Article

Comprehensive Validation and Calibration of MODIS PWV over Mainland China

1
School of Electronics and Information, Northwestern Polytechnical University, Xi’an 710129, China
2
Xi’an New Combination Electronic Intelligent Technology Co., Ltd., Xi’an 710065, China
3
School of Communications and Information Engineering, Xi’an University of Posts and Telecommunications, Xi’an 710121, China
4
School of Artificial Intelligence, Xi’an University of Posts and Telecommunications, Xi’an 710121, China
5
State Key Laboratory of Geodesy and Earth’s Dynamics, Innovation Academy for Precision Measurement Science and Technology, CAS, Wuhan 430077, China
*
Author to whom correspondence should be addressed.
Atmosphere 2022, 13(11), 1763; https://doi.org/10.3390/atmos13111763
Submission received: 28 September 2022 / Revised: 18 October 2022 / Accepted: 22 October 2022 / Published: 26 October 2022
(This article belongs to the Special Issue New Insights in Atmospheric Water Vapor Retrieval)

Abstract

:
Although ground-based precipitable water vapor (PWV) can be obtained with a high temporal resolution and spatial resolution of tens of kilometers in an urban area using Global Navigation Satellite System (GNSS) observation, it remains fairly sparse in the vast regions over Mainland China. Satellite-derived PWV has a high spatial resolution, thereby enabling the accurate investigation of regional climate change. However, understanding the quality of satellite-derived PWV products is a prerequisite before use, which has become the focus of this study. PWV products, namely, MOD05_L2 and MYD05_L2, over the entirety of Mainland China derived from MODerate Resolution Imaging Spectroradiometer (MODIS) onboard Terra and Aqua satellites are validated over the period 2000–2017 using multiple sources, including GNSS, radiosonde, AErosol RObotic NETwork (AERONET), and European Center for Medium-Range Weather Forecasts ERA-Interim (ECMWF). The accuracy of MODIS PWV products is less than 4.3 mm over the entirety of Mainland China; however, it varies in four areas of South China (SC), North China (NC), Northwest China (NWC), and Tibetan Plateau (TP), separately with values ranging from 3 mm to 6 mm. A linear fit model is applied to calibrate the MODIS PWV products, and the accuracies of the corrected PWV from MODIS infrared (IR) and near-infrared (NIR) products have been improved by approximately 7.5% and 50.6%, respectively. The MODIS PWV is compared and calibrated in the four areas, and the improved accuracies vary widely. The root mean square error (RMSE) of IR PWV is approximately less than 4 mm over China except for the SC area with a value of approximately 5.3 mm after calibration, whereas the values of NIR PWV are approximately 2 mm over the entirety of Mainland China, except for the TP area, with a value of approximately 2.6 mm. The MODIS NIR PWV performs better than that of IR PWV data in most areas of Mainland China regardless of whether with calibration. The validation and calibration of MODIS water vapor products over Mainland China also indicate their capability to investigate the seasonal and annual variations as well as long-term trend changes in water vapor in China.
Keywords:
MODIS; PWV; GNSS; radiosonde; China

1. Introduction

Atmospheric water vapor is a major component in the troposphere, which has influenced the energy budget, hydrological cycle, climate change at global/regional scales, and the development of weather fronts [1,2,3]. Its radiative effects may intensify the response of climate and cause further global warming [4,5]. The long-term trend of PWV has a positive relationship with the variations in precipitation and atmospheric temperature [6]. Furthermore, water vapor plays a crucial role in obtaining surface temperature using satellite data [7], and an evident positive relationship existed between water vapor and surface temperature. Improved knowledge of variations in the transport of atmospheric water vapor is important for weather forecasting [8].
Precipitable water vapor (PWV) is a measurable parameter that mainly comprises tropospheric and stratospheric water vapor, which is generally used to investigate water vapor changes and their contribution to climate change [9]. PWV is the total atmospheric water vapor content integrated along a column of the unit area [10], which varies greatly in space and time. At present, PWV can be obtained from various techniques. The radiosonde is one of the most common techniques for PWV retrieval, and it has the longest recordings; the technique has been used for over half a century [11]. Radiosonde-derived PWV is often considered a reference for validating the quality of other measuring techniques because of its high accuracy [12,13]. However, its limitations, such as low temporal–spatial resolution, high costs, and uncontrollable balloon, hinder its usability to conduct water vapor monitoring over large regions [11,14]. Furthermore, the inhomogeneity problem induced by the changes in processing and calibration strategies, measurable practice, variant equipment types, or other issues also exist and are difficult to handle [6].
In addition to the widest applications of positioning, navigation, and timing (PNT), the Global Navigation Satellite System (GNSS) has become a useful and convenient approach to PWV retrieval [15], and the accuracy of the derived PWV is approximately 1–2 mm [16]. The GNSS technique has elicited considerable attention in retrieving atmospheric water vapor because of its high level of accuracy, high temporal resolution, low cost, and all-weather measurements [17]. Therefore, GNSS-derived PWV is generally regarded as a reference to validate the PWV obtained from satellite-based observation. In addition, the high temporal resolution of GPS-derived PWV enables the investigation of the short-term span and nowcasting analysis, such as the diurnal variation and precipitation forecasting [17,18,19,20]. Some uncertainties and modeling errors related to the mapping function have a combined uncertainty of GPS-derived PWV at 5–7% [15,21,22]. Although GNSS-derived PWV has many advantages, the ground-based measurements remain coarse, especially for areas with mountains and deserts over the west part of China.
In addition to GNSS and radiosonde, ground-based PWV can also be derived from sun photometers [19]. This technique is conducted using a 940 nm wavelength of strong water vapor absorption to estimate water vapor information [23,24]. PWV can also be derived from the AErosol RObotic NETwork (AERONET), which was founded by NASA and includes more than 300 sun photometers globally. The modified Langley algorithm has been applied to estimate the PWV value using the spectral transmission of solar irradiance at 0.940 μm [25]. Similar to the GNSS technique, AERONET sun photometers can provide water vapor information with high accuracy and low maintenance cost in real time [26,27]. Although AERONET-derived PWV can also be used to monitor short-term water vapor variations, its low spatial resolution limits its application. Furthermore, PWV can be obtained in a form of grid points from the reanalysis products of numerical weather models; however, its accuracy is relatively low compared with the aforementioned techniques.
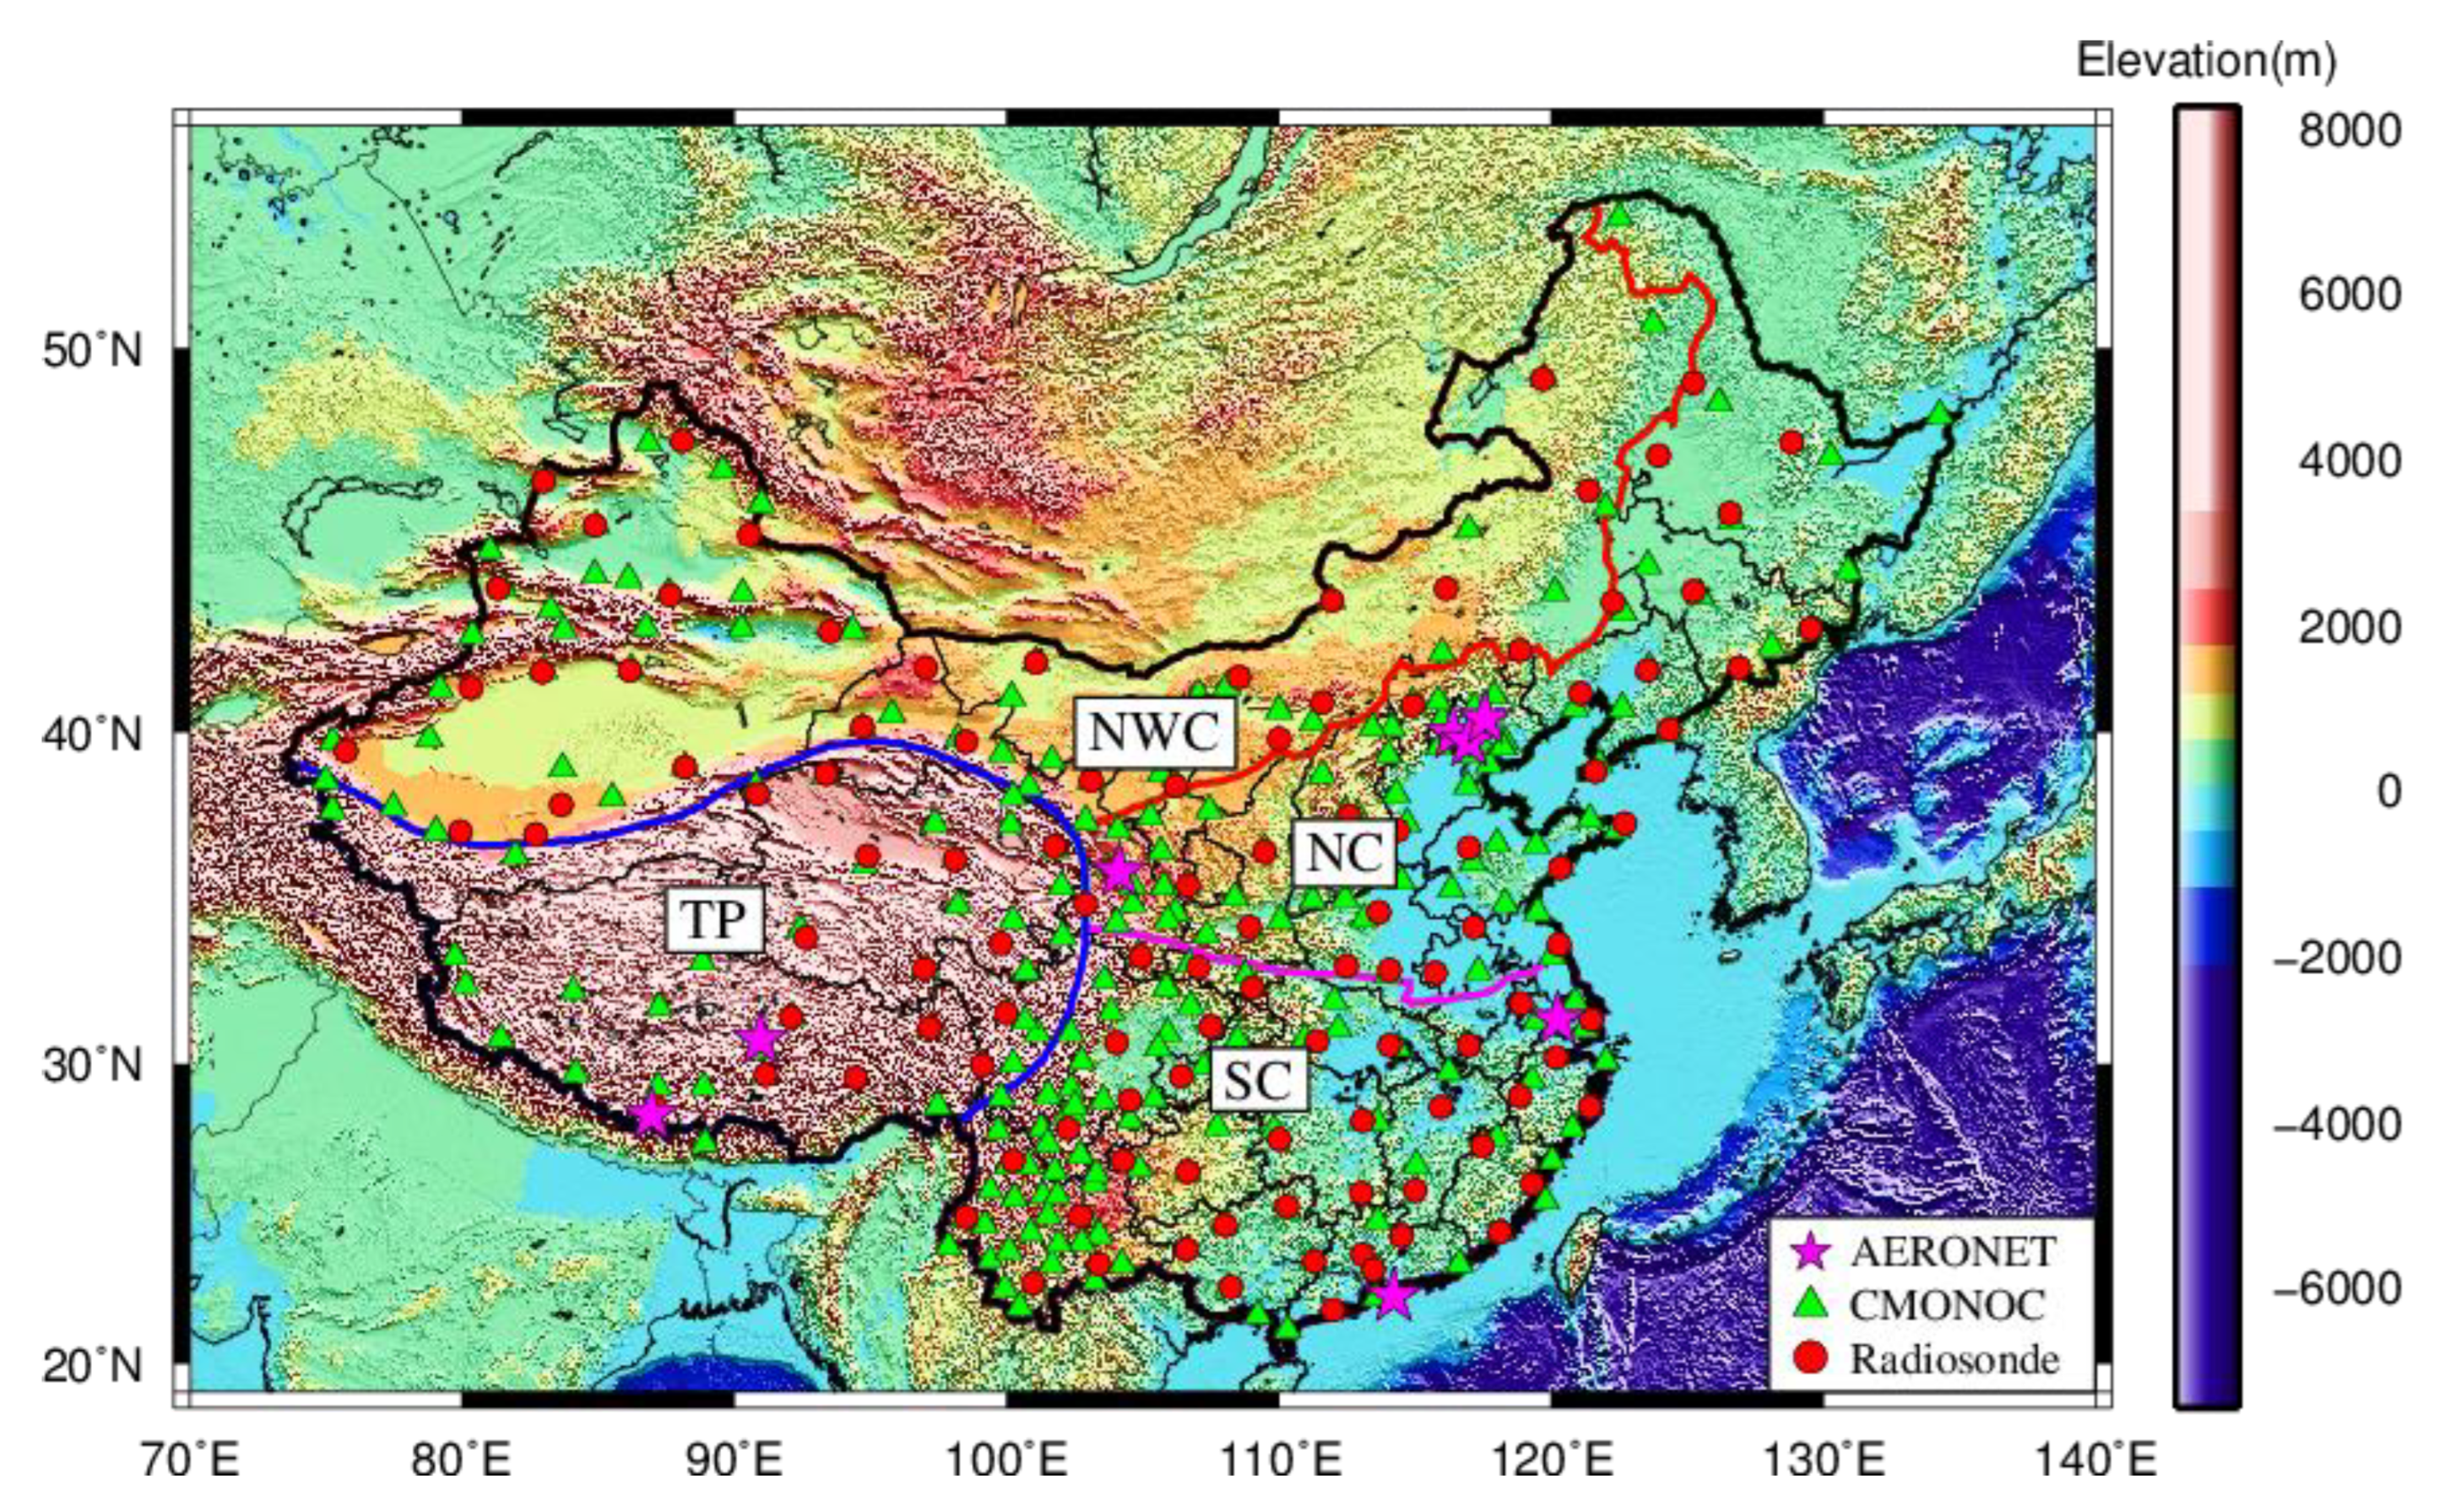
China is an ideal place for the investigation of regional atmospheric water vapor responses to global warming [28]. In China, influence factors, such as latitude, geographic altitude, and monsoon (atmospheric circulation), all exist. In Ref. [29], the authors have found that the PWV over China shows evident seasonal variations, which are mainly caused by the influence of the East Asian monsoon. Over the past decades, China has experienced a period of urban modernization, the transformation of people from rural to urban, and industrialization. Furthermore, global warming, the abnormality of atmospheric circulation, El Niño, and the continuous precipitation have a considerable impact on the atmospheric water vapor variation. Therefore, the investigation of water vapor variations in China is crucial, especially in the southeastern coastal areas with dense populations, the Tibetan Plateau (TP) with its high altitude, and the desert regions in the northeast of China.
Although many ground-based stations from GNSS, radiosonde, or AERONET have been used with high accuracy and relative intensity in urban areas in China to obtain atmospheric water vapor, the spatial resolution of PWV is fairly sparse in the vast regions over China, especially for areas in Southern Tibetan Plateau (TP) and the Himalayas with few ground-based observations. Therefore, satellite remote sensing is an alternative technique for deriving PWV distribution. As a more feasible monitoring technology, satellite remote sensing techniques elicit high interest due to its capability to obtain spatial distribution and variation of PWV on a large regional scale [10].
MODerate Resolution Imaging Spectroradiometer (MODIS) is one of the most widely used sensors for water vapor monitoring and is onboard NASA’s Terra and Aqua space platforms [10,30]. MODIS-derived PWV can be available on a global scale with a high spatial resolution (1 × 1 km for near-infrared (NIR) and 5 × 5 km for infrared (IR) PWV) and low cost. Its evaluation has been investigated using ground-based PWV data on a global scale [19,21,31]. In China, [32] validated MODIS PWV products using one year of GPS observations and found an evident improvement after the correction of the MODIS water vapor product over the TP. In Ref. [9], the authors compared the Terra and Aqua MODIS PWV over Southern Tibet using GPS-derived PWV of 22 ground-based stations for the period of January to October 2008. The result revealed that MODIS-derived PWV tends to overestimate water vapor under clear-sky conditions with a root mean square error (RMSE) from 2.1 to 3.2 mm. In Ref. [19], the authors validated the atmospheric water vapor derived from MOD05 and MOD07 in Hong Kong using radiosonde data with correlation coefficients both larger than 0.87. [11] validated the MODIS PWV using 26 GPS stations in China; however, such a number of stations is insufficiently far to represent the general result in China. In Ref. [
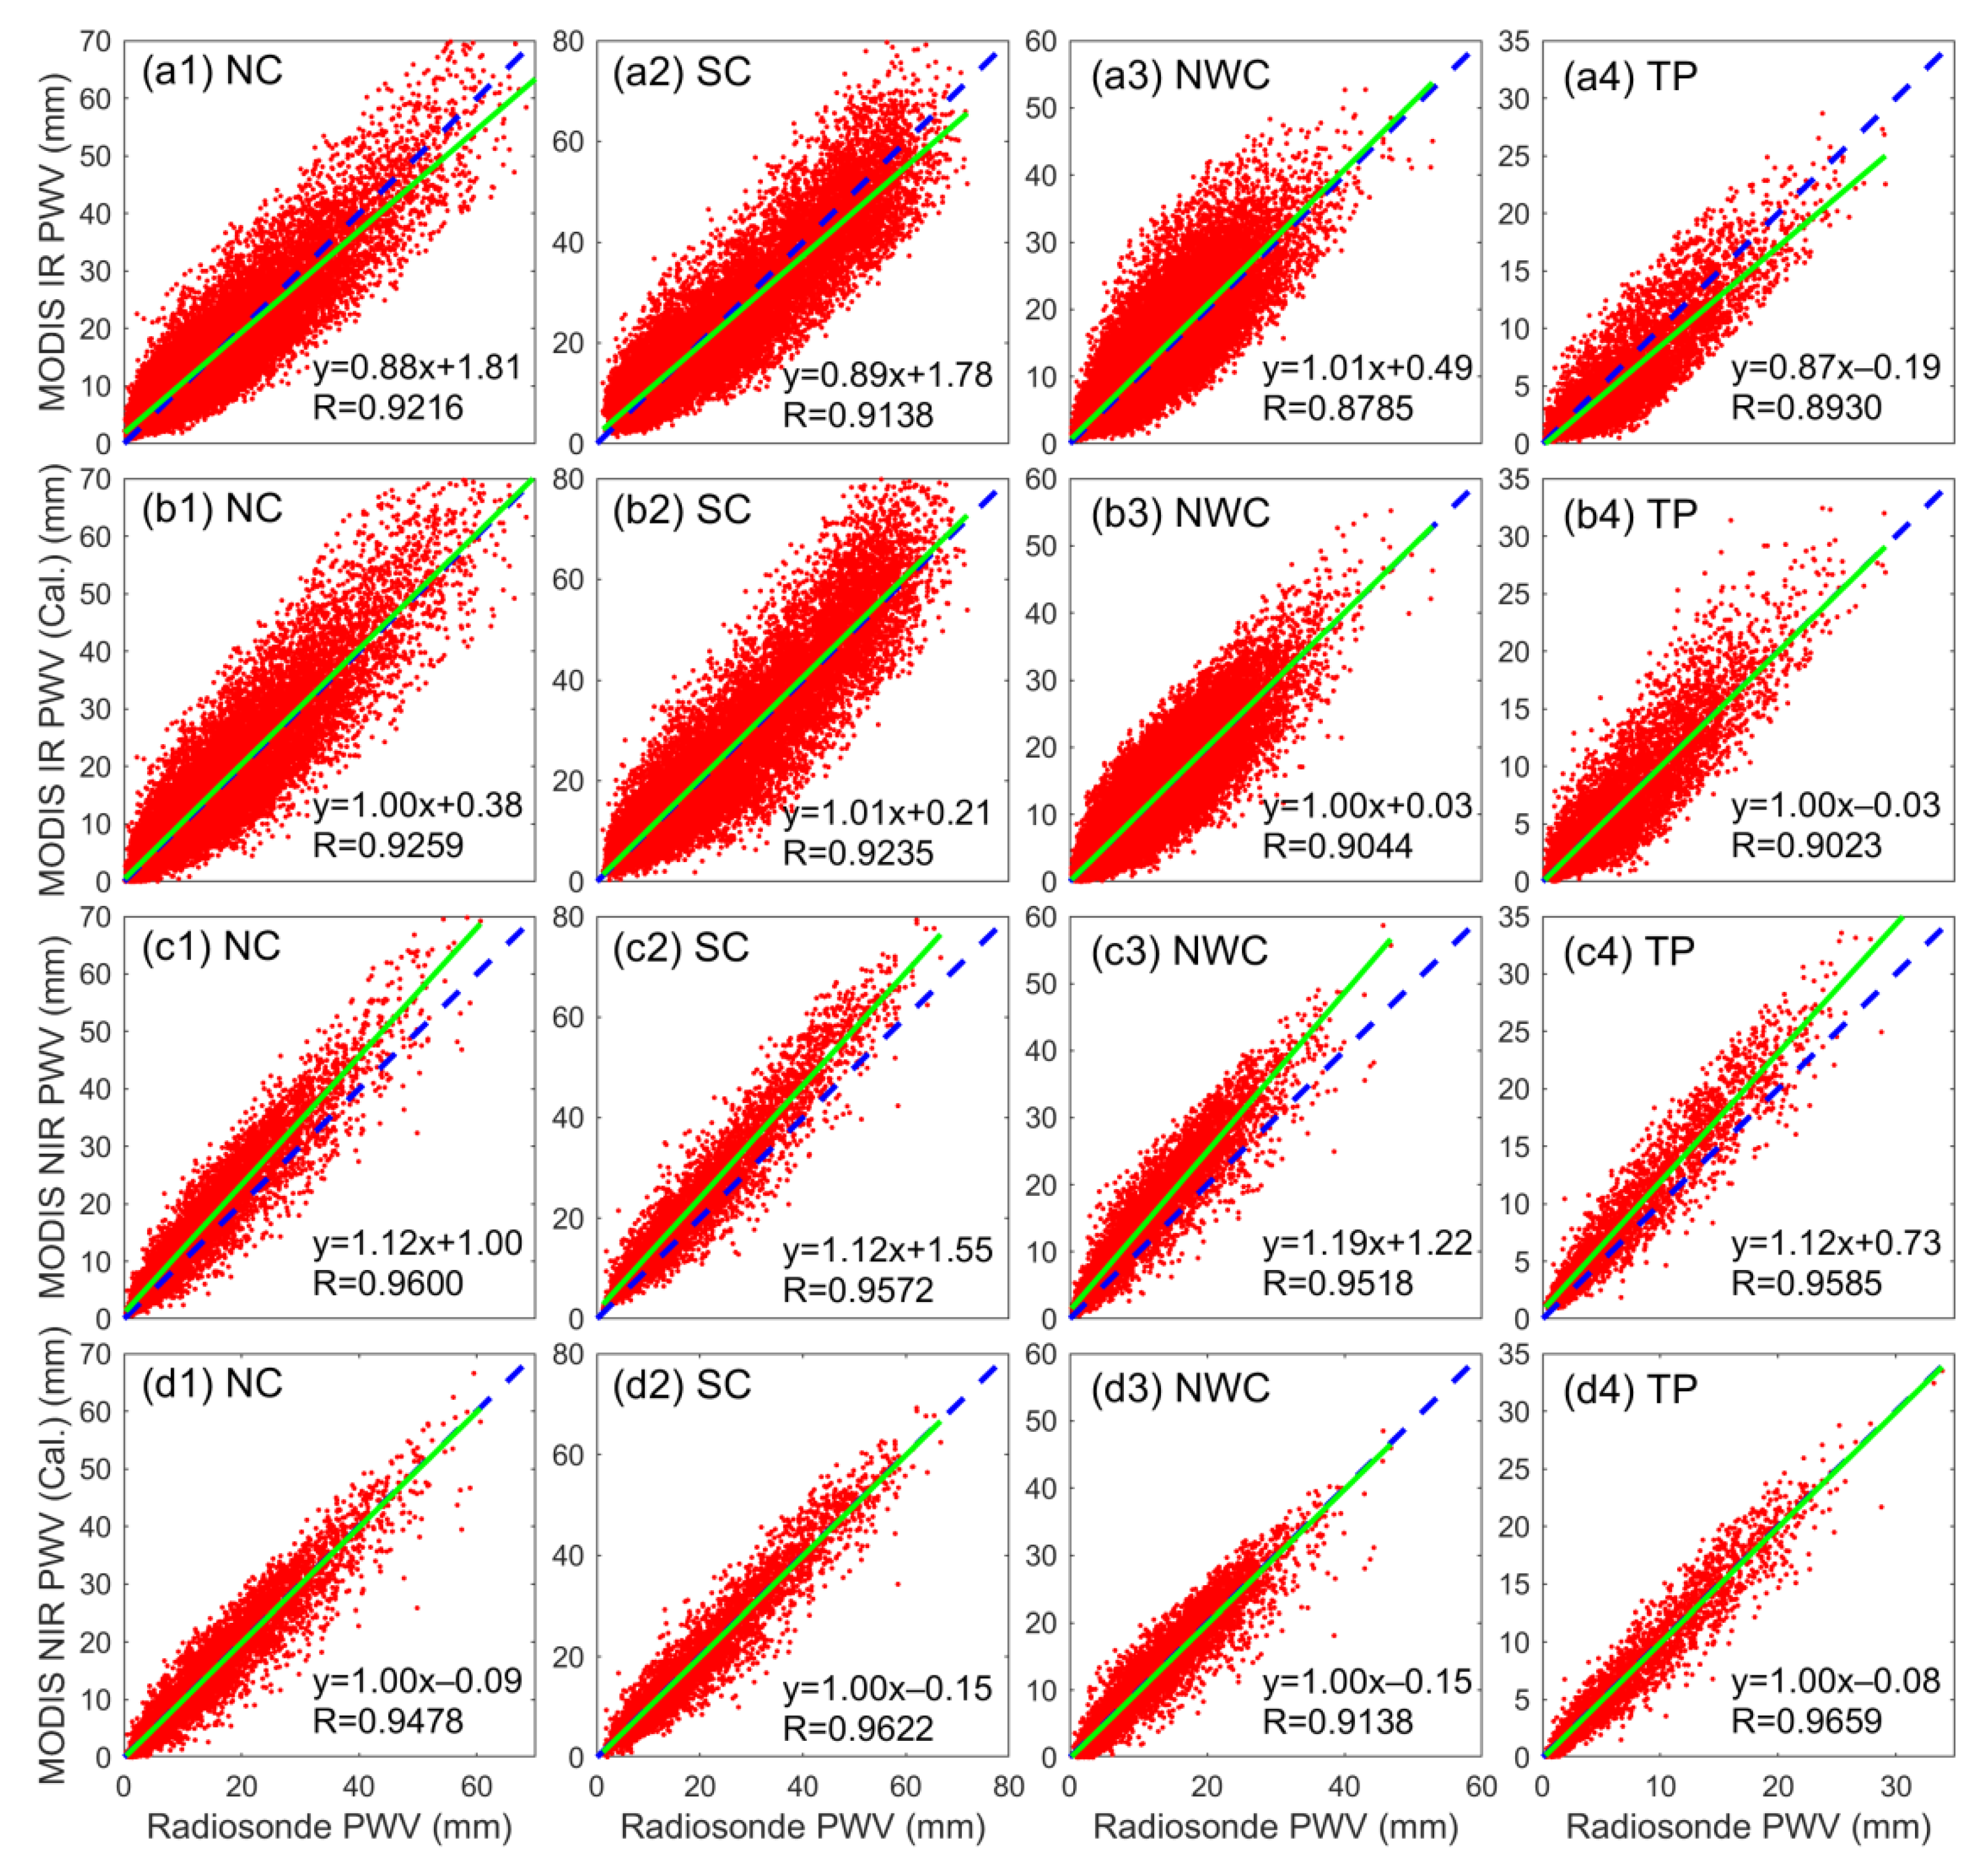
33], the authors found that the MODIS NIR PWV product has a better agreement than IR PWV when compared with the one-year radiosonde data of 83 stations in China. In addition, the quality of PWV derived from the MODIS IR during nighttime is superior to that obtained during the daytime. In Ref. [34], the authors have verified that the MODIS PWV products are underestimated in a dry area but overestimated in a moist region using 3-year data when compared with the Atmospheric Infrared Sounder (AIRS). In Ref. [35], the authors analyzed the variation of PWV over China using the MODIS NIR PWV product from 2011 to 2013, thereby revealing the clear geographic differences in water vapor. In Ref. [25], the authors have analyzed the PWV in China, but only eight GPS and five AERONET sites are selected to represent all of China, which is insufficient for the vast regions of China in terms of the number of ground-based sites.
Although some studies have been conducted to validate the quality of MODIS PWV over Mainland China, those studies remain at the stage of case studies for a specific area or limited stations for a short time. Therefore, the quality of MODIS-derived PWV products in Mainland China has not been well-investigated due to its vast region, varied topography, and lack of valid and long-term reference datasets. Thus, this study validates the accuracy of Terra and Aqua MODIS IR/NIR PWV products for a time span of 2000 to 2017 over the entire Mainland China using multisource data, including GNSS, radiosonde, AERONET, and European Center for Medium-Range Weather Forecasts (ECMWF) ERA-Interim. Furthermore, a linear fit model is applied to calibrate a MODIS PWV product with considerable improvement and apply for the analysis of seasonal and long-term PWV variations. The validation and calibration of MODIS water vapor products are crucial in using such products for the assimilation into the regional or global climate model and other studies over China, which is helpful for enhancing the model’s capability to calculate the radiative forcing and predict climate change.

2. Study Area and PWV Datasets

2.1. Description of the Study Area

China is located in East Asia with areas from 18° N to 54° N in latitude and 73° E to 135° E in longitude; it has a territory of more than 9.7 million km2 and a population of 1.339 billion [36]. PWV changes largely over Mainland China in space and time due to the influence of diverse monsoons and the topography (mountains in the west and flat plains in the east). Furthermore, the PWV over China shows an evident seasonal variation, which is mainly caused by the influence of the East Asian monsoon [29]. All the preceding factors allow the investigation of regional atmospheric water responses to global warming.
In this study, Mainland China is divided into four areas, namely, North China (NC), South China (SC), Northwest China (NWC), and Tibetan Plateau (TP). NC and SC are divided based on the 0 °C isothermal lines and 800 mm annual rainfall. NC and NWC are separated on the basis of non-monsoon and monsoon climate lines, as well as 400 mm annual rainfall. TP is isolated because of the high altitudes and cold climate. Figure 1 presents the four areas in Mainland China and the ground-based GNSS/radiosonde/AERONET stations used.

2.2. PWV Datasets

Four types of PWV datasets are obtained from 2000 to 2017 and used in this study. They consist of 6 h homogenized radiosonde PWV dataset [3], 6 h Integrated Global Radiosonde Archive (IGRA) Ver. 2 radiosonde PWV dataset, 6 h CMONOC PWV dataset [37], 1-h CMONOC PWV dataset [38], 1 h AERONET PWV dataset, 6 h ERA-Interim PWV dataset, and 12 h MODIS IR and NIR PWV products. The characteristics of these datasets are summarized in Table 1. The radiosonde, AERONET, and CMONOC PWV datasets are available at ground-based stations over Mainland China, and 6 h ERA-Interim PWV data are gridded onto a 0.125° × 0.125° grid point over Mainland China. Homogenized radiosonde PWV dataset, CMONOC PWV dataset, and AERONET PWV dataset are used because they have been validated with good performance and meet the requirement of this study.
CMONOC PWV (2000–2015; [37]): The dataset consists of more than 260 ground-based GNSS stations in China from the CMONOC over the period of 1999–2015. Two phases are performed, that is, Phase I from 1999 to 2010 and Phase II from 2010 to the present; approximately 27 and more than 260 ground-based GNSS stations are included over China for two phases, respectively. Parameter ZTD is estimated using the PPP technique with the Position And Navigation Data Analyst (PANDA) package [38], with an accuracy comparable to the final ZTD product (~4 mm). Two key parameters, namely, weighted mean temperature and surface air pressure, are used to convert ZTD to PWV; these parameters have been retrieved from the synoptic station or ERA-Interim product and validated with accuracies of 1.8 K and 0.7 hPa over China when compared to the radiosonde data, respectively. The 6 h GNSS-derived PWV is validated using the radiosonde data and ERA-Interim with an average RMSE of 0.75 mm, whereas the maximum and minimum values are 1.10 mm and 0.55 mm, respectively.
CMONOC PWV (2010–2017; [39]): This dataset only contains the stations that belong to Phase II CMONOC, which has 249 fixed GNSS stations. ZTD is estimated using the double-difference technique with the GAMIT/GLOBK (Ver. 10.4) software. The surface pressure and weighted mean temperature are calculated using the layered ERA-Interim products, and the average values of RMSE are 1.14 hPa and 1.24 K, respectively, when compared to that of the radiosonde data. The 1 h GNSS-derived PWV is obtained and validated with the average RMSE of 1.3 mm and 1.38 mm over Mainland China when compared to the ECMWF- and radiosonde-derived PWV, respectively.
Homogenized radiosonde PWV (2000–2010; [39]): This dataset contains daily radiosonde at standard pressure levels from January 1945 to the end of 2010. A new approach is used to homogenize the historical recording of dewpoint depression (DPD) and humidity (up to 100 hPa) of radiosonde data. Kolmogorov–Smirnov and penalized maximal F tests are applied to detect the change in distributions and mean shifts of variant bins of DPD [40]. The homogenized data includes data on the surface and 15 standard pressure levels from 1000 hPa to 10 hPa. In addition, the homogenized PWV values are provided in three levels (surface–500 hPa, 500–300 hPa, and 300–100 hPa). The temporal resolutions of PWV recordings are recorded twice daily, which is the same as the raw radiosonde data.
IGRA Ver. 2 radiosonde PWV (2011–2017): In addition to the homogenized radiosonde PWV data obtained from [39], the radiosonde recording over the period 2011–2017 from the IGRA Ver. 2, which has been reformatted as a homogenized data format since March 2009, is used. In comparison with Ver. 1, IGRA Ver. 2 includes additional radiosonde stations, and the data of over 2000 stations can be used with the earliest recordings that began in 1905 to the present. Rigorous quality checks have been conducted, and only 0.61% of dry bias exists in the PWV over 300 hPa. In this study, only the profiles of recordings that reach up to at least 300 hPa are used as valid data [41].
AERONET PWV (2000–2017): The 1 h PWV values of eight stations derived from AERONET with the time period of 2000–2017 are also used in this study. The three levels of PWV data provided by AERONET are raw data (Level 1.0), cloud-screened data (Level 1.5), and cloud-screened and quality-assured data (Level 2.0; [26]), which can be obtained from the AERONET website (https://aeronet.gsfc.nasa.gov/)(accessed on 5 July 2021). In this study, the PWV values derived from Level 2.0 products are selected, and Table 2 provides the geographic information of the selected eight stations.
ERA-Interim PWV (2011–2017): The ECMWF is an independent international organization, which was founded in 1975 and constituted by 34 countries. ECMWF provides global forecasts, climate reanalysis, and specific datasets; two types of reanalysis data, namely, ERA-15 and -40, are mainly provided. The ERA-Interim project was initiated in 2006 to bridge ECMWF’s previous reanalysis and ERA-40 (1957–2002), which is a reanalysis of the global atmosphere covering the data-rich period since 1979 and continuing in real time. The temporal–spatial resolutions are recorded four times daily and 0.125°×0.125°, respectively. In this study, the layered reanalysis products (37 layers), which include specific humidity, pressure, and temperature, from 1000 hPa to 1 hPa are used to calculate PWV in China, and the corresponding formulas can be referred to [38]. Approximately 2.1 mm of PWV accuracy of ERA-Interim with negligible Biases in China was proven by Ref. [42] using more than 260 GNSS stations; however, the atmospheric water vapor seems overestimated by ERA-Interim over the TP.
MODIS PWV (2000–2017): As the first space instrument to adopt NIR bands equipped with IR bands to sense the atmospheric water vapor [31], MODIS provides the NIR PWV (daytime) and IR PW (day and night) products with a temporal resolution of two and four times, respectively, each day for one location [34]. MODIS is onboard the Aqua and Terra satellites, which were launched in 2002 and 1999, respectively. These satellites are synchronous and undergo one location each day at 13:30 local time (LCT) in ascending node and 10:30 in descending node. MODIS Level 2 PWV products of Collection 61 from Aqua (MYD05_L2) and Terra (MOD05_L2) are obtained at a 1 × 1 km and 5 × 5 km spatial resolution using the NIR and IR algorithm [31].
IR-derived PWV is generated as one component of the atmospheric profile product (MYD07/MOD07) and simply added to MYD05/MOD05 for convenience. Three water vapor-absorbing channels (i.e., bands 17, 18, and 19) and two atmospheric window channels (i.e., bands 2 and 5) are used to determine the amount of column water vapor. The obtained MODIS PWV has errors usually in the range between 5% and 10% due to the uncertainties in atmospheric profiles and spectral responses, the influence of haze, and surface spectral calibration [30,43,44,45]. Given that the atmospheric water vapor derived from MODIS is vulnerable to the influence of clouds in the field of view, only PWV values derived from Terra and Aqua MODIS under clear-sky conditions are used in this study. Pixels with 99% confidence clarity are determined using the cloud mask product.

3. Validation of MODIS PWV

The temporal–spatial misregistration of PWV data between MODIS and other techniques is an important problem that affects the comparison result. Therefore, in this study, the MODIS PWV products are averaged over the grids centered on the location of GNSS, radiosonde, AERONET stations, or ERA-Interim grid points to overcome the misregistration issue. The resolution of MODIS MOD05 (MYD05) NIR and IR PWV data are 1 km and 5 km, respectively. Therefore, 9 × 9 and 4 × 4 grids are determined for the average, which indicates the spatial resolution of 9 km and 20 km for two conditions, respectively. In Ref. [44], the authors also declared that at least five grid points existed in the selected range, which is also adopted in the experiment of the present study. In addition to spatial matching, temporal misregistration is also considered. In Ref. [8] and Ref. [25], the authors selected the time difference of 30 min for the matched pair of MODIS and GNSS PWV data, which is relatively large because the water vapor changed dramatically in a short time, especially during the precipitation period [21]. Therefore, the time difference is decreased to 15 min between the MODIS and AERONET/CMONOC PWV [39] to reduce the PWV error caused by time misregistration.

3.1. Comparison of MODIS and Radiosonde PWV

Terra passes China at approximately 10:00–11:00 and 22:00–23:00 LCT each day, whereas Aqua passes China at approximately 01:00–02:00 and 13:00–14:00 LCT [10]; meanwhile, the radiosondes are generally launched twice daily at 08:00 and 20:00 LCT. Obtaining the exactly temporal collocated radiosonde values with Terra- and Aqua-derived PWV values is impossible. Therefore, the time difference of PWV data between radiosonde and MODIS is limited within ±4 h according to the previous study [33].
The PWV values of 117 homogenized radiosonde stations derived from [40] is used to validate the MODIS PWV products over Mainland China. The RMSE and Bias for each paired point are calculated to obtain the averaged RMSE and Bias of four areas, as shown in Table 3. Figure 2 presents the scatterplots of the radiosonde-derived versus MODIS-derived IR/NIR PWV values. As shown in Table 3, the MODIS IR/NIR PWV products have significant regional differences over Mainland China, thereby further verifying the reasonability of dividing China into four areas. A high correlation exists between MODIS PWV and radiosonde PWV, especially for the NIR product with a maximum value of up to approximately 0.95 (Figure 2). The largest PWV differences for MODIS IR and NIR PWV products occur in the SC area, with RMSE of 7.00 mm and 5.84 mm, whereas the smallest values are 2.54 mm and 2.60 mm in the TP area, respectively. As shown in Figure 2, the IR PWV products have been underestimated when the atmospheric water vapor is low and overestimated when its value is large. The NIR PWV has a higher accuracy than IR PWV when compared using radiosonde data but overestimates PWV with an average bias of 2.33 mm.

3.2. Comparison of MODIS and AERONET PWV

AERONET PWV data of eight stations with hourly temporal resolution over Mainland China are used to validate the quality of MODIS PWV products. Table 4 shows the RMSE and bias of PWV differences between AERONET- and MODIS-derived PWV from the period of 2000 to 2017. Figure 3 shows the scatterplots of AERONET-derived versus MODIS-derived PWV for different areas over Mainland China.
The MODIS-derived PWV values agree well with AERONET PWV data at eight stations, with maximum and minimum RMSE/bias values of 9.24/6.25 mm in Hong Kong Station and 0.92/−0.61 mm in Qoms Station for MODIS IR PWV, respectively, whereas the maximum and minimum values for NIR PWV are 6.19/4.45 mm in Taihu Station and 1.98/1.17 mm in Xinglong Station, respectively. Combining Figure 3 shows that the maximum RMSE/Bias occurs at stations with high PWV values between 0 mm and 80 mm, whereas the minimum RMSE/bias occur at stations only with low values ranging from 0 mm to 30 mm. In addition, the IR/NIR PWV products are overestimated at most stations when compared with the AERONET PWV.

3.3. Comparison of MODIS and GNSS PWV

The number of paired points is limited due to the relatively large temporal resolution for 6 h CMONOC PWV [37]. Therefore, the time difference of 1 h, which was also used by [11], is selected for comparison between CMONOC PWV [37] and MODIS PWV in this section. Comparisons between MODIS IR/NIR PWV products and GNSS-derived PWV are shown in Figure 4, in which the PWV values obtained from Aqua and Terra satellites are compared separately. Table 5 provides the statistical result of RMSE and bias of PWV differences for Aqua and Terra satellites of IR/NIR PWV products over the period 2000–2015. From the table, MODIS IR/NIR PWV products have a good agreement with GNSS PWV values. The RMSE values of IR/NIR PWV products in each area are different but have high coefficients of over 0.9, except for Aqua IR PWV in areas of SC and TP. The Aqua and Terra NIR PWV products appear to have good quality, with high coefficients of up to 0.95; however, these products show a unanimously positive bias when compared with GNSS-derived PWV.
In comparison with the statistical results from radiosonde data, a relatively small RMSE/bias and higher R2 are observed between MODS PWV products and GNSS PWV data in the four areas. This result is reasonable because the time difference between CMONOC PWV [37] and MODIS PWV is 1 h, whereas the value is 4 h between the radiosonde and MODIS comparison. The atmospheric water vapor is continuously changing, and the PWV can be sharply increased or decreased especially during the precipitation period [21]; therefore, the large time difference will affect the validated result of MODIS PWV products. Furthermore, the relatively large PWV discrepancies of MODIS-derived PWV compared with GPS/radiosonde are possibly caused by the various physical methodologies for the three techniques. The MODIS PWV has instantaneous values using the scanned MODIS mirror (also referred to as a scan line), which requires only 1.447 s [16]. GPS-derived observations have certain intervals (e.g., 1, 15, or 30 s), and PWV is collected from the inverted dome above the selected elevation angle (e.g., 7°, 10°, or 15°). Radiosonde data are observed along the flight trajectory of the sounding balloon; therefore, the radiosonde-derived PWV has integration values that will be affected by the horizontal drift occasionally.

4. Calibration and Application of MODIS PWV

As presented in Section 3, extensive comparisons in specific points between MODIS and AERONET and in different areas among MODIS IR/NIR, radiosonde, and GNSS illustrate the scale factors varying from 0.8 to 1.9, and a unanimously positive bias exists between MODIS PWV products and different referenced PWV data, especially for the MODIS NIR PWV products. This phenomenon indicates that MODIS PWV products are possibly calibrated, which was conducted by [16,46] and [9] using a linear model. Therefore, the MODIS-derived PWV products over China should be calibrated before use for seasonal and long-term analysis.

4.1. Calibration of MODIS PWV Using Radiosonde Data

The radiosonde PWV data of 84 stations derived from IGRA Ver. 2.0 over the period of 2011–2017 is used to calibrate the MODIS PWV product at those points using the linear fit model proposed by [7]. Table 6 shows the comparison results between MODIS and radiosonde with and without calibration, and Figure 5 provides the scatterplots in the four areas over Mainland China. Although the slope and intercept of PWV between calibrated MODIS IR and radiosonde have been decreased, the RMSE and bias of PWV differences between calibrated MODIS IR and radiosonde are not improved, which is expected in NC and SC areas. This finding may be caused by the poor quality of MODIS IR PWV and the calibration method does not work well in areas with large errors. Another reason is misregistration, especially in respect of time (4 h of time difference). By contrast, the calibrated result seems to work well for MODIS NIR PWV, and the positive bias has been decreased to approximately 0. As shown in Figure 5, although the slopes and intercepts of calibrated NIR PWV in the four areas have been close to 1 and 0, respectively, the coefficients in NC and NWC areas have decreased. These results indicate the large difference between MODIS and radiosonde PWV, which corrupts the calibrated result.

4.2. Calibration of MODIS PWV Using GNSS Data

To remove the influence of time difference on the calibrated MODIS PWV product, the 1 h GNSS PWV of 249 stations derived from [38] over the period of 2011–2017 is used with a time difference of 15 min. Furthermore, the Aqua and Terra satellites have been compared separately to evaluate the PWV quality of each satellite. Table 7 provides the comparison result of MODIS PWV products and GNSS PWV, and Figure 6 and Figure 7 show the scatterplots of PWV with and without calibration.
A similar result can be concluded from Table 7 that the accuracy of the calibrated Aqua and Terra MODIS NIR has been improved. The RMSE of calibrated MODIS IR PWV is also decreased in NC and SC areas when compared with that without calibration, which is different from the result concluded from the comparison between MODIS IR and radiosonde PWV. This finding indicates that the large time difference between the compared paired PWV data is the main reason for the poor result of MODIS IR PWV after calibration using radiosonde data. The average improved percentage for NIR PWV is 50.6%, whereas that for IR PWV is approximately 7.5%, which indicates the effectiveness of the linear fit model, especially for NIR PWV. Furthermore, the large positive bias of MODIS NIR PWV has been remarkably calibrated with the linear fit model. Combining Figure 6 and Figure 7 indicate that the accuracy of Terra and Aqua IR/NIR PWV products is comparable; however, the quality of the NIR PWV product is better than that of the IR PWV product. Nevertheless, some large PWV differences exist for the calibrated result of MODIS IR/NIR PWV in the TP area with an average altitude that exceeds 3 km, which indicates the poorly calibrated effect of the linear fit model in this area. In Ref. [9], the authors proved that the calibrated result of MODIS PWV products over Southern Tibet with an altitude of GPS sites larger than 3 km is relatively poor, which is consistent with the result in this study.
To better understand the accuracy distributions of calibrated MODIS PWV products over the GNSS stations, Figure 8 and Figure 9 illustrate the RMSE and bias distributions of MODIS IR/NIR PWV products with and without calibration in the four areas of Mainland China. The quality of the calibrated MODIS PWV products at the GNSS sites has been improved, especially for the NIR PWV in areas of SC, NC, and NWC. For the TP area, a limited improvement of RMSE values of IR PWV is shown in Figure 8, whereas the values of bias have been decreased largely. In comparison with the GNSS PWV data, MODIS NIR PWV is overestimated over nearly the entire Mainland China, whereas the IR PWV is underestimated over the southeast of China and TP areas.

4.3. Calibration of MODIS PWV Using ERA-Interim Product

To evaluate further the quality of MODIS PWV products with and without calibration in a higher spatial resolution, the PWV values at grids with the temporal–spatial resolutions of four times (i.e., UTC 00, 06, 12, and 18) daily and 1° × 1°, respectively, are derived from the ECMWF ERA-Interim reanalysis product. Table 8 provides the statistical result of RMSE, bias, and coefficient (R) of the MODIS PWV product with and without calibration for 964 grid points over Mainland China in the period 2011–2017. The R in the TP area is decreased after the calibration of MODIS IR/NIR PWV, except for some similar conclusions previously obtained. In addition, the RMSE of MODIS PWV is slightly large in the comparison with ERA-Interim than that of the comparison with GNSS PWV derived from [37] and [38]. The reason for this result is because the PWV value derived from ERA-Interim is the reanalyzed data of the numerical weather model, and its accuracy is relatively poorer than the GNSS-derived PWV, especially for areas without adequate assimilated ground- and space-based meteorological data.
Figure 10 and Figure 11 show the distributions of RMSE and Bias of MODIS IR/NIR PWV products with and without calibration, respectively. Here, the grid points over the TP area are not calibrated for the following reasons: (1) the variation of relatively small PWV differences between MODIS ERA-Interim PWV will lead to a relatively large slope due to the small PWV value over the TP area (average value of 6 mm), thereby leading to a poorly calibrated result; and (2) the RMSE of uncalibrated MODIS PWV products in TP area is less than 3 mm and approximately 3 mm for MODIS NIR and NIR PWV, respectively, when compared with the GNSS PWV [38], which is sufficient for some meteorological studies. The PWV threshold accuracy of 5 mm has been set for global numerical weather prediction (NWP) models based on the World Meteorological Organization (WMO; WMO Observing requirements database, http://www.wmo-sat.info/db/ (accessed on 10 August 2021)); [46]), and it is especially important in climate modeling for PWV < 3 mm [47]. As shown in Figure 10 and Figure 11, the calibrated result of the MODIS PWV product is good, especially for SC with adequate atmospheric water vapor (average value of 24 mm). The bias of MODIS PWV products has been significantly decreased to approximately 0, especially for the NIR product. In comparison with the RMSE and bias of IR/NIR PWV products, except for the TP region, the quality of the NIR PWV product is better than that of IR PWV regardless of calibration or without calibration.
Figure 12 shows the distributions of slope and intercept of the linear fit model to calibrate the MODIS PWV over Mainland China. From the figure, the slope and intercept of IR PWV are more fluctuated with the values ranging from 0.8 mm to 1.2 mm and from −6 mm to 6 mm, respectively; by contrast, the values of NIR PWV are relatively stable, which vary from 0.9 mm to 1.1 mm and 0.5 mm to 1.5 mm, respectively. The negative intercepts of IR PWV change to positive values from southeast to the northwest of China; however, the positive values of NIR PWV are distributed over Mainland China. Following the characteristics of slow change in coefficients of the established linear fit model, the slope and intercept at any location can be obtained by an interpolation method. Therefore, the calibrated 5 × 5 km IR product with an accuracy of less than 4 mm in NC and NWC and approximately 6 mm in SC can be obtained. Furthermore, the calibrated 1 × 1 km NIR PWV products with an accuracy of less than 3 mm can be obtained in Mainland China, which is especially important for some regional climate studies over the region.

4.4. Analysis of Seasonal and Long-Term PWV Variations

In addition to the radiosonde and GNSS PWV, the MODIS-derived PWV is suitable for extracting the monthly average value using daily water vapor value, which can be used to investigate the seasonal and annual variation of atmospheric water vapor [47,48]. The variations are usually correlated with surface temperature, rainfall, topography, latitude, and monsoon [39,49,50,51,52]. As mentioned previously, the regional features of PWV variation exist over China; thus, the seasonal variation of MODIS PWV calibrated using GNSS PWV from [38] is analyzed in the four areas of China. Figure 13 illustrates the seasonal distribution of PWV derived from MODIS and GNSS PWV over the period of 2011–2017, and the evidently seasonal variations exist in the four areas. The largest PWV value appears in July for NC, SC, and NWC areas with approximately 25, 37, and 18 mm, respectively; however, this value occurs in August in the TP region with approximately 13 mm. The calibrated NIR PWV has a better agreement with GNSS PWV in NC, SC, and NWC areas; however, the calibrated IR PWV agrees well with GNSS PWV in TP area, which also indicates the poorly calibrated effect of the linear fit model in the TP area.
In addition to the seasonal variation of PWV, the long-term MODIS-derived PWV can also be used for the trend analysis of atmospheric water vapor. The annual, semi-annual, and seasonal periods, as well as the trend component in GNSS PWV time series, can be modeled by the linear sine and cosine model [41]. Therefore, this model is used for the estimation of PWV trend and different periods over Mainland China. Prior to the modeling of MODIS-derived PWV time series, the preprocess of PWV time series is performed using the interquartile range (IQR) method [53] to remove the outlying PWV values. The PWV data used should be homogenized before use due to the magnitude of climate signal being comparable with that of long-term PWV time series. The error induced by inhomogeneous long-term series will corrupt the change in trend estimation. Therefore, the homogenized radiosonde PWV data derived from [39] is used and compared with that of MODIS PWV.
Table 9 shows the estimated result of different amplitudes and trend component using the radiosonde and MODIS PWV with and without calibration, and Figure 14 shows the long-term distribution of PWV time series in the four areas. The PWV time series derived from MODIS agree well with that from radiosonde. The amplitudes and average PWV values estimated using different PWV datasets are similar in each area. The average PWV values are different in the four areas with the range of approximately 6–24 mm. The SC region has the largest atmospheric water vapor, whereas the least PWV is observed in the TP region. Annual amplitude shows a similar variation condition with average PWV with values ranging from approximately 5 mm to 16 mm. The NC region shows a relatively large semi-annual and seasonal amplitudes when compared with other areas with values of 4.47 mm and 1.86 mm, respectively. Seasonal amplitude can be neglected in SC and TP regions because of their characteristic of geographical location and altitude, respectively. Although similar trends of PWV are observed in the four areas in Figure 14, their trend components are varied largely. However, most of the trends do not pass the 95% significance test due to the limitation of time length. The number of years required for PWV time series is between 30 and 40 years to detect the significant trends of atmospheric water vapor [54].

5. Conclusions

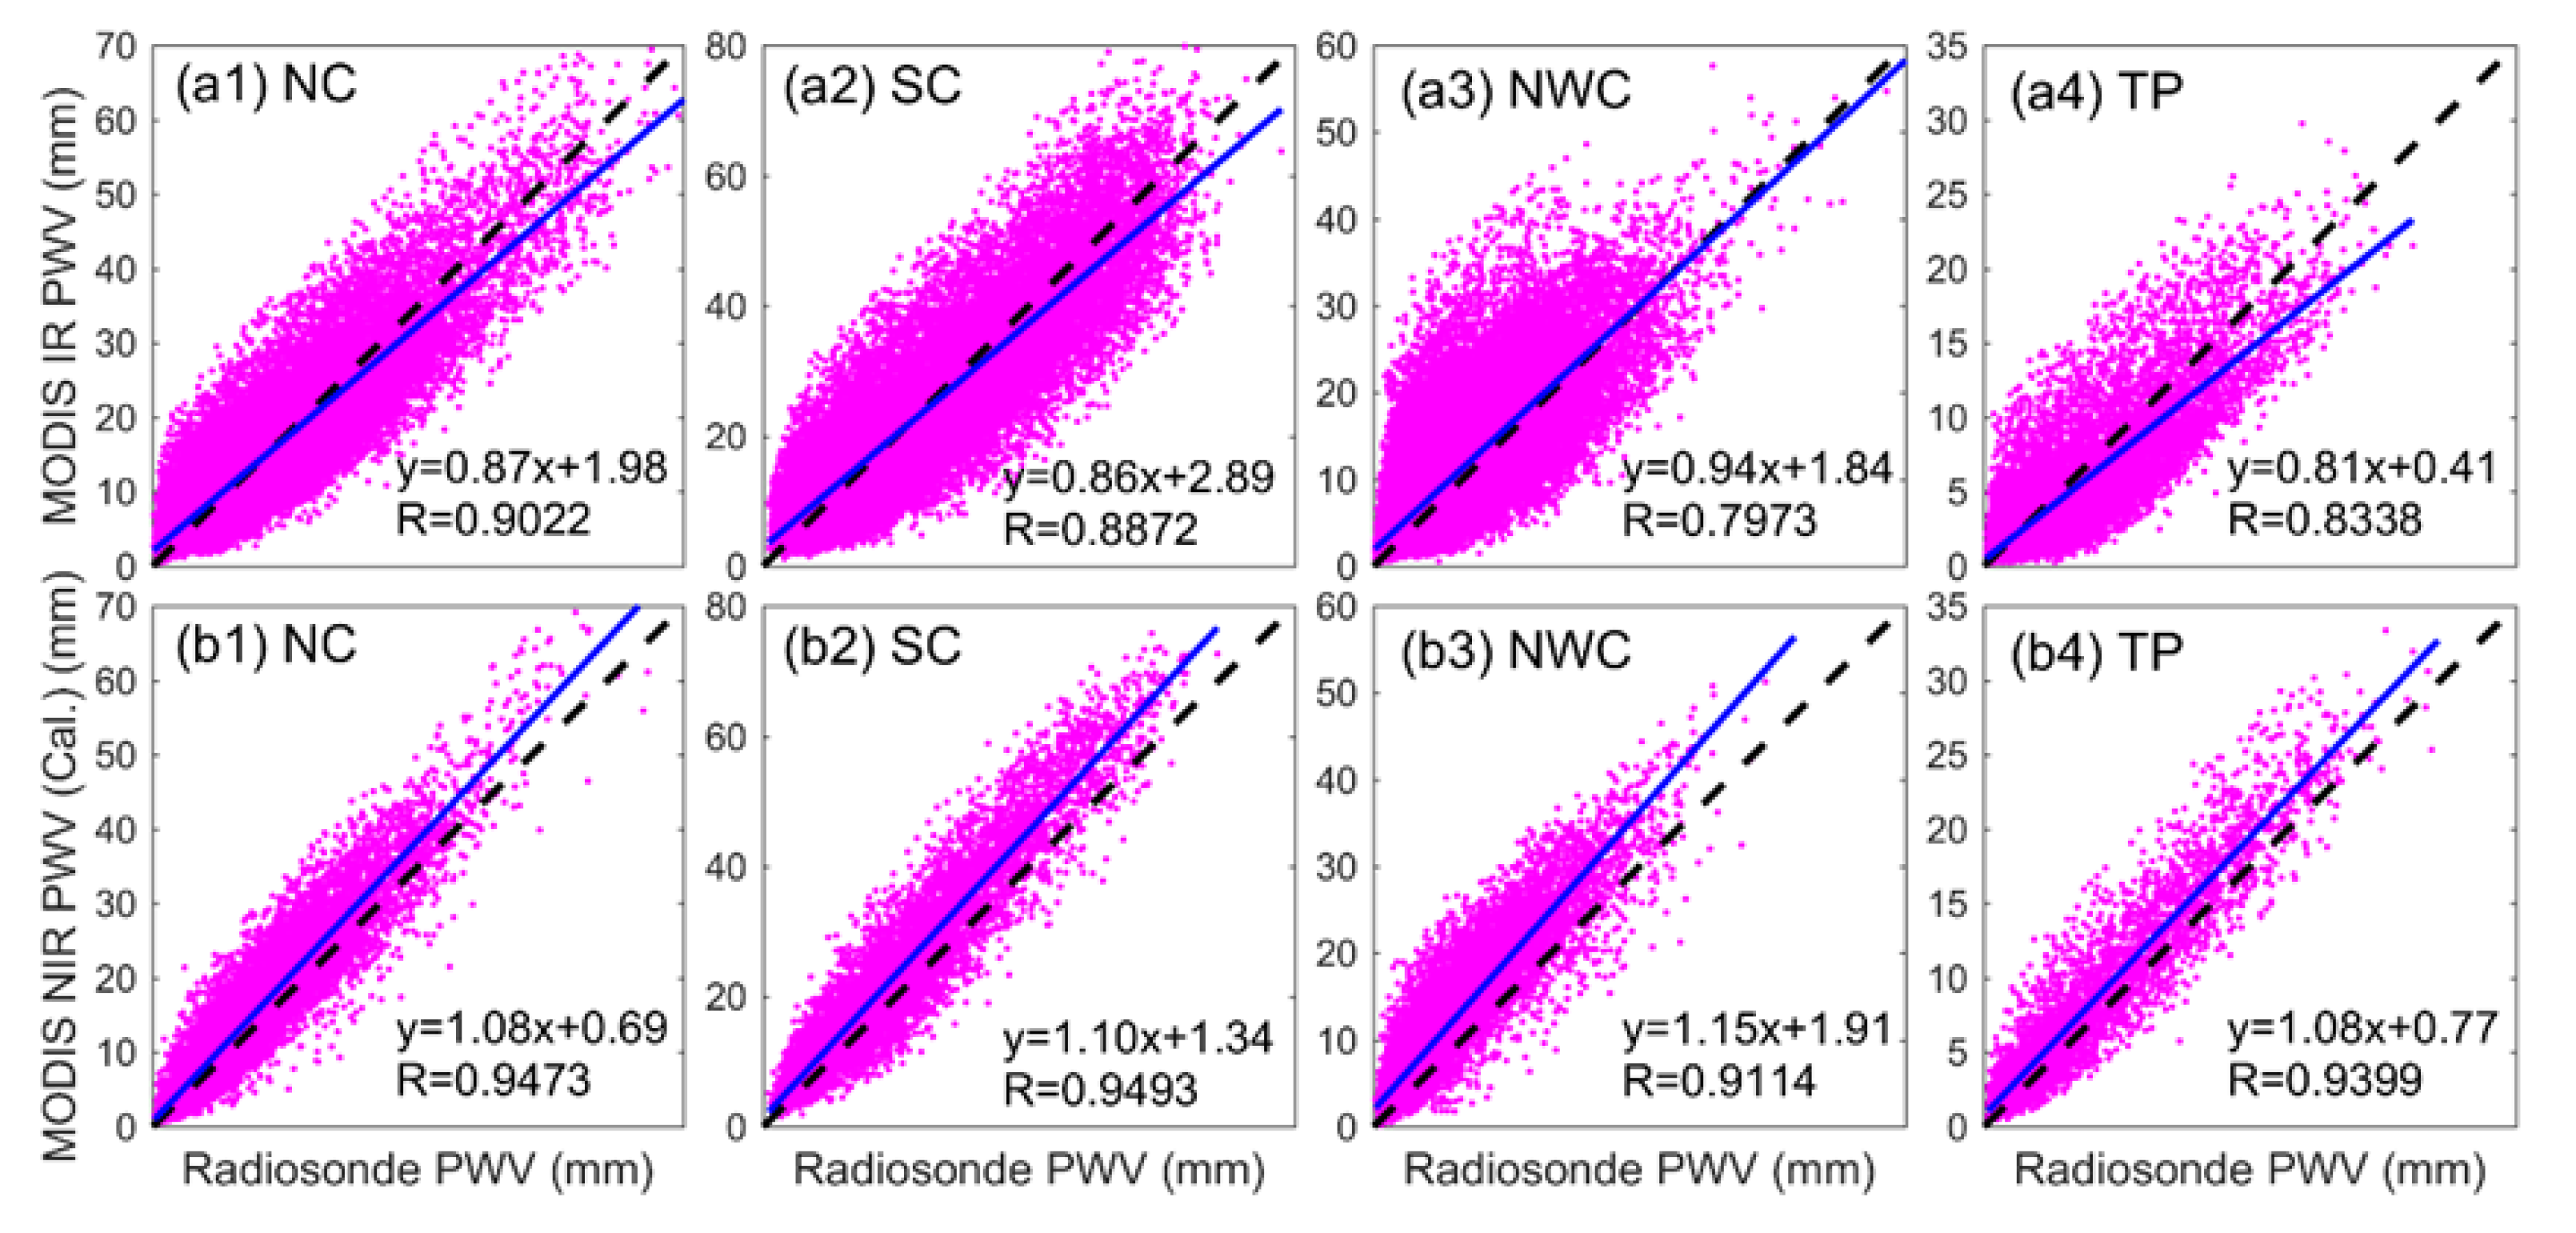
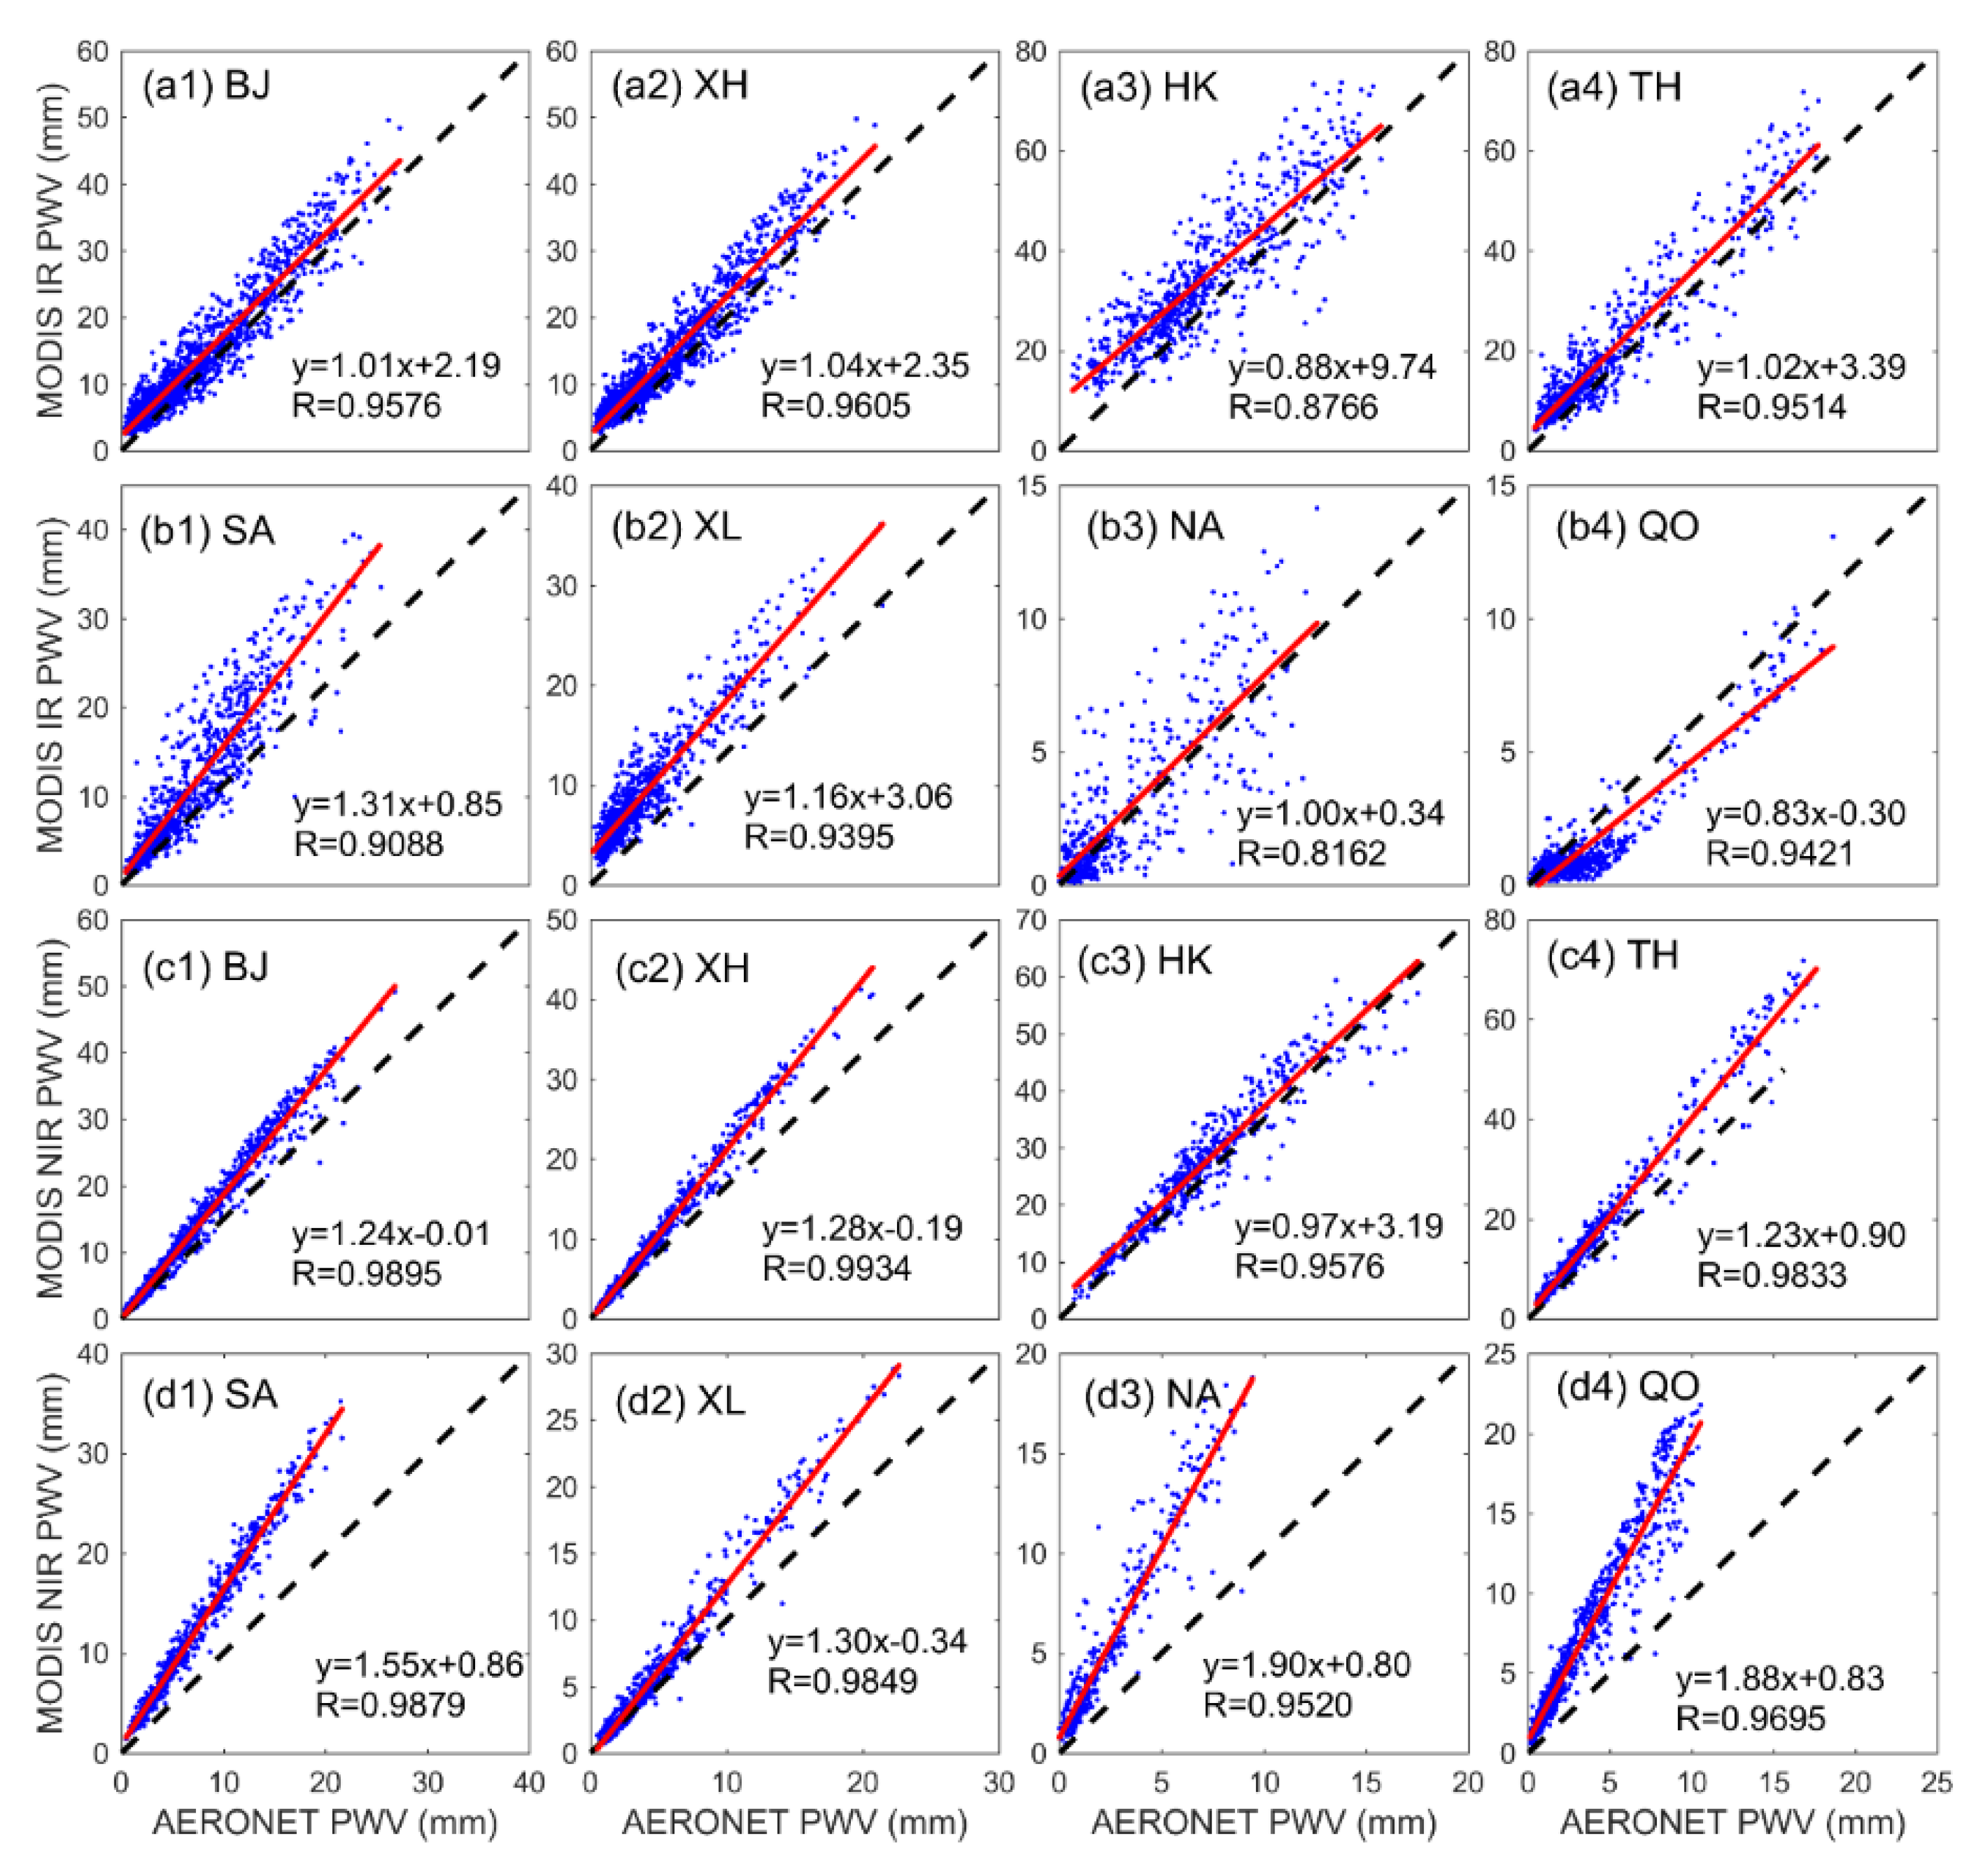
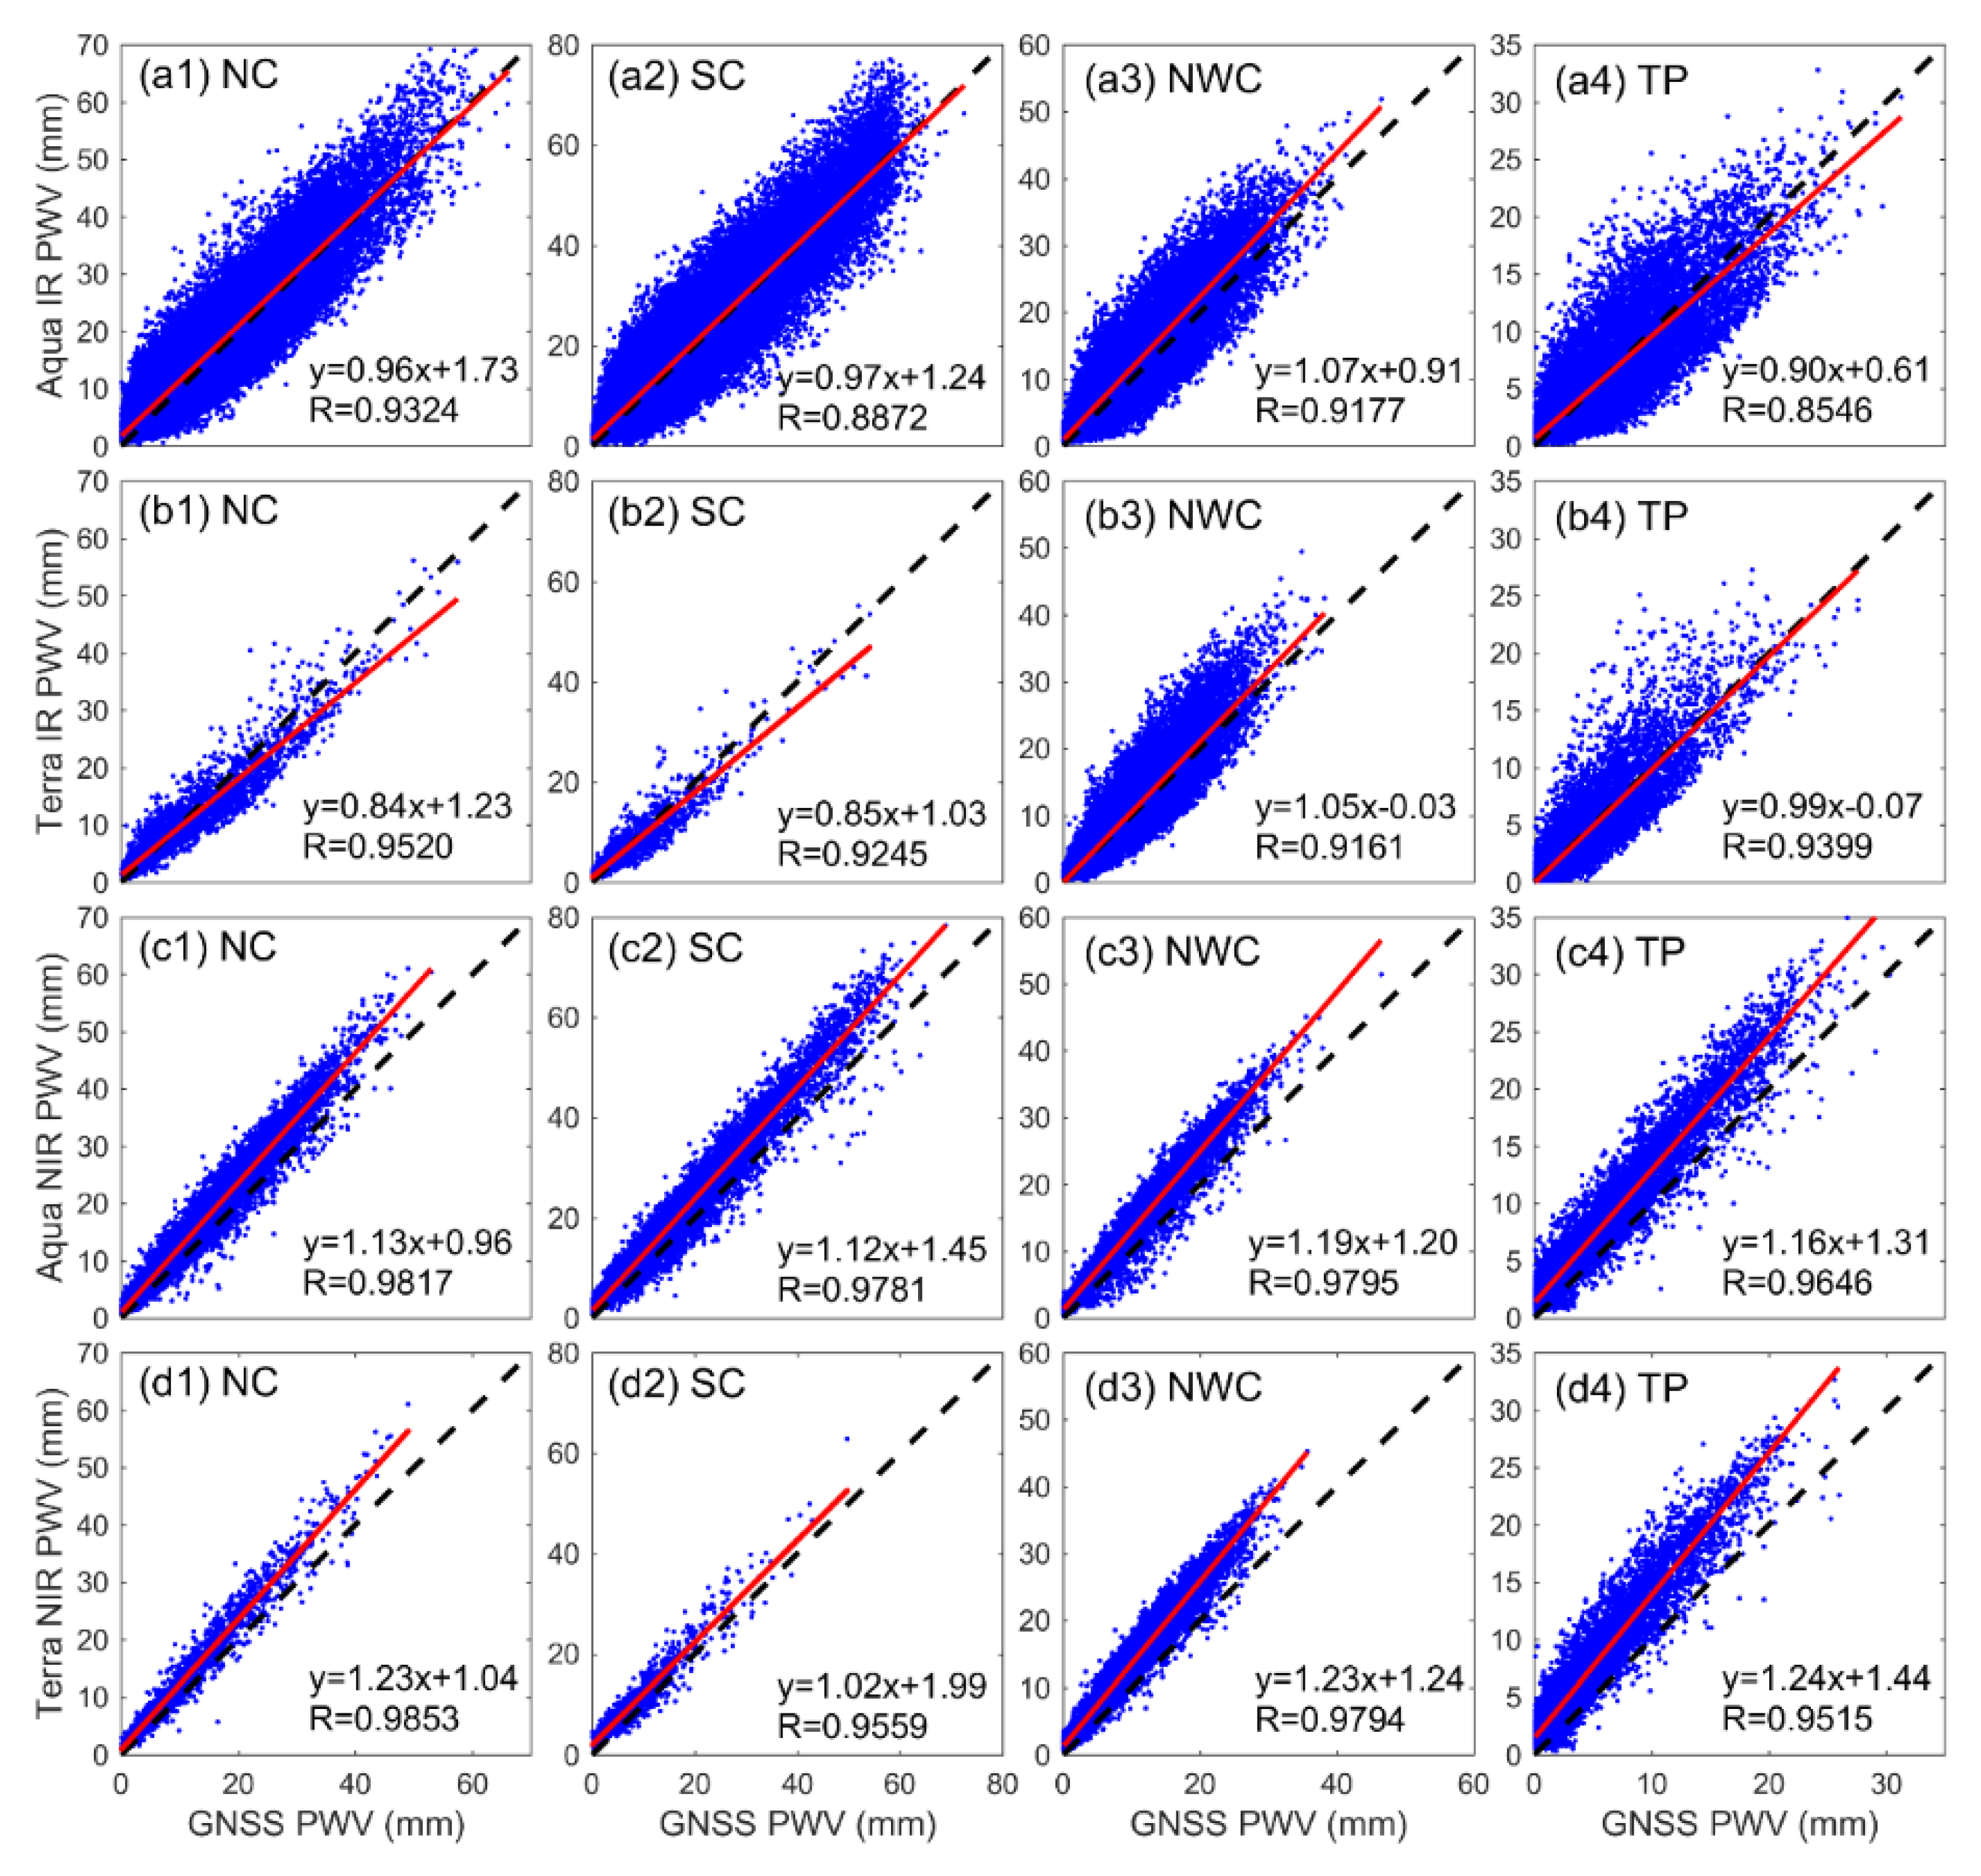
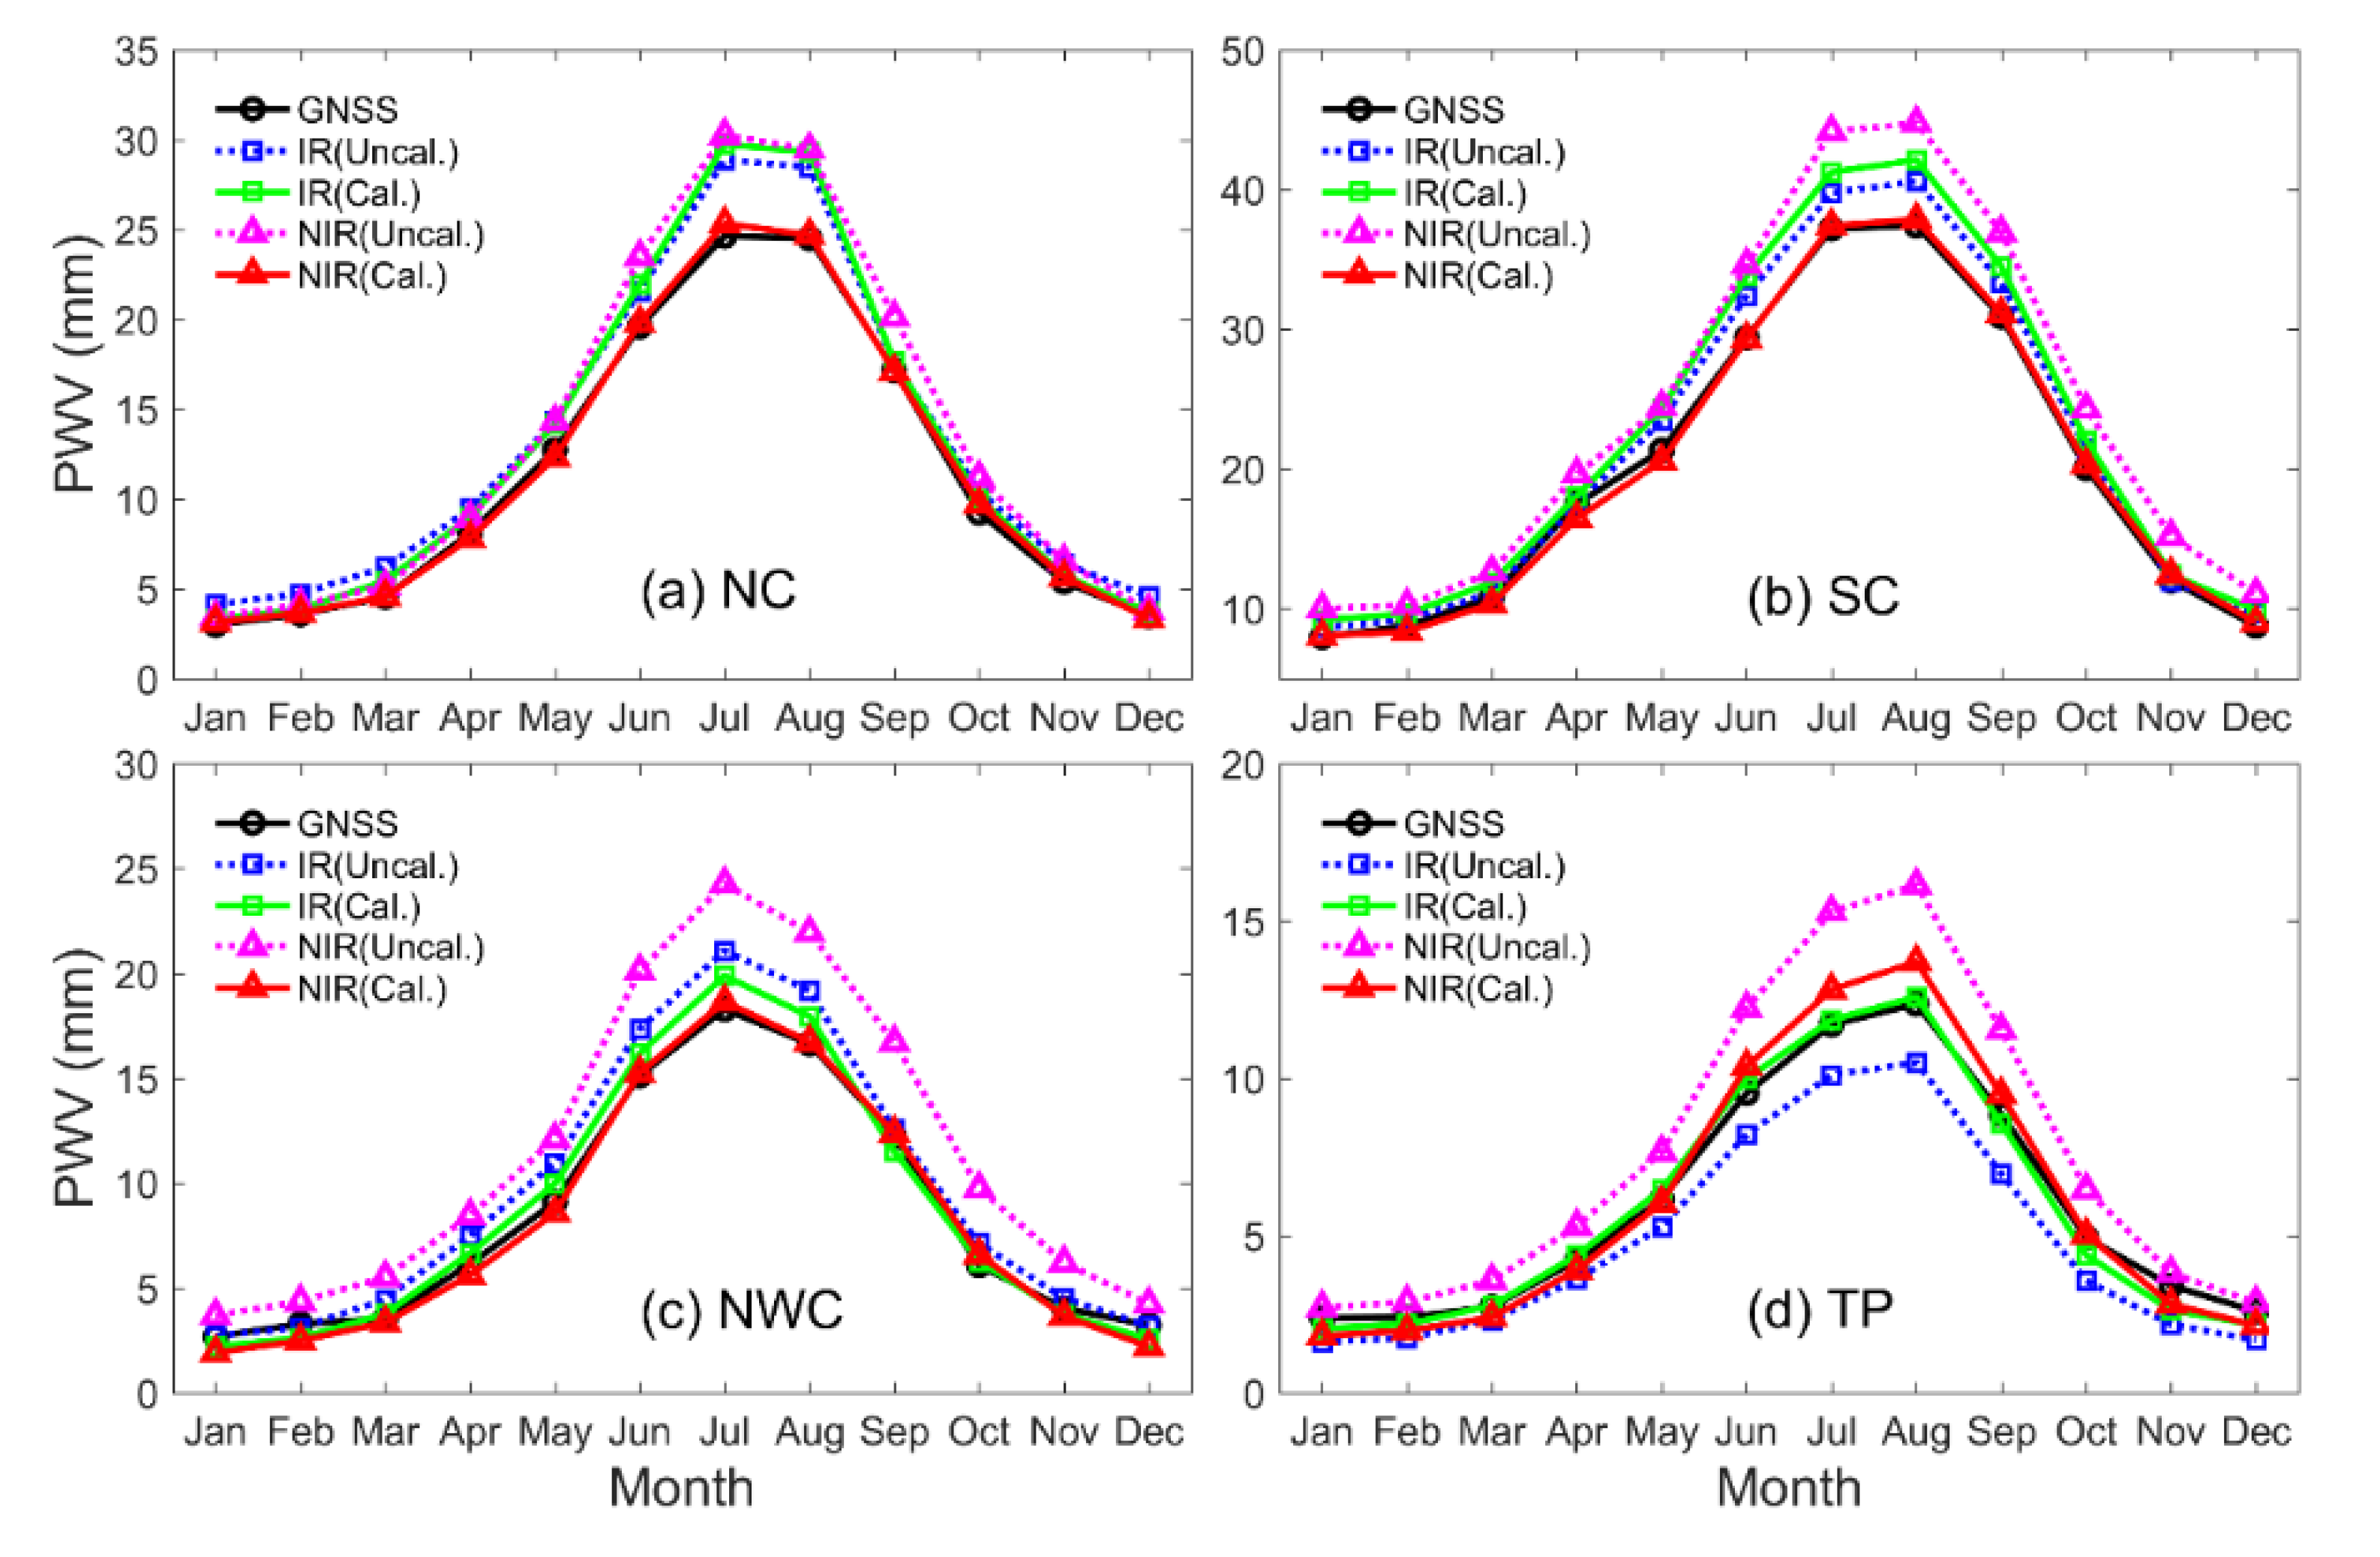
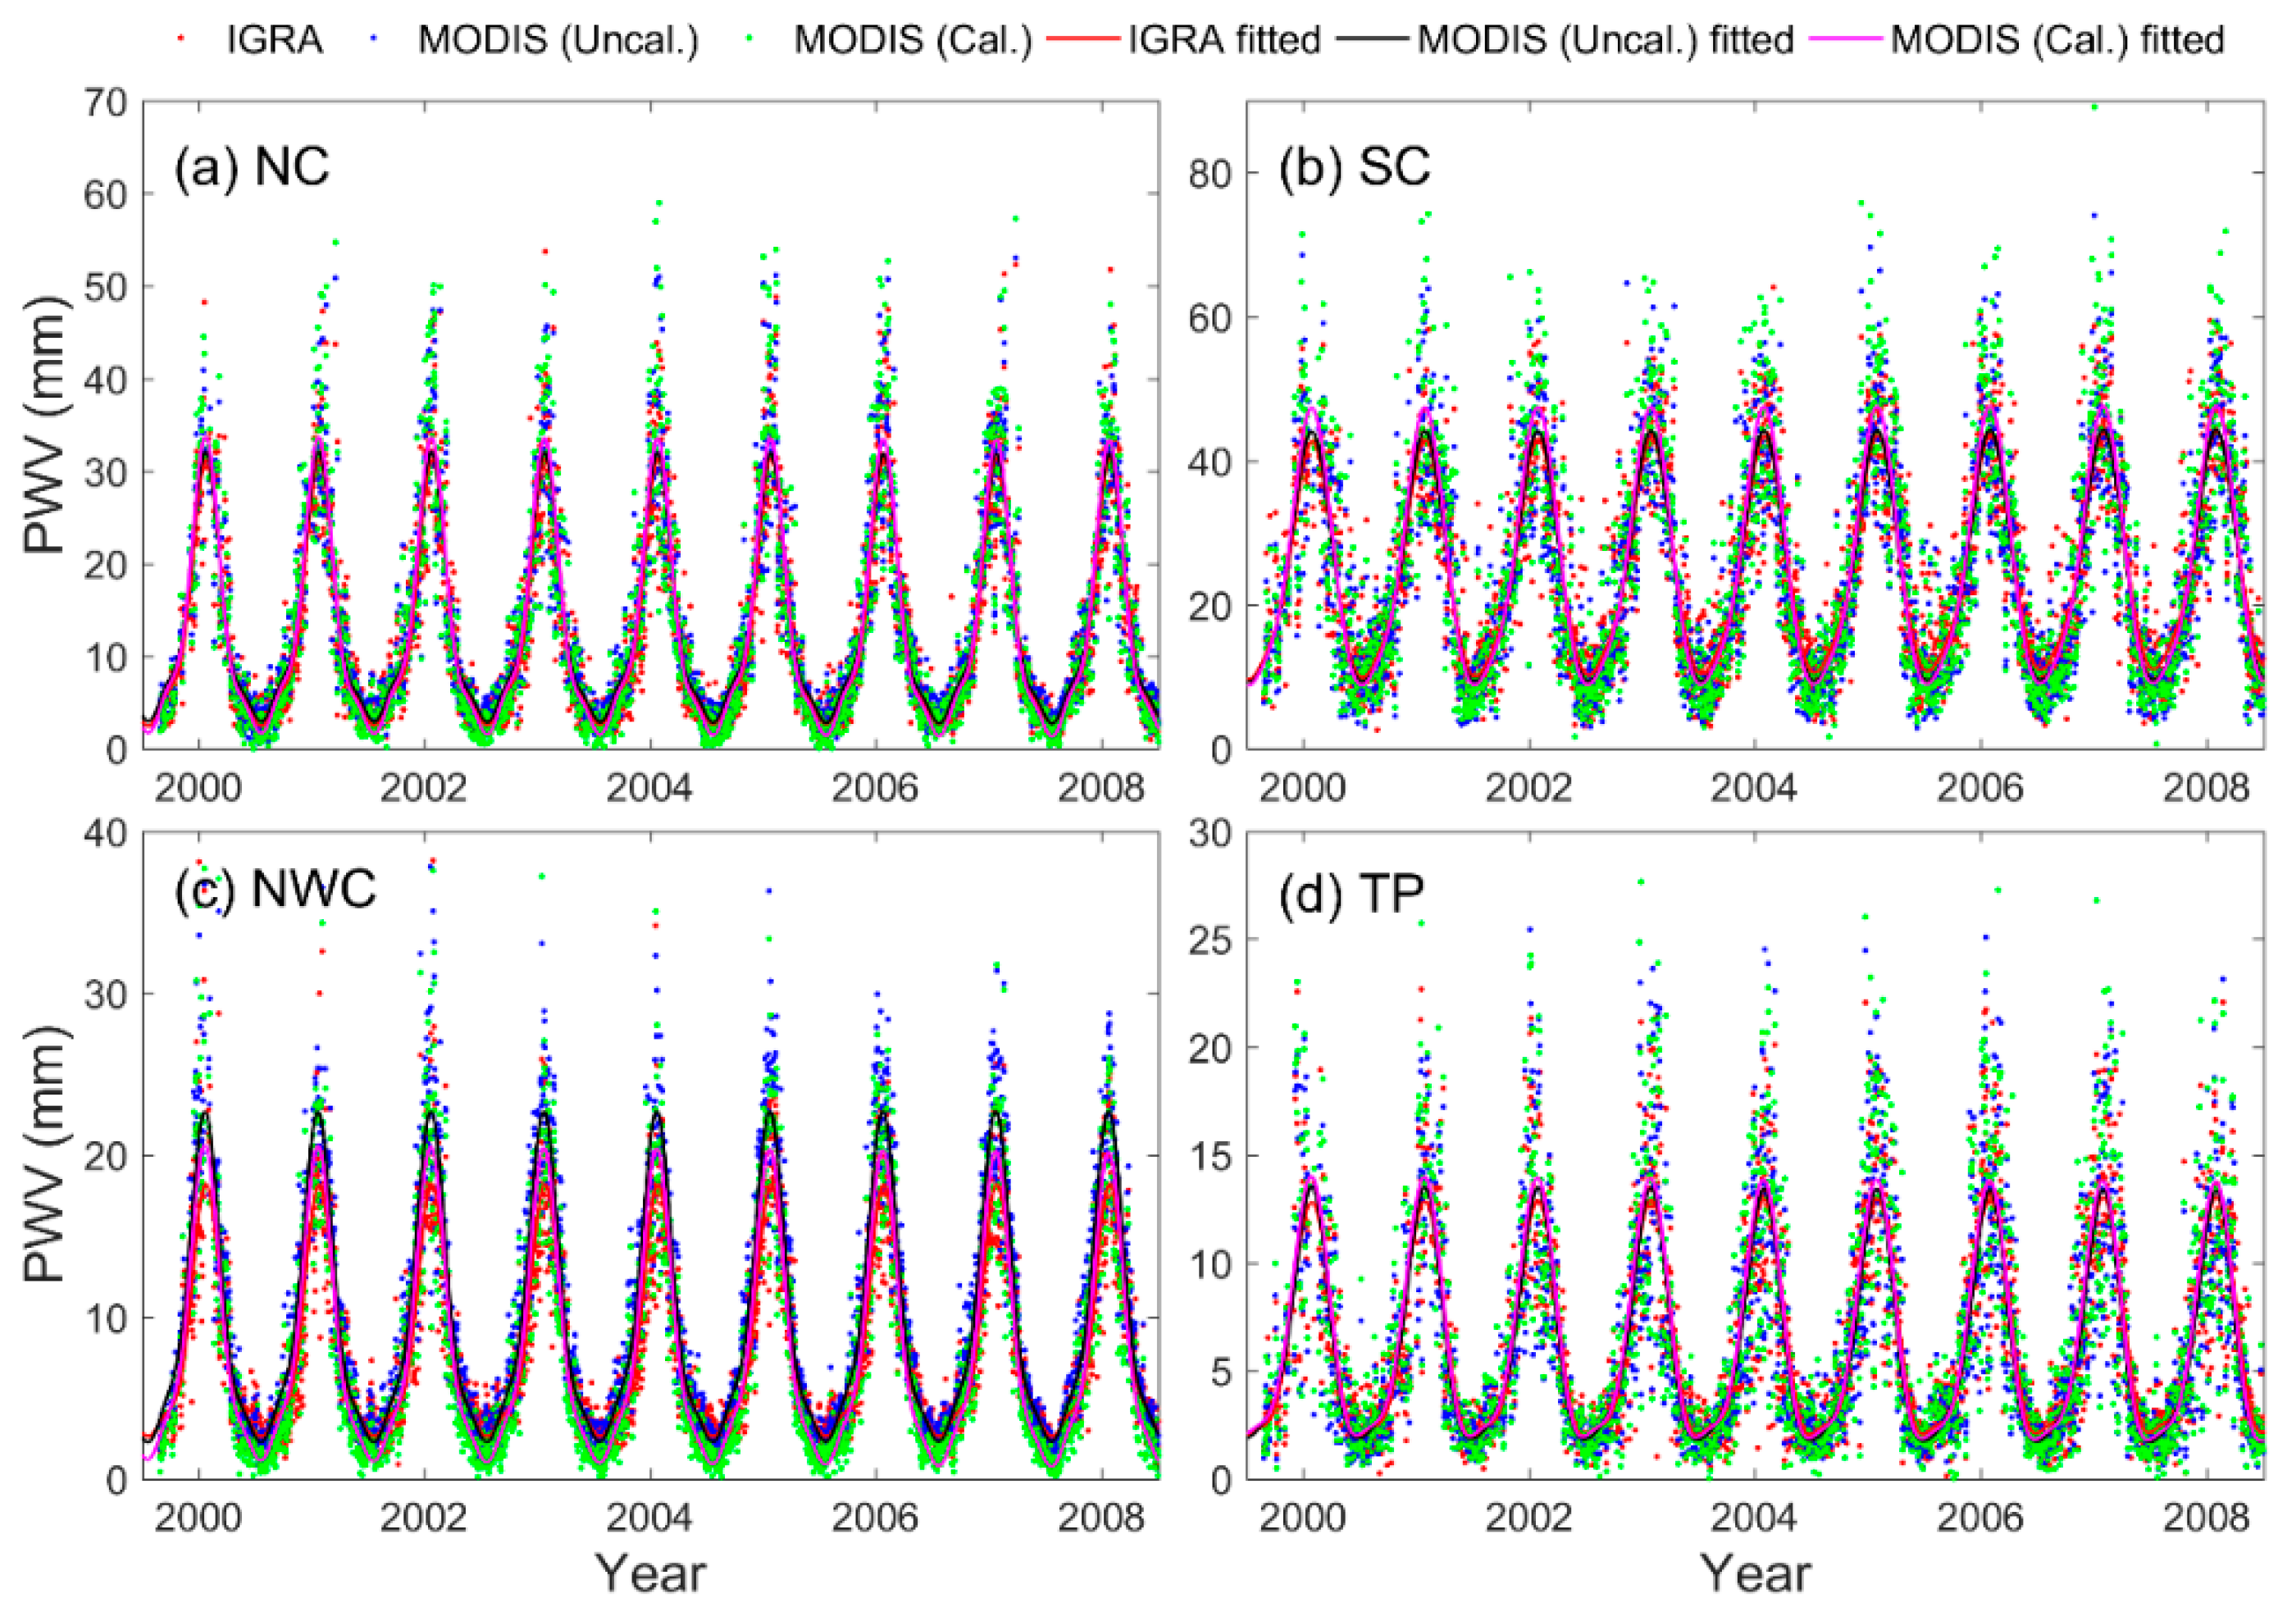
The quality of MODIS PWV products with the longest time is initially validated comprehensively using ground-based GNSS, AERONET, radiosonde, and ECMWF ERA-Interim PWV data over Mainland China, which is divided into four areas, and the calibration of the MODIS PWV products are conducted. Seasonal and long-term PWV variations derived from MODIS are also analyzed in this study.
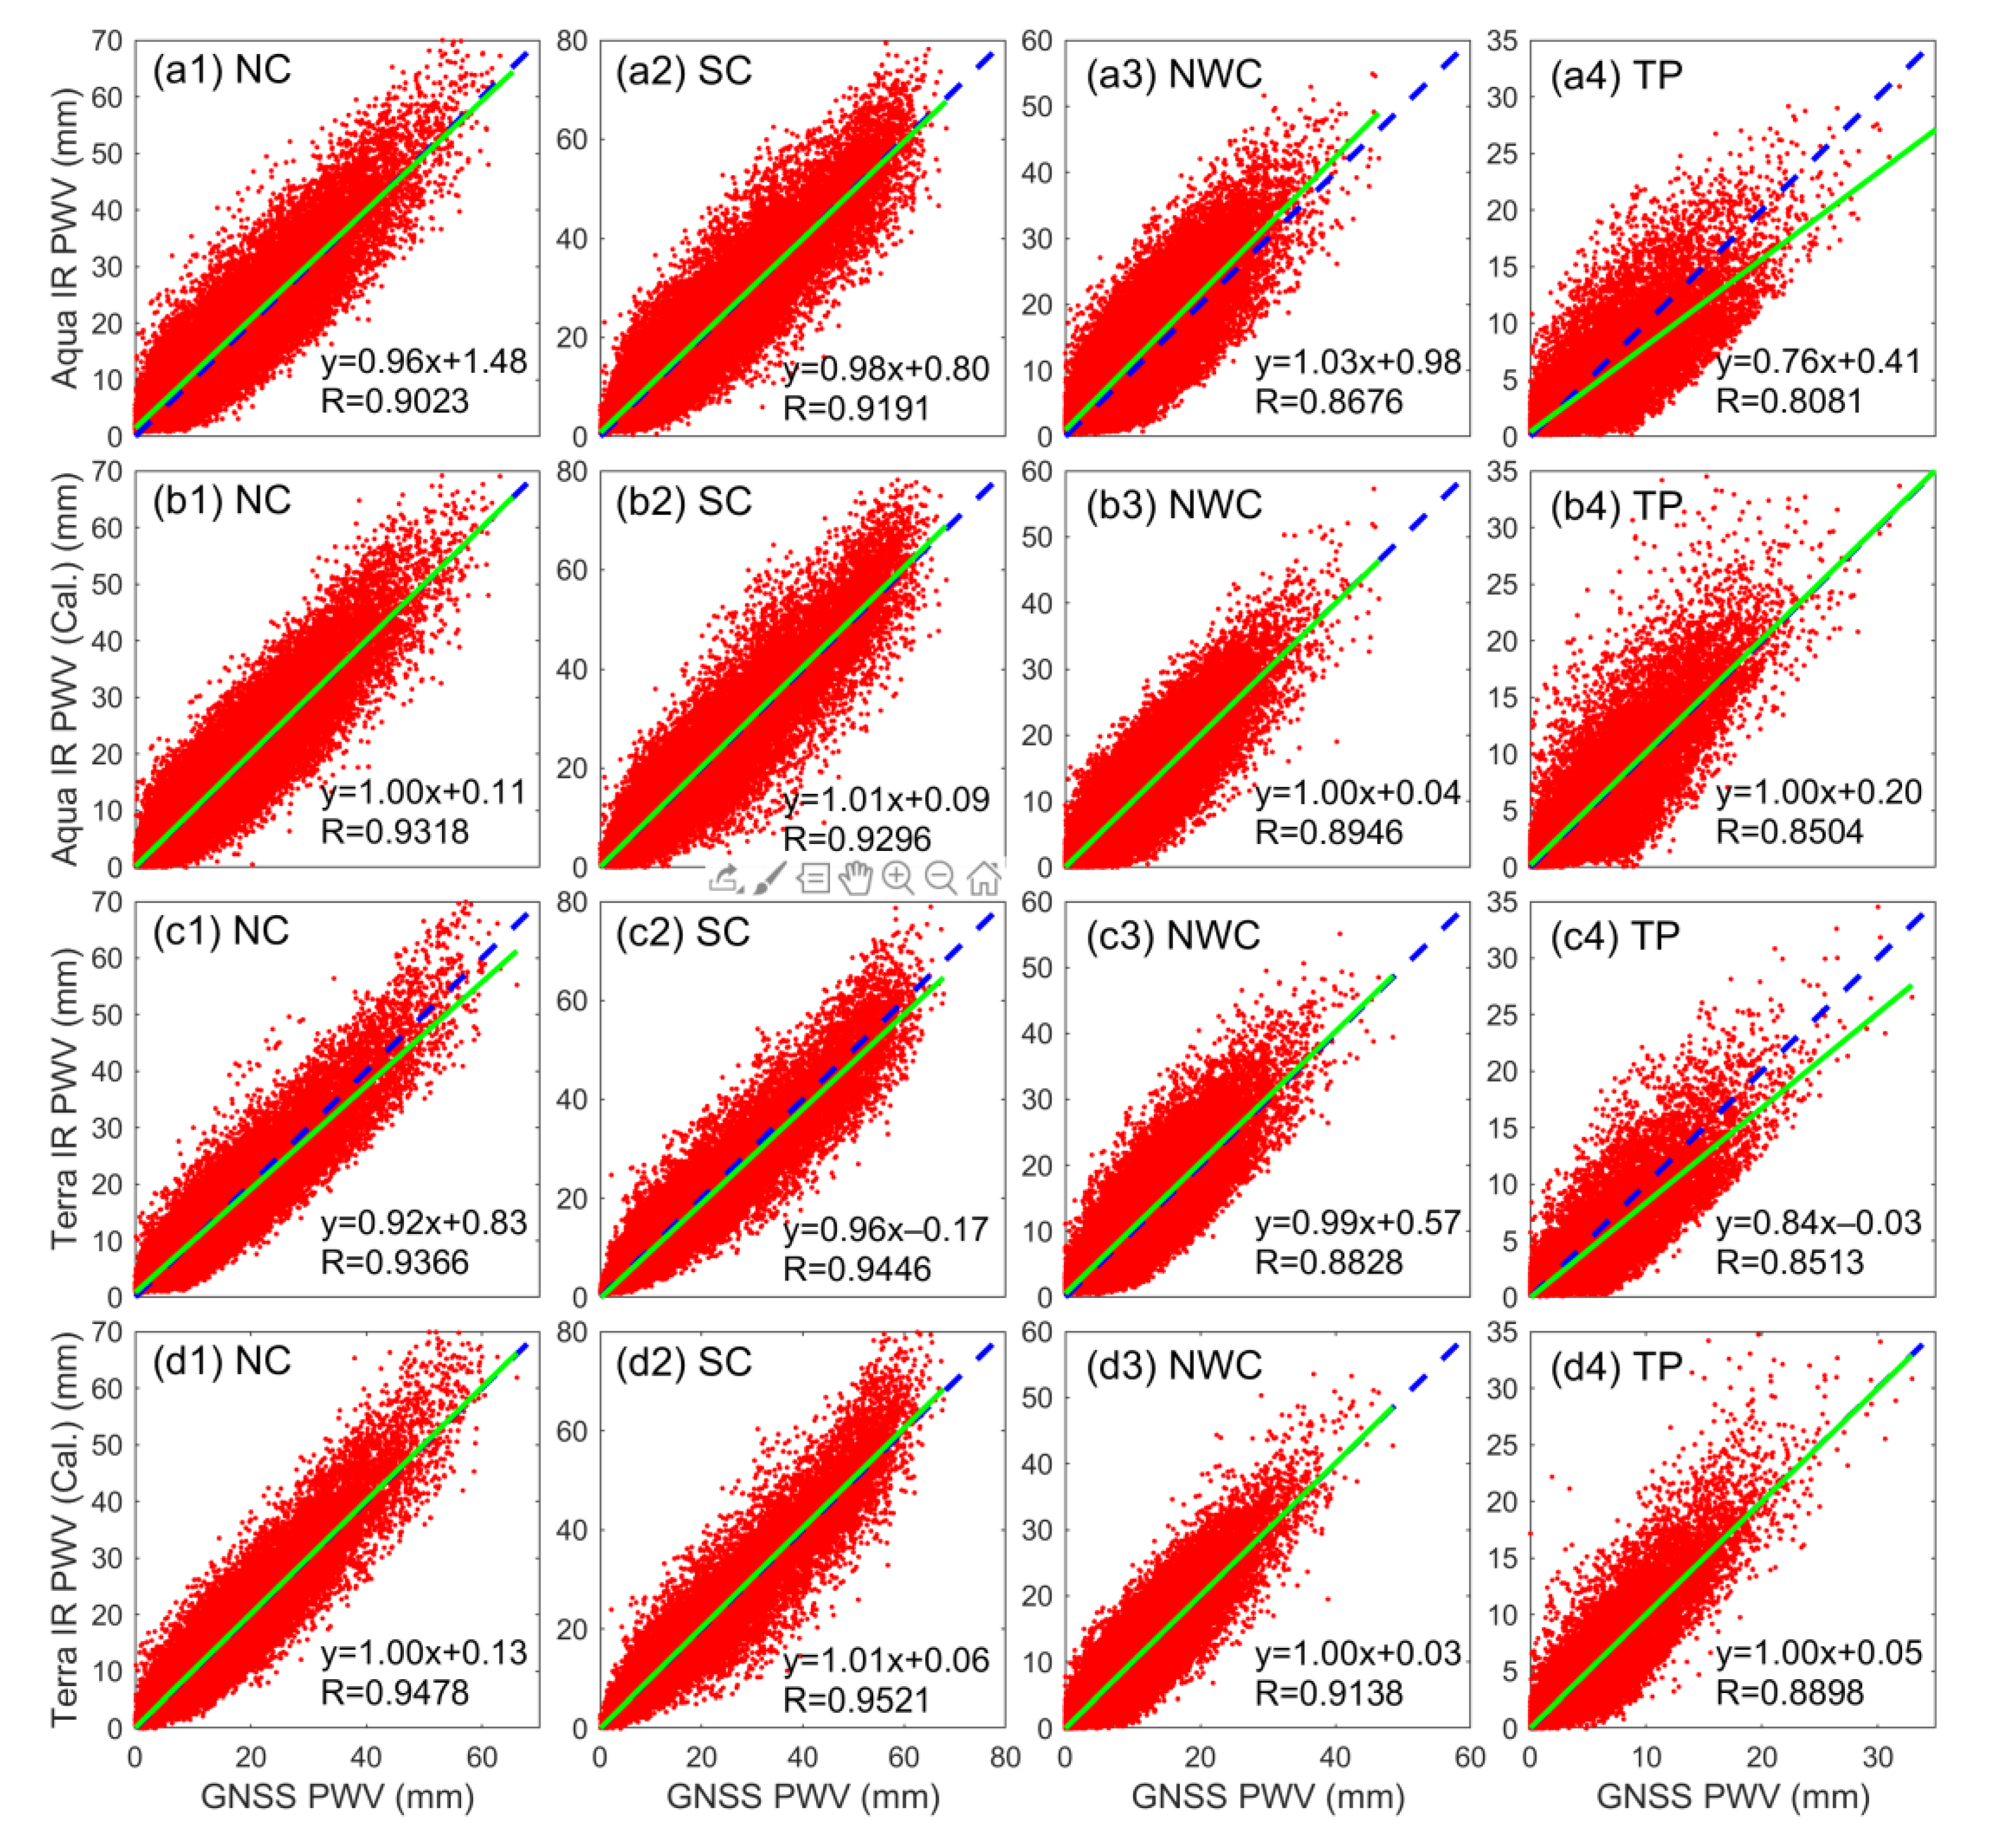
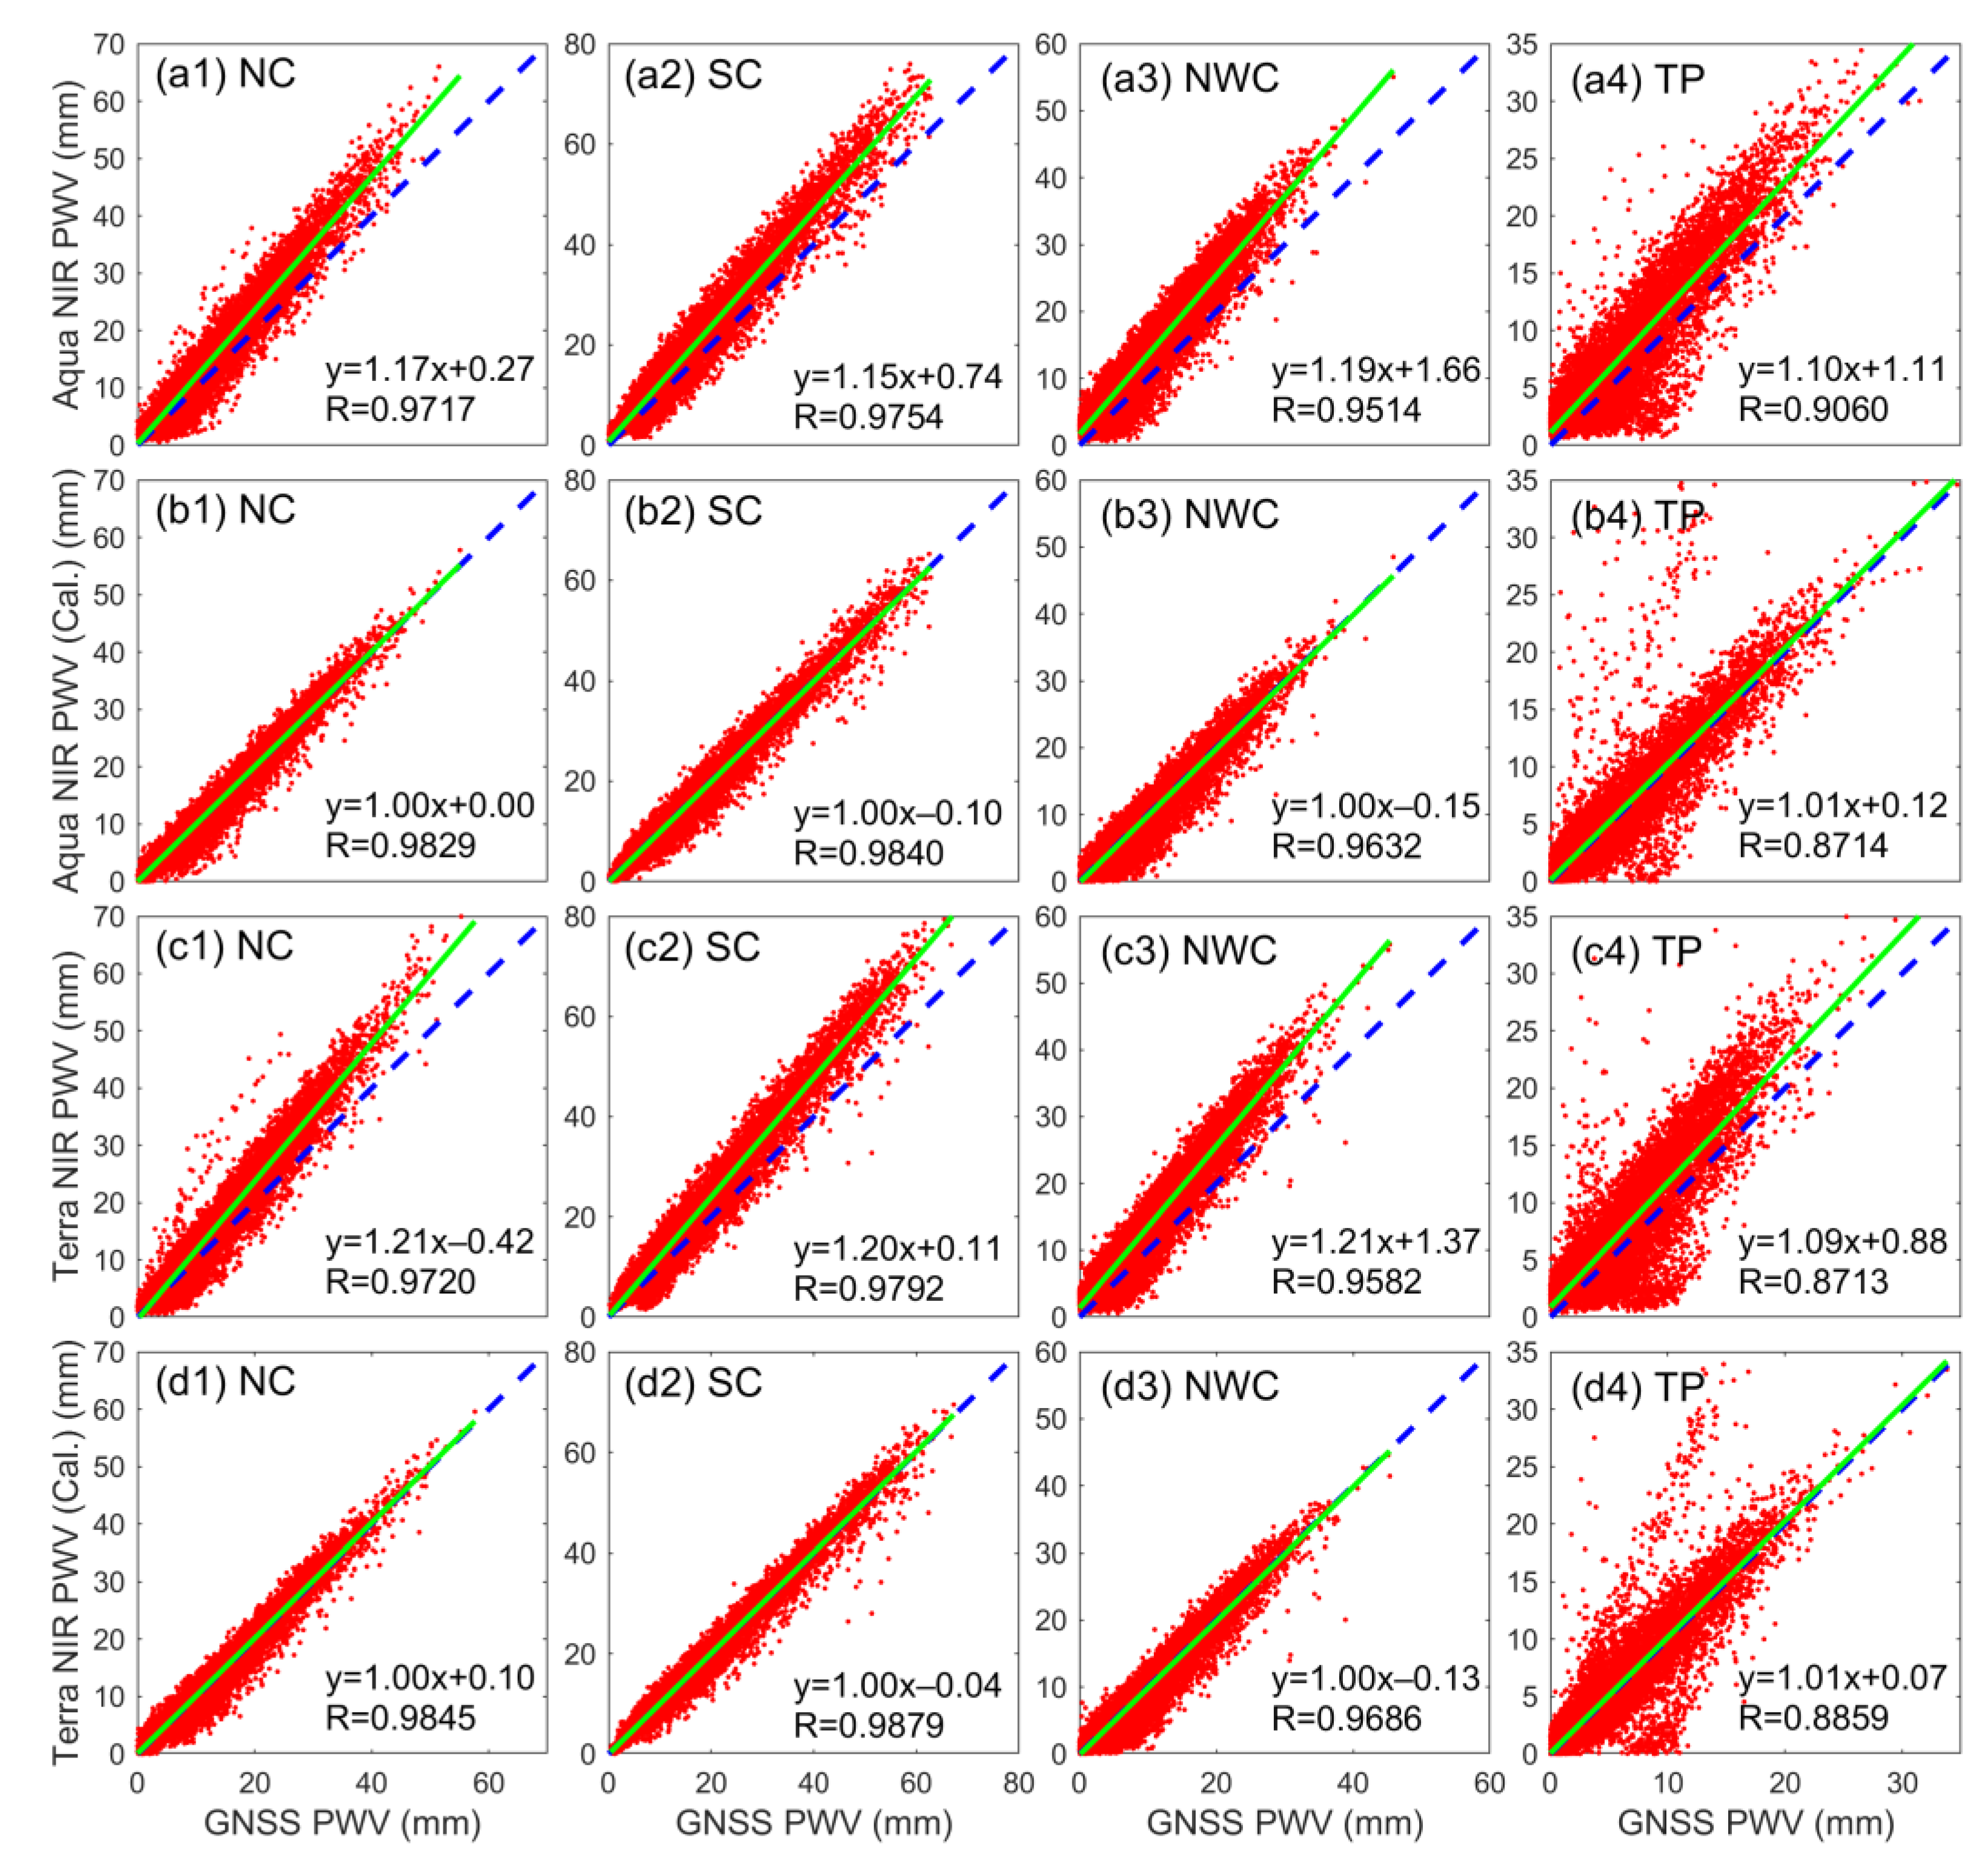
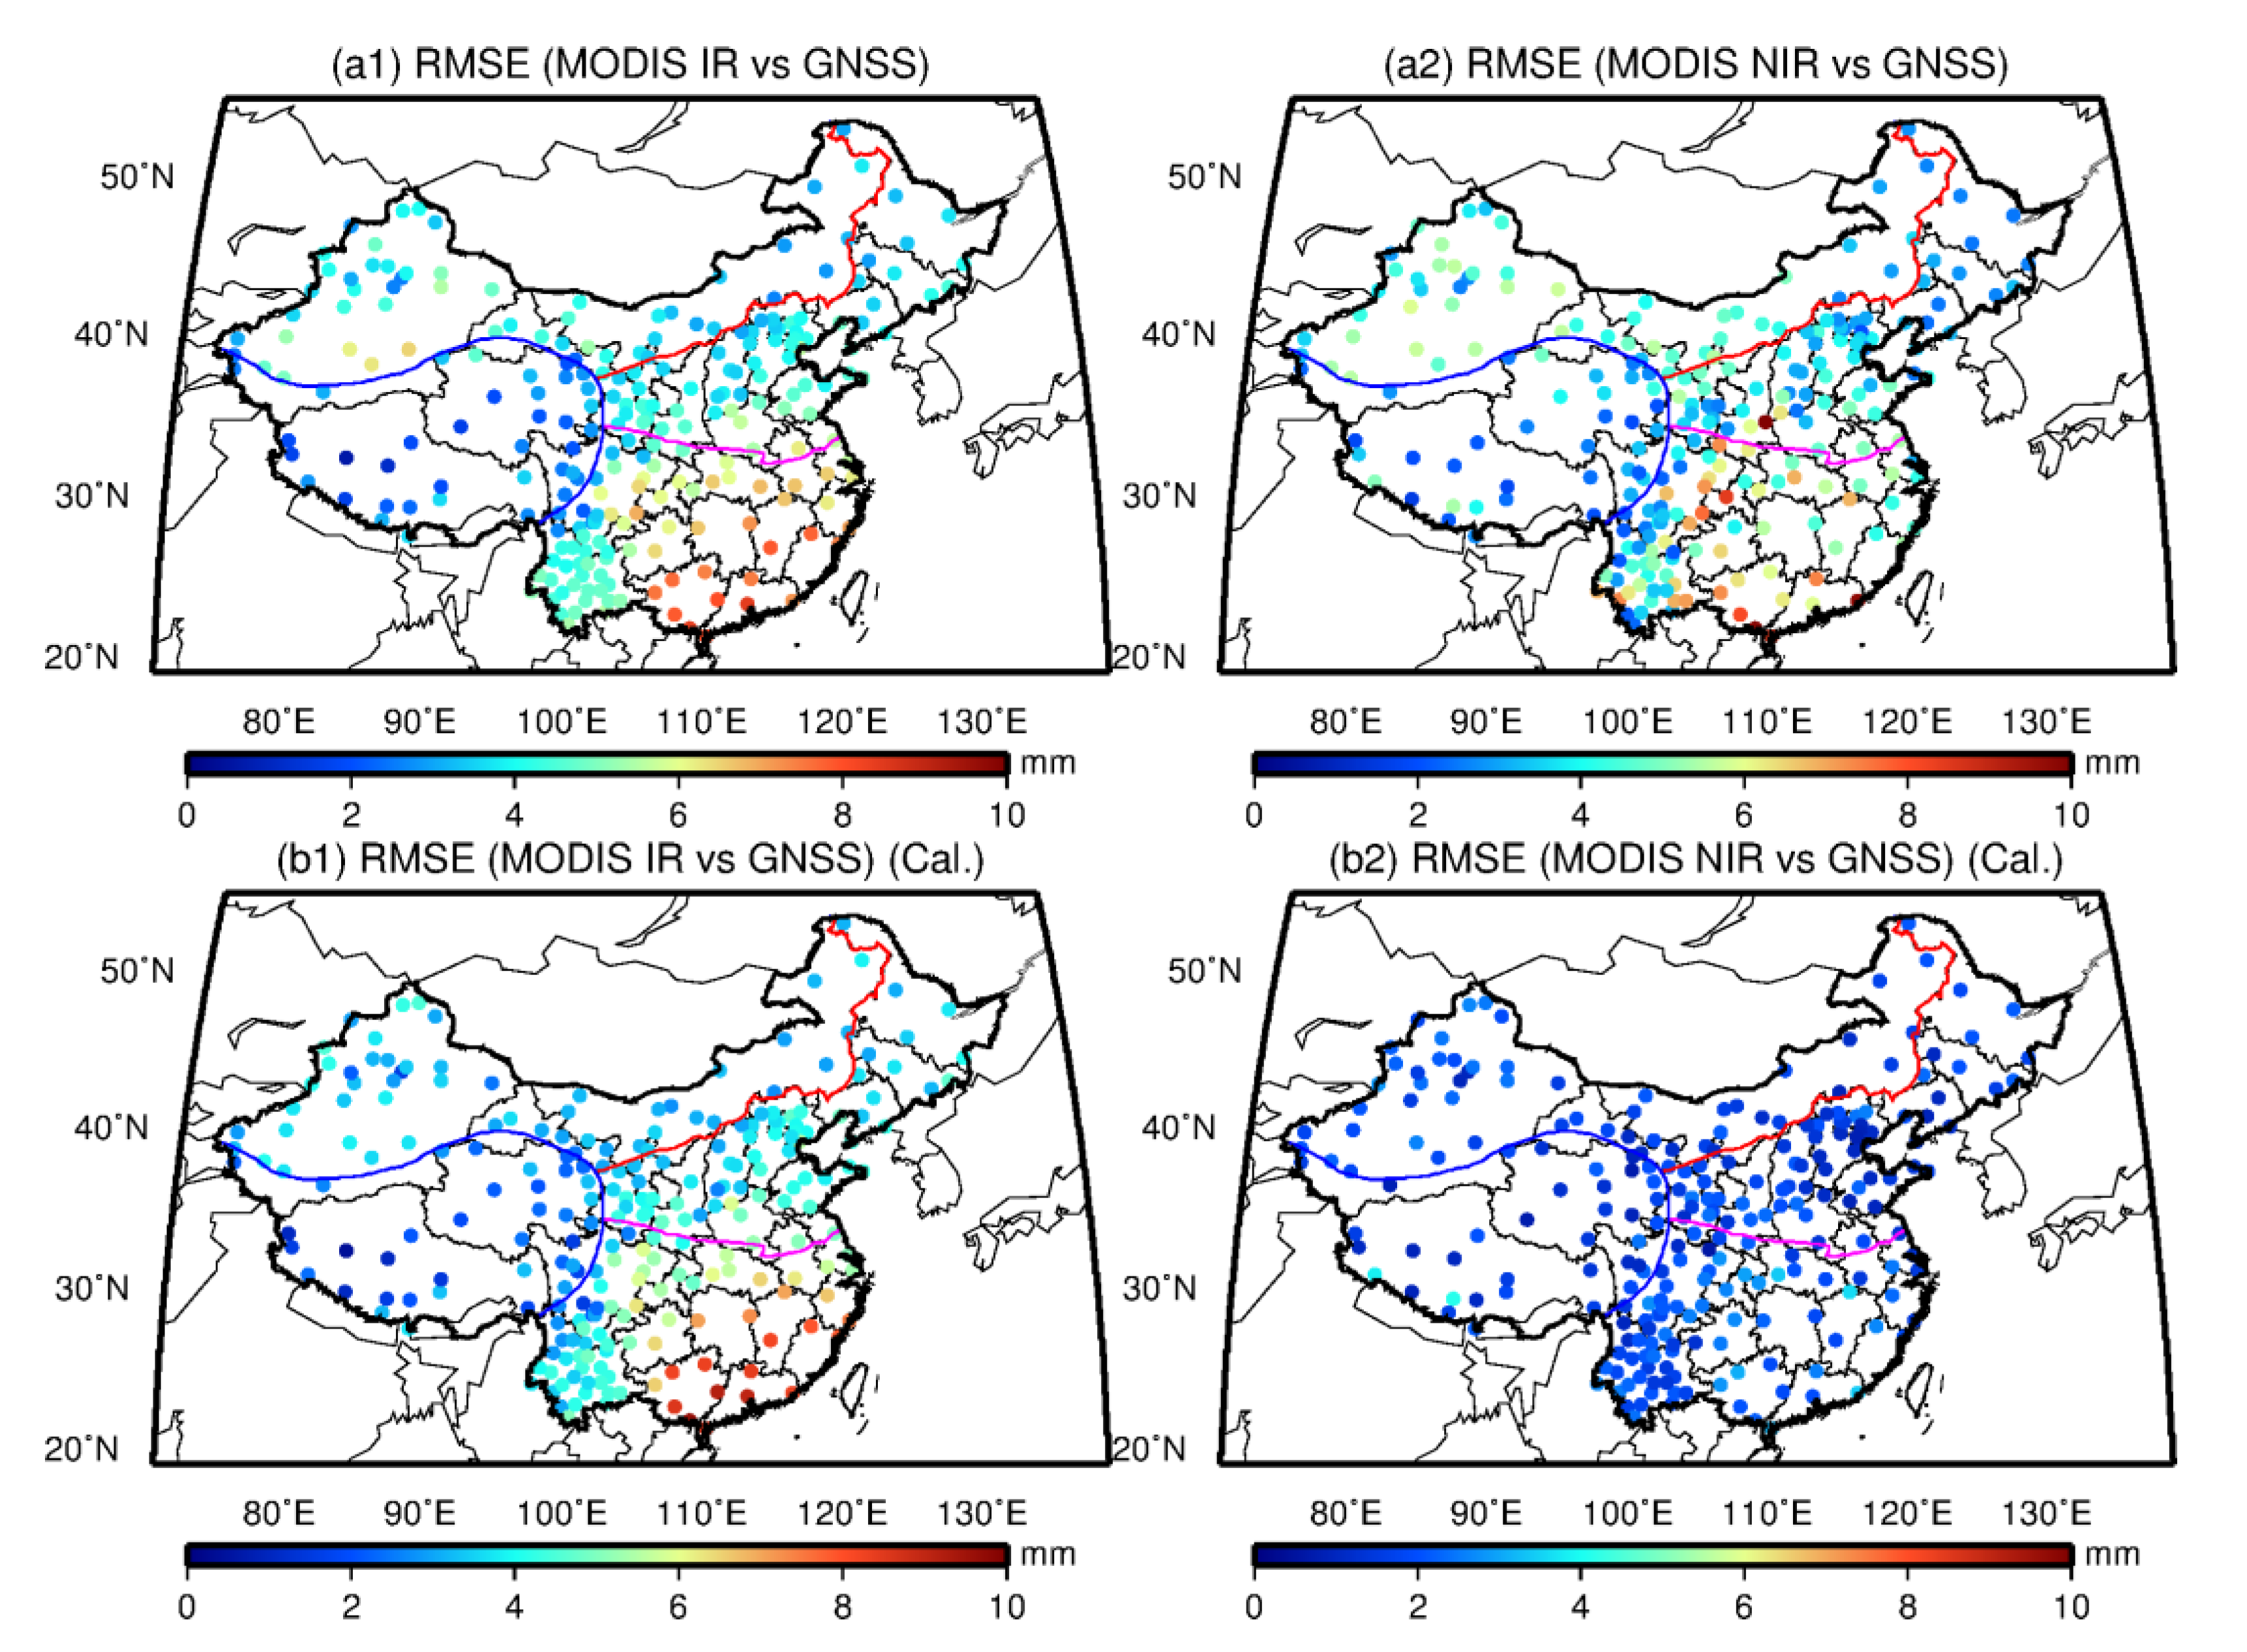
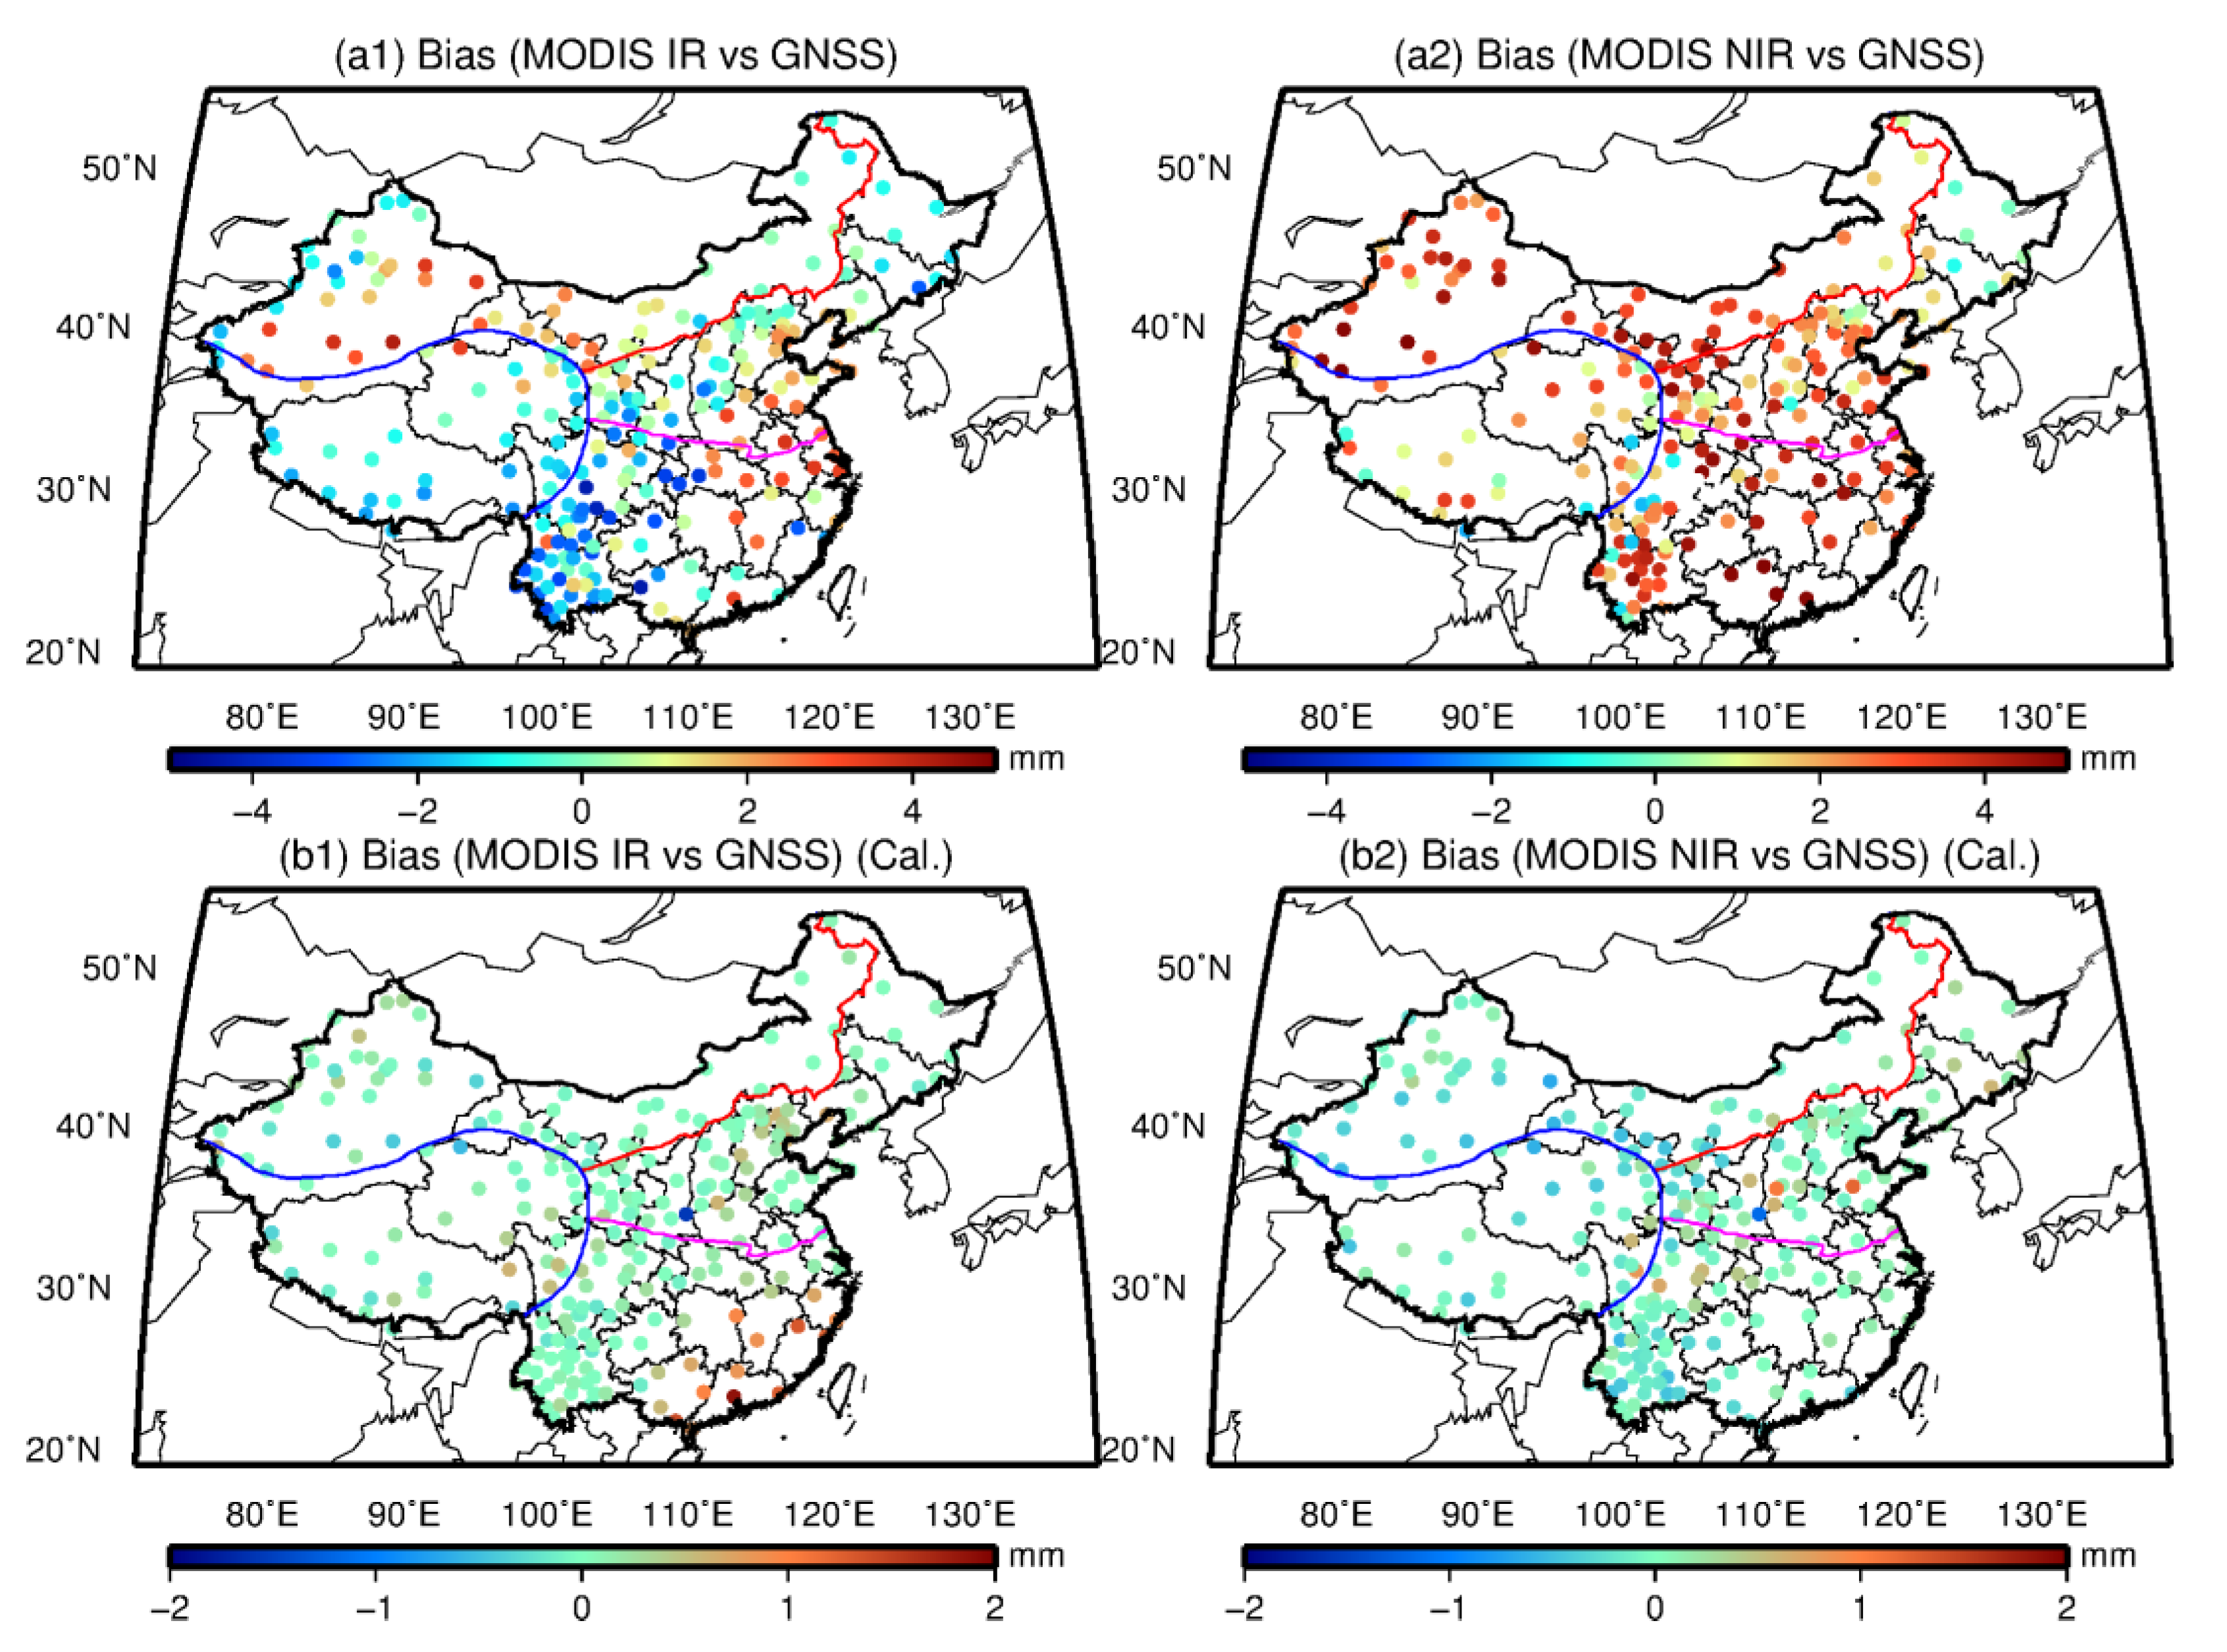
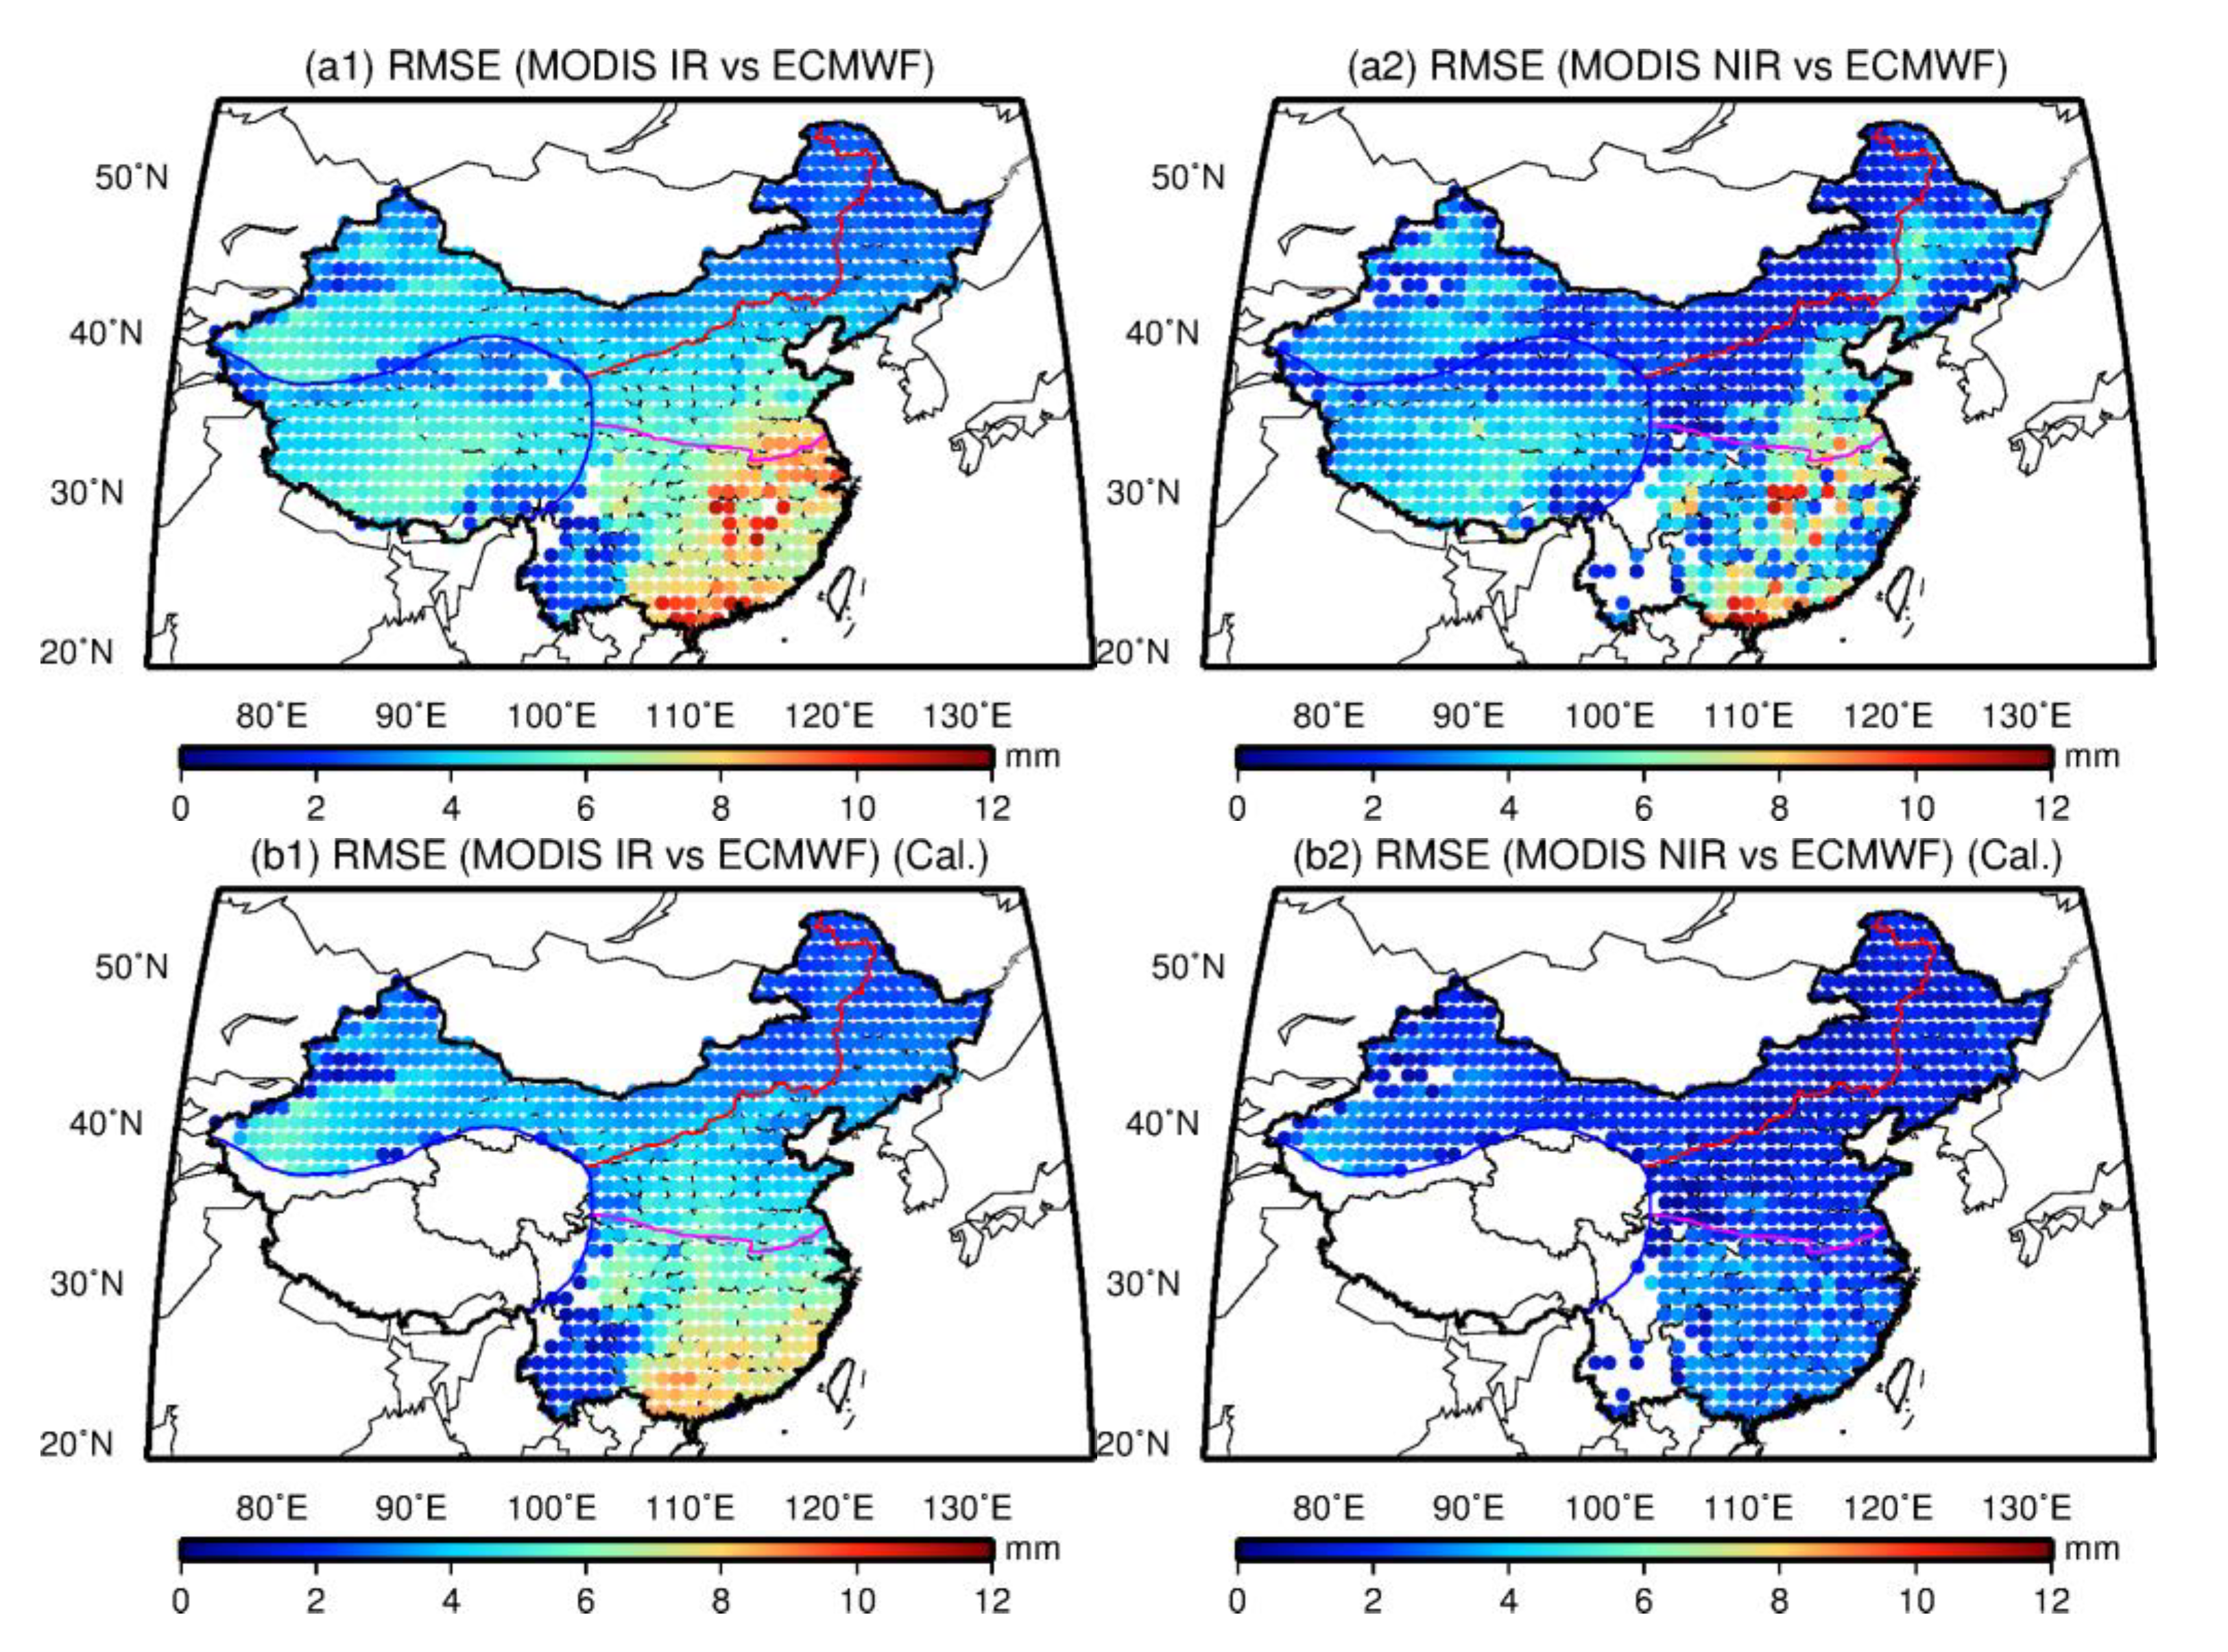
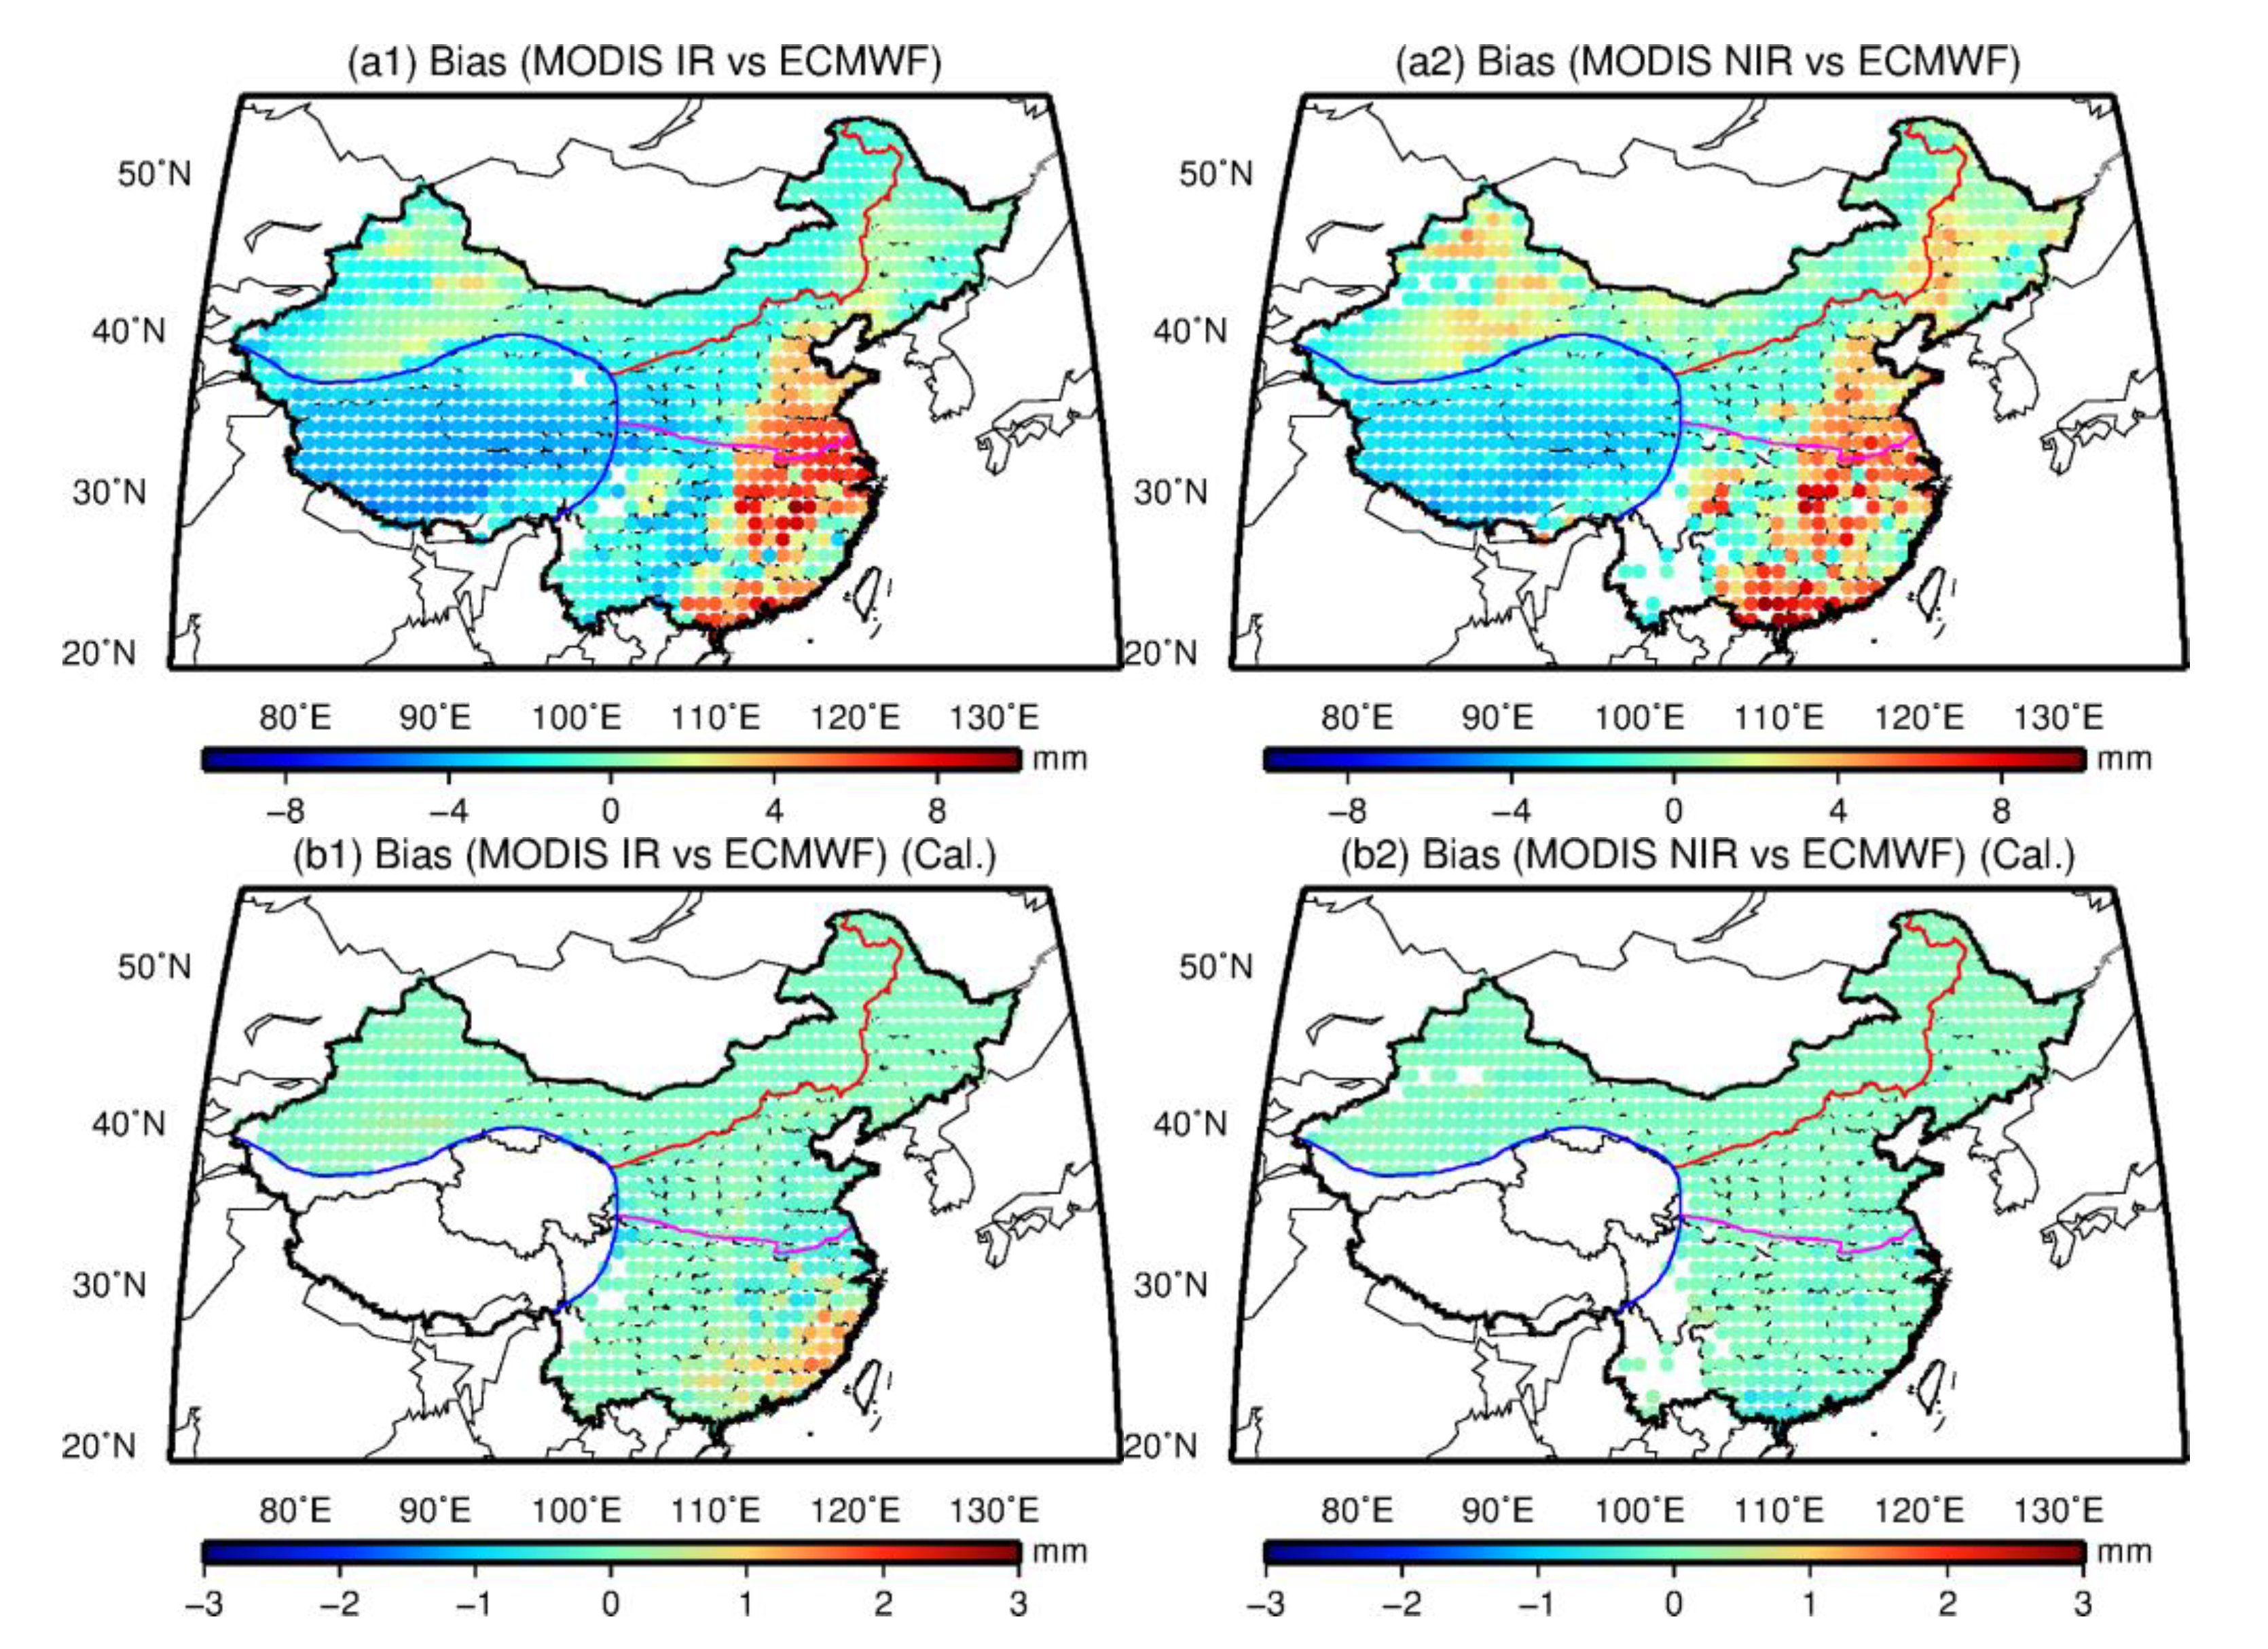
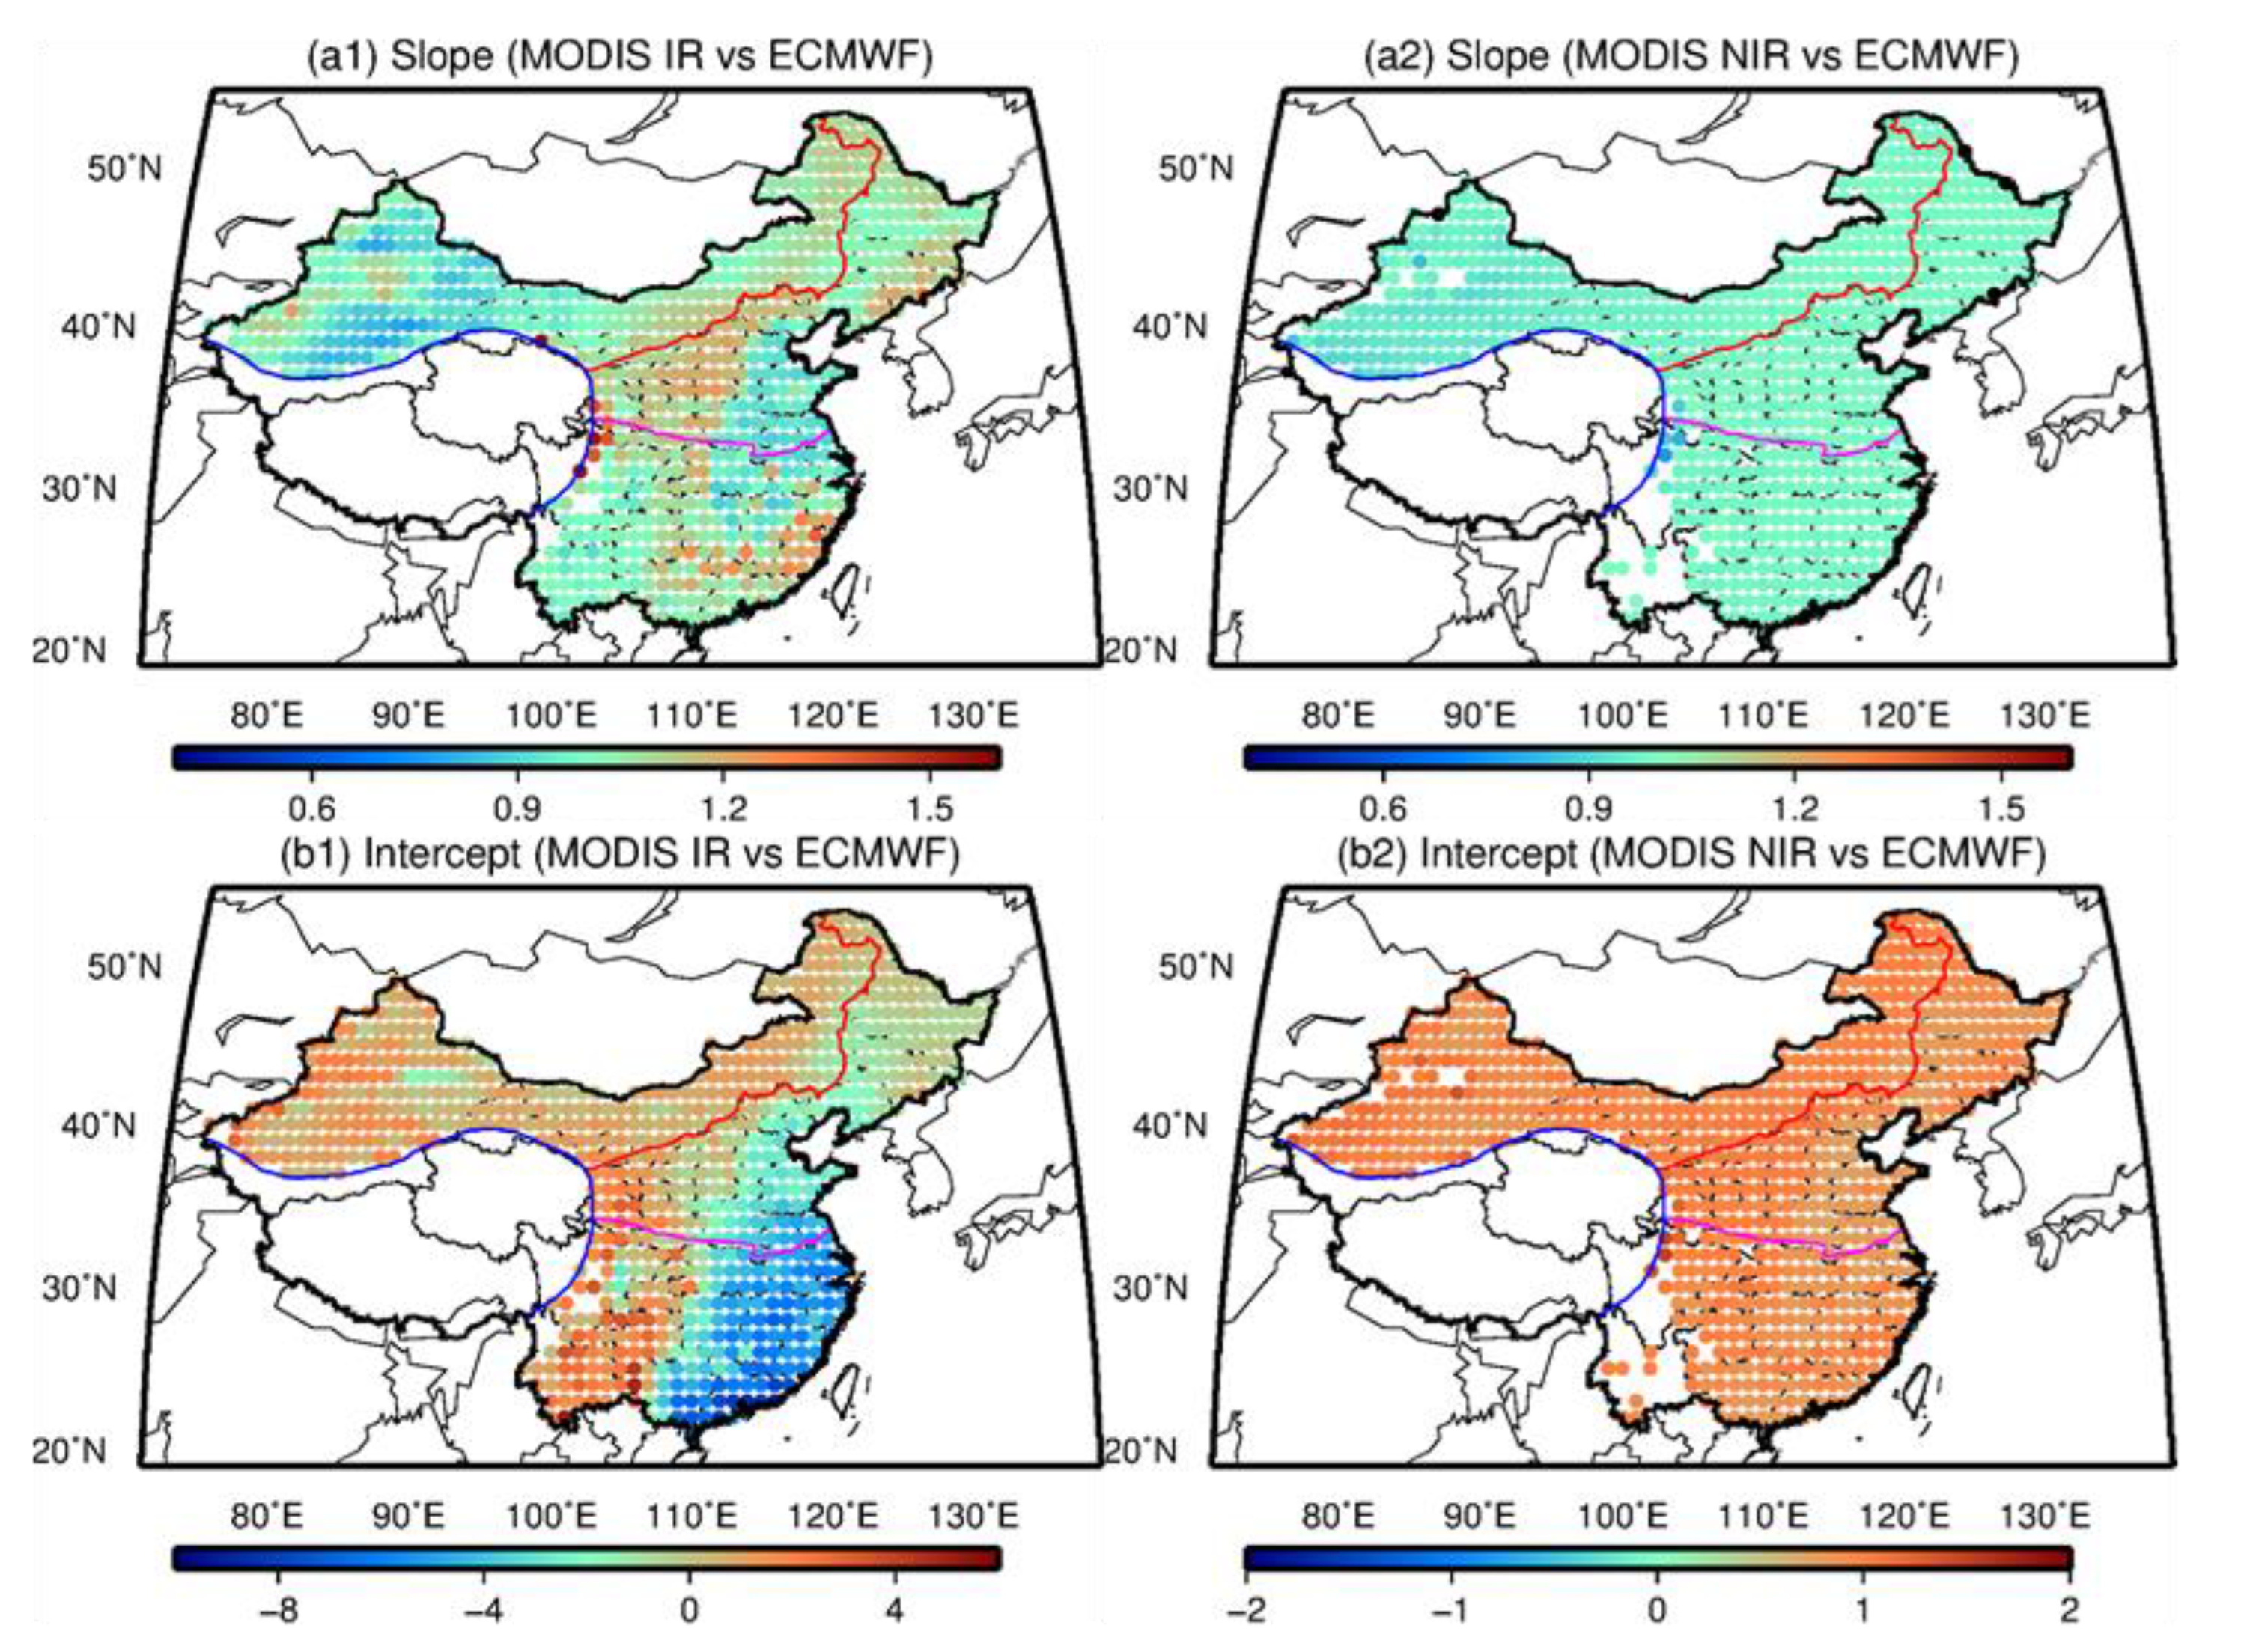
The accuracies of MODIS IR/NIR PWV are different when compared with GNSS, radiosonde, and ERA-Interim. Generally, the accuracies of MODIS IR and NIR PWV products are approximately 4.6–5.0 mm and 4.1–4.3 mm over Mainland China, respectively. In dry areas of NC and NWC, an RMSE value of 3.7–4.6 mm is obtained for MODIS PWV products. In humid SC areas, the RMSE value is from 4.8 mm to 5.8 mm and 4.6 mm to 5.2 mm for MODIS IR and NIR PWV products, respectively. The least RMSE is observed in the TP area with the largest value of approximately 3 mm for MODIS IR and NIR PWV products. However, the accuracy of MODIS PWV has been improved after the linear calibration, especially for the NIR PWV product with an improvement percentage of up to approximately 50%. The overall RMSE values of MODIS IR/NIR PWV have decreased to approximately 4 mm and 2 mm over Mainland China after calibration, respectively. The comprehensive comparison of MODIS PWV with multiple PWV data over Mainland China shows that (1) the PWV value retrieved from MODIS NIR has a better consistency with GNSS/radiosonde PWV than that from MODIS IR in China. This result indicates the MODIS NIR PWV is preferred for regional climate studies if available. (2) A large unanimously positive bias is observed for MODIS NIR PWV, and a linear fit model is effective to correct the quality of NIR PWV over Mainland China, except for the TP area with an average altitude exceeding 3 km. (3) The calibration coefficient of the linear fit model obtained using ERA-Interim can be interpolated into grid points of MODIS PWV products, which is critical to obtain the calibrated 5 × 5 km IR PWV product over Mainland China. This calibrated MODIS PWV with good quality is critical for Chinese studies, especially for regional climate change, weather, and other investigations over Mainland China.

Author Contributions

Conceptualization, Y.Z., H.Z. and J.L.; methodology, Y.Z. and G.X.; validation, Y.Z. and H.Z.; data curation, Y.Z., H.Z. and G.X.; funding acquisition, G.X.; writing—original draft preparation, Y.Z. and H.Z.; writing—review and editing, J.L., and G.X. All authors have read and agreed to the published version of the manuscript.

Funding

This research was funded by the State Key Laboratory of Geodesy and Earth’s Dynamics (Program No. SKLGED2022-3-3).

Institutional Review Board Statement

Not applicable.

Informed Consent Statement

Not applicable.

Data Availability Statement

ERA5 data are obtained from: https://www.ecmwf.int/en/forcasts/datasets/reanalysis-datasets/era5 (accessed on 3 January 2022).

Acknowledgments

The authors thank IGAR, ECMWF, and AREONET for providing the corresponding experimental data. June Wang and Weixing Zhang are also acknowledged for providing homogenized radiosonde and GNSS PWV data.

Conflicts of Interest

The authors declare no conflict of interest.

References

  1. Trenberth, K.E.; Fasullo, J.; Smith, L. Trends and variability in column-integrated atmospheric water vapor. Clim. Dyn. 2005, 24, 741–758. [Google Scholar] [CrossRef]
  2. Wagner, T.; Beirle, S.; Grzegorski, M.; Platt, U. Global trends (1996–2003) of total column precipitable water observed by global ozone monitoring experiment (gome) on ers-2 and their relation to near-surface temperature. J. Geophys. Res. Atmos. 2006, 111, 1–15. [Google Scholar] [CrossRef] [Green Version]
  3. Zhao, Q.; Liu, Y.; Yao, W.; Yao, Y. Hourly Rainfall Forecast Model Using Supervised Learning Algorithm. IEEE Trans. Geosci. Remote. Sens. 2022, 60, 4100509. [Google Scholar] [CrossRef]
  4. Raval, A.; Ramanathan, V. Observational determination of the greenhouse effect. Nature 1989, 342, 758–761. [Google Scholar] [CrossRef]
  5. Held, I.M.; Soden, B.J. Water vapor feedback and global warming. Annu. Rev. Energy Env. 2000, 25, 441–475. [Google Scholar] [CrossRef] [Green Version]
  6. Zhao, T.; Dai, A.; Wang, J. Trends in tropospheric humidity from 1970 to 2008 over china from a homogenized radiosonde dataset. J. Clim. 2012, 25, 4549–4567. [Google Scholar] [CrossRef] [Green Version]
  7. Li, Z.L.; Tang, B.H.; Wu, H.; Ren, H.; Yan, G.; Wan, Z.; Trigo, I.; Sobrino, J. Satellite-derived land surface temperature: Current status and perspectives. Remote Sens. Environ. 2013, 131, 14–37. [Google Scholar] [CrossRef] [Green Version]
  8. Wang, Y.; Yang, K.; Pan, Z.; Qin, J.; Chen, D.; Lin, C.; Chen, Y.; Tang, W.; Han, M.; Lu, N. Evaluation of precipitable water vapor from four satellite products and four reanalysis datasets against GPS measurements on the southern Tibetan plateau. J. Clim. 2017, 30, 5699–5713. [Google Scholar] [CrossRef]
  9. Lu, N.; Qin, J.; Yang, K.; Gao, Y.; Xu, X.; Koike, T. On the use of GPS measurements for moderate resolution imaging spectrometer precipitable water vapor evaluation over southern Tibet. J. Geophys. Res. Atmos. 2011, 116, 1–7. [Google Scholar] [CrossRef]
  10. King, M.D.; Kaufman, Y.J.; Menzel, W.P.; Tanre, D. Remote sensing of cloud, aerosol, and water vapor properties from the Moderate Resolution Imaging Spectrometer (MODIS). IEEE Trans. Geosci. Remote Sens. 1992, 30, 2–27. [Google Scholar] [CrossRef]
  11. Wong, M.S.; Jin, X.; Liu, Z.; Nichol, J.; Chan, P.W. Multi-sensors study of precipitable water vapour over mainland china. Int. J. Climatol. 2015, 35, 3146–3159. [Google Scholar] [CrossRef]
  12. Soden, B.J.; Lanzante, J.R. An assessment of satellite and radiosonde climatologies of upper-tropospheric water vapor. J. Clim. 1996, 9, 1235–1250. [Google Scholar] [CrossRef]
  13. Adeyemi, B.; Joerg, S. Analysis of water vapor over Nigeria using radiosonde and satellite data. J. Appl. Meteorol. Climatol. 2011, 51, 1855–1866. [Google Scholar] [CrossRef]
  14. Van Baelen, J.; Aubagnac, J.P.; Dabas, A. Comparison of near real time estimates of integrated water vapor derived with GPS, radiosondes, and microwave radiometer. J. Atmos. Ocean. Technol. 2005, 22, 201–210. [Google Scholar] [CrossRef]
  15. Bevis, M.; Businger, S.; Herring, T.A.; Rocken, C.; Anthes, R.A.; Ware, R.H. GPS meteorology: Remote sensing of atmospheric water vapor using the global positioning system. J. Geophys. Res. Atmos. 1992, 97, 15787–15801. [Google Scholar] [CrossRef]
  16. Li, Z.; Muller, J.P.; Cross, P. Comparison of precipitable water vapor derived from radiosonde, GPS, and moderate-resolution imaging spectroradiometer measurements. J. Geophys. Res. Atmos. 2003, 108, 1–10. [Google Scholar] [CrossRef]
  17. Bokoye, A.I.; Royer, A.; Cliche, P.; O’Neill, N. Calibration of sun radiometer based atmospheric water vapor retrievals using gps meteorology. J. Atmos. Ocean. Technol. 2007, 24, 064–979. [Google Scholar] [CrossRef]
  18. Zhao, Q.; Liu, Y.; Ma, X.; Yao, W.; Yao, Y.; Li, X. An improved rainfall forecasting model based on GNSS observations. IEEE Trans. Geosci. Remote. Sens. 2020, 58, 4891–4900. [Google Scholar] [CrossRef]
  19. Liu, Z.; Man, S.W.; Nichol, J.; Chan, P.W. A multi-sensor study of water vapour from radiosonde, MODIS and AERONET: A case study of Hong Kong. Int. J. Climatol. 2013, 33, 109–120. [Google Scholar] [CrossRef] [Green Version]
  20. Zhao, Q.; Yao, Y.; Yao, W. Studies of precipitable water vapour characteristics on a global scale. Int. J. Remote Sens. 2018, 40, 72–88. [Google Scholar] [CrossRef]
  21. Zhao, Q.; Yao, Y.; Yao, W. GPS-based PWV for precipitation forecasting and its application to a typhoon event. J. Atmos. Sol. Terr. Phys. 2018, 167, 124–133. [Google Scholar] [CrossRef]
  22. Pérez-Ramírez, D.; Whiteman, D.N.; Smirnov, A.; Lyamani, H.; Holben, B.N.; Pinker, R.; Andrade, M.; Alados-Arboledas, L. Evaluation of AERONET precipitable water vapor versus microwave radiometry, gps, and radiosondes at arm sites. J. Geophys. Res. Atmos. 2015, 119, 9596–9613. [Google Scholar] [CrossRef] [Green Version]
  23. Schmid, B.; Thorne, K.J.; Demoulin, P.; Peter, R.; Mätzler, C.; Sekler, J. Comparison of modeled and empirical approaches for retrieving columnar water vapor from solar transmittance measurements in the 0.94-μm region. J. Geophys. Res. Atmos. 1996, 101, 9345–9358. [Google Scholar] [CrossRef]
  24. Halthore, R.N.; Eck, T.F.; Holben, B.N.; Markham, B.L. Sun photometric measurements of atmospheric water vapor column abundance in the 940-nm band. J. Geophys. Res. Atmos. 1997, 102, 4343–4352. [Google Scholar] [CrossRef]
  25. Shi, F.; Xin, J.; Yang, L.; Cong, Z.; Liu, R.; Ma, Y.; Wang, Y.; Lu, X.; Zhao, L. The first validation of the precipitable water vapor of multi sensor satellites over the typical regions in china. Remote Sens. Environ. 2018, 206, 107–122. [Google Scholar] [CrossRef]
  26. Holben, B.N.; Eck, T.F.; Slutsker, I.; Tanré, D.; Buis, J.P.; Setzer, A.; Vermote, E.; Reagan, J.A.; Kaufman, Y.J.; Nakajima, T.; et al. AERONET—A federated instrument network and data archive for aerosol characterization. Remote Sens. Environ. 1998, 66, 1–16. [Google Scholar] [CrossRef]
  27. Bokoye, A.I.; Royer, A.; O’Neill, N.T.; Cliche, P.; McArthur, L.J.; Teillet, P.M.; Fedosejevs, G.; Thériault, J.M. Multi sensor analysis of integrated atmospheric water vapor over Canada and Alaska. J. Geophys. Res. Atmos. 2003, 108, 1–21. [Google Scholar] [CrossRef]
  28. Takahashi, A.; Hiyama, T.; Nishikawa, M.; Fujinami, H.; Higuchi, A.; Li, W.; Fukushima, Y. Diurnal variation of water vapor mixing between the atmospheric boundary layer and free atmosphere over Changwu, the Loess Plateau in China. Sola 2008, 4, 33–36. [Google Scholar] [CrossRef] [Green Version]
  29. Wang, K.L.; Hao, J.; Zhao, H.Y. Atmospheric water vapor transport from westerly and monsoon over the northwest China. Adv. Water Sci. 2005, 16, 432–438. [Google Scholar]
  30. Gao, B.C.; Kaufman, Y.J. Water vapor retrievals using moderate resolution imaging spectroradiometer (MODIS) near-infrared channels. J. Geophys. Res. Atmos. 2003, 108, 1–4. [Google Scholar] [CrossRef]
  31. Prasad, A.K.; Singh, R.P. Validation of MODIS Terra, AIRS, NECP/DOE AMIP-II reanalysis-2, and AERONET sun photometer derived integrated precipitable water vapor using ground-based GPS receivers over India. J. Geophys. Res. Atmos. 2009, 114, 1–20. [Google Scholar] [CrossRef]
  32. Liu, J.; Liang, H.; Sun, Z.; Zhou, X. Validation of the Moderate-Resolution Imaging Spectroradiometer precipitable water vapor product using measurements from GPS on the Tibetan Plateau. J. Geophys. Res. Atmos. 2006, 111, 1–5. [Google Scholar] [CrossRef]
  33. Liu, H.; Tang, S.; Zhang, S.; Hu, J. Evaluation of MODIS water vapour products over china using radiosonde data. Int. J. Remote Sens. 2015, 36, 680–690. [Google Scholar] [CrossRef]
  34. Li, X.; Zhang, L.; Cao, X.; Quan, J.; Wang, T.; Liang, J.; Shi, J. Retrieval of precipitable water vapor using MFRSR and comparison with other multi sensors over the semi-arid area of northwest china. Atmos. Res. 2016, 172–173, 83–94. [Google Scholar] [CrossRef]
  35. Gui, K.; Che, H.; Chen, Q.; Zeng, Z.; Liu, H.; Wang, Y.; Zheng, Y.; Sun, T.; Liao, T.; Wang, H.; et al. Evaluation of radiosonde, MODIS-NIR-Clear, and AERONET precipitable water vapor using IGS ground-based GPS measurements over China. Atmos. Res. 2017, 197, 461–473. [Google Scholar] [CrossRef]
  36. China Census Data. 2010; National Bureau of Statistics of China. Available online: http://www.stats.gov.cn/english/ (accessed on 31 August 2018).
  37. Zhang, W.; Lou, Y.; Haase, J.S.; Zhang, R.; Zheng, G.; Huang, J.; Shi, C.; Liu, J. The use of ground-based GPS precipitable water measurements over China to assess radiosonde and ERA-Interim moisture trends and errors from 1999 to 2015. J. Clim. 2017, 30, 7643–7667. [Google Scholar] [CrossRef]
  38. Shi, C.; Zhao, Q.; Geng, J.; Lou, Y.; Ge, M.; Liu, J. Recent development of PANDA software in GNSS data processing. In Proceedings of the International Conference on Earth Observation Data Processing and Analysis (ICEODPA), Wuhan, China, 28–30 December 2008; SPIE: Bellingham, WA, USA, 2008; Volume 7285, pp. 558–566. [Google Scholar]
  39. Zhao, Q.; Yao, Y.; Yao, W.; Zhang, S. GNSS-derived PWV and comparison with radiosonde and ECMWF ERA-Interim data over mainland China. J. Atmos. Sol. -Terr. Phys. 2018, 182, 85–92. [Google Scholar] [CrossRef]
  40. Wang, J.; Zhang, L.; Dai, A.; Immler, F.; Sommer, M.; Vömel, H. Radiation dry bias correction of Vaisala RS92 humidity data and its impacts on historical radiosonde data. J. Atmos. Ocean. Technol. 2013, 30, 197–214. [Google Scholar] [CrossRef]
  41. Dai, A.; Wang, J.; Thorne, P.; Parker, D.E.; Haimberger, L.; Wang, X.L. A New Approach to Homogenize Daily Radiosonde Humidity Data. J. Clim. 2011, 24, 965–991. [Google Scholar] [CrossRef]
  42. Zhao, Q.; Yao, Y.; Yao, W.Q.; Li, Z. Near-global GPS-derived PWV and its analysis in the El Niño event of 2014–2016. J. Atmos. Sol. -Terr. Phys. 2018, 179, 69–80. [Google Scholar] [CrossRef]
  43. Zhang, W.; Lou, Y.; Huang, J.; Zheng, F.; Cao, Y.; Liang, H.; Liu, J. Multiscale Variations of Precipitable Water over China Based on 1999–2015 Ground-Based GPS Observations and Evaluations of Reanalysis Products. J. Clim. 2018, 31, 945–962. [Google Scholar] [CrossRef]
  44. King, M.D.; Menzel, W.P.; Kaufman, Y.J.; Tanre, D. Cloud and aerosol properties, precipitable water, and profiles of temperature and water vapor from MODIS. IEEE Trans. Geosci. Remote Sens. 2003, 41, 442–458. [Google Scholar] [CrossRef] [Green Version]
  45. Koo, M.S.; Hong, S.Y. Diurnal variations of simulated precipitation over East Asia in two regional climate models. J. Geophys. Res. Atmos. 2010, 115, 1–17. [Google Scholar] [CrossRef]
  46. Li, Z.; Muller, J.P.; Cross, P.; Fielding, E.J. Interferometric synthetic aperture radar (InSAR) atmospheric correction: GPS, Moderate Resolution Imaging Spectroradiometer (MODIS), and InSAR integration. J. Geophys. Res. Solid Earth 2005, 110. [Google Scholar] [CrossRef]
  47. Dousa, J.; Bennitt, G.V. Estimation and evaluation of hourly updated global GPS Zenith Total Delays over ten months. GPS Solut. 2013, 17, 453–464. [Google Scholar] [CrossRef]
  48. Mattioli, V.; Westwater, E.R.; Cimini, D.; Liljegren, J.C.; Lesht, B.; Gutman, S.I.; Schmidlin, F.J. Analysis of radiosonde and ground-based remotely sensed PWV data from the 2004 North Slope of Alaska Arctic Winter Radiometric Experiment. J. Atmos. Ocean. Technol. 2007, 24, 415–431. [Google Scholar] [CrossRef]
  49. Chrysoulakis, N.; Kamarianakis, Y.; Xu, L.; Mitraka, Z.; Ding, J. Combined use of MODIS, AVHRR and radiosonde data for the estimation of spatiotemporal distribution of precipitable water. J. Geophys. Res. Atmos. 2008, 113, 1–18. [Google Scholar] [CrossRef] [Green Version]
  50. Senkal, O.; Yıldız, B.Y.; Şahin, M.; Pestemalcı, V. Precipitable water modelling using artificial neural network in Çukurova region. Environ. Monit. Assess. 2012, 184, 141–147. [Google Scholar] [CrossRef]
  51. Zhai, P.; Eskridge, R.E. Atmospheric water vapor over china. J. Clim. 1997, 10, 2643–2652. [Google Scholar] [CrossRef]
  52. Wang, H.; Chen, H. Climate control for southeastern china moisture and precipitation: Indian or east Asian monsoon. J. Geophys. Res. Atmos. 2012, 117, 1–9. [Google Scholar] [CrossRef]
  53. Klos, A.; Hunegnaw, A.; Teferle, F.N.; Abraha, K.E.; Ahmed, F.; Bogusz, J. Statistical significance of trends in Zenith Wet Delay from re-processed GPS solutions. GPS Solut. 2018, 22, 1–12. [Google Scholar] [CrossRef]
  54. Alshawaf, F.; Zus, F.; Balidakis, K.; Deng, Z.; Hoseini, M.; Dick, G.; Wickert, J. On the statistical significance of climatic trends estimated from GPS tropospheric time series. J. Geophys. Res. Atmos. 2018, 123, 10967–10990. [Google Scholar] [CrossRef]
Figure 1. Distributions of AERONET, Crustal Movement Observation Network of China (CMONOC), and radiosonde stations used. The blue, magenta, and red lines denote the boundaries of the four geographical areas.
Atmosphere 13 01763 g001
Figure 2. Scatterplots of the radiosonde-derived versus MODIS-derived IR/NIR PWV values over the period of 2000–2010 in the four areas in China, where (a1a4) are the comparison of MODIS IR and radiosonde PWV, and (b1b4) are the comparison of MODIS NIR and radiosonde PWV.
Atmosphere 13 01763 g002
Figure 3. Scatterplots of the AERONET-derived versus MODIS-derived IR/NIR PWV values over the period of 2000–2010 in the four areas in China, where (a1b4) are the comparison of MODIS IR and AERONET PWV, and (c1d4) are the comparison of MODIS NIR and AERONET PWV.
Atmosphere 13 01763 g003
Figure 4. Scatterplots of GNSS-derived versus MODIS-derived IR/NIR PWV values over the period of 2000–2015 in the four areas in China, where (a1b4) are the comparison of MODIS IR and GNSS PWV, and (c1d4) are the comparison of MODIS NIR and GNSS PWV.
Atmosphere 13 01763 g004
Figure 5. Scatterplots of the MODIS-derived IR/NIR PWV values with and without calibration over the period of 2011–2017 in the four areas in China, where (a1b4, c1c4) are the comparison of MODIS IR/NIR and GNSS PWV, and (b1b4,d1d4) are the comparison of calibrated MODIS IR/NIR and GNSS PWV.
Atmosphere 13 01763 g005
Figure 6. Scatterplots of the MODIS-derived IR PWV values with and without calibration over the period of 2011–2017 in the four areas in China, where (a1b4, c1c4) are the comparison of Aqua/Terra IR and GNSS PWV, and (b1b4,d1d4) are the comparison of calibrated Aqua/Terra IR and GNSS PWV.
Atmosphere 13 01763 g006
Figure 7. Scatterplots of the MODIS-derived NIR PWV values with and without calibration over the period 2011–2017 in the four areas in China, where (a1b4, c1c4) are the comparison of Aqua/Terra NIR and GNSS PWV, and (b1b4, d1d4) are the comparison of calibrated Aqua/Terra NIR and GNSS PWV.
Atmosphere 13 01763 g007
Figure 8. RMSE distribution of paired stations between MODIS and GNSS over the period of 2011–2017, where the first row (a1,a2) is the RMSE of MODIS IR/NIR PWV without calibration, and the second row (b1,b2) is the values with calibration using GNSS PWV.
Atmosphere 13 01763 g008
Figure 9. Bias distribution of paired stations between MODIS and GNSS over the period of 2011–2017, where the first row (a1,a2) represents the Bias of MODIS IR/NIR PWV without calibration and the second row (b1,b2) denotes the values with calibration using GNSS PWV.
Atmosphere 13 01763 g009
Figure 10. RMSE distribution of paired stations between MODIS and ERA-Interim over the period 2011–2017, where the first row (a1,a2) is the bias of MODIS IR/NIR PWV without calibration, and the second row (b1,b2) is the values with calibration using ERA-Interim PWV.
Atmosphere 13 01763 g010
Figure 11. Bias distribution of paired stations between MODIS and ERA-Interim over the period 2011–2017, where the first row (a1,a2) is the bias of MODIS IR/NIR PWV without calibration, and the second row (b1,b2) is the values with calibration using ERA-Interim PWV.
Atmosphere 13 01763 g011
Figure 12. Distributions of slope and intercept of the linear model established to calibrate the MODIS PWV products using ECMWF ERA-Interim PWV data, where the first row (a1,a2) is the distribution of slope, and the second row (b1,b2) refers to the distribution of intercept.
Atmosphere 13 01763 g012
Figure 13. Seasonal variation of PWV derived from MODIS IR/NIR and GNSS PWV over the period of 2011–2017 in the four areas in China, where (ad) are NC, SC, NWC and TP of China.
Atmosphere 13 01763 g013
Figure 14. Distributions of PWV time series in the four areas of Mainland China over the period of 2000–2008, where (ad) are NC, SC, NWC and TP of China.
Atmosphere 13 01763 g014
Table 1. Characteristics of datasets used in this study.
NameTime SpanSelected PointsTemporal ResolutionSpatial CoverageWeather Limitation
Radiosonde 2000–201011000:00 UTC and 12:00 UTCGlobal Land stationsNo
[3]2011–20178400:00 UTC and 12:00 UTCGlobal Land stationsNo
Radiosonde 1999–2015259Every 6 h, all dayChina Land stationsNo
(IGRA Ver. 2)2011–2017249Every 1 h, all dayChina Land stationsNo
CMONOC 2000–2017815 min during daytimeGlobal Land stationsClear sky and rain-free
[37]2011–2017964Every 6 h, all day0.125°No
CMONOC2000–2017-Every day and night5 kmClear sky only
[39]2000–2017-Every day1 kmClear sky only
Table 2. Geographic information of the AERONET stations used.
StationLatitude (deg.)Longitude (deg.)Height (m)
Beijing (BJ)39.977116.38192.0
Xianghe (XH)39.754116.96236.0
Hongkong (HK)22.303114.18030.0
Taihu (TH)31.421120.21520.0
Sacol (SA)35.946104.1371965.8
Xinglong (XL)40.396117.578899.0
Nam (NA)30.77390.9624746.0
Qoms (QO)28.36586.9484276.0
Table 3. Statistical result of PWV differences between MODIS IR/NIR and radiosonde PWV (unit: mm).
MODISAreaRMSEBias
IR PWVNC4.560.50
SC7.00−0.13
NWC4.801.39
TP2.54−0.53
Mean5.160.551
NIR PWVNC3.861.56
SC5.843.31
NWC4.823.14
TP2.601.26
Mean4.602.33
Table 4. RMSE and bias of eight paired stations between AERONET- and MODIS-derived IR/NIR PWV over the period of 2000–2017.
StationMODIS IRMODIS NIR
RMSEBiasRMSEBias
Beijing (BJ)3.382.283.182.17
Xianghe (XH)3.682.702.731.84
Hongkong (HK)9.246.254.192.42
Taihu (TH)5.973.686.194.45
Sacol (SA)5.033.325.684.86
Xinglong (XL)4.363.831.981.17
Nam (NA)1.710.354.033.16
Qoms (QO)0.92−0.614.123.18
Table 5. Comparison results between Aqua/Terra MODIS PWV products and GNSS PWV [39] in the four areas over Mainland China during the period of 2000–2015 (unit: mm).
MODISAreaRMSEBiasMODISAreaRMSEBias
Aqua-IRNC4.091.31Aqua-NIRNC3.212.27
SC5.510.77SC4.233.10
NWC3.541.48NWC3.372.75
TP2.620.08TP2.862.16
Mean4.391.07Mean3.582.64
Terra-IRNC2.62−0.09Terra-NIRNC3.713.01
SC3.12−0.51SC3.092.14
NWC2.910.42NWC3.913.26
TP1.86−0.11TP3.212.51
Mean2.630.18Mean3.612.91
Table 6. Statistical result of MODIS PWV with and without calibration over the period of 2011–2017 in the four areas of China (unit: mm).
MODISAreaRMSERMSE (Cal.)BiasBias (Cal.)
IR PWVNC4.474.700.320.38
SC6.486.58−0.850.41
NWC3.883.300.560.04
TP2.202.10−0.91−0.03
Mean4.594.480.040.20
NIR PWV NC4.262.812..38−0.10
SC5.873.463.88−0.14
NWC4.412.293.01−0.17
TP2.551.501.60−0.08
Mean4.592.702.87−0.13
Table 7. Statistical result of RMSE and bias derived from MODIS IR/NIR PWV products with and without calibration using GNSS PWV derived from [39], where Per. refers to the improved percentage of RMSE after calibration.
MODISAreaRMSRMS (Cal.)Per.BiasBias (Cal.)
Aqua-IRNC4.504.157.78 1.040.10
SC5.805.515.00 0.410.24
NWC4.403.5319.77 1.290.02
TP2.922.862.05 −0.840.19
mean4.624.189.52 0.660.10
Terra-IRNC3.683.514.62 −0.190.14
SC4.784.525.44 −1.000.22
NWC3.733.1116.62 0.510.04
TP2.482.2011.29 −0.830.03
mean3.813.488.66 −0.260.11
MODIS IRNC4.133.973.87 0.390.12
SC5.455.263.49 −0.500.21
NWC4.083.3617.65 0.900.03
TP2.722.546.62 −0.860.09
mean4.293.977.46 0.130.10
Aqua-NIRNC3.651.7252.88 2.090.02
SC4.612.1254.01 3.01−0.10
NWC4.531.9457.17 3.41−0.15
TP3.122.907.05 1.660.20
mean4.072.1746.68 2.60−0.02
Terra-NIRNC3.821.6357.33 2.010.14
SC5.211.9562.57 3.490.03
NWC4.571.8359.96 3.44−0.14
TP3.132.4123.00 1.360.12
mean4.251.9653.88 2.590.01
MODIS NIRNC3.731.6954.69 2.040.07
SC4.902.0957.35 3.20−0.06
NWC4.561.8958.55 3.45−0.15
TP3.082.5616.88 1.490.14
mean4.152.0550.60 2.58−0.01
Table 8. Statistical results of MODIS IR/NIR PWV products with and without calibration for 964 grid points over the period 2011–2017.
MODISAreaRMSRMS (Cal.)BiasBias (Cal.)R2R2 (Cal.)
IR PWVNC4.143.570.27−0.010.92500.9453
SC7.656.442.040.190.89500.9239
NWC3.843.49−0.510.010.89990.9142
TP4.383.68−3.42−0.290.81950.7911
mean4.593.97−0.51−0.030.92400.9378
NIR PWV NC3.471.691.03−0.010.96630.9858
SC5.852.732.92−0.070.96190.9827
NWC2.842.140.77−0.020.94720.9626
TP3.934.14−2.571.120.82810.8163
mean3.582.820.110.280.94890.9557
Table 9. Estimated parameters of linear PWV model using radiosonde and MODIS PWV time series over the period of 2000–2008.
ParameterAreaRadiosonde PWVMODIS (Uncal.)MODIS (Cal.)
Average PWV value (mm)NC12.4012.3213.03
SC23.7624.0124.97
NWC7.969.578.17
TP6.196.266.65
Trend (mm/year)NC0.03 ± 0.03 (△)−0.03 ± 0.03 (△)−0.05 ± 0.04 (△)
SC0.17 ± 0.05 (▲)0.03 ± 0.05 (△)0.04 ± 0.06 (△)
NWC0.01 ± 0.02 (△)0.01 ± 0.02 (△)−0.06 ± 0.02 (▲)
TP0.03 ± 0.02 (△)−0.02 ± 0.02 (△)−0.03 ± 0.03 (△)
Annual amplitude (mm)NC12.4912.6213.82
SC15.8816.9218.72
NWC6.859.078.63
TP5.375.505.84
Semi-annual amplitude (mm)NC4.474.344.73
SC2.893.083.62
NWC2.462.902.78
TP1.341.611.56
Seasonal amplitude (mm)NC1.861.972.22
SC0.370.270.33
NWC0.921.151.10
TP0.080.240.07
▲ and △ refer to the trend component that pass or do not pass the 95% significance test, respectively.
Publisher’s Note: MDPI stays neutral with regard to jurisdictional claims in published maps and institutional affiliations.

