Communication

An Empirical Equation for Wet-Bulb Temperature Using Air Temperature and Relative Humidity

1
Africa Industrial Research Center, National Chung Hsing University, Taichung 40227, Taiwan
2
Department of Bio-Industrial Mechatronics Engineering, National Chung Hsing University, Taichung 40227, Taiwan
*
Author to whom correspondence should be addressed.
Atmosphere 2022, 13(11), 1765; https://doi.org/10.3390/atmos13111765
Submission received: 22 September 2022 / Revised: 16 October 2022 / Accepted: 24 October 2022 / Published: 26 October 2022
(This article belongs to the Topic Climate Change, Air Pollution, and Human Health)

Abstract

:
Climate change causes extreme heat and high humidity in some regions. The wet-bulb temperature (Tw) is a heat stress index, and the threshold is 35 °C. It is difficult to measure the value of Tw using a psychrometer, but the Tw value can be calculated using the air temperature and humidity. To provide accuracy for the Tw calculation, an empirical equation is established using regression analysis. This study defines the empirical equation as Tw = 4.391976 + 0.0198197 RH + 0.526359 Td + 0.00730271 RH · Td + 2.4315 × 10 4 RH 2 2.58101 × 10 5 Td · RH 2 , where Td is the air temperature in °C and RH is the relative humidity in %. This equation applies to a temperature of 20~45 °C and RH of 40~99%. The fit is better than that for the Stull equation in this range. The prediction accuracy is 0.022 °C and there is no fixed pattern for the error distribution for the range of Td and RH. The measurement uncertainty for Tw values for thermometer and humidity sensors that are not calibrated is 1.4~2.2%. If these sensors are calibrated, the measurement uncertainty for Tw values is 0.16~0.28 °C. Therefore, well-calibrated sensors are necessary to enhance the accuracy of the Tw predictive equation.

1. Introduction

Thermal comfort and heat stress indices are important environmental indicators. Farmers, workers, and soldiers are often exposed to high temperatures, humidity, and solar radiation, so a threshold to ensure the safety of human beings must be established.
In an environment with high temperature and low humidity, the human body cools itself by evaporating sweat. However, evaporation is inhibited and less heat is removed in conditions of high temperature and humidity and cooling is difficult [1,2]. In an extreme climate, the wet-bulb temperature is an index of dangerous levels for human beings. The wet-bulb temperature (Tw) is affected by air temperature and humidity, and could be used to determine the human body’s ability to cool itself [3] so an accurate Tw value is important.
The comfort zone in a room environment is defined by ASHRAE(American Society of Heating, Refrigerating, and Air-Condition Engineers) [4]. In the psychrometric chart, if the temperature is greater than 25 °C and the relative humidity is greater than 50%, the zone is classified as a hot and humid zone. Forty indices were reviewed by Epstein and Moran [5]. The first index is the wet-bulb temperature. In 1905, Haldane [6] noted that the wet-bulb temperature is the most appropriate criterion to define heat stress. Epstein and Moran [5] evaluated two indices: the wet-bulb globe temperature (WBGT) and the discomfort index (DI). The results of this study showed that DI is a universal index for heat stress.
Abdel-Ghany et al. [7,8] evaluated the temperature-humidity index (THI), the wet-bulb globe temperature (WBGT), the physiological effective temperature (PET), and the universal thermal climatic index (UTCI) as thermal comfort indices for an outdoor urban arid environment and concluded that the PET and UTCI scales can be used for an arid environment. Abdel-Ghany et al. [9] compared heat stress indices in summer for an arid environment and found that the stand-effective temperature (SET) is a better index than the THI, PET, or UTCI indices.
Anuja and Priya [10] proposed six thermal contort indices: THI, the Heat index (HI), the heat transfer coefficient (HTC), the tropical summer index (TSI), the apparent temperature (AT), and the WBGT. Ali and Patnaik [11] showed that the PET value is higher than 30 °C during the afternoon hours and used the PET value as the best index for a tropical city. Aghamohammadi et al. [12] used the PET value as the thermal comfort index for a tropical city and proposed an acceptable range of 25.9–32.3 °C.
In terms of passive cooling and human comfort, Fairvey [13] noted that evaporative cooling is the most important mechanism for cooling body temperature. If the dry-bulb air temperature is less than the skin temperature and the air humidity is low, evaporation increases the dissipation of heat but this evaporative cooling of the air is not significant in warm and highly humid climates. The WBGT index considers the effect of the dry-bulb temperature, the wet-bulb temperature, air velocity, and solar radiation [14]. However, this index responds poorly to air humidity and movement and stress due to restricted evaporation is underestimated [14]. Heat stress for human beings due to high temperature and humidity must be considered.
Climate change has increased the temperature of the earth. A climate with high temperature and humidity is common in regions of South Asia and the Middle East. The wet-bulb temperature is the subject of many studies. If the ambient temperature is near or greater than the body temperature, evaporative cooling is the only method to reduce body temperature. However, if the relative humidity reaches saturation, evaporative cooling is inhibited and the wet-bulb temperature is close to the dry-bulb temperature. Sherwood and Huber [15] proposed the threshold of the wet-bulb temperature. If the wet-bulb temperature exceeds 35 °C for extended periods, the dissipation of heat from the human body is inhibited. A long period during which Tw > 35 °C is unsafe for humans [15]. Pal and Eltahir [16] used a regional climate model to simulate the extremes of Tw in the Arabian Gulf region and found specific regional hotspots where the threshold of 35 °C is exceeded. The value of Tw depends on temperature and humidity so Raymond et al. [17] used Tw as a proxy for the effect of heat on health and economic activity and found that the value of Tw is extremely high in the later- summer in the southern Great Plains and Southwest USA. Sherwood [15] studied Tw and WBGT and found that WBGT instruments are extremely rare. The Tw value depends on the thermodynamic principle that controls heat flux into or out of a wet object.
The Tw value is more sensitive to humidity than the WGBT. The threshold for Tw is 35 °C but there is no safety threshold for the WGBT. Raymond et al. [18] used a value of 35 °C for Tw and sea surface temperature to observe Tw projections and established the figure for the observed global extreme humid heat map. Zhang et al. [19] used the extreme wet-bulb temperature as an integrated temperature-humidity metric for the effect of heat waves due to the change.
The maximum wet-bulb and dry-bulb temperatures in climate models were established. Vecellio et al. [20] calculated an adaptability threshold of 35 °C Tw for young and healthy subjects and a TW value < 35 °C is necessary to eliminate heat stress in high humidity for young and healthy adults. Vecellio et al. [21] studied the indices to define heat stress, including Tw, HI, WBGT, and UTCI, and noted that a value of 35 °C for the Tw threshold requires further validation. However, this study found that the Tw value is the most important heat stress index.
Recently, the Tw index has been quoted by media sources. Anders [22] reported the importance of Tw and determined the effect of heat waves on hot and humid weather. Reiners [23] noted that if Tw > 35 °C, some humans may die within a few hours. Sharing [24] described the effect of the Tw on the evaporation of sweat and showed that a threshold of 35 °C for Tw represents the limit of human durability.
More reports have appeared in mainstream media [25,26,27]. The wet-bulb temperature can be used to express the ability of the human skin to evaporate. It reflects the temperature and humidity at which the human body can cool. If the air surrounding the human body becomes hotter and more humid, the body is less able to cool itself. Many thermal comfort indices have been proposed. The wet-bulb temperature is the best way to evaluate the effect on human health of climate change, which induces a rise in temperature and humidity, especially during heat waves [25,28,29].
The WBGT index considers the effect of temperature, humidity air movement, and solar radiation. The most serious limitation is the lack of a threshold so there is no indicator of significant stress in high humidity conditions [14,30,31] The wet-bulb temperature is more useful in the extremely dangerous situation of higher temperature and humidity, but Tw is difficult to measure accurately.
The Tw temperature can be measured directly or indirectly. The direct method uses a psychrometer. This measurement uses the thermodynamic principle. When water covers the bulb of the thermometer, the water evaporates, removing the latent heat from the bulb surface. The thermometer reading at the thermodynamic balance is called the wet-bulb temperature [32].
A psychrometer has two thermometers of the same specification. One measures the actual air temperature or the dry-bulb temperature and the other that is covered with water measures the wet-bulb temperature. To ensure evaporation, the wet-bulb thermometer is enclosed by a wick to maintain a wetted condition using pure, distilled water [32]. The required air velocity over thermometers is >3.3 m/s [33]. The device is cheap and simple.
The limitations of this device include the susceptibility to contamination or an improper setting for the wet bulb, an insufficient water supply, and the requirement for maintenance. The response to heat balance is sluggish so the device does not allow remote measurements and is not easy to be used in a weather station or a remote area [32].
Humidity is measured accurately using capacitive or resistive sensing elements [32,34]. In the past, the relative humidity of air was calculated using the dry-bulb and wet-bulb temperatures. The wet-bulb temperature is also calculated using the dry-bulb and the relative humidity is measured using a thermometer and an electric humidity sensor [35]. The Tw is calculated using Td and RH values and the psychrometric principle, but the calculation is complex and time-consuming. Stull [35] proposed an empirical equation using gene-expression programming. The Stull equation is:
Tw = Td * tan 1 [ 0.151977 ( RH + 8.313659 ) 0.5 ]   +   tan 1 ( Td   +   RH )     tan 1 ( RH 1.676331 )   +   0.00391838 ( RH ) 1.5 tan 1 ( 0.023101 RH ) 4.686035
where Tw and Td are in °C and RH is in %.
The equation is valid for RH values between 5% and 95% and Td values between −20 °C and 50 °C. This empirical equation includes an arctangent function and a power function so the calculation for Tw is complex. The calculated errors in Tw range from −1 °C to 0.65 °C. The measurement uncertainty for this empirical equation has not been reported.
Now, Tw is used to express the durability of human beings in high temperature and humidity conditions. Weather stations usually measure Tb and RH values. This study proposes empirical Tw equations for higher humidity. The uncertainty in Tw values is also determined.

2. Methodology

This standard Tw values in the range of temperature in 20~45 °C and RH in 40~99% are calculated using a psychrometric software program developed by thermodynamics. The Td are 20, 24, 28, 32, 34, 36, 38, 40, 42, 43, 44, and 45 °C. At each dry-bulb temperature, twenty-three RH values are used to calculate the Tw values. The total data sets include 276 data used to establish the Tw empirical equation. Then Tw is served as the dependent value and Td and RH are served as independent values. The relationship between Tw and Td, RH is established. The standard error for the regression is used as the criterion to evaluate adequate regression equations. To compare the predictive performance of the equations developed in this study and the Stull equation, the comparison criteria are the maximum error, the minimum error, the average sum of absolute errors, and the standard deviation for errors. The uncertainty of Tw values by using these empirical equations is determined.

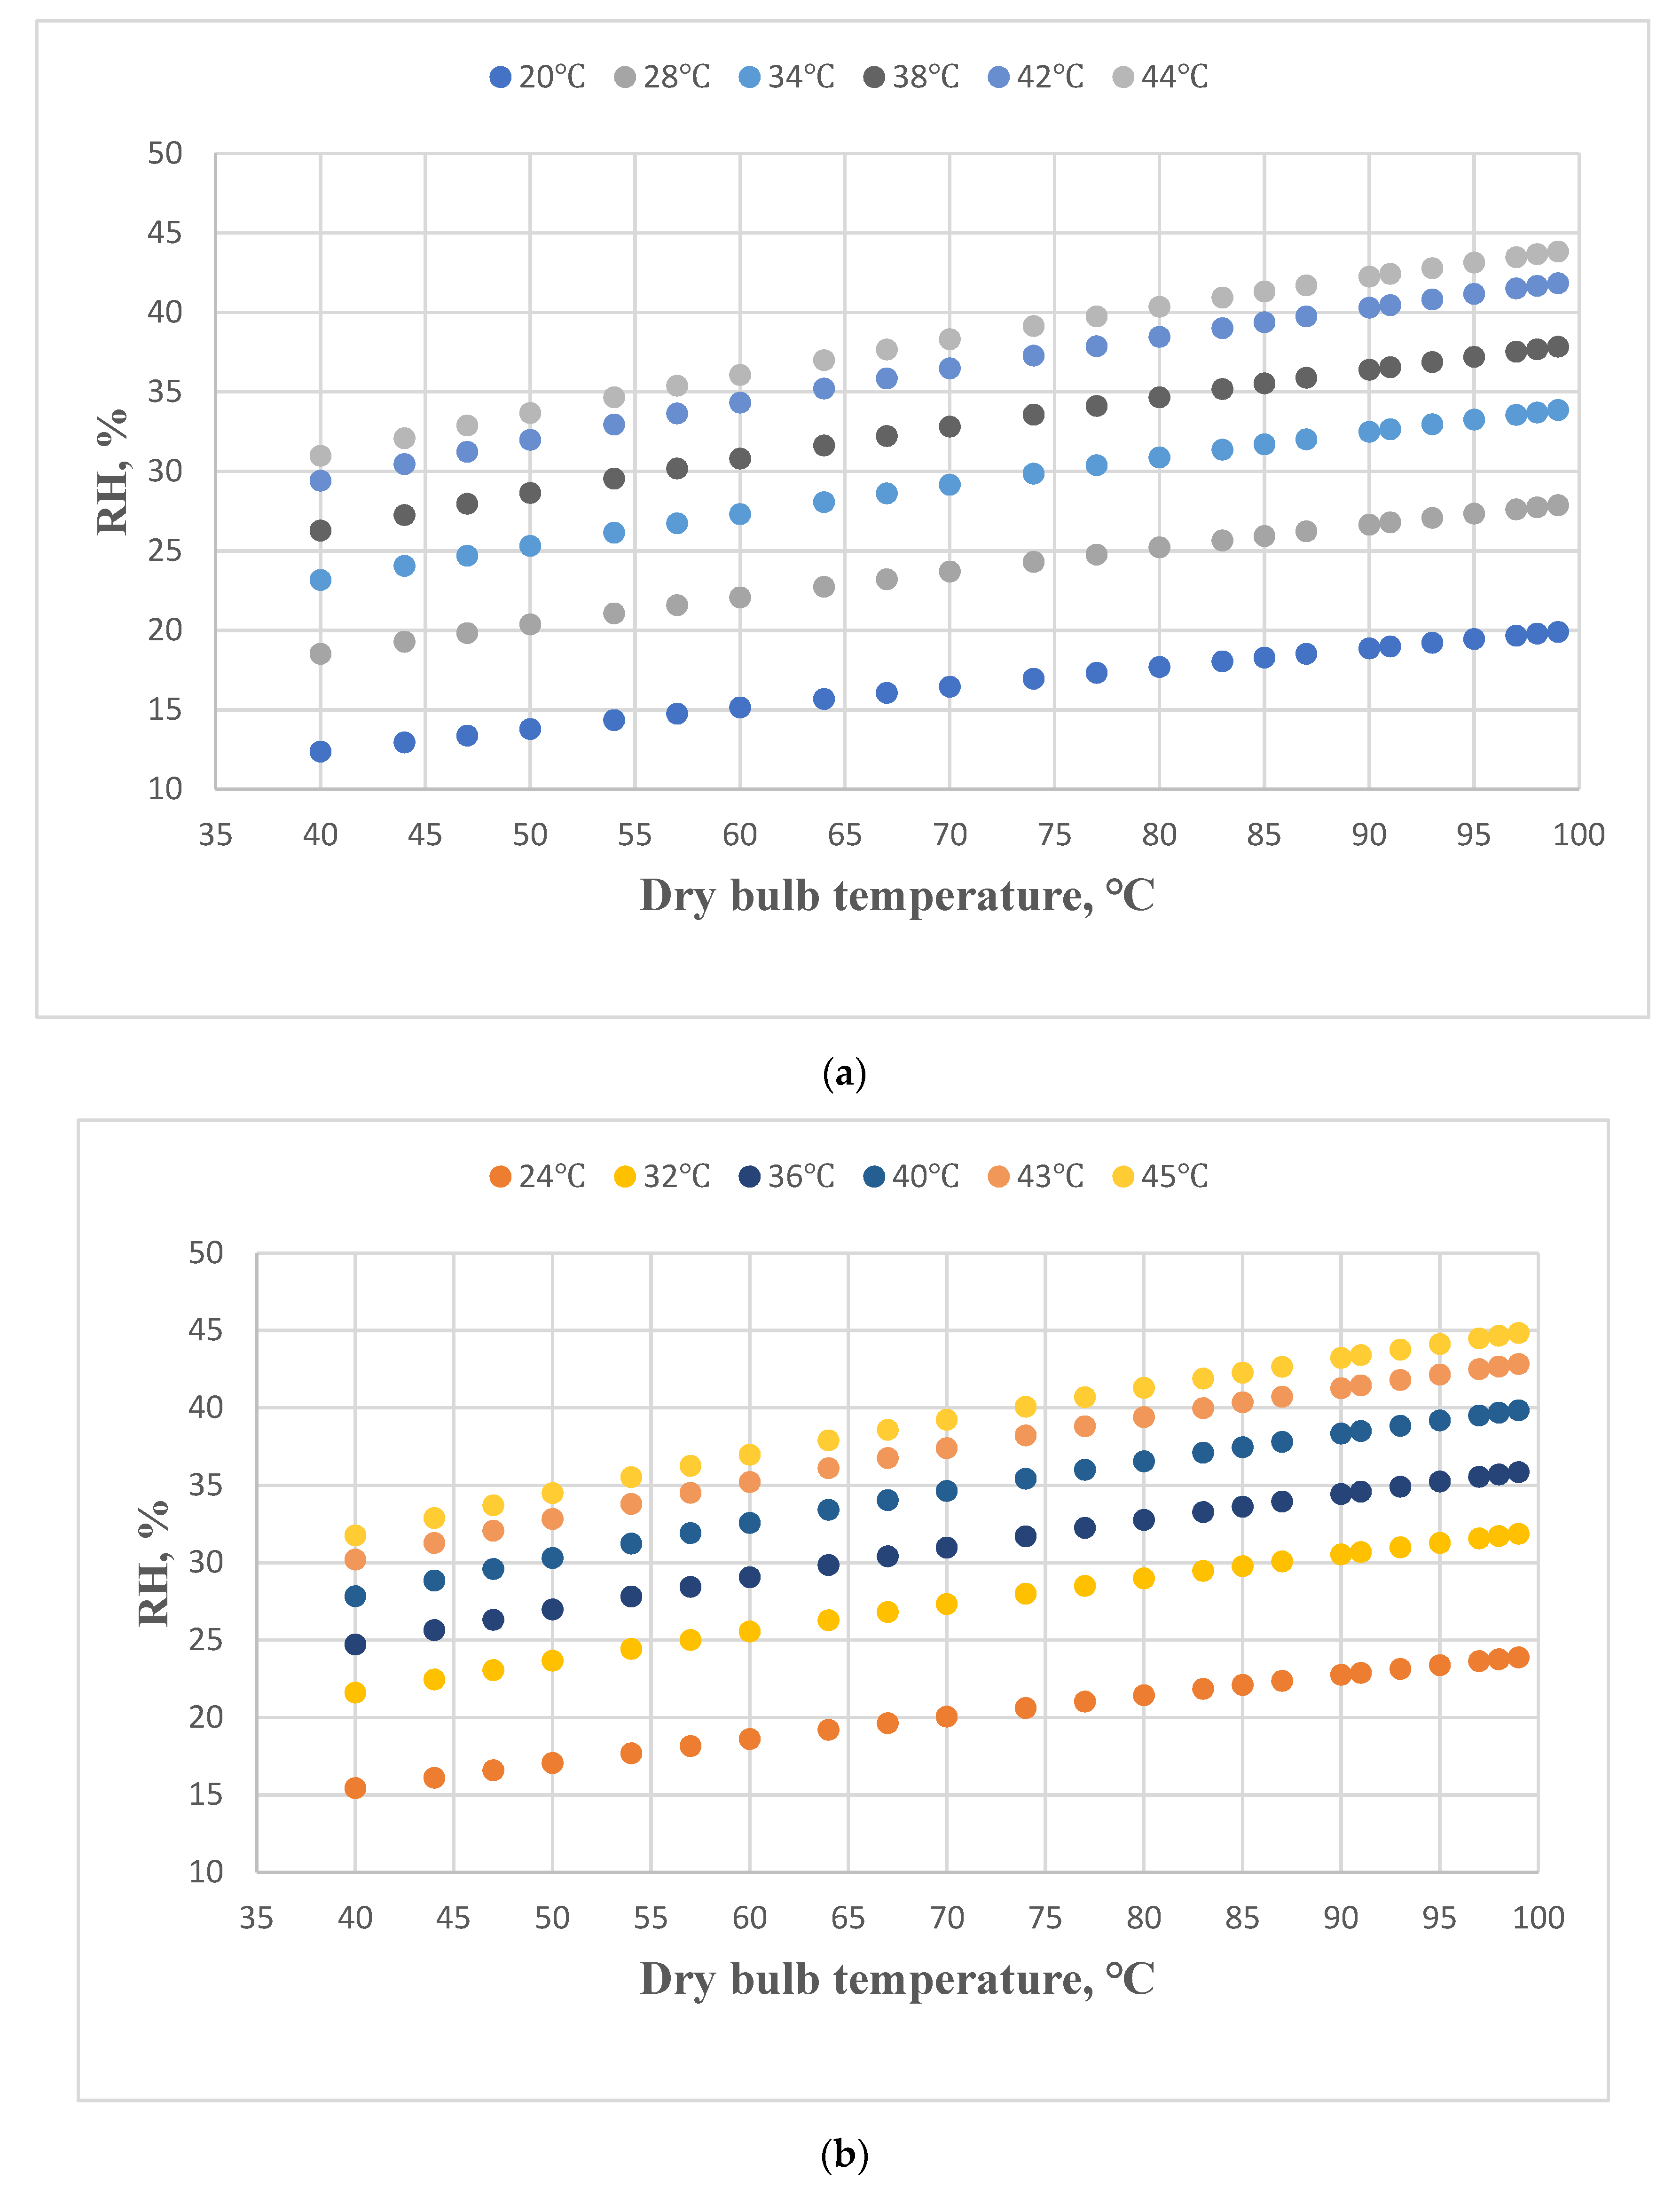
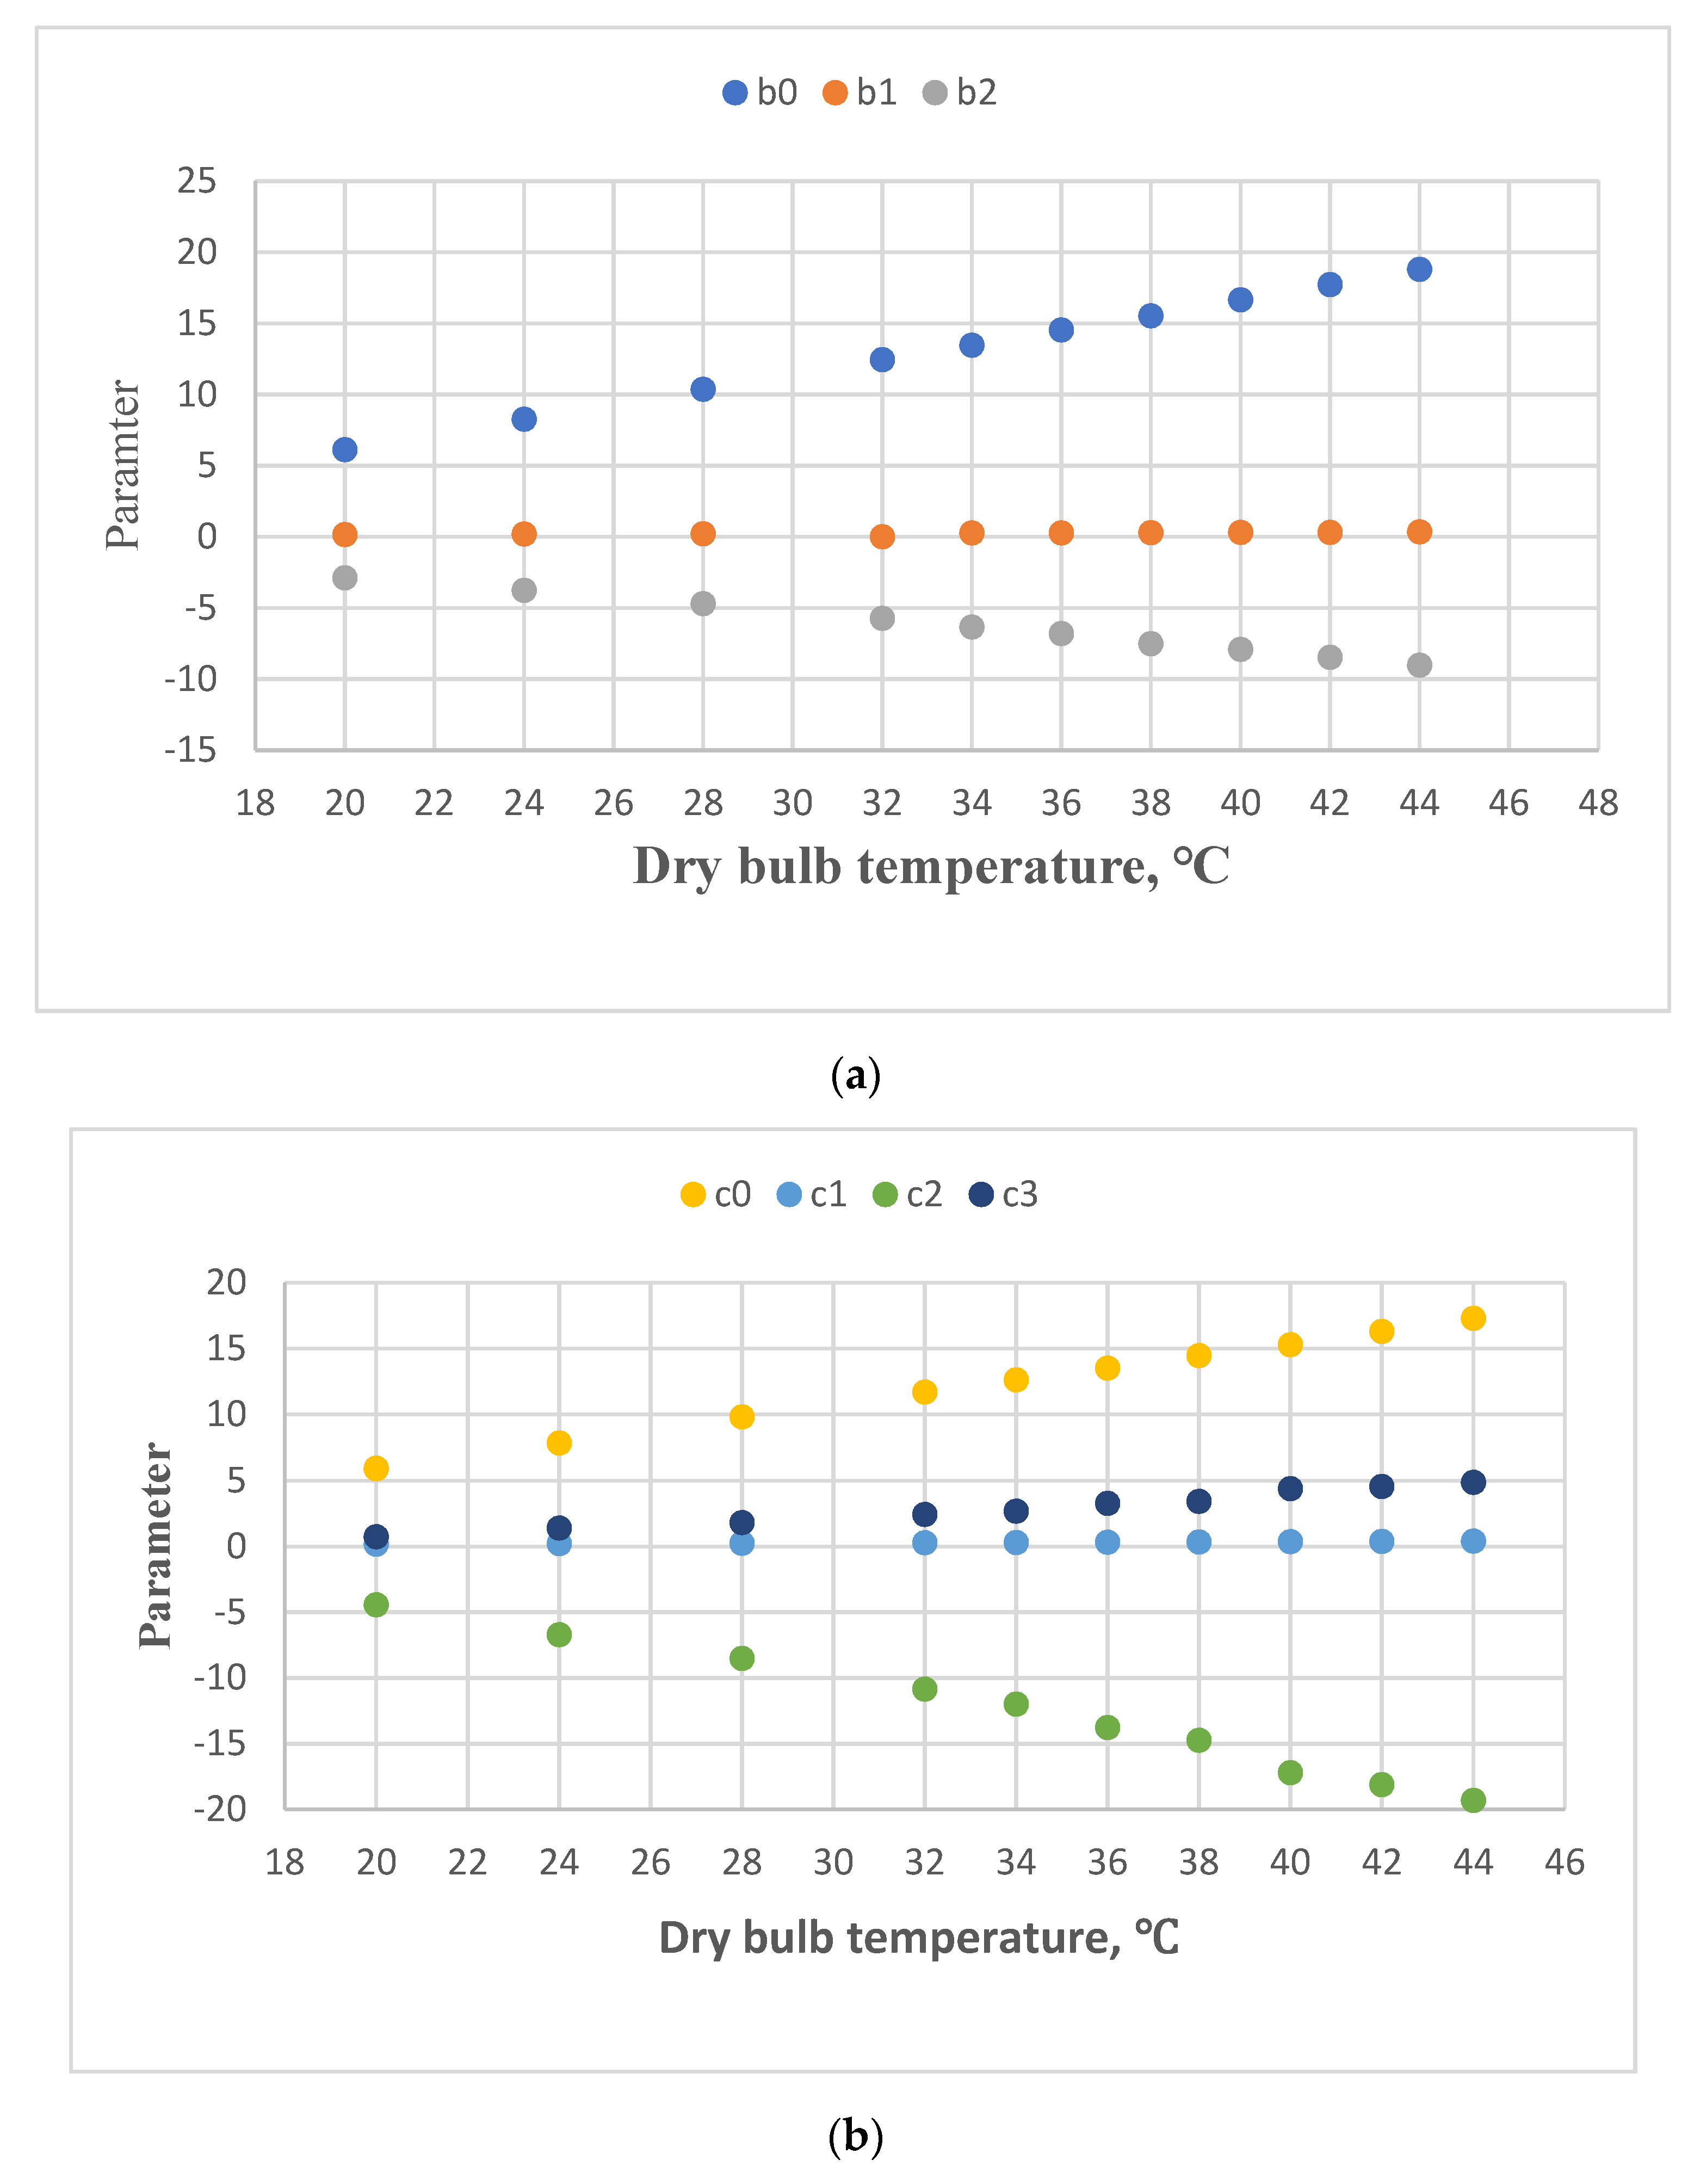
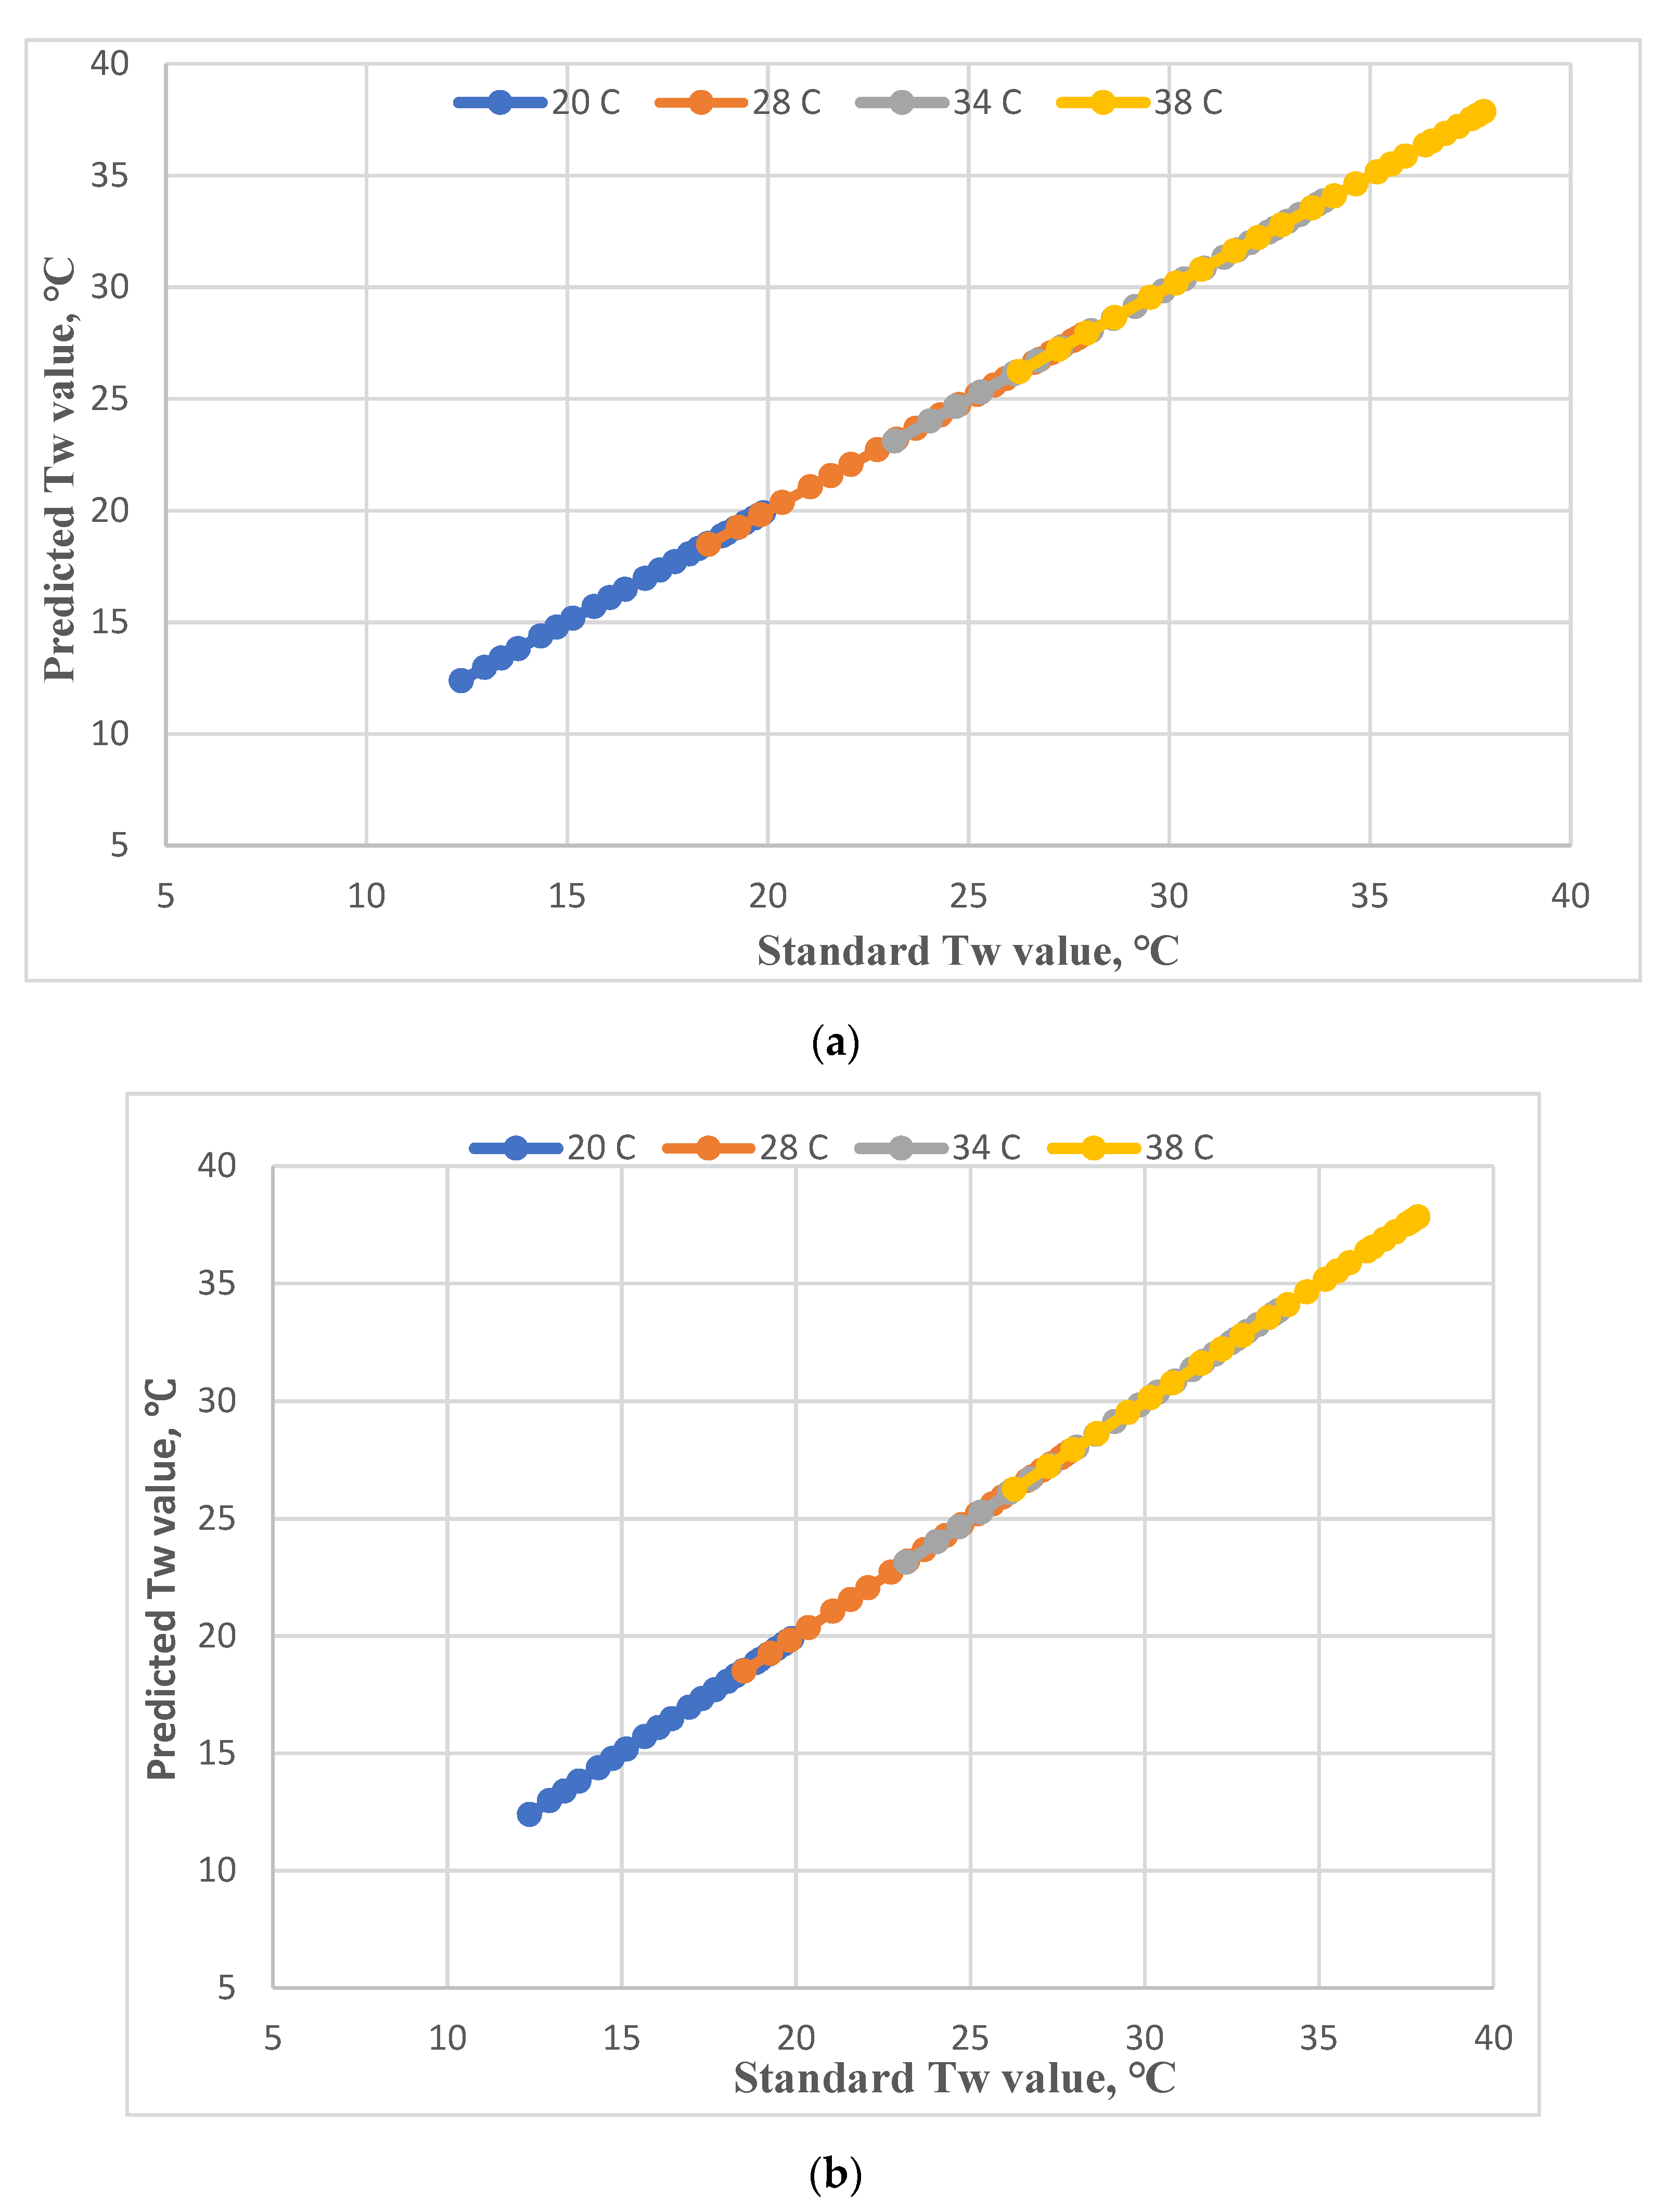
3. Development of the Tw Empirical Equation

The standard Tw values are calculated using Td and RH and a psychrometric software program. There are 276 data used to establish the Tw empirical equation. They include 12 data sets for 12 dry-bulb temperatures. Each dry-bulb temperature has 23 RH values. The distribution of the Tw and RH for different Td values is shown in Figure 1.
For a fixed Td value, the relationship between Tw and RH for different Td values is a nonlinear curve. The equations are:
Tw = b 0 + b 1 RH + b 2 RH 2
Tw = C 0 + C 1 RH + C 2 RH 2 + C 3 RH 3
Therefore:
For Td = 20 °C
Tw = 6.132121 + 0.167344 RH 2.8724 × 10 4 RH 2
s = 0.1145
where s is the standard error for the regression.
The value of s represents the accuracy of the calibration equation [36,37].
Tw = 5.90639 + 0.17784 RH 4.42401 × 10 4 RH 2 + 7.34578 × 10 7 RH 3
s = 0.0030
At Td = 40 °C
Tw = 16.65690 + 0.31214 RH 7.9050 × 10 4 RH 2
s = 0.0211
Tw = 15.306912 + 0.37489 RH 17.18421 × 10 4 RH 2 + 4.3931 × 10 6 RH 3
s = 0.0031
The relationship between the parameters for Equations (2) and (3) and the dry-bulb temperature is shown in Figure 2a,b. The parameters all have a linear relationship with the Td value.
Considering the effect of Td values on the parameters for Equations (2) and (3), Equations (2) and (3) are modified as:
Tw = d 0 + d 1 T + d 2 RH + d 3 RH 2 + d 4 T · RH + d 5 T · RH 2
Tw = e 0 + e 1 T + e 2 RH + e 3 RH 2 + e 4 RH 3 + e 5 T · RH + e 6 T · RH 2 + e 7 T · RH 3
To determine the fitting-ability between Td and RH data and the Tw values, two empirical equations are established using regression analysis. The Td ranges from 20 °C to 45 °C and RH ranges from 40% to 99%.
Model I:
Tw = 4.391976 + 0.0198197 RH + 0.526359 Td + 0.00730271 RH · Td + 2.4315 × 10 4 RH 2 2.58101 × 10 5 Td · RH 2
s = 0.02173
Model II:
Tw = 3.456088 0.0236826 RH + 0.471469 Td + 0.00985411 RH · Td + 8.86804 × 10 4 RH 2 6.35386 × 10 5 Td · RH 2 3.04555 × 10 6 RH 3
  s = 0.0160
To determine the degree of fitting between the Tw equations, the predicted Tw values by regression equation and the standard Tw values that are calculated using the psychrometric principle are compared. The difference between the predicted value by the model and the standard value is called the error. The criteria for comparison are the maximum error, emax, the minimum error, emin, the average sum of absolute errors, | e | ave, and the standard deviation for errors, esd.
e i = Tw ( prediction ) Tw ( standard )
| e | ave =   | e i | / n
e s d = (   ( e i ) 2 n ) 0.5
The criteria for the Stull Equation (Equation (1)), Model I (Equation (10)), and Model II (Equation (11)) are listed in Table 1. The criteria for the predictive errors for the Stull, Model I, and Model II equations are calculated with Equations (12)–(14).
The results in Table 1 show that Model II, which has a higher power term for RH, has the lowest values for the four criteria. This shows that this equation has the best fitting ability and predictive ability. The criteria for Model I are larger than those for Model II but there is a limited improvement in the predictive ability with higher power terms ( RH 3 ). The form of Model I is simple and easy to use, and this model can be used to calculate the Tw value using Td and RH values.
The parity plot is shown in Figure 3 to present the relationship between the prediction Tw value (Y) and the standard Tw value (X). The prediction Tw values and the standard Tw values distribute with the linear distribution of Y = X. The correlation coefficients between the prediction Tw value (Y) and the standard Tw value (X) are >0.9999. It indicated the good fitting ability of the two models.
The Stull equation had the highest criteria for e m a x , e m i n , | e | a v e and e s d , possibly because the range of Td and RH is different for this study. To develop the Tw equation, Stull [35] used Gene-expression programming to determine the best-fitting equation. The Td value of −20 to 50 °C and humidities of 5% to 99% was used in the study by Stull [35]. This study develops the equation to predict Tw using regression analysis. The Td and RH values range from 20 °C to 45 °C, and 40% to 99%, respectively. The predictive ability of Models I and II is better than that of the Stull equation. For an environment with a higher air temperature and humidity, Model I has the acceptable predictive ability and a simple form.
The error distributions for Models I and II are shown in Figure 4 and Figure 5. The distributions of the contour errors showed the specific geographical area to indicate the characteristic error distribution. In Figure 4 and Figure 5. the error distribution is uniform and there are no significant errors. All errors are less than 0.06 °C. No partial high error regions are found. There are two areas of interest in the error distribution for the Stull equation (In Figure 3, Stull [35]) for high temperature (>40 °C) and humidity (>85%). These errors are >0.3 °C. The prediction criteria of this equation are better than that of the Stull equation when applied to a temperature of 20~45 °C and RH of 40~99%.

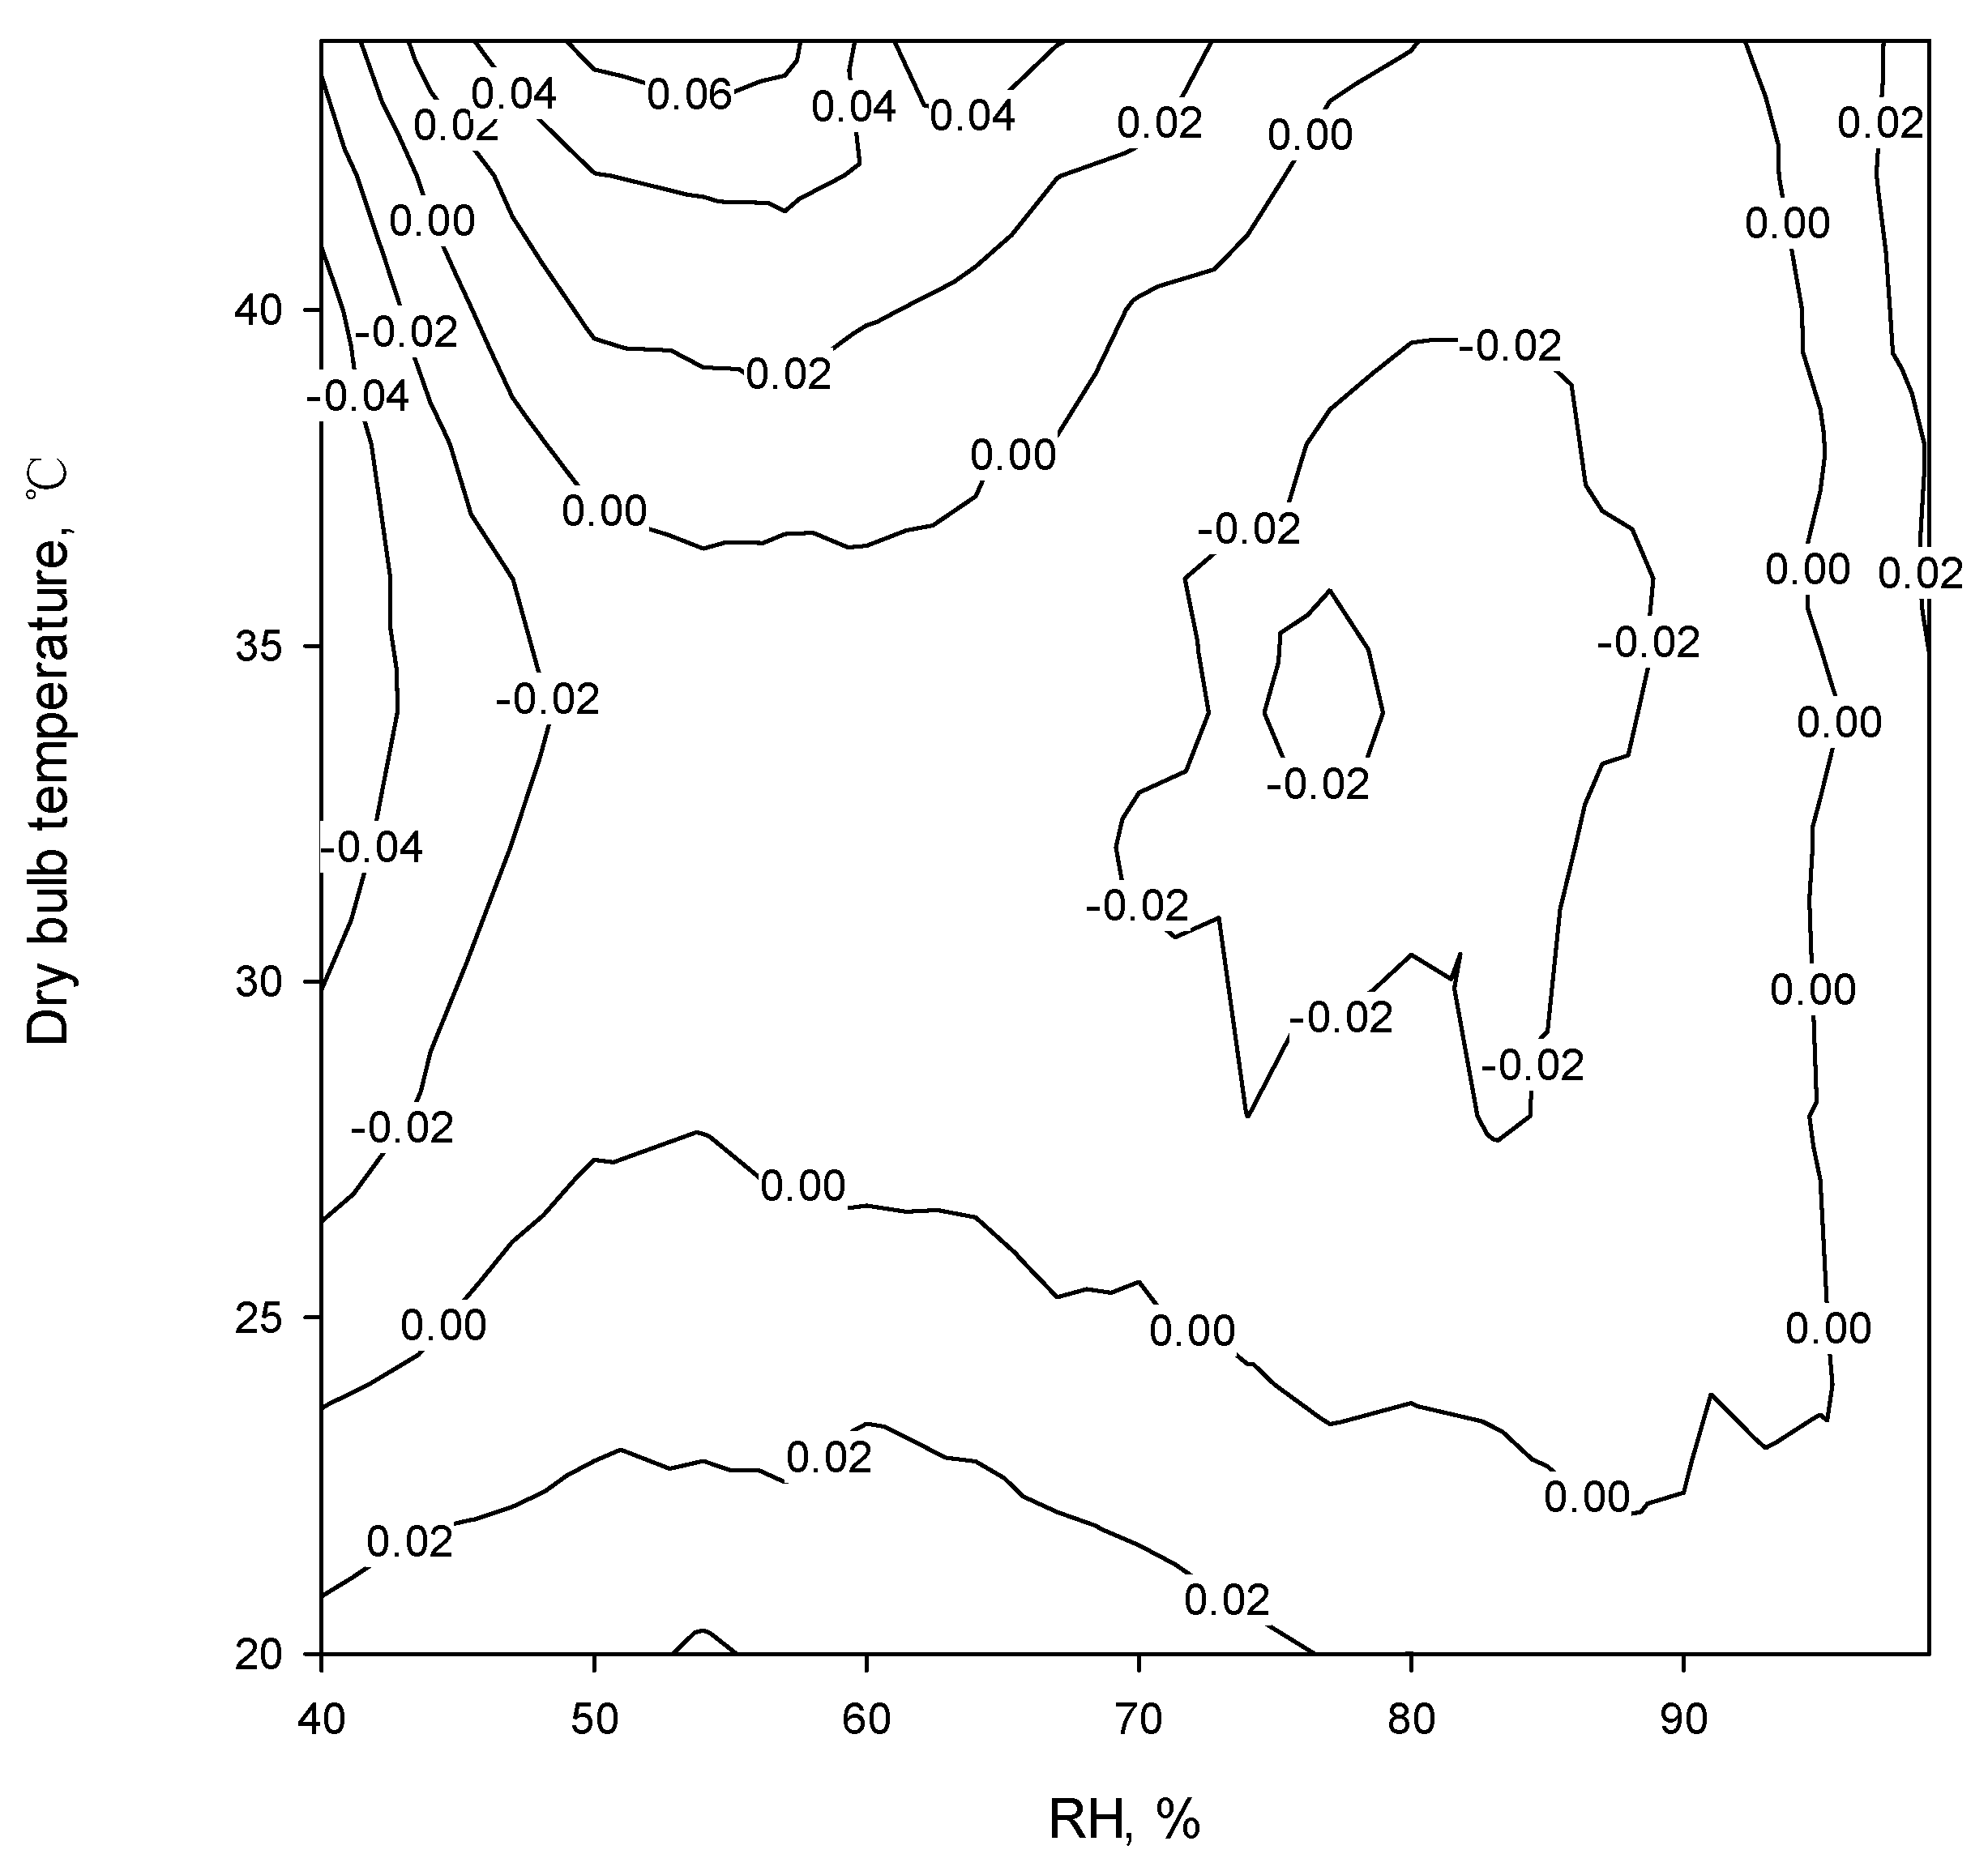
4. The Measurement Uncertainty for the Tw Equation

For a value of Tw of 35 °C, with the threshold for heat stress at 35 °C, the relationship between Td and RH is shown in Figure 6.
To ensure the safety of human beings, if the air humidity is 80%, the Td value must be <38.3 °C. If the air humidity is 90%, the Td value must be <36.6 °C. However, the measurement errors for Td and RH are not considered. This study uses the concept of measurement uncertainty to determine the effect of measurement errors for Td and RH on the Tw calculation [38,39].
The uncertainty in Tw is calculated as:
u 2 ( Tw ) = ( Tw RH ) 2 u 2 ( RH ) + ( Tw Td ) 2 u 2 ( Td ) + u 2 ( s )
where u (RH) is the measurement uncertainty for RH sensors, u (Td) is the measurement uncertainty for the Td thermometer, and u (s) is the measurement uncertainty for the Tw equation.
The expanded measurement uncertainty is 1.96 u (Tw). This equates to a 95% probability for the measurement uncertainty value for Tw.
In this study, Model I (Equation (9)) is used:
Tw RH = 0.0198197 + 0.00730271 Td + 4.8703 × 10 4 5.1620 × 10 5 Td · RH
Tw Td = 0.526359 + 0.00730271 RH 2.581 × 10 5 RH 2
where   u (s) is the standard error for the regression for the Tw equation. In Model I, u (s) = 0.02173
There are two causes for measurement uncertainty for Td and RH.
A. No calibration of sensors [34,40]
u ( Td )   =   0.75   ° C ,   u ( RH )   =   3.8 %
B. After calibration of sensors [34,40]
u ( Td )   =   0.22   ° C ,   u ( RH )   =   1.6 %
Using Equations (15)–(17) and the measurement uncertainty values for Td and RH for these two cases, the values for the expanded measurement uncertainty at different Td and RH values are shown in Figure 7 and Figure 8.
If the Td and RH sensors are not calibrated, the expanded uncertainty measurement is 1.4~2.2 °C. The threshold value for Tw is 35 °C, so the alarm temperature needs to be set as 32.8~33.6 °C to assure the safety of human beings. If the Td and RH sensors are calibrated, the expanded measurement uncertainty for higher RH (>80%) is 0.16~0.28 °C. In this case, the threshold value is 34.7 °C.
Vecellio et al. [21] calculated the uncommendable heat stress in high humidity for young and healthy adults as a TW value < 35. This Tw value is affected by measurement uncertainty for sensors. The estimated measurement uncertainty values show that the performance of the Td and RH sensors has a significant effect on the Tw threshold values.
Sherwood and Huber [3] first proposed an adaptability limit of Tw > 35 °C for heat stress. Their observational estimated wet-bulb temperatures were derived using temperature, humidity, and pressure data from the ERA-Interim data sets. The equation for Tw values and the uncertainty in these observation instruments were not reported. If the uncertainty of the Tw values is considered, the adaptability limit is more accurate.
In a study of the spatiotemporal patterns and synoptics for extreme wet-bulb temperature in the United States, Raymond et al. [17] calculated the Tw value using temperature and humidity data from 175 weather stations using the Stull equations.
The characteristics of predictive errors are compared with the maximum error, the minimum error, the average sum of absolute errors, and the standard deviation for errors. The results indicated that the Tw model developed in this study is more accurate than that of the Stull equation. This empirical model also provides more precise information.
Sherwood [3] noted that the Tw value is the apparent temperature for the weather service, but this study did not measure Tw. Raymond et al. [18] used the National Climate Data Center Integrated Surface Database. The Tw value was calculated using air temperature and humidity. The study reported uncertainty in Tw of 0 to 0.5 °C for recent data and 1.2 °C for the oldest data. However, the method to calculate uncertainty was not described. In this study, we develop and validate a revised equation to calculate Tw. The calculation for measurement uncertainty for Tw values is described. This study adds to the collective knowledge of the effect of Tw values on heat stress for human beings in an environment of climate change.

5. Conclusions

This study determines the fit between the Tw data and the independent variables of air temperature (Td) and humidity (RH). The empirical equation is Tw = 4.391976 + 0.0198197 RH + 0.526359 Td + 0.00730271 RH · Td + 2.4315 × 10 4 RH 2 2.58101 × 10 5 Td · RH 2 . Td is in °C and RH is in %. This equation pertains to temperature and RH ranges of 20~45 °C and 40~99%, respectively. The prediction accuracy is 0.022 °C. The fitting ability is better than that of the Stull equation for this range. The limitation of this empirical equation is the application range. It could not be applied in the range of Td < 20 °C or RH < 40%.
The measurement uncertainty for Tw values if the thermometer and humidity sensors are not calibrated is 1.4~2.2%. If these sensors are calibrated, the measurement uncertainty for Tw values is 0.16~0.28 °C. An adequate Tw predictive equation and calibrated sensors are required to set the Tw alarm values for environments with high temperature and humidity.

Author Contributions

Conceptualization, H.-Y.C. and C.-C.C.; methodology, H.-Y.C. and C.-C.C.; software, C.-C.C.; formal analysis, H.-Y.C.; investigation, H.-Y.C. and C.-C.C.; data curation, H.-Y.C.; writing—original draft preparation, H.-Y.C. and C.-C.C.; writing—review and editing, H.-Y.C. and C.-C.C.; visualization, C.-C.C.; supervision, C.-C.C.; project administration, C.-C.C. All authors have read and agreed to the published version of the manuscript.

Funding

The authors would like to thank the Ministry of Science and Technology of the Republic of China for financially supporting this research under Contract No. MOST-109-2313-B-005-038.

Data Availability Statement

Not applicable.

Conflicts of Interest

The authors declare no conflict of interest.

References

  1. Dunne, J.P.; Stouffer, R.J.; John, J.G. Reductions in labour capacity from heat stress under climate warming. Nat. Clim. Chang. 2018, 3, 563–566. [Google Scholar] [CrossRef]
  2. Ghani, S.; Bialy, E.M.; Bakochristou, F.; Gamaledin, S.M.A.; Rashwan, M.M.; Hughes, B. Thermal comfort investigation of an outdoor air-conditioned area in a hot and arid environment. Sci. Technol. Built Environ. 2017, 23, 1113–1131. [Google Scholar] [CrossRef] [Green Version]
  3. Sherwood, S.C.; Huber, M. An adaptability limit to climate change due to heat stress. Proc. Natl. Acad. Sci. USA 2010, 107, 9552–9555. [Google Scholar] [CrossRef] [PubMed] [Green Version]
  4. ASHRAE. Thermal Comfort Conditions; ASHRAE Standard 55.66; ASHRAE: New York, NY, USA, 1966. [Google Scholar]
  5. Epstein, Y.; Moran, D.S. Thermal comfort and the heat stress indices. Ind. Health 2006, 44, 388–398. [Google Scholar] [CrossRef] [PubMed] [Green Version]
  6. Haldane, J.S. The influence of high air temperatures No. I. Epidemiol. Infect. 1905, 5, 494–513. [Google Scholar] [CrossRef]
  7. Abdel-Ghany, A.M.; Al-Helal, I.M.; Shady, M.R. Human thermal comfort and heat stress in an outdoor urban arid environment: A case study. Adv. Meteorol. 2013, 2013, 693541. [Google Scholar] [CrossRef] [Green Version]
  8. Abdel-Ghany, A.M.; Al-Helal, I.M.; Shady, M.R. Effect of the evaporative cooling on the human thermal comfort and heat stress in a greenhouse under arid conditions. Adv. Meteorol. 2013, 2013, 361471. [Google Scholar] [CrossRef] [Green Version]
  9. Abdel-Ghany, A.M.; Al-Helal, I.M.; Shady, M.R. Evaluation of human thermal comfort and heat stress in an outdoor urban setting in summer under arid climatic conditions. Environ. Prot. Eng. 2014, 40, 3. [Google Scholar] [CrossRef]
  10. Anuja, N.; Priya Amutha, N. Assessment of thermal comfort in institutional building based on theoretical and experimental analysis. Asian Rev. Civ. Eng. 2016, 5, 7–12. [Google Scholar]
  11. Ali, S.B.; Patnaik, S. Thermal comfort in urban open spaces: Objective assessment and subjective perception study in the tropical city of Bhopal, India. Urban Clim. 2018, 24, 954–967. [Google Scholar] [CrossRef]
  12. Aghamohammadi, N.; Fong, C.S.; Idrus, M.H.M.; Ramakreshnan, L.; Haque, U. Outdoor thermal comfort and somatic symptoms among students in a tropical city. Sustain. Cities Soc. 2021, 72, 103015. [Google Scholar] [CrossRef]
  13. Fairey, P.W. Passive Cooling and Human Comfort; Florida Solar Energy Center: Cocoa, FL, USA, 1981. [Google Scholar]
  14. Budd, G.M. Wet-bulb globe temperature (WBGT)—Its history and its limitations. J. Sci. Med. Sport 2008, 11, 20–32. [Google Scholar] [CrossRef]
  15. Sherwood, S.C. How important is humidity in heat stress? J. Geophys. Res. Atmos. 2018, 123, 808–810. [Google Scholar] [CrossRef] [Green Version]
  16. Pal, J.; Eltahir, E. Future temperature in southwest Asia is projected to exceed a threshold for human adaptability. Nat. Clin. Chang. 2016, 6, 197–200. [Google Scholar] [CrossRef]
  17. Raymond, C.; Singh, D.; Horton, R.M. Spatiotemporal patterns and synoptics of extreme wet-bulb temperature in the contiguous United States. J. Geophys. Res. Atmos. 2017, 122, 13–108. [Google Scholar] [CrossRef]
  18. Raymond, C.; Matthews, T.; Horton, R.M. The emergence of heat and humidity is too severe for human tolerance. Sci. Adv. 2020, 6, eaaw1838. [Google Scholar] [CrossRef]
  19. Zhang, Y.; Held, I.; Fueglistaler, S. Projections of tropical heat stress constrained by atmospheric dynamics. Nat. Geosci. 2021, 14, 133–137. [Google Scholar] [CrossRef]
  20. Vecellio, D.J.; Wolf, S.T.; Cottle, R.M.; Kenney, W.L. Evaluating the 35 °C wet-bulb temperature adaptability threshold for young, healthy subjects (PSU HEAT Project). J. Appl. Physiol. 2021, 132, 340–345. [Google Scholar] [CrossRef]
  21. Vecellio, D.J.; Wolf, S.T.; Cottle, R.M.; Kenney, W.L. Suitability of thermal indices in describing heat stress compensability. FASEB J. 2022, 36, R5194. [Google Scholar] [CrossRef]
  22. Anders, C. Wet-Bulb Temperature Is Important, Climate Experts Say. So What Is It? 2021. Available online: https://www.washingtonpost.com/weather/2021/07/24/wet-bulb-temperature-extreme-heat/ (accessed on 24 July 2021).
  23. Reiners, P.W. Wet Bulb Temperature. Available online: https://www.salon.com/2021/07/18/wet-bulb-temperature-climate-change/ (accessed on 26 July 2021).
  24. Prevost-Manuel, J. How Hot Is Too Hot for Humans? Understanding Wet-Bulb Temperatures. Available online: https://www.cbc.ca/news/science/how-hot-is-too-hot-for-humans-understanding-wet-bulb-temperatures-1.6088415 (accessed on 30 May 2022).
  25. Chow, D. Deadly ‘Wet-Bulb Temperatures’ Are Being Stoked by Climate Change and Heat Waves. NBC News. Available online: https://www.nbcnews.com/science/science-news/wet-bulb-temperature-weather-average-climate-human-heat-wave-rcna27478 (accessed on 7 July 2022).
  26. Sirur, S. What Are Wet Bulb Temperatures, and Why They Probably Won’t Cross 35°C Long Enough to Be Lethal? Available online: https://theprint.in/environment/what-are-wet-bulb-temperatures-and-why-they-probably-wont-cross-35c-long-enough-to-be-lethal/951637/ (accessed on 24 May 2022).
  27. Buis, A. Too Hot to Handle: How Climate Change May Make Some Places Too Hot to Live. NASA. Available online: https://climate.nasa.gov/ask-nasa-climate/3151/too-hot-to-handle-how-climate-change-may-make-some-places-too-hot-to-live/ (accessed on 9 July 2022).
  28. Ganaie, A. Explained! How Harmful Is Rising Incidence of Fatal Wet-Bulb Temperature for Humans? Available online: https://www.digpu.com/health/surge-in-measles-cases-mandates-catch-up-immunization-campaigns (accessed on 30 July 2022).
  29. The Economist. The Increasing Frequency of Fatal Wet-Bulb Temperatures. Available online: https://www.economist.com/the-economist-explains/2022/05/13/the-increasing-frequency-of-fatal-wet-bulb-temperatures? (accessed on 13 July 2022).
  30. Alfano, F.R.D.A.; Palella, B.I.; Riccio, G. On the problems related to natural wet bulb temperature indirect evaluation for the assessment of hot thermal environments by means of WBGT. Ann. Occup. Hyg. 2012, 56, 1063–1079. [Google Scholar]
  31. Golbabaei, F.; Asour, A.A.; Kolahdoozi, M.; Mohammadiyan, M. The limitations of WBGT index for application in industries: A systematic review. J. Occup. Hyg. Eng. 2021, 13, 365–381. [Google Scholar] [CrossRef]
  32. Wernecke, R.; Wernecke, J. Industrial Moisture and Humidity Measurement: A Practical Guide; Wiley: Hoboken, NJ, USA, 2014. [Google Scholar]
  33. Wiederhold, P.R. Water Vapor Measurement: Methods and Instrumentation; CRC Press: Boca Raton, FL, USA, 2012. [Google Scholar]
  34. Lu, H.; Chen, C. Uncertainty evaluation of humidity sensors calibrated by saturated salt solutions. Measurement 2007, 40, 591–599. [Google Scholar] [CrossRef]
  35. Stull, R. Wet-bulb temperature from relative humidity and air temperature. J. Appl. Meteorol. Climatol. 2011, 50, 2267–2269. [Google Scholar] [CrossRef] [Green Version]
  36. Raymond, M. Classical and Modern Regression with Applications, 2nd ed.; Duxbury: Pacific Grove, CA, USA, 2000. [Google Scholar]
  37. Ellison, S.L.; Williams, A. EURACHEM/CITAC Guide CG4: Quantifying Uncertainty in Analytical Measurement, 3rd ed.; EURACHEM: Teddington, UK, 2012. [Google Scholar]
  38. Iso, I.; Oiml, B. BIMP, IEC, IFCC, ISO, IUPAC, IUPAP, OIML. In Guide to the Expression of Uncertainty in Measurement; ISO: Geneva, Switzerland, 1993. [Google Scholar]
  39. ISO/IEC 98-3; Uncertainty of Measurement—Part 3: Guide to the Expression of Uncertainty in Measurement. ISO Edition: Geneva, Switzerland, 2010.
  40. Chen, C. Evaluation of measurement uncertainty for thermometers with calibration equations. Accredit. Qual. Assur. 2006, 11, 75–82. [Google Scholar] [CrossRef]
Figure 1. The distribution for Tw and RH for different Td values. (a) 20, 28, 34, 38, 42, 44 °C, (b) 24, 32, 36, 40, 43, 45 °C.
Atmosphere 13 01765 g001
Figure 2. The relationship between the parameters for Equations (2) and (3) and the dry-bulb temperature. (a) b0, b1, and b2 parameters, (b) c0, c1, c2 and c3 parameters.
Atmosphere 13 01765 g002
Figure 3. The parity plot of the prediction Tw values and the standard Tw value. (a) Model I, (b) Model II.
Atmosphere 13 01765 g003
Figure 4. The error distribution for Model I.
Atmosphere 13 01765 g004
Figure 5. The error distribution for Model II.
Atmosphere 13 01765 g005
Figure 6. The relationship between Td and RH for a threshold of heat stress of 35 °C.
Atmosphere 13 01765 g006
Figure 7. The expanded measurement uncertainty for different Td and RH values if the Td and RH sensors are not calibrated.
Atmosphere 13 01765 g007
Figure 8. The expanded measurement uncertainty for different Td and RH values if the Td and RH sensors are calibrated.
Atmosphere 13 01765 g008
Table 1. The criteria for the predictive errors for three equations.
CriteriaModel IModel IIStull Eq.
e m a x 0.072120.047060.86078
e m i n −0.05860−0.029848−0.15988
| e | a v e 0.016830.011950.21357
e s d 0.021450.015760.2860
Publisher’s Note: MDPI stays neutral with regard to jurisdictional claims in published maps and institutional affiliations.

