1. Introduction
Worldwide, the jarosite process is the most widely used technique of iron removal from the acidic process in the zinc industry, where it is often produced as a by-product. The use of jarosite in the zinc industry is followed by the production of iron precipitates, with minimum losses of Zn, Cd and Cu in jarosite precipitates. During the zinc extraction process, a huge amount of jarosite is released as waste, where jarosite is extremely common. Therefore, jarosite is common in diverse environments such as nature (oxidizing zones of sulphide deposits, acid sulfate soil, or clays) and hydrometallurgical waste [
1,
2,
3,
4,
5,
6]. Even though the function of jarosite as a potential source of acid in mines is not completely understood, the traditional view that acid can be generated in mine waste due to the oxidation of sulphide minerals and dissolution of sulfate salts and sulfate minerals such as jarosite has been brought to attention by several researchers [
4,
5,
6,
7,
8].
Jarosite waste released from the zinc extraction process may cause serious environmental problems due to the presence of toxic metals, such as Pb, Cd, Zn, and As. The characterization and environmental impact of tailing mining waste have been addressed by various researchers worldwide [
4,
6,
7]; however, fewer researchers have addressed the jarosite waste contribution to atmospheric metal deposition in the area of polluted mining districts [
9]. From an X-ray diffractogram of jarosite released from the zinc extraction process, the authors confirmed that the major mineral phase is jarosite (KFe
3(SO
4)
2(OH)
6) and iron sulfate hydrate (2Fe
2O
3SO
3·5H
2O). According to Picazo-Rodríguez et al. [
1], the mineral phase in jarosite is hydrophobic and insoluble, while the other phase namely iron sulfate hydrate is hydrophilic and easily soluble. This characteristic nature makes jarosite hazardous material interesting for further study.
The deposition of jarosite waste in open tailing is not a reliable method because of future environmental costs. Tailings are exposed to weathering, acid mine drainage, and the mobilization of metals. There are many documented cases in which the long-term investigation of the bioavailability of heavy metals in the environment has built up toxic metal concentrations in the soil, water, air, and organisms [
1,
5,
9]. Mining in Kosovo has occurred for a long period, with lead and zinc metallurgy productions in the Trepca mine in Mitrovica in the region. With reserves of lead, zinc, bauxite, nickel, silver, and gold, Trepca is known as one of the biggest mining complexes in Europe [
8]. Wind movement over the open tailings in Mitrovica transport a high concentration of heavy metals in the form of particles and present a potential human health concern that requires radical changing measures. Their potential risk is linked with direct exposure to the contaminated site by breathing dust [
10,
11,
12].
Today, there are several simulation models used for air quality assessment in urban and industrial zones. Atmospheric dispersion models, such as the Gaussian model, Eulerian model, and Lagrangian model, have been applied and implemented using different statistical comparative parameters [
10,
11,
12,
13]. These models have been used for the assessment of air quality in the mining industry. Most studies have been focused on determining the dispersion of particulate matter but not on assessing the pollution with heavy metals. Castillo et al. reported that mine wastes are the major sources of heavy-metal particles distributed in surrounding areas [
11]. The US Environmental Protection Agency proposed several meteorological modeled data sets and models for performing simulations using AERMOD, CALPUFF, and ADMS [
14,
15,
16]. The AERMOD techniques were used to analyze short- and long-range air dispersion modeling for isolated buildings and wind tunnels and the total suspended particulates from an open-cast coal mine [
17]. Zunaira et al. used the quantity of the pollutant’s concentration produced at the mining site as the criterion to determine how far the pollutant could travel [
17]. The findings showed that Zn in minimal quantities could travel up to 20 km, whereas other heavy metals did not travel beyond 10 km due to lower emissions at the source. Other authors have confirmed that the technique based on the Gaussian algorithm has been used for the mining application [
18,
19,
20]. The authors have confirmed that the analytical solution and predictions are made by incorporating the emission rate linked to various mining activities [
7,
8,
9,
10,
11,
12,
13,
14,
15,
16,
17,
18,
19,
20]. It has been observed that there is a need for a more holistic approach to gain more understanding of air pollution multiple-source levels [
17,
21,
22,
23,
24].
The European Environment Agency presented the use of air dispersion models as a response to policymakers and researchers to interpret model results that help the definition of intervention priorities [
21]. Evaluation of the modeling results has been the focus of studies in Europe to respond to emission reductions, facilitate air quality planning, and help policymakers in prioritizing policies [
20,
21,
22]. Very few studies have concentrated on assessing the urban environment exposed to varying concentrations of heavy metals from jarosite [
2,
5,
8]. In this work, we apply the AERMOD View- Gaussian air dispersion model to illustrate to what extent the ratio of the concentration of jarosite particles changes corresponding to the open-tailing location in Mitrovica, Kosovo. The scope of the selected model is to provide the first assessment report on the prediction of air pollutants from jarosite in the form of a model that can be used by the Trepca mining industry and policymakers in Kosovo.
2. Materials and Methods
2.1. Jarosite Waste
Jarosite waste dispersion modeling is a quantitative statistical assessment of the consequences of airborne dust emissions from mine sources in a certain area. Different hydrometeorological conditions, such as wind speed and direction, temperature, relative humidity, and precipitation, are just a few of the variables that affect the transport and dispersion of jarosite and airborne dust particles. The AERMOD air quality model was used to forecast airborne jarosite waste concentrations. The results are visualized and used for decision-making and analysis purposes.
For that purpose, there following investigations were performed:
Site characterization, with terrain data, elevation, and locations of the urban infrastructure.
Processing of terrain data using AERMAP software (PDS Consultancy, Leicester, UK).
Jarosite deposit characterization as a primary source of emission for environmental impact assessment purposes.
Processing wind data using AERMET software.
AERMOD application over an area of interest in order to predict the jarosite particle distribution (plume forecast).
2.2. Site Characterization
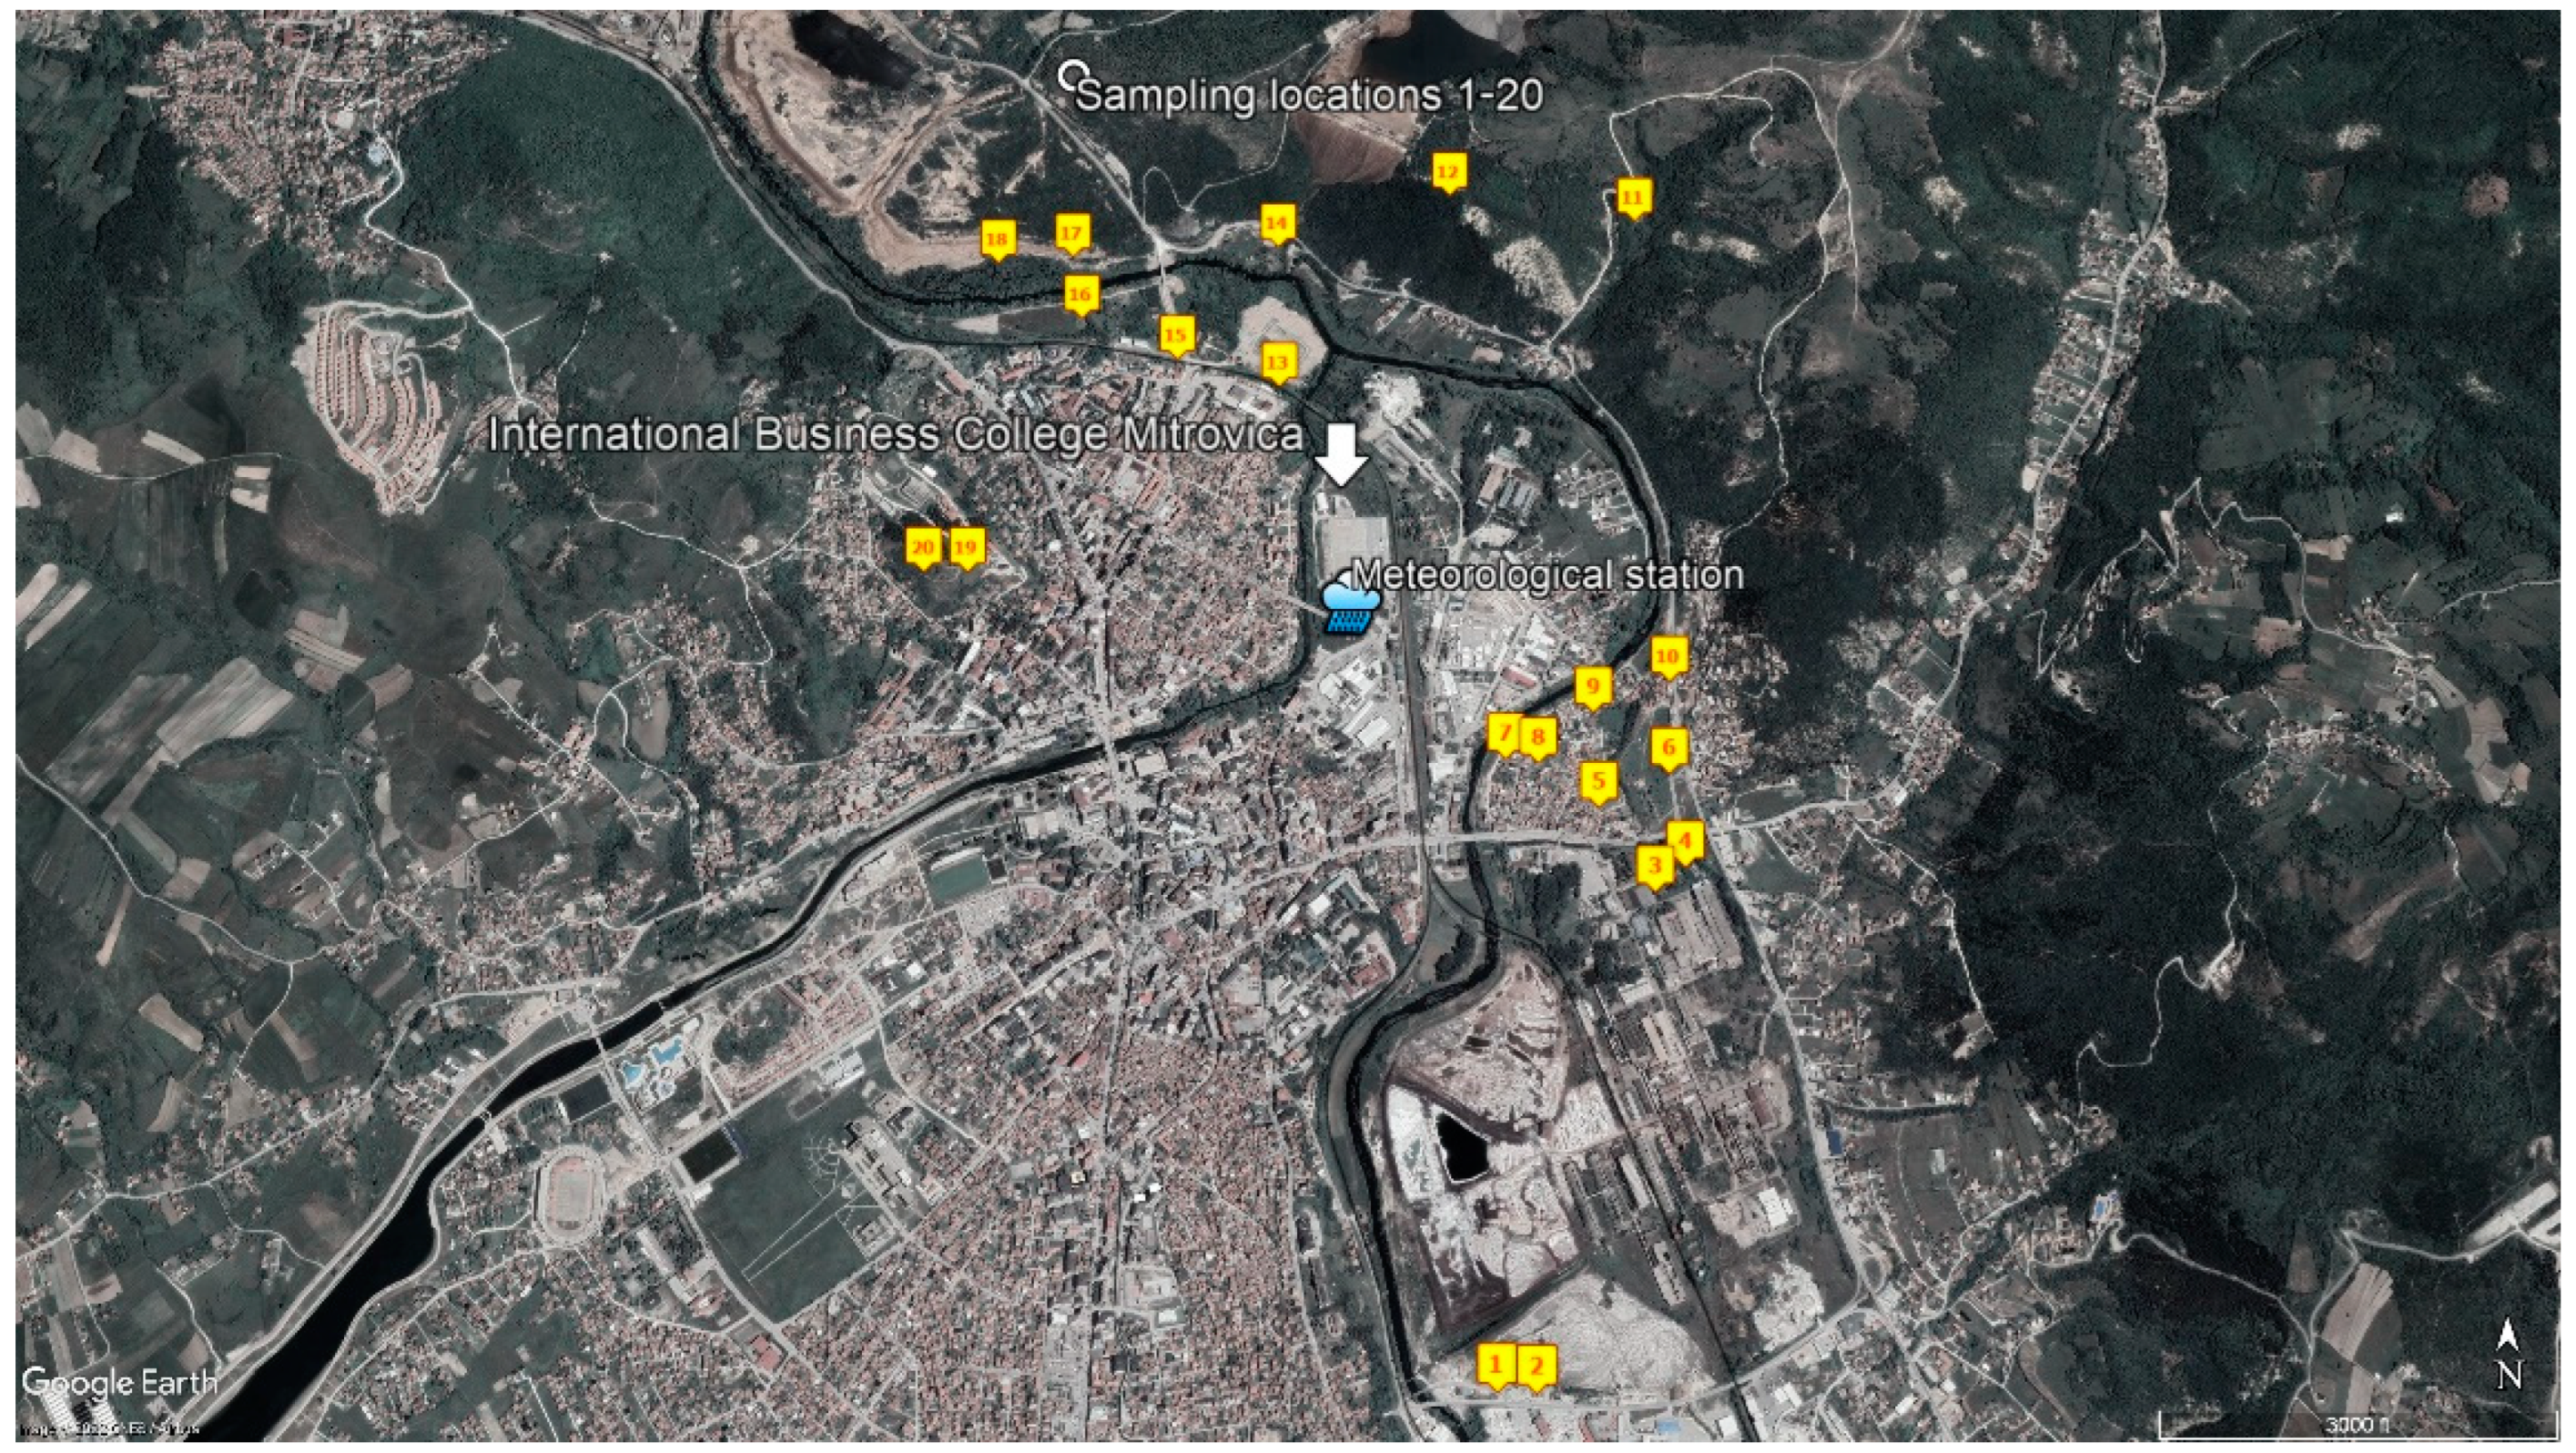
The jarosite waste deposit is located on the Sitnica riverbank in the close vicinity of Mitrovica city,
Figure 1.
In the Receptor pathway in the AERMOD program, the Flat and Elevated option was selected, as the location is situated at the Sitnica River Valley, which separates the industrial park from the city of Mitrovica, and there are the slopes of the Mountain Bajgora surrounding the site from the eastern side. The AERMOD used the AERMAP Receptor Output file (*ROU). The terrain and location of the broader area of influence, including the location of the nearest meteorological station, are presented in
Figure 1. The samples of the topsoil surrounding the jarosite waste deposit were taken from the Sitnica River Valley and analyzed for their heavy metal content, as presented in
Table 1.
2.3. Waste Characterization
The jarosite waste deposit is a passive industrial waste deposit, and it was exposed to aging and weathering processes that caused changes in particle size and chemical properties due to agglomeration and oxidation.
The deposit was characterized by chemical analysis and granulometric composition in order to determine the presence of PM 2.5 and PM 10 particles.
The total metal content of trace and major metals was determined by means of inductively coupled plasma-optical emission spectrometry ICP=OES (ICP—OES, Teledyne Leeman Labs (Hudson, NH, SAD) after the preparation of samples using the microwave digestion method (MARS 6 XP1500 Microwave Digestion System, CEM, UK). Microwave digestion of jarosite waste samples was carried out in two stages with the use of reagents HCl, HNO
3, HF, and H
3BO
3. Certified reference materials, S JR-3 and S Jsy-1 (MBH Analytical Ltd., Chipping Barnet, UK) were analyzed in order to test the accuracy of the applied method for the determination of total metal concentrations in the investigated jarosite samples. The chemical composition of the jarosite waste deposit is shown in
Table 2.
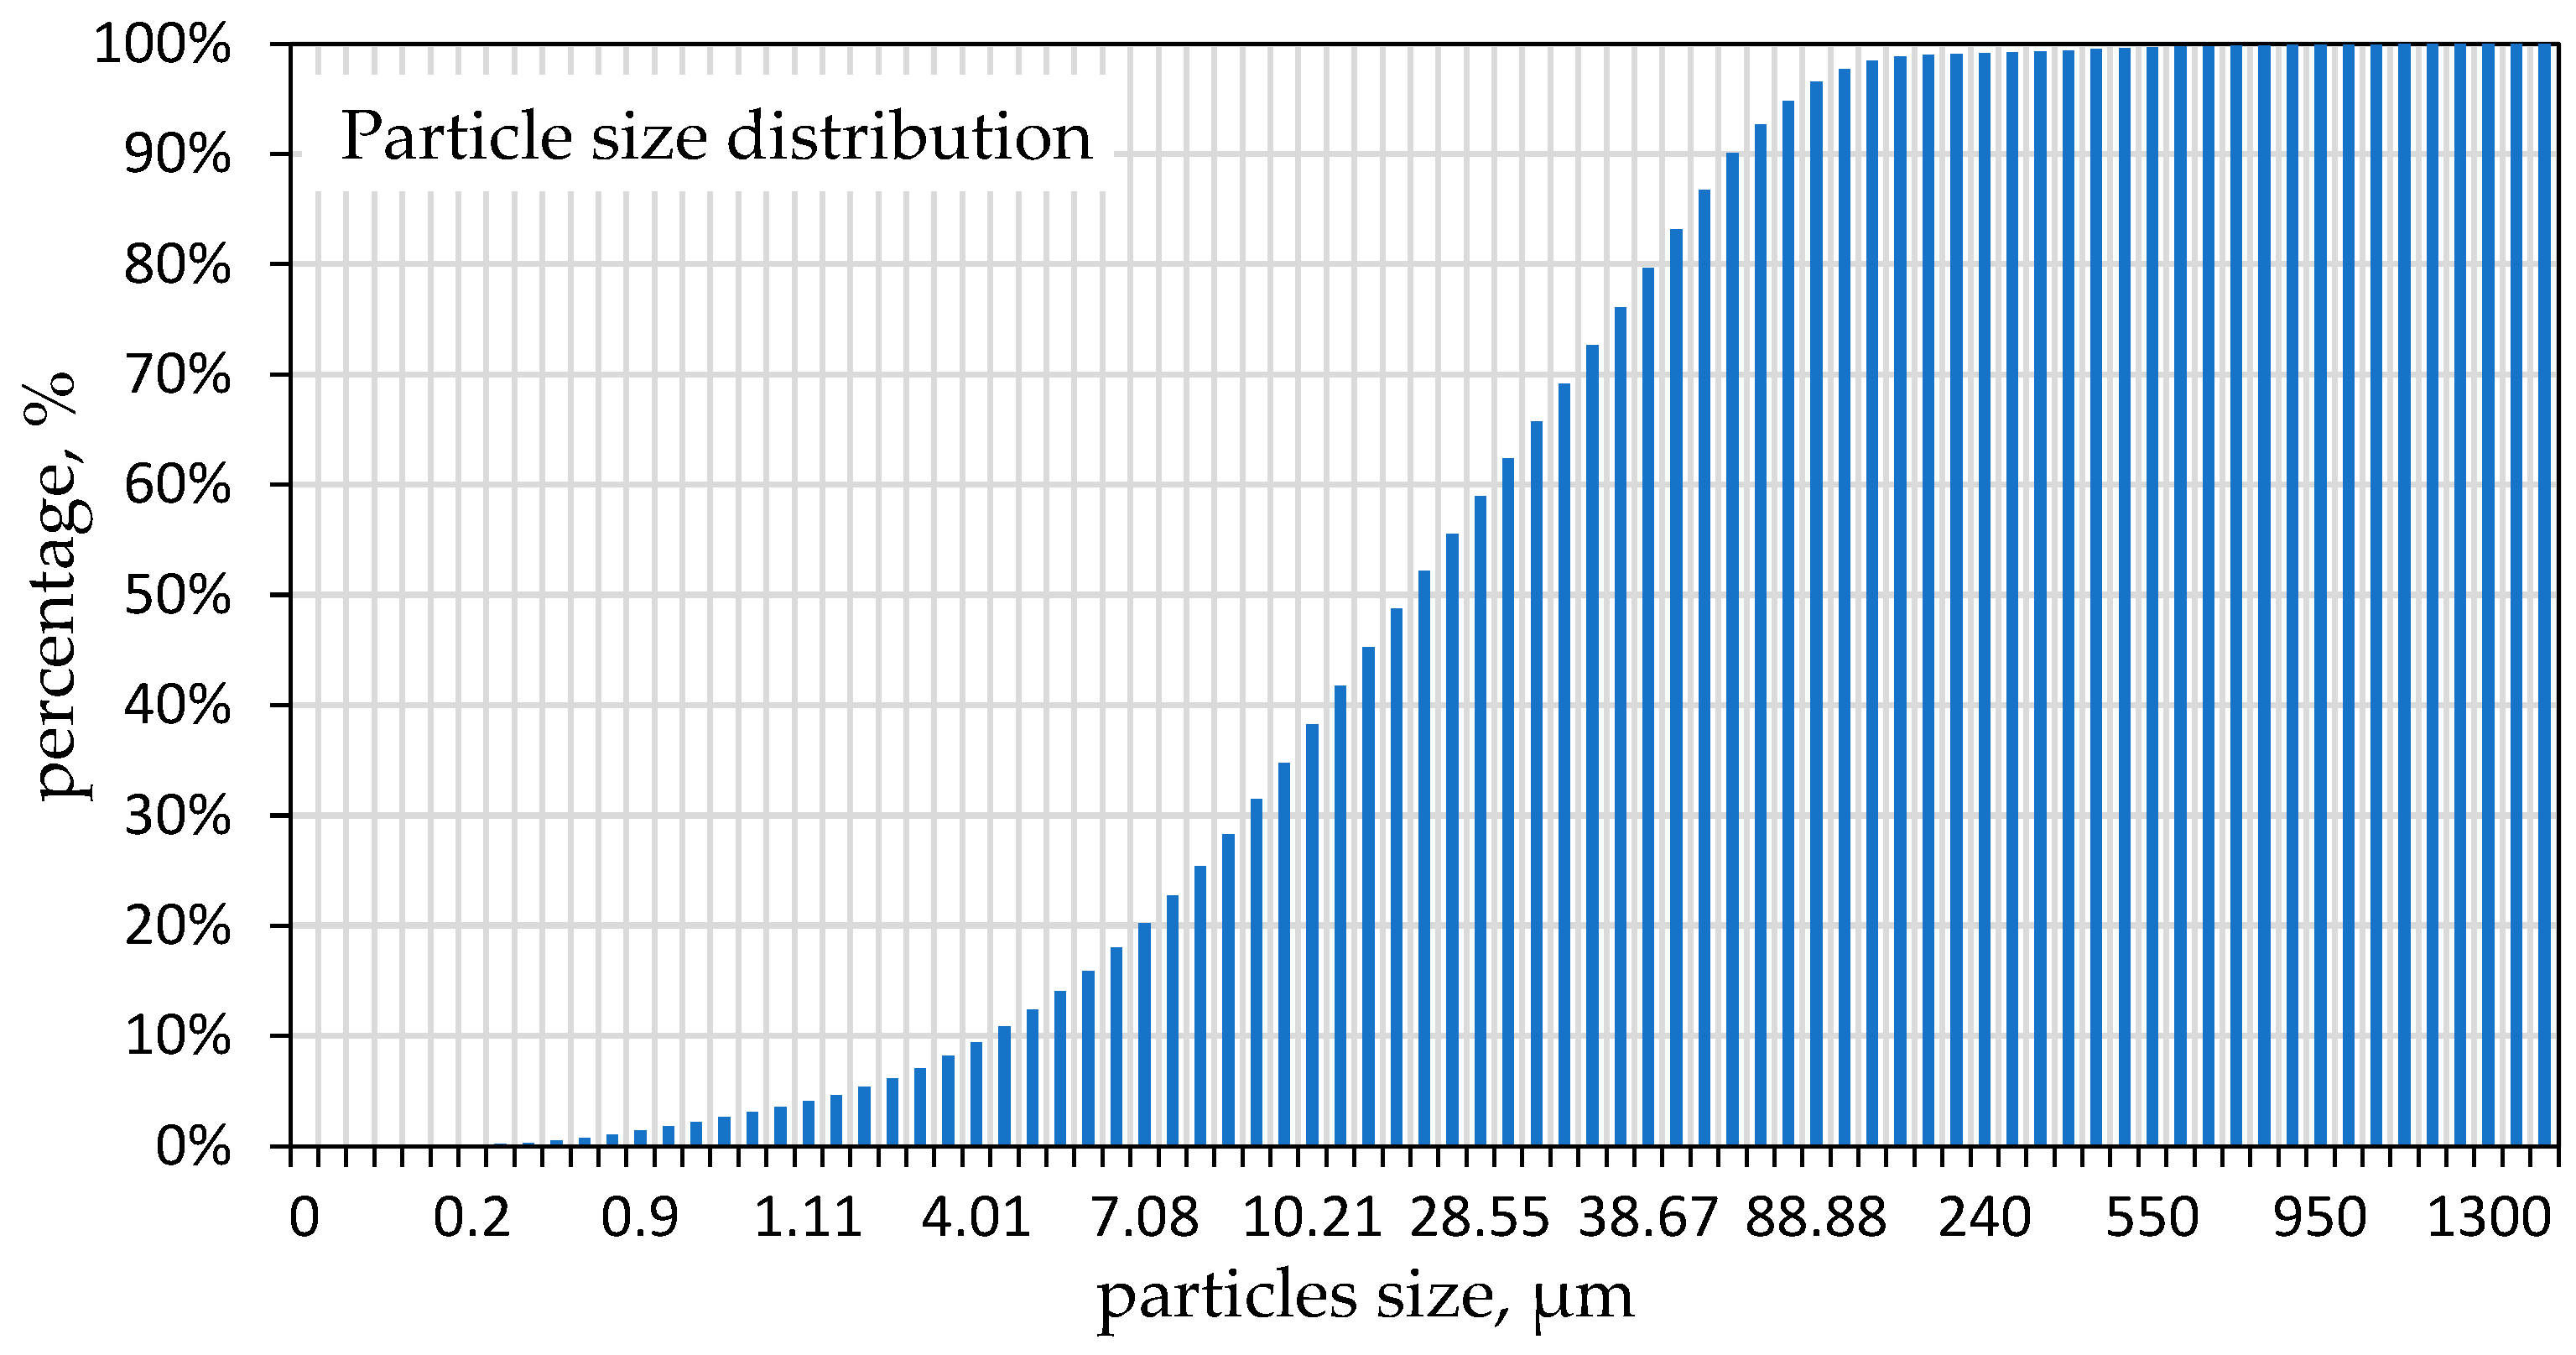
The granulometric composition was determined using Zetasizer Ultra (Malvern Panalytical, Malvern, UK) and is shown in
Figure 2.
As shown in
Figure 2, the particle size was smaller than 1 mm, and most of the particles were larger than 10 µm. Less than 8% were PM 2.5, and 30% were PM 10. The rest of them aggregated in weather conditions and aging, so 10% of the particles were larger than 2 mm in diameter. On the other side, the Jarosite waste stored in the open tailing damp became very dry in the summer, which also contributed to airborne dispersion.
For the purpose of modeling, the source was characterized as pollutant TSP and PM 10, Source Type AREA, and polygon was limited by X and Y coordinates.
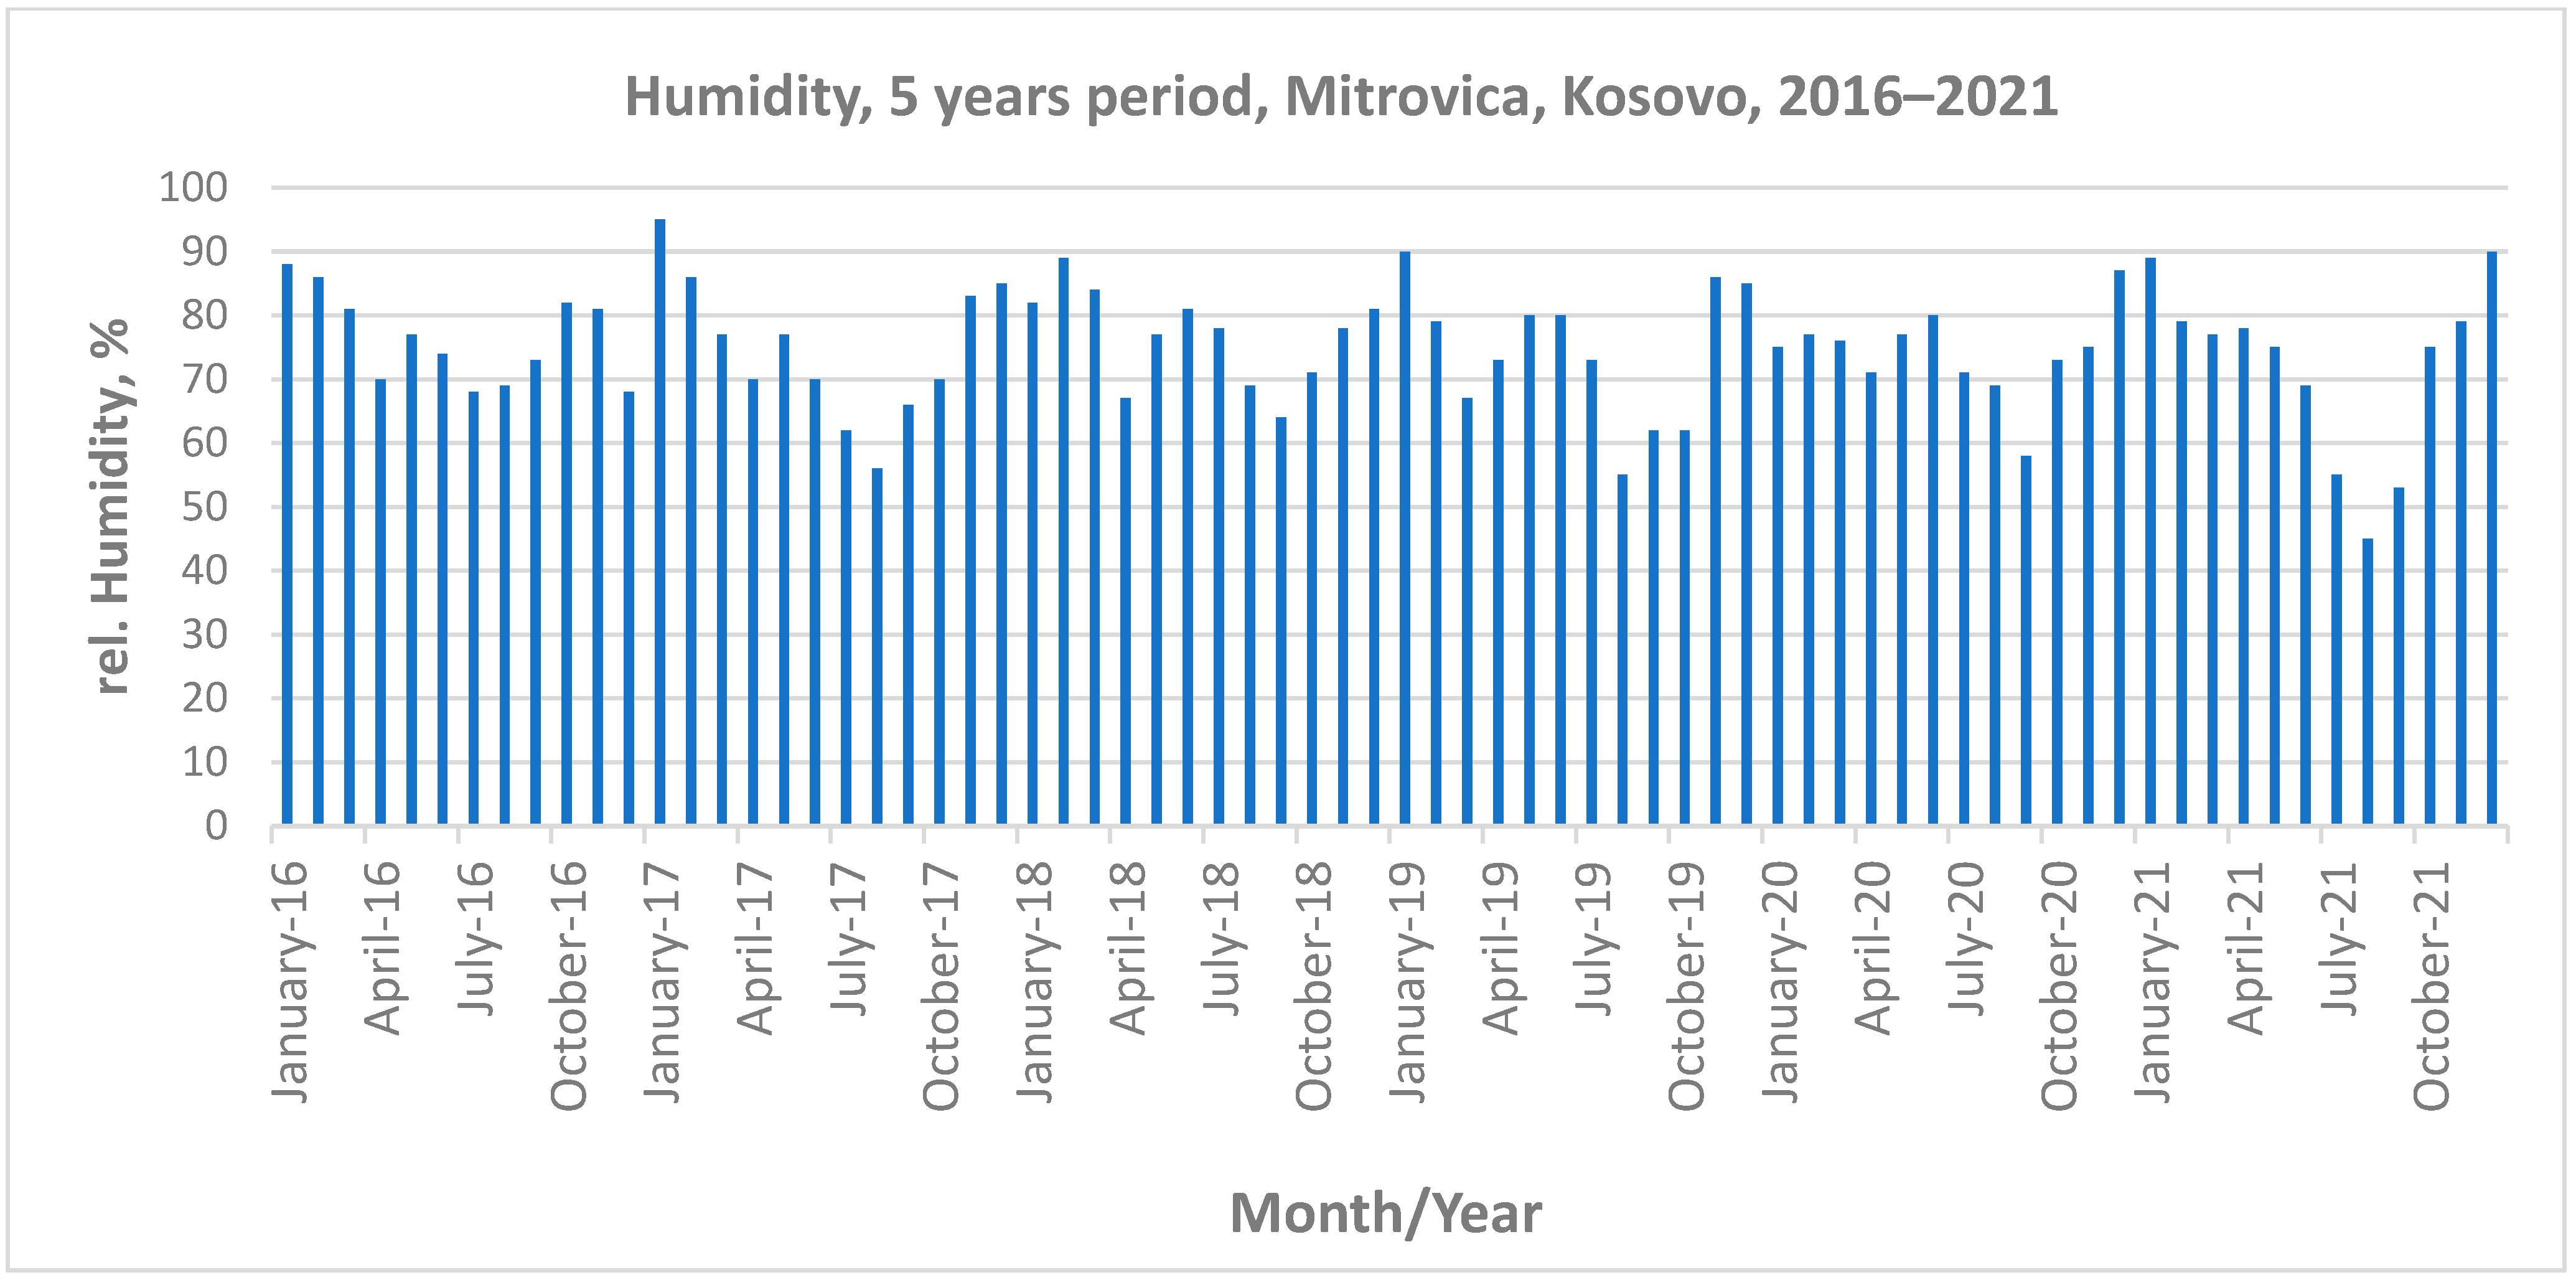
2.4. Meteorological Data-Climate Characteristics for the Mitrovica Region
In recent years, there has been a trend of decreasing lowest relative humidity data in the summer months. In addition, the humidity data have varied from season to season. The relative humidity data during the last 5 years for the Mitrovica region are presented in
Figure 3.
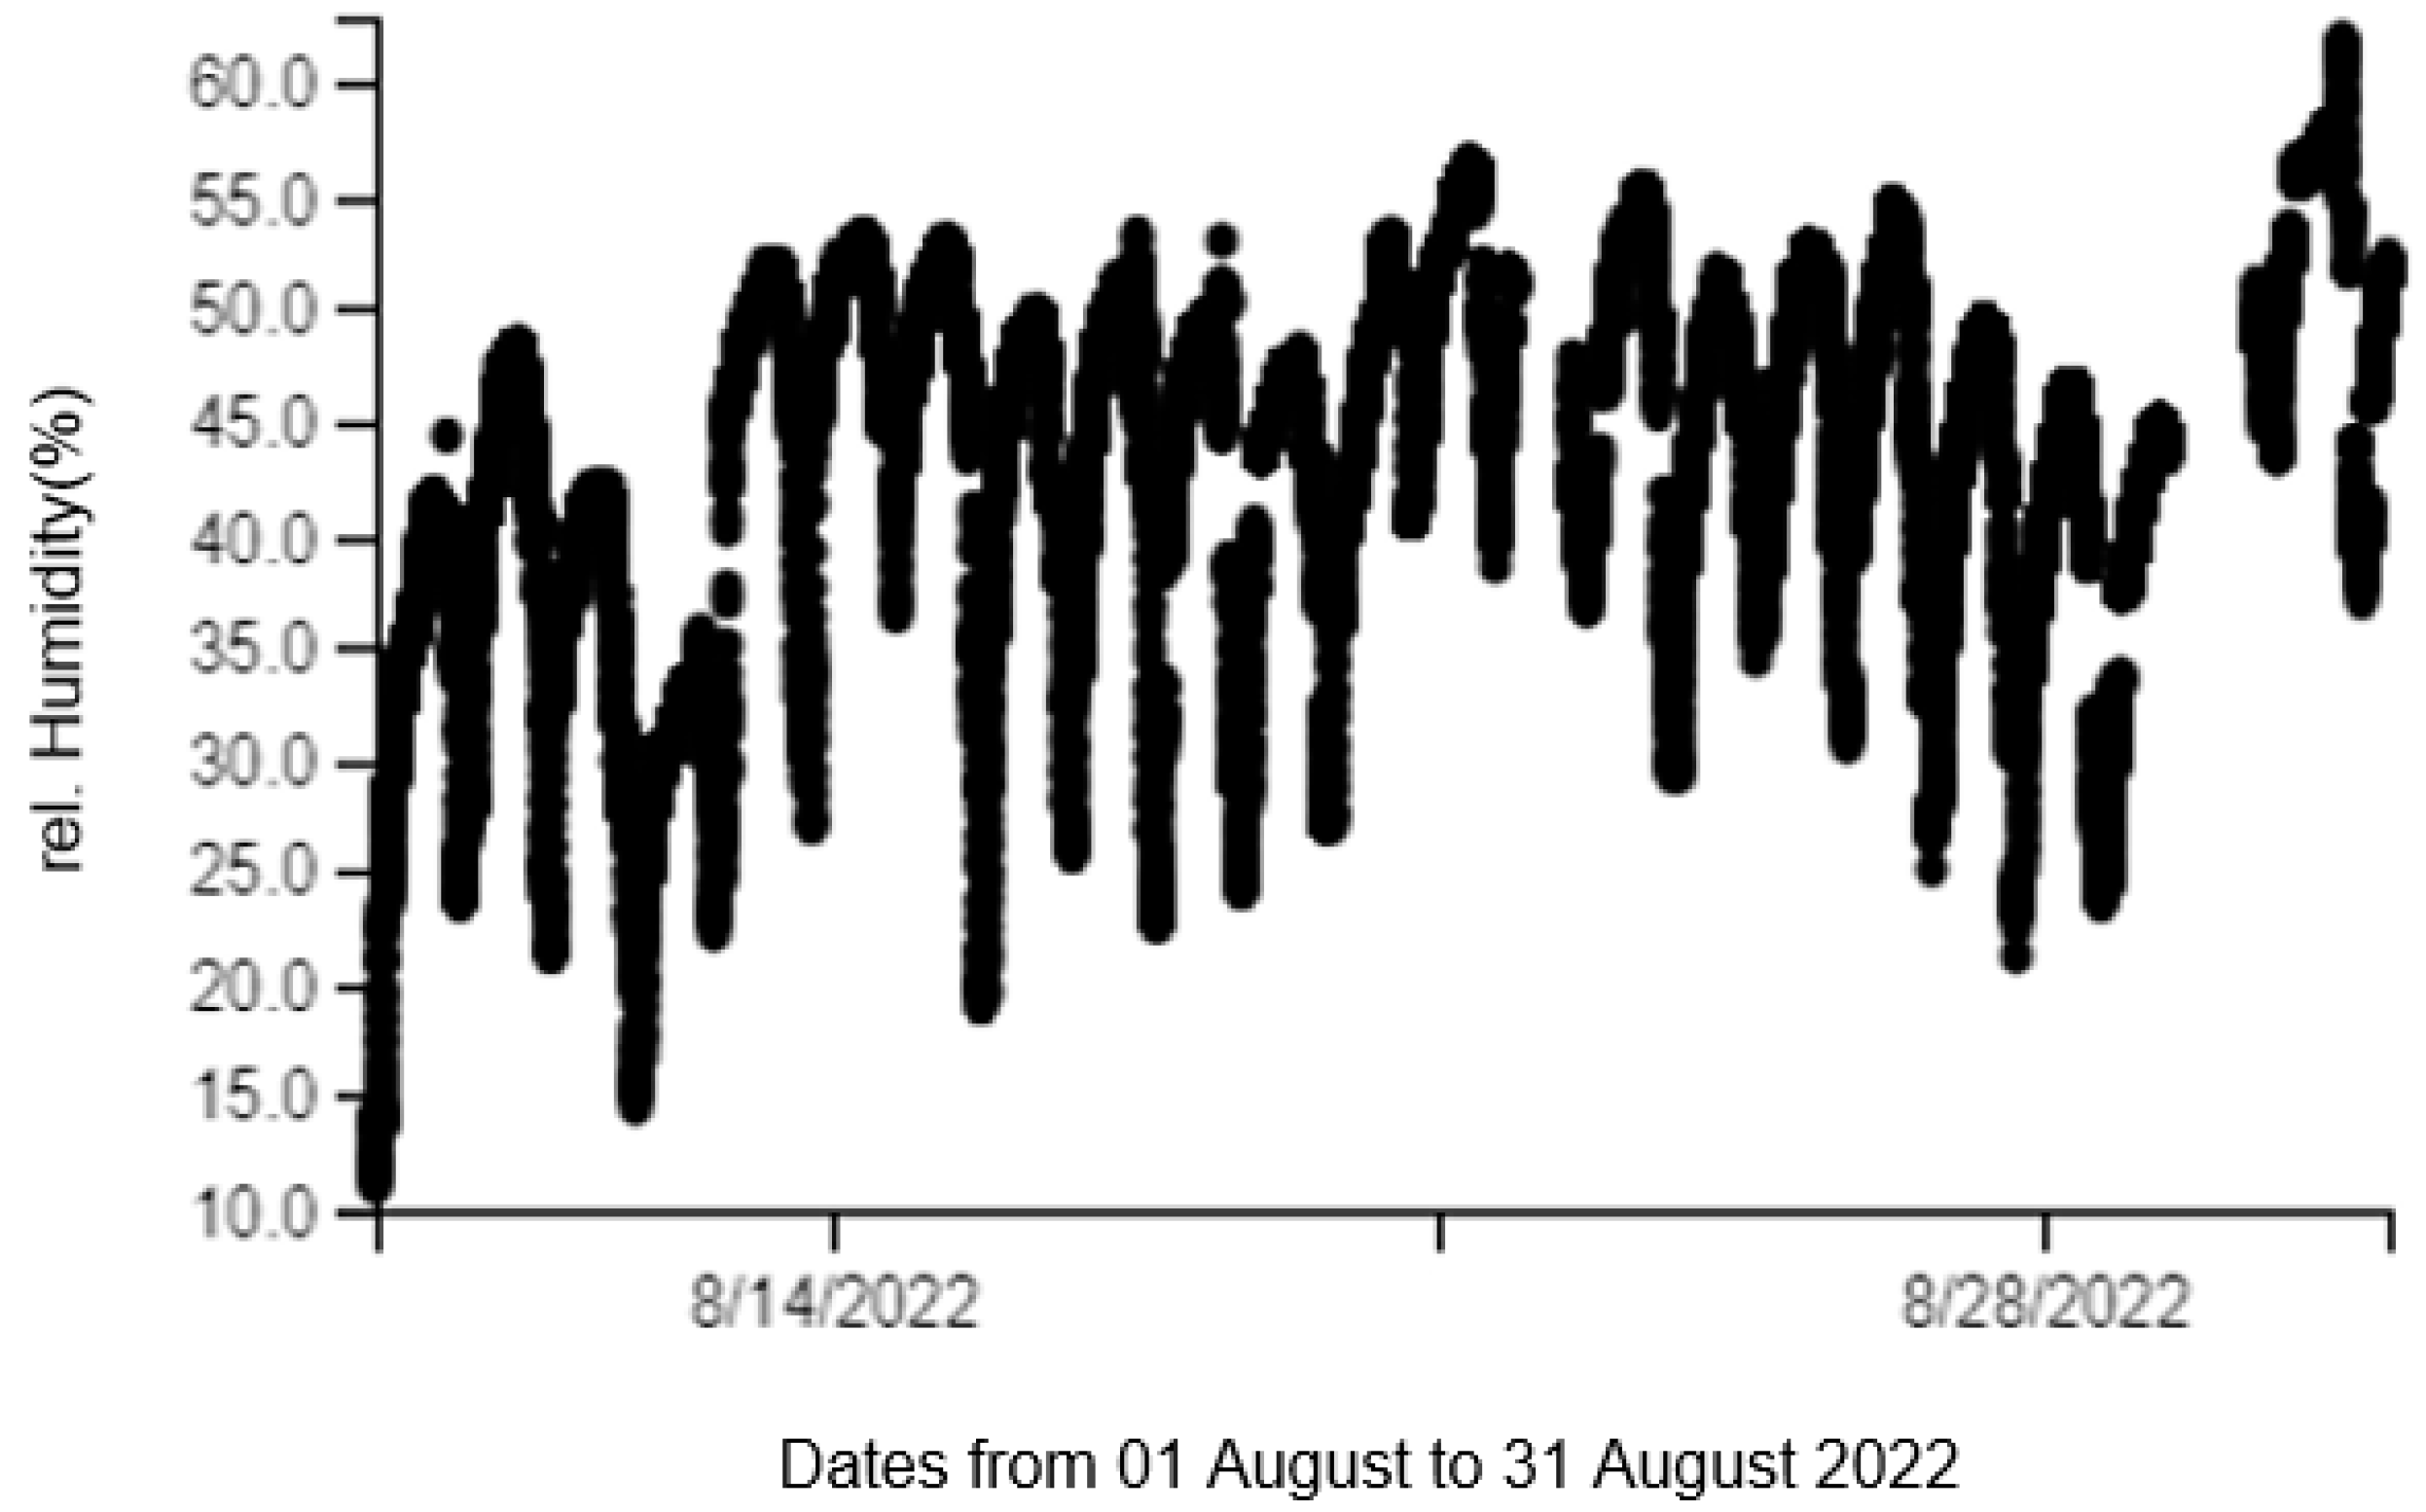
Even though the relative humidity recorded in the last three decades did not show any significant change, there are oscillations in the recorded data in different seasons, showing that winter and autumn seasons bring more precipitation and that July and August are the driest months of the year. The chart shows the average relative humidity for each month during the 5-year period. Overall, 2022 was recorded as extremely dry, the minimum values recorded in August were much lower, and the minimum relative humidity in the close vicinity of the deposit was recorded to be less than 30%, as shown in
Figure 4. The data were recorded in the real-time probe in the remote sensing system every 2.5 min, showing significant differences during the day. The results correspond well with the PM 2.5 and PM 10 measurements during August measured at the meteorological station, as shown in
Figure 1. For the purpose of including other possible sources of pollution, the average TSP concentrations were taken into consideration. The probe located at the International Business College building collects data, and those data are processed for a 1-year period. The average TSP concentration in the air was calculated to be 21 µg m
−3. Further investigation has determined the origins of these particles as traffic, demolition and construction waste, and individual heating during the winter time.
Meteorological input data were taken from the Meteorological station Mitrovica, Hydrometeorological Institute of Kosovo. The base elevation was 495 m.
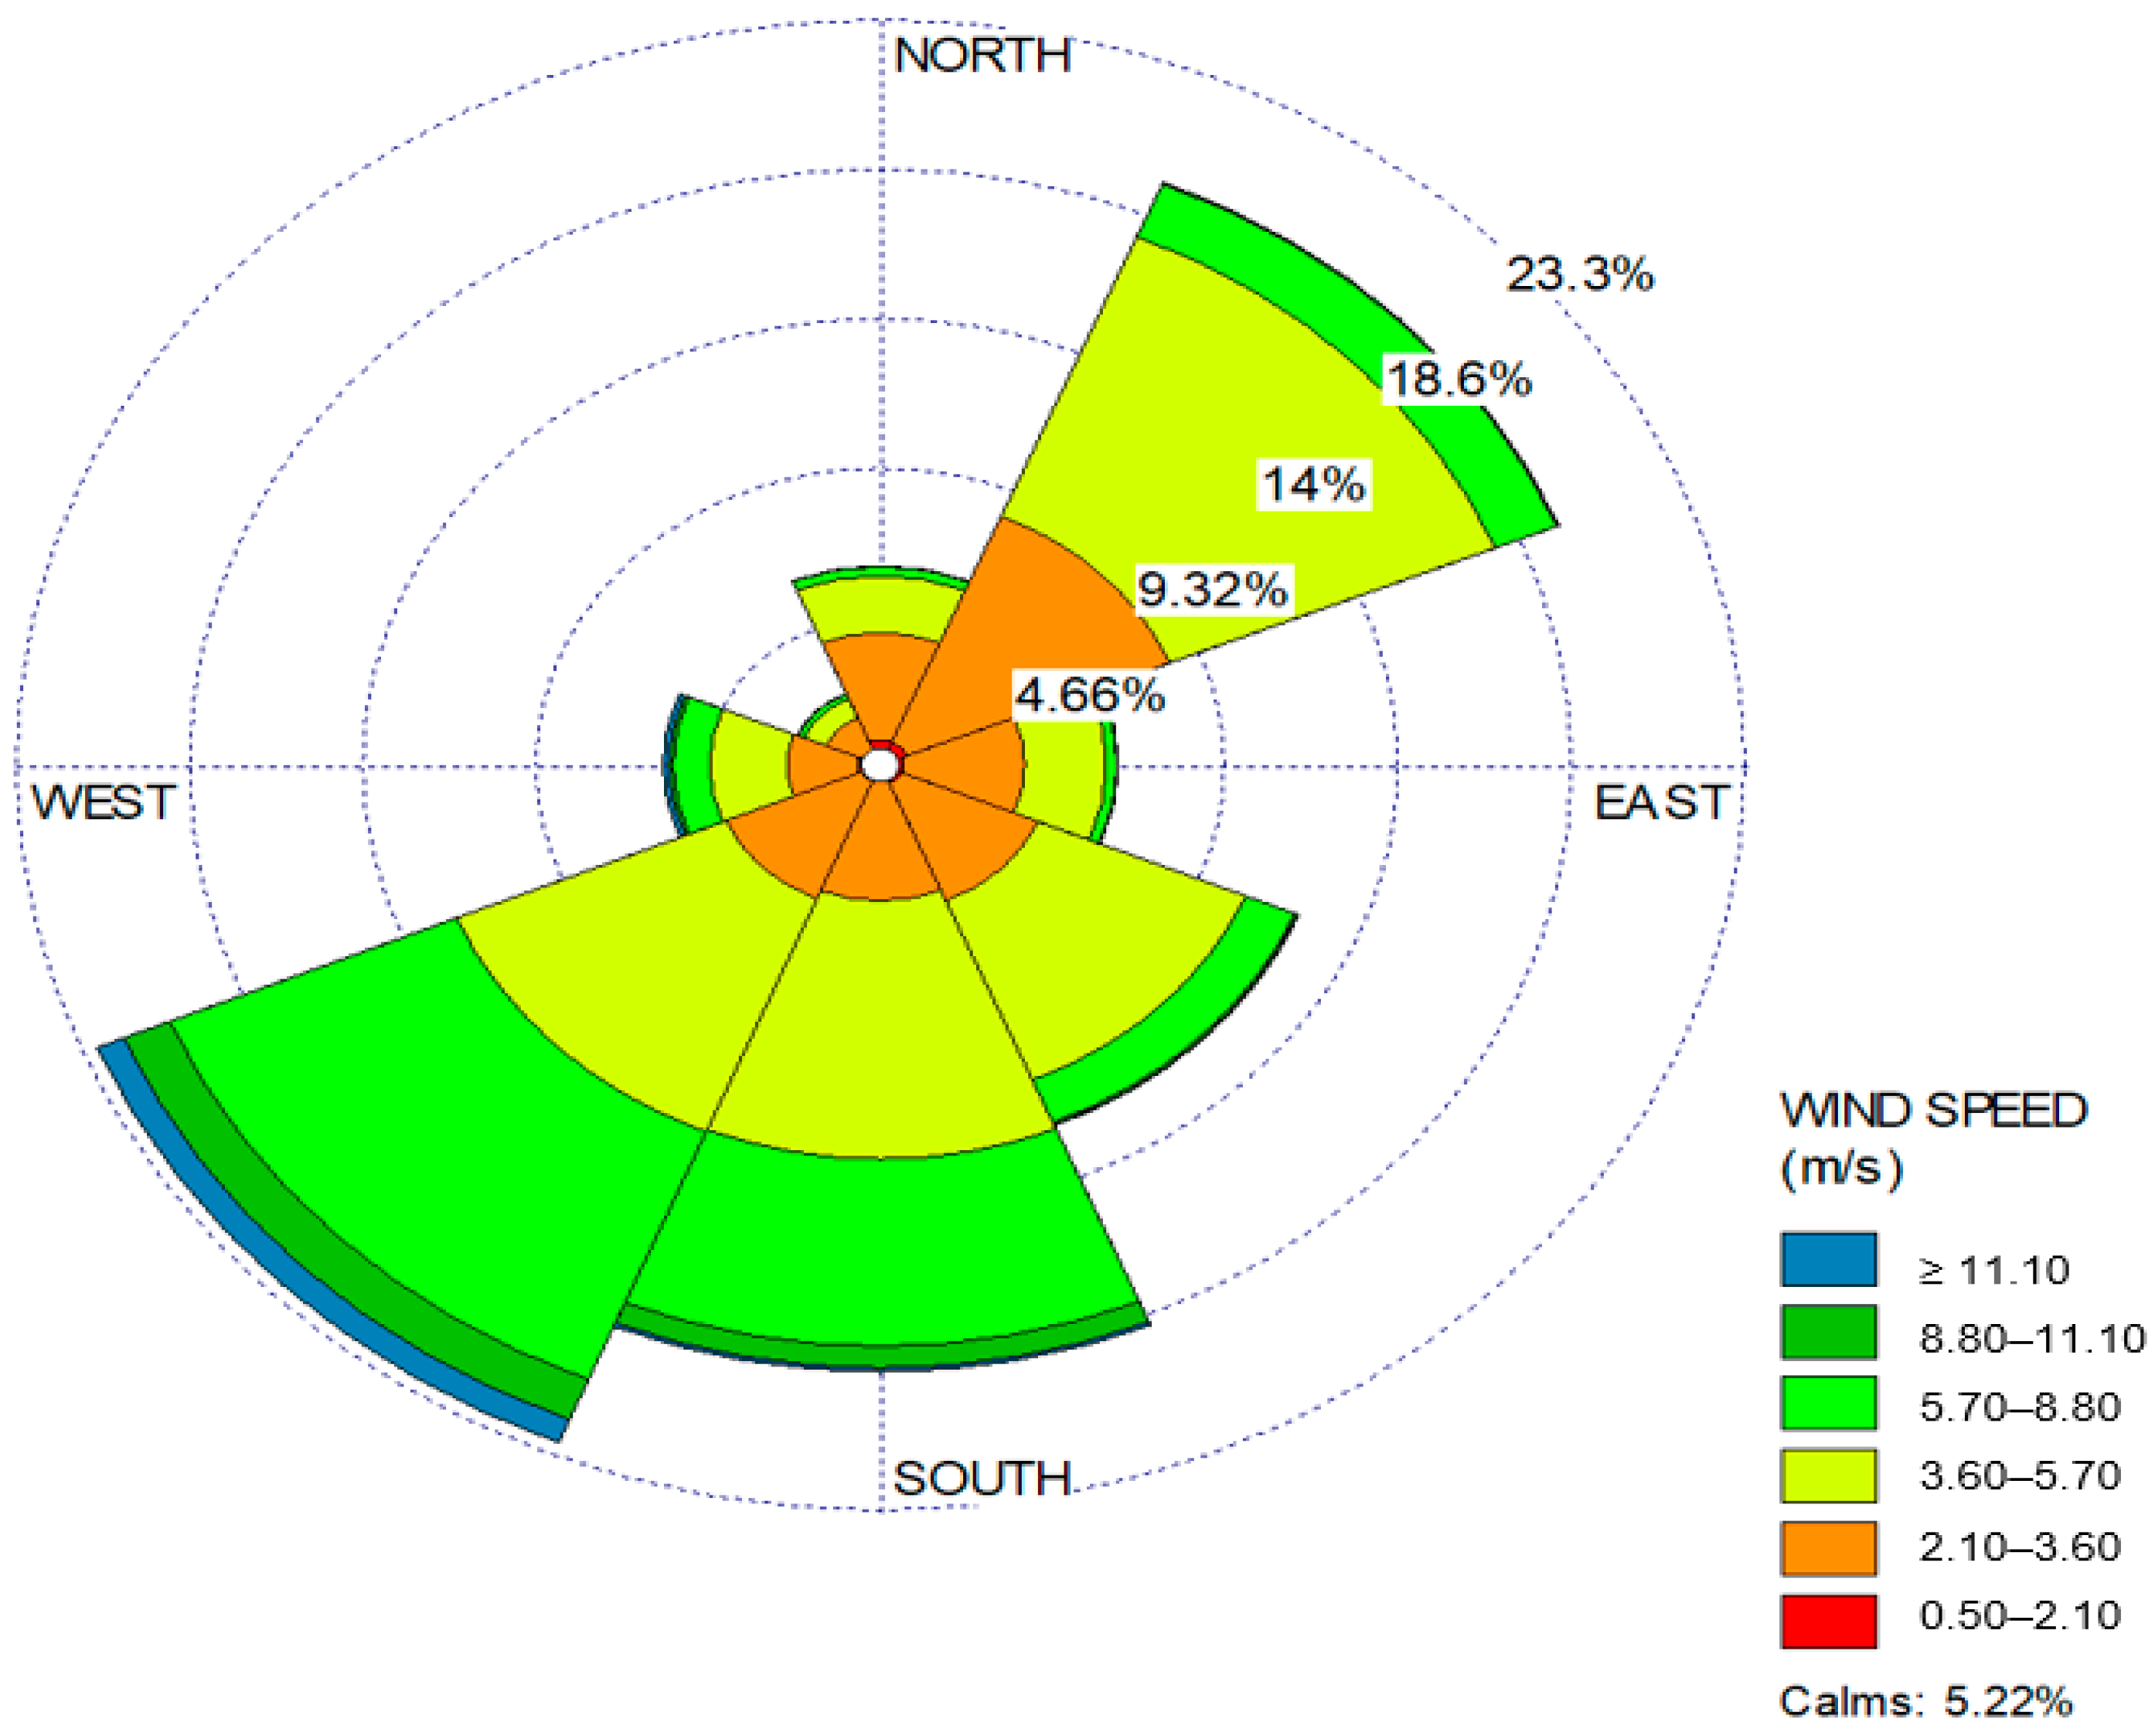
Figure 5 presents the wind rose for the Mitrovica region based on the wind blowing from the indicated direction. The wind blows from southwest to northeast. Southern winds have a characteristic of the strong west wind, but southwestern winds also increase in frequency and speed toward the northeast. This situation is reflected during the summer, usually when strong hot winds blow from the Mediterranean area accompanied by hot and dry weather.
2.5. Measurements of Solid Particles Emission within the Given Climate Conditions
The apparatus for the measuring of solid particles carried by the wind was composed of the fan type ABVE-3.5 with a flow of 3600 m
3 h
−1, a vacuum of 200 Pa used for airflow simulation, and a gravimetric sampler of the respiratory dust. The sample was set in a shallow metal plate with a measuring scale for the captured TSP and digital anemometer (DA-4000). The measurements were performed in the airflow directed from the fan before the apparatus for air vacuuming. The wind speed was changed by changing the distance between the fan and the sample. The experiment was conducted at the wind speed of 5, 7, and 10 m s
−1. The humidity in the laboratory was within the interval of 28–56%, and the dusting was 0% (
Table 3).
3. Results
In extreme weather conditions, a wind speed stronger than 10 m s−1 is expected, and there are no data on pollution in these climatic conditions. The potentially unstable weather was taken into consideration for modeling. The distance of 5000 m from the source of the pollution jarosite waste deposit was set for discrete distance calculations.
The simulation was performed using the Gaussian Plume Air Dispersion Model AERMOD. AERMOD incorporates, with a new simple approach, current concepts about flow and dispersion in complex terrain. In this case, the plume is modeled and presents the impacting and following terrain.
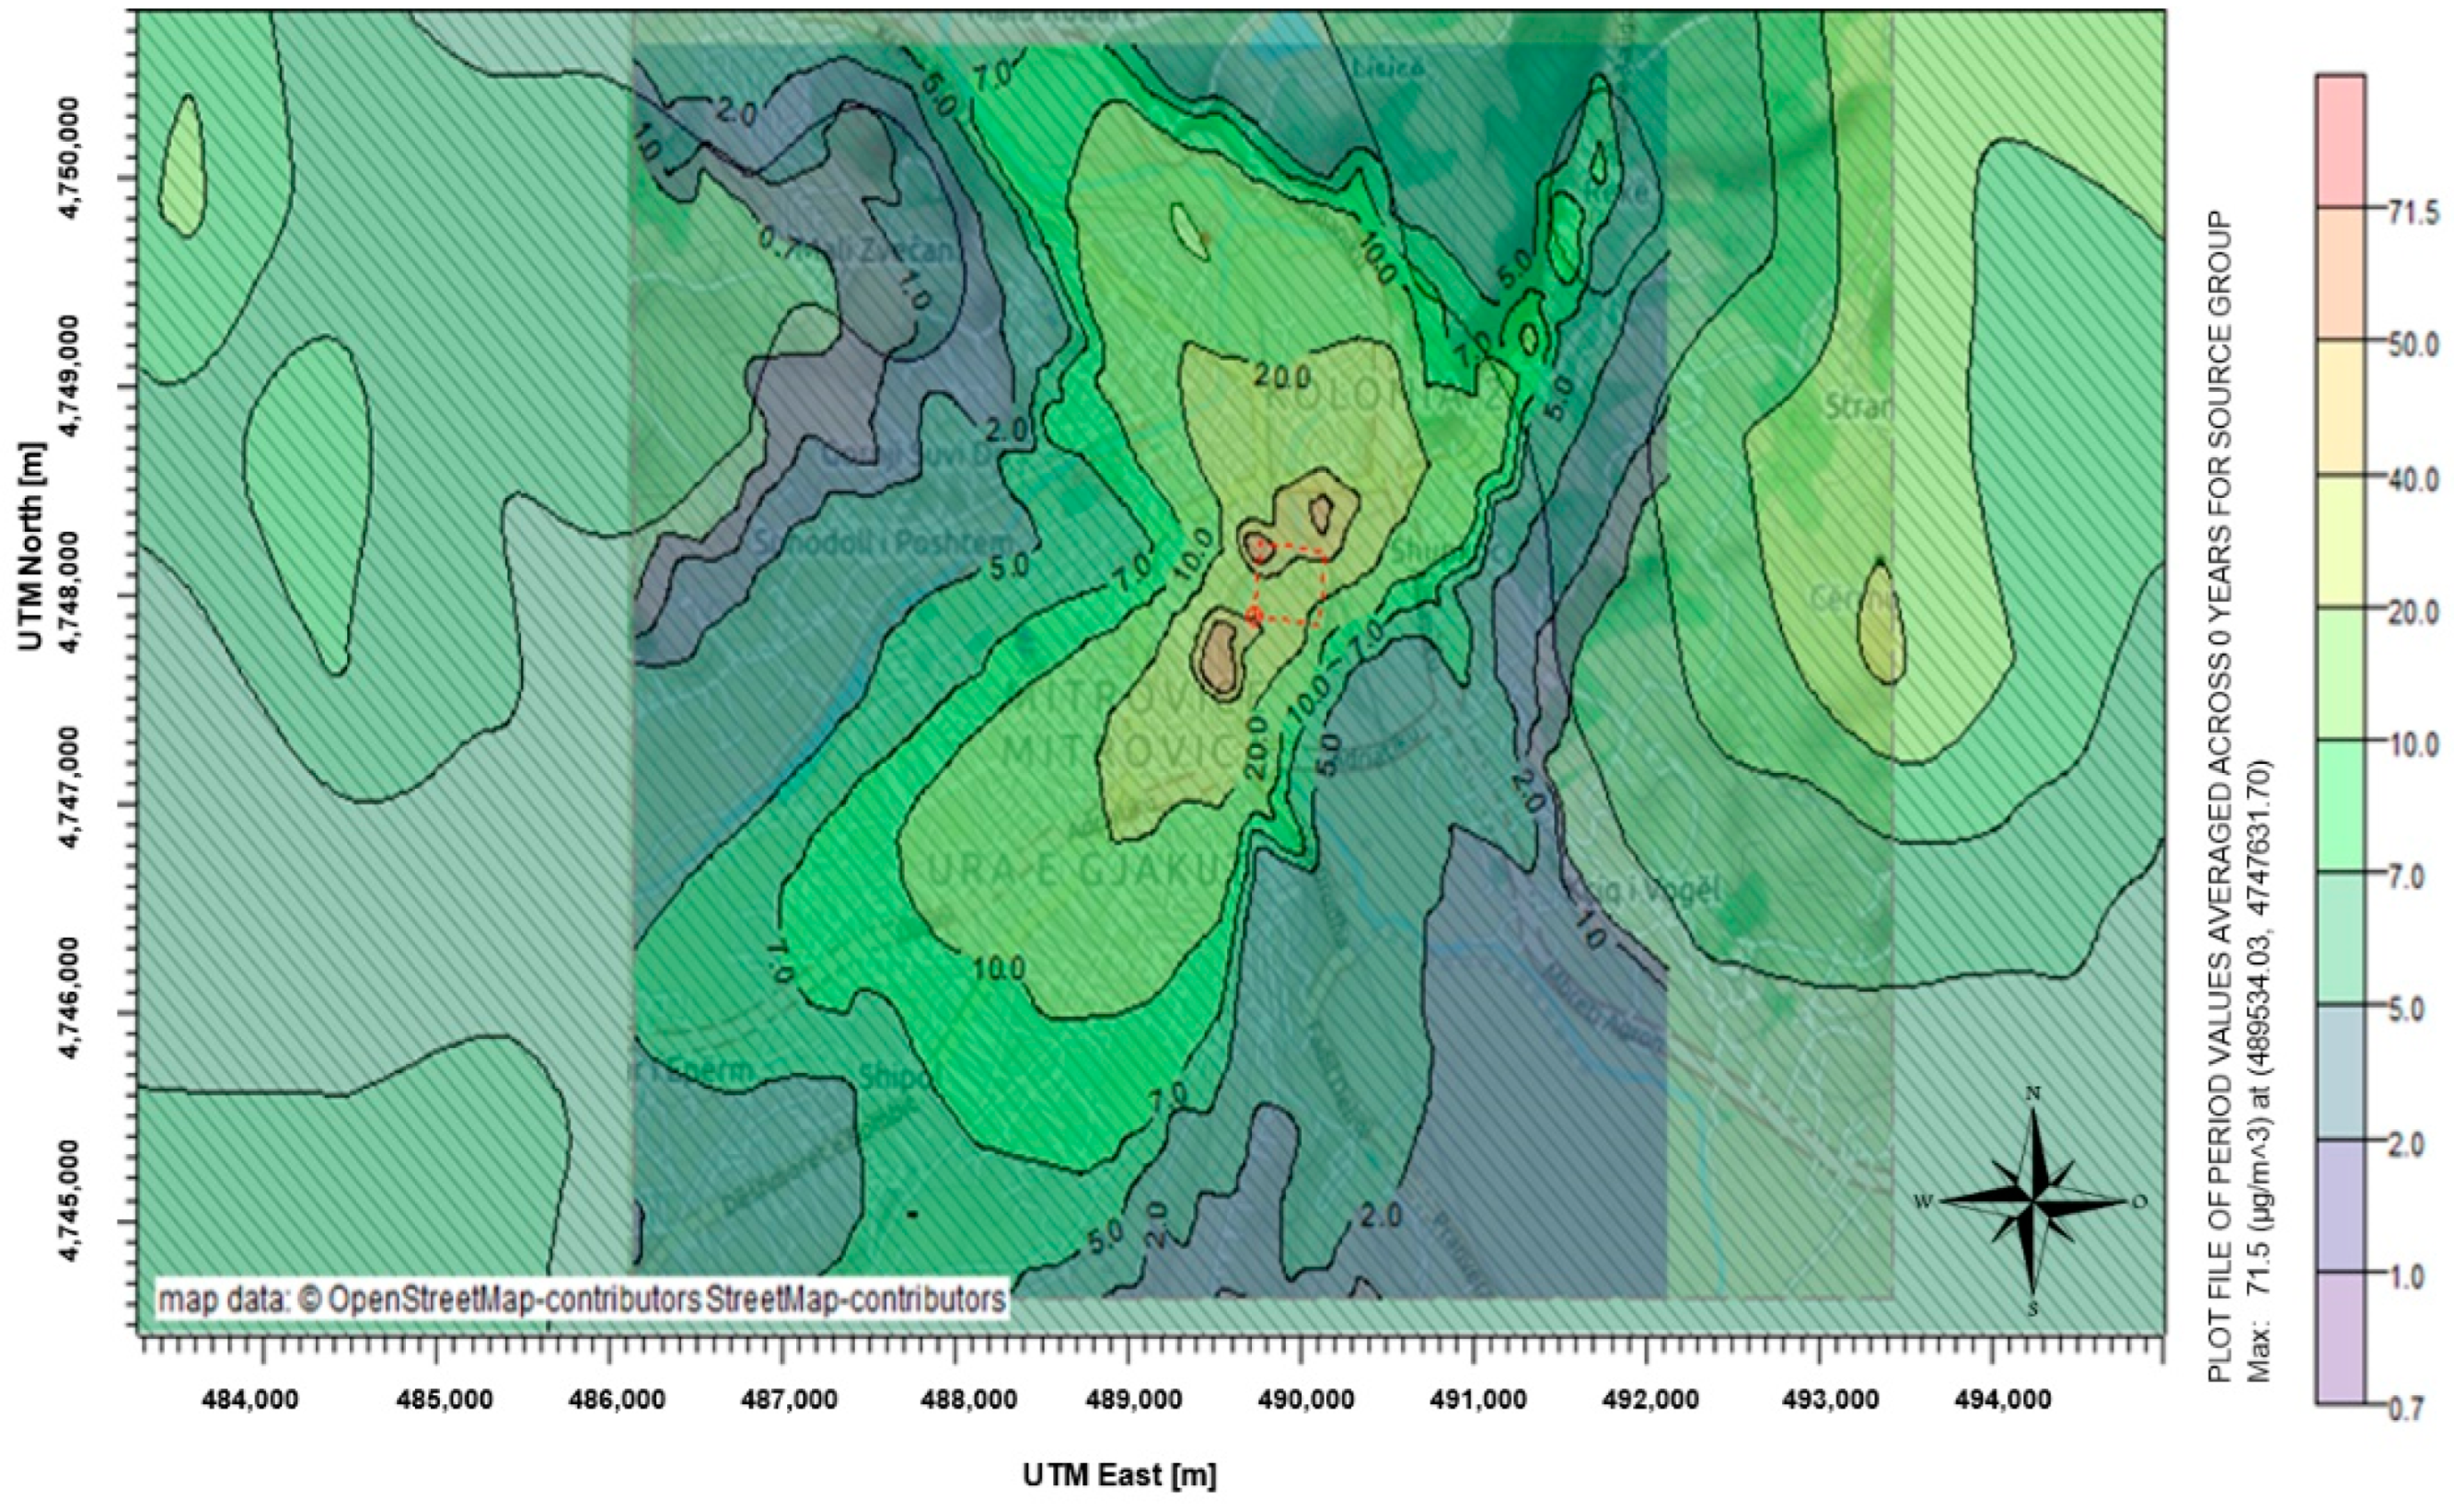
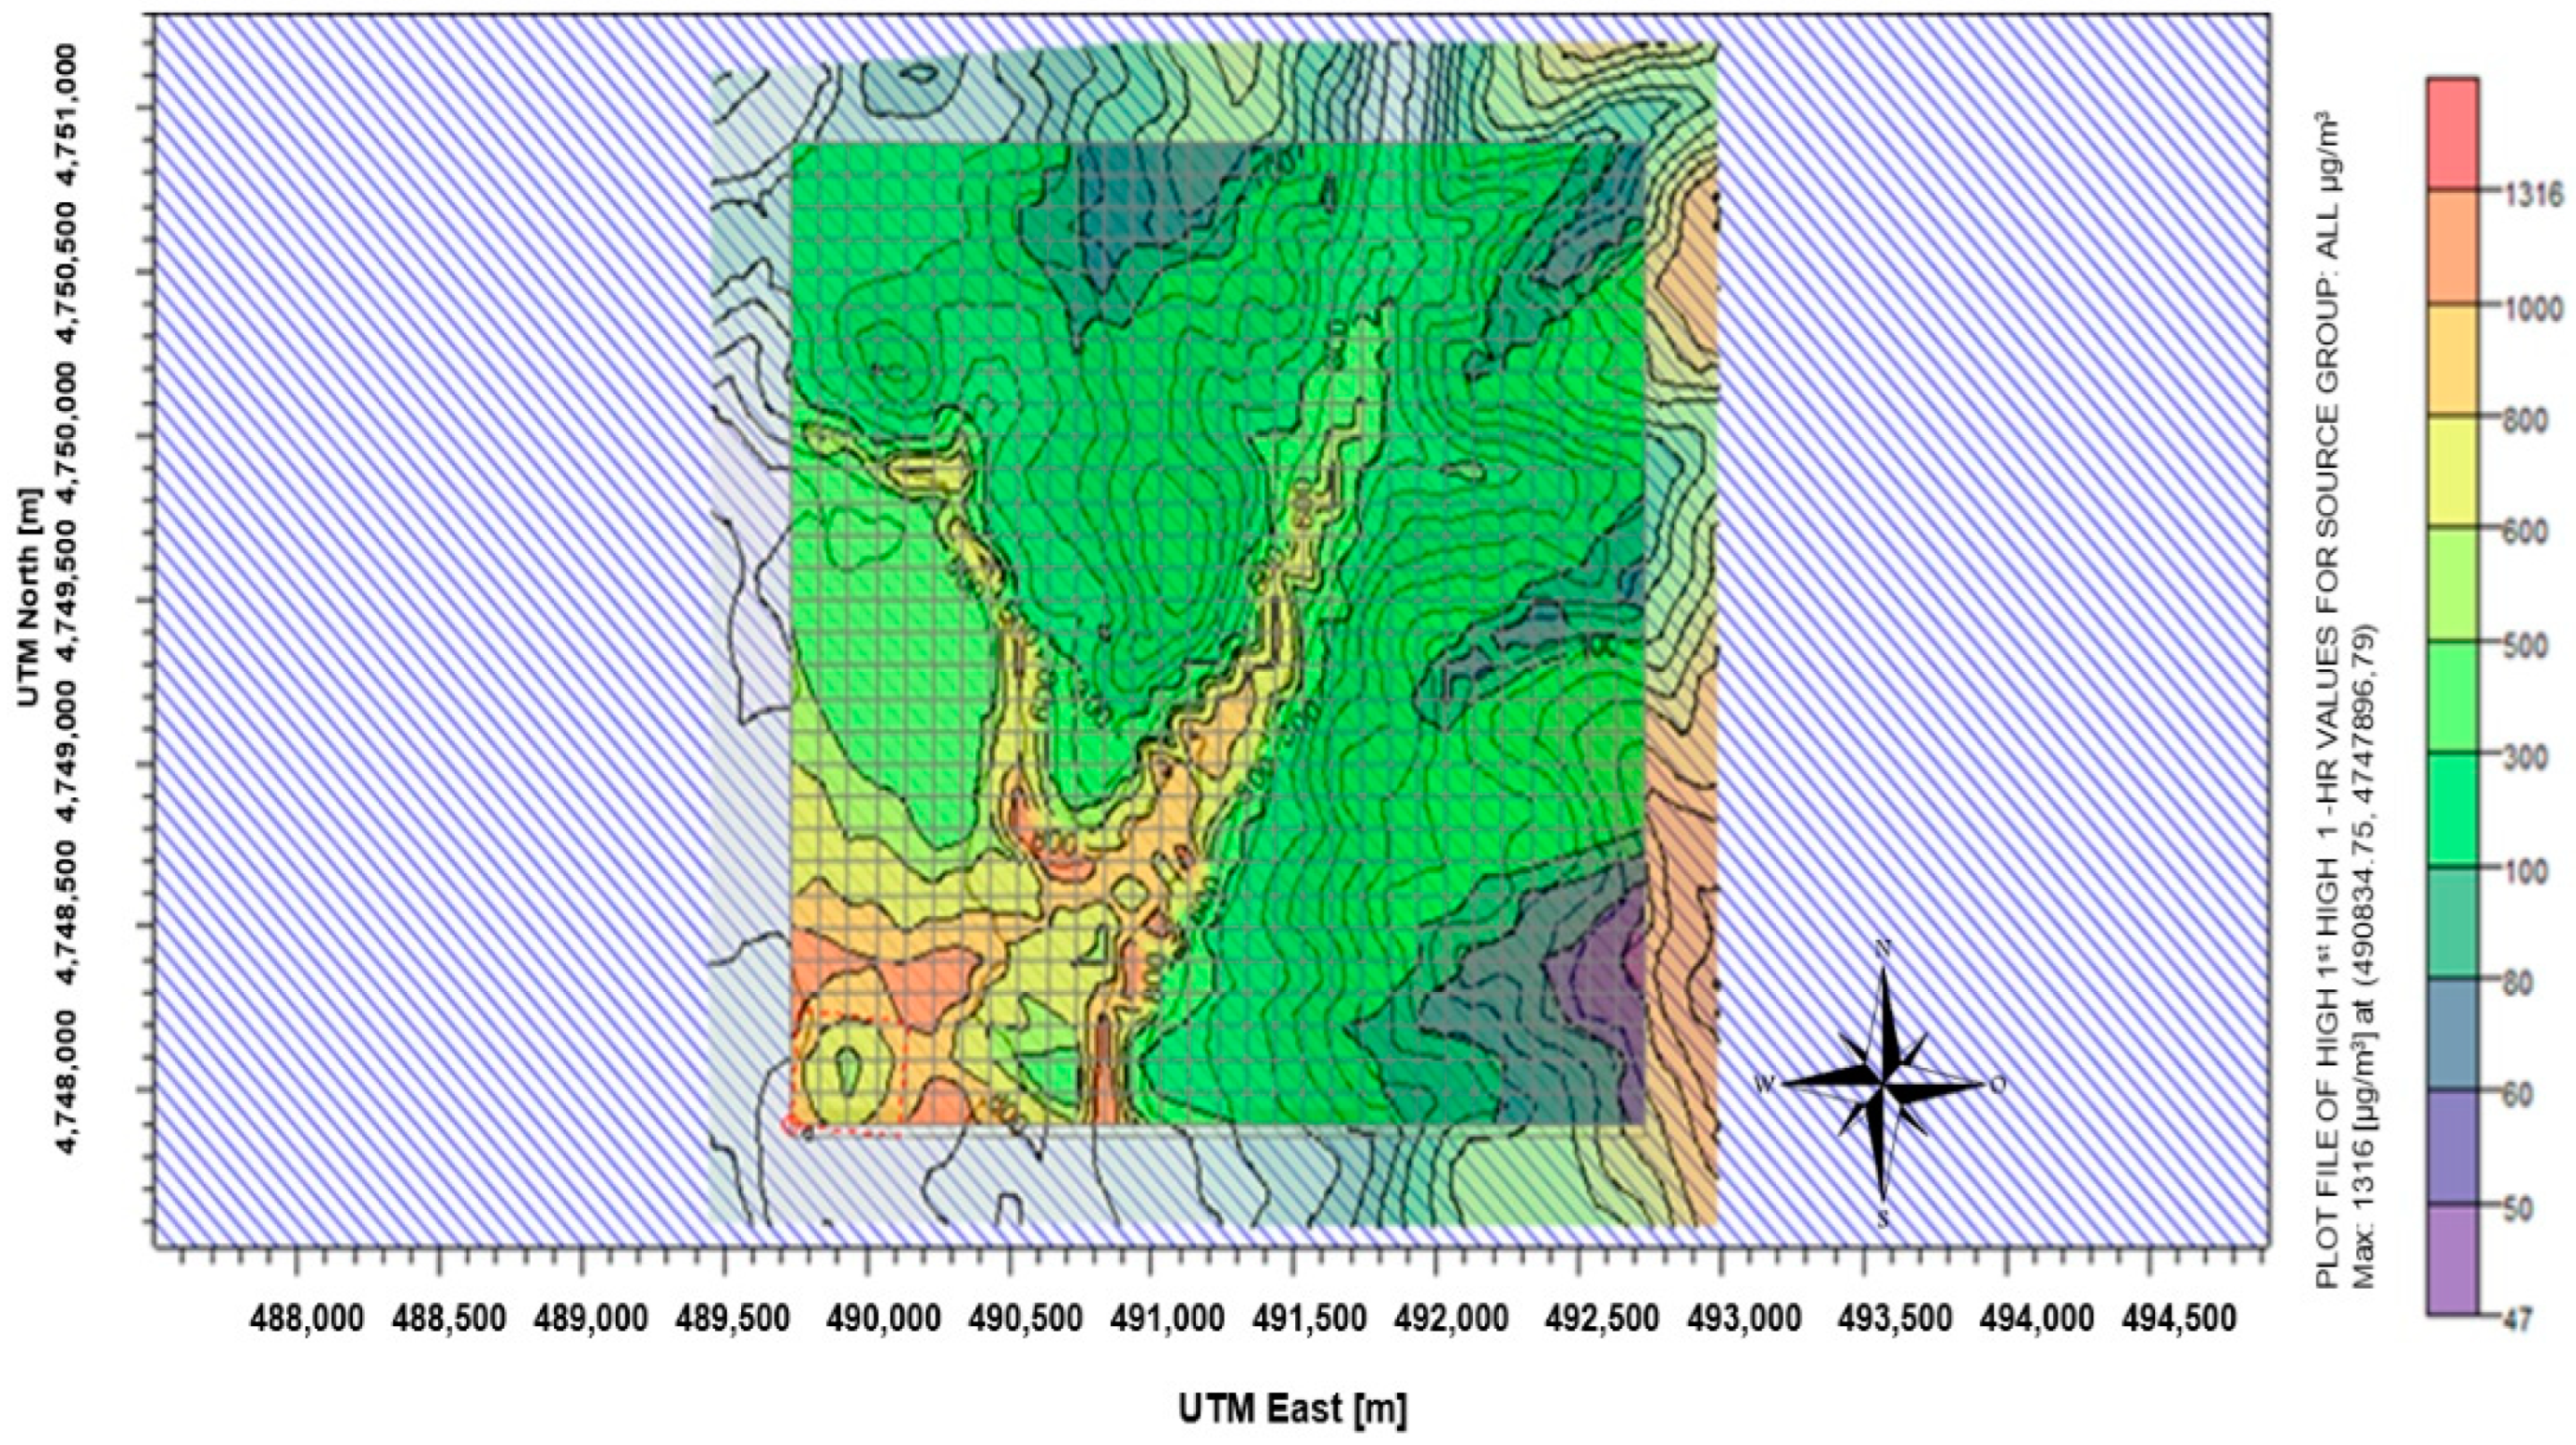
Figure 6 shows that there is significant air pollution only in the close vicinity of the deposit. The dashed line marks the jarosite waste deposit. The figure is the result of modeling with the AERMOD software, and it shows the results of the simulation of the particle concentration on the grid of receptors. The receptors grid was set as the Uniform Cartesian grid receptor network, covering an area with a diameter of 6000 m starting from the center of the deposit. The receptors were set at a distance of 200 m from each other, with 961 receptors in total. The Map Projection was set in the Project Coordinate System UTM (Universal Transverse Mercator) with parameters taken from the WGS84 World Geodetic System. Universal Transverse Mercator (UTM) are units used to describe the terrain latitude and longitude, and those units are on the X and Y axes. In
Figure 6, the color scale shows the level of concentration, where the concentrations lower than 40,324 µg m
−3 are from yellow to green. The concentrations higher than the EU threshold enter the red part of the spectrum. The constant air dispersion of heavy metals, even in the lower concentration, contributes to soil pollution. The area that was calculated to be the most polluted corresponds with the results of the environmental risk assessment performed with the BCR (the modified European Community Bureau of (BCR) five-step sequential extraction procedure) [
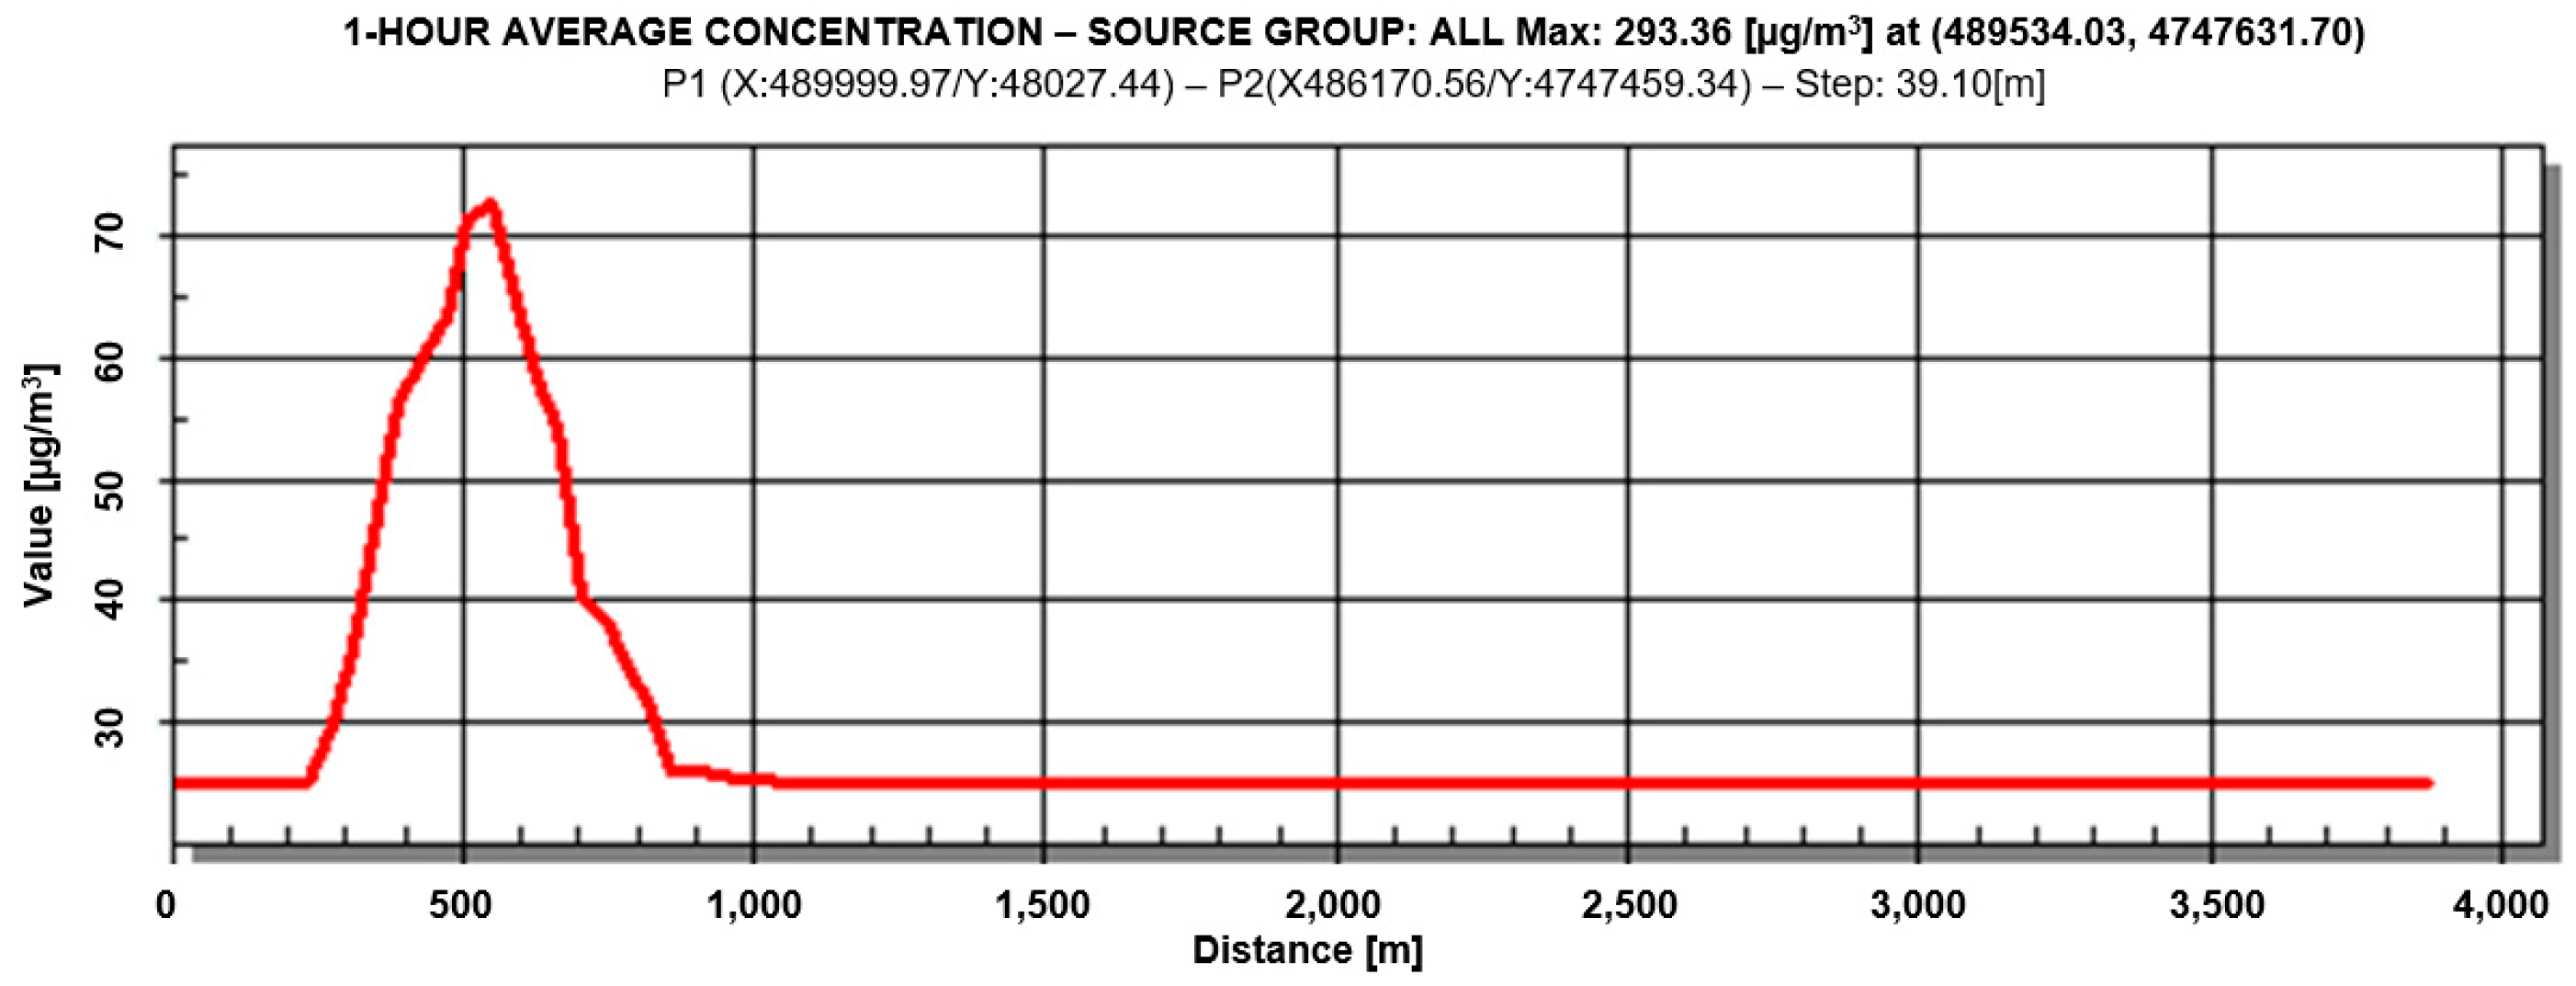
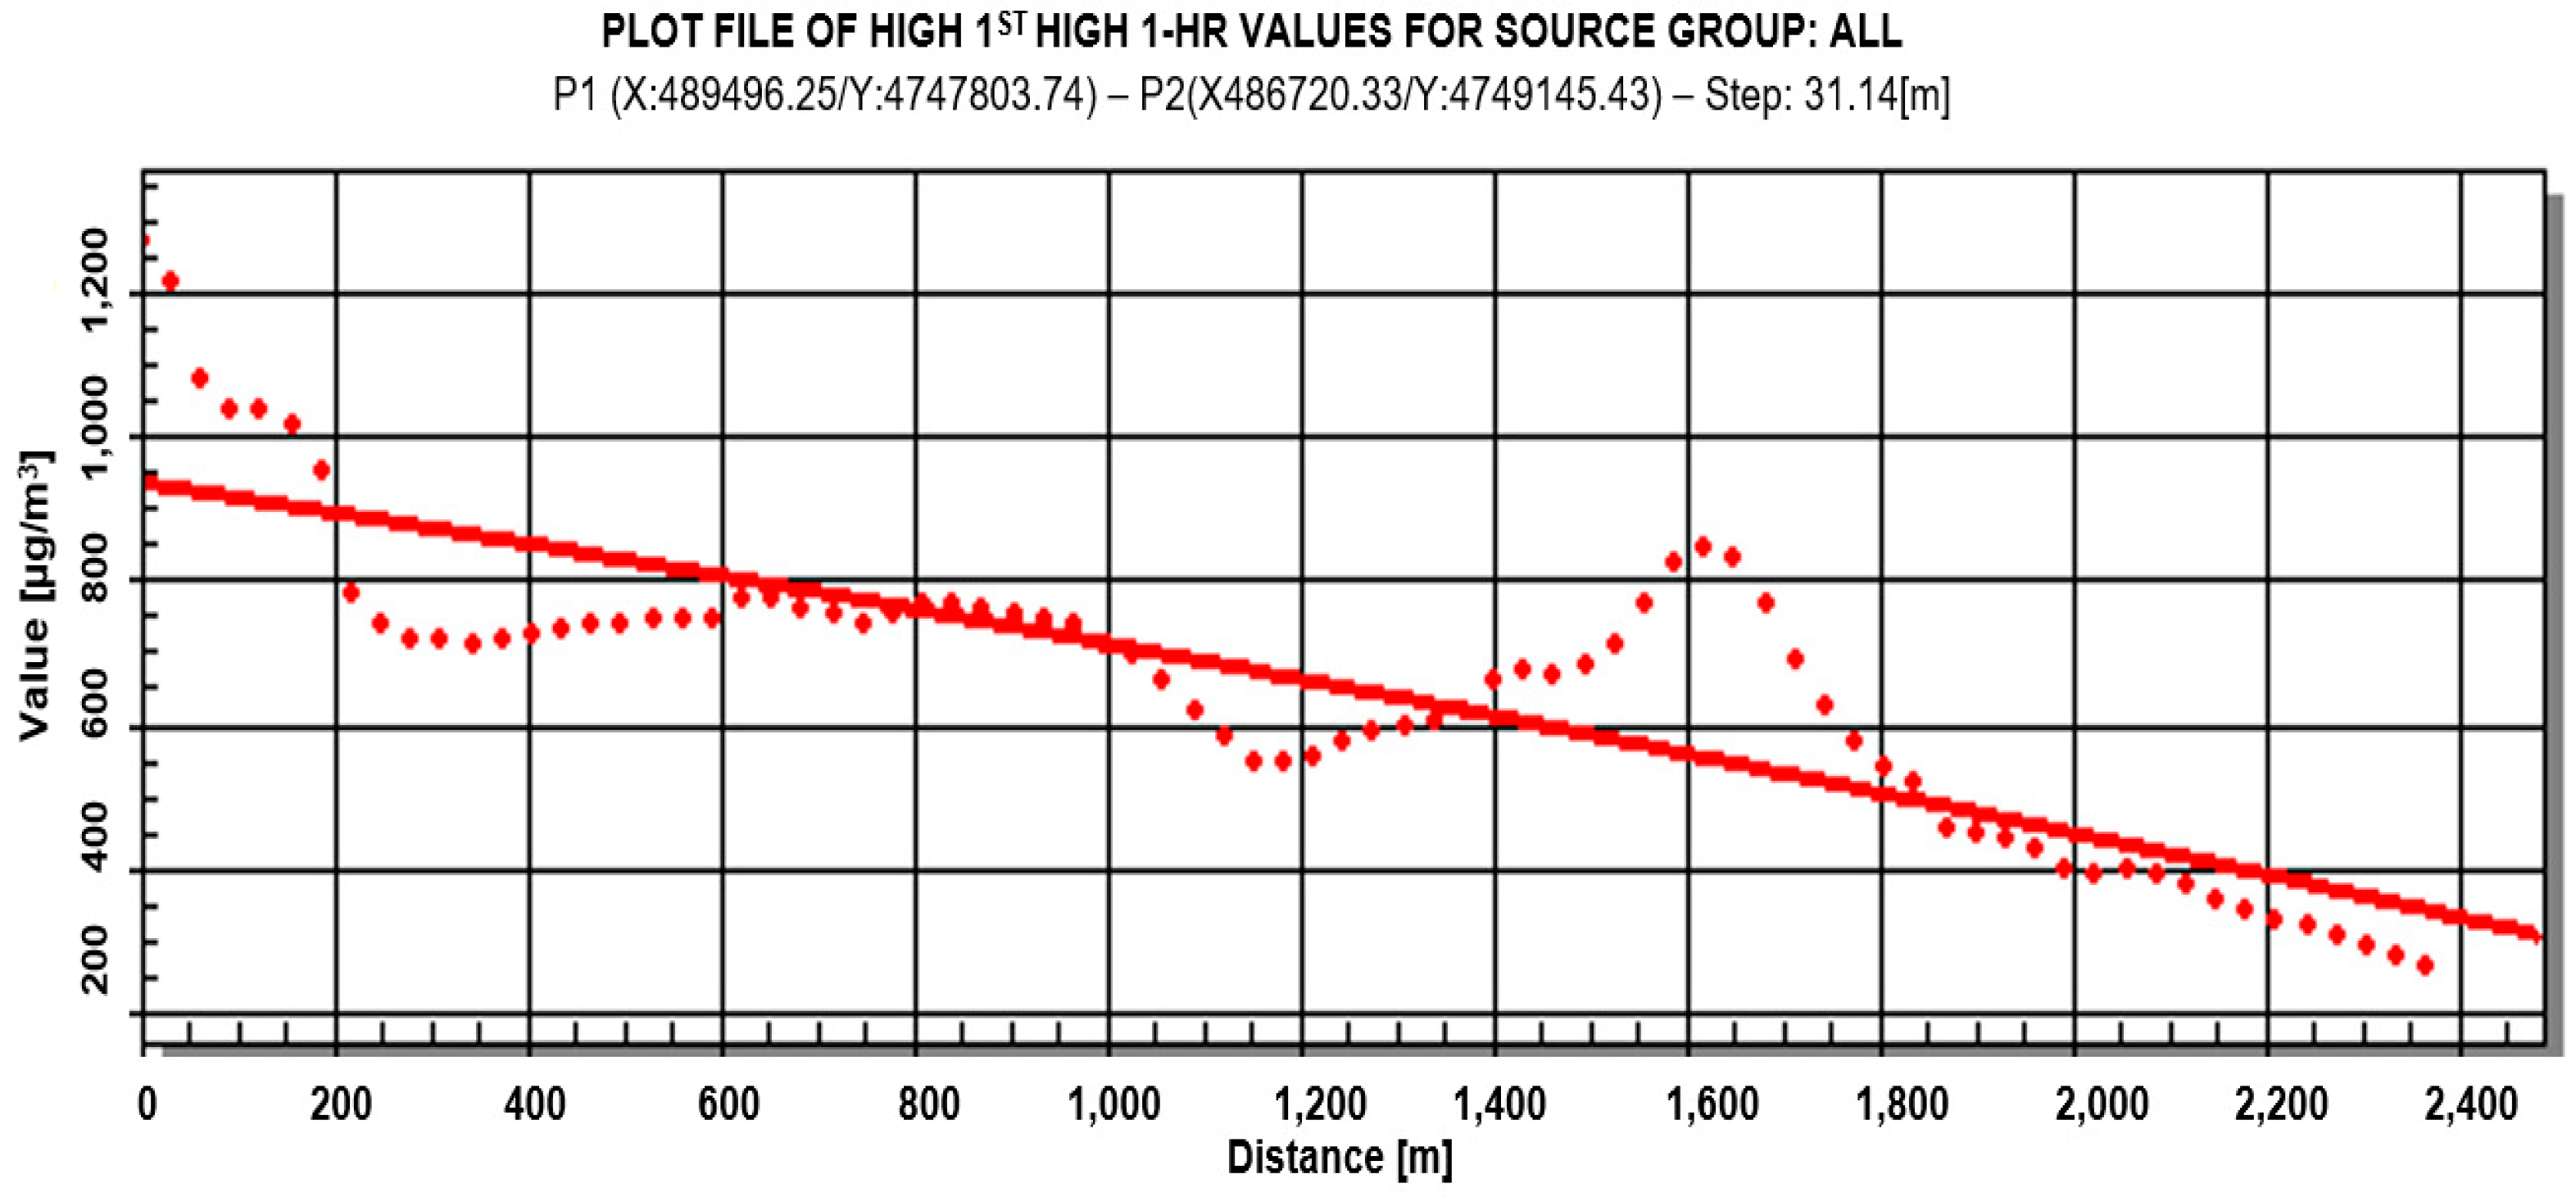
5]. The cross-sections were done to establish the relationship between the dispersion and soil pollution in the selected spots. The cross-section in the eastern direction (
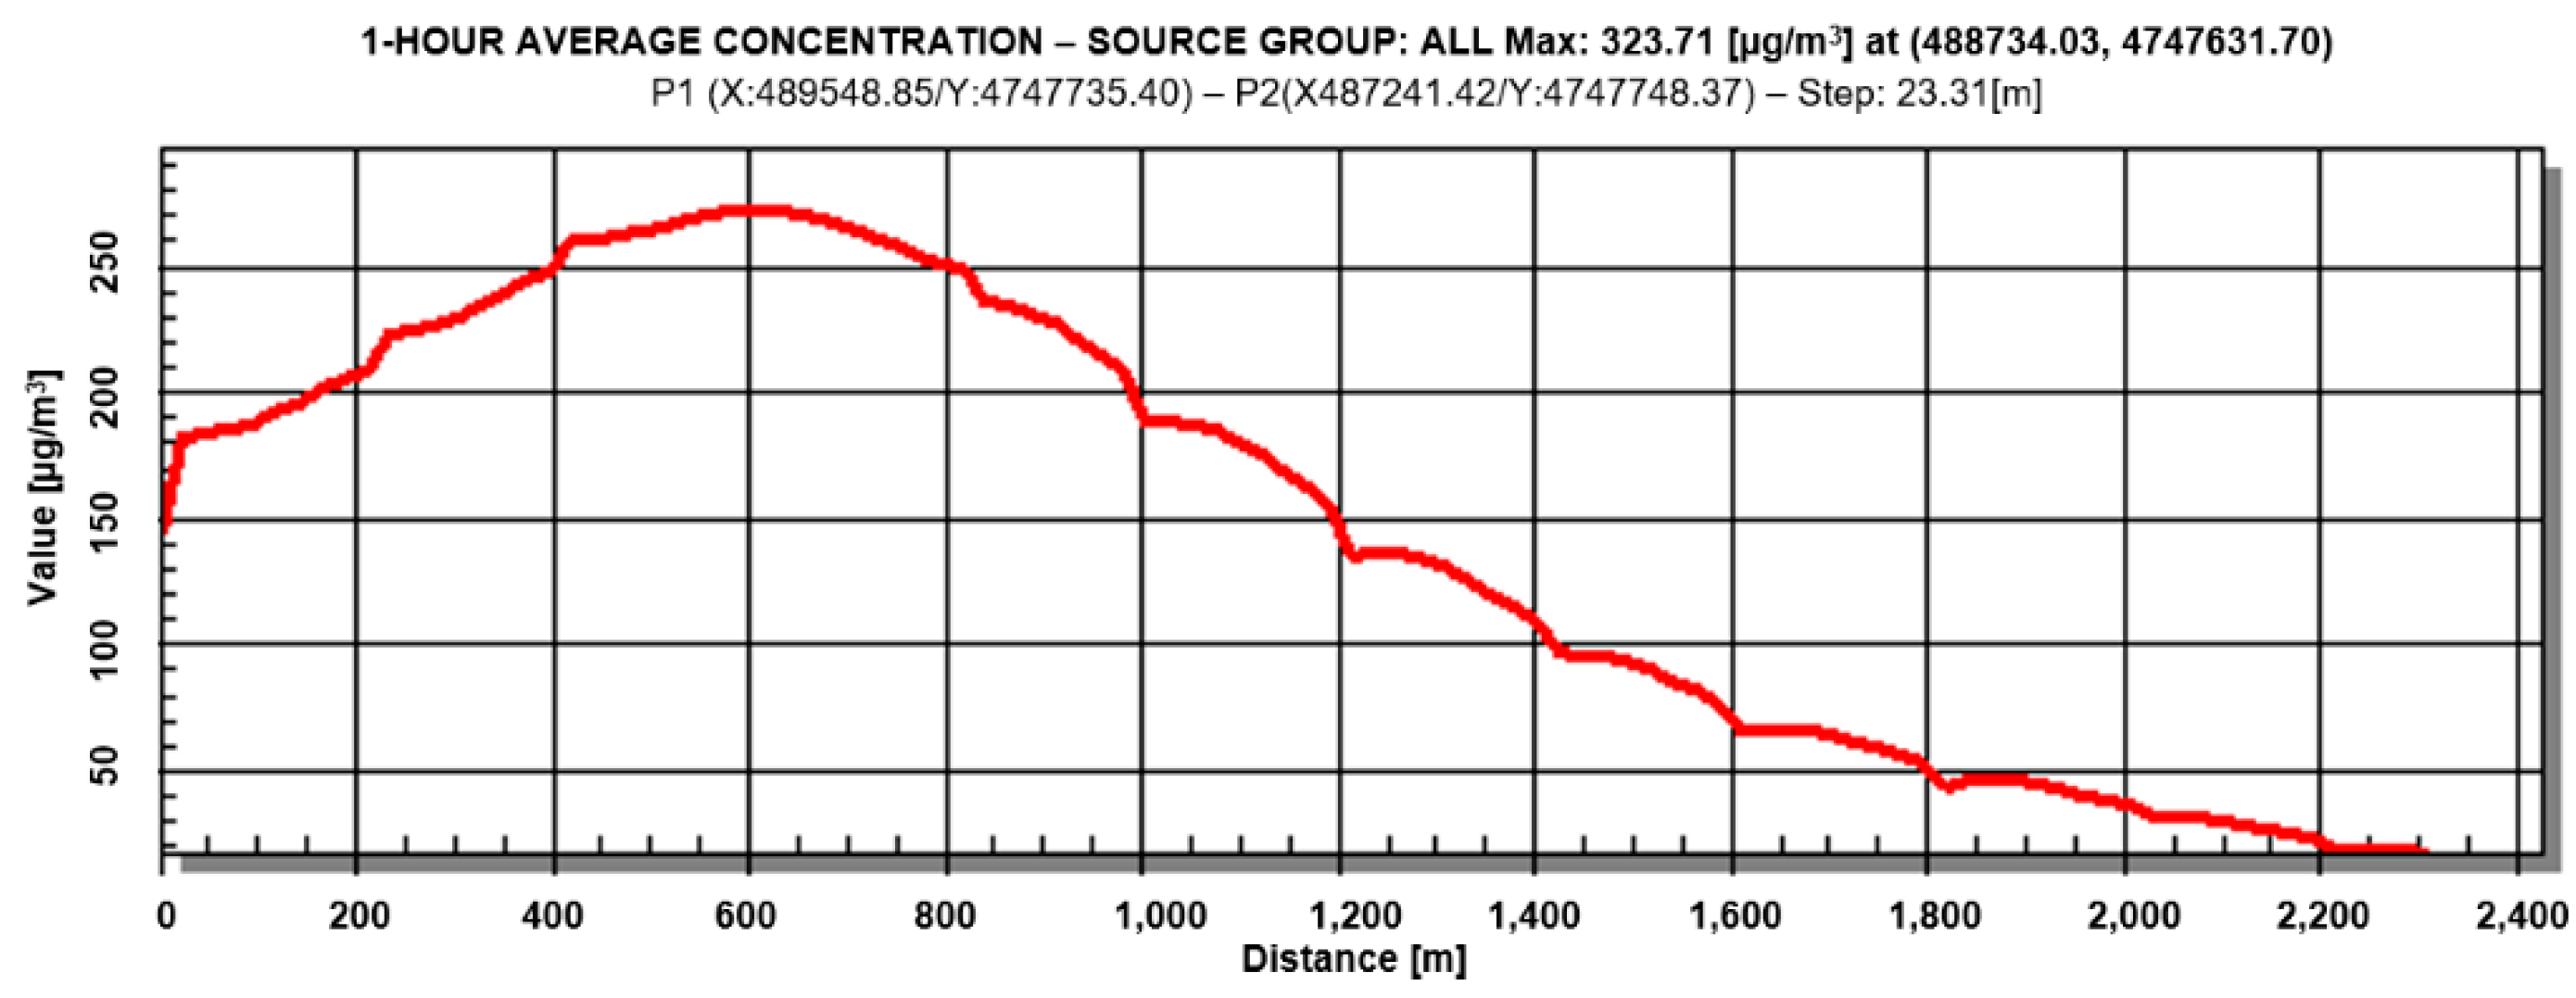
Figure 7) shows that the air dispersion will be stopped by the hills in the east, and the pollution does not exceed the distance of 800 m in that direction. In addition, the cross-section in the southwestern direction (
Figure 8) shows good agreement with the soil analysis presented in
Table 1 and shows significant average pollution in the western direction toward the city at a distance larger than 2.4 km. The exact heavy metal content in the particles could be estimated from the total TSP and PM 10 concentration in the air. The grain size distribution of jarosite shows that the particles containing heavy metals participate in the total solid particles with certain percentages: Pb-7.51%; Zn-10.91%; Cd-0.23%; As-0.5%. The average airborne pollution was calculated to be 71 µg m
−3, and the background concentration containing inert dust participation was calculated to be 21 µg m
−3. Therefore, it can be assumed with reasonable certainty that in the remaining 50 µg m
−3, lead will participate with 3.75 µg m
−3, Zinc with 5.45 µg m
−3, Cd with 0.115, and As with 0.25 µg m
−3.
The maximum concentration was calculated with the southwest wind direction and the plot with the PM 10 concentration.
Figure 9 shows that the city will become very endangered in the case of the wind blowing from the eastern mountains toward the river valley in the southwest direction, which corresponds well with the map shown in
Figure 10.
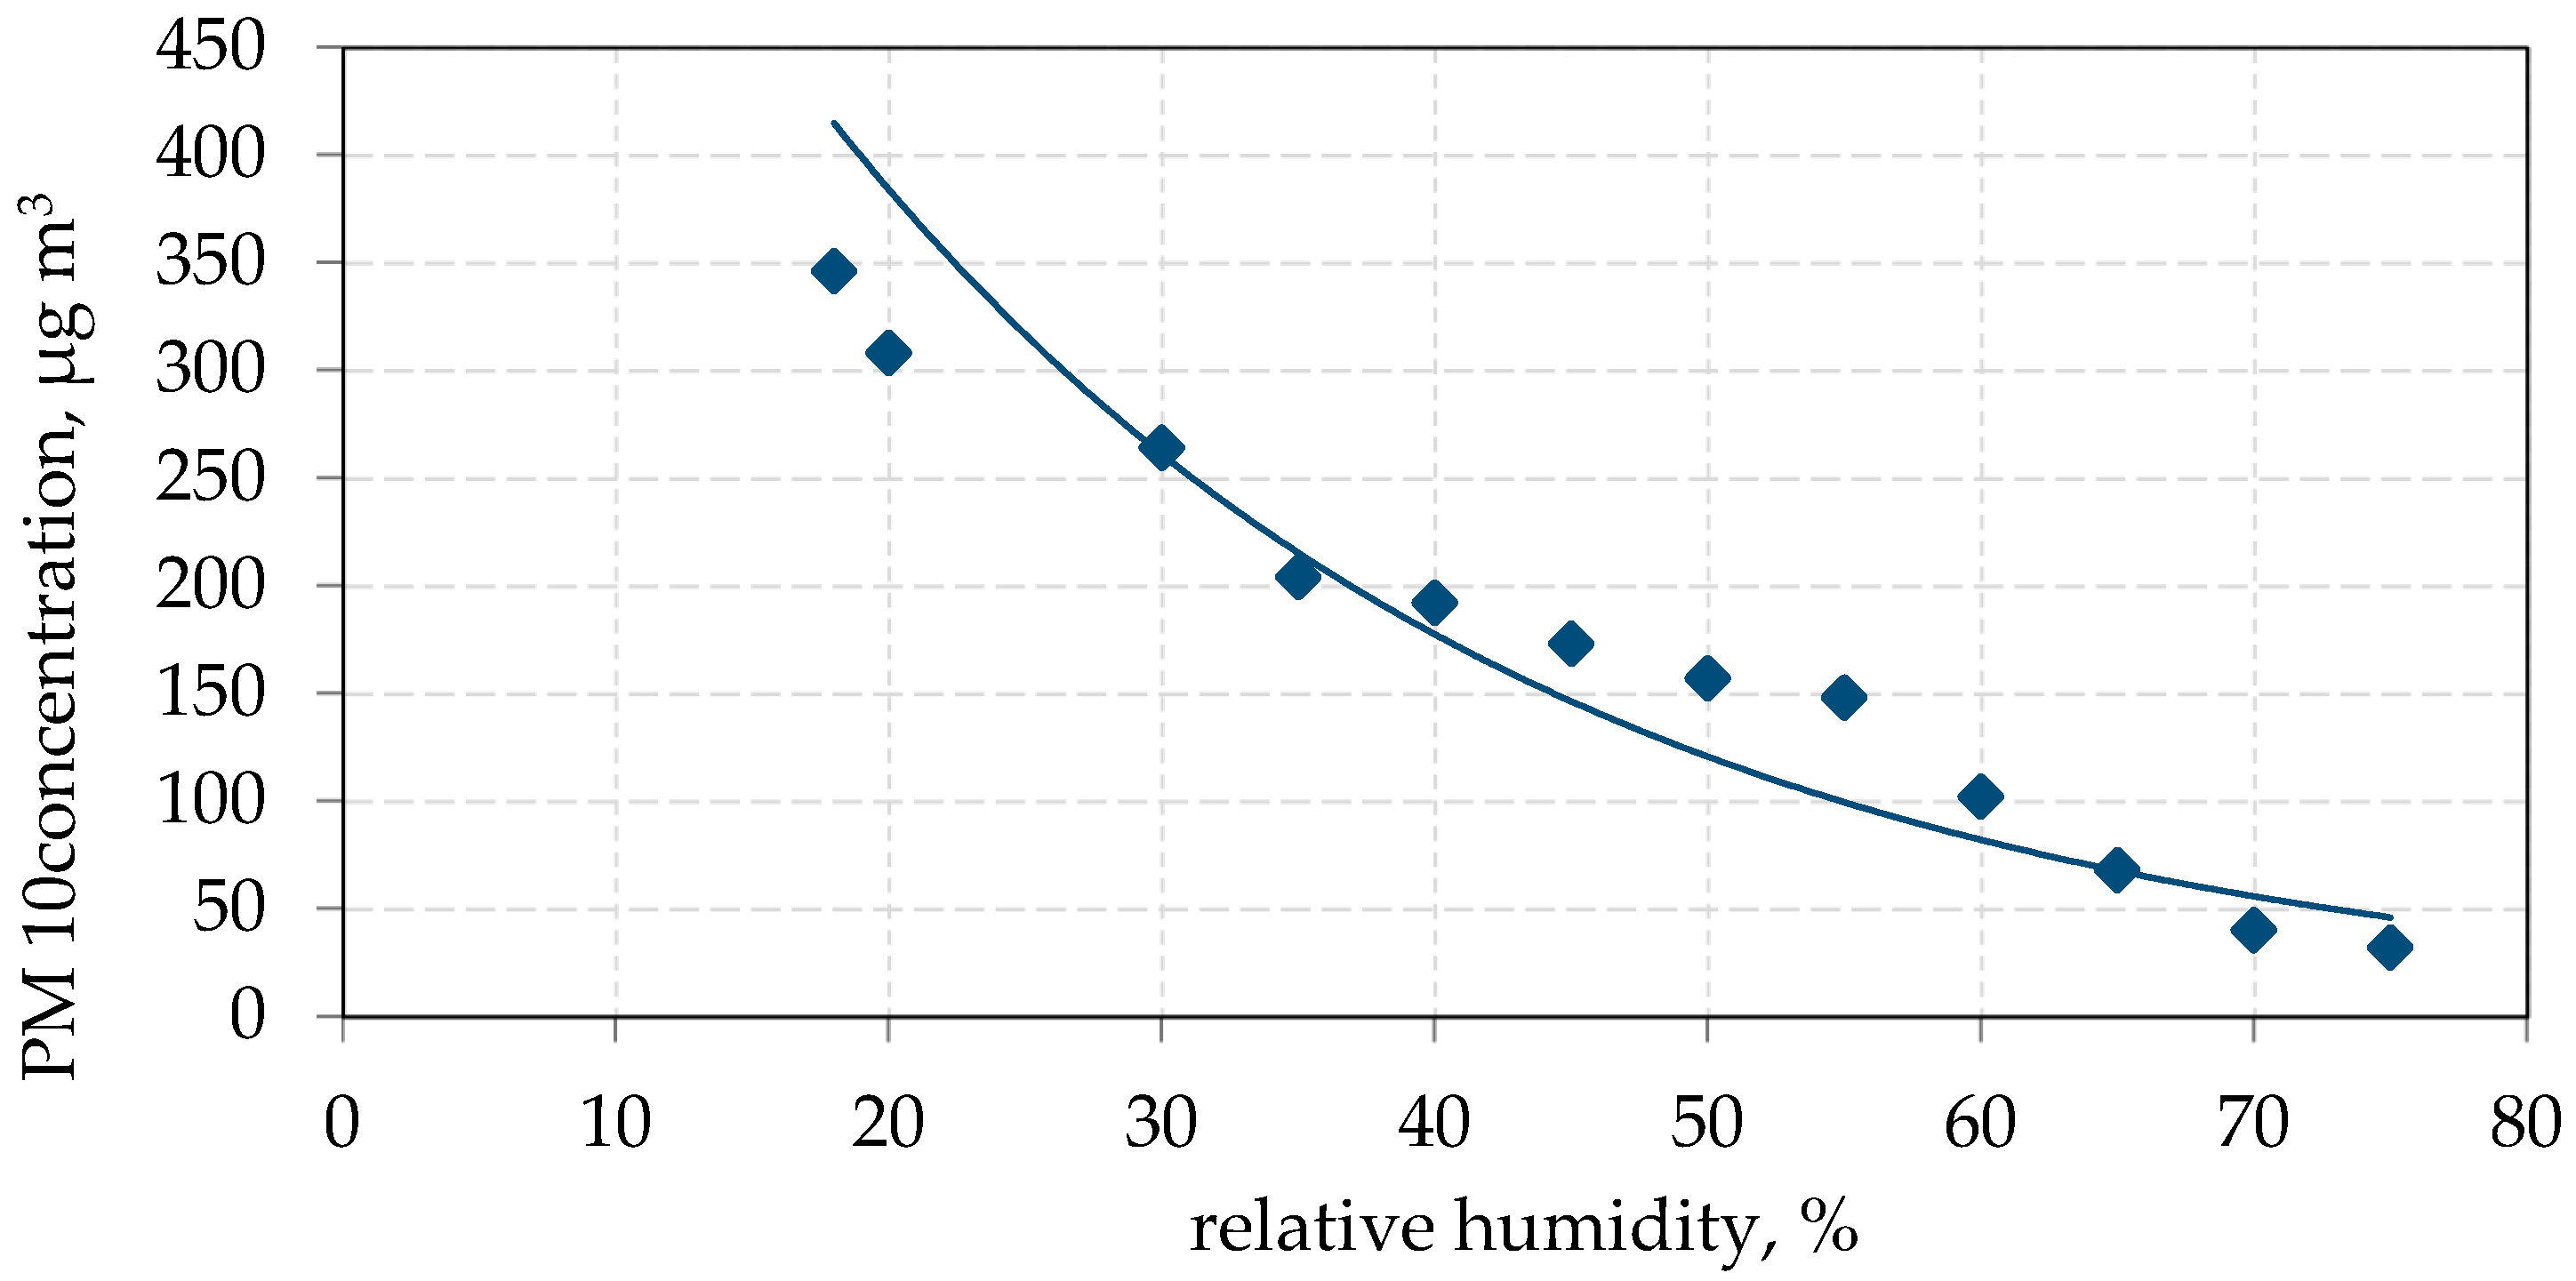
The weather conditions also changed in the case of relative humidity, so the emission of the solid particles was calculated for the case of minimum relative humidity of 14% and wind speed stronger than 11 m s
−1. The results of the PM 10 concentrations measured at the site for 2022 show good agreement with the calculations, as shown in
Figure 11.
The results of the PM 10 concentrations measured at the measuring point in the close vicinity of the deposit in the southwest direction in August 2022 show good agreement with the calculations for the given conditions. The PM 10 concentration of 324 µg m
−3 was found to be the maximum for these conditions using AERMOD modeling, and 346 µg m
−3 was the value obtained by measuring on-site. Comparing the EU threshold for PM 10 concentration, 40 µg m
−3, it can be concluded that the maximum 1-hour concentration exceeds the EU threshold by 9 times. The modeling shows the results presented in
Figure 12 in the form of plume animation for the changing weather conditions. The plume animation was used to visualize the impact of the jarosite landfill on the city and population in all wind directions and speeds.
Figure 12 presents the typical airborne pollution dispersion in the case of wind blowing in the southwest direction. The plume animation shows that the city will be endangered in the case of the wind blowing from the eastern mountains toward the river valley, as shown in
Figure 12. The color scale shows the yellow, orange, and red areas exceeding the maximum values, which cover the most populated city areas. The 1 h average concentration shows that starting from the deposit (dashed red square), the wind will carry high amounts of PM 10 particles to the southwest.
4. Conclusions
The jarosite waste deposit represents a constant and significant burden to the environment in the city of Mitrovica. Therefore, a comprehensive analysis of the jarosite waste deposit’s actual and potential risks was presented to analyze the environmental impact and provide information for the decision on sustainable development planning for the city. The waste was analyzed for its toxicity, grain size, and mineral composition, and the range of airborne distribution was determined. The aspect of climate change was taken into consideration, as small-grained waste is scattered significantly in dry weather conditions. The results obtained using the AERMOD software package correspond to the measured values in average conditions, 71.5 µg m−3, and 324 µg m−3 for extremely dry and windy conditions recorded in August 2022. In addition, the direction west was detected as the most polluted in accordance with the terrain and wind rose for the location of the city. The usage of AREMOD is recommended for urban planning, but in the situation of climate change, relative humidity must be also taken into consideration. Future investigation should include downwash.


