

Applying Wind Erosion and Air Dispersion Models to Characterize Dust Hazard to Highway Safety at Lordsburg Playa, New Mexico, USA

 ,
,  , , and
Abstract
1. Introduction
2. Methods
2.1. Site Description
2.2. SWEEP Model
2.3. AERMOD
3. Results and Discussion
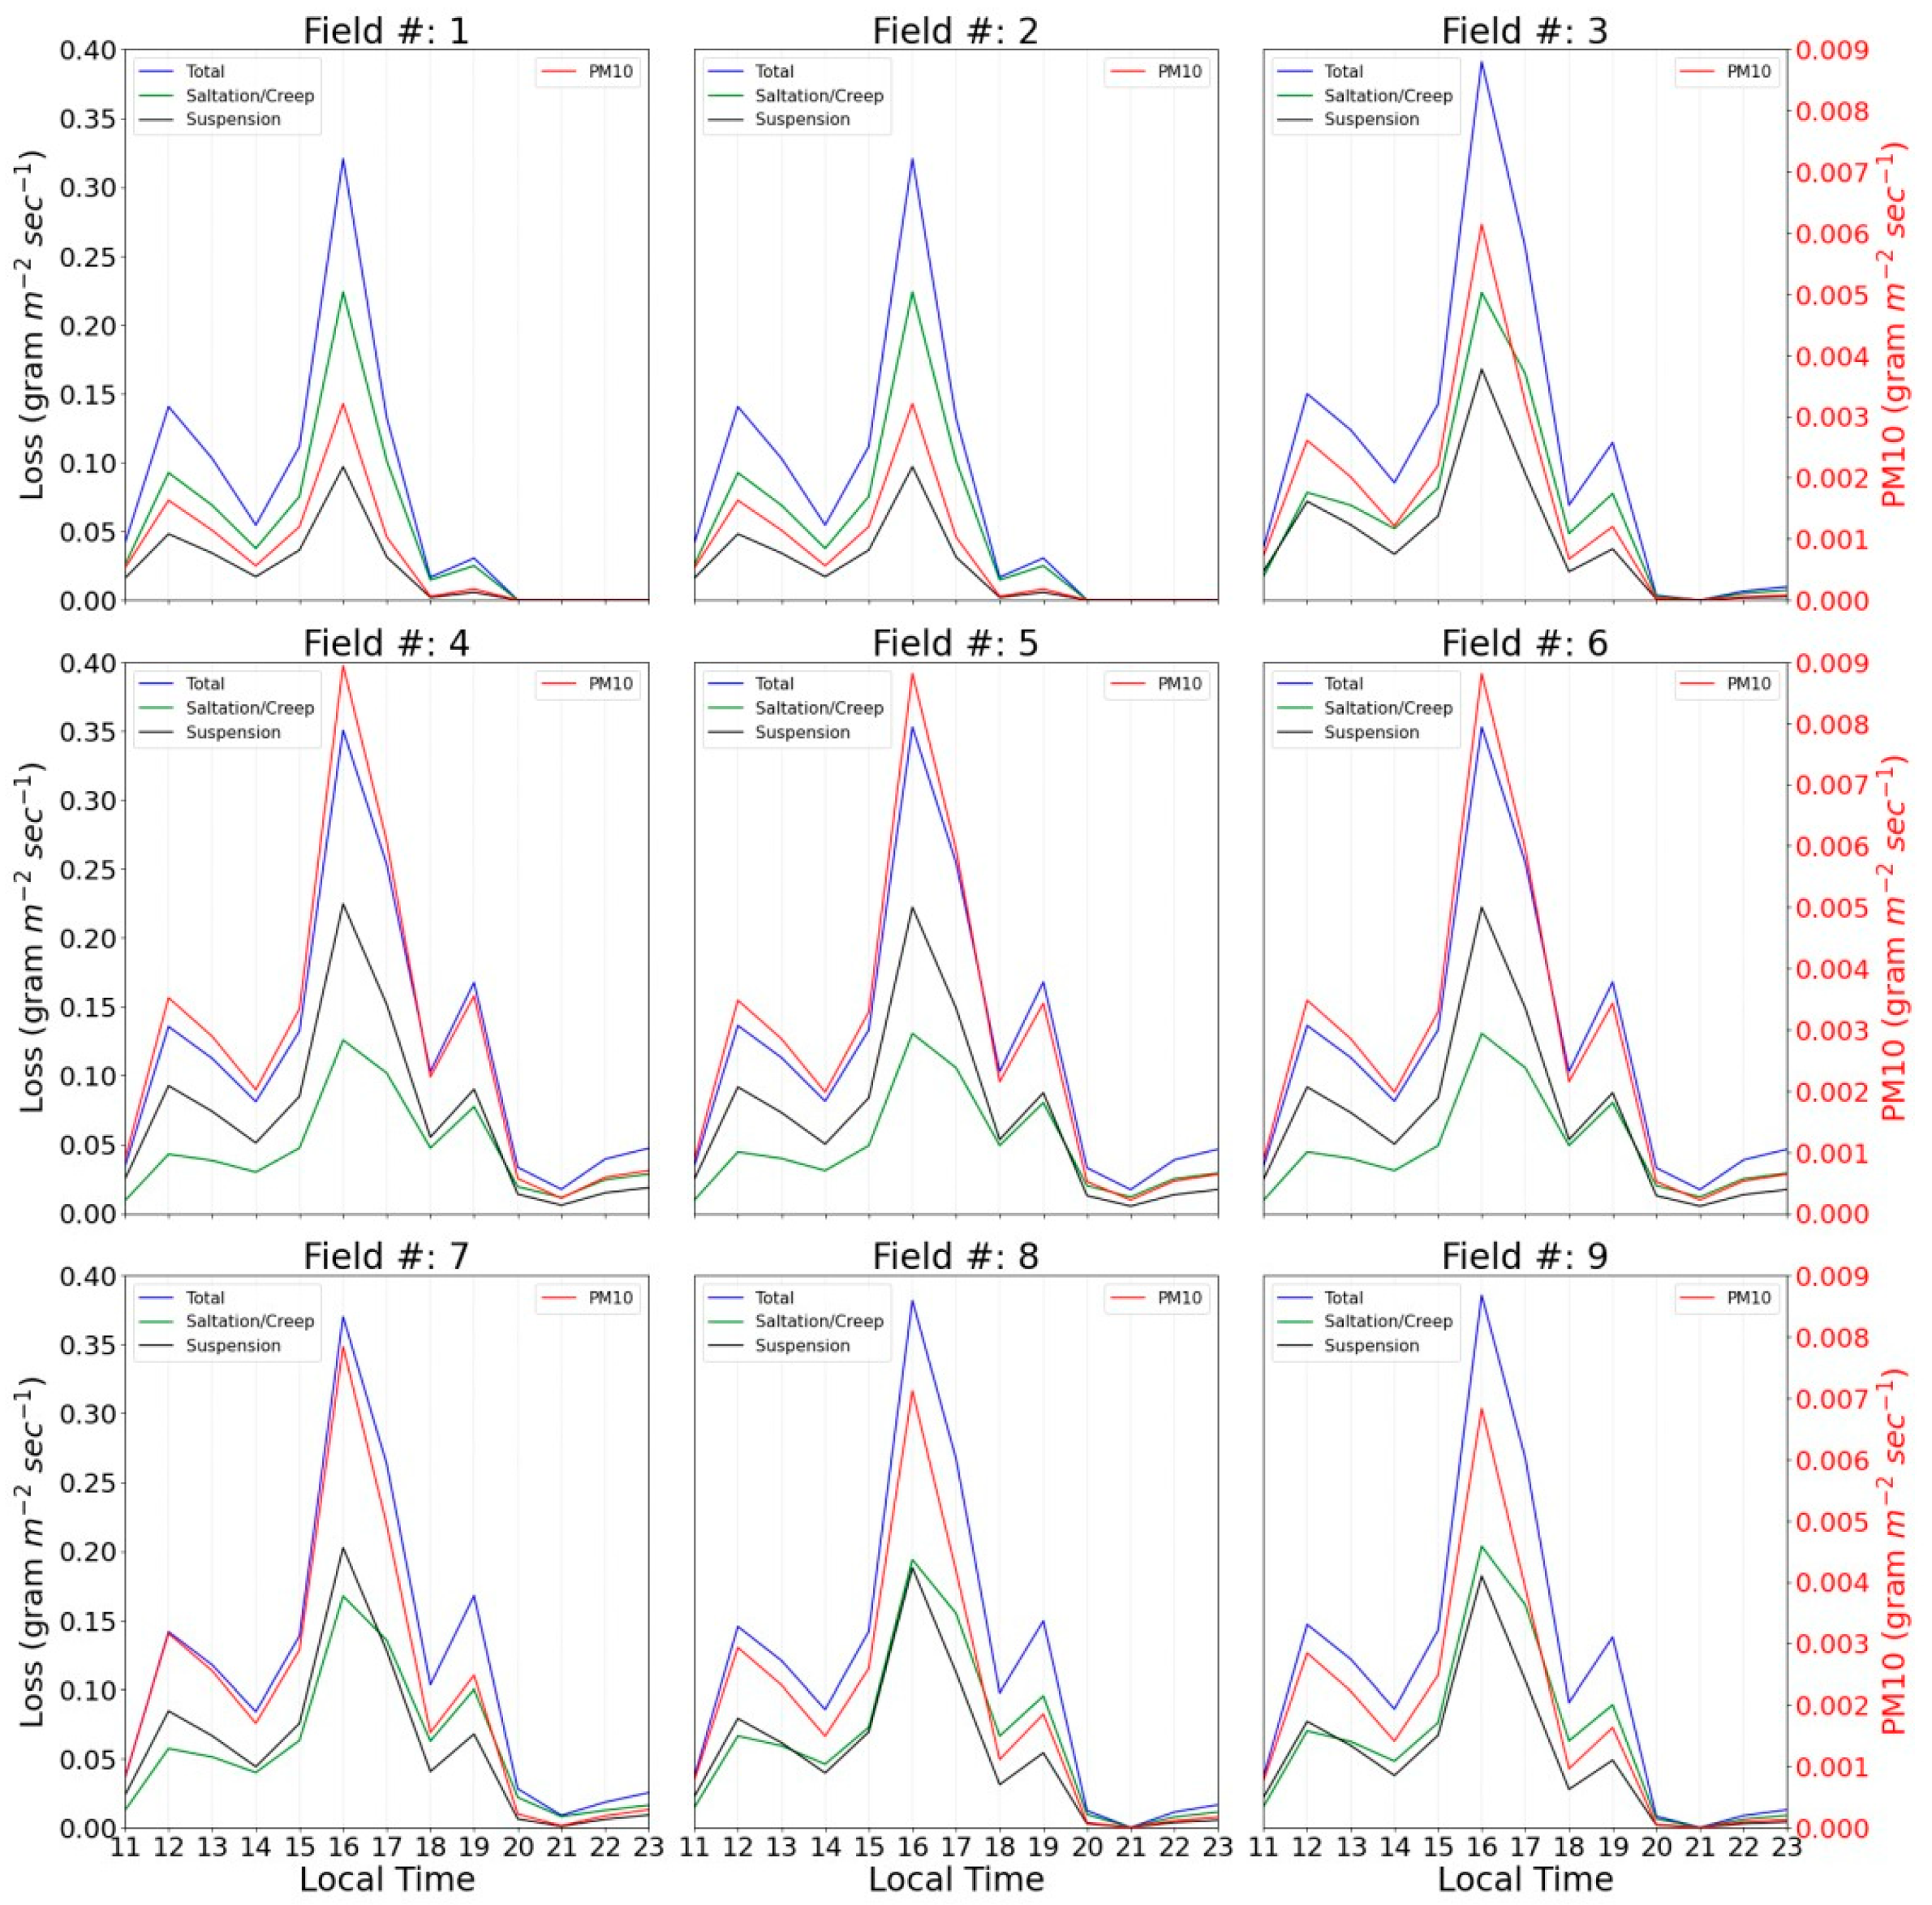
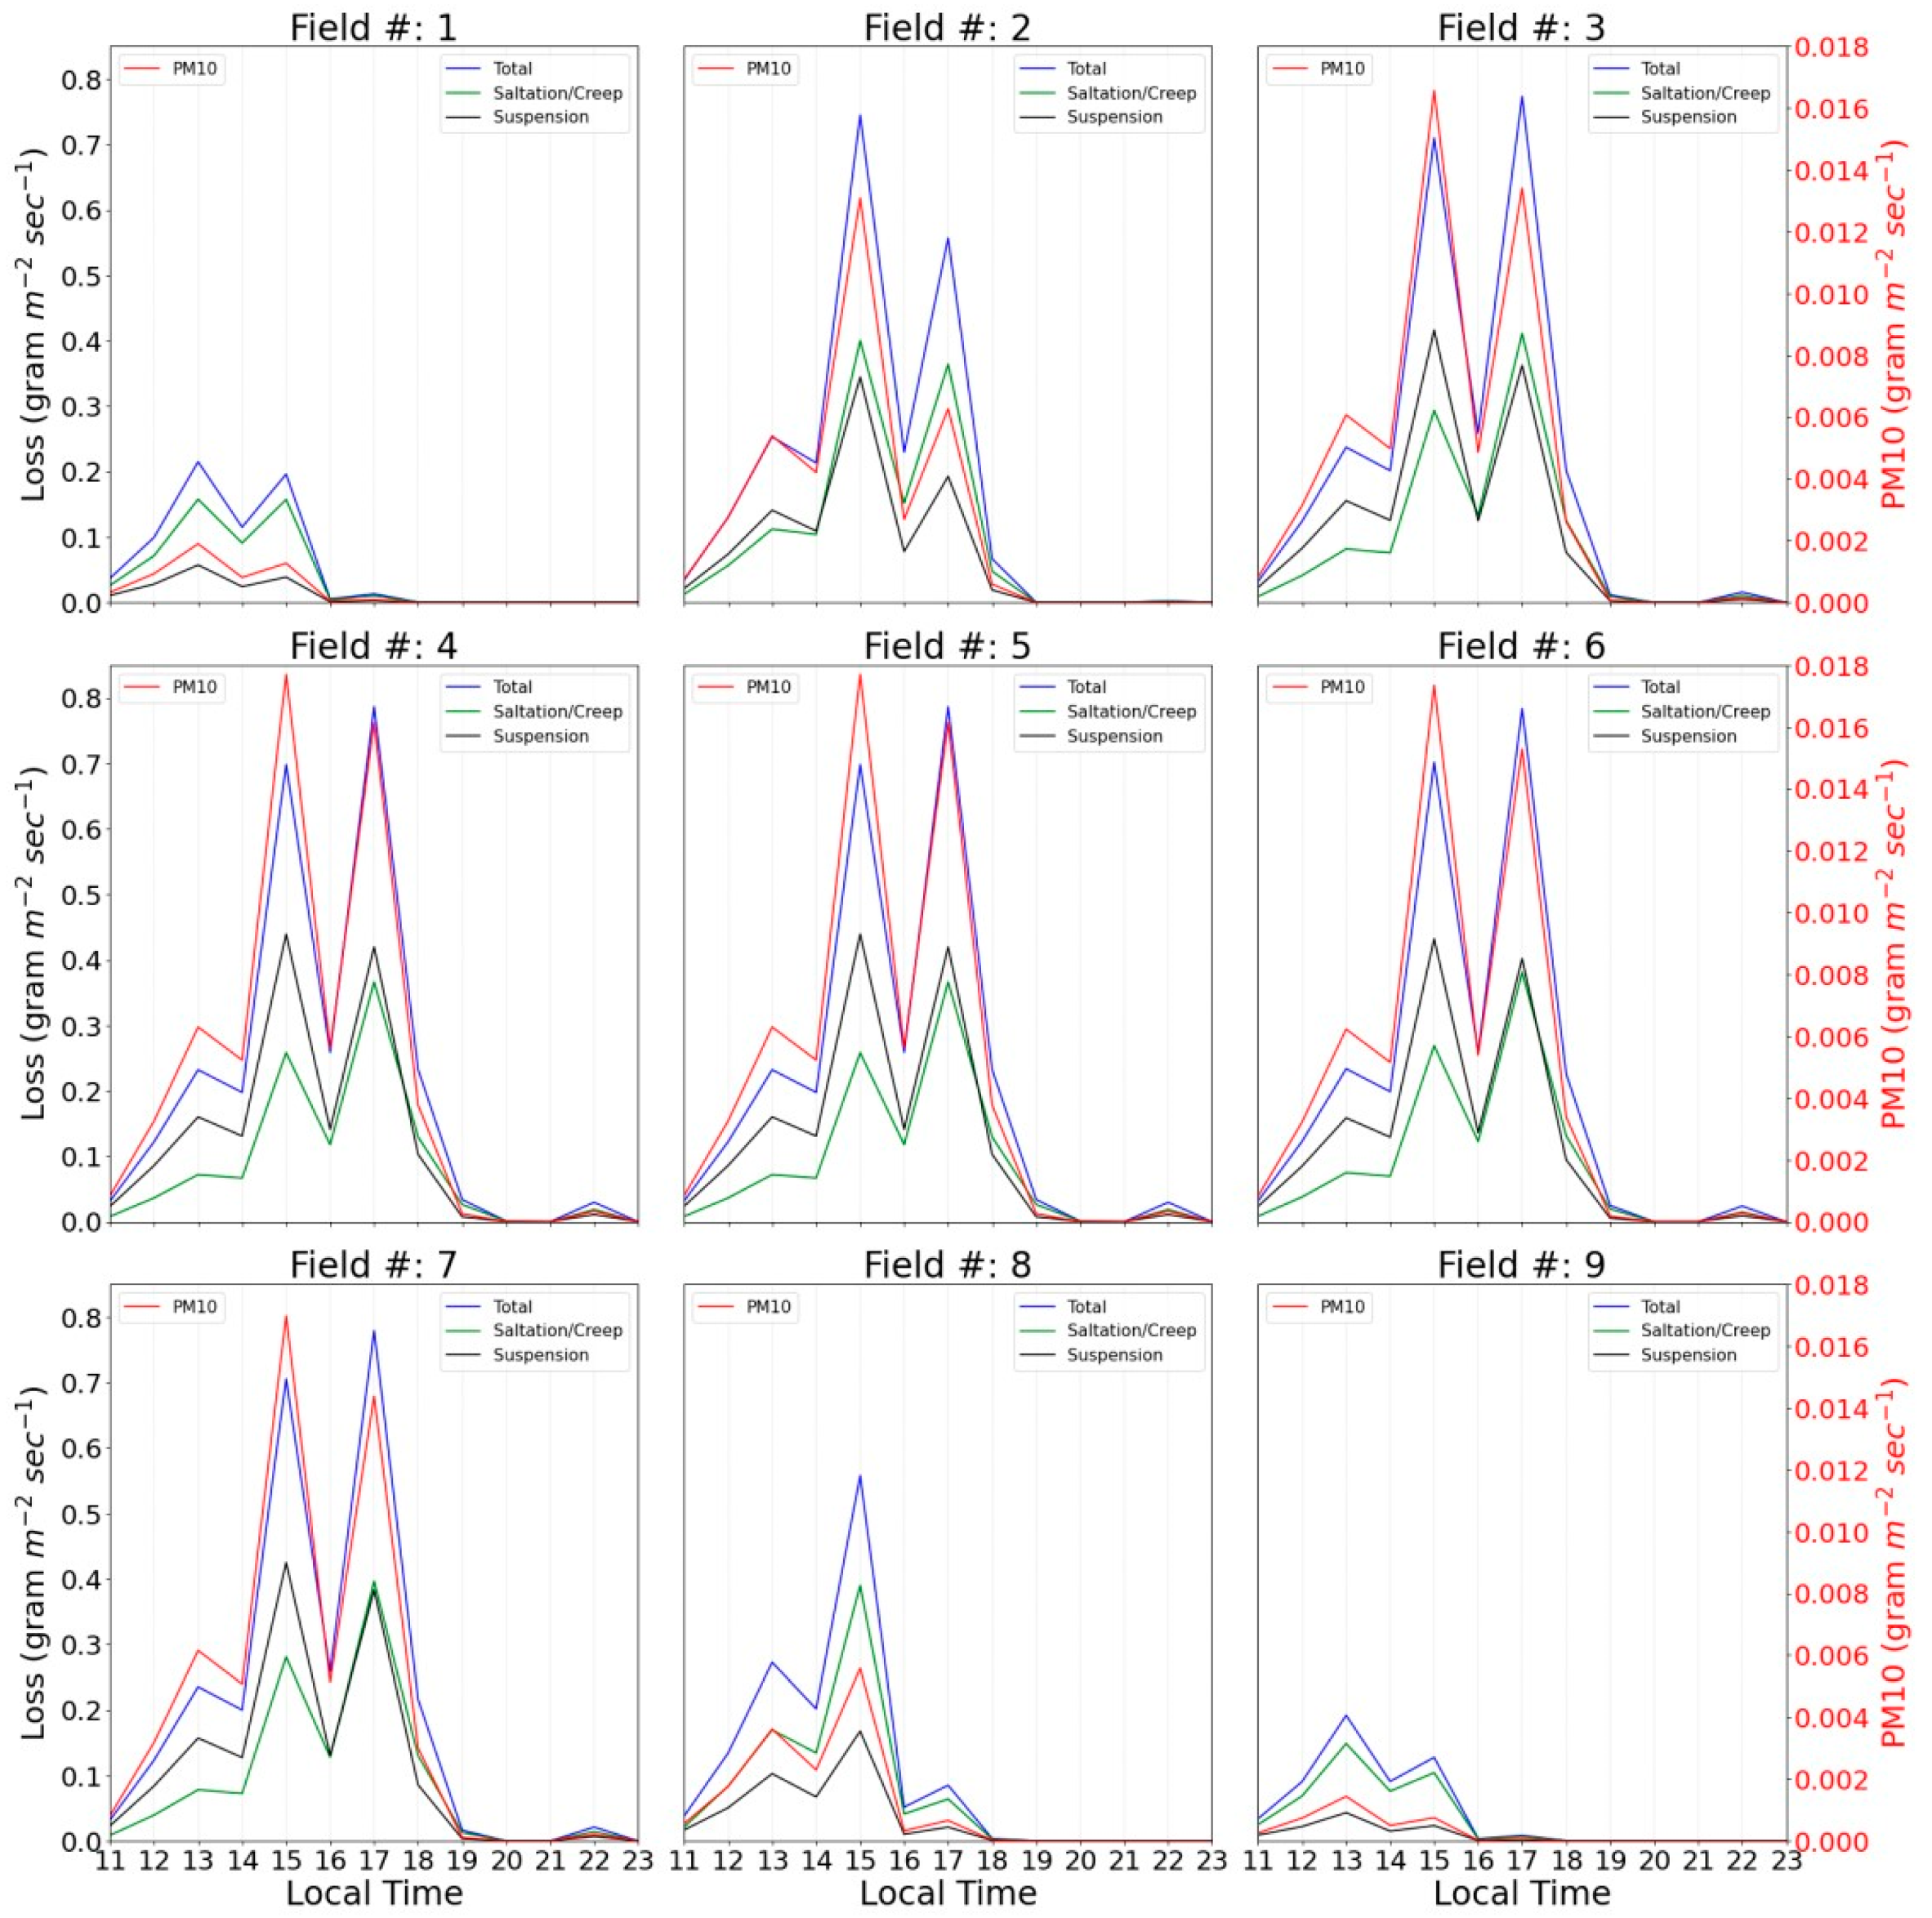
3.1. SWEEP
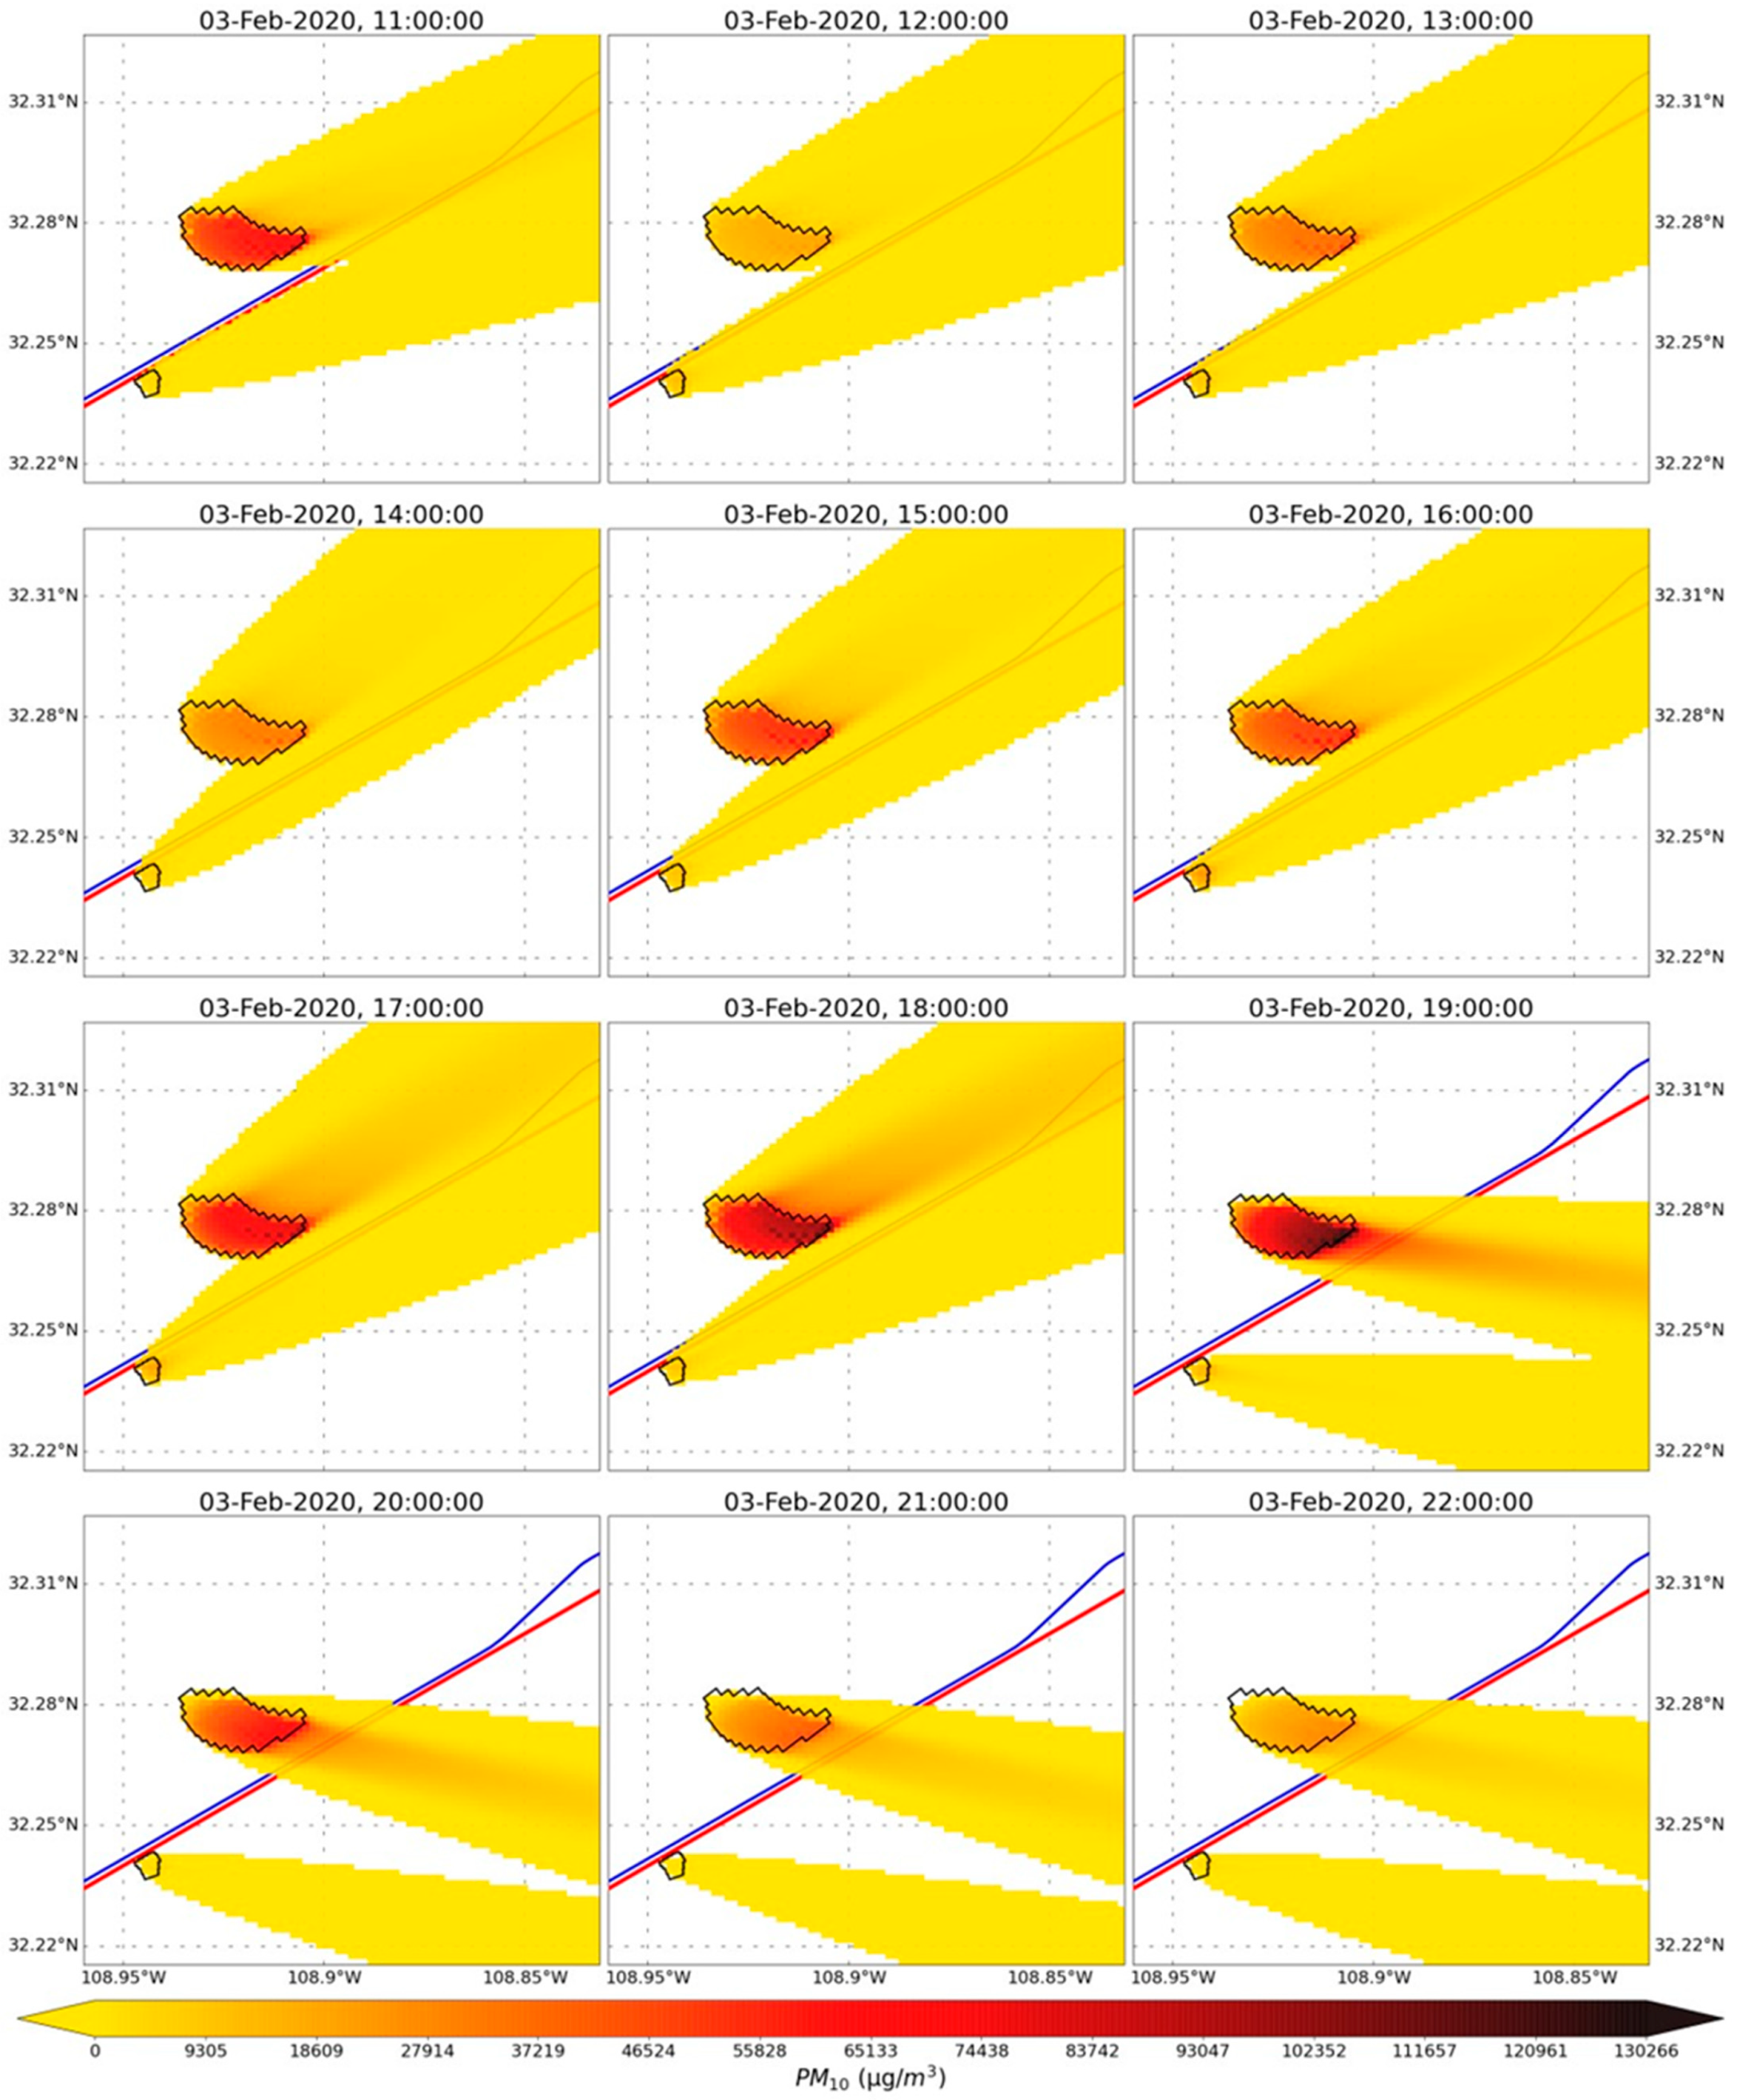
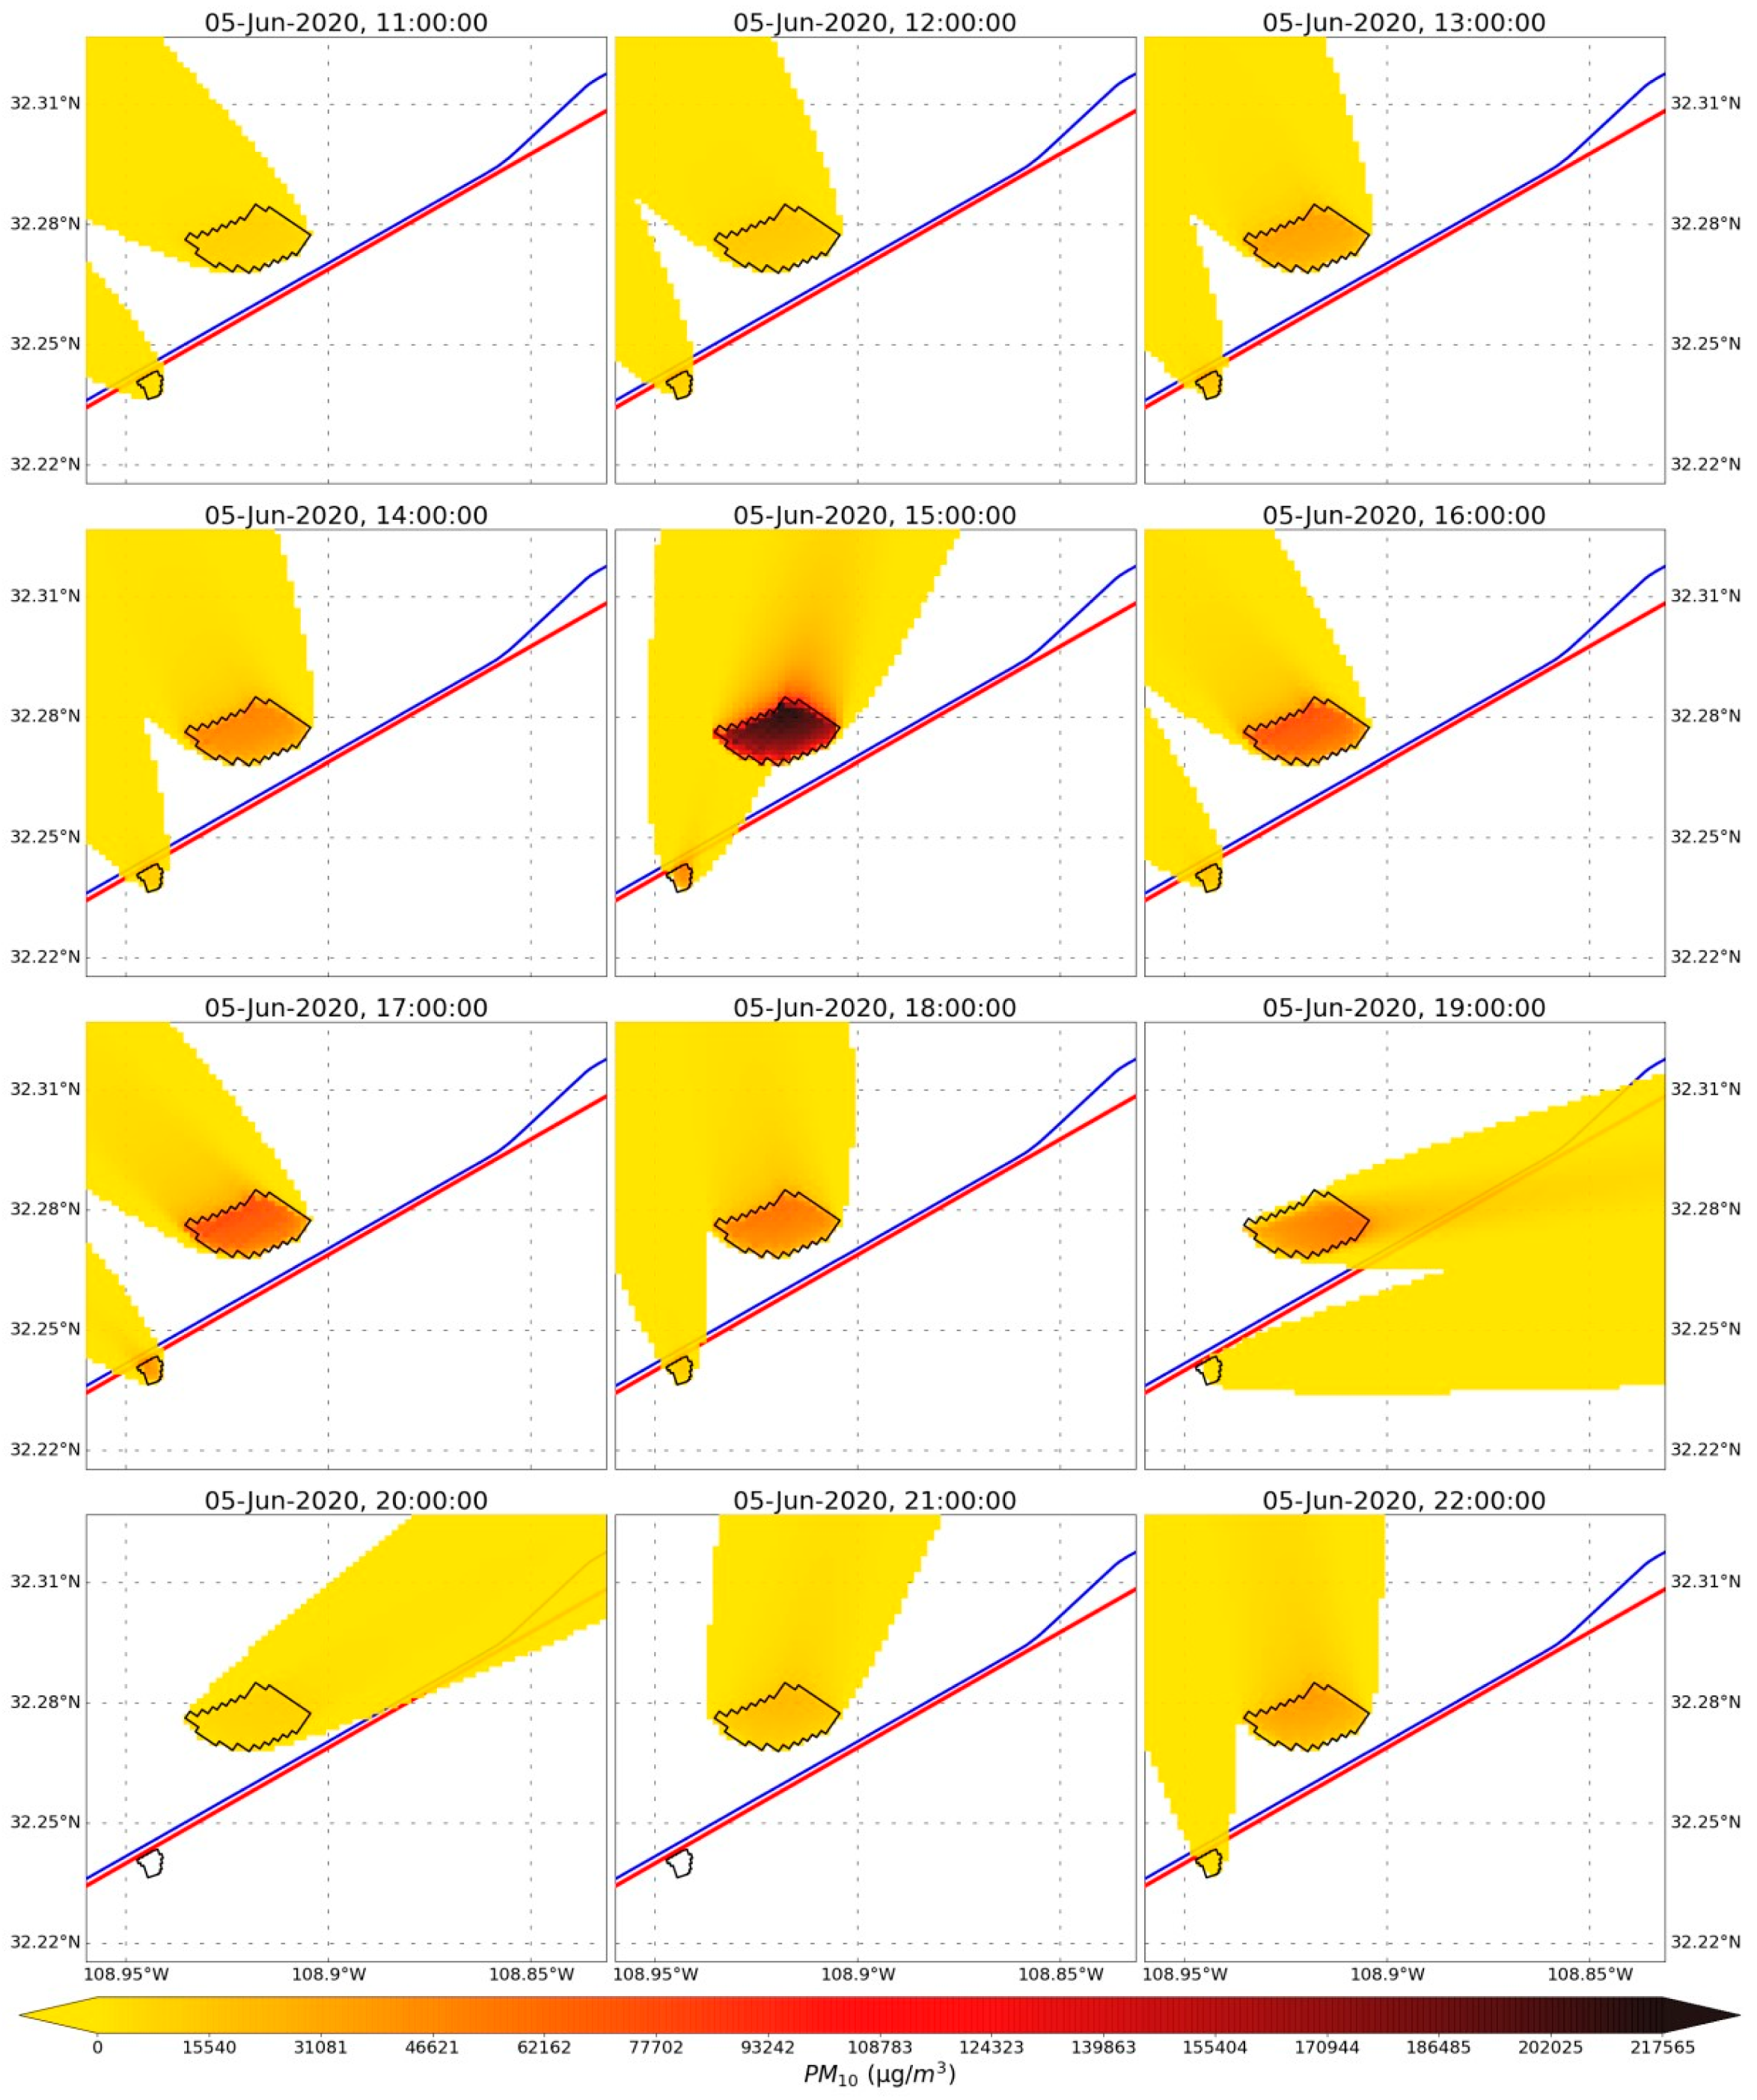
3.2. AERMOD
3.3. Potential Metal Exposures
3.4. Limitations
4. Conclusions, Implications, and Recommendations
Author Contributions
Funding
Institutional Review Board Statement
Informed Consent Statement
Data Availability Statement
Acknowledgments
Conflicts of Interest
Disclaimer
Appendix A

| Parameters | North Playa | Road Forks | Source of Data | ||
|---|---|---|---|---|---|
| 03 Feb 2020 | 06 Jun 2020 | 03 Feb 2020 | 06 Jun 2020 | ||
| 1. Field | |||||
| x and y dimensions of fields | Refer to Table 1 | ||||
| Angle, degrees | 52.69 | 304.44 | 71.19 | 341.58 | Wind direction via New Mexico Climate Center |
| Number of fields | 12 | 9 | 9 | 9 | - |
| Wind barriers | 0 | 0 | 0 | 0 | - |
| 2. Biomass | |||||
| Residue average height (m) | 0 | 0 | 0 | 0 | Bureau of Land Management (BLM) |
| Residue stem area index (m2/m2) | 0 | 0 | 0 | 0 | |
| Residue leaf area index (m2/m2) | 0 | 0 | 0 | 0 | |
| Residue flat cover (m2/m2) | 0 | 0 | 0 | 0 | |
| Growing crop average height (m) | 0 | 0 | 0 | 0 | |
| Growing crop stem area index | 0 | 0 | 0 | 0 | |
| Growing crop leaf area index | 0 | 0 | 0 | 0 | |
| Row spacing (m) | 0 | 0 | 0 | 0 | |
| Seed placement | Furrow | Furrow | Furrow | Furrow | |
| 3. Soil Layers | |||||
| Number of layers | 2 | 3 | NRCS, USDA | ||
| Thickness | 150, 1370 | 200, 330, 990 | |||
| Sand Fraction (Mg/Mg) | 0.18, 0.031 | 0.18, 0.311, 0.551 | Soil sampling and particle size distribution from field measurements and Gill et al. [35] | ||
| Very fine sand fraction (Mg/Mg) | 0.13, 0.024 | 0.13, 0.086, 0.111 | |||
| Silt fraction (Mg/Mg) | 0.59, 0.444 | 0.59, 0.309, 0.174 | |||
| Clay fraction (Mg/Mg) | 0.1, 0.525 | 0.1, 0.38, 0.275 | |||
| Rock volume fraction (m3/m3) | 0, 0 | 0, 0, 0 | Natural Resources Conservation Service (NRCS) USDA through Soil Survey Geographic (SSURGO) database | ||
| Dry bulk density (Mg/m3) | 1.491, 1.491 | 1.307, 1.677, 1.426 | |||
| Avg. aggregate density (Mg/m3) | 1.8, 1.8 | 1.8, 1.8, 1.8 | |||
| Avg. dry aggregate stability (ln(J/kg)) | 2.73, 2.73 | 3.018, 3.359, 3.348 | |||
| GMD of aggregate sizes (mm) | 4.914, 26.174 | 4.409, 11.118, 17.7 | |||
| GSD of aggregate sizes (mm/mm) | 14.989, 10.506 | 14.745, 14.735, 12.778 | |||
| Minimum aggregate size (mm) | 0.01, 0.01 | 0.01, 0.01, 0.01 | |||
| Maximum aggregate size (mm) | 36.8, 59.748 | 36.042, 44.489, 51.383 | |||
| Soil wilting point w. content | 0.267, 0.267 | 0.103, 0.217, 0.145 | |||
| 4. Soil Surface | |||||
| Surface crust fraction (m2/m2) | 0.5 | 0.5 | Klose et al. [38] | ||
| Surface crust thickness (mm) | 10 | ′10 | Field measurements | ||
| Loose material on crust (m2/m2) | 0.8 | 0.8 | Klose et al. [38] | ||
| Loose mass on crust (kg/m2) | 1.5 | 1.5 | Assumed | ||
| Crust density (Mg/m3) | 1.8 | 1.8 | Natural Resources Conservation Service (NRCS) USDA through Soil Survey Geographic (SSURGO) database | ||
| Crust stability (ln(J/kg)) | 2.73 | 3.02 | |||
| Allmaras random roughness (mm) | 4 | 4 | |||
| Ridge height (mm) | 0 | 0 | |||
| Ridge spacing (mm) | 10 | 10 | |||
| Ridge width (mm) | 10 | 10 | |||
| Ridge orientation (deg) | 0 | 0 | |||
| Dike spacing (mm) | 0 | 0 | |||
| Snow depth (mm) | 0 | 0 | |||
| Hourly surface water content | 0 | 0 | Assumed | ||
| 5. Weather | |||||
| Air density (kg/m3) | 1.0692 | 0.9993 | 1.0698 | 0.9999 | Estimated |
| Wind direction (deg. from north) | 232 | 124.44 | 251.19 | 161.58 | New Mexico Climate Center |
| Anemometer height (m) | 10 | 10 | 10 | 10 | |
| Aerodynamic roughness (mm) | 25 | 25 | 25 | 25 | NRCS, USDA |
| Z0 location flag | Station | Station | Field | Field | New Mexico Climate Center |
| Number of interval/day to run | 24 | 24 | 24 | 24 | |
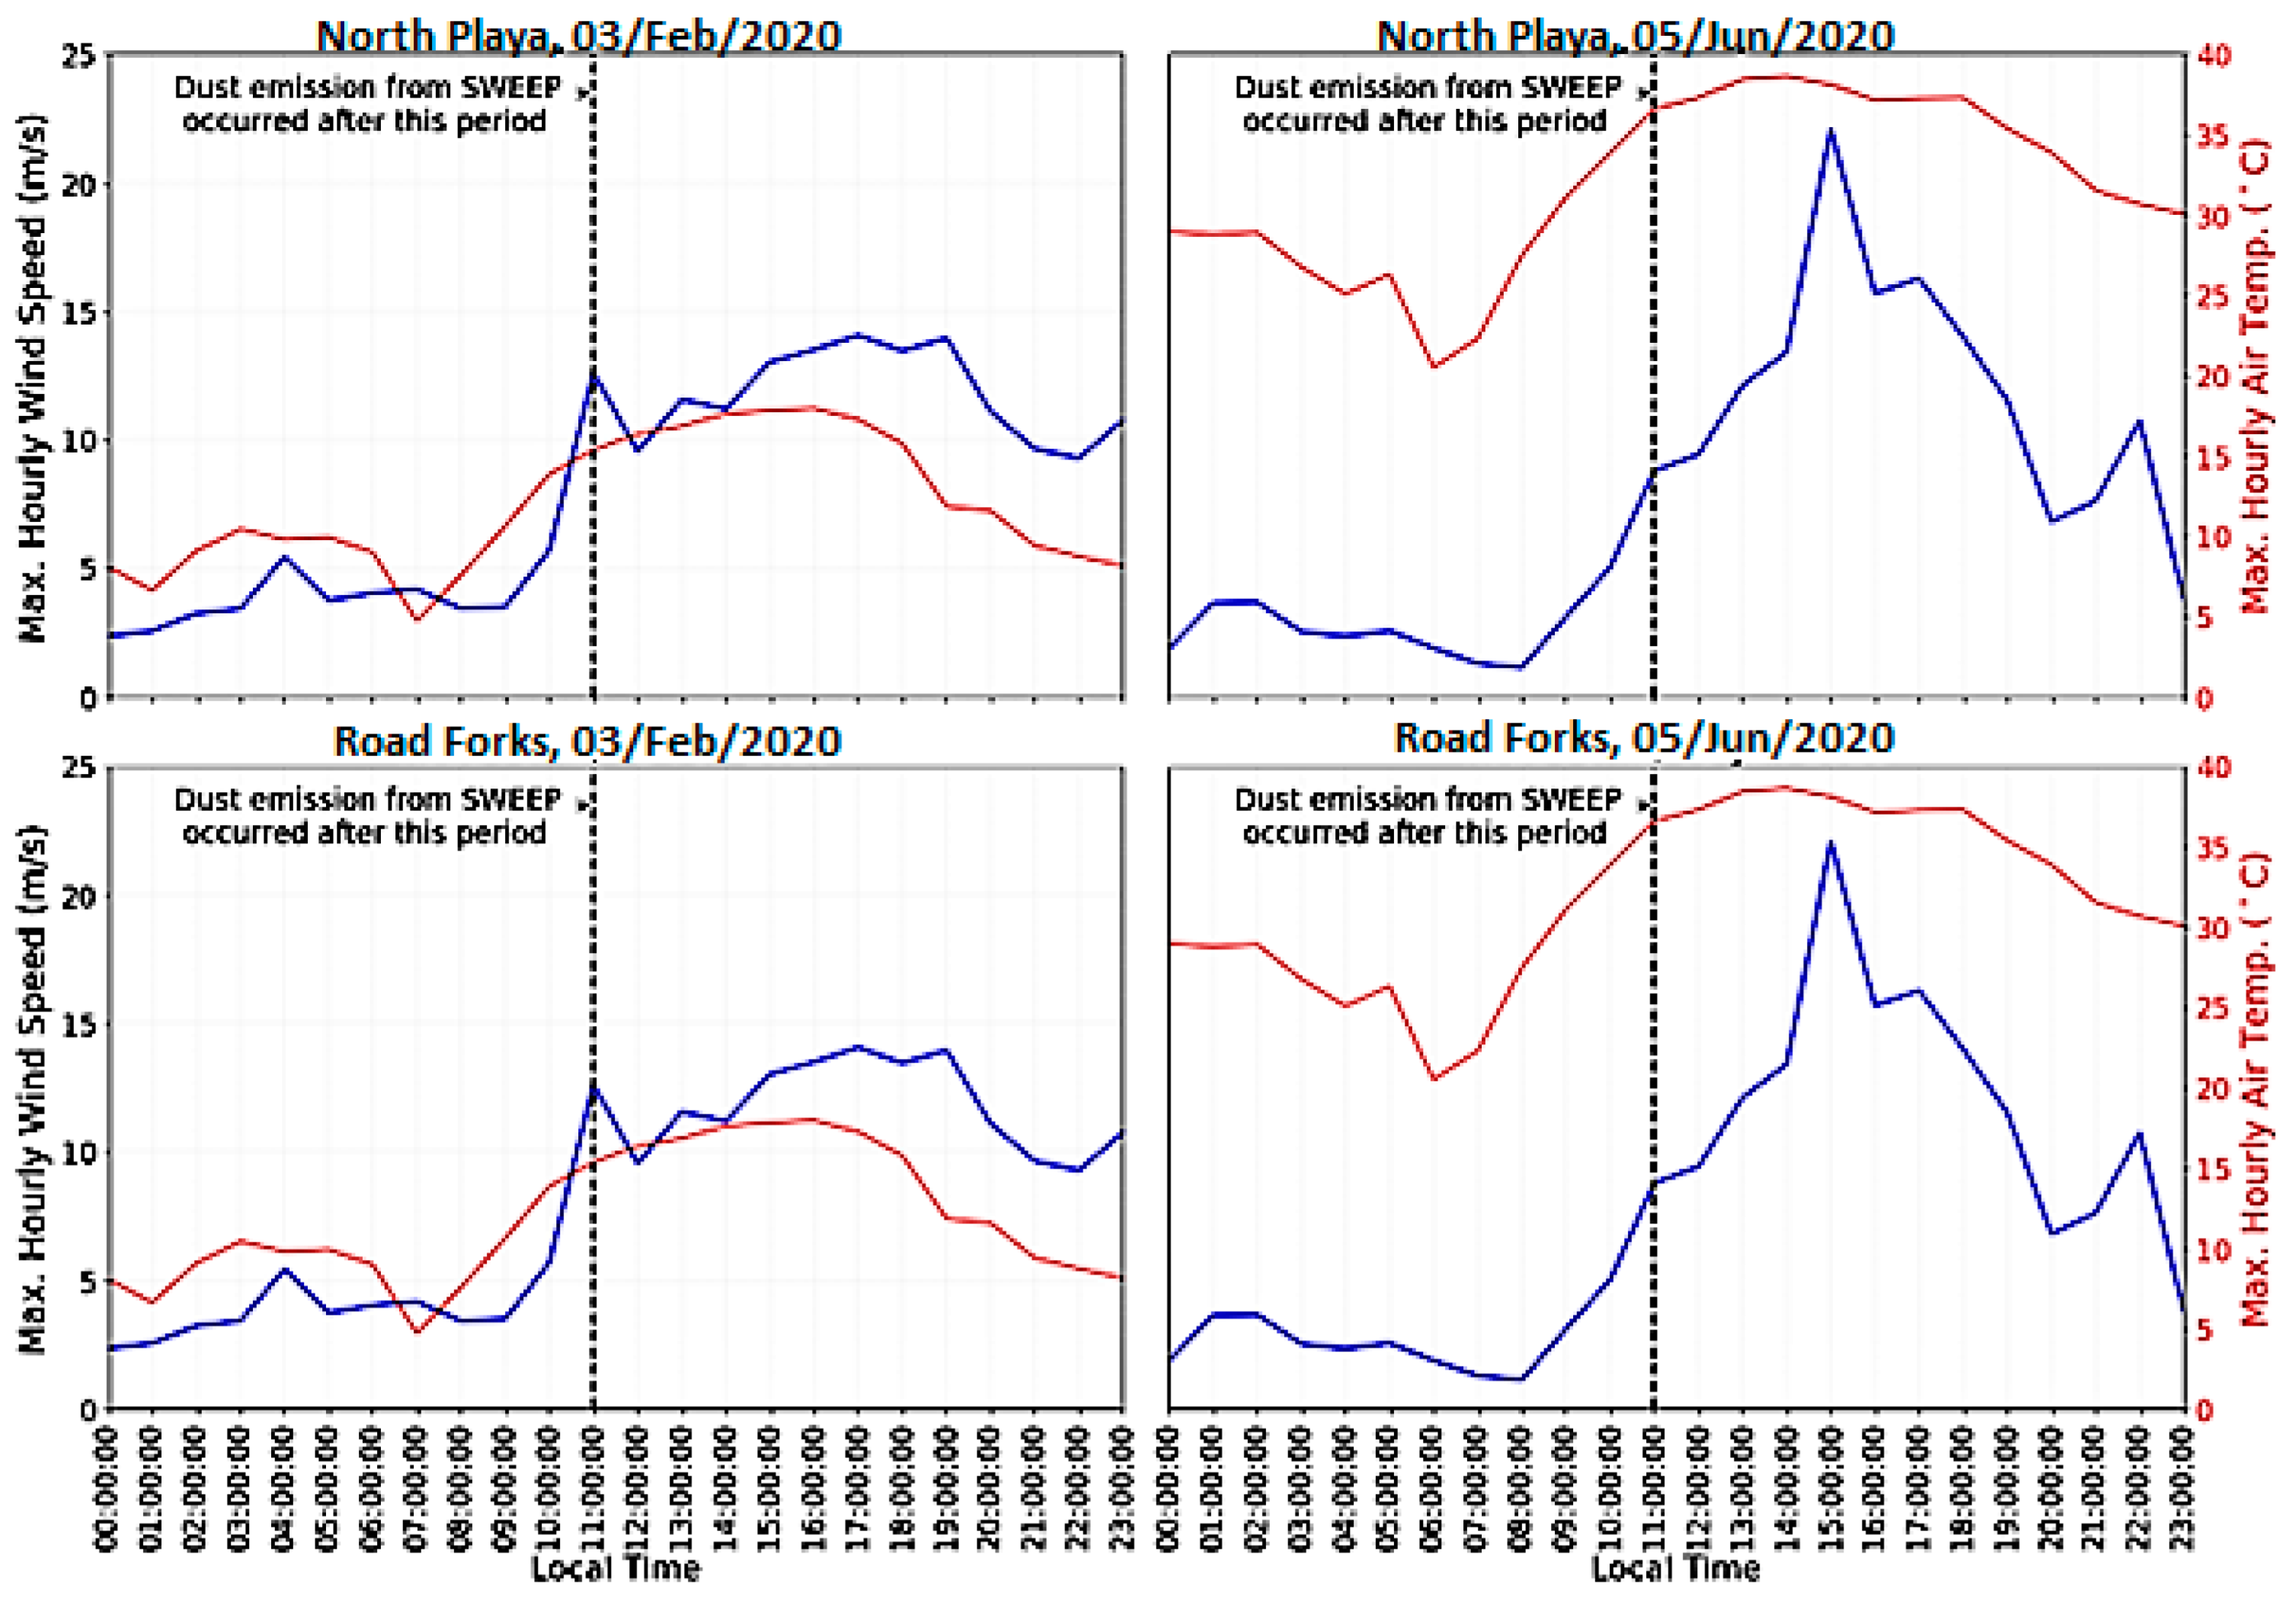
| Wind speed (m/s) | Refer to Figure 4 | ||||
References
- World Health Organization. Global Status Report on Road Safety 2018; World Health Organization: Geneva, Switzerland, 2018. [Google Scholar]
- Ashley, W.S.; Strader, S.; Dziubla, C.C.; Haberlie, A. Driving blind: Weather-related vision hazards and fatal motor vehicle crashes. Bull. Am. Meteorol. Soc. 2015, 96, 755–778. [Google Scholar] [CrossRef]
- Bhattachan, A.; Okin, G.S.; Zhang, J.; Vimal, S.; Lettenmaier, D.P. Characterizing the role of wind and dust in traffic accidents in California. GeoHealth 2019, 3, 307–328. [Google Scholar] [CrossRef] [PubMed]
- Li, J.; Kandakji, T.; Lee, J.A.; Tatarko, J.; Blackwell, J.; Gill, T.E.; Collins, J.D. Blowing dust and highway safety in the southwestern United States: Characteristics of dust emission “hotspots” and management implications. Sci. Total Environ. 2018, 621, 1023–1032. [Google Scholar] [CrossRef] [PubMed]
- Van Pelt, R.S.; Tatarko, J.; Gill, T.E.; Chang, C.; Li, J.; Eibedingil, I.G.; Mendez, M. Dust emission source characterization for visibility hazard assessment on Lordsburg Playa in Southwestern New Mexico, USA. Geoenviron. Disasters 2020, 7, 34. [Google Scholar] [CrossRef] [PubMed]
- Miri, A.; Middleton, N. Long-term impacts of dust storms on transport systems in south-eastern Iran. Nat. Hazards 2022, 114, 291–312. [Google Scholar] [CrossRef]
- Pan, J.; Zhao, H.; Wang, Y.; Liu, G. The Influence of Aeolian Sand on the Anti-Skid Characteristics of Asphalt Pavement. Materials 2021, 14, 5523. [Google Scholar] [CrossRef]
- Lader, G.; Raman, A.; Davis, J.T.; Waters, K. Blowing Dust and Dust Storms: One of Arizona’s Most Underrated Weather Hazards; NOAA Technical Memorandum NWS-WR-290; Science and Technology Infusion Division, National Weather Service: Salt Lake City, UT, USA, 2016. [Google Scholar]
- Gillette, D.A. A qualitative geophysical explanation for “hot spot” dust emitting source regions. Contrib. Atmos. Phys. 1999, 72, 67–77. [Google Scholar]
- Gill, T.E. Eolian sediments generated by anthropogenic disturbance of playas: Human impacts on the geomorphic system and geomorphic impacts on the human system. Geomorphology 1996, 17, 207–228. [Google Scholar] [CrossRef]
- Prospero, J.M.; Ginoux, P.; Torres, O.; Nicholson, S.E.; Gill, T.E. Environmental characterization of global sources of atmospheric dust identified with the Nimbus-7 Total ozone mapping spectrometer (TOMS) absorbing aerosol products. Rev. Geophys. 2002, 40, 1002. [Google Scholar] [CrossRef]
- Rivera Rivera, N.I.; Gill, T.E.; Gebhart, K.A.; Hand, J.L.; Bleiweiss, M.P.; Fitzgerald, R.M. Wind modeling of Chihuahuan Desert dust outbreaks. Atmos. Environ. 2009, 43, 347–354. [Google Scholar] [CrossRef]
- Baddock, M.C.; Gill, T.E.; Bullard, J.E.; Dominguez Acosta, M.; Rivera Rivera, N. Geomorphology of the Chihuahuan Desert based on potential dust emissions. J. Maps 2011, 7, 249–259. [Google Scholar] [CrossRef]
- Gillette, D.; Niemeyer, T.C.; Helm, P.J. Supply-limited horizontal sand drift at an ephemerally crusted, unvegetated saline playa. J. Geophys. Res.—Atmos. 2001, 106, 18085–18098. [Google Scholar] [CrossRef]
- Lee, J.A.; Gill, T.E.; Mulligan, K.R.; Dominguez Acosta, M.; Perez, A.E. Land use/land cover and point sources of the 15 December 2003 dust storm in southwestern North America. Geomorphology 2009, 105, 18–27. [Google Scholar] [CrossRef]
- Baddock, M.C.; Zobeck, T.M.; Van Pelt, R.S.; Fredrickson, E.L. Dust emissions from undisturbed and disturbed, crusted playa surfaces: Cattle trampling effects. Aeolian Res. 2011, 3, 31–41. [Google Scholar] [CrossRef]
- Cahill, T.A.; Gill, T.E.; Reid, J.S.; Gearhart, E.A.; Gillette, D.A. Saltating particles, playa crusts, and dust aerosols at Owens (dry) Lake, California. Earth Surf. Process. Landf. 1996, 21, 621–639. [Google Scholar] [CrossRef]
- Houser, C.A.; Nickling, W.G. The emission and vertical flux of particulate matter <10 μm from a disturbed clay-crusted surface. Sedimentology 2001, 48, 255–267. [Google Scholar] [CrossRef]
- Macpherson, T.; Nickling, W.G.; Gillies, J.A.; Etyemezian, V. Dust emissions from undisturbed and disturbed supply-limited desert surfaces. J. Geophys. Res.—Earth Surf. 2008, 113, F02S04. [Google Scholar] [CrossRef]
- Haas, T.P. Traffic counts—New Mexico interstates. Report prepared by the New Mexico Department of Transportation for the Transportation Infrastructure Revenue Subcommittee Meeting, 10 October 2017. 2017. Available online: https://www.nmlegis.gov/handouts/TIRS%20101017%20Item%201%20B%20-%20Interstate%20Traffic%20data-map.pdf (accessed on 30 June 2022).
- Tong, D.; Feng, I.; Wang, G.; Gill, T. Rising Dust and Impact on American Public: How Many People Were Killed by Windblown Dust Events? In Proceedings of the Air and Waste Management Association 114th Annual Conference and Exhibition, Virtual Conference, 11–14 June 2021. [Google Scholar]
- Botkin, T.; Hutchinson, B. Lordsburg Playa Dust Storm Mitigation Update. Presented at the USA National Weather Service 9th Dust Storm Workshop, Coolidge, AZ, USA, March 2020. Available online: https://www.weather.gov/media/psr/Dust/2020/9_BOTKIN_DustMitigation_AZ_2020.pdf (accessed on 30 June 2022).
- ADOT (Arizona Department of Transportation). U.S. 70 Safford to New Mexico State Line Interstate Detour Needs Study; Report Prepared for the Arizona Department of Transportation, Contract #17–171965, Task #MPD 00018–19; 2019; 60p. Available online: https://azdot.gov/sites/default/files/media/2020/01/US70_Interstate_Detour_Needs_Study_FinalReport.pdf (accessed on 30 June 2022).
- New Mexico Department of Transportation. Dust Mitigation Safety Projects: Interstate 10. In Proceedings of the New Mexico Transportation and Construction Conference, Las Cruces, NM, USA, April 2018. [Google Scholar]
- Associated Press. 2 killed in freeway crash in NM dust storm. published on February 24, 2017. 2017. Available online: http://www.lcsun-news.com/story/news/local/2017/02/24/2-killed-freeway-crash-nm-duststorm/98369206/ (accessed on 30 June 2022).
- Mejia, J.F.; Gillies, J.A.; Etyemezian, V.; Glick, R. A very-high resolution (20m) measurement-based dust emissions and dispersion modeling approach for the Oceano Dunes, California. Atmos. Environ. 2019, 218, 116977. [Google Scholar] [CrossRef]
- Cimorelli, A.J.; Perry, S.G.; Venkatram, A.; Weil, J.C.; Paine, R.J.; Wilson, R.B.; Lee, R.F.; Peters, W.D.; Brode, R.W. AERMOD: A dispersion model for industrial source applications. Part I: General model formulation and boundary layer characterization. J. Appl. Meteorol. 2005, 44, 682–693. [Google Scholar] [CrossRef]
- Perry, S.G.; Cimorelli, A.J.; Paine, R.J.; Brode, R.W.; Weil, J.C.; Venkatram, A.; Wilson, R.B.; Lee, R.F.; Peters, W.D. AERMOD: A dispersion model for industrial source applications. Part II: Model performance against 17 field study databases. J. Appl. Meteorol. 2005, 44, 694–708. [Google Scholar] [CrossRef]
- Jarrah, M.; Mayel, S.; Tatarko, J.; Funk, R.; Kuka, K. A review of wind erosion models: Data requirements, processes, and validity. Catena 2020, 187, 104388. [Google Scholar] [CrossRef]
- Barjoee, S.S.; Azimzadeh, H.R.; Arani, A.M. Application of SWEEP and AERMOD Models to Simulate PM10 Emission Risk from Primary Materials and Waste Depos of Tile and Ceramic, Khak-e-Chini and Glass Industries of Ardakan, Yazd, Iran in 2018. J. Environ. Health Eng. 2020, 7, 401–426. [Google Scholar]
- Smyth, T.A.G. A review of Computational Fluid Dynamics (CFD) airflow modelling over aeolian landforms. Aeolian Res. 2016, 22, 153–164. [Google Scholar] [CrossRef]
- Alizadeh, D.A.; Ghavidel, A.; Panahandeh, M. CFD modeling of particulate matter dispersion from Kerman cement plant. Iran. J. Health Environ. 2010, 3, 67–74. [Google Scholar]
- Tang, W.; Huber, A.; Bell, B.; Schwarz, W. Application of CFD simulations for short range atmospheric dispersion over open fields and within arrays of buildings. In Proceedings of the 14th Joint Conference on the Applications of Air Pollution Meteorology with the A&WMA, Atlanta, GA, USA, 30 January–2 February 2006; Preprints; American Meteorological Society Annual Meeting; J1.8. Available online: https://ams.confex.com/ams/pdfpapers/104335.pdf (accessed on 30 June 2022).
- Richter, D.; Gill, T. Challenges and opportunities in atmospheric dust emission, chemistry, and transport. Bull. Am. Meteorol. Soc. 2018, 99, ES115–ES118. [Google Scholar] [CrossRef]
- Gill, T.E.; Eibedingil, I.G.; Van Pelt, R.S.; Li, J.; Mendez, M.; Saucedo, J.; Jin, L. Quantifying Bioavailable Metals and Potential Dust Emissions from Highway-Related and Desert Sediments at Lordsburg Playa, New Mexico; Final Report to the Center for Advancing Research in Transportation Emissions, Energy, and Health; 2021 54p. Available online: https://rosap.ntl.bts.gov/view/dot/62431 (accessed on 30 June 2022).
- Allen, B.D. Ice age lakes in New Mexico. N. M. Mus. Nat. Hist. Sci. Bull. 2005, 28, 107–113. [Google Scholar]
- Eibedingil, I.G.; Gill, T.E.; Van Pelt, R.S.; Tong, D.Q. Combining Optical and Radar Satellite Imagery to Investigate the Surface Properties and Evolution of the Lordsburg Playa, New Mexico, USA. Remote Sens. 2021, 13, 3402. [Google Scholar] [CrossRef]
- Klose, M.; Gill, T.E.; Etyemezian, V.; Nikolich, G.; Zadeh, Z.G.; Webb, N.P.; Van Pelt, R.S. Dust emission from crusted surfaces: Insights from field measurements and modelling. Aeolian Res. 2019, 40, 1–14. [Google Scholar] [CrossRef]
- Botkin, T.; Hutchison, B. Dust Storm Mitigation Update: Lordsburg Playa Dust Storms. Presentation at the USA National Weather Service 8th Dust Storm Workshop, Coolidge, AZ, USA, March 2019. Available online: https://www.weather.gov/media/psr/Dust/2019/12_BOTKIN%20DustMitigation_AZ2019.pdf (accessed on 3 August 2022).
- U.S. Department of the Interior. Bureau of Land Management Emergency closure of the Lordsburg playa to off-highway vehicles (OHV), Hidalgo County, NM. Fed. Regist. 1998, 63, 34661. [Google Scholar]
- Rivera, N.I.R.; Gill, T.E.; Bleiweiss, M.P.; Hand, J.L. Source characteristics of hazardous Chihuahuan Desert dust outbreaks. Atmos. Environ. 2010, 44, 2457–2468. [Google Scholar] [CrossRef]
- McLemore, V.T.; Elston, W.E. Geology and mineral occurrences of the mineral districts of Hidalgo County, southern New Mexico. N.M.Geol. Soc. Annu. Fall Field Conf. Guideb. 2000, 51, 253–262. [Google Scholar]
- Gill, T.E.; Gillette, D.A.; Niemeyer, T.; Winn, R.T. Elemental geochemistry of wind-erodible playa sediments, Owens Lake, California. Nucl. Instrum. Methods Phys. Res. 2002, 189, 209–213. [Google Scholar] [CrossRef]
- Kim, C.S.; Anthony, T.L.; Goldstein, D.; Rytuba, J.J. Windborne transport and surface enrichment of arsenic in semi-arid mining regions: Examples from the Mojave Desert, California. Aeolian Res. 2014, 14, 85–96. [Google Scholar] [CrossRef]
- Fubini, B.; Arean, C.O. Chemical aspects of the toxicity of inhaled mineral dusts. Chem. Soc. Rev. 1999, 28, 373–381. [Google Scholar] [CrossRef]
- Tatarko, J.; Wagner, L.; Fox, F. The Wind Erosion Prediction System and its Use in Conservation Planning. In Bridging among Disciplines by Synthesizing Soil and Plant Processes; Wendroth, O., Lascano, R.J., Ma, L., Eds.; Advances in Agricultural System Modeling; American Society of Agronomy: Madison, WI, USA, 2019; Volume 8, pp. 71–101. [Google Scholar] [CrossRef]
- Tatarko, J.; van Donk, S.J.; Ascough, J.C.; Walker, D.G. Application of the WEPS and SWEEP models to non-agricultural disturbed lands. Heliyon 2016, 2, e00215. [Google Scholar] [CrossRef] [PubMed]
- USDA-ARS. Single-Event Wind Erosion Evaluation Program SWEEP User Manual Draft. 2007. Available online: https://infosys.ars.usda.gov/WindErosion/weps/download/archive/SWEEPUserGuide.pdf (accessed on 30 June 2022).
- Hagen, L.J.; Wagner, L.E.; Tatarko, J.; Skidmore, E.L.; Durar, A.A.; Steiner, L.J.; Schomberg, H.H.; Retta, A.; Armbrust, D.V.; Zobeck, T.M.; et al. Wind erosion prediction system: Technical description. In Proceedings of WEPP/WEPS Symposium; Soil and Water Conservation Society: Des Moines, IA, USA; Ankeny, IA, USA, 1995; Volume 9111. [Google Scholar]
- Pi, H.; Webb, N.P.; Huggins, D.R.; Sharratt, B.; Li, S. Performance of the single-event wind erosion evaluation program (SWEEP) model in assessing the impact of crop rotation, green manure, fertilizer, and tillage on wind erosion. Land Degrad. Dev. 2022, 33, 1787–1798. [Google Scholar] [CrossRef]
- Pi, H.; Sharratt, B.; Feng, G.; Lei, J.; Li, X.; Zheng, Z. Validation of SWEEP for creep, saltation, and suspension in a desert-oasis ecotone. Aeolian Res. 2016, 20, 157–168. [Google Scholar] [CrossRef]
- Jiang, Y.; Gao, Y.; Dong, Z.; Liu, B.; Zhao, L. Simulations of wind erosion along the Qinghai-Tibet Railway in north-central Tibet. Aeolian Res. 2018, 32, 192–201. [Google Scholar] [CrossRef]
- Maurer, T.; Gerke, H.H. Modelling aeolian sediment transport during initial soil development on an artificial catchment using WEPS and aerial images. Soil Tillage Res. 2011, 117, 148–162. [Google Scholar] [CrossRef]
- Jia, Q.; Al-Ansari, N.; Knutsson, S. Modeling of wind erosion of the Aitik Tailings Dam using SWEEP model. Engineering 2014, 6, 355–364. [Google Scholar] [CrossRef]
- U.S. Department of the Interior, Bureau of Land Management. Road Forks Dust Mitigation Project Environmental Assessment. Document No. IT4RM-L000-2018-0056-EA. 2018. Available online: https://dot.state.nm.us/content/dam/nmdot/D1/I-10%20Dust%20Mitigation%20Project%20Road%20Forks.pdf (accessed on 30 June 2022).
- Botkin, T.; Hutchison, B. 2021 Lordsburg Playa Dust Storm Mitigation Update. Presentation at the USA National Weather Service 10th Dust Storm Workshop, Coolidge, AZ, USA, March 2021. Available online: https://youtu.be/dFv3cCKFtkI (accessed on 3 August 2022).
- Novlan, D.J.; Hardiman, M.; Gill, T.E. A synoptic climatology of blowing dust events in El Paso, Texas from 1932–2005. In Proceedings of the 16th Conference on Applied Climatology, 2007; American Meteorological Society Annual Meeting, J3.12; Preprints. Available online: https://ams.confex.com/ams/pdfpapers/115842.pdf (accessed on 30 June 2022).
- Gascon, F.; Bouzinac, C.; Thépaut, O.; Jung, M.; Francesconi, B.; Louis, J.; Lonjou, V.; Lafrance, B.; Massera, S.; Gaudel-Vacaresse, A.; et al. Copernicus Sentinel-2A calibration and products validation status. Remote Sens. 2017, 9, 584. [Google Scholar] [CrossRef]
- USDA-NRCS. Web Soil Survey. 2019. Available online: https://websoilsurvey.sc.egov.usda.gov/App/WebSoilSurvey.aspx (accessed on 30 June 2022).
- Bobo, M.; Karl, M.G.; Miller, S.W.; Spurrier, C.; Taylor, J.M.; Toevs, G.R. AIM-Monitoring: A Component of the BLM Assessment, Inventory, and Monitoring Strategy; U.S. Department of the Interior, Bureau of Land Management, National Operations Center: Denver, CO, USA, 2018. [CrossRef]
- New Mexico Climate Center. 2020. Available online: https://weather.nmsu.edu/nmdot-lp/ (accessed on 30 June 2022).
- U.S. EPA. User’s Guide for the AERMOD Meteorological Preprocessor (AERMET); Office of Air Quality Planning and Standards: Research Triangle Park, NC, USA, 2019.
- Cimorelli, A.J.; Perry, S.G.; Venkatram, A.; Weil, J.C.; Paine, R.J.; Peters, W.D. AERMOD—Description of model formulation. U.S. Environmental Protection Agency Document EPA-454/R-03-004. 1998. Available online: https://gaftp.epa.gov/Air/aqmg/SCRAM/models/preferred/aermod/aermod_mfd.pdf (accessed on 3 August 2022).
- Heckel, P.F.; Lemasters, G.K. The use of AERMOD air pollution dispersion models to estimate residential ambient concentrations of elemental mercury. Water Air Soil Pollut. 2011, 219, 377–388. [Google Scholar] [CrossRef]
- U.S. EPA. AERMOD Model Formulation and Evaluation. 2018. Available online: https://www3.epa.gov/ttn/scram/models/aermod/aermod_mfed.pdf (accessed on 30 November 2020).
- Willis, G.E.; Deardorff, J.W. A laboratory study of dispersion from a source in the middle of the convectively mixed layer. Atmos. Environ. 1981, 15, 109–117. [Google Scholar] [CrossRef]
- Zou, B.; Zhan, F.B.; Wilson, J.G.; Zeng, Y. Performance of AERMOD at different time scales. Simul. Model. Pract. Theory 2010, 18, 612–623. [Google Scholar] [CrossRef]
- Rood, A.S. Performance evaluation of AERMOD, CALPUFF, and legacy air dispersion models using the Winter Validation Tracer Study dataset. Atmos. Environ. 2014, 89, 707–720. [Google Scholar] [CrossRef]
- Chavez, M.; Li, W.W. Comparison of modeled-to-monitored PM2.5 exposure concentrations resulting from transportation emissions in a near-road community. Transp. Res. Rec. 2020, 24, 130–143. [Google Scholar] [CrossRef]
- Amer, N.H.; Abbas, A.A. Combined Influence of Stack Height and Exit Velocity on Dispersion of Pollutants Caused by Helwan Cement Factory (Study using AERMOD Model). Int. J. Comput. Appl. 2015, 121, 19–24. [Google Scholar]
- Hadlocon, L.S.; Zhao, L.Y.; Bohrer, G.; Kenny, W.; Garrity, S.R.; Wang, J.; Wyslouzil, B.; Upadhyay, J. Modeling of particulate matter dispersion from a poultry facility using AERMOD. J. Air Waste Manag. Assoc. 2015, 65, 206–217. [Google Scholar] [CrossRef]
- Fadavi, A.; Abari, M.F.; Nadoushan, M.A. Evaluation of AERMOD for Distribution Modeling of Particulate Matters (Case Study: Ardestan Cement Factory). Int. J. Pharm. Res. Allied Sci. 2016, 5, 262–270. [Google Scholar]
- Botlaguduru, V.S.V. Comparison of AERMOD and ISCST3 Models for Particulate Emissions from Ground Level Sources. Master’s Thesis, Texas A & M University, College Station, TX, USA, 2010. [Google Scholar]
- Tartakovsky, D.; Stern, E.; Broday, D.M. Dispersion of TSP and PM10 emissions from quarries in complex terrain. Sci. Total Environ. 2016, 542, 946–954. [Google Scholar] [CrossRef]
- Tian, S.; Liang, T.; Li, K. Fine road dust contamination in a mining area presents a likely air pollution hotspot and threat to human health. Environ. Int. 2019, 128, 201–209. [Google Scholar] [CrossRef]
- Westbrook, J.A.; Sullivan, P.S. Fugitive dust modeling with AERMOD for PM10 emissions from a municipal waste landfill. In Proceedings of the A&WMA Specialty Conference, Guideline on Air Quality Models: Applications and FLAG Developments 2006; Air and Waste Management Association: Pittsburgh, PA, USA, 2006; Publication CP-164; pp. 207–223. [Google Scholar]
- Chalvatzaki, E.; Glytsos, T.; Lazaridis, M. A methodology for the determination of fugitive dust emissions from landfill sites. Int. J. Environ. Health Res. 2015, 25, 551–569. [Google Scholar] [CrossRef]
- Ono, D.; Kiddoo, P.; Howard, C.; Davis, G.; Richmond, K. Application of a Combined Measurement and Modeling Method to Quantify Windblown Dust Emissions from the Exposed Playa at Mono Lake, California. J. Air Waste Manag. Assoc. 2011, 61, 1036–1045. [Google Scholar] [CrossRef][Green Version]
- U.S. EPA. AERMINUTE User’s Guide; Office of Air Quality Planning and Standards: Research Triangle Park, NC, USA, 2015.
- U.S. EPA. User’s Guide for AERSURFACE Tool; Office of Air Quality Planning and Standards: Research Triangle Park, NC, USA, 2020.
- U.S. EPA. User’s Guide for the AERMOD Terrain Preprocessor (AERMAP); Office of Air Quality Planning and Standards: Research Triangle Park, NC, USA, 2018.
- Wickham, J.; Homer, C.; Vogelmann, J.; McKerrow, A.; Mueller, R.; Herold, N.; Coulston, J. The Multi-Resolution Land Characteristics (MRLC) Consortium—20 Years of Development and Integration of USA National Land Cover Data. Remote Sens. 2014, 6, 7424–7441. [Google Scholar] [CrossRef]
- Yang, L.; Jin, S.; Danielson, P.; Homer, C.; Gass, L.; Bender, S.M.; Case, A.; Costello, C.; Dewitz, J.; Fry, J.; et al. A new generation of the United States National Land Cover Database: Requirements, research priorities, design, and implementation strategies. ISPRS J. Photogramm. Remote Sens. 2018, 146, 108–123. [Google Scholar] [CrossRef]
- U.S. Department of Transportation. 5.1.4 Recommended Guidelines—FHWA. 2016. Available online: https://mutcd.fhwa.dot.gov/rpt/tcstoll/chapter514.htm (accessed on 30 June 2022).
- Al-Rajhi, M.A.; Al-Shayeb, S.M.; Seaward, M.R.D.; Edwards, H.G.M. Particle size effect for metal pollution analysis of atmospherically deposited dust. Atmos. Environ. 1996, 30, 145–153. [Google Scholar] [CrossRef]
- Palleschi, S.; Rossi, B.; Armiento, G.; Montereali, M.R.; Nardi, E.; Tagliani, S.M.; Inglessis, M.; Gianfagna, A.; Silvestroni, L. Toxicity of the readily leachable fraction of urban PM2.5 to human lung epithelial cells: Role of soluble metals. Chemosphere 2018, 196, 35–44. [Google Scholar] [CrossRef]
- Monsé, C.; Raulf, M.; Jettkant, B.; van Kampen, V.; Kendzia, B.; Schürmeyer, L.; Seifert, C.E.; Marek, E.M.; Westphal, G.; Rosenkranz, N.; et al. Health effects after inhalation of micro-and nano-sized zinc oxide particles in human volunteers. Arch. Toxicol. 2021, 95, 53–65. [Google Scholar] [CrossRef]
- Councell, T.B.; Duckenfield, K.U.; Landa, E.R.; Callender, E. Tire-wear particles as a source of zinc to the environment. Environ. Sci. Technol. 2004, 38, 4206–4214. [Google Scholar] [CrossRef]
- Tartakovsky, D.; Stern, E.; Broday, D.M. Comparison of dry deposition estimates of AERMOD and CALPUFF from area sources in flat terrain. Atmos. Environ. 2016, 142, 430–432. [Google Scholar] [CrossRef]
- Zucca, C.; Middleton, N.; Kang, U.; Liniger, H. Shrinking water bodies as hotspots of sand and dust storms: The role of land degradation and sustainable soil and water management. Catena 2021, 207, 105669. [Google Scholar] [CrossRef]
- Eibedingil, I.G. Drought, Dust Storm and Particulate Matter Pollution and Their Interaction at the Cascade of Spatial Scales across the Western United States. Ph.D. Thesis, Environmental Science and Engineering. The University of Texas at El Paso, El Paso, TX, USA, 2021. Available online: https://scholarworks.utep.edu/open_etd/3243/ (accessed on 3 August 2022).


| Field | 3 February 2020 | 5 June 2020 | ||||||||||
|---|---|---|---|---|---|---|---|---|---|---|---|---|
| North Playa | Road Forks | North Playa | Road Forks | |||||||||
| x | y | Area | x | Y | Area | X | Y | Area | x | y | Area | |
| 1 | 213.13 | 401.70 | 85,604 | 29.62 | 186.02 | 5509 | 143.25 | 619.88 | 88,785 | 54.30 | 125.04 | 6789 |
| 2 | 213.14 | 714.72 | 152,188 | 29.62 | 309.80 | 9182 | 214.90 | 1416.86 | 304,400 | 54.30 | 400.11 | 21,724 |
| 3 | 213.15 | 1159.38 | 247,308 | 29.62 | 454.74 | 13,467 | 214.90 | 1549.33 | 332,938 | 54.30 | 550.15 | 29,871 |
| 4 | 213.16 | 1472.94 | 313,893 | 118.48 | 579.22 | 68,561 | 214.90 | 1549.69 | 332,935 | 54.31 | 625.17 | 33,944 |
| 5 | 213.17 | 1517.59 | 323,410 | 88.86 | 558.08 | 49,585 | 214.90 | 1549.68 | 332,932 | 108.61 | 625.17 | 67,889 |
| 6 | 213.17 | 1517.61 | 323,415 | 88.86 | 454.67 | 40,403 | 214.90 | 1549.67 | 332,929 | 108.61 | 600.17 | 65,174 |
| 7 | 213.17 | 1517.62 | 323,419 | 88.86 | 434.07 | 38,567 | 214.90 | 1549.65 | 332,925 | 54.31 | 575.16 | 31229 |
| 8 | 213.17 | 1517.63 | 323,421 | 88.86 | 372.07 | 33,057 | 501.39 | 1549.66 | 776,808 | 54.30 | 225.06 | 12220 |
| 9 | 213.17 | 1517.63 | 323,423 | 59.24 | 351.57 | 20,814 | 143.27 | 1239.69 | 177,553 | 54.30 | 100.03 | 5431 |
| 10 | 213.17 | 1517.64 | 323,424 | - | - | - | - | - | - | - | - | - |
| 11 | 213.17 | 1517.64 | 323,424 | - | - | - | - | - | - | - | - | - |
| 12 | 142.10 | 757.98 | 107,808 | - | - | - | - | - | - | - | - | - |
Publisher’s Note: MDPI stays neutral with regard to jurisdictional claims in published maps and institutional affiliations. |
© 2022 by the authors. Licensee MDPI, Basel, Switzerland. This article is an open access article distributed under the terms and conditions of the Creative Commons Attribution (CC BY) license (https://creativecommons.org/licenses/by/4.0/).
Share and Cite
Eibedingil, I.G.; Gill, T.E.; Van Pelt, R.S.; Tatarko, J.; Li, J.; Li, W.-W. Applying Wind Erosion and Air Dispersion Models to Characterize Dust Hazard to Highway Safety at Lordsburg Playa, New Mexico, USA. Atmosphere 2022, 13, 1646. https://doi.org/10.3390/atmos13101646
Eibedingil IG, Gill TE, Van Pelt RS, Tatarko J, Li J, Li W-W. Applying Wind Erosion and Air Dispersion Models to Characterize Dust Hazard to Highway Safety at Lordsburg Playa, New Mexico, USA. Atmosphere. 2022; 13(10):1646. https://doi.org/10.3390/atmos13101646
Chicago/Turabian StyleEibedingil, Iyasu G., Thomas E. Gill, R. Scott Van Pelt, John Tatarko, Junran Li, and Wen-Whai Li. 2022. "Applying Wind Erosion and Air Dispersion Models to Characterize Dust Hazard to Highway Safety at Lordsburg Playa, New Mexico, USA" Atmosphere 13, no. 10: 1646. https://doi.org/10.3390/atmos13101646
APA StyleEibedingil, I. G., Gill, T. E., Van Pelt, R. S., Tatarko, J., Li, J., & Li, W.-W. (2022). Applying Wind Erosion and Air Dispersion Models to Characterize Dust Hazard to Highway Safety at Lordsburg Playa, New Mexico, USA. Atmosphere, 13(10), 1646. https://doi.org/10.3390/atmos13101646