Abstract
We present a study concerning the thermospheric O/N2 variations for the period 2002 to 2020, using the measurements of global ultraviolet imager (GUVI) onboard TIMED satellite. In this regard, monthly averaged O/N2 was computed—using the five quietest days of the month—at low- and mid-latitudes. To find the longitudinal dependence of thermospheric variations, the analysis is further extended to different longitudinal sectors, namely Asia, Africa, and America. We found that the latitudinal and longitudinal O/N2 variations follow the solar activity. These variations, during a high solar activity in northern winter, are found to be always much greater than southern winter and northern summer. The latitudinal and longitudinal variations of O/N2 at low- and mid-latitudes in December solstice are observed to be higher than June solstice counterparts in the northern hemisphere. We also computed the amplitudes of annual and semiannual variations using the bandpass filters. The former variations of O/N2 for low-latitudes do not follow the solar activity in the southern hemisphere. Moreover, these variations are stronger for mid-latitudes as compared with low-latitude regions. Similarly, the annual variations in Asian and African sectors of southern hemisphere do not follow the solar cycle (SC) trends. In the northern hemisphere, the variations are stronger during a solar maximum than in the southern counterpart. The observed semiannual variations are in-phase for both hemispheres; moreover, the corresponding amplitude remains almost the same at low- and mid-latitudes, while the semiannual variations for low-latitudes, and corresponding longitudinal regions, are stronger during a high solar activity. These variations, for mid-latitudes, in African, northern Asian, and southern American sectors do not follow the SC activity.
1. Introduction
The accurate forecasting of terrestrial ionosphere is a challenging task as it is strongly affected by the space weather and forcing from lower thermosphere [1]. In addition to other factors, ratio of atomic oxygen and molecular nitrogen (O/N2) is a significant parameter that can influence the variability of ionospheric electron density and is the topic of present study [2]. Rishbeth and Setty (1962) [3] were the first to use the neutral O/N2 concentration ratio for determining the loss and production rate of electrons in the F2-layer.
Anomalies are unexpected variations in the ionospheric parameters and are contrary to the predictions of Chapman (1940). For example, here we consider seasonal, annual, and semiannual anomalies, which are still not very well understood. The peak electron density in F2 (NmF2) profile in the ionosphere is higher in winter and this effect is referred to as seasonal (annual or winter) anomaly. The photodissociation of molecular oxygen—by solar ultraviolet radiations—produces an atomic oxygen [4]. The rate of increasing electrons in the F-region is mainly caused by the photoionization of atomic oxygen, whereas molecular nitrogen does not contribute significantly to the observed ionization [5,6].
During a high solar activity, the seasonal anomaly (winter maximum) in the northern hemisphere is due to the convection from summer to winter hemisphere. Moreover, such seasonal maxima can also be observed in the Australian–Indian ocean section of southern hemisphere, whereas, for rest of the globe, the semiannual anomaly (equinoctial maxima) is dominant. The variations in neutral densities, which are responsible for the equinoctial maxima, can be affected by auroral and geomagnetic activities. The southern-side convection from the northern summer to southern winter hemisphere is reduced at the solar minimum, consequently semiannual anomaly dominates in the south Pacific and south Atlantic regions [7]. Meier and Anderson (1983) [8] studied the characteristic emissions of the main thermospheric elements (N2, O2, and O) and absorption spectra in the case of O2 to provide information about the absolute concentrations of these elements. Strickland et al. (1995) [9] applied a novel technique (disk problem) to develop a functional relationship between the column densities ratios of O and N2 and FUV (far ultraviolet) airglow emission intensities. The Feng Yun 3-D satellite also provides FUV measurements [10]. Annual, seasonal, and semiannual variations in the total electron content (TEC) are also a direct consequence of (i) orbitally driven photoionization of the atomic/molecular density in the F2-layer and (ii) changes in thermospheric composition [11,12]. Rishbeth (1998) [5] analyzed the chemical composition variations of the F-region as affected by the thermospheric wind and also discussed the annual, seasonal, and semiannual fluctuations of the F2-layer at mid-latitudes during quiet and disturbed conditions. Burns et al. (2014) [13] investigated the dependence of winter anomaly on SC and pointed out that the said anomaly may be observed only during the maximum phase of a SC and can be associated with the enhanced winter to summer difference of thermospheric O/N2. Luan et al. (2017) [14] recently studied the longitudinal variations of O/N2 as affected by seasonal and local time variations. It was found that the thermospheric O/N2 at higher mid-latitudes is modulated by the Joule heating mechanism. Yue et al. (2019) [15] considered the features of annual and semiannual variations in O/N2 data using global ultraviolet imager (GUVI) limb measurements. In a more recent study, Qian et al. (2022) [16] analyzed the seasonal variations in O/N2 using GOLD satellite data and found that the southern hemisphere exhibits the well-known annual and semiannual patterns, whereas the northern hemisphere is dominated by the annual component. For a better understanding of O/N2 variations as affected by SC, longitudinal, and hemispherical asymmetries, one needs to examine the corresponding data over an extended period of time. Motivated by this, here we analyze the GUVI data for the period 2002–2020 to investigate the features of O/N2 variations at low and mid-latitudes. In this regard, global O/N2 ratio and corresponding anomalies are discussed at the corresponding latitudes as well as in different longitudinal sectors.
2. Data Set and Methodology
The TIMED satellite was launched on 06 December 2001 by NASA. It orbits around the Earth at an altitude of 625 km with an inclination of 74° and carries four instruments, namely GUVI, SEE, SABER, and TIDI. The GUVI is based on imaging spectroscopy which measures the spectral intensity of FUV airglow in the UV range of 110 nm to 180 nm for five selectable bands. The thermospheric O/N2 ratio can be obtained from the respective intensity ratio of excited photoelectron OI 135.6 nm emission band to N2 LBHS (Lyma-Birge-Hopfield short) emission band [9,17,18]. The O/N2 data is managed by Johns Hopkins University Applied Physics Laboratory (JHUAPL) and can be accessed in IDLSave format via web-link http://guvitimed.jhuapl.edu/data_fetch_l3_on2_idlsave, accessed on 10 March 2022. The monthly average value of ∑O/N2 over each mid- and low-latitudes region can be evaluated as
where i and j represent the lower and upper limits of latitudinal region, respectively. The index i (j) is 0(30) for low-latitudes and 30(60) for mid-latitudes (Table 1). Here, the dummy index n ranges from 1 to nm (=5) and represents the five geomagnetically quietest days of the month as provided by world data center for geomagnetism, Kyoto Japan (https://wdc.kugi.kyoto-u.ac.jp/qddays/) (accessed on 10 March 2022).

Table 1.
Geographic coordinates of low- and mid-latitudes regions.
The monthly averaged O/N2 in different longitudes is computed by choosing Equation (1) at the longitudinal limits of 60° to 150°, 30° to 60° and 30° to −120° for Asian, African, and American regions, respectively, as depicted in Table 2. As the O/N2 measurements by TIMED are not made at fixed local solar time, they have contributions from the local time variations. To minimize the impact of such perturbations in the seasonal analysis, we follow Yue et al. (2019) [15] who have proposed that the GUVI data should be binned bimonthly (January–February, March–April, May–June, July–August, September–October, and November–December), which essentially covers a yaw cycle approximately centered on the spacecraft yaw occurrence.

Table 2.
Geographic coordinates of low- and mid-latitudes longitudinal regions.
The annual variations in O/N2 have a period of 12 months, whereas semiannual variations correspond to oscillations with a 6-month periodicity. A finite impulse response band-pass filter has been employed to separate such variations. The upper and lower frequency bound for annual (semiannual) variations were 1/10.8 (1/6.5) months and 1/13.2 (1/5.4) months, respectively [19]. The data considered in this work include different phases of SC 23, complete SC 24, and an increasing phase of SC 25. Years corresponding to different phases of the considered SCs are depicted in Table 3.

Table 3.
Years corresponding to different phases of the considered SCs.
3. Results
3.1. Low- and Mid-Latitudinal Variations
Figure 1a,b show the monthly averaged O/N2 variations from January 2002 to December 2020 at the low- and mid-latitudes, respectively. During the SC 23 (2002–2008), the maximum (minimum) value in 2003 for northern low- latitudes (NLL) was 0.9 (0.52), which occurred in March (June) with a percentage difference of 42.2%. The maximum value of the said ratio during the SC 24 (2009–2020) for NLL was 0.8415 in November 2014. During the same year, the minimum value was found to be 0.4368 in June. The percentage difference between the maximum and minimum in the northern hemisphere was 48.1%. Similarly, the maximum value for southern low-latitudes (SLL) was 0.87 in March, and the minimum value was 0.54 in April of 2003, with a percentage difference of 38%. The highest value of monthly mean O/N2 for SLL, for the SC 24, was 0.7756 in May 2015, and the corresponding minimum value was 0.454 which occurred in June 2015. The percentage difference between these two values in SLL during 2015 was 41.5%. In NLL, the month of March exhibited the highest values of O/N2 for the years 2008–2009, 2015–2018, 2020, and 2019. Furthermore, the O/N2 ratio in November had the maximum value for the remaining years. January 2008, August 2009, June 2010–2019, and July 2020 had the lowest O/N2 variations in NLL. The months of March for 2008, 2009, 2014, 2017, 2018, and 2020, April 2010–2011, and May of the remaining years had the largest values in SLL. Figure 1a also depicts that January 2008, February for 2009 and 2011, December for 2010, 2012, 2013, and June 2014–2020 exhibited the lowest variations in SLL.
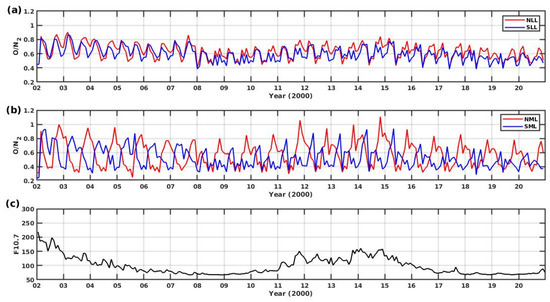
Figure 1.
(a) Monthly averaged O/N2 variations in both hemispheres for low-latitudes. (b) Monthly mean O/N2 variations in both hemispheres for mid-latitudes. (c) Solar index F10.7 variations during the SC 24.
In Figure 1b the highest O/N2 variations for northern mid-latitudes (NML) were 0.998 (March) with the lowest variations of 0.31 (January) during 2002 for the SC 23, having a percentage difference of 69. The maximum (minimum) monthly averaged O/N2 ratio, during 2008–2020 in NML, was 1.107 (0.3274) in November (June) 2014, having a percentage difference of 70.4%. The maxima during 2002–2008 for southern mid-latitudes (SML) was 0.93 in May 2002, and the minimum value was 0.24 in June, having a percentage difference of 74. The highest (lowest) value, during the SC 24 in SML, was 0.9384 (0.0.34) in May (December) 2015, with a percentage difference of 63.8%. November 2008–2020 exhibited the highest variations in NML. August 2008–2009, July 2019–2020, and June of the remaining years had the lowest variations in NML. Similarly, in SML the maximum ratios appeared in May 2008–2020, and the lowest values occurred in February 2008–2009, December of the years 2015, 2016, 2017, and 2020, and in June of the remaining years. Figure 1c shows the solar index F10.7 variations during the SCs 23 and 24; we note that the most (magnetically) disturbed years of the considered SCs were 2002 and 2012–2014, respectively. Our analysis of O/N2 ratio depicts that the maximum value of O/N2 in low- and mid-latitudes throughout the SCs 23 and 24 occurred in 2002–2003 and 2014–2015 for the northern and southern hemispheres, respectively. These O/N2 variations were stronger in mid-latitudes than in low-latitudes sectors for both hemispheres. In this regard, the variations in the northern hemisphere were found to be stronger than the southern counterpart.
Figure 2 presents the annual variations at low- (top) and mid- (bottom) latitudes from 2002 to 2020. On each panel, red (blue) curve corresponds to the northern (southern) hemisphere. It can be observed that the maxima (minima) of annual variations occurred during the months of December–January (May–June) for the northern low- and mid-latitudes, whereas, for the southern counterpart, corresponding maxima and minima occured during May and June, respectively. Hence, annual variations as presented in the Figure 2 corresponded to the winter anomaly because the maxima (minima) occurred during the local winter (summer) months. The amplitude of annual variations at low-latitudes was higher in northern hemisphere and did not vary much with the SC. The mid-latitudes depicted a positive correlation between amplitude of annual variations and the SC. Furthermore, note that the two maxima correspond to the maximum phase of the respective SCs.
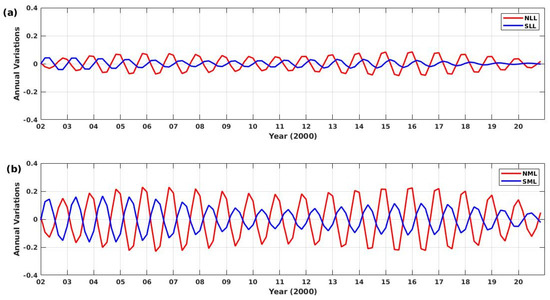
Figure 2.
(a) Annual variations of mean O/N2 ratio in both hemispheres for low-latitudes. (b) Annual variations of monthly mean O/N2 ratio in both hemispheres for mid-latitudes.
Figure 3 is analogous to Figure 2 but presents semiannual variations, which exhibited several common features of such variations, e.g., they are hemispherically symmetric with equinoctial maxima at low- and mid-latitudes. The amplitude of semiannual variations remained almost the same at low- and mid-latitudes for both hemispheres. During the years 2003–2004, the amplitude of the semiannual component was highest at low- and mid-latitudes. This corresponded to years of highest solar activity (as indicated by F10.7 index of Figure 1), whereas, during the years 2016–2019, the semiannual variations depicted the minimum values.
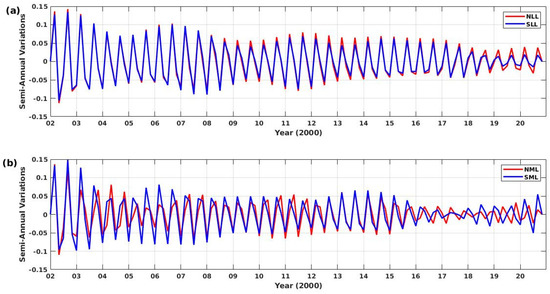
Figure 3.
(a) Semiannual variations of averaged O/N2 ratio in both hemispheres for low- latitudes. (b) Semiannual variations of mean O/N2 ratio in both hemispheres for mid-latitudes.
3.2. Longitudinal Variations in Both Hemispheres for Low- and Mid-Latitude
3.2.1. Longitudinal Variations in Both Hemispheres for Low-Latitude
Figure 4 presents the thermospheric composition ratio (O/N2) in three longitudinal sectors, Asia, Africa, and America, from top to bottom, respectively, from 2002 to 2020. The abbreviations used here are AsNLLL (Asia northern low-latitude longitude), AsSLLL (Asia southern low-latitude longitude), AfNLLL (Africa northern low-latitude longitude), AfSLLL (Africa southern low-latitude longitude), AmNLLL (America northern low-latitude longitude), and AmSLLL (Africa southern low-latitude longitude). The maximum values of O/N2 in the Asian regions of the northern hemisphere were 0.92 (0.8718) in March 2003 (November 2014) and the respective minimum values were 0.48 (0.4352) in June 2003 (2014), with percentage differences of 47.8% (50%) for the SC 23 (24). Similarly, for the southern hemisphere, the peak value in the Asian sector was 0.91 as observed in March 2003, and the lowest value was 0.54 in June 2003 for the SC 23, having a percentage difference of 40.7%. The maximum monthly averaged variations in AsNLLL occurred in October 2019, March of years 2008, 2015, 2016, 2018, and 2020, and in November for the remaining years. The minimum variations appeared in January 2008, August 2009, and in June 2010–2020. The maximum variations in AsSLLL occurred in November 2010–2011, May 2013, October 2019, February 2020, and March of the remaining years. Additionally, the lowest variations appeared in October 2008–2009, August 2011, and in June of all other years.
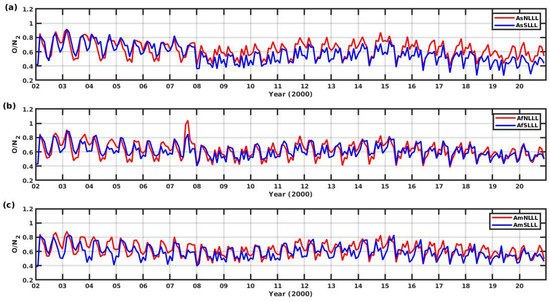
Figure 4.
Similar to Figure 1a but for (a) Asian, (b) African, and (c) American regions.
Figure 4b describes the variations of in the low-latitudes of the African sector of both hemispheres. The highest composition ratio, for the SC 23 in the northern hemisphere, was 1.04 (September) and the lowest value was 0.47 (July), with a percentage difference of 55%. The maximum mean value during 2009–2020 in the northern African regions was 0.828 in November 2014, and the minimum value during the same year was 0.4225 in June, having a percentage difference of 49%. The maximum (minimum) variations for 2002–2007 in AfSLLL were 0.89 (0.57) in March (June) of 2003, with an observed difference of 36%. The highest (lowest) mean variation, during the SC 24in the southern African sector, was 0.8001 (0.4252) in March (June) 2015, with a percentage difference of 47%. The larger variations for AfNLLL appeared in March of years 2008, 2009, 2015–2018, and 2020, October 2019, and November for the remaining years. The minimum variations were observed in January 2008, August 2009, June 2010–2019, and July 2020. Similarly, the highest variations of O/N2 in AfSLLL were found to be in April 2010–2012, May of the years 2013, 2016, 2019, and March of the remaining years. The minimum variations occurred in January 2008, February 2009, August 2011, December 2012–2013, and in June of the remaining years.
Figure 4c shows the monthly averaged variations of O/N2 in American regions which exhibited highest variations of 0.88 (0.827) on the northern side in March 2003 (November 2014), and the corresponding lowest variations in were found to be 0.56 (0.4522) in June 2003 (2014) with observed percentage differences of 36% (45%) for the SC 23 (24). Similarly, the peak value in AmSLLL during the SC 23 was 0.83 in April 2003, and the lowest value was 0.44 in December 2003. The difference between these values was 47%. During 2009–2020, the highest variation in southern America’s regions was 0.8306 in May 2015, and the minimum variation was 0.4494 in December 2015 with a percentage difference of 46%. The maximum mean variations of the O/N2 ratio in AmNLLL appeared in March of the years 2008, 2009, 2010, and 2015–2018, in October 2019–2020, and in November for the rest of the years. The minimum variations occurred in January 2008, August 2009, and in June 2010–2020. Similarly, the highest O/N2 variations in AmSLLL occurred in April of 2008 2010, and 2011, and in May for the remaining years. The minimum average variations were observed in January 2008, February of the years 2009 and 2011, October 2010, June 2016–2017, and December of the remaining years. We further note that the variations in the Asian region were slightly greater than the African and American counterparts.
Figure 5 describes the annual variations in the Asian, African, and American low-latitudes sectors from 2002 to 2020. On each panel, red (blue) curve corresponds to the northern (southern) region. This figure reveals several interesting facts about the longitudinal variations of annual component, e.g., the said variations were completely out of phase in American low-latitudes, with a maxima occurring in the local winter season, i.e., the winter anomaly in this region. Furthermore, the northern low-latitudes sectors of Asia and Africa also exhibited the winter anomaly, whereas the southern counterparts of the said regions showed the phase changes of annual oscillations with the SC. During the years of solar maximum (minimum), there were regular annual variations (winter anomaly) in the southern low-latitudes of Asia and Africa. In this regard, the amplitude of annual variations and hemispheric asymmetry was at a maximum in Asia, followed by Africa and America, respectively.
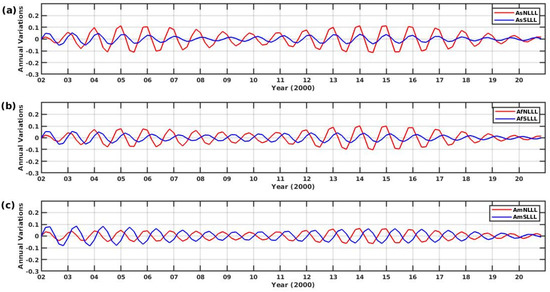
Figure 5.
Similar to Figure 2a for (a) Asian, (b) African, and (c) American regions.
Figure 6 describes the semiannual variations for the Asian, African, and American sectors from 2002 to 2020. The semiannual variations exhibited almost similar trend in the three longitudinal sectors. The northern low-latitudes, in the African and American regions, showed slightly higher amplitude as compared with the southern counterparts. The maximum (minimum) amplitude of the semiannual variations occurred during the years 2004–2005 (2019–2020). Moreover, these semiannual variations remain hemispherically symmetric at all the longitudes.
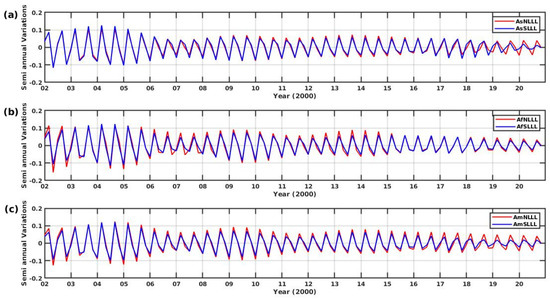
Figure 6.
Similar to Figure 3a but for sectors of (a) Asia, (b) Africa, and (c) America.
3.2.2. Longitudinal Variations in Both Hemispheres for Mid-Latitudes
Figure 7 shows mid-latitudinal longitudinal variations of O/N2 in both hemispheres. In Figure 7a, the monthly averaged O/N2 variations corresponded to the Asian sector for the SCs 23 and 24, respectively, for which the maximum was found to be 1.19 (1.117) in December 2003 (November 2011), and the observed minimum variation was 0.28 (0.2145) in June 2003 (2014) for the northern hemisphere (AsNMLL). The percentage difference between maximum and minimum values for the SCs 23 and 24 was found to be 76.5% and 75.9%, respectively. Similarly, the highest (lowest) variations during 2002–2007 in the southern region (AsSMLL) were 0.96 (0.15) in April (February) of 2002, having a difference of 84%. The maximum value of O/N2, for the SC 24 was 0.938 in May 2015 and the lowest value was 0.2145 in June for AsSMLL, having a percentage difference of 76%. In AsNMLL, November had a maximum value of O/N2 for the entire cycle, and the minimum variations were observed in August 2008–2010, July of 2019–2020, April 2017–2018, and June of the remaining years. Similarly, in AsSMLL, March of 2008 and 2017, April of 2009 and 2020, August 2018, September 2019, and May of the remaining years had the highest concentration ratios. December of 2016–2017 and June for the rest of years had the lowest ratio in AsSMLL.
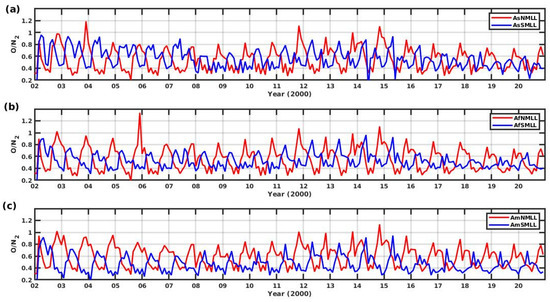
Figure 7.
Similar to Figure 1b for (a) Asian, (b) African, and (c) American regions.
Figure 7b shows the monthly averaged concentration ratio in African regions for both hemispheres. The percentage difference between the peak value of 1.3 (December 2005), and the lowest value of 0.19 (August 2005) in the northern African regions (AfNMLL) was 85%. The maximum (minimum) mean ratio during 2009–2020 was 1.106 (0.293), which occurred in November (June) 2014 for AfNMLL, having a percentage difference of 73%. Similarly, the percentage difference between the maximum value 0.9 (May 2002) and the minimum value of 0.15 (February 2002) during 2002–2007 for the southern African sector (AfSMLL) was 83%. In AfSMLL, the corresponding maximum value was found to be 0.9621 in May, and the minimum value was 0.4271 in December 2014 for the SC 24, with a percentage difference of 55.6%. November had a maximum value of O/N2 for the entire cycle, and the lowest variations appeared in August 2008, July 2020, and in June 2009–2019 for AfNMLL. Similarly, April 2009 and May of the remaining years had the highest variations, and January 2020, February of 2009 and 2011, October of 2008 and 2010, and December of the remaining years had the lowest ratios in AfSMLL. The mid–latitudes longitudinal variations in the American sector are presented in Figure 7a. The maximum O/N2 variations from 2002–2008 in the northern American sector (AmNMLL) was 1.02 (November 2002), and the minimum variation was 0.3 (February 2002). Their percentage difference was 70.6%. The highest monthly mean O/N2 value in AmNMLL, during SC 24 was 1.134 in November, and the lowest value was 0.3532 in June 2014, having a percentage difference of 69%. During the SCs 23 and 24, the highest (lowest) variations in the southern America regions (AmSMLL) were found to be 0.92 (0.13) and 0.945 (0.2974) which occurred, respectively, in May (February) 2002 and May (December) 2015, having percentage differences of 86% and 68.5%. The O/N2 ratio in November was highest in the northern American sectors for the entire cycle. August of 2008 and 2009, July 2020, and June for the rest of the years depicted the lowest O/N2 ratio in AmNMLL. Similarly, the monthly mean O/N2 ratio in May was at a maximum during the entire cycle, and January 2019–2020, October 2010, February 2008–2013, October 2010 and 2016, and December of the years 2014–2015 and 2017–2018 had the minimum O/N2 ratio in southern America region.
Figure 8, from top to bottom, presents the annual variations at mid-latitudes of Asia, Africa, and America, respectively, from 2002 to 2020. The intensity of annual variations increased with the phase of the respective SC, i.e., it exhibited two maxima at all longitudes corresponding to maximum phase of the corresponding cycles. The amplitude of annual variations was found to be relatively high at northern mid-latitudes as compared with southern counterpart, whereas this difference was at a maximum for Africa, followed by Asia and America, in that order. During the years 2019–2020, the amplitude of said oscillations reached a minimum value at all longitudes.
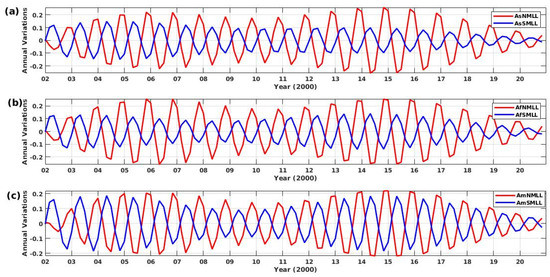
Figure 8.
Similar to Figure 2b but for the sectors of (a) Asia, (b) Africa, and (c) America.
Figure 9 describes the semiannual variations at mid-latitudes for the Asian, African, and American sectors for both hemispheres. These variations in the AsSMLL, except in AsNMLL, followed the solar activity. In this regard, the observed southern side variations were stronger than the northern counterpart. The semiannual variations for AfSMLL followed the solar activity but were least affected. In AfNMLL, it did not follow the SC trend, and the semiannual variations in AmNMLL were stronger and were least affected by the solar activity.
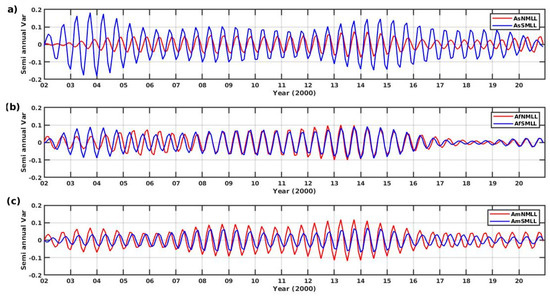
Figure 9.
Similar to Figure 3b but for (a) Asian region, (b) African sector, and (c) American region.
4. Discussion
The magnitude of monthly-averaged O/N2 variations at low- and mid-latitudes (Figure 1) as well as in different longitudinal sectors (Figure 4 and Figure 7) are seen to follow the SC. This effect is stronger—due to vertical winds acting on the respective gradient of O/N2—under the solar maximum conditions that are mainly caused by higher vertical temperature gradients [20]. Globally, the O/N2 ratio is higher in the northern hemisphere than in the southern counterpart and is more prominent for mid-latitudes than the low-latitudes regions. For mid-latitudes, there is a hemispheric asymmetry (percentage difference between the O/N2 ratio of corresponding months in both hemispheres) of O/N2 ratio, with a maximum effect observed in November 2014 (December 2003) where it reaches 52.3% (63%) for the SC 24 (23) (Figure 1). This asymmetry has the maximum effect in America (60%) followed by Asia (50%) and Africa (49%). This observed asymmetry in America, Asia, and Africa for the SC 23 is found to be 68.4%, 66.6 %, and 57% in December 2003, respectively. The seasonal asymmetry is due to the variability of O/N2 over a SC [21,22]. The meridional wind from the summer side to winter is disrupted by the EIA (equatorial ionosphere anomaly) because of solar heating [23]. In the summer hemisphere, this EIA-related heating reduces the summer-to-winter side pressure gradient; however, it raises pressure gradients in the winter hemisphere. Consequently, the summer-to-winter wind is restrained as it approaches the EIA in the summer hemisphere but accelerates after passing through the EIA at mid-latitudes in the winter hemisphere. As equator–pole pressure gradients decrease at high latitudes, the meridional wind converges—by Joule heating—in auroral zones and creates an opposite pressure gradient. Large values of O/N2 are observed in sub-auroral latitudes in the winter hemisphere due to convergence and downwelling. Near the December solstice, the EIA impact is stronger than at the June solstice. The ionospheric annual asymmetry causes the December/June variations: during the December solstice, there is a much larger electron density than the corresponding values in June. As a result, in the winter hemisphere, meridional wind convergence and downwelling at sub-auroral latitudes are greater in January (than July); consequently, it leads to a higher O/N2 in the January winter hemisphere (northern hemisphere) than in the July winter hemisphere (southern hemisphere). Thus, this results in the hemispheric asymmetry of the summer–winter seasonal fluctuations of thermospheric concentration and causes the ionospheric winter anomaly [6,22]. Globally, O/N2 peaks in sub-auroral latitudes and exhibits small values near the magnetic poles during the local winters in both hemispheres. From the solar minimum to high solar activity, the O/N2 sub-auroral improvements move increasingly poleward in both hemispheres, while overall latitudinal width becomes narrower. The magnitude of O/N2 sub-auroral maxima rises at all longitudes from low solar activity to solar maximum. Moreover, the O/N2 in localized winter is higher near pole longitudes for latitudes below the sub-auroral region (in geographic coordinates). At higher mid-latitudes, near-pole longitudes have a greater O/N2 ratio than far-from-pole counterparts [6,14,23]. Here we note that this trend is opposite to the one observed in lower latitudes of both hemispheres. Li et al. (2022) [24] also reported a similar SC dependence of O/N2 variations through a model simulations. They suggested that the chemical processes play critical roles in increasing thermospheric O/N2 from low to high solar activity levels. The changes in O/N2 with solar activity are dominated by the enrichment of O and loss of N in the lower and upper thermospheres, respectively. Furthermore, the changes in chemical processes could result in a stronger vertical advection of O/N2, which, however, is not sufficient to cause a greater hemispheric asymmetry of the concentration ratio at higher solar activity. Instead, the solar activity dependence of the O/N2 hemispheric asymmetry is mainly attributed to the changes in thermospheric summer-to-winter circulation from low to high solar activities.
The annual variations at low- (Figure 2a) and mid-latitudes (Figure 2b) as well as in different longitudinal sectors such as Asia, Africa, and America (Figure 5 and Figure 8) are stronger in the northern hemisphere. The corresponding maxima occur in the northern hemisphere in November/December (winter) and minima in May/June (summer), which corresponds to the winter (or seasonal) anomaly. The annual variations which correspond to winter anomaly in the northern hemisphere vary linearly with the SC; however, in the southern side, it follows the SC only in the American sector. At mid-latitudes, the annual variations are stronger as compared with the low-latitudes in the northern hemisphere; however, this difference is less significant in the southern counterpart. The strong annual component in the northern hemisphere is due to the intense winter anomaly in this region. The intensity of winter anomaly in the northern hemisphere is high enough to reverse the regular variations, and a maxima (minima) is observed in the local winter (summer) [13,20,23]. Yu et. al. (2004) [25] observed that the annual variations of NmF2 have significant local features. On a global basis, the amplitude of these variations is higher (lower) in the northern (southern) hemisphere and quite small in the low-latitudinal regions. The annual variations are larger in the high mid-latitudinal regions than in low-latitudes. At near-pole stations, NmF2 and O/N2 have substantial annual component with a prominent winter anomaly; hence, O/N2 fluctuations may be primarily responsible for NmF2 variations in this region. The higher amplitude of annual variations at mid-latitudes and in the northern hemisphere is also found in the earlier studies by Yue et al. (2019) [14] and Qian et al. (2022) [16]. The wind-driven advection is the main process that causes the departure of thermospheric neutral species from diffusive equilibrium [26,27,28]. The thermospheric circulation can result in the accumulation of lighter (atomic helium and atomic oxygen) and heavier (molecular nitrogen and atomic argon) species in winter and summer, respectively [5,28]. Specifically, the up-welling in the summer hemisphere pushes the nitrogen-rich air upward and the downwelling in the winter thermosphere brings the atomic oxygen rich air downward [5,26]. Consequently, O/N2 would become greater in winter than in summer. However, this wind-driven effect is intensified at mid-latitudes as compared with the low counterpart. This leads to higher amplitude of annual variations as observed at mid-latitudes.
The semiannual variations show equinoctial maxima in March/September and April/October, except for NML where the maximum/minimum variations appear in the months of May/November for most of the years. These variations are stronger during the SC 23. Figure 6 describes the low-latitudes semiannual variations in the Asian, African, and American sectors; here we observed equinoctial maxima for all the three regions from 2002–2020. These variations are weightier during SC 23. For corresponding mid-latitudinal sections, the semiannual variations are prominent in AsSMLL and AmNMLL during the high solar activity. In African sectors, the equinoctial maxima appear for majority of the years, but the amplitude of fluctuations is very small. In the early phase of the SC, the said variations show an anomalous behavior. Correlating with solar activity, the semiannual variations in Africa, AsNMLL, and AmSMLL depict unusual behavior (Figure 9). In near-pole regions, semiannual fluctuations are minimal, while in far-pole and tropical sectors, they are extremely high. Furthermore, the semiannual variations are generally at their highest in March/September and April/October [29,30]. According to the CTIPe model results, the semiannual variations are thought to be a property of the mid-latitudes’ ionosphere. Both the northern and southern hemispheres exhibit this behavior although this effect is substantially higher in the southern hemisphere as caused by stronger magnetic offset [31].
5. Conclusions
- To conclude, we studied the thermospheric O/N2 from 2002 to 2020 over low- and mid-latitudes. The analysis is further extended to four longitudinal sectors. Main findings of present work are summarized as follows:
- The O/N2 variations at low- and mid-latitudes, as well as at different longitudinal sectors, clearly follow the SC trends.
- The O/N2 ratios in the northern hemisphere are stronger than the southern counterpart throughout the cycle, i.e., the maxima in every year are always greater for the northern hemisphere, except for some years of the SC 23.
- We also note that the amplitude of annual variations at mid-latitudes is higher than at low-latitudes. This fact is also observed for different longitudinal sectors.
- The mean O/N2 and their annual variations depict that in the northern hemisphere, December always has greater variations than June; in brief, we can say that the winter O/N2 ratio is greater than summer for low- as well as mid-latitudes in the northern hemisphere. Also, the annual variations in the northern hemisphere and in the southern mid-latitudes of American regions follow the solar activity.
- The annual variations for the southern hemisphere show that, on a broad scale, the May/June months have a higher O/N2 ratio than November/December for mid-latitudes and corresponding longitudinal regions. We further note that the mean O/N2 ratio in December is not always greater than June for the southern hemisphere.
- The annual variations (winter anomalies) are clearly observed for northern low- and mid-latitudes in both hemispheres. Moreover, these variations are stronger in the northern hemisphere.
- The semiannual variations or equinoctial maxima are evident for low-latitudes in both hemispheres and for mid-latitudes of the southern hemisphere, except for the mid-latitudes southern American sector.
- Semiannual variations are in-phase for both hemispheres and their amplitude remains essentially the same at low- and mid-latitudes.
Author Contributions
Conceptualization, J.K., W.Y. and C.A.-M.; methodology, J.K. and W.Y.; software, W.Y. and J.K.; validation, M.K., C.A.-M. and J.K.; formal analysis, M.K. and C.A.-M.; investigation, C.A.-M.; resources, M.K. and W.Y.; writing—original draft preparation, J.K., W.Y., M.K. and C.A.-M.; writing—review and editing, M.K. and C.A.-M.; supervision, M.K. and C.A.-M.; project administration, M.K.; funding acquisition, M.K. All authors have read and agreed to the published version of the manuscript.
Funding
This research was supported by Higher Education Commission of Pakistan, grant number 20-14405/NRPU/R&D/HEC/2021.
Institutional Review Board Statement
Not applicable.
Informed Consent Statement
Not applicable.
Acknowledgments
The authors are thankful to the TIMED/GUVI management team (http://guvitimed.jhuapl.edu/, accessed on 20 March 2022) for providing thermospheric ∑O/N2 ratio. We would like to thank the OMNI-WEB data center for making available solar radio flux data.
Conflicts of Interest
The authors declare no conflict of interest.
References
- Heelis, R.A.; Maute, A. Challenges to Understanding the Earth’s Ionosphere and Thermosphere. J. Geophyisical Res. Space Phys. 2020, 125, e2019JA027497. [Google Scholar] [CrossRef]
- Meier, R.R. The thermospheric column O/N2 ratio. J. Geophyisical Res. Space Phys. 2021, 126, 3. [Google Scholar]
- Rishbeth, H.; Setty, G.S.G.K. The F-layer at sunrise. J. Atmos. Terr. Phys. 1962, 21, 263–276. [Google Scholar]
- Kumar, V.; Krishnakumar, E. Hot Atoms in the Terrestrial Atmosphere. In Advances in Atomic, Molecular, and Optical Physics; Elsevier: Amsterdam, The Netherlands, 2003. [Google Scholar] [CrossRef]
- Rishbeth, H. How the thermospheric circulation affects the ionospheric F2-layer. J. Atmos. Sol. Terr. Phys. 1998, 60, 1385–1402. [Google Scholar] [CrossRef]
- Evans, J.S.; Strickland, D.J.; Huffman, R.E. Satellite remote sensing of thermospheric O/N2 and solar EUV: 2. Data analysis. J. Geophys. Res. Space Phys. 1995, 100, 12227–12233. [Google Scholar] [CrossRef]
- Torr, M.R.; Torr, D.G. The seasonal behaviour of the F2-layer of the ionosphere. J. Atmos. Terr. Phys. 1973, 35, 2237–2251. [Google Scholar] [CrossRef]
- Meier, R.R.; Anderson, D.E., Jr. Determination of atmospheric composition and temperature from the UV airglow. Planet. Space Sci. 1983, 31, 967–976. [Google Scholar] [CrossRef]
- Strickland, D.J.; Evans, J.S.; Paxton, L.J. Satellite remote sensing of thermospheric O/N2 and solar EUV: 1. Theory. J. Geophys. Res. Space Phys. 1995, 100, 12217–12226. [Google Scholar] [CrossRef]
- Wang, Y.; Fu, L.; Jiang, F.; Hu, X.; Liu, C.; Zhang, X.; Li, J.; Ren, Z.; He, F.; Sun, L.; et al. Far-ultraviolet airglow remote sensing measurements on Feng Yun 3-D meteorological satellite. Atmos. Meas. Tech. 2022, 15, 1577–1586. [Google Scholar] [CrossRef]
- Rishbeth, H.; Müller-Wodarg, I.C.F.; Zou, L.; Fuller-Rowell, T.J.; Millward, G.H.; Moffett, R.J.; Idenden, D.W.; Aylward, A.D. Annual and semiannual variations in the ionospheric F2-layer: II. Physical discussion. Ann. Geophys. 2000, 18, 945–956. [Google Scholar] [CrossRef]
- Lean, J.L.; Woods, T.N.; Eparvier, F.G.; Meier, R.R.; Strickland, D.J.; Correira, J.T.; Evans, J.S. Solar extreme ultraviolet irradiance: Present, past, and future. J. Geophys. Res. Space Phys. 2011, 116, A1. [Google Scholar] [CrossRef]
- Burns, A.G.; Wang, W.; Qian, L.; Solomon, S.C.; Zhang, Y.; Paxton, L.J.; Yue, X. On the solar cycle variation of the winter anomaly. J. Geophys. Res. Space Phys. 2014, 119, 4938–4949. [Google Scholar] [CrossRef]
- Luan, X.; Wang, W.; Burns, A.; Dou, X. Solar cycle variations of thermospheric O/N2 longitudinal pattern from TIMED/GUVI. J. Geophys. Res. Space Phys. 2017, 122, 2605–2618. [Google Scholar] [CrossRef]
- Yue, J.; Jian, Y.; Wang, W.; Meier, R.R.; Burns, A.; Qian, L.; Jones, M.; Wu, D.L.; Mlynczak, M.; Jr, M.J. Annual and Semiannual Oscillations of Thermospheric Composition in TIMED/GUVI Limb Measurements. J. Geophys. Res. Space Phys. 2019, 124, 3067–3082. [Google Scholar] [CrossRef]
- Qian, L.; Gan, Q.; Wang, W.; Cai, X.; Eastes, R.; Yue, J. Seasonal Variation of Thermospheric Composition Observed by NASA GOLD. J. Geophys. Res. Space Phys. 2022, 127, e2022JA030496. [Google Scholar] [CrossRef]
- Christensen, A.B.; Paxton, L.J.; Avery, S.; Craven, J.; Crowley, G.; Humm, D.C.; Kil, H.; Meier, R.R.; Meng, C.-I.; Zhang, Y.L.; et al. Initial observations with the Global Ultraviolet Imager (GUVI) in the NASA TIMED satellite mission. J. Geophys. Res. Space Phyics 2003, 108, A12. [Google Scholar] [CrossRef]
- Zhang, Y.; Paxton, L.J. Long-term variation in the thermosphere: TIMED/GUVI observations. J. Geophys. Res. Space Phys. 2011, 116, A2. [Google Scholar] [CrossRef]
- Younas, W.; Amory-Mazaudier, C.; Khan, M.; Amaechi, P.O. Climatology of global, hemispheric and regional electron content variations during the solar cycles 23 and 24. In Advances in Space Research; Elsevier: Amsterdam, The Netherlands, 2022. [Google Scholar] [CrossRef]
- Burns, A.G.; Solomon, S.C.; Wang, W.; Qian, L.; Zhang, Y.; Paxton, L.J.; Yue, X.; Thayer, J.P.; Liu, H.L. Explaining solar cycle effects on composition as it relates to the winter anomaly. J. Geophys. Res. Space Phys. 2015, 120, 5890–5898. [Google Scholar] [CrossRef]
- Qian, L.; Burns, A.G.; Solomon, S.C.; Wang, W.; Zhang, Y. Solar cycle variations of thermospheric composition at the solstices. J. Geophys. Res. Space Phys. 2016, 121, 3740–3749. [Google Scholar] [CrossRef]
- Qian, L.; Burns, A.G.; Wang, W.; Solomon, S.C.; Zhang, Y.; Hsu, V. Effects of the equatorial ionosphere anomaly on the interhemispheric circulation in the thermosphere. J. Geophys. Res. Space Phys. 2016, 121, 2522–2530. [Google Scholar] [CrossRef]
- Yasyukevich, Y.V.; Yasyukevich, A.S.; Ratovsky, K.G.; Klimenko, M.V.; Klimenko, V.V.; Chirik, N.V. Winter anomaly in NmF2 and TEC: When and where it can occur. J. Space Weather. Space Clim. 2018, 8, A45. [Google Scholar] [CrossRef]
- Li, Z.; Luan, X.; Lei, J.; Ren, D. A Simulation Study on the Variation of Thermospheric O/N 2 With Solar Activity. J. Geophys. Res. Space Phys. 2022, 127, e2022JA030305. [Google Scholar] [CrossRef]
- Yu, T.; Wan, W.; Liu, L.; Zhao, B. Global scale annual and semi-annual variations of daytime NmF2 in the high solar activity years. J. Atmos. Sol. Terr. Phys. 2004, 66, 1691–1701. [Google Scholar] [CrossRef]
- Burns, A.G.; Killeen, T.L.; Roble, R.G. Processes responsible for the compositional structure of the thermosphere. J. Geophys. Res. 1989, 94, 3670–3686. [Google Scholar] [CrossRef]
- Liu, X.; Wang, W.; Thayer, J.P.; Burns, A.; Sutton, E.; Solomon, S.C.; Qian, L.; Lucas, G. The winter helium bulge revisited. Geophys. Res. Lett. 2014, 41, 6603–6609. [Google Scholar] [CrossRef]
- Sutton, E.K. Interhemispheric transport of light neutral species in the thermosphere. Geophys. Res. Lett. 2016, 43, 12–325. [Google Scholar] [CrossRef]
- Yu, T.; Ren, Z.; Le, H.; Wan, W.; Wang, W.; Cai, X.; Li, X. Seasonal Variation of O/N2 on Different Pressure Levels From GUVI Limb Measurements. J. Geophys. Res. Space Phys. 2020, 125, e2020JA027844. [Google Scholar] [CrossRef]
- Millward, G.H.; Rishbeth, H.; Fuller-Rowell, T.J.; Aylward, A.D.; Quegan, S.; Moffett, R.J. Ionospheric F2 layer seasonal and semiannual variations. J. Geophys. Res. Space Phys. 1996, 101, 5149–5156. [Google Scholar] [CrossRef]
- Strickland, D.J.; Evans, J.S.; Correira, J. Comment on “Long-term variation in the thermosphere: TIMED/GUVI observations by Zhang, Y.; Paxton, L.J. J. Geophys. Res. Space Phys. 2012, 117, A7. [Google Scholar] [CrossRef]
Publisher’s Note: MDPI stays neutral with regard to jurisdictional claims in published maps and institutional affiliations. |
© 2022 by the authors. Licensee MDPI, Basel, Switzerland. This article is an open access article distributed under the terms and conditions of the Creative Commons Attribution (CC BY) license (https://creativecommons.org/licenses/by/4.0/).