Abstract
The Liupan Mountain (LPM) area is located on the northeast margin of the Qinghai–Tibet Plateau, which is the western part of the second ladder of China’s terrain. It is also an intersection area of two air currents, which are caused by the combined action of the Qinghai–Tibet Plateau, the middle and lower levels of the westerly belt and the edge of the monsoon area. LPM is one of the main air water vapour transport pathways in Northwest China as well as a main water conservation area for nearly ten million people. Research on atmospheric precipitable water vapour (PWV) variation characteristics in LPM is beneficial for understanding the mechanisms of orographic precipitation and improving the effects of weather modification. Based on the data from 10 Global Navigation Satellite System Meteorology (GNSS/MET) stations for 6 years and the data of automatic weather stations in the LPM, the temporal and spatial variation characteristics of PWV in the LPM were analysed, and the differences in PWV in the 24 h before and after precipitation were compared in this study. The results showed that the hourly, monthly and seasonal variations in PWV displayed obvious patterns. PWV increased rapidly 10 h ahead of precipitation, while it decreased rapidly within 10 h after precipitation, which was slower than that before precipitation. In terms of spatial distribution, PWV was larger in the south than in the north and larger in the east than in the west. Although the precipitation on the LPM peak was the highest in the whole LPM area, its PWV was always the lowest, indicating that the PWV was obviously affected by the air temperature. This showed that under the same water vapour condition, precipitation was more likely to form in the area with low temperature, and the precipitation was larger, which also provided a train of thought for improving the method of artificial precipitation enhancement by using the condensation catalyst.
1. Introduction
Precipitable water vapour (PWV), a meteorological term, refers to the amount of precipitation that can be generated when the total amount of water vapour contained in the atmospheric column per unit area from the ground to the top of the atmosphere condenses and falls to the ground. Its measurement unit is mm. The method of Global Navigation Satellite System (GNSS) remote sensing atmospheric water vapour uses the navigation data received by the GNSS ground receiving station to calculate the zenith atmospheric wet delay of the navigation signal reaching the receiving station. Then, the PWV is calculated according to the propagation characteristics of the signals in wet air [1]. This method was proposed by Michael Bevis et al. in 1992 [2]. In 1993, the UNAVCO (A community of scientists, educators, and professionals working together to better understand Earth processes and hazards using geodesy) and the University of Southern California jointly conducted a large-scale GPS/STORM test to evaluate the measurements of PWV by ground-based Global Positioning System (GPS) [3]. In 1994, National Oceanic and Atmospheric Administration (NOAA) and the UNAVCO conducted a GPS-WIS94 test, which proved that PWV can be continuously monitored by GPS, with a time resolution better than 1 h and accuracy at the millimetre level [4]. In China, Mao and others thoroughly introduced the ground-based GPS inversion of atmospheric water vapour technology in 1993 [1]. From 1997 to 2021, Liang, Li, Lei and others carried out GNSS monitoring and inversion experiments of atmospheric water vapour content in Shanghai, Beijing, Shandong and other places in China. They obtained a large number of research results and summarised the method of calculating the total amount of PWV by using GNSS data to receive zenith atmospheric wet delay, analysing the causes of various errors and elimination methods [5,6,7,8,9,10,11,12,13,14,15,16]. The Satellite Navigation and Positioning Technology Research Center of Wuhan University developed the PRIDE PPP-AR II system in 2021 to provide a basic support platform for high-precision GNSS researchers.
In this paper, the wet delay of GPS signals in the air was used to calculate the whole atmospheric PWV in the LPM. Its temporal and spatial variation characteristics were analysed as well. The PWV differences were compared between nonprecipitation periods and precipitation periods, and the temporal change in PWV before and after precipitation was studied, providing a theoretical basis for the weather modification of the Liupan Mountain (LPM).
2. Data and Methods
2.1. Study Area
The LPM area in the northeast margin of the Qinghai–Tibet Plateau is located west of the second ladder of China’s terrain, which is adjacent to the monsoon region of the Sichuan Basin in the southwest and the Qinling Mountains in the southeast [17,18,19]. The LPM area is the boundary zone of warm temperate forest and the transition zone from subhumid to semiarid regions, and it is also one of the main routes for water vapour transport to the northwest inland region [20,21,22]. LPM plays an important role in water conservation, climate regulation and ecological balance. It is also the main water conservation area for nearly 10 million people in Ningxia, Gansu and Shaanxi Provinces. In summer, influenced by the Qinghai–Tibet Plateau heat movement, the warm and humid airflow from the Indian Ocean, the Pacific Ocean and the Atlantic Ocean moves northwards along the Sichuan Basin from the east of the Yunnan-Guizhou Plateau [23,24,25], and the southwest warm and humid airflow currents near 3000 m in the LPM area frequently move northwards. The valley on the east side of the LPM extends southeast and connects with the northwest end of the Guanzhong Plain, forming a narrow and open bell mouth terrain in the northwest and an open terrain in the southeast. Its unique microtopography is conducive to the low-level southeast airflow moving to the east side of the LPM in summer and then converging and uplifting on the east side of the LPM. The elevation of the main peak of the LPM is 2942 m and is suitable for field scientific experiments. The eastern slope of the mountain is steep with a slope of 26° to 60°, and the western slope is comparatively mild with a slope of 20° to 35°, creating favourable conditions for the study of airflow propagation in a continuous mountain range as well as the physical processes of cloud precipitation. The LPM area, with abundant water vapour resources and an annual mean relative humidity of 69%, can be used as a natural laboratory for orographic cloud precipitation and weather modification experiments.
The LPM area refers to a rectangular area centred on the LPM in this study, which is approximately 90 km in length from east to the west (105°12′5″ E–106°57′17″ E) and 110 km in width from north to south (35°14′18″ N–36°56′33″ N) (Figure 1), covering most of southern Ningxia Province, eastern Gansu Province and western Shaanxi Province, with an area of approximately 32,000 km2. Since 2013, 10 Global Navigation Satellite System Meteorology (GNSS/MET) stations have been built in succession, forming a GNSS/MET station network covering the LPM area, which lays a foundation for the study of PWV in the LPM area. In 2018, Chang and others used the Bevis model to preliminarily analyse the distribution characteristics of air cloud water resources in Ningxia Province based on GNSS/MET data [26].
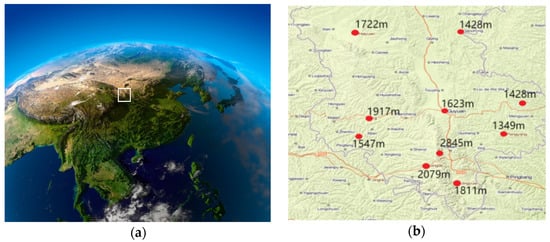
Figure 1.
Aerial view map of the general region. (a) The position of the LPM area (The area in the white circle). The base map is obtained from Google Maps; (b) Diagram of location distribution of 10 GNSS/MET stations in the LPM area (Red spots). The base map is obtained from the National Platform for Common Geospatial Information Services of China.
2.2. Methods
GAMIT (GPS Analysis at MIT) software is a high-precision and Linux-based open-source software developed by the Massachusetts Institute of Technology [27]. It is specifically used to calculate navigation satellite data [28]. It is widely used in high-precision GNSS research and can calculate GPS, GLONASS (GLObalnaya NAvigatsionnaya Sputnikovaya Sistema), Galileo (Galileo Satellite Navigation System) and BDS (BeiDou Navigation Satellite System) navigation satellite data [29,30,31,32]. The PWV analysed in this study was obtained by calculating the navigation data of GNSS/MET stations in the LPM area with GAMIT software. The GNSS/MET stations constructed in the LPM district use the LEICA GR10 receiver, and the document format was RINEX (receiver independent exchange format), whose data format was widely used in GNSS measurement applications. To maintain the calculation accuracy, three or more international standard stations were required in the calculation of the navigation data of GAMIT. In this study, BJFS (Beijing Fangshan), HKSL (Hong Kong), PTBB (Wolfsburg) and YSSK (South Sakhalinsk) data were used to calculate the navigation data of GNSS/MET stations in the LPM area.
The principle of using satellite navigation data to calculate PWV is that the time from the satellite sending signal to receiving at the ground receiving station is delayed to a certain extent compared with the theoretical calculation time, and the medium causing the delay is atmosphere and atmospheric water vapour. The total delay information removes the atmospheric delay information to obtain the delay caused by water vapour in the atmosphere, namely atmospheric wet delay (ZWD). The conversion formula between ZWD and PWV of electromagnetic signal deduced by Askne et al. in 1987 [33] is as follows:
where Π is a dimensionless coefficient, The calculation formula [34] is as follows:
where ρw is water vapour density, Rv is water vapour gas constant, Mv is molar mass of water vapour molecule, Md is molecular molar mass of dry air, k1, k2 and k3 are atmospheric refractive index constant, k1 = 77.689 K•hPa−1, k2 = 71.2952 K•hPa−1, k3 = 375463 K2•hPa−1, Tm is weighted mean temperature of the atmosphere (mean temperature of the vertical integral of water vapour pressure weight in a local atmospheric column), the calculation formula of Tm is as follows:
where h2 and h1 are the upper and lower altitudes of the two atmospheres respectively, ei is the mean water vapour pressure of the two atmosphere layers (hPa), and Ti is the mean absolute temperature of the two adjacent atmospheres (K). h2, h1, ei and Ti are measurable. Using the observed data of LPM, the PWV of the LPM area can be calculated by the above three formulas, and then through statistical analysis, the temporal and spatial distribution characteristics of PWV in the LPM area can be obtained.
2.3. Data
The data from 10 GNSS/MET stations in the LPM area from 1 January 2014, to 31 December 2020, were used for analysis. The 10 GNSS/MET stations were equipped with conventional automatic weather station apparatuses, and the precipitation and air temperature data of the same period were obtained for comparison analysis. According to the statistics, more than 439,000 valid PWV data were inverted using GNSS/MET data for 6 years, among which more than 60,000 were missing from precipitation measurements at the corresponding time. A total of 2678 effective precipitation processes were collected at 10 stations in 6 years, which can be used for comparative analysis of more than 379,000 data with precipitation (Table 1). The PWV analysed in this study can be divided into three situations. The first was to comprehensively analyse the spatiotemporal changes of all 439,000 data, which can maximise the continuity of data samples and make the analysis results representative. Second, the variation characteristics of all the cases under nonprecipitation conditions were analysed. Since the real precipitation situation at the time of missing measurement could not be determined, more than 60,000 PWV corresponding to missing measurement time were removed accordingly. Third, the variation characteristics of PWV during precipitation were analysed. The time corresponding to all data in this study was the Greenwich mean time (GMT).

Table 1.
LPM area data collection statistics over six years, including the total amount of GNSS/MET data every year, the number of missing precipitation measurements and the number of effective precipitation processes.
3. Results
3.1. Time Variation Characteristics of PWV
- a.
- Characteristics of PWV of hourly variation
To analyse the variation of PWV over the course of a day, all the data were averaged over the years according to the time of generation. As shown in Figure 2a, the hourly variation in PWV within 24 h of a day was regular. The analysis found that the variation was basically proportional to the change in atmospheric temperature. From 2014 to 2020, the PWV had the same change, showing a rapid growth rate from 00:00, which is basically the sunrise time in the LPM area, and was also the time that the temperature begins to rise. The PWV reached the secondary peak value (or peak value) at 06:00, and the temperature also rises to a high value in one day, but the difference was that the temperature gradually declines afterwards. However, the PWV maintained a steady and slow growth trend, reaching a peak at approximately 14:00 and dropping rapidly to the minimum value at approximately 21:00. At that time, the temperature also reached the minimum value of one day. PWV was related to air temperature because the saturated water vapour pressure in the air is directly proportional to the air temperature. The temperature increases with the saturated water vapour pressure [35], resulting in an increase in water vapour that the air can hold. The increase in temperature during one day also led to an increase in evaporation. Although the temperature began to decline at 06:00, the water vapour in the air was not saturated and coupled with the evaporation of water vapour, keeping the PWV in the air steady or increasing slowly. From 14:00 to 21:00, the temperature dropped rapidly, and the saturated water vapour pressure of the air decreased. When the water vapour reached saturation, water vapour condensed into dew or frost, and the PWV decreased accordingly.
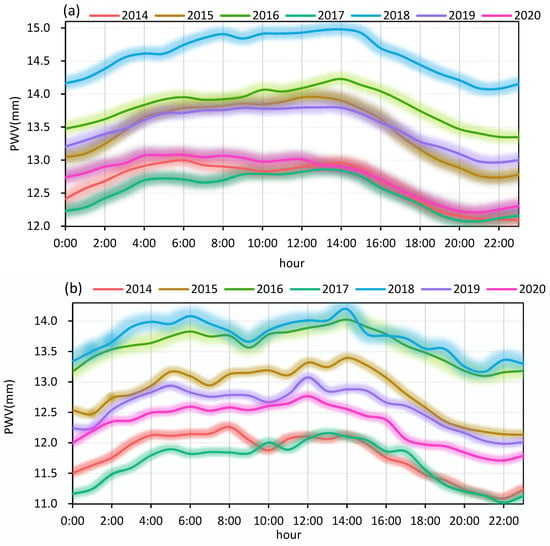
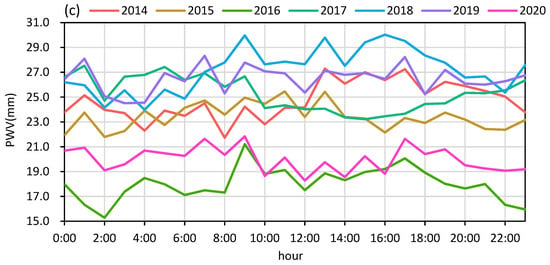
Figure 2.
Hourly PWV line graphs of the LPM area from 2014 to 2020. (a) Hourly PWV trend of the comprehensive conditions; (b) Hourly PWV trend under nonprecipitation conditions; (c) Hourly PWV trend under precipitation conditions.
Figure 2a shows that the annual mean daily range of PWV was between 0.8–1.2 mm, and the annual mean daily range was 0.9 mm. The LPM area is one of the main routes for water vapour transport to the northwest inland region, there is a lot of water vapour passing over this area every year. Even the hourly mean value of the whole year cannot completely eliminate the impact of individual cases, so on several curves have local dimples, bulges, making them not quite sinusoidal. As shown in Figure 2b, the hourly PWV trend under nonprecipitation conditions was basically consistent with the hourly change in the comprehensive analysis, and the data inflection point time was basically the same. But there were two different points from the comprehensive analysis. First, the value under nonprecipitation conditions was 0.62 mm smaller than the comprehensive analysis value, which was because the PWV value was at a high level under precipitation conditions, which increases the mean value of the comprehensive analysis. Second, the fluctuation of PWV value under nonprecipitation conditions was more obvious than of the comprehensive analysis, which was not supported by other data temporarily, but this was an observed fact, which may also be directly related to precipitation according to inference. We recognise that the evaporation and input water vapour content is continuously stable over a long period of time, and the disordered change of water vapour content caused under precipitation conditions will correspondingly cause the disordered change of water vapour content under nonprecipitation conditions. However, because the precipitation time accounts for only 0.6% of all samples, precipitation cannot completely affect the change rule when under nonprecipitation conditions, so the state shown in Figure 2b appears. Under nonprecipitation conditions, the annual mean daily range of PWV was larger than that of the comprehensive analysis, ranging from 0.9–1.3 mm, and the annual mean was 1.1 mm. Hourly variation of PWV during precipitation, and its variation pattern was basically not clear from the figure value. The size of PWV during precipitation may be related to precipitation, phase state, and duration, which requires detailed analysis. As shown in Figure 2c, under precipitation conditions, the annual mean daily range of PWV was the largest, ranging from 3.6–6.1 mm, and the annual mean was 4.7 mm. The PWV was significantly largest too, with a variation range of 15.9–30.0 mm, while under nonprecipitation conditions, the variation range was 11.1–14.2 mm, of the comprehensive conditions, the variation range was 12.1–15.0 mm. In conclusion, precipitation had a great influence on PWV.
- b.
- Monthly and seasonal variation characteristics of PWV
Figure 3 shows the monthly change in PWV. Since the PWV data for 2015 were missing for 2 months, the data for 2015 were excluded from the monthly analysis. As seen from the figure, whether under comprehensive analysis, under nonprecipitation conditions and under precipitation, PWV had obvious regularity of monthly variation, and the trend variation was highly consistent. The minimum values of PWV appeared in January and were 3.6 mm, 3.6 mm and 5.9 mm, respectively. The maximum values were 27.3 mm, 25.3 mm and 34.0 mm, respectively, appearing in August. The mean annual ranges were 23.7 mm, 21.7 mm and 28.1 mm, respectively. Compared with each year, the minimum PWV appeared in December and the maximum in July in some years, but the trend variation was basically the same. PWV showed an upwards tendency from January to April, with a relatively slow upwards speed of 2.3 mm per month. There was a rapid upwards tendency from May to July, with a monthly upwards tendency of 6.7 mm. There was a rapid downwards tendency from August to November, with a monthly downwards tendency of 6.9 mm. Figure 3 shows that the PWV trend under the comprehensive analysis was highly consistent with that under nonprecipitation conditions. There was a slight difference in PWV between the comprehensive analysis and nonprecipitation conditions, and the data inflection point was also exactly the same. In the cases of precipitation, PWV maintained the same trend as well. However, in terms of specific data, the change in PWV in the cases of precipitation was more complex, the change ranges were wider and the values were larger than those in the cases of comprehensive analysis and under nonprecipitation conditions. The significant monthly variation in PWV was due to the joint effect of air temperature and external water vapour. In winter, the minimum temperature in the LPM is as low as −10 °C. According to the relationship between temperature and saturation water vapour pressure, the water vapour density can be calculated to be 2.36 g·m−3. In summer, the temperature in the LPM area can reach 25–30 °C or even higher, and the water vapour density is 23–30 g·m−3 when water vapour is saturated, which is approximately 10 times that in winter. More water vapour in the atmosphere can be contained in summer than in winter. In addition, the southwest monsoon originating from the Indian Ocean and the southeast monsoon that originated from the Pacific Ocean in summer began to affect the LPM and brought abundant water vapour from June, which reached the peak in August and gradually withdrew from the Chinese mainland in September.
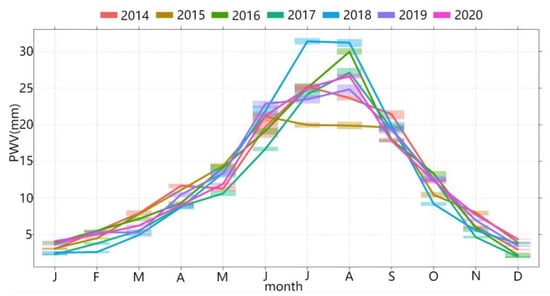
Figure 3.
Monthly PWV line graphs of LPM area from 2014 to 2020.
Due to the obvious monthly variation law of PWV, the corresponding seasonal distribution also showed the variation characteristics of the maximum in summer, the secondary in spring and autumn, and the minimum in winter. The PWV in all seasons was 23.7 mm, 9.8 mm, 12.8 mm and 4.4 mm, respectively. By comparing the PWV in four seasons under nonprecipitation conditions and precipitation, it was found that the difference between the two increased with the total PWV. The gap between them was 3.1 mm in winter, 5.9 mm and 5.2 mm in spring and autumn, and 7.6 mm in summer. This is because the air holds more water vapour in summer than in winter, leading to greater variability.
- c.
- Interannual variation in PWV
From the overall change of PWV from 2014 to 2020 (Figure 4a), the trend was obvious and consistent with the monthly change analysed in the previous section. It could be seen from the figure that the whole curve was not smooth, with many bumps and depressions, because PWV was obviously affected by precipitation. Figure 4b showed the comparison of annual mean values under comprehensive conditions, with and without precipitation. Through analysis that the annual mean PWV of the LPM area was 13.3 mm, 12.6 mm under nonprecipitation conditions, 0.7 mm lower than that under comprehensive conditions, 23.6 mm under precipitation conditions, 10.3 mm higher than that under comprehensive conditions, and 11.0 mm higher than that under nonprecipitation conditions. In summary, precipitation had a great impact on PWV.
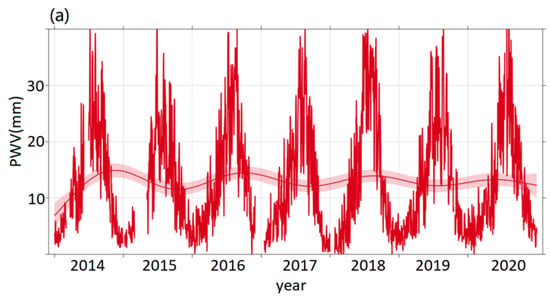
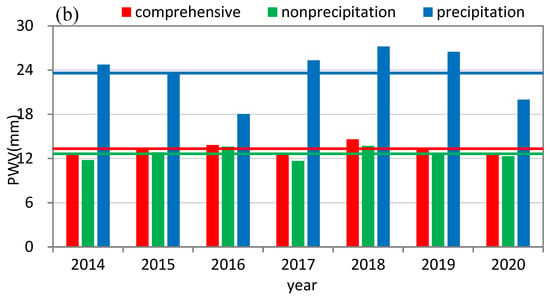
Figure 4.
Interannual change PWV of LPM area from 2014 to 2020. (a) PWV Change line graphs in the LPM area from 2014 to 2020; (b) Annual mean PWV change bar charts in the LPM area under comprehensive, nonprecipitation and precipitation conditions.
From the analysis of the interannual variation in PWV in Figure 2a, it could be seen that the interannual variation in PWV was obvious and hierarchical. The PWV in 2018 was obviously larger, with a mean of 14.6 mm, and the second value was in 2016, with a mean of 13.8 mm, which was 0.8 mm smaller than that in 2018. The minimum value of PWV was in 2017, with a mean value of 12.5 mm, which was 2.1 mm smaller than that in 2018. Under nonprecipitation conditions (Figure 2b), the interannual variation in PWV was also obvious. The maximum and submaximum values also appeared in 2018 and 2016, with means of 13.7 mm and 13.6 mm, identically, while the minimum value appeared in 2014, with a mean of 11.7 mm. Compared with the comprehensive analysis results, the interannual variation in PWV was more obvious, and the interannual difference was more uniform under nonprecipitation conditions. The interannual variation in PWV under precipitation conditions (Figure 2c) was obvious as well, while the hierarchy was not very clear. The maximum values also appeared in 2018, with means of 27.2 mm, and the minimum values appeared in 2016, with means of 18.0 mm. The analysis showed that the mean PWV was 13.0 mm under nonprecipitation conditions and 25.2 mm under precipitation. From the above analysis, the PWV in the LPM area under precipitation conditions was 12.2 mm higher than that under nonprecipitation conditions.
3.2. Spatial Distribution Characteristics of PWV
From the spatial distribution (Figure 5), when it is in spring, summer and autumn, the maximum value of PWV appeared in the east of LPM, the second maximum value appeared in the west, and the minimum value appeared on the top of LPM. The maximum value of PWV appeared in winter in the west of LPM, the second maximum value appeared in the east of LPM, and the minimum value also appeared at the top of LPM. Figure 5b shows the spatial distribution of PWV in the LPM area for the whole year (to make the comparison more obvious, Figure 5b adopts a different colour code from Figure 5a). This showed that the spatial distribution characteristics of PWV throughout the year were basically the same in the four seasons. As a whole, the spatial distribution characteristics showed that the southern region of the LPM was larger than the northern region, and the eastern region was larger than the western region. The PWV at the top of the LPM was always the lowest. According to the comprehensive analysis, the area of the maximum PWV was southeast of the LPM, reaching 13.5–14.5 mm, following the southwest, with a value of 13.2–13.9 mm. The area with lower PWV was northwest of LPM, with a value of 11.5–12.2 mm. The minimum PWV appeared in the peak area of the LPM, with a value as low as 10.4 mm.
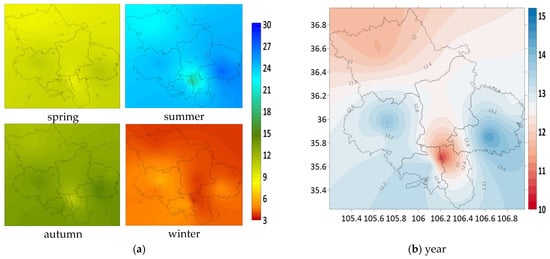
Figure 5.
Spatial distribution characteristics of PWV in LPM area (35°14′18″ N–36°56′33″ N, 105°12′5″ E–106°57′17″ E). (a) Spatial distribution characteristics of PWV in LPM area according to seasons; (b) Spatial distribution characteristics of an annual mean of PWV in LPM area.
The spatial distribution of PWV in the LPM area was mainly due to the air temperature and water vapour transport. According to the monsoon advance rule affecting the LPM area in summer, the water vapour in the southern part of the LPM area should be abundant, while the actual result was that the top of the LPM was always in the region of low PWV. The main reason was that the mean temperature at the top of the LPM was only 1.5 °C, 4–6 °C lower than the surrounding area due to the high altitude of the top of the LPM (2985 m, 800–1500 m higher than the surrounding area). Even in July, the mean temperature was the highest (12.4 °C), which caused the saturated water vapour pressure at the top of the LPM to remain low, and the water vapour density was 2–3 g·m−3 lower than that in the surrounding area. The altitude of the eastern part of the LPM was 1350–1650 m, which was lower than that of the western part from 1550–1900 m. The mean temperature of the eastern part was 7.2 °C, which was higher than that of the western part (5.6 °C). The saturated water vapour density of the eastern part was 0.8 g·m−3, which was higher than that in the western part. Therefore, under the same latitude and water vapour transport conditions, the PWV in the southeast of LPM was higher than that in the southwest.
3.3. Changes in PWV before and after Rainfall
By analysing the changes in PWV within 24 h before and after 2678 effective precipitation events in 2014–2020 (Figure 6), there was not much change in the 24th–19th hours before precipitation, which implied that it had not entered the development stage of the precipitation process at that time. From the 18th to 11th hours before precipitation, PWV increased slowly with an increment of 0.52 mm, indicating that it was in the initial stage of the development of the precipitation process, the dynamic and thermal effects increased gradually, and the water vapour began to accumulate gradually. In the 10th–1st hours before precipitation, PWV increased rapidly, with an increased value of 2.65 mm. At that time, precipitation had fully entered the development stage of the precipitation process, the dynamic and thermal effects were intensified, and the water vapour in the air rapidly accumulated to supersaturation and formed precipitation. After precipitation, the precipitation process entered the dissipation stage, the dynamic and thermal conditions tended to be stable, and the PWV gradually decreased. As the evaporation of surface rainwater supplemented the water vapour content in the air within a certain period, the decline rate of PWV after rainfall was slower than that before rainfall. In the first 10 h after precipitation, PWV was in a relatively rapid declining stage, with a declining value of 1.67 mm. From the 11th to 22nd hours after precipitation, the speed of replenishing air water vapour through evaporation of surface rainwater was equivalent to the speed of water vapour dissipation, and PWV maintained even increased slightly at that stage. After the 22nd hour after precipitation, rainwater disappeared from the surface in the form of runoff, evaporation and infiltration. The speed of supplementing air water vapour through the evaporation of surface rainwater was much lower than the dissipation speed. The PWV began to decline rapidly to the value when there was no precipitation.
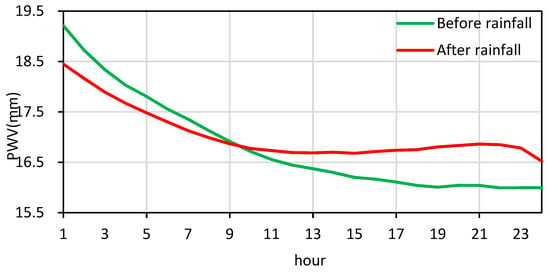
Figure 6.
PWV comprehensive statistical line chart within 24 h before and after rainfall. The blue line indicates the change in PWV 24 h before rainfall, and the red line indicates after.
The PWV changes 24 h before and after rainfall were statistically analysed, and their range, variance and standard deviation were calculated (Table 2). It could be seen from the table that the variance of PWV in the 10 h before the rainfall changed greatly, and increased from 81.7 to 101.1, and then it was basically stable between 82 and 85, indicating that the PWV in the 10 h before the rainfall changes violently and unevenly. Within 23 h after the rainfall, the variance of PWV basically remained between 97 and 100, indicating that the PWV changes more acutely after rainfall than before rainfall, and lasted for a longer time. Through the analysis of all samples, the PWV distribution within 24 h before and after rainfall conformed to the characteristics of normal distribution. The correlation analysis was conducted on PWV samples of two adjacent times, and it was found that the correlation of the two adjacent times was more than 0.99 no matter before or after the rainfall. The samples were tested by T-test and F-test, and both passed the significance verification of 0.05. It showed that the change of PWV within 24 h before and after rainfall conforms to the statistical characteristics and has a general law. This is of great significance to weather forecasts and weather modification.

Table 2.
Data table of variance, standard deviation, correlation coefficient and T-test and F-test within 24 h before and after rainfall.
4. Discussions and Conclusions
4.1. Conclusions
Through the above analysis, we found several differences from the general subconscious cognition.
First of all, people generally believe that PWV must be large in places with large precipitation, because only abundant water vapour can cause large precipitation. However, through analysis, we find that this cognition is incorrect, or even the opposite, because the precipitation of LPM Peak was obviously greater than that of the surrounding areas, but the PWV value was at a low level all year-round. This is because the saturated water vapour content in the atmosphere is obviously affected by temperature. Under the condition of water vapour saturation, the water vapour content in the atmosphere at 20 °C is 3.6 times that at 0 °C and 8.1 times that at −10 °C. Therefore, when the water vapour conditions are the same, the water vapour at LPM Peak, which has a lower temperature, has reached saturation and formed precipitation. This was one of the reasons why the precipitation on LPM Peak was obviously more than that around it. This also provided a train of thought for improving the method of artificial precipitation enhancement by using a condensation catalyst.
Secondly, we generally believe that without an external water vapour supplement, PWV should not change much in a day, but through the hourly change analysis of PWV in LPM, we found that the change in PWV over 24 h per day was proportional to the air temperature. Because the saturated water vapour pressure in the air is directly proportional to the air temperature, the temperature increases resulting in an increase in water vapour that the air can hold, and the increase in temperature during one day also led to an increase in evaporation, and the PWV increased accordingly. When the temperature began to decline, and the saturated water vapour pressure of the air decreased, when the water vapour reached saturation, water vapour condensed into dew or frost, and the PWV decreased accordingly.
Third, because the impact of precipitation on PWV is very obvious, the annual mean value of PWV under precipitation conditions can almost double that under nonprecipitation conditions, and there is no obvious regularity. According to general cognition, when PWV values are analysed, the values with strong interference under precipitation conditions are eliminated, and ideal and highly correlated data will be obtained. But through our analysis, we found that after excluding the data under precipitation conditions, the PWV regularity became worse, the curve had more concave and convex, and was more uneven. Because, under the condition that the total water vapour content is fixed, a part of the water vapour was converted into precipitation and then evaporated, which will inevitably lead to dramatic changes in the air-water vapour content over a period of time. If the water vapour that becomes precipitation is eliminated when analyzing the data, the changes in the retained data will be more difficult to explain.
Unfortunately, due to the limitation of observation elements, the meteorological observation station corresponding to the GNSS/MET station does not have meteorological data such as humidity, pressure and cloud, which makes it impossible to analyse the relationship between PWV, precipitation, humidity and cloud.
Next, we will continue to carry out in-depth research from two aspects. First, we will analyse the changes in PWV before the beginning of rainfall for different rainfall intensities and durations, in order to find out the corresponding relationship. Second, study the distribution characteristics of PWV at the same altitude and on the same isothermal surface, so as to find out the conversion relationship between PWV and precipitation under the same conditions.
4.2. Discussions
The change in PWV over 24 h per day was proportional to the air temperature. From 00:00, the PWV increased rapidly with the temperature. At 06:00, the temperature reached the highest, and the PWV also reached the second peak (or peak). Then it maintained a steady or slow growth trend, and reached the peak at 14:00. From 14:00 to 21:00, PWV rapidly decreased to the lowest value with the temperature.
The monthly variation in PWV was very obvious. The minimum value of PWV appeared in January, the rising rate was relatively slow from January to April, the rapid increase from May to July, the maximum value of PWV was in August, and then the rapid decline. The PWV trend variation under nonprecipitation conditions was highly consistent with that in the comprehensive analysis and similar to that under precipitation conditions, but the variation was more complex, the variation range was wider, and the value was larger than that under the comprehensive analysis and nonprecipitation conditions. The obvious monthly PWV variation was due to the combined effect of air temperature and water vapour supplementation. As the changes in PWV obviously changed from month to month, the distribution of PWV in all seasons was obvious, and the maximum value was in summer, followed by spring and autumn, and the minimum was in winter.
From the analysis of spatial distribution, the maximum PWV in spring, summer and autumn appeared in the east of the LPM area, and the second maximum value appeared in the west. The maximum value in winter appeared west of the LPM area, and the second maximum value appeared in the east. The minimum value of all seasons appeared at the top of the LPM area. Affected by the northwards advance law of the monsoon, the spatial distribution of PWV in the LPM area was larger in the south than in the north. As the altitude of the east side of the LPM was lower than that of the west side and the mean temperature of the east side was higher than that of the west side, PWV showed the characteristics that the east side was greater than the west side. As the mean temperature on the top of the LPM was the lowest, the saturation water vapour pressure and water vapour density were the lowest year-round, and the PWV on the top of the LPM was low.
From the 18th to 11th hours before precipitation, the precipitation process was in the initial stage of development, and PWV increased slowly. Within 10 h before precipitation, the precipitation process entered the rapid development stage, and PWV increased rapidly. After precipitation, the process entered the dissipation stage. Due to the evaporation and replenishment of surface rainfall, the PWV decreased more slowly after precipitation than before precipitation. From the 11th to 22nd hours after precipitation, the evaporation supplement water vapour rate was equivalent to the water vapour dissipation rate, and PWV was maintained or even increased slightly. After the 22nd hour after precipitation, the speed of surface rainfall evaporation to supplement water vapour decreased significantly, and PWV decreased rapidly.
Author Contributions
Conceptualization, Z.S. and D.P.; methodology, J.S. and H.W.; validation, Z.S. and T.L.; formal analysis, Z.S. and Y.S.; resources, Y.S. and T.T.; data curation, Z.S. and Y.Y.; writing—original draft preparation, Z.S.; writing—review and editing, Z.S. and H.Z.; visualization, Z.S. and H.Z.; funding acquisition, J.S. All authors have read and agreed to the published version of the manuscript.
Funding
This research was funded by the Key R & D projects in Ningxia Hui Autonomous Region, grant number 2022BEG02010, and the subtopic westerly monsoon synergy and its impact of the second comprehensive scientific investigation and Research on the Qinghai Tibet Plateau, grant number 2019QZKK0104.
Institutional Review Board Statement
Not applicable.
Informed Consent Statement
Not applicable.
Data Availability Statement
The data presented in this study are available on request from the corresponding author. The data are not publicly available due to confidentiality.
Acknowledgments
The authors are grateful for support from China’s second Qinghai Tibet Plateau comprehensive scientific investigation and research project team, Key Laboratory for Meteorological Disaster Monitoring and Early Warning and Risk Management of Characteristic Agriculture in Arid Regions, Key Laboratory of Meteorological Disaster Prevention and Mitigation of Ningxia.
Conflicts of Interest
The authors declare no conflict of interest.
References
- Mao, J.T. Meteorological Applications of GPS. Meteorol. Sci. Technol. 1993, 4, 47–51. [Google Scholar]
- Bevis, M.; Businger, S.; Herring, T.A. GPS Meteorology: Remote Sensing of Atmospheric Water Vapor Using the Global Positioning System. J. Geophys. Res. Atmos. 1992, 97, 15787–15801. [Google Scholar] [CrossRef]
- Rocken, C.; Ware, T.; Van Hove, T. Sensing Atmospheric Water Vapor with the Global Positioning System. Geophys. Res. Lett. 1993, 20, 2631–2634. [Google Scholar] [CrossRef]
- Rocken, C.; Hove, T.V.; Johnson, J. GPS/STORM-GPS Sensing of Atmospheric Water Vapor for Meteorology. J. Atmos. Ocean. Technol. 1995, 12, 468–478. [Google Scholar] [CrossRef]
- Liang, F.; Li, C.C.; Wang, Y.C.; Mao, J.T.; Fang, Z.Y. An Analysis of Atmospheric Precipitable Water Based on Regional Ground-Based GPS Network in Beijing. Chin. J. Atmos. Sci. 2003, 27, 236–244. [Google Scholar]
- Mao, P.Y.; Chen, Y.M.; Meng, X. Feasibility Analysis of Precipitable Water Vapor Retrieval with Ground-Based GPS Based on Singular Spectrum Analysis. J. Geod. Geodyn. 2017, 37, 933–936. [Google Scholar]
- Wang, H.; Lei, H.C.; Yang, C.; Song, Y.P.; Meng, J.; Xu, X.L. A Comparison of Datasets of Precipitable Water Vapor over Jinan Retrieved by Three Kinds of Equipments. J. Mar. Meteorol. 2017, 37, 83–89. [Google Scholar]
- Wang, H.; Zhang, E.H.; Meng, J.; Xu, X.L. Error Analysis of Precipitable Water Vapor by GPS/MET and Its Application in Precipitation Forecast. Sci. Soil Water Conserv. 2017, 15, 85–91. [Google Scholar]
- Cao, Y.J.; Liu, J.M.; Liang, H.; Li, W.J.; Chu, Y.L. Progress in Ground-Based GPS Tomographying Atmospheric Water Vapor Resource. J. Nat. Resour. 2010, 10, 1786–1796. [Google Scholar]
- Xiong, Y.L.; Huang, D.F.; Ding, X.L.; Yin, H.T. Research on the Modeling of Tropospheric Delay Based on Multi-reference-stations. Geotech. Investig. Surv. 2005, 5, 55–57. [Google Scholar]
- Xue, Q. The Study on Local Model Based on the Atmospheric Weighted Mean Temperature. Railw. Investig. Surv. 2018, 44, 24–27. [Google Scholar]
- Gu, X.P.; Wang, C.Y.; Wu, D.X. Research on the Local Algorithm for Weighted Atmospheric Temperature Used in GPS Remote Sensing Water Vapor. Sci. Meteorol. Sin. 2005, 25, 79–83. [Google Scholar]
- Wang, X.Y.; Zhu, W.Y.; Yan, H.J.; Ding, J.C. The Latest Advance in Monitoring Atmosphere by Ground Based GPS. Adv. Earth Sci. 1997, 12, 22–30. [Google Scholar]
- Chen, X.L. Study on the Operation and Application of the Ground-Based GPS in Hebei; Lanzhou University: Lanzhou, China, 2007. [Google Scholar]
- Li, C.; Mao, J.T. Analysis for Remote Sensing of Atmospheric Precipitable Water Using Ground Based GPS Receiver. Q. J. Appl. Meteorol. 1998, 9, 91–98. [Google Scholar]
- Yang, J.M.; Qiu, J.H. A Method for Estimating Precipitable Water and Effective Water Vapor Content from Ground Humidity Parameters. Chin. J. Atmos. Sci. 2002, 26, 9–22. [Google Scholar]
- Zhou, X.J.; Zhao, P.; Chen, J.M.; Chen, L.X.; Li, W.L. Impacts of thermodynamic processes over the Tibetan Plateau on the Northern Hemispheric climate. Sci. China (Ser. D Earth Sci.) 2009, 39, 1473–1486. [Google Scholar] [CrossRef]
- Liu, X.D. Influences of Qinghai Xizang(Tibet) Plateau Uplift on the Atmospheric Circulation, Global Climate and Environment Changes. Plateau Meteorol. 1999, 18, 321–332. [Google Scholar]
- Wu, G.X.; Mao, J.Y.; Duan, A.M.; Zhang, Q. Recent Progress in the Study on the Impacts of Tibetan Plateau on Asian Summer Climate. Acta Meteorol. Sin. 2004, 62, 528–540. [Google Scholar]
- Xu, X.D.; Shi, X.Y.; Wang, Y.Q. Data Analysis and Numerical Simulation of Moisture Source and Transport Associated with Summer Precipitation in the Yangtze River Valley over China. Meteorol. Atmos. Phys. 2008, 100, 217–231. [Google Scholar] [CrossRef]
- Huang, J.P.; Liu, Y.Z.; Wang, T.H.; Yan, H.R.; Li, J.M.; He, Y.L. An Overview of the Aerosol and Cloud Properties and Water Vapor Budget over the Qinghai-Xizang Plateau. Plateau Meteorol. 2021, 40, 1225–1240. [Google Scholar]
- Liang, H. Study of Atmospheric Water Vapor Distribution and Change over Tibetan Plateau and around Area; Chinese Academy of Meteorological Sciences: Beijing, China, 2005. [Google Scholar]
- Bothe, O.; Fraedrich, K.; Zhu, X. Large-scale Circulations and Tibetan Plateau Summer Drought and Wetness in a High–resolution Climate Model. Int. J. Climatol. 2011, 31, 832–846. [Google Scholar] [CrossRef]
- Sun, J.; Wang, H. Changes of the Connection between the Summer North Atlantic Oscillation and the East Asian Summer Rainfall. J. Geophys. Res. Atmos. 2012, 117, 393–407. [Google Scholar] [CrossRef]
- Gao, Y.; Wang, H.; Li, S. Influences of the Atlantic Ocean on the summer precipitation of the southeastern Tibetan Plateau. J. Geophys. Res. Atmos. 2013, 118, 3534–3544. [Google Scholar]
- Chang, Z.L.; Cui, Y.; Zhang, W.; Tian, L.; Zhai, T. Characteristics and Developing Potential of Cloud Water Resources in Ningxia with the CERES Data. Arid Land Geogr. 2015, 38, 1112–1120. [Google Scholar]
- Guan, C.H.; Meng, Q.L.; Li, C.; Yin, J.Y. GAMIT/GLOBK Fast Installation and Example Solution Based on Ubuntu. Geomat. Spat. Inf. Technol. 2021, 44, 5–8. [Google Scholar]
- Wang, R.; Pang, Z.; Wang, Q.; Bi, J.X. Research on Positioning Accuracy of BDS/GPS based on GAMIT/GLOBK. Site Investig. Sci. Technol. 2021, 2, 20–25. [Google Scholar]
- Li, Y. Analysis of GAMIT/GLOBK in High-precision GNSS Data Processing for Crustal Deformation. Prog. Earthq. Sci. 2021, 3, 29–37. [Google Scholar] [CrossRef]
- Mu, R.H.; Chang, C.T.; Dang, Y.M.; Cheng, Y. GAMIT 10.71 Resolution GNSS Long Baseline Precision Analysis. GNSS World China 2020, 45, 14–19+83. [Google Scholar]
- Guo, R.C.; Hu, J. Precision Processing and Accuracy Evaluation of Beidou Third-generation Satellite Positioning Data Based on GAMIT. Sci. Technol. Innov. 2022, 5, 66–68. [Google Scholar]
- Li, J.T.; Zhu, L.Y.; Shi, K.; Yu, F.J.; Wang, L.D.; Li, Y.M. Performance Test and Analysis of GLONASS/BDS Precision Relative Positioning with GAMIT (10.7). Eng. Surv. Mapp. 2020, 29, 60–66. [Google Scholar]
- Askne, J.; Nordius, H. Estimation of tropospheric delay for microwaves from surface weather data. Radio Sci. 1987, 22, 379–386. [Google Scholar] [CrossRef]
- Champolliona, C.; Massona, F.; Bouin, N. GPS water vapor tomography: Preliminary results from the ESCOMPTE field experiment. Atmos. Res. 2005, 74, 253–274. [Google Scholar] [CrossRef]
- Goff, J.A. Low-pressure Properties of Water From -160°F to 212°F. Trans. Actions Am. Soc. Heat. Vent. Eng. 1946, 52, 95–121. [Google Scholar]
Publisher’s Note: MDPI stays neutral with regard to jurisdictional claims in published maps and institutional affiliations. |
© 2022 by the authors. Licensee MDPI, Basel, Switzerland. This article is an open access article distributed under the terms and conditions of the Creative Commons Attribution (CC BY) license (https://creativecommons.org/licenses/by/4.0/).