Article

Detailed Evolution Characteristics of an Inclined Structure Hailstorm Observed by Polarimetric Radar over the South China Coast

1
Yangjiang Meteorological Bureau, China Meteorological Administration, Yangjiang 529500, China
2
Institute of Tropical and Marine Meteorology, China Meteorological Administration, Guangzhou 510640, China
3
Key Laboratory of Atmosphere Sounding, China Meteorological Administration, Chengdu 610225, China
4
China Meteorological Administration Training Center, Beijing 100081, China
5
Foshan Weather Service/Foshan Tornado Research Center, Foshan 528000, China
*
Author to whom correspondence should be addressed.
Atmosphere 2022, 13(10), 1564; https://doi.org/10.3390/atmos13101564
Submission received: 31 July 2022 / Revised: 14 September 2022 / Accepted: 16 September 2022 / Published: 25 September 2022
(This article belongs to the Special Issue Identification and Optimization of Retrieval Model in Atmosphere)

Abstract

:
A hailstorm with an inclined structure occurred in the western part of the South China coast on 27 March 2020. This study investigates the detailed evolution characteristics of this inclined structure using the Doppler radar data assimilation system (VDRAS) and the improved fuzzy logic hydrometeor classification algorithm (HCA). Obvious differential reflectivity (often referred to as ZDR) arc characteristics, ZDR column characteristics, and the specific differential phase (often referred to as KDP) of the column are observed using dual-polarization radar prior to hailfall. Both the ZDR column and KDP column reached their strongest intensities during the hailfall phase, with their heights exceeding the height of the −20 °C layer (7.997 km above ground level), displaying a cross-correlation coefficient (CC) valley during this phase. Meanwhile, two centers of strong reflectivity were found, with one (C1) being located at 2–4 km, and the other (C2) being located at 6–8 km. The maximum horizontal distance between the two centers is 8 km, suggesting a strongly inclined structure. This inclined structure was closely related to the interaction between upper-level divergent outflows and ambient horizontal winds. The updraft on the front edge of the hailstorm continued to increase, keeping C2 at the upper level. At the same time, large raindrops at the lower part of C2 are continuously lifted, leading to ice formation. These ice particles then fell obliquely from their high altitude, merging with C1.

1. Introduction

Hail is a type of extreme convective weather with a small spatial scale, rapid development, and great destructive power [1,2]. Hailstorm research has always been an important part of the severe weather field. Púcik et al. (2015) [3] found that roofs, windows, vehicles, and crops are damaged when hailstones exceed 5 cm, and trees and green-houses are also damaged when hailstones are 2–3 cm in size. Due to the local extent of hail-affected areas and the lack of widespread, standardized, and accurate hail observation systems, hailstorms are not always captured accurately and comprehensively [4]. In addition, many studies have shown that the hail disasters caused by climate change are increasing and remain difficult to predict accurately [5,6]. Therefore, an improved understanding of the formation and characteristics of hailstorms can potentially lead to more accurate severe weather predictions.
Weather radar has become an important means of identifying and monitoring hail due to its high spatial and temporal resolution, and it is widely used in daily forecasts. With the development of weather radar and other detection technologies, much effort has been made in studying the echo structure and flow field structure inside hailstorm systems. By using a vertically pointing X-band Doppler radar, Battan (1975) [7] obtained vertical velocities within a hail cloud. Miller et al. (1990) [8] derived the hail growth trajectory within a supercell using two radar wind field retrieval results. Hubbert and Bringi (2000) [9] observed that three-body scattering (TBSS) has unique polarization characteristics. In recent years, dual-polarization radar has also been applied to study the microphysical characteristics of mesoscale convective systems (MCSs), such as hail or gust fronts. Browning et al. (1976) [10] established a hail growth model for supercells using observations and analyses from radar and four aircrafts. In addition, Stefano Gobbo (2021) [11] estimated hail loss using crop models and remote sensing. Most existing hailstorm cases have a strong center with a weak echo region (WER) or bounded weak echo region (BWER) on the side of the updraft. There is also an overhanging structure above the inflow area. When hail falls, the strong center drops rapidly from the middle and high layers, and the vertical structure of the hailstones throughout this phase are mostly perpendicular to the ground or are tilted slightly forward [12,13]. However, there have been few studies on the detailed evolution characteristics of hail with multiple strong centers and strongly inclined structures [14,15]. Xu et al. (2016) [14] mainly analyzed the environmental field evolution and internal airflow structure of a case of hail with an inclined structure and found that the internal vortex characteristics made the supercell have a strong updraft, supporting the growth of large hail. Zhang et al. (2019) [1] used WRF to simulate the evolution process of a case of an inclined hailstorm in Guizhou Province, mainly analyzing the development and evolution characteristics of hail cloud system and the microphysical structure characteristics of the clouds. Using dual-polarization radar with wind field retrieval and Park et al.’s (2009) [15] particle phase recognition algorithm, Pan et al. (2020) [16] analyzed the dual-polarization characteristics, dynamics, and physical structure evolution of the clouds in a large supercell hailstorm in Fujian Province. However, considering the differences between radar hardware and DSD in South China, whether the default parameters used in the American algorithm can be directly applied to South China radar measurements remains to be tested (this will be explained later).
Studies have shown that hail embryos are mainly derived from graupels and frozen droplets. However, the type and number of hail embryos, the supercooled water content, and the strength of a storm’s updrafts all affect hail formation. This is important when investigating the microphysical processes inside a hailstorm, such as when investigating the interactions between various particles. The formation of hailstones is also closely related to updrafts [17,18]. Small frozen particles become hail embryos when updrafts carry hydrometeors above the melting layer, growing as additional supercooled liquid water freezes on them. Original hail embryos lofted upward by the updraft may temporarily fall out and recirculate back into the updraft, where they continue to grow to larger sizes; as such, their trajectories within the cloud can be quite complicated. So long as there is sufficient updraft strength to support large hailstones without being so strong as to eject them out of the growth region, hailstones can reside in the updraft for a long time, becoming quite sizeable [19,20,21]. Dual-polarization radars can emit polarized electromagnetic waves in both the horizontal and vertical directions. A series of polarization parameters can also be obtained in addition to obtaining conventional parameters, such as the horizontal reflectivity factor. These parameters can provide information such as the phase state, shape, and spatial orientation of the hydrometeor depending on which the type of hydrometeor can be further inferred. Dual-polarization has been improved over the last 20 years and has been applied to classify the phases of different bands and different regions of the hailstorm [22,23,24,25,26,27]. Park et al. (2009) [15] proposed a new fuzzy logic-based HCA, in which the confidence level is calculated to evaluate the quality of the radar observations for each polarimetric variable, and it can be used to adjust weighting factors during the fuzzy logic approach. The operational algorithm uses the HCA of the U. S. Weather Surveillance Radar 88 Doppler (WSR-88D) dual-polarization radars, the results of which have been widely verified [28,29]. A modified HCA using dual-polarization radar data collected over the Pearl River Delta has been developed by Wu et al. (2018) [30]. The membership functions used in the HCA for DS, WS, CR, and BS are optimized based on the statistical analysis of the polarimetric variables from raindrops, snow and ice crystals, melting particles, and non-meteorological echoes [30]. Meanwhile, according to the local radar data, the thresholds of ZDR and ρhv for confidence vector computation were modified. The classifications of the phase state generated by the new HCA performed well [31,32] and is more suitable for the study of the microphysical characteristics of different phase particles in South China.
This study aims to investigate the detailed evolution characteristics of the inclined structure of a hailstorm that occurred on the west coast of southern China. However, no single remote sensing instrument (e.g., radar) can observe three-dimensional wind fields. The four-dimensional variational (4DVAR) Doppler radar assimilation system (VDRAS) [33,34] developed by National Center for Atmospheric Research (NCAR), has been widely used to reveal three-dimensional wind patterns within a mesoscale convective system [35,36,37,38,39]. VDRAS is capable of producing rapid-update mesoscale analyses by assimilating radar and surface observations. The formation and characteristics of the inclined hailstorm are investigated using VDRAS and the improved HCA. This will deepen our understanding of the fine structure of an inclined hailstorm, which will help to improve hailstorm forecasting.

2. Data and Methods

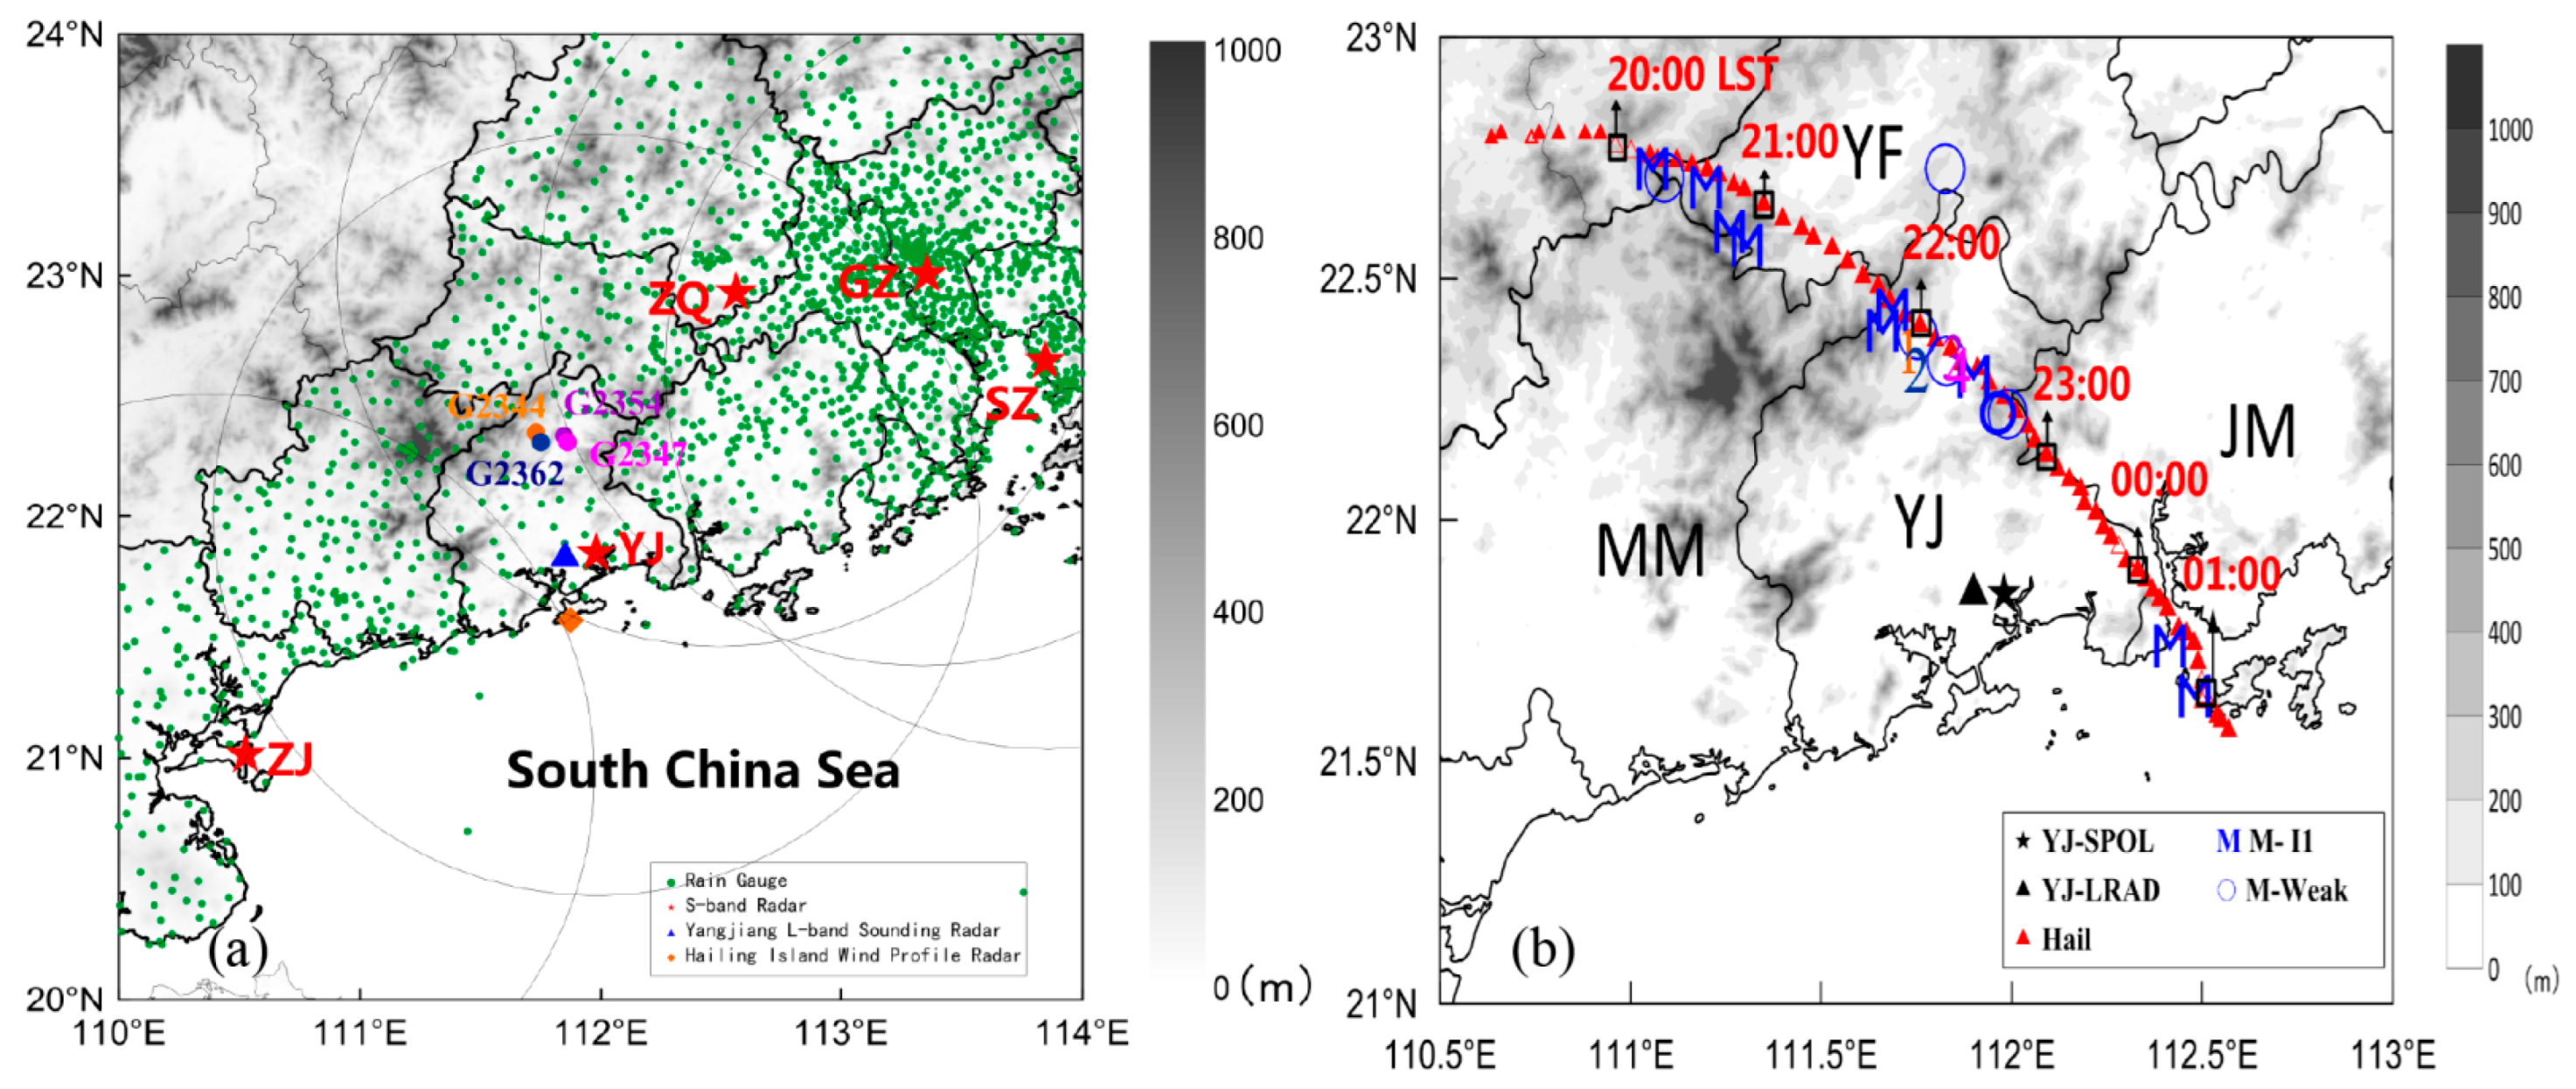
2.1. Observation Data

Yangjiang S-band Polarization Radar (YJ-SPOL in Figure 1) was used in this study to examine the dual-polarization characteristics of the hailstorm structure. The Yangjiang l-band sounding radar (YJ-LRAD), the Hailing Island wind profile radar, and Yangjiang hailstone automatic station were also utilized to reveal the synoptic environment during the formation of the hailstorm. Skew T-log P diagrams are generated by calculating the data obtained by YJ-LRAD. The first two families of curves, temperature and pressure, are used to locate points on the chart. An arbitrary coordinate system was selected to measure distances. Let the origin correspond to the point at a temperature of 0 °C (centigrade) and a pressure of 1000 mb (millibars). Take the X direction to be parallel to the pressure lines (horizontal), with positive X to the right. The point at a temperature of 1 °C and at a pressure of 1000 mb is on the positive side of the origin [40]. The Y direction is perpendicular to the X direction. Positive Y is towards lower pressures (up). A point on the chart that is specified by its temperature and pressure may be transformed to X, Y coordinates via Equations (1) and (2) in Stipanuk (1974) [40]. The components of the X, Y system are given in inches. See Stipanuk (1974) [40] for the method for calculating quantity. The geopotential height represents the thickness accumulation between two adjacent barometric layers. It is usually calculated using the temperature, barometric pressure, and humidity measured by sounding, or it can be obtained by converting the radar height. The pressure height formula is shown in Formula (1) of Cui (2017) [41].
In addition, the radial velocity and reflectivity data of five operational S-band ground-based Doppler radars, the Yanjiang radar (YJ-SPOL in Figure 1), Guangzhou radar (GZ-SPOL), Shenzhen radar (SZ-SPOL), Zhaoqing radar (ZQ-SPOL), and Zhanjiang radar (ZJ-SPOL), were used in the present study. The five radars operate using the volume coverage pattern 21 (VCP21) mode, which includes nine elevations ranging from 0.5 to 19.5° [42,43] every 6 min and a 230 km maximum Doppler range. Together with observations from the five radars, 10 m wind and 2 m temperature from −1000 AWSs (automated weather stations) taken every 5 min are included to obtain high-resolution reanalysis.
This paper selects a hailstorms supercell process in western Guangdong on the night of 27 March 2020. The scarcity of Yangjiang ground hail detection networks adds complexity to hailstorm confirmation and characterization. The hail was mainly confirmed through the time and place reported by the meteorological information officer and hail photos provided by witnesses.

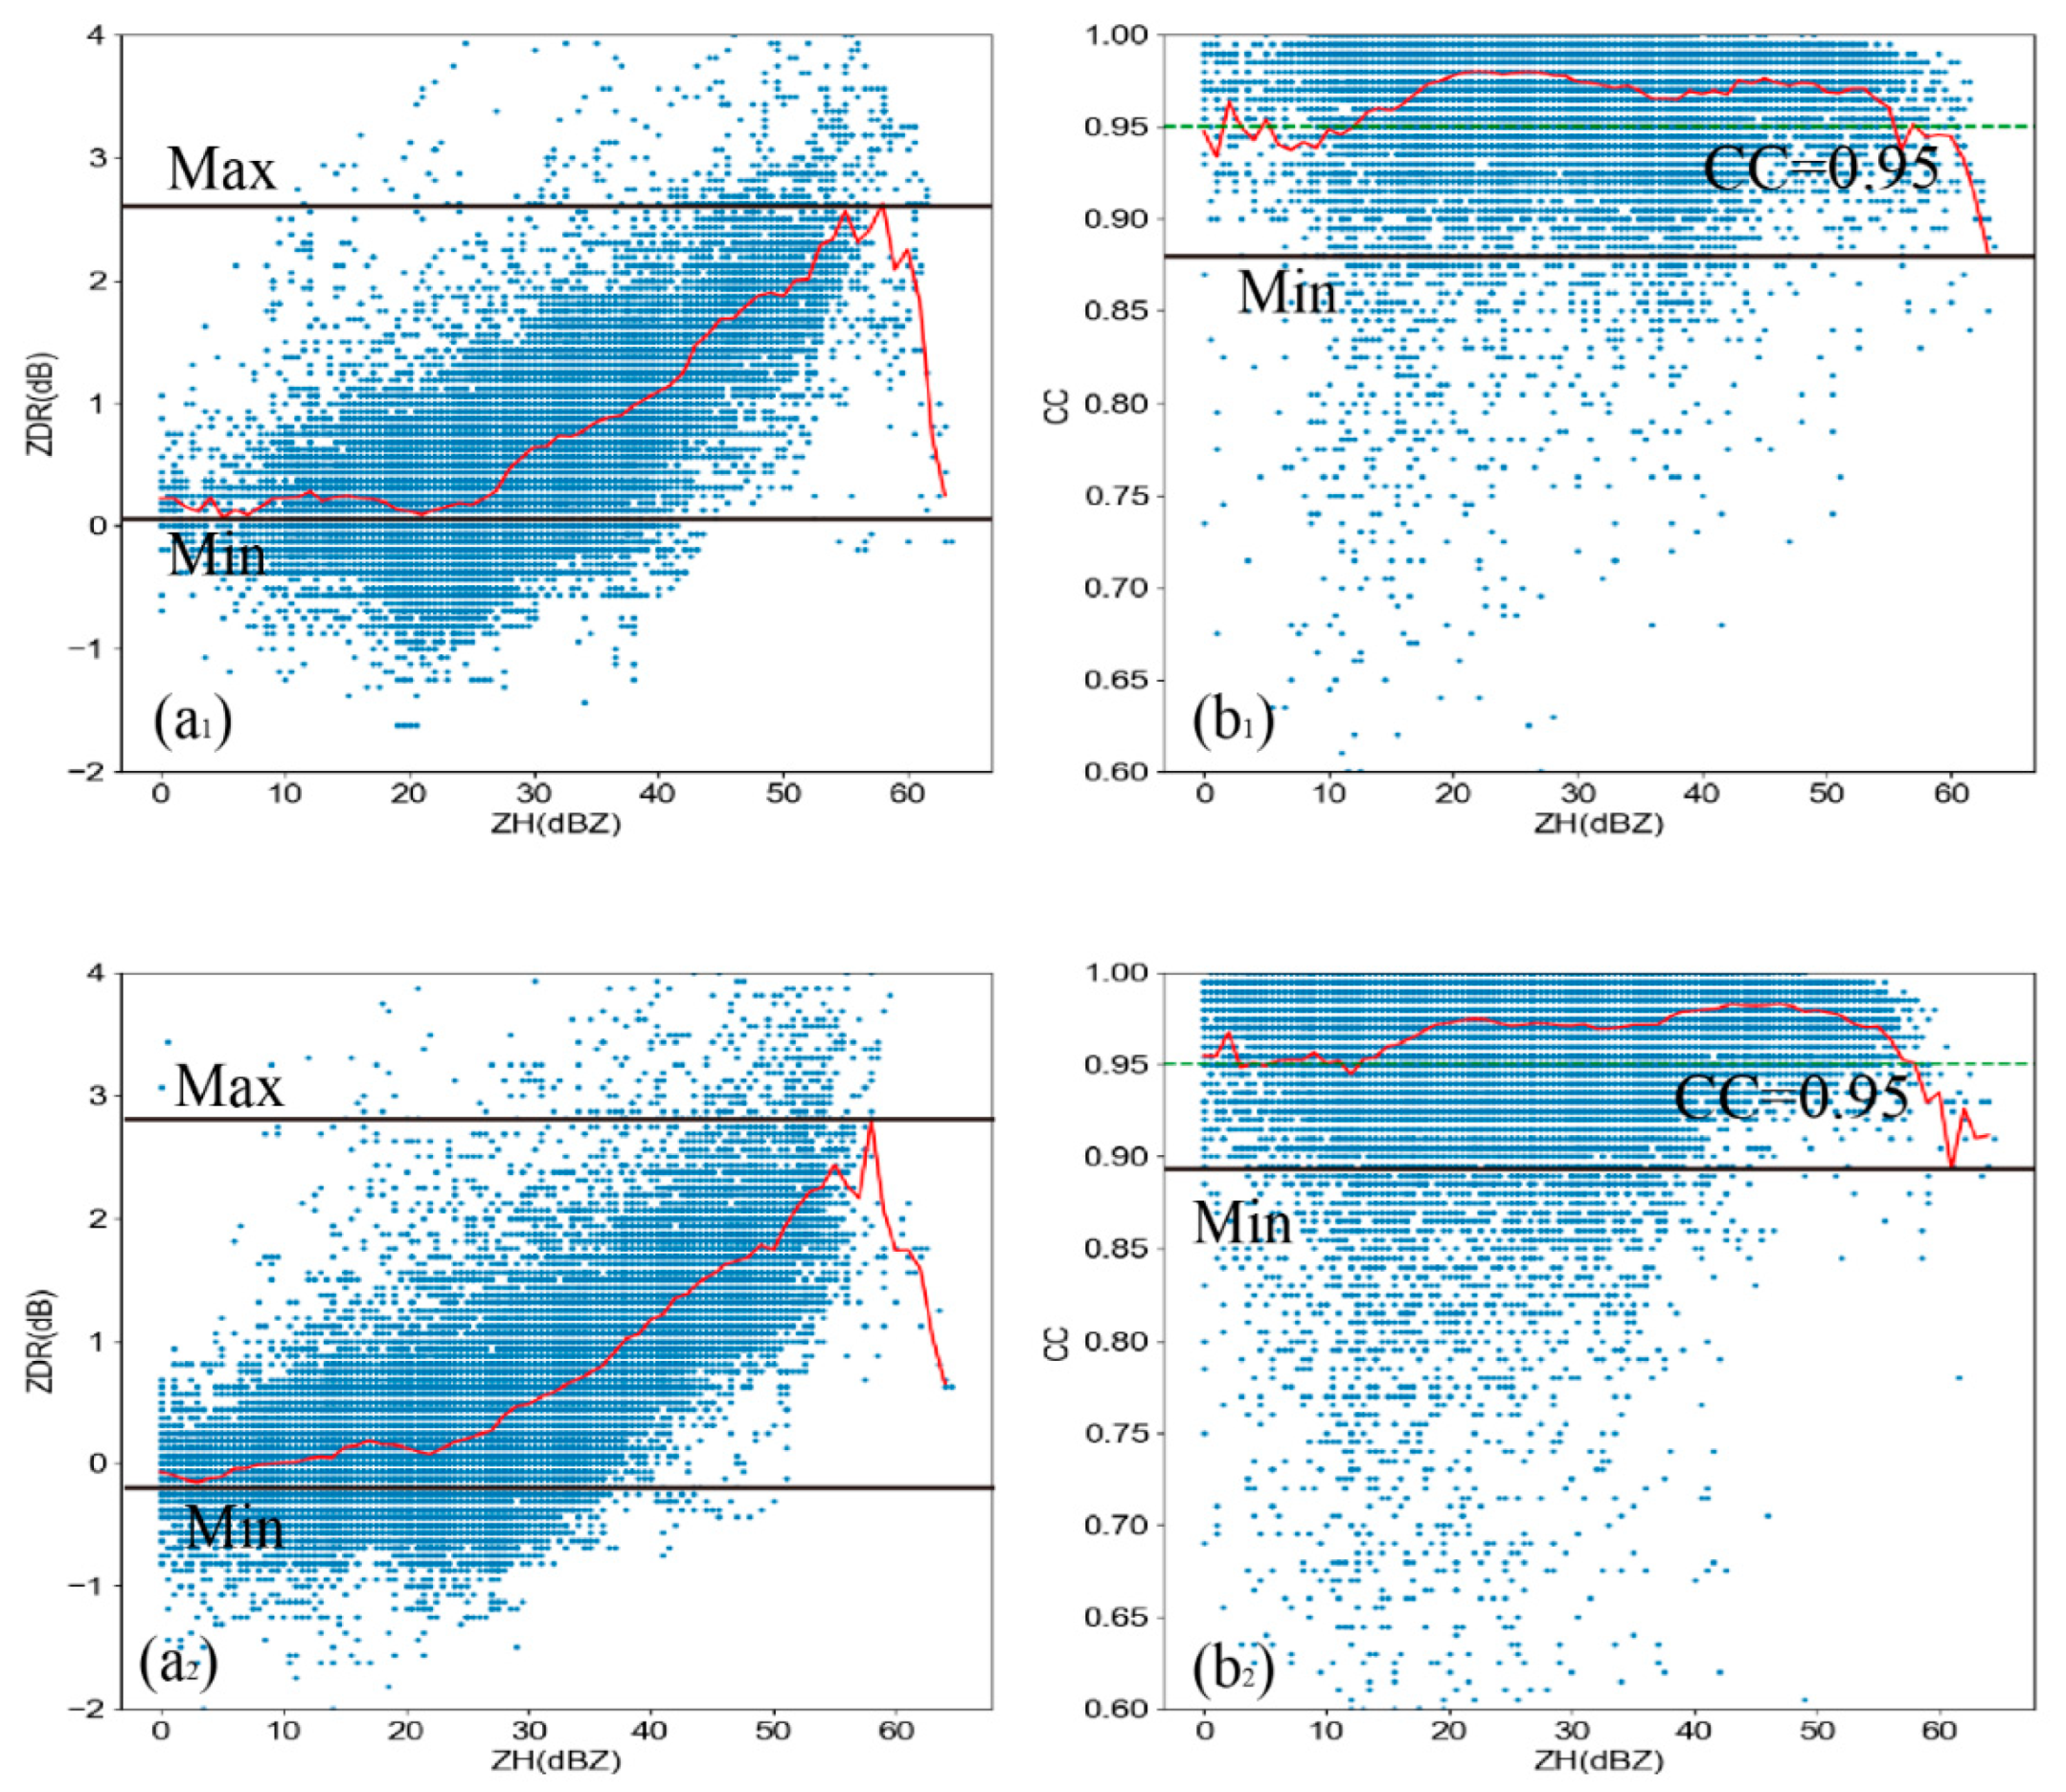
2.2. Data Processing of Dual-Polarization Radar

The main performance indices of YJ-SPOL are given in Table 1. YJ-SPOL operates using the VCP21 mode, which consists of one plan position indicator (PPI).
The five radars in the locations shown in Figure 1 operate using a VCP21 mode consisting of nine elevations (0.5, 1.5, 2.4, 3.4, 4.3, 6.0, 9.9, 14.6, and 19.5°) every 6 min and have an unambiguous range (velocity) of 150 km (26. 5 m·s−1).
In order to better analyze the dual-polarization radar characteristics of this hailstorm, strict radar data quality control technology was carried out from three different aspects: the elimination of non-meteorological echoes, the correction of system ZDR bias, and algorithm revisions of KDP in hail [44,45,46].
It should be pointed out that since the calculation of KDP is related to CC, KDP will not be calculated when CC < 0.9, so there will be some null KDP values when there is a corresponding radar echo. Because the CC of large hail is usually less than 0.9, KDP has obvious defects when analyzing the evolution of hail.
In order to effectively avoid a null KDP value in hail, this paper adds the signal-to-noise ratio (SNR) as the constraint condition: (1) when CC ≥ 0.90, the SNR ≥ 50, and the reflectivity is greater than 40 dBZ, the KDP will be recalculated using the 9-point least squares method. (2) When the CC ≥ 0.90, the SNR ≥ 50, and the is reflectivity <40 dBZ, the KDP will be recalculated using the 25-point least squares method [47], solving the problem of missing KDP in hailstorms.

2.3. VDRAS

VDRAS is a rapidly updated 4DVAR system based on a three-dimensional numerical cloud model and its joint, which assimilates the reflectivity and radial velocity of multiple Doppler radars. High-resolution analyses yielded by VDRAS simultaneously satisfy both model physics and radar observations [33,35]. In recent years, VDRAS has been successfully applied to the convective-scale analysis and short-term forecasts of mesoscale convective storms [36,48,49,50].
The five radars are located in the locations shown in Section 2.2. Note that this 6-minute radar volume sampling rate allows VDRAS analysis to document storm evolutions slower than this time scale. Due to the large increments at higher elevation angles in a typical radar VCP21 scanning sequence, radar observations are sparse in the middle to upper parts of a storm, which results in relatively large uncertainties compared to those at lower levels in VDRAS analysis [50]. The use of data from five radars effectively expands the data coverage compared to assimilating only one radar, reducing the radar data void regions in the middle to upper parts of the storm. Radar data gaps exist in the boundary layer in addition to the results from the earth’s curvature. The VDRAS used in this study has been modified to assimilate observations from both the Doppler radar and surface AWSs, significantly improving performance in the boundary layer [48]. This improved VDRAS has also been widely used to investigate the convective-scale and mesoscale processes of convective systems in China [36,37,51].
In the current study, the radial velocity and reflectivity factor of the five radars and readings of the wind at 10 m and the temperature at 2 m from −1000 AWSs were assimilated simultaneously within a 9 min 4DVAR assimilation window. Prior to assimilation, the raw radar data were interpolated horizontally onto 1 km Cartesian grids, upon which quality control was performed. With the aid of NCAR RADX software [37], the quality-controlled 1 km data were horizontally interpolated onto the 2 km VDRAS domain grids. By using the weather research and forecasting (WRF, [52]) model, a simulation for this case was also obtained to provide the background and boundary conditions for assimilation. In total, 1 to 2 radar observations and 1 to 2 AWS observations were assimilated in each 9 min assimilation window. The 9 min 4DVAR assimilation was then followed by a 6 min forecast. Each analysis cycle lasted for 15 min, with the VDRAS analysis being conducted from 09:00 to 17:00 UTC on 27 March 2020 for this event. The analyses were generated every 6 min, with a spatial resolution of 2 km. The VDRAS covers a domain consisting of 171 × 171 horizontal grid points (2 km horizontal resolution), with the domain center (112.0 °E, 21.2 °N) being located around the Yangjiang radar. The vertical resolution is 0.3 km with 57 layers, and the lowest model layer is centered at 150 m above ground level (AGL).

2.4. Improved Hydrometeor Identification Method Based on Polarization and Temperature

Since its introduction, many scholars have applied the fuzzy logic algorithm to the hydrometeor identification of dual-polarization radars, testing and evaluating it to achieve more reasonable identification results [23,53,54]. This has improved the understanding of microphysical processes within rapidly developed mesoscale systems [53,55]. This paper investigates the microphysical characteristics of the hailstorm using the improved hydrometeor classification algorithm in Wu et al. (2018) [30]. The classification of hydrometeors in this paper follows the classification method of Park et al. (2009) [15], discriminating between 10 classes of radar echo: (1) ground clutter, including clutter due to anomalous propagation (GC/AP); (2) biological scatterers (BS); (3) dry aggregated snow (DS); (4) wet snow (WS); (5) crystals of various orientations (CR); (6) graupel (GR); (7) big drops (BD); (8) light and moderate rain (RA); (9) heavy rain (HR); and (10) a mixture of rain and hail (RH). The big-drop category designates rain with a drop size distribution skewed towards large raindrops. This usually implies the presence of drops bigger than 3 mm and a deficit of smaller drops. The class of biological scatterers includes insects, birds, and bats. Other nonmeteorological scatterers in the atmosphere, such as tornadic debris or military chaff, may fall into either the GC/AP or BS categories. An aggregation value of Ai for the ith class of radar echoes is defined based on the fuzzy logic principle as:
A i = j = 1 6 W i , j Q j P i ( V j ) j = 1 6 W i , j Q j
where Vj is the jth variable, and Pi (Vj) is a membership function that characterizes the distribution of the jth variable for the ith class. Here, the membership function Pi (Vj) is assumed to have a trapezoidal shape. The value of the functions is determined by the relative location between the input variable and the trapezoidal-shaped membership functions, where different parameters correspond to distributions of the polarimetric variables of different hydrometeors. Wi,j is weighted between 0 and 1, and is assigned to the jth variable. This describes the discriminating efficiency of each variable with respect to a particular class. Readers are referred to Figure 1 of Wu et al. (2018) [30] for more detailed information about ZHRD, related measurement quality control, and the optimized hydrometeor classification algorithm.

3. Case Overview

From 22:00 to 23:00 LST on 27 March 2020, hailstorms appeared along the west coast of Guangdong, the hail particles of which had a diameter of about 2 cm. The hail size mainly comes from measurement results of meteorological informants. On this basis, the location and time of these hail events was further analyzed and verified in combination with radar data, which were consistent with the hail information provided by meteorological informants and witnesses.
This hailstorm occurred and developed in the 200 hPa shunt area and in the low-level shear overlap area (in the 925 hPa). The suction effect formed by upper-level divergence and lower-level convergence, mid-level fluctuations, and boundary layer convergence provided dynamic uplift conditions for the formation of hail (Figure 2). By comparing the ERA5 reanalysis data (Fig.omitted), it was found that the southwesterly wind at 850 hPa in the hailfall area continued to be 12 m·s−1 or above, with an area of high-water vapor flux also being present nearby, indicating a strong southwesterly air current at low altitudes that could continuously transport water vapor to the land, providing water vapor and thermal conditions.
Based on the sounding located near the hail area (Figure 3), it was found that:
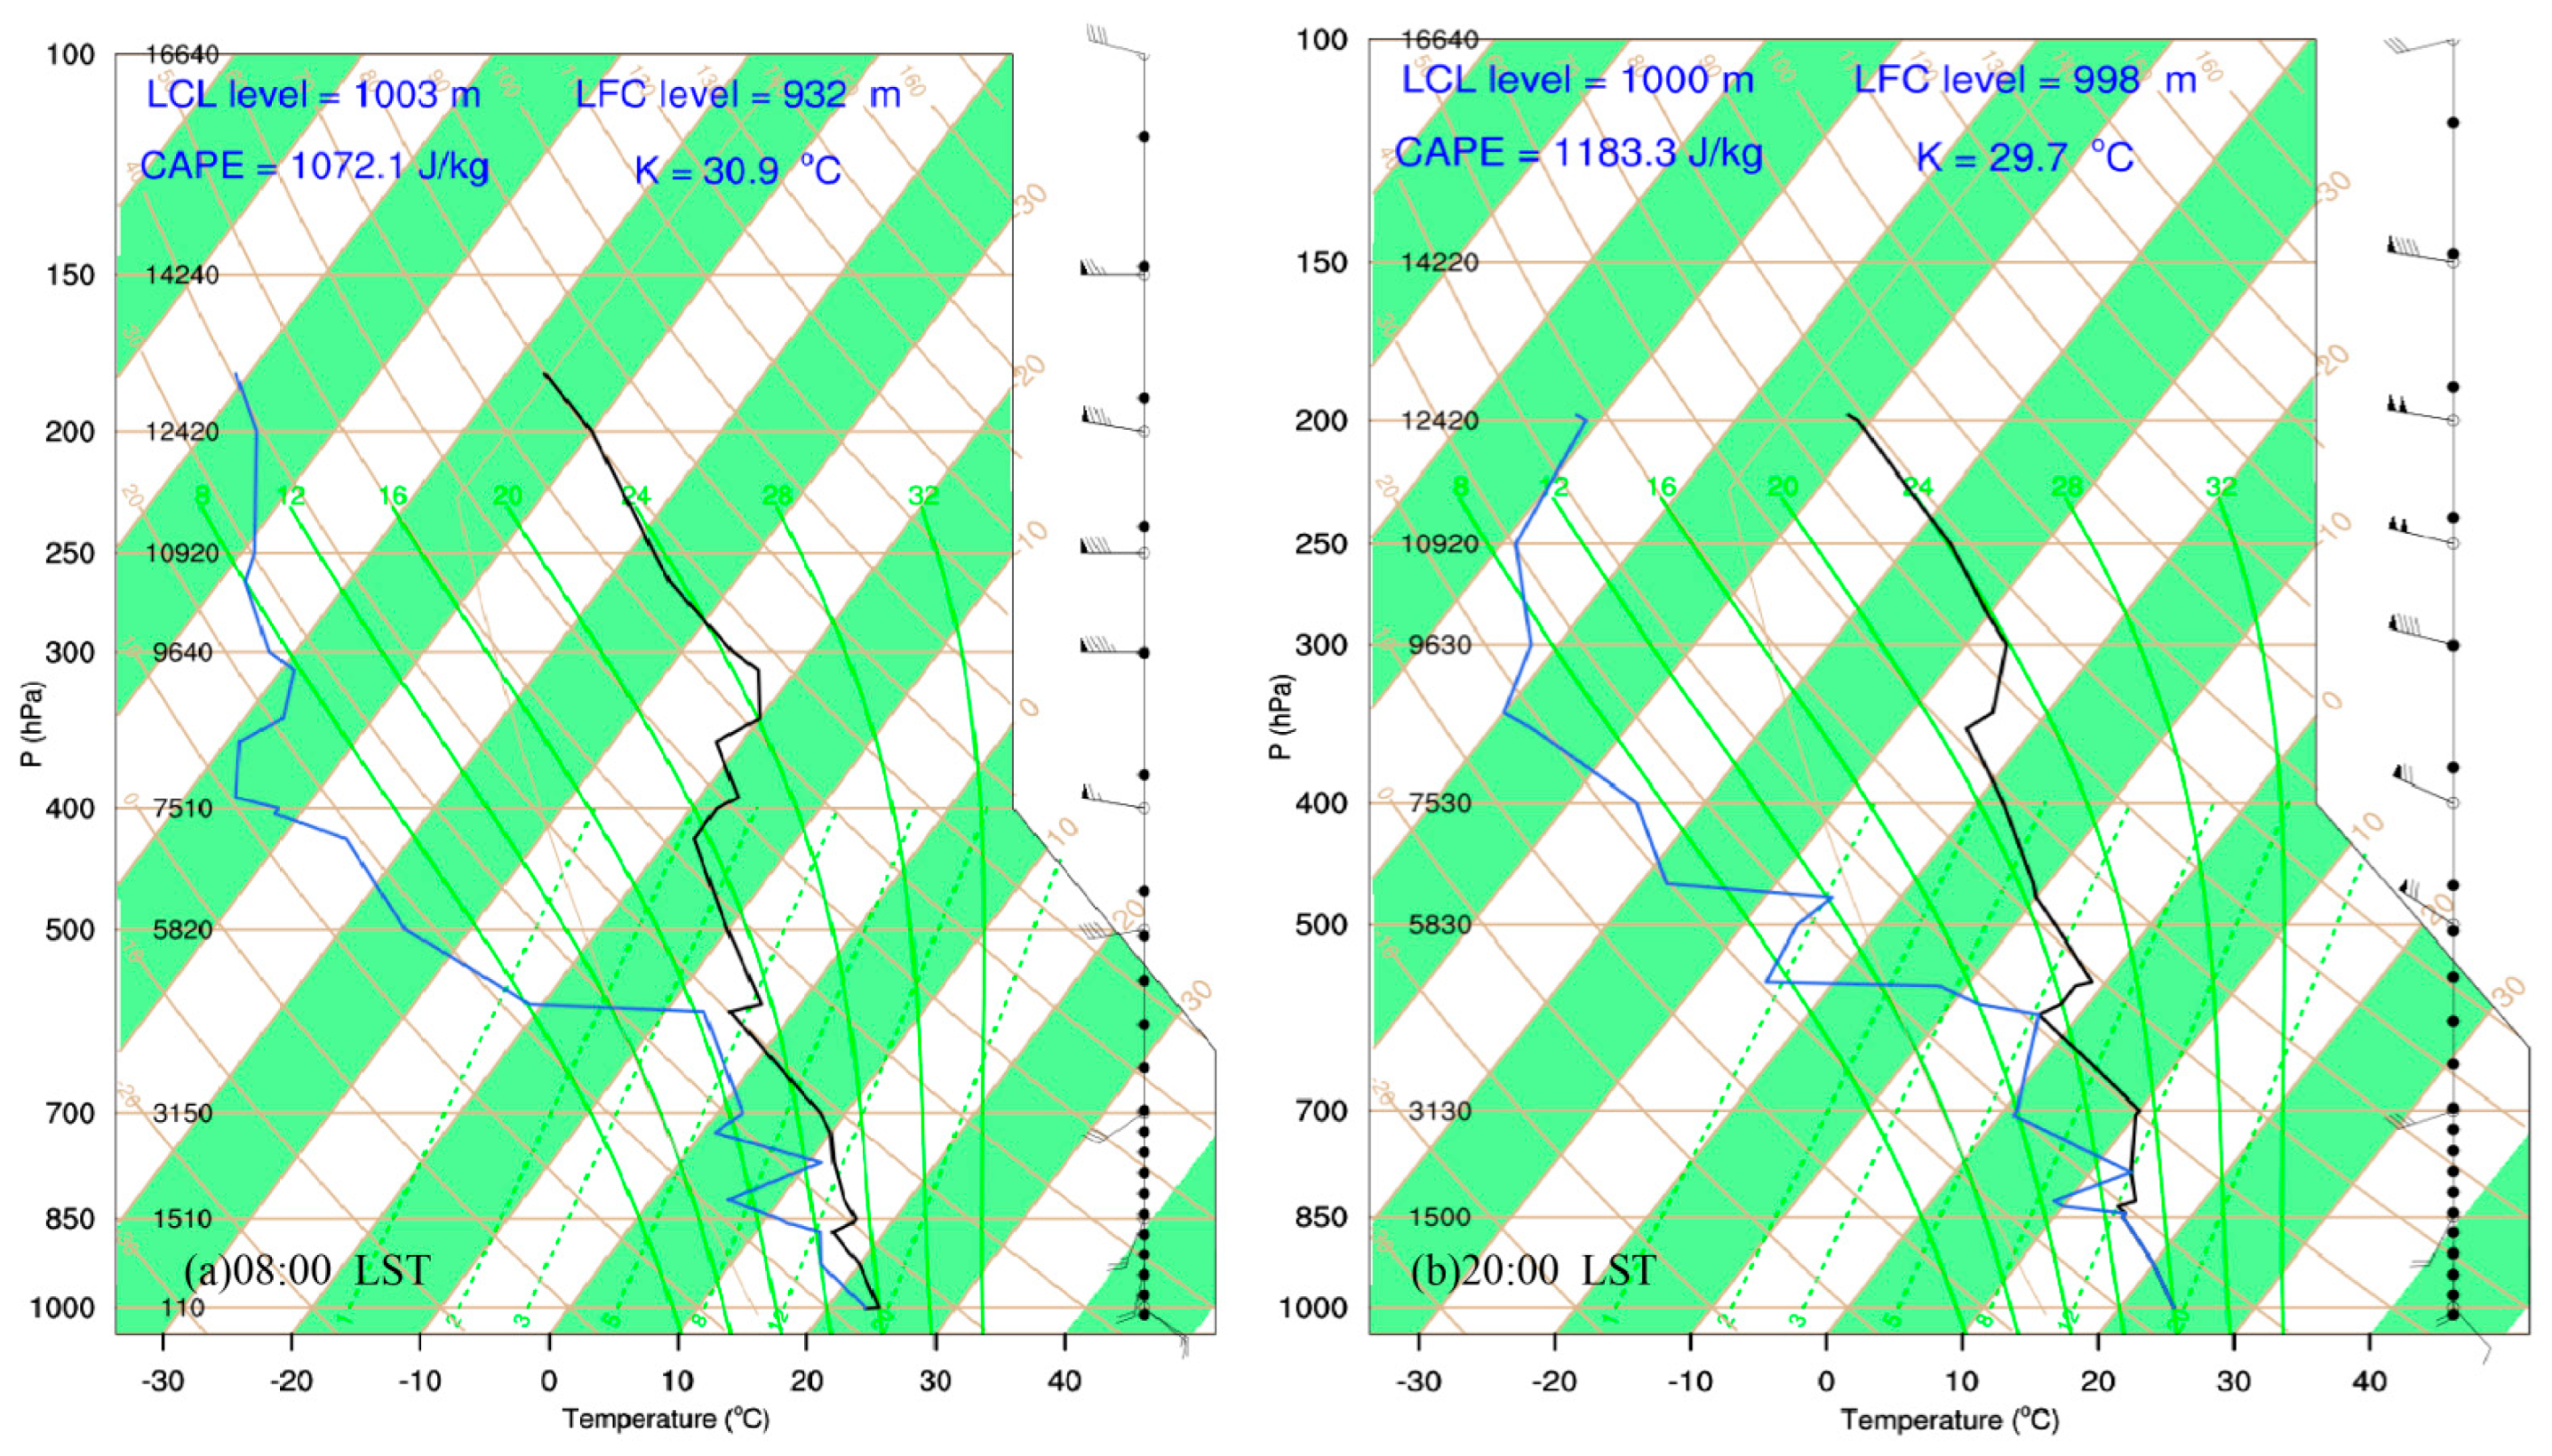
  • From 08:00 to 20:00 LST on the 27th, the hail area was in a state of atmospheric stratification, with the upper layer being dry and the lower one being wet; the humidification of the lower layer was obvious at 20:00 LST. Low- and mid-level winds veered with a height and wind vector difference of 0–6 km, increasing from 16 m·s−1 to 26.6 m·s−1, indicating warm advection and moderate vertical wind shear typical of deep moist convection [56].
  • At 20:00 LST on the 27th, the temperature difference between 850 and 500 hPa reached 27 °C, stronger than previous statistics of hailstorms in northern Guangdong, Guangdong Province, and the Pearl River Delta (PRD) (24–25 °C, [57]). The difference between the temperature and dew point was 46 °C, close to the upper limit of the average value (31.7–46.3 °C). There was also an inversion layer near 850 hPa.
  • Regarding thermal conditions, the CIN decreased to 0 J/kg, the CAPE increased to 1183.30 J/kg, and the SI index was −1.15 °C at 20:00 LST. The heights of the wet bulb zero (WBZ) and the −20 °C were 3922 and 7997 m, respectively. At the same time, the CAPE value above the height of the −20 °C layer increased significantly. The above conditions are conducive to the rapid growth of hail in supercooled water areas and to the maintenance of ice crystal structure, both of which are conducive to the development and falling of hail.
This indicates favorable environmental conditions and unstable energy for the development of the hailstorm.
As shown in Figure 4, the sudden increase in wind speed and precipitation mainly occurred from 22:00 to 23:00 LST, and the wind direction of the four stations before and after 22:00 LST rotated clockwise, but other meteorological elements in Guigang (Figure 4a) and Naliu (Figure 4b) showed little change, which may be related to the southward position of the two stations relative to the storm’s moving path. The wind speed in Beimian (Figure 4c) rapidly increased to 13.4 m·s−1, with the hourly rainfall exceeding 20 mm·h−1. The maximum gust wind speed in Heshui (Figure 4d) reached 15 m·s−1 at 22:30 LST. The precipitation at these two stations was mainly concentrated from 22:20 to 22:40 LST, and affected by rainfall, the decreases in temperature were much stronger than those observed at the first two stations. This indicates rapid hailstorm development. In addition, the hailstorm was accompanied by severe weather, such as temporary strong winds and heavy precipitation.

4. Dual-Polarization Radar Fine-Structure Evolution Characteristics of the Hailstorm

This section discusses the fine supercell structure of this hailstorm, focusing on the features observed via dual polarization.
Hail can be effectively identified using dual-polarization radar, which has been a popular research subject over the last three decades. Kumjian et al. (2008) [58] showed that ZDR column can provide information on the location and intensity of storm updrafts. Snyder et al. (2015) [59] found that the extension height of the ZDR column is related to the strongest updraft and that the strength of the updraft is closely related to the growth potential of hail [60]. Ye et al. through numerical tests, it is found that the strengthening of the wind field in the lower troposphere is conducive to the development of storms and the change of structures [61]. In addition, the change in the ZDR column height precedes the change in the maximum updraft intensity. Heinselman and Ryzhkov et al. (2006) [62] pointed out that polarimetric radar can identify whether hail melts completely or partially before reaching the ground. ZDR columns indicate an updraft, whereas KDP columns mark a major precipitation shaft in a downdraft. Compared to ZDR columns, there are significant differences in the types and concentrations of hydrometeors in KDP columns, which are not sensitive to ice particles. Zrnic et al. (2002) [63] pointed out that the KDP column is dominated by a mixture of large amounts of small and medium raindrops as well as melting ice particles (1–4 mm). Variations in the hail-phase state in this process can be analyzed by combining ZDR, KDP, and CC.

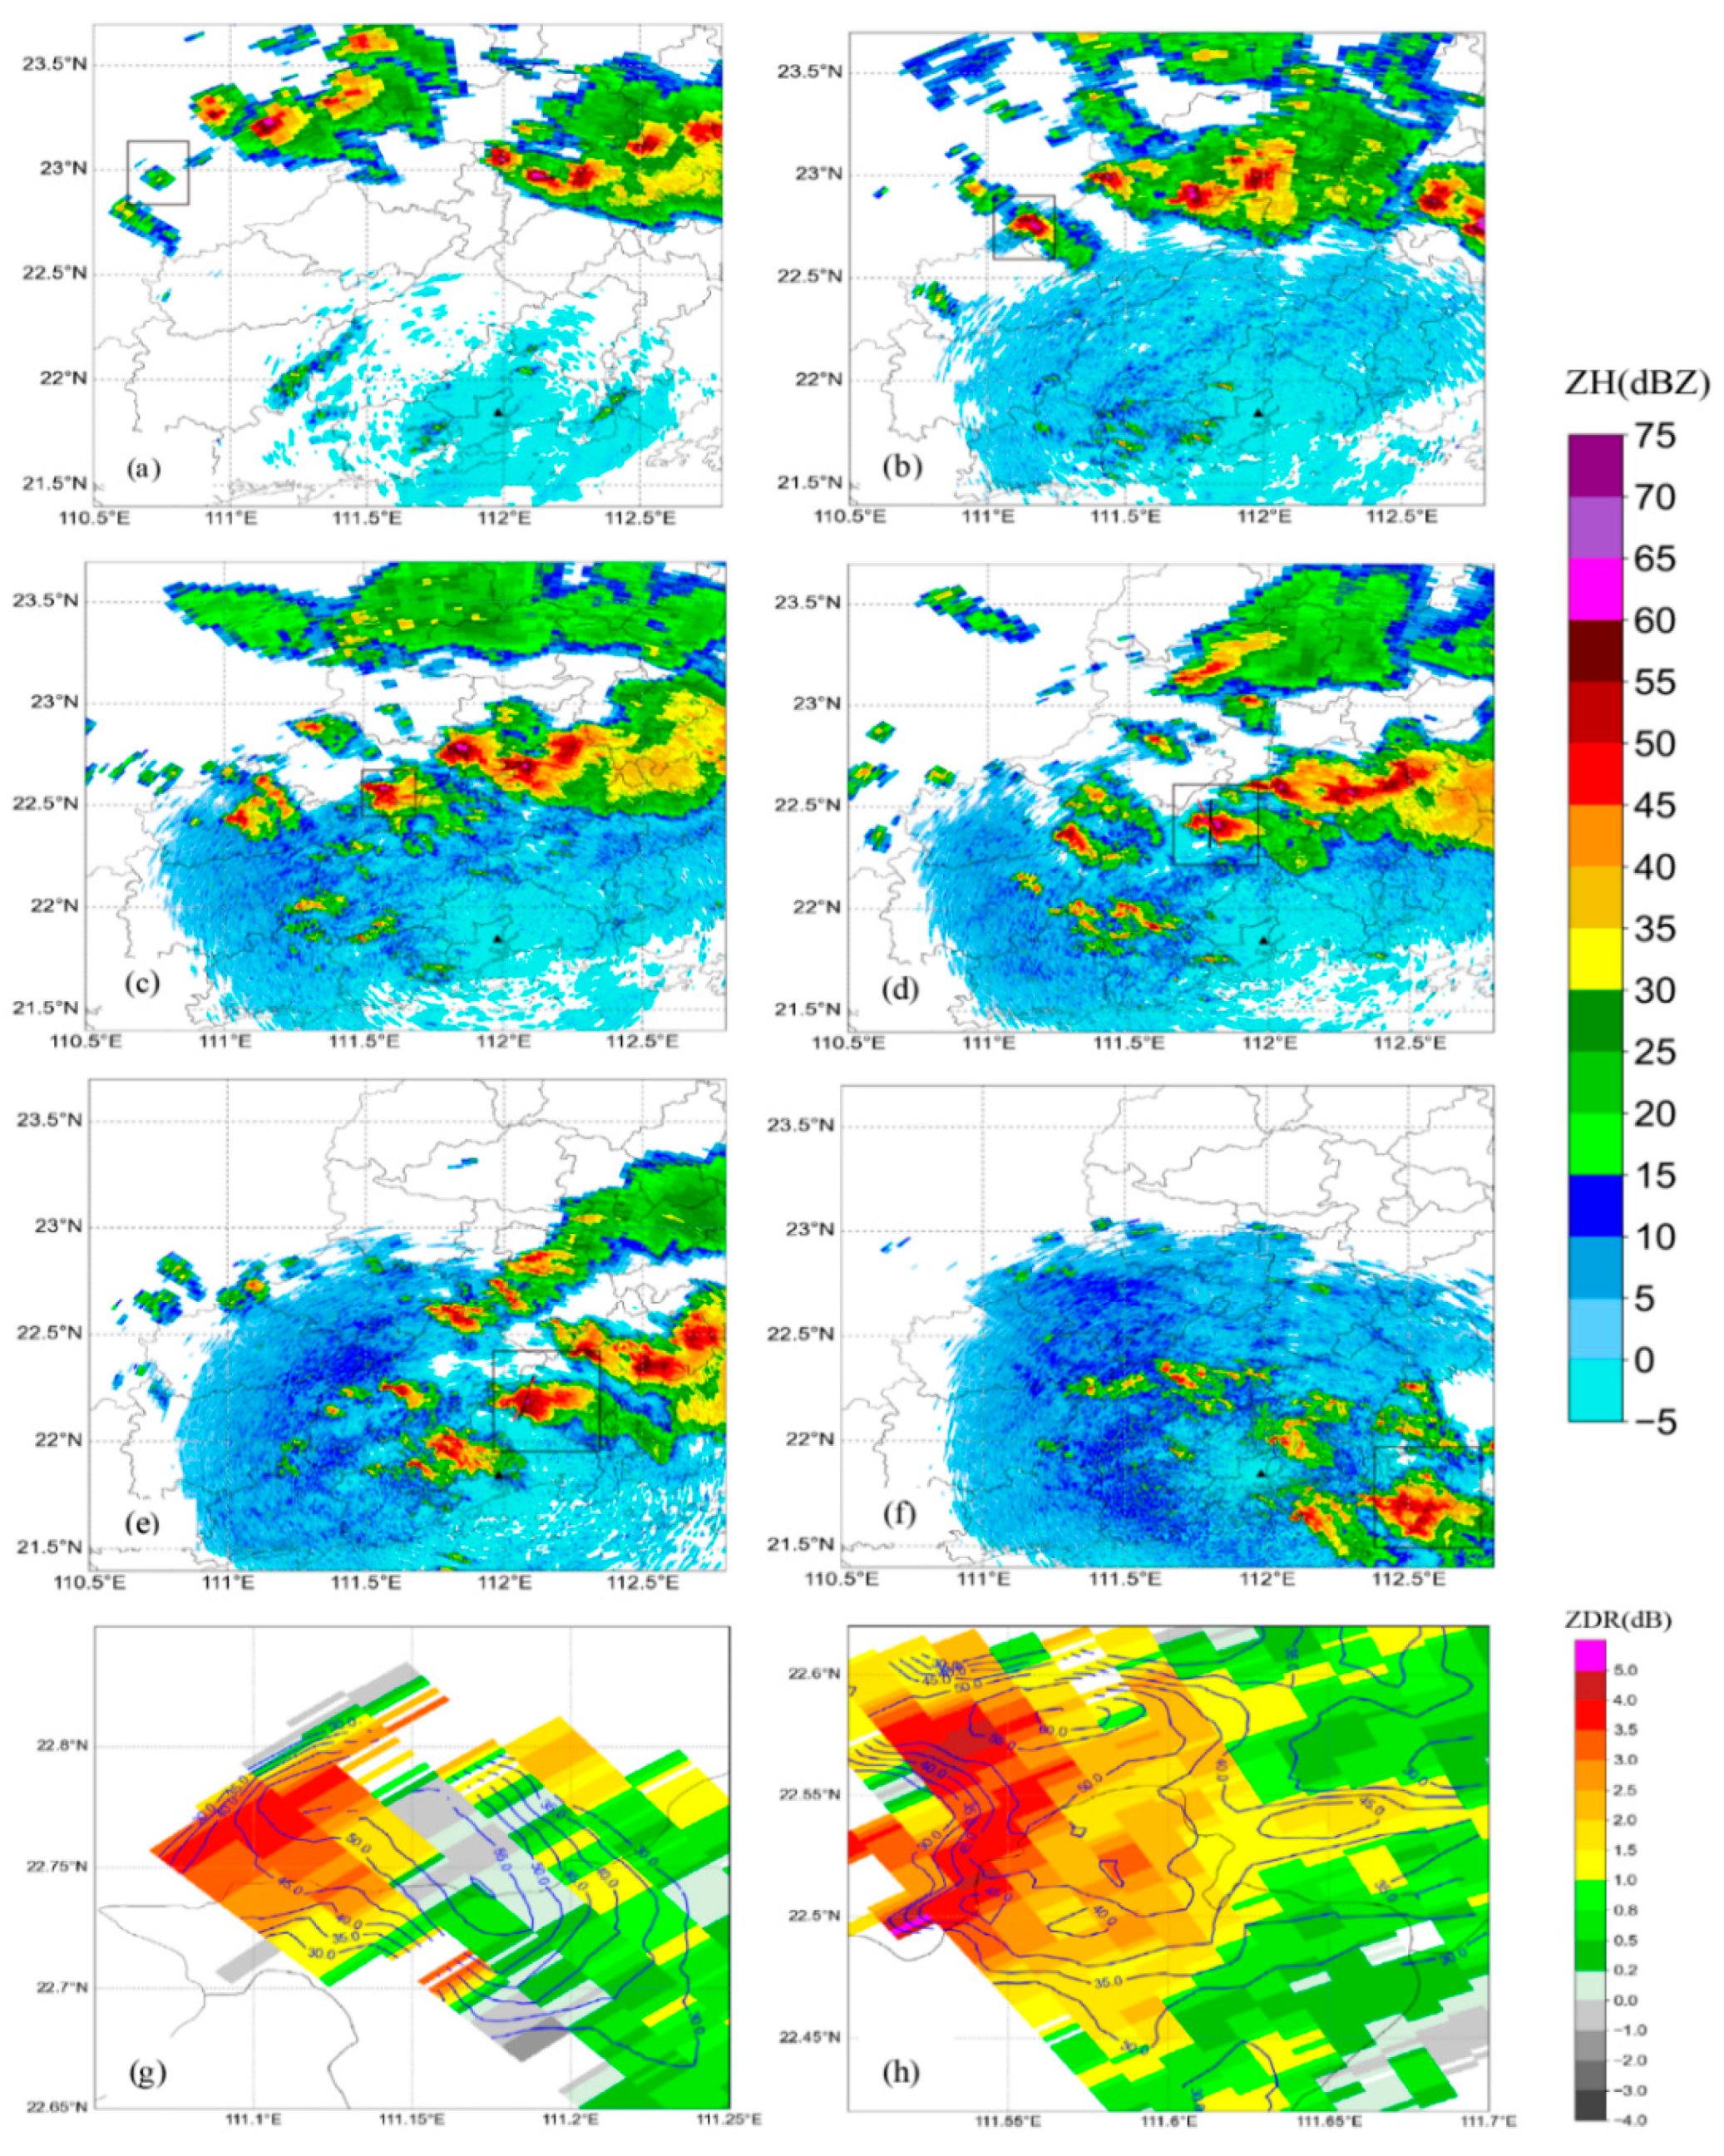
4.1. Developments of the Hailstrom

By analyzing reflectivity factors at an elevation angle of 1.5° (Figure 5a–f) and the radar-tracking path of this hailstorm (Figure 1b), it was found that the hail appeared in a rapidly developing supercell storm. The supercell storm originated from Yulin City, Guangxi Province, and continued to move southeast, passing through Yunfu City and Yangjiang City in Guangdong Province before finally entering the sea southwest of Jiangmen City. The life cycle of the storm lasted nearly 7 h, during which it underwent five stages: the initial stage (S1: 19:00–20:00 LST on the 27th), the development stage (S2: 20:06–20:48 LST on the 27th), the mature stage (S3: 20:54–21:48 LST on the 27th), the hailfall stage (S4: 21:54–23:30 LST on the 27th), and the weakening stage (S5: 23:36LST on the 27th −01:00 LST on 28th).
During the S1 stage, ZH was mostly below 50 dBZ, which is indicative of an ordinary storm (Figure 5a).
During the S2 stage, the storm rapidly developed into a supercell storm once it moved into Yunfu City in Guangdong Province. The strong ZH center was between 60 and 73 dBZ. At 20:30 LST (Figure 5b), typical characteristics of hailstones were present, including a hook-shaped echo, TBSS, and side-lobe echoes. The Yangjiang radar identified many medium cyclones (M) and hail indexes (HI) (Figure 1b). However, medium cyclones mainly appear above 6 km (Figure 6). At the same time, there was a large ZH gradient near the storm inflow gap (ZH decreases from 55 to 30 dBZ), which corresponds to the ZDR large value area (3–4 dB) (Figure 5g solid line ellipse), showing the characteristics of a ZDR arc. The appearance of a ZDR arc indicates a strong wind shear in the hailstorm supercell, which is conducive to the maintenance and development of mesocyclones and thunderstorms. At the same time, this was also a manifestation of the vigorous development of the storm, consistent with the storm evolution trend. In addition, in the region on the right (Figure 5g, ZH ≥ 60 dBZ), a large ZH corresponds to a small ZDR, where ice crystals may be present.
The storm mainly affected Yunfu City during the S3 stage, and the front side of the storm’s movement path developed quickly. However, the strong center was mainly located in the middle and rear, with the intensity of the center weakened slightly (ZH < 70 dBZ). At this stage, the middle cyclone and strong reflection center of the supercell storm continued to reside in the middle layer (Figure 6), and the hail had not yet fallen. The ZH gradient decreased significantly at around 21:30 LST (Figure 5h), corresponding to a slight increase of ZDR (3.5–6 dB, solid line ellipse in Figure 5h), and the area with a negative ZDR value near the high ZH center (dotted line ellipse in Figure 6) disappeared (1–2 dB). As opposed to 20:30 LST, the large ZH area (Figure 5h, ZH ≥ 60 dBZ) corresponded to a large ZDR at this time, which may indicate a large hailstorm or melting hail. As the hail in the hail cloud continued to accumulate, it became more difficult for the updraft to carry the weight of larger hailstones; as such, the hail cloud’s equilibrium state was broken, and the hailfall stage (S4) was ushered in.
The storm mainly affected Yangjiang City during the S4 stage. The ZDR arc weakened and disappeared, but the intensity of the storm center increased rapidly from 63 to 75. 5 dBZ (Figure 5d,e), exhibiting a hook-like structure. The maximum shear value of the mesocyclone was 45 × 10−3 s−1 (22:00 LST, Figure 6), and the top and bottom heights of the mid-cyclone rapidly decreased to 1.5 km and 0.6 km (22:30 LST, Figure 6), indicating that the hail was falling, consistent with the recorded hailfall time. From 22:48 to 23:30 LST, the storm experienced a second strengthening; at 23:00 LST, the strong ZH center was about 67 dBZ, but there was no medium cyclone present. The height of the storm’s center dropped slightly. At 23:00 LST, the ZH at the center of the storm reached 68 dBZ, while the hail was still falling. During stage S5, the ZH in the storm center quickly dropped to below 60 dBZ, moving to the South China Sea and away from land.
By analyzing the wind profile radar data from Hailing Island (Figure 7), the evolution of the wind was as follows:
(1)
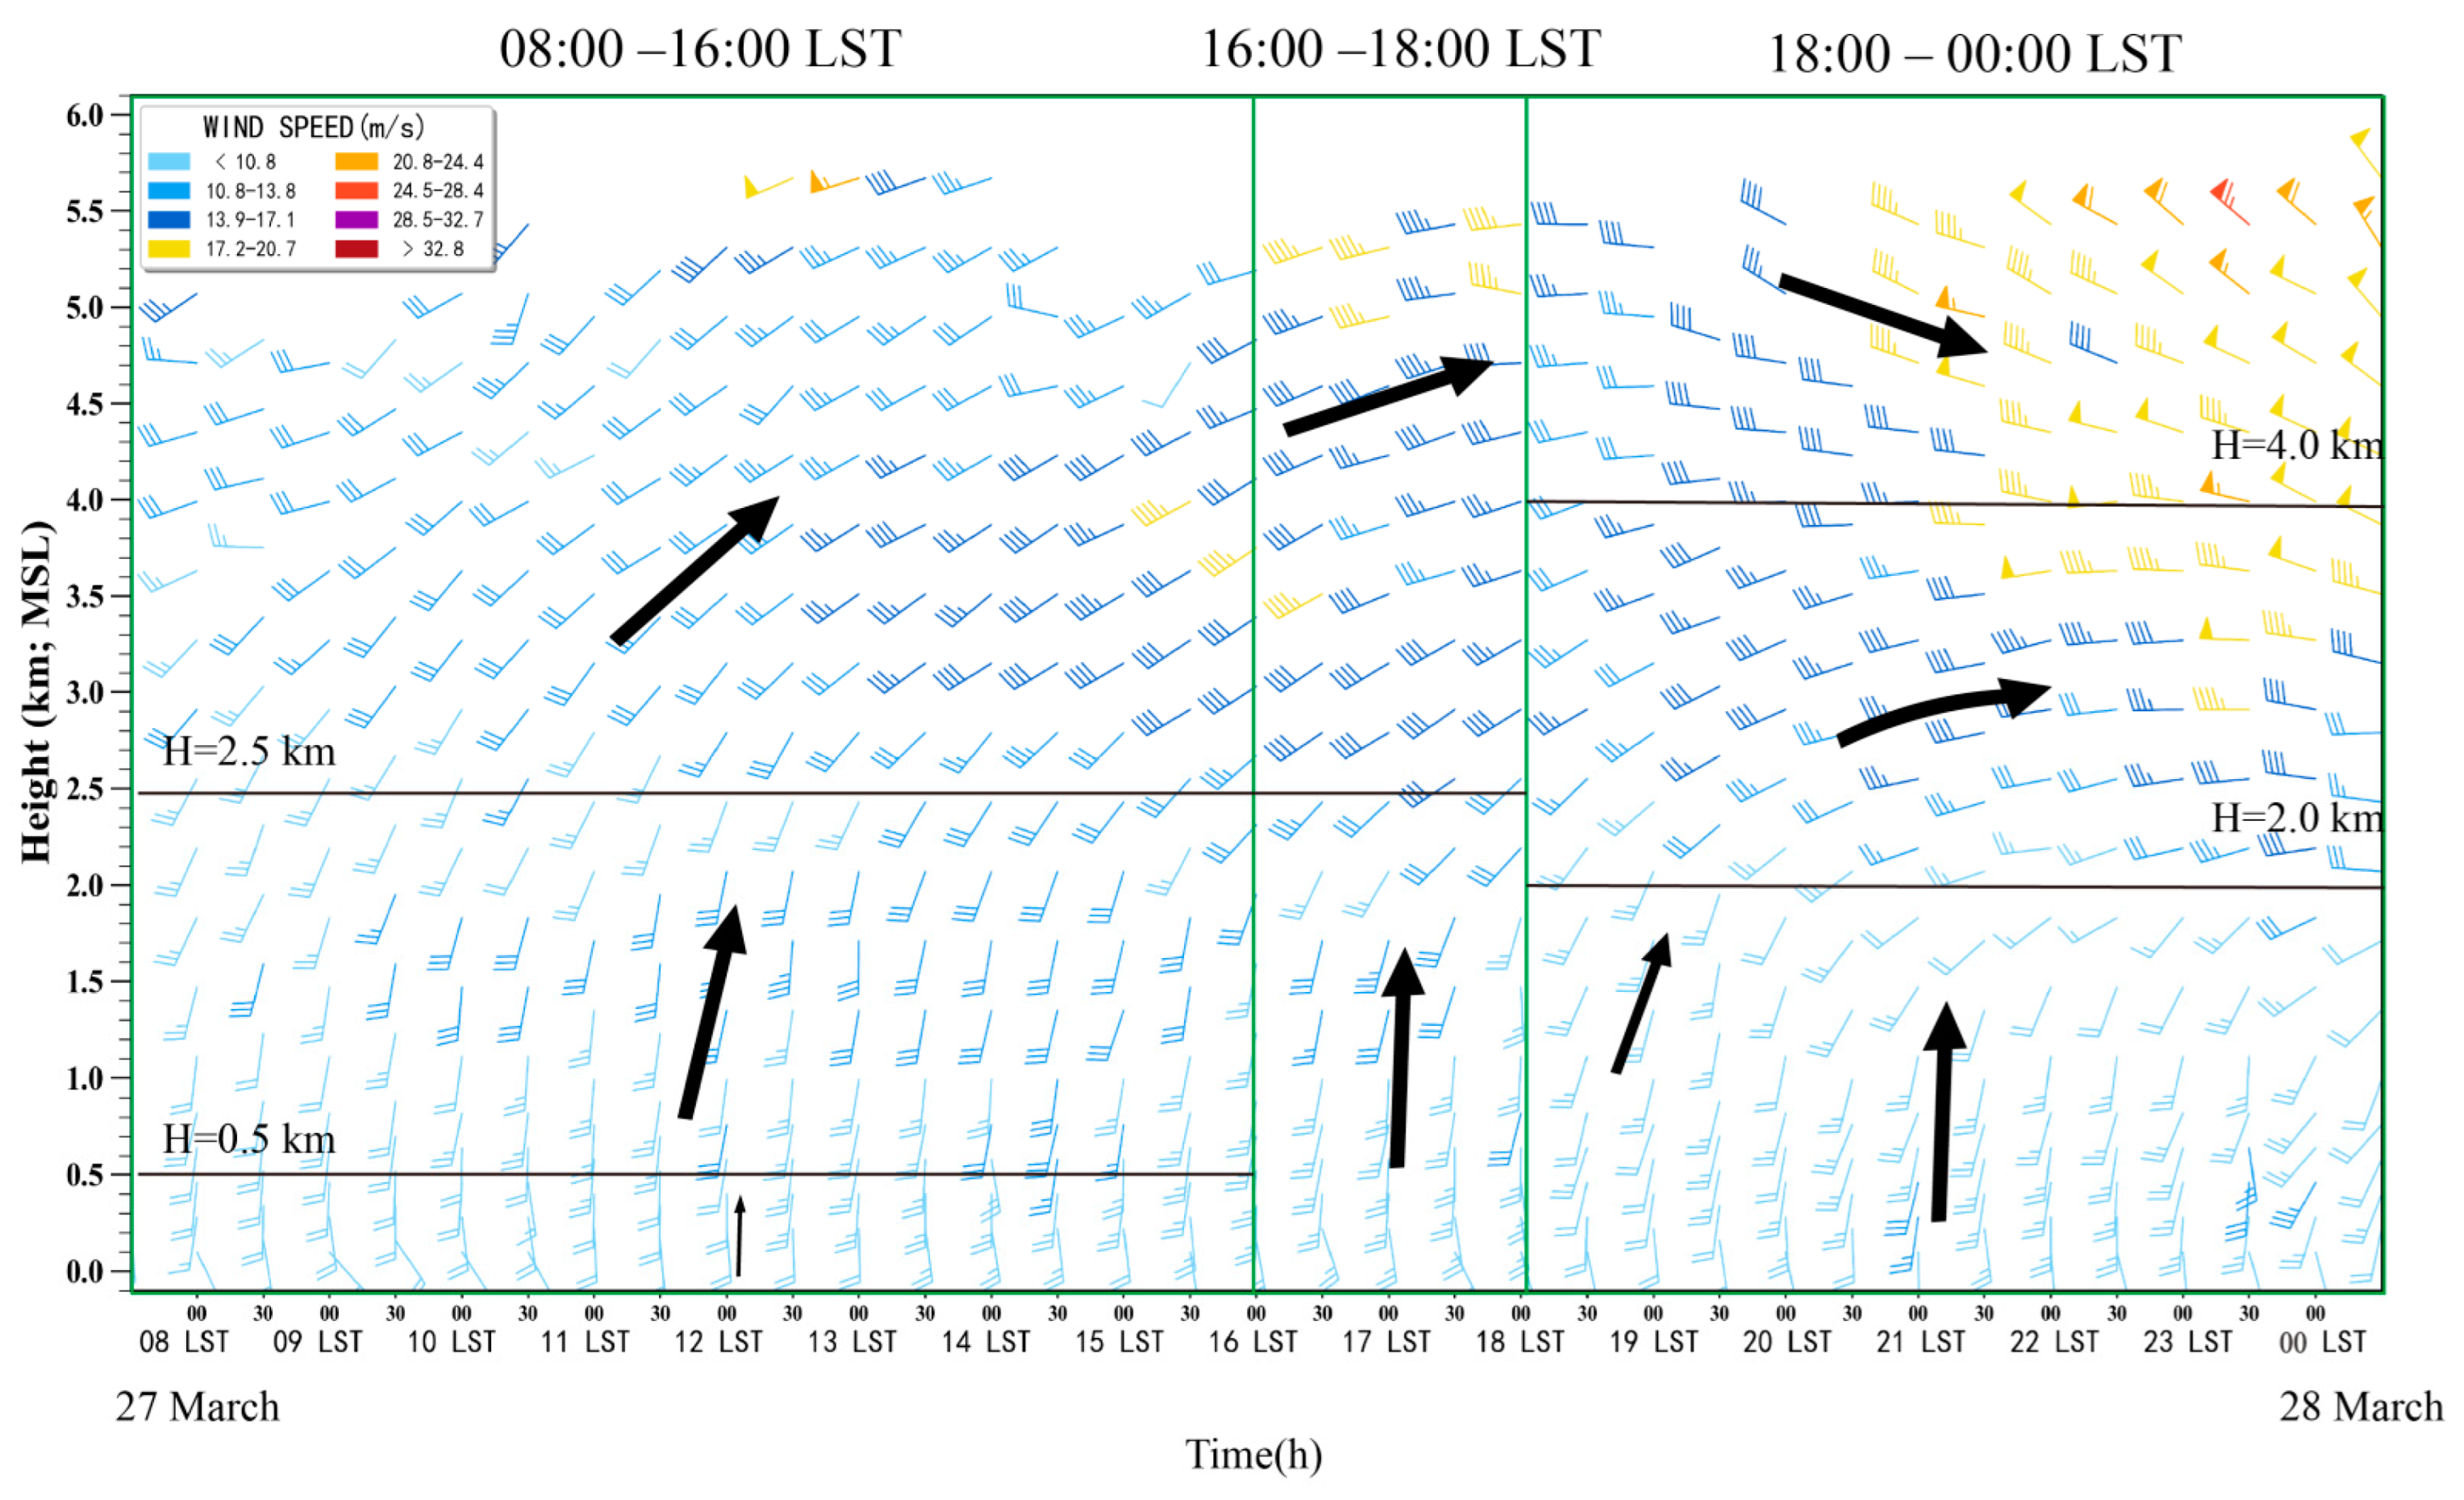
From 08:00 to 16:00 LST on 27th, the wind direction below 6 km did not change significantly. The area within the 0–2.5 km altitude was occupied by southerly winds, with southwesterly winds prevailing at the middle and upper layers. Wind speed displayed an obvious increase from 12:00 to 16:00 LST. The wind speed below 0.5 km was about 10 m∙s1 and was about 12 m∙s−1 at 0.5–2.5 km in height and 14–18 m∙s1 above 2.5 km. The warm, moist southwesterly winds continuously conveyed from the South China Sea to the land, providing favorable thermal conditions for the development of subsequent storms.
(2)
The wind speed of the whole layer did not change much from 16:00 to 18:00 LST on the 27th, but the wind direction at the middle and high layers turned from southwesterly to westerly. This change was related to an eastward-moving short-wave trough, with Yangjiang City being located at the bottom of the trough.
(3)
From 18:00 LST on 27th to 00:00 LST on 28th, the westerly wind above 4 km angled to the northwest, with the wind speed undergoing a significant increase (16–22 m·s−1). At 2.0–4.0 km, the southwest wind changed to a westerly wind, with little change in the wind speed. The wind direction at the lower level did not change much, but the wind speed first decreased and then increased. At this stage, the wind rotated clockwise as it ascended, suggesting obvious warm advection currents conducive to storm development. A northwesterly air flow was dominant at the altitude above 4 km, correlating with the rapid southeastward movement of the storm.
It is noted that the moving path of the storm (Figure 1b) is mainly correlated with the mid-level guided airflow. In addition, the continuous conveyance of southerly winds in the boundary layer was also crucial for the formation and maintenance of the hailstorm supercell.

4.2. Dual-Polarization Radar-Observed Structure of Hailing Stage

This subsection focuses on the dual-polarization fine radar structure of the hailstorm during the hailfall stage (S4: 21:54–23:30 LST). The ZDR column threshold was set as ZDR ≥ 1 dB, and the KDP column threshold was set as KDP ≥ 1°/km [17]. The radar station was continuously located on the south side of the hailstorm during this stage. From the basic reflectivity factor profile (Figure 8a1,a2), it was found that hail during the S4 stage had two strong centers with different heights, with the stronger center being located near the height of the WBZ (marked with C1) and the other weaker one being located at 7 km (marked with C2). The horizontal distance between the two centers was about 5–8 km. The overall structure was strongly inclined, which was obviously different from the vertical structure of a classic hailstorm with only one center. Combining the basic reflectivity factor and the radial velocity profile, it can be seen that the bounded weak echo region (BWER) (Figure 8a1,a2) in the hail during this stage corresponds well to the strong updraft region (Figure 8b1,b2), the area on the left side of the ellipse. Additionally, the center of C1 corresponds to the convergence area of the low-level airflow (Figure 8b1,b2, solid white box).
At 22:06 LST (Figure 8a1,b1,c1,d1,e1), the strong center of C1 (solid white line frame, ZH = 75.5 dBZ) was the strongest during the life cycle, with the ZDR value of the corresponding height being close to 0 dB, a CC between 0.75 and 0.9, and a KDP close to 0°/km. This may have been caused by the differential attenuation behind the ice core (Ryzhkov et al., 2013) [64] or due to giant hail (resonant size hail 5–7 cm diameter), which some authors report (Mirkovic et al., 2021) [65]. The ZH was still strong below 2 km, (50 < ZH < 60 dBZ), and the ZDR was between 1 and 2.5 dB, 0.85 < CC < 0.95, and 1 < KDP < 3°/km, suggesting a mixture of melting hail and ice water. The weak echo (less than 20 dBZ) between 4 and 6 km on the right of the low-level strong center corresponds to a small ZDR (−4–0.2 dB) and a low CC (0.1–0.7), which was consistent with the dual-polarization feature of TBSS. Another strong center area (C2) with a higher height also demonstrated wind speed convergence and ZDR values of mostly 0 dB. Below the 0 dB layer was a strong ZDR column (the maximum value of ZDR was close to 5 dB), which was different fromC1. The CC value of C2 was slightly larger (0 9 < CC < 0.95), indicating that there was a large number of supercooled raindrops lifted to the upper layer by the strong updraft near C2 in addition to the large hail particles.
The center of C1 dropped to about 2 km at 23:00 LST (Figure 8a2). The ZDR in its vicinity was between −1 and 2 dB (Figure 8c2, solid black frame), with 0.95 ≥ CC > 0.85 (Figure 8d2, black solid frame) and a very large KDP (Figure 8e2, solid black frame). However, due to the limited observation equipment and manual observations at night, no real-time hail information was collected during this period. The height and area of the ZDR column at 23:00 LST (black dotted frame in Figure 8c2) was stronger than that at 22:06 LST, corresponding to the updraft region (Figure 8b2). At this time, even though there were low-level convergences and high-level divergences (Figure 8b2) and a strong updraft, the reflectivity and velocity were smaller than those in the previous period. This likely resulted from the release of near-ground energy, which led to a weaker hailstorm.
In order to reduce the influence of ground clutter and the melting layer, this paper selects radar data with an elevation angle of 1.5° in the range of 20–100 km during hailstorms and variations of ZDR, CC, and ZH in the hailstorm stage (Figure 9), as shown in Figure 9. When ZH ≥ 58 dBZ, the ZDR rapidly drops to around 0 dB as ZH increases, and the CC also drops rapidly to below 0.9, which is representative of the dual-polarization characteristics of hail.
In general, the storm structure during the hailfall stage was strongly inclined, and the dual-polarization characteristics of the hail were obvious, which also shows that the dual-polarization parameter profile characteristics can better reflect the microphysical differences in hailstorm supercells.

4.3. The Evolution of ZDR Column and KDP Column

As shown by Figure 10, the ZDR column height at the S1 stage was mostly between 7 and 8 km, close to the −20 °C layer height (7.99 km), and the long-lasting high ZDR column is conducive to the convection development. The CC generally showed a decreasing trend during the S2–S4 stages. A CC valley appeared during the S4 stage, while both the ZDR column and the KDP column continued to rise to their highest points. Raindrops were lifted into the supercooled area to form large hailstones. During the S5 stage, the height of the ZDR column and KDP column decreased rapidly, with the CC increasing to more than 0.95. The updraft weakened during this stage, which was not conducive to the lifting of water droplets to form hail.
However, even though the ZDR column can reflect changes in the strength of the updraft, it cannot directly represent the actual dynamic field information. As such, it cannot fully explain the cause of the inclined structure. In Section 5, the actual dynamic field is analyzed in detail with the help of high-resolution reanalysis.

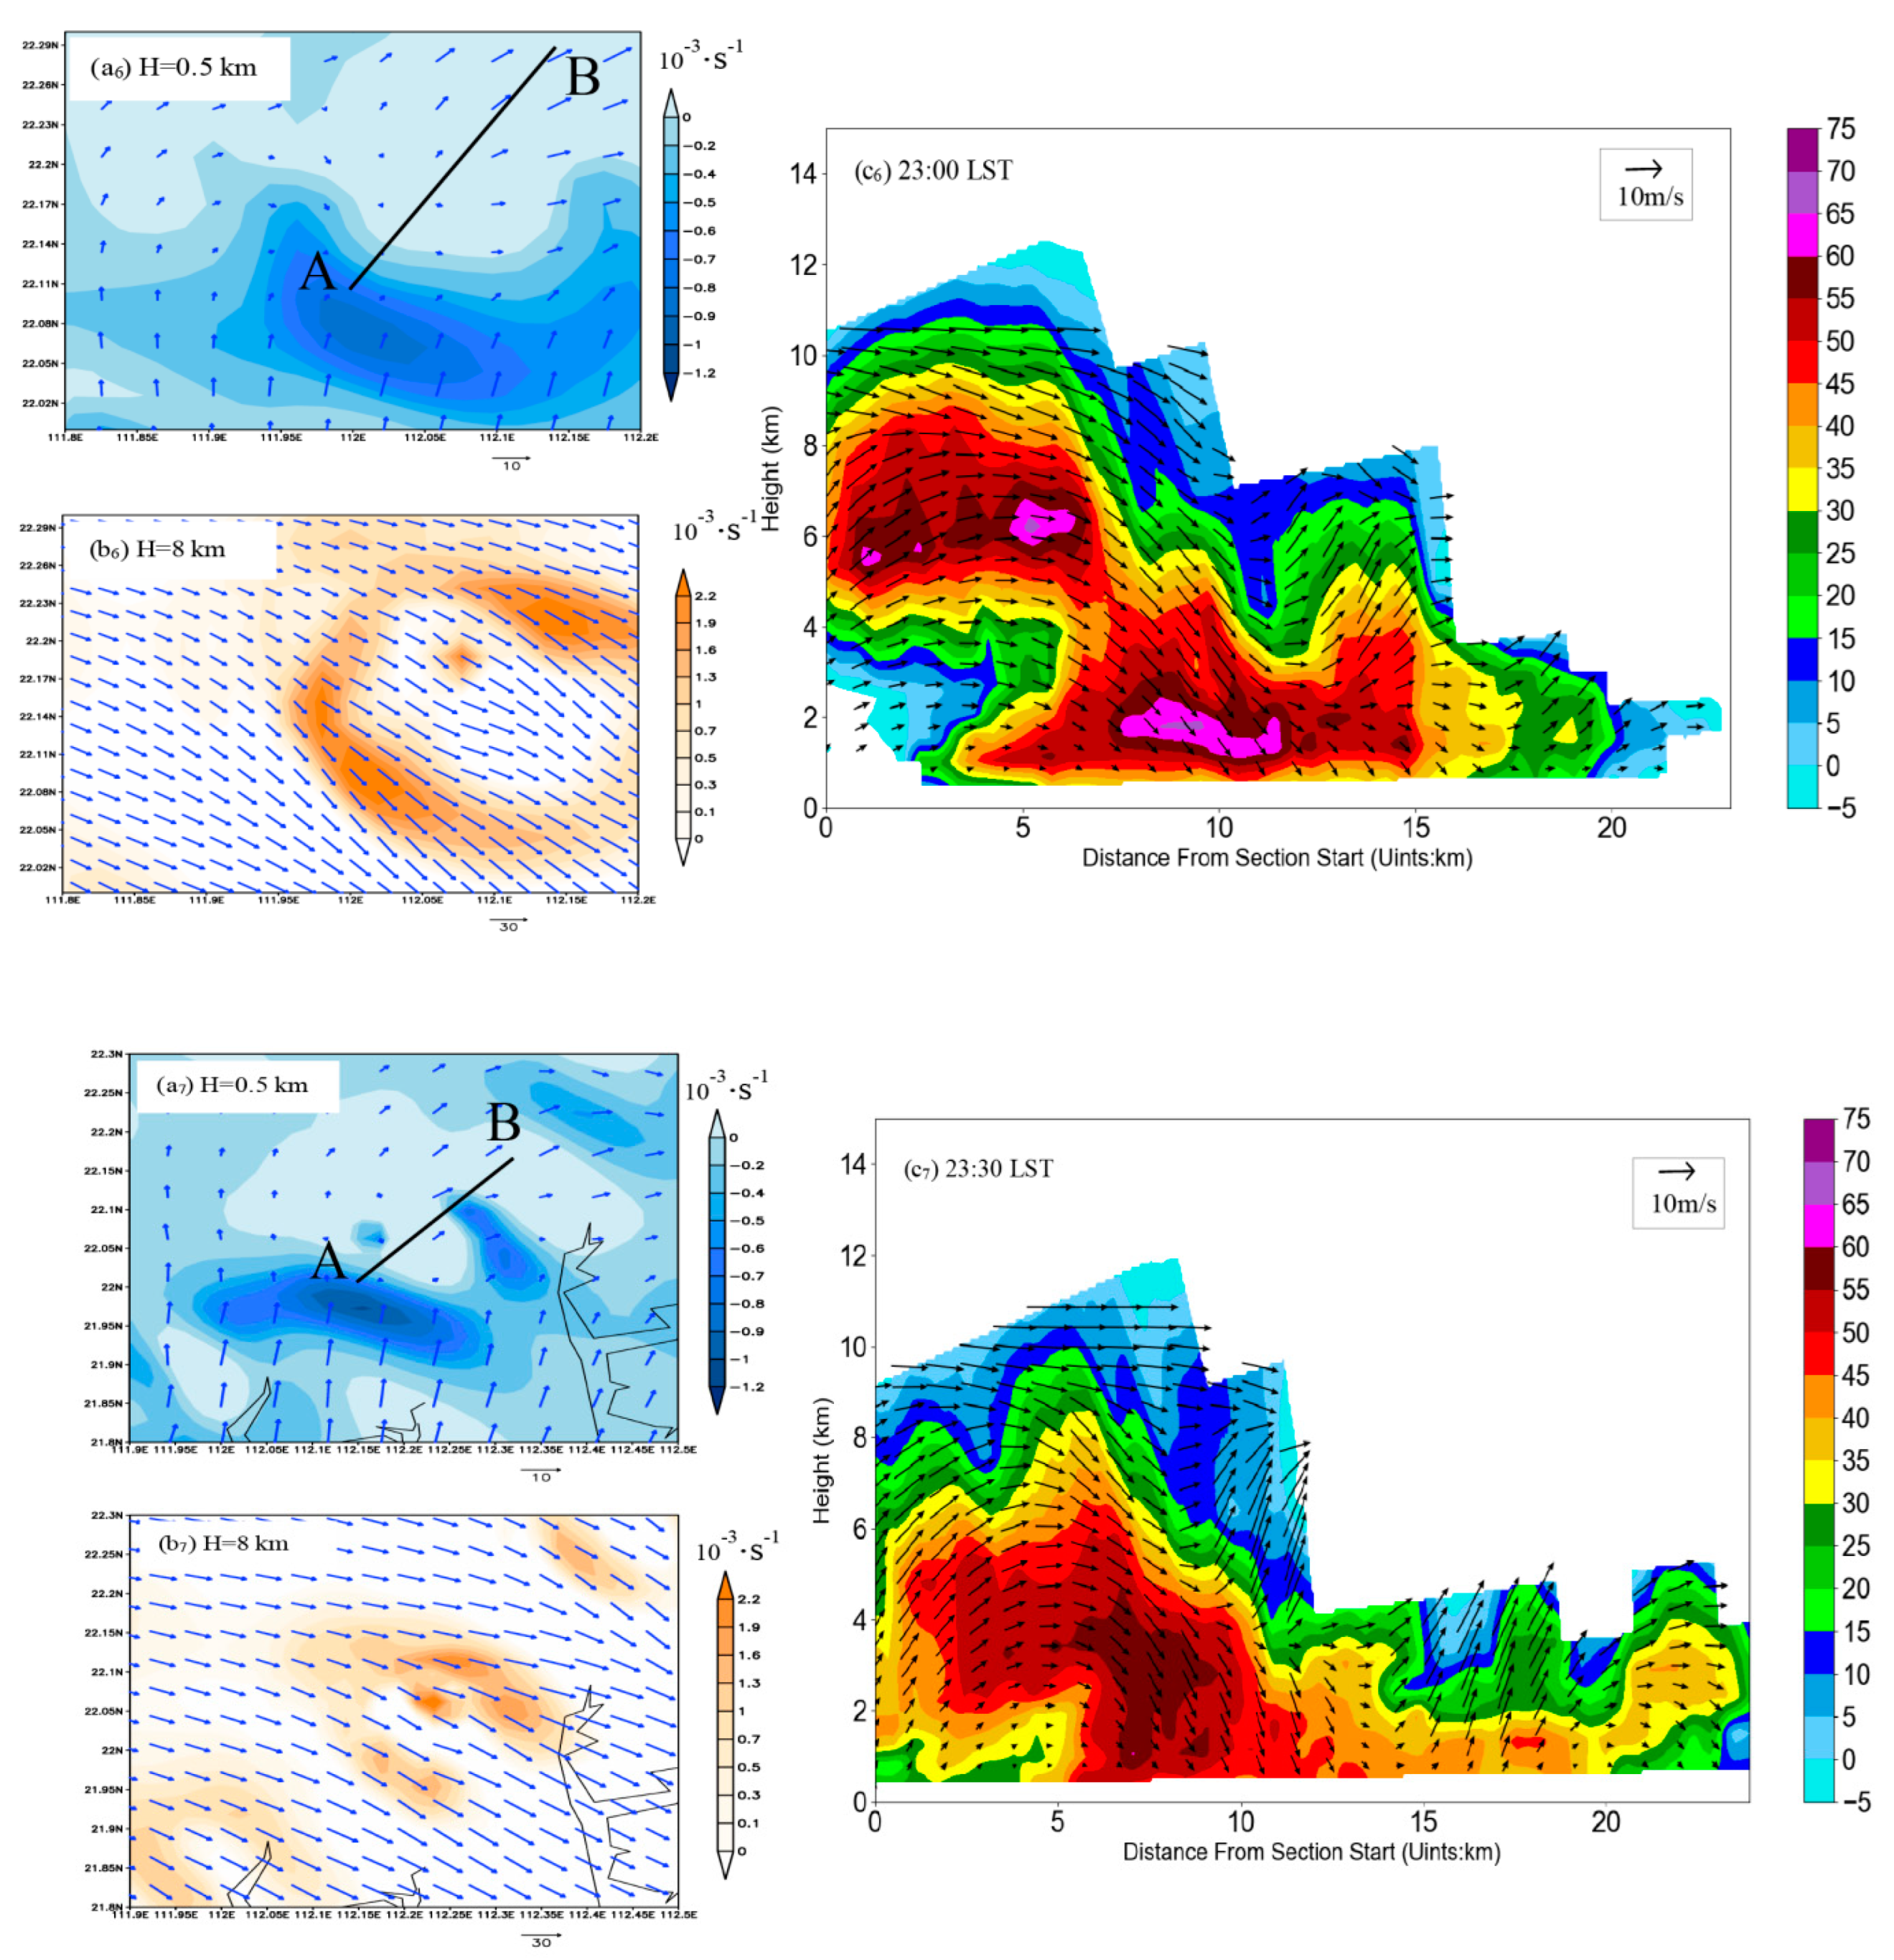
5. Kinetic Properties Structure of the Inclined Hailstorm

The distributions of particles with different phases and dynamical processes for the formation of this hailstorm’s inclined structure are further discussed in this section based on VDRAS reanalysis and the HCA results.
As mentioned above, the inclined structure of this hailstorm appeared at around 21:54 LST on 27 March. The storm only had one strong center (C1 at the S4 stage) before the appearance of the inclined structure (S1–S3). This can be seen in the change from a constant southwest airflow to westward and southerly air flows(Figure 11a1,a2, at 20:36–21:30 LST). At the same time, the divergence (div)value on the southwest side of C1 also changed from −0.2 to −0.5 × 10⁻³∙s−1 as the convergence became stronger. Anticyclonic divergence was found on the west side of C1 at 8 km, with enhanced divergence (Figure 11b1,b2, at 20:36–21:30 LST). Additionally, updrafts occupied the 0–8 km layer in front of the strong center, with a maximum value of about 8 m·s−1 (Figure 11c1,c2 at 20:36–21:30 LST).
During the early stage of the appearance of the inclined structure (Figure 11a3,b3 at 21:54 LST), the low-level convergence (0.5 km, the value of div was −0.7 × 10⁻³∙s−1) and high-level divergence (8 km, the maximum value of div was 1.9 × 10⁻³∙s−1) were significantly enhanced, but the wind speed at 0.5 km increased significantly to 20 m∙s−1. The wind speed at 8 km did not change. There was a relatively deep updraft near the BWER at the front of the hailstorm, with a maximum speed of −15 m·s−1 (Figure 11c3, at 21:54 LST). The updraft climbed to 8 km AGL and then turned into an inclined downdraft. The two reflectivity cores (C1 and C2) exceeded 60 dBZ at this time, and the horizontal distance was about 5 km. Graupel and a mixture of hail and rain were found above 6 km near the northern periphery of the updraft. A mixture of rain and hail fell to the ground to the north of the downdraft region (Figure 12a). Subsequently, the strength and vertical extension height of the updraft and the two reflectivity cores fluctuated significantly.
The div at 0.5 km decreased to 0.7 × 10⁻³∙s−1 from 22:00 to 22:24 LST; the divergence at 8 km increased to 2.2 × 10⁻³∙s−1. At the same time, the airflow rise of the BWER at the front of the hailstorm decreased slightly, with the vertical extension falling to 2 km AGL. The downdraft between the two cores continued, but the wind speed decreased slightly. The reflectivity center of C2 intensified at this time, with the height decreasing to 6 km AGL. The height of C1 did not change much but had a greater intensity than that of C2, with the horizontal distance between the two cores being maintained at about 5 km. A mixture of hail and rain became more dominant in these levels, with heavy rain appearing below the mixture, which can be partly attributed to the melting of the hail (Figure 12b).
The div at 0.5 km dropped to −1.2 × 10⁻³∙s−1 from 22:30 to 22:36 LST (Figure 11a5,b5,c5, part of the Figure that was omitted, at 22:36 LST), showing the strengthening of the convergence enhancement in the lower layers; however, the div at 8 km remained unchanged. The updraft increased significantly at this time, with the vertical extension height increasing to 6 km AGL; the downdraft between the two reflectivity cores remained while the wind speed once again increased; the two reflectivity cores decreased, but the ZH of the C2 increased slightly. The height of C1 still did not change much, but was stronger than that of the higher levels, and the horizontal distance between the two reflectivity cores increased slightly (6 km). The hydrometeor classification results show that the mixture of hail and rain fell lower, and more hail tended to reach the ground at 22:36 LST (Figure 12c).
The divergence at 0.5 km and 8 km did not change much from 22:42 to 23:00 LST (Figure 11a6,b6,c6, part of the Figure that was omitted, shows 23:00 LST), but the wind speed decreased slightly. The updrafts from the storm front gradually weakened, but C2 had a higher ZH than C1. The downdraft was characterized by continuous intensification. The C2 cores experienced a resurgence during this time, even as C1 weakened and the horizontal distance between the two cores increased to 8 km, thus making this the strongest inclination. The mixture of rain and hail particles between C1 and C2 was less in number at this time (Figure 12d,e, which show from 22:24 to 23:00 LST).
From 23:06 to 23:30 LST (Figure 11a7,b7,c7, part of the Figure that was omitted, shows 23:30 LST), the div was weakened at the 8 km altitude, and the convergence at 0.5 km was slightly weakened, but the divergence was still −1 × 10⁻³∙s−1. The updraft intensity (height) was also significantly weakened (lowered). The downdraft turned to an updraft at 6 km AGL. The two reflectivity cores decreased at the same time. The higher-level reflectivity core first dropped to below 60 dBZ, with the height dropping to 4 km AGL. The lower reflectivity core dropped to 2 km AGL. The horizontal distance between the two height centers also decreased to below 5 km, with the inclined structure weakening and ultimately disappearing. Less of the hail and rain mixture appeared in the lower levels (Figure 12f, which shows 23:30 LST).
In conclusion, the inclined structure of the hail storm is closely related to the air flow inside it. When the updraft was strong from 19:00 to 22:36 LST, the reflectivity core at the upper layer was lifted to a higher level. The intensified downdraft on the right side caused the strong reflectivity factor center to be transmitted obliquely downward so that the strength of the reflectivity core at the lower layer was maintained. The updraft and downdraft then weakened, with the inclined structure also weakening and disappearing.

6. Discussions and Conclusions

A hailstorm characterized by its strongly inclined structure hit the west coast of southern China (Yangjiang City) at 21:54–23:30 LST on 27 March 2020. This study combines Doppler radar assimilation (VDRAS) and an improved HCA to examine the detail evolution characteristics of the inclined structure of the hail based on multi-source observations and reanalysis data. The main results are as follows:
(1)
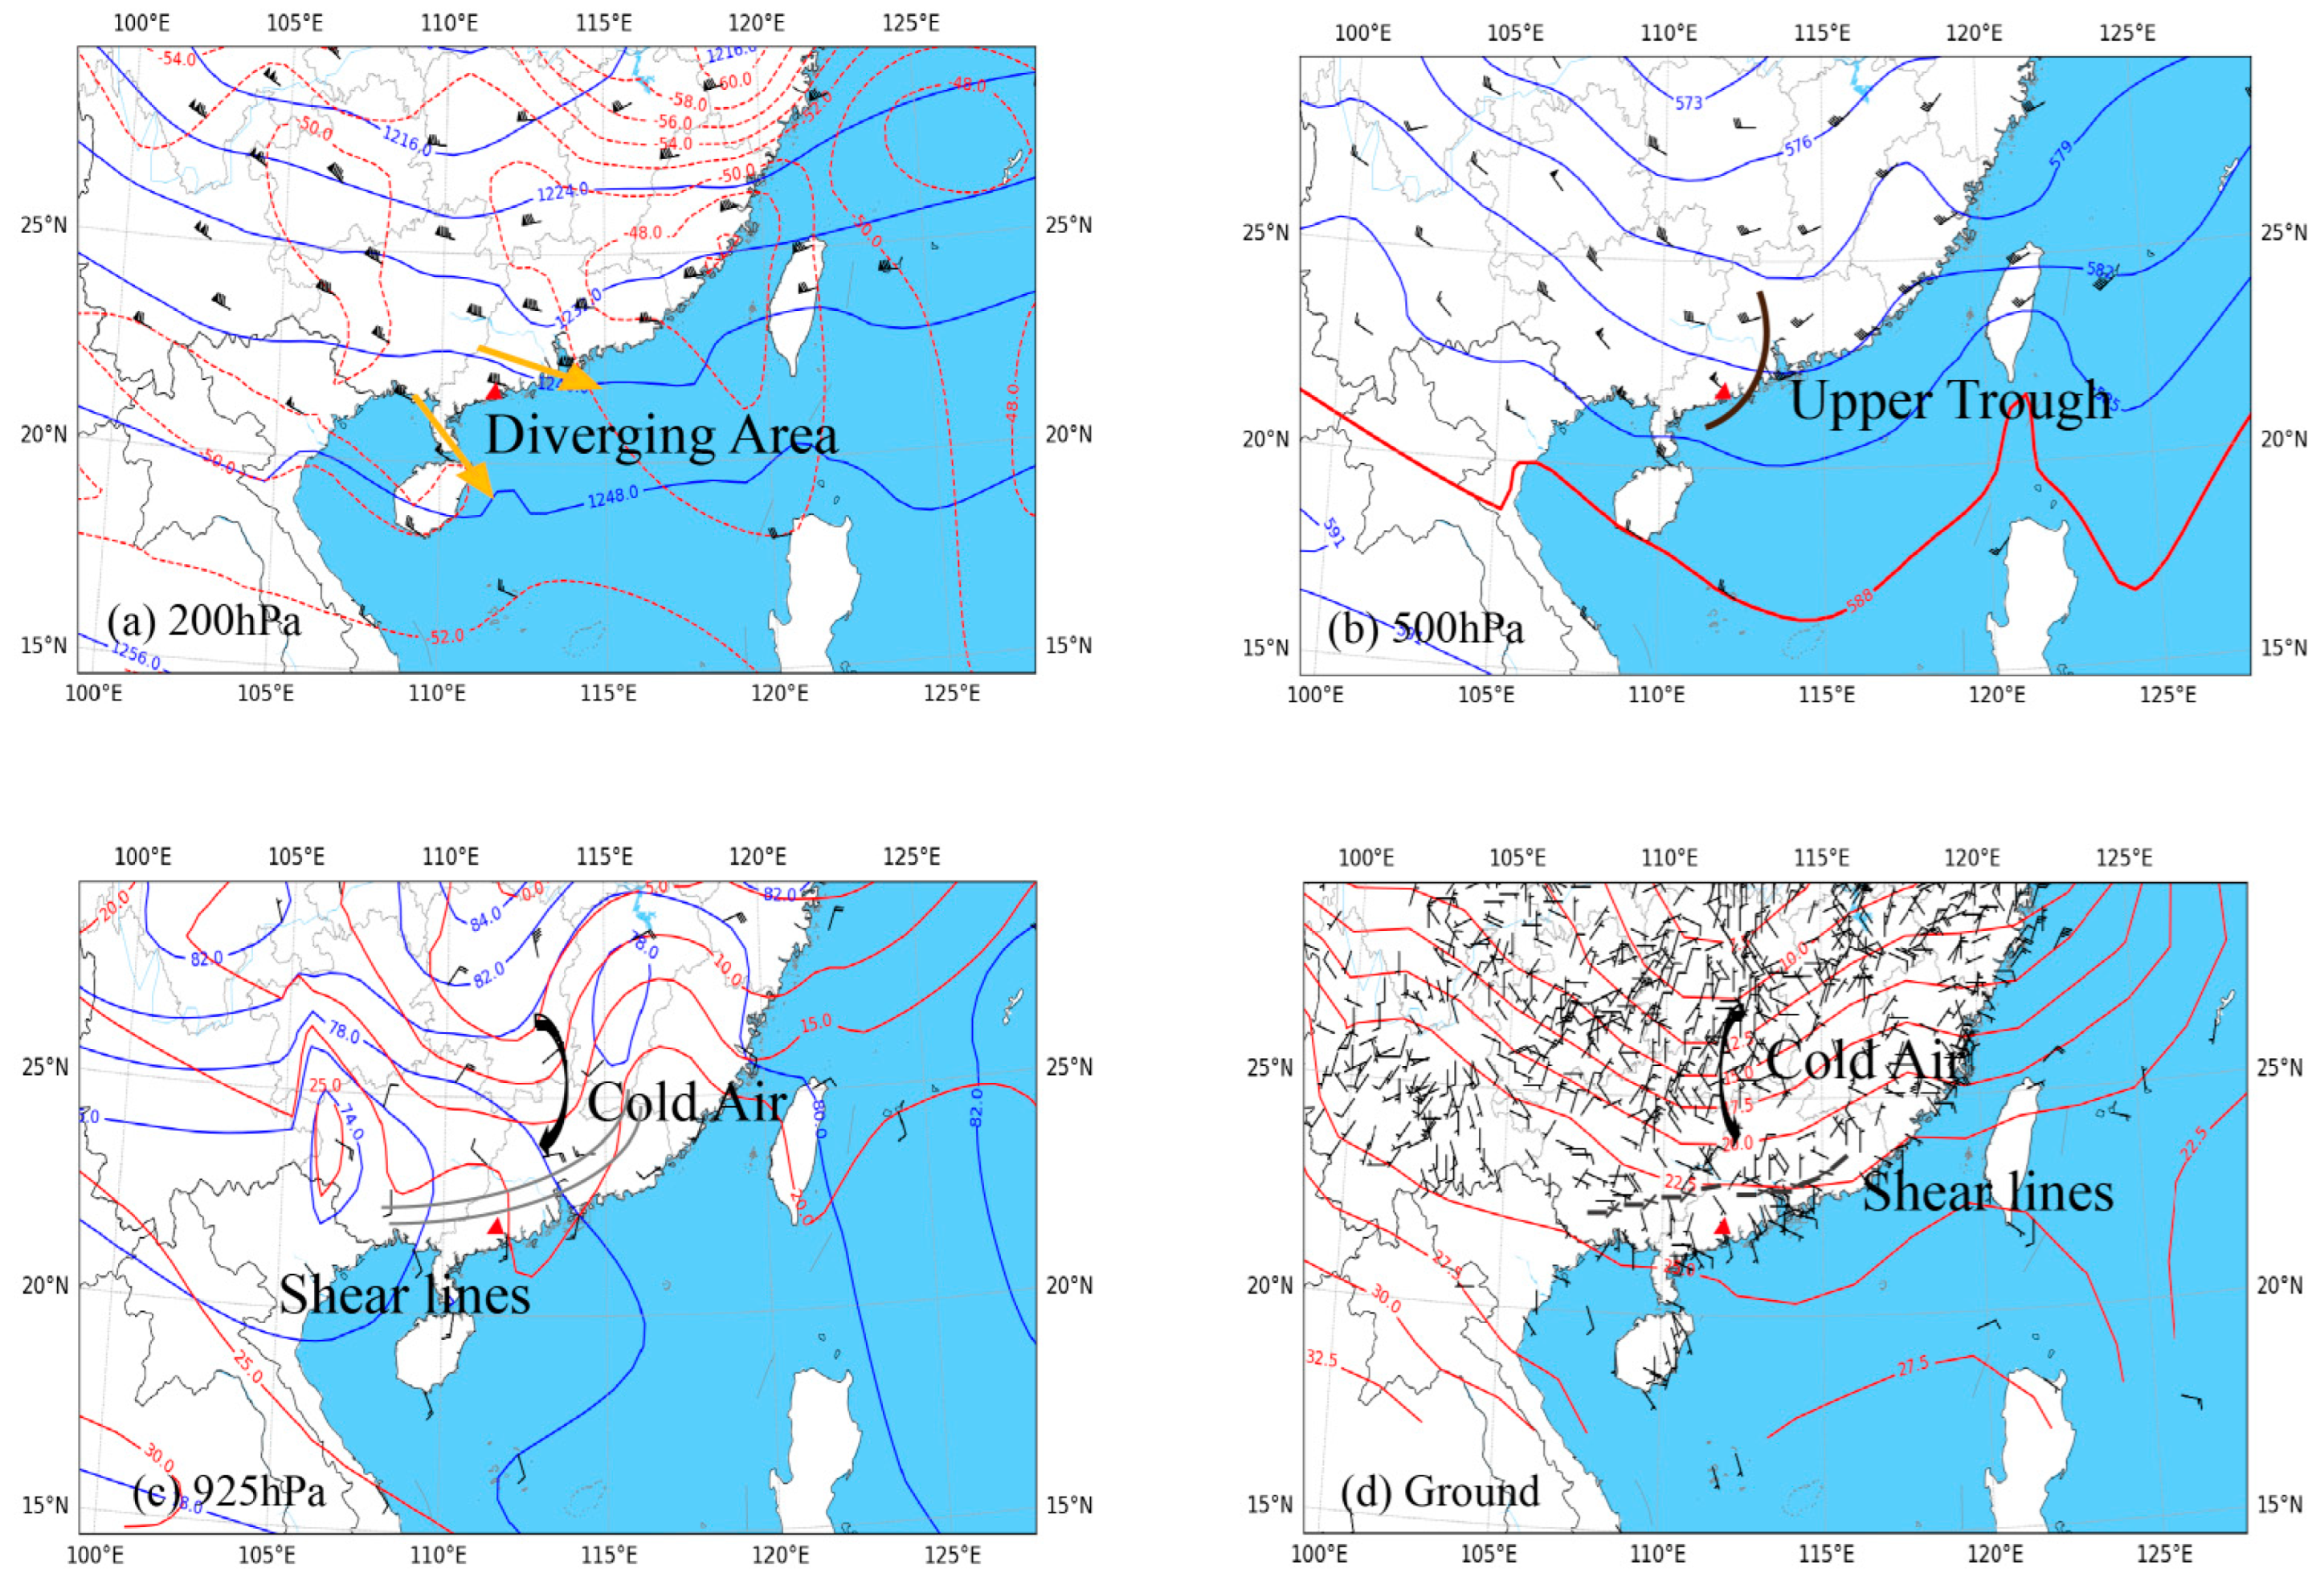
This event occurred in the overlapping area of the 200 hPa distributary area and lower-level shear line. The upper-level divergence and lower-level convergence provided favorable dynamic uplifts. Under this unstable stratification, the CIN decreased to 0 J/kg, the CAPE increased to 1183.30 J·kg−1, and the SI index was −1.15 °C at 20:00 LST. The heights of the wet bulb zero (WBZ) and −20 °C were 3.922 and 7.997 km, respectively. The wind vector difference of 0–6 km increased from 16 m∙s−1 to 26.6 m∙s−1. All environmental physical quantities were conducive to the occurrence of severe convective weather.
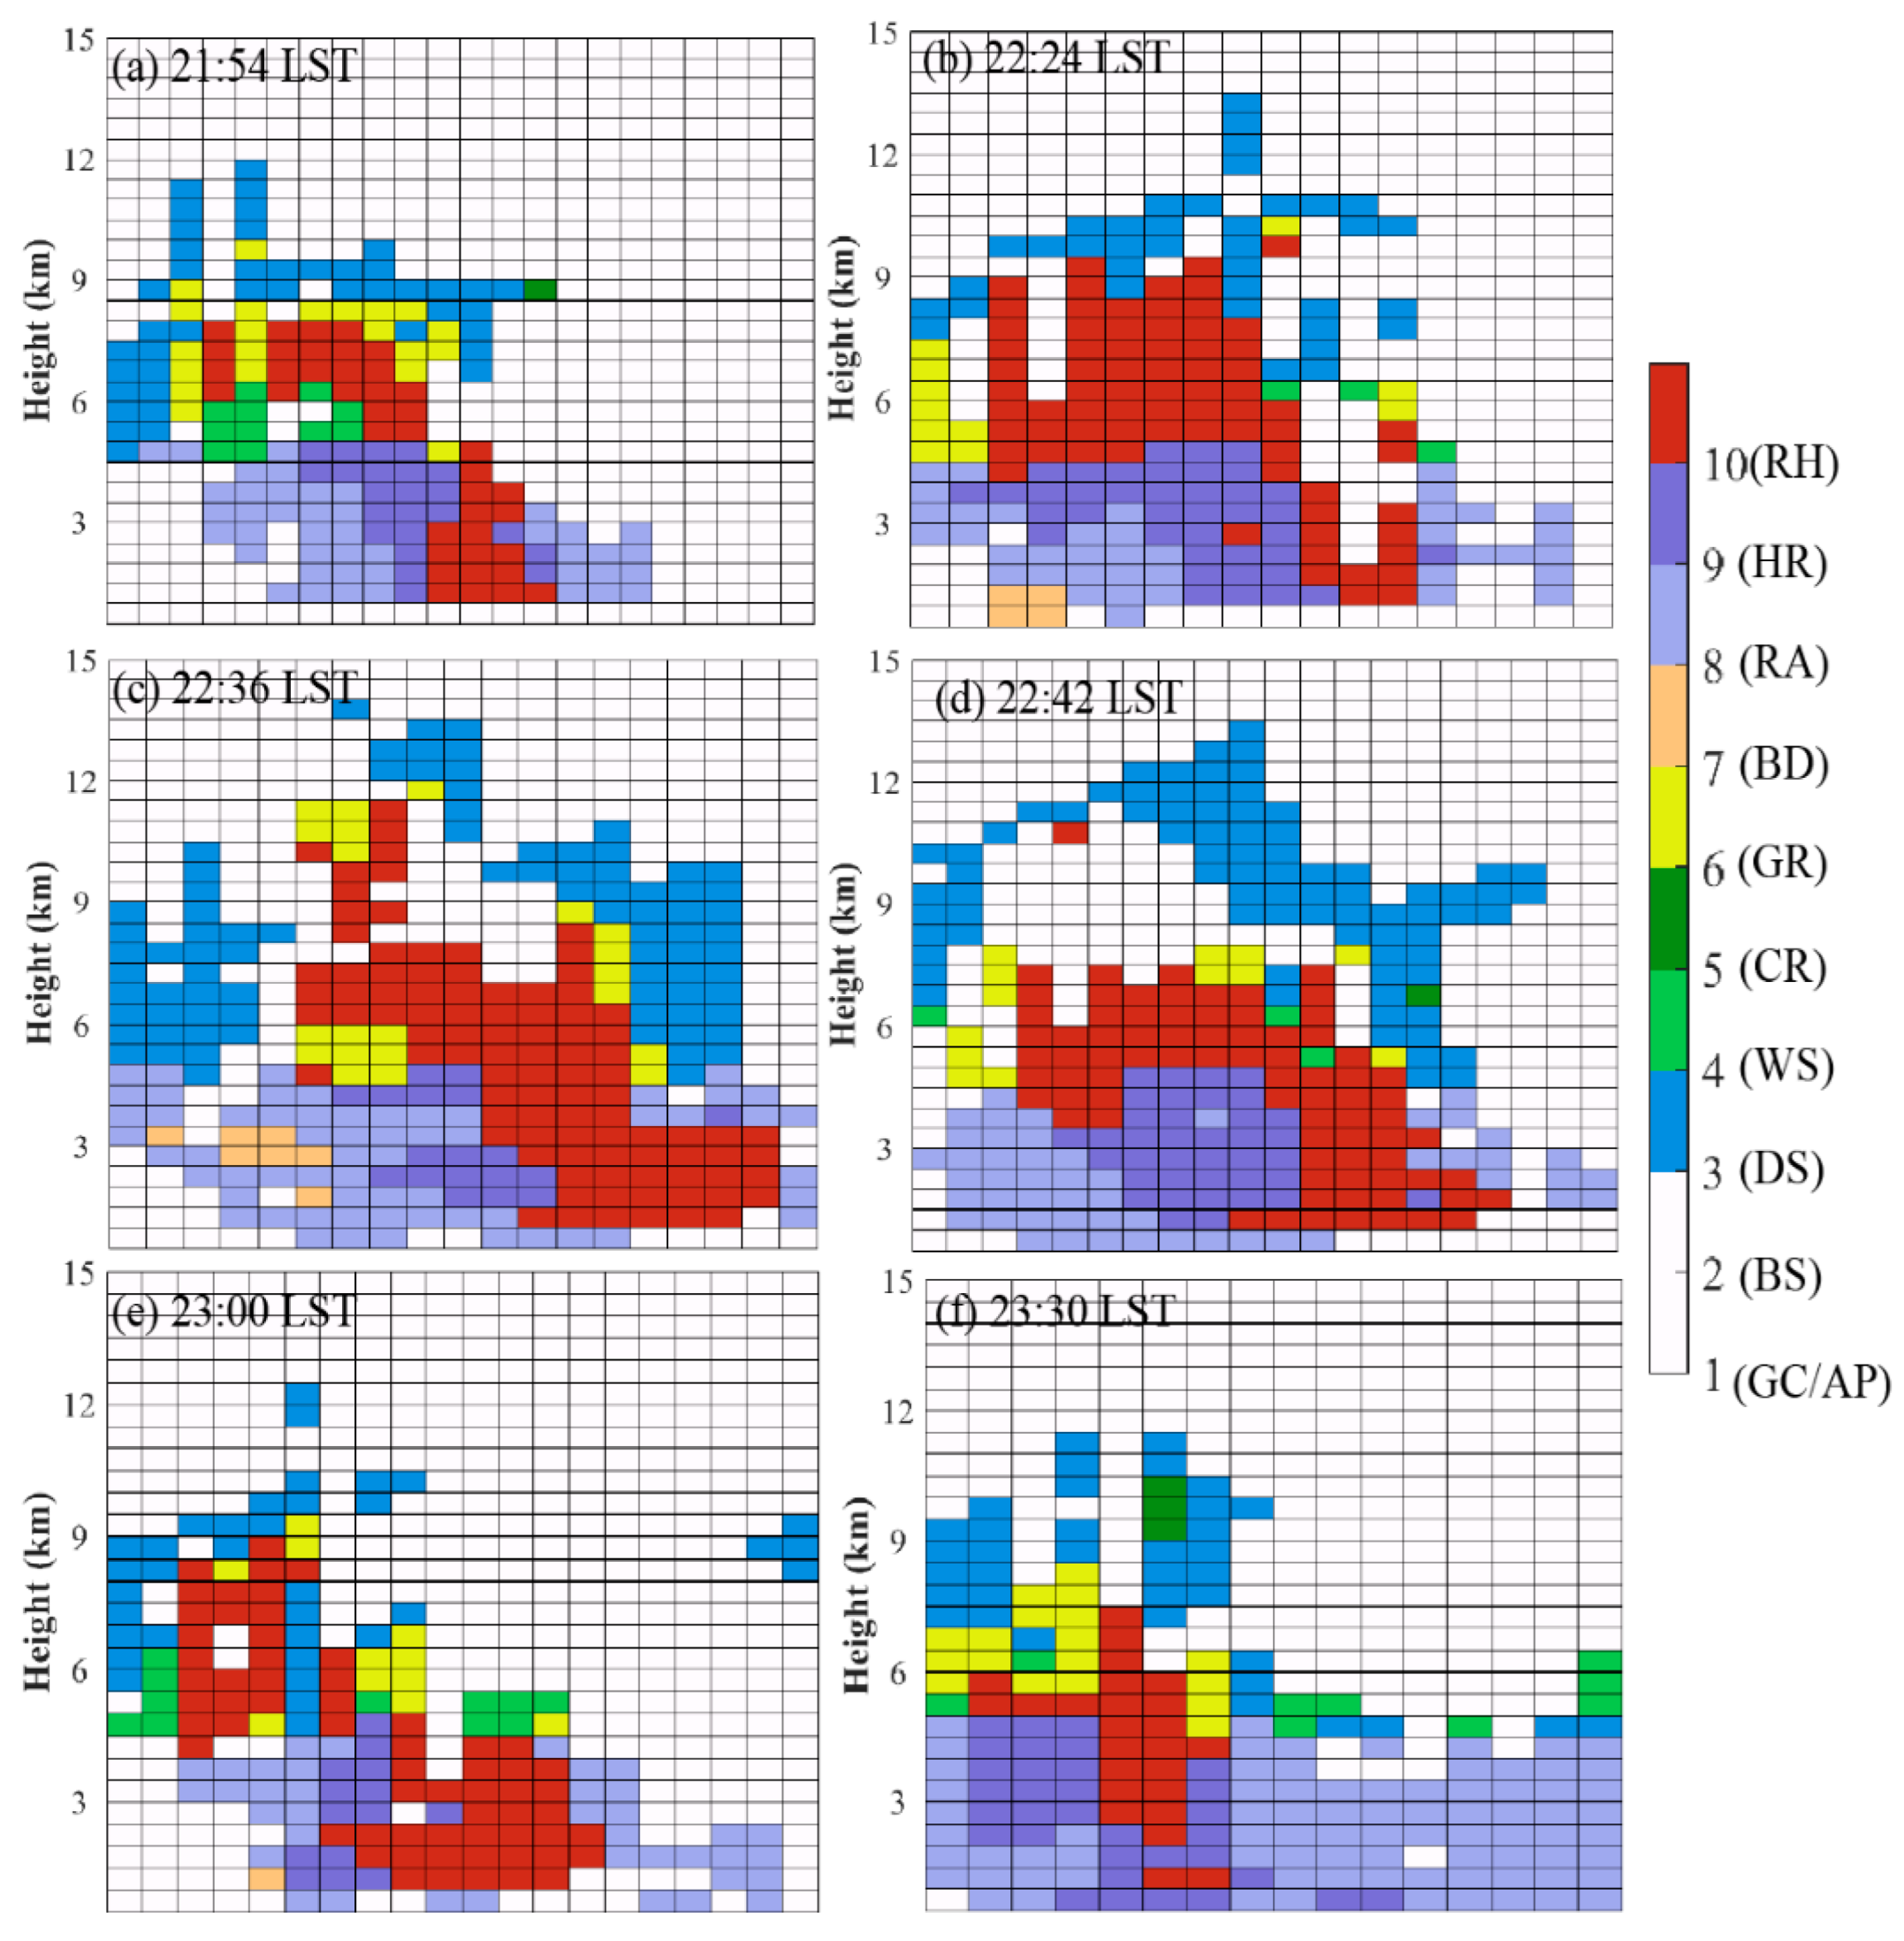
(2)
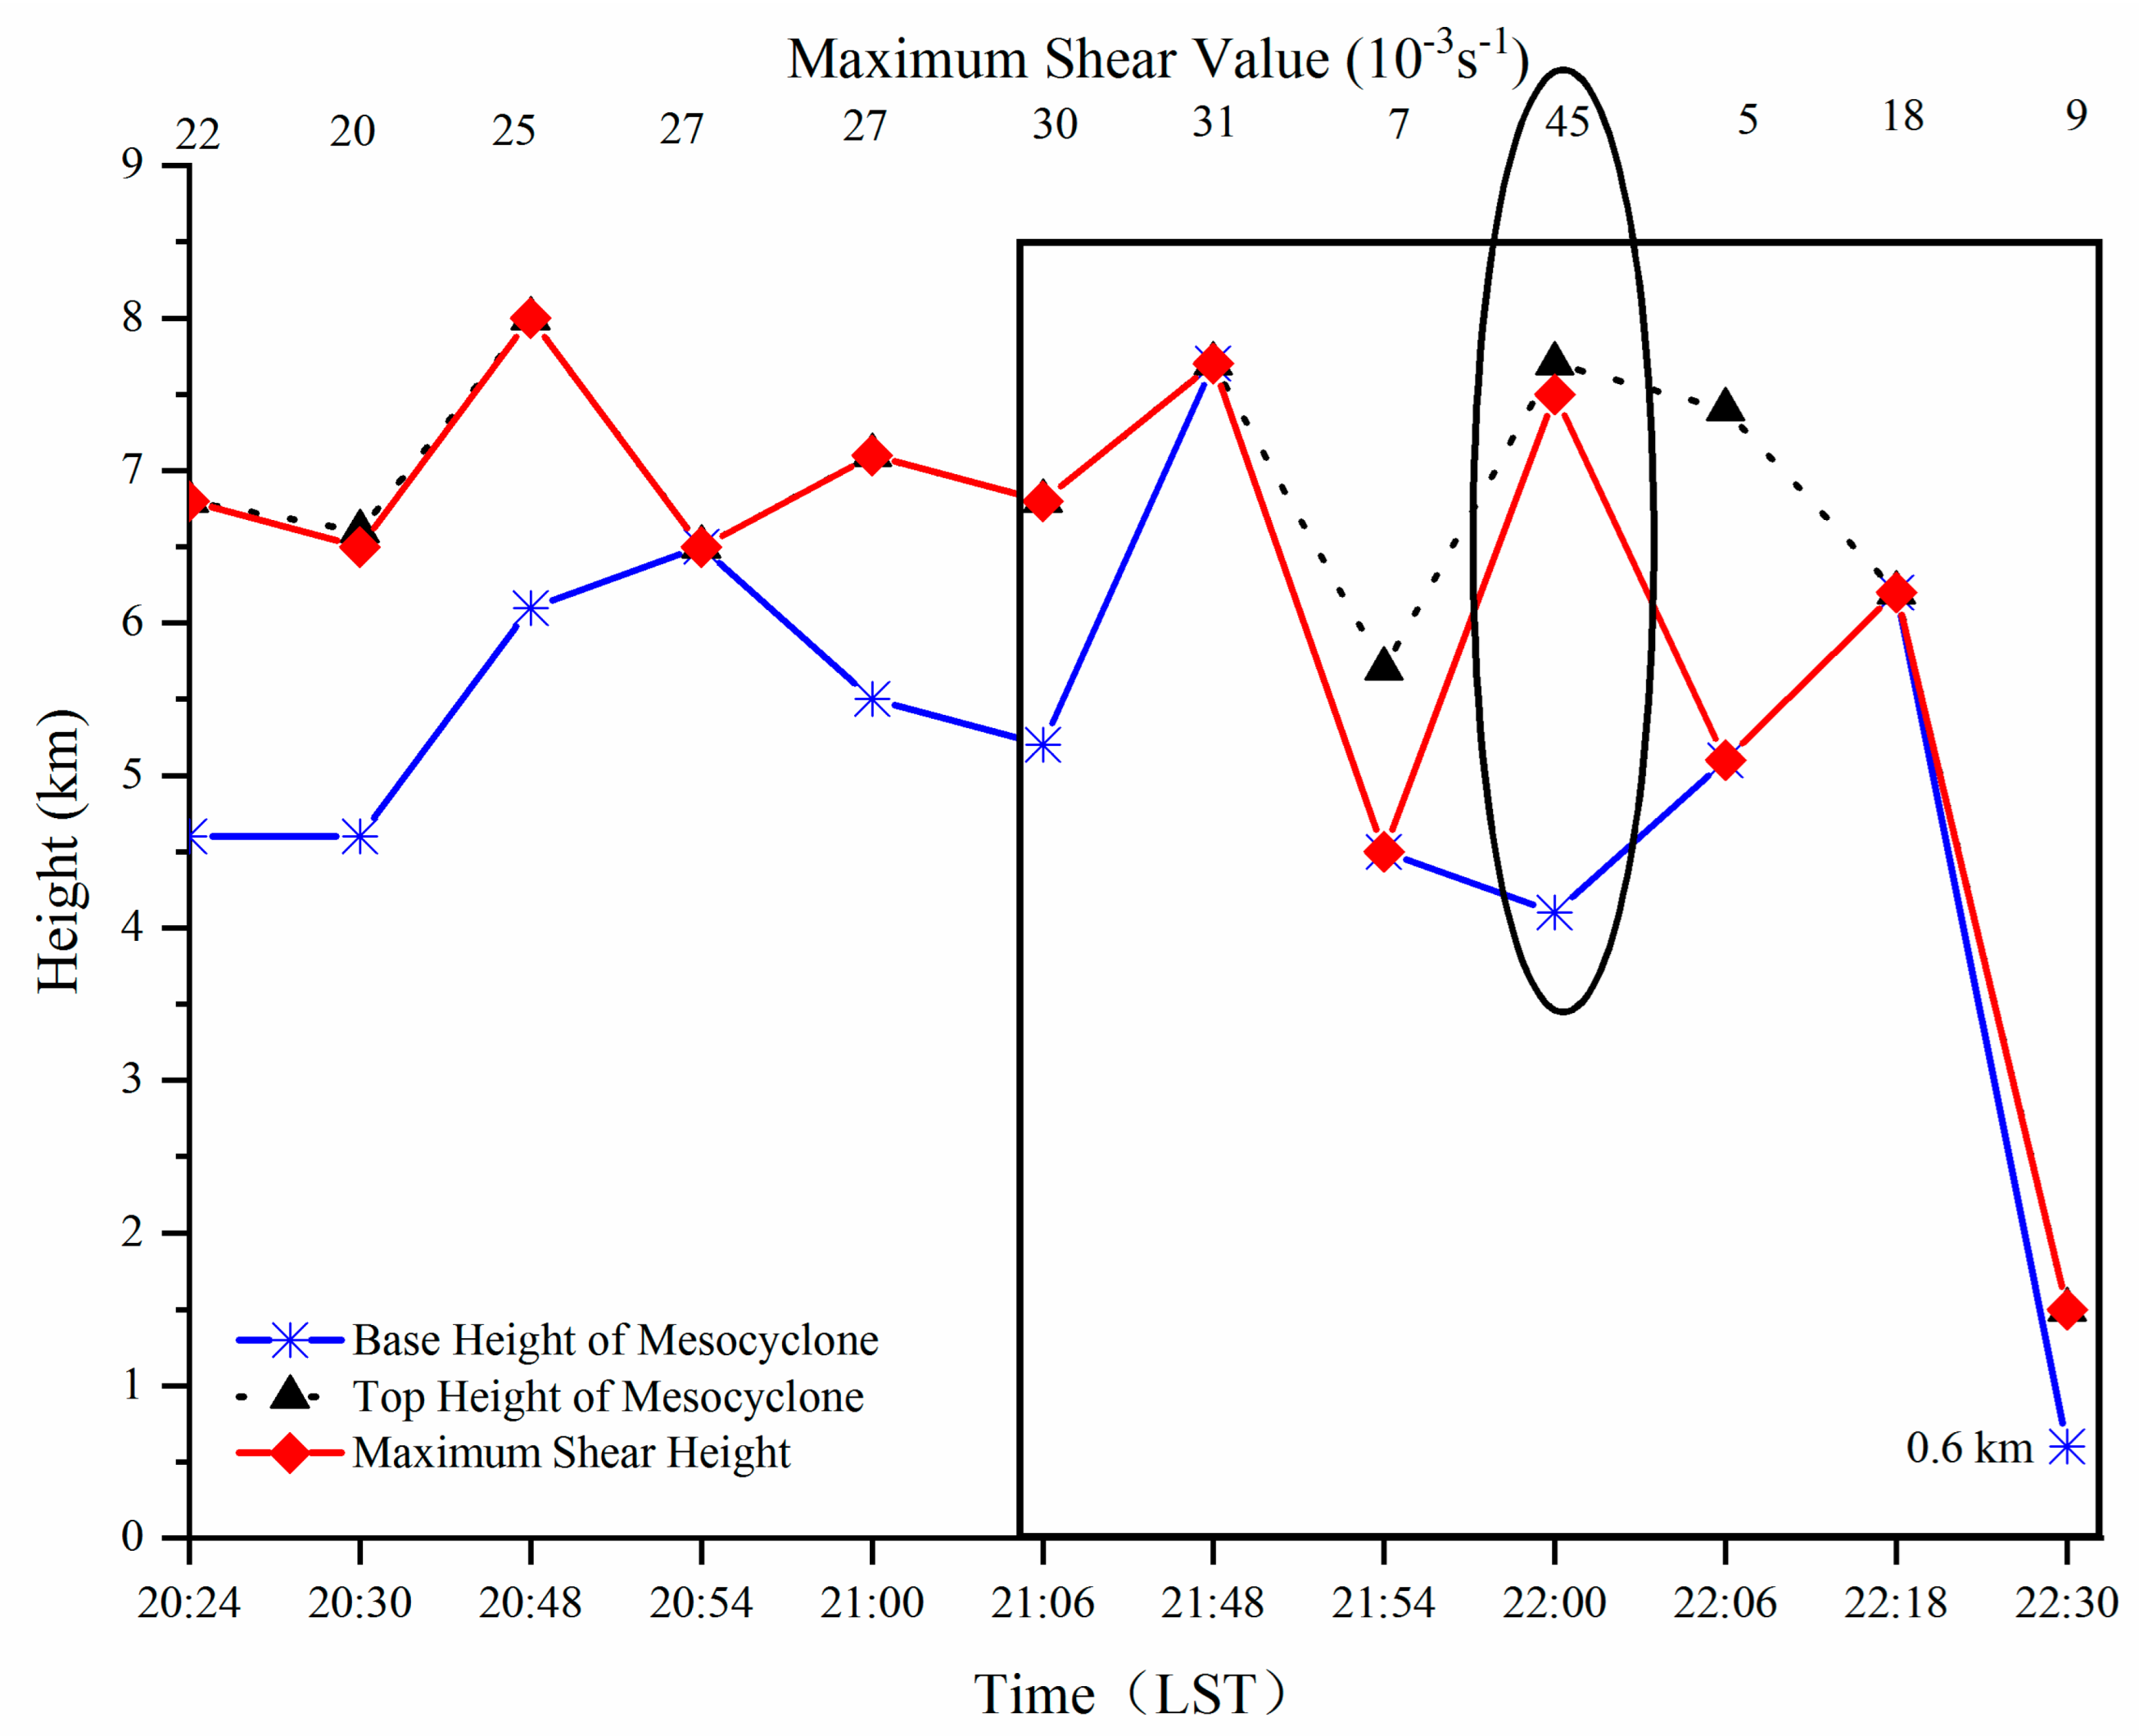
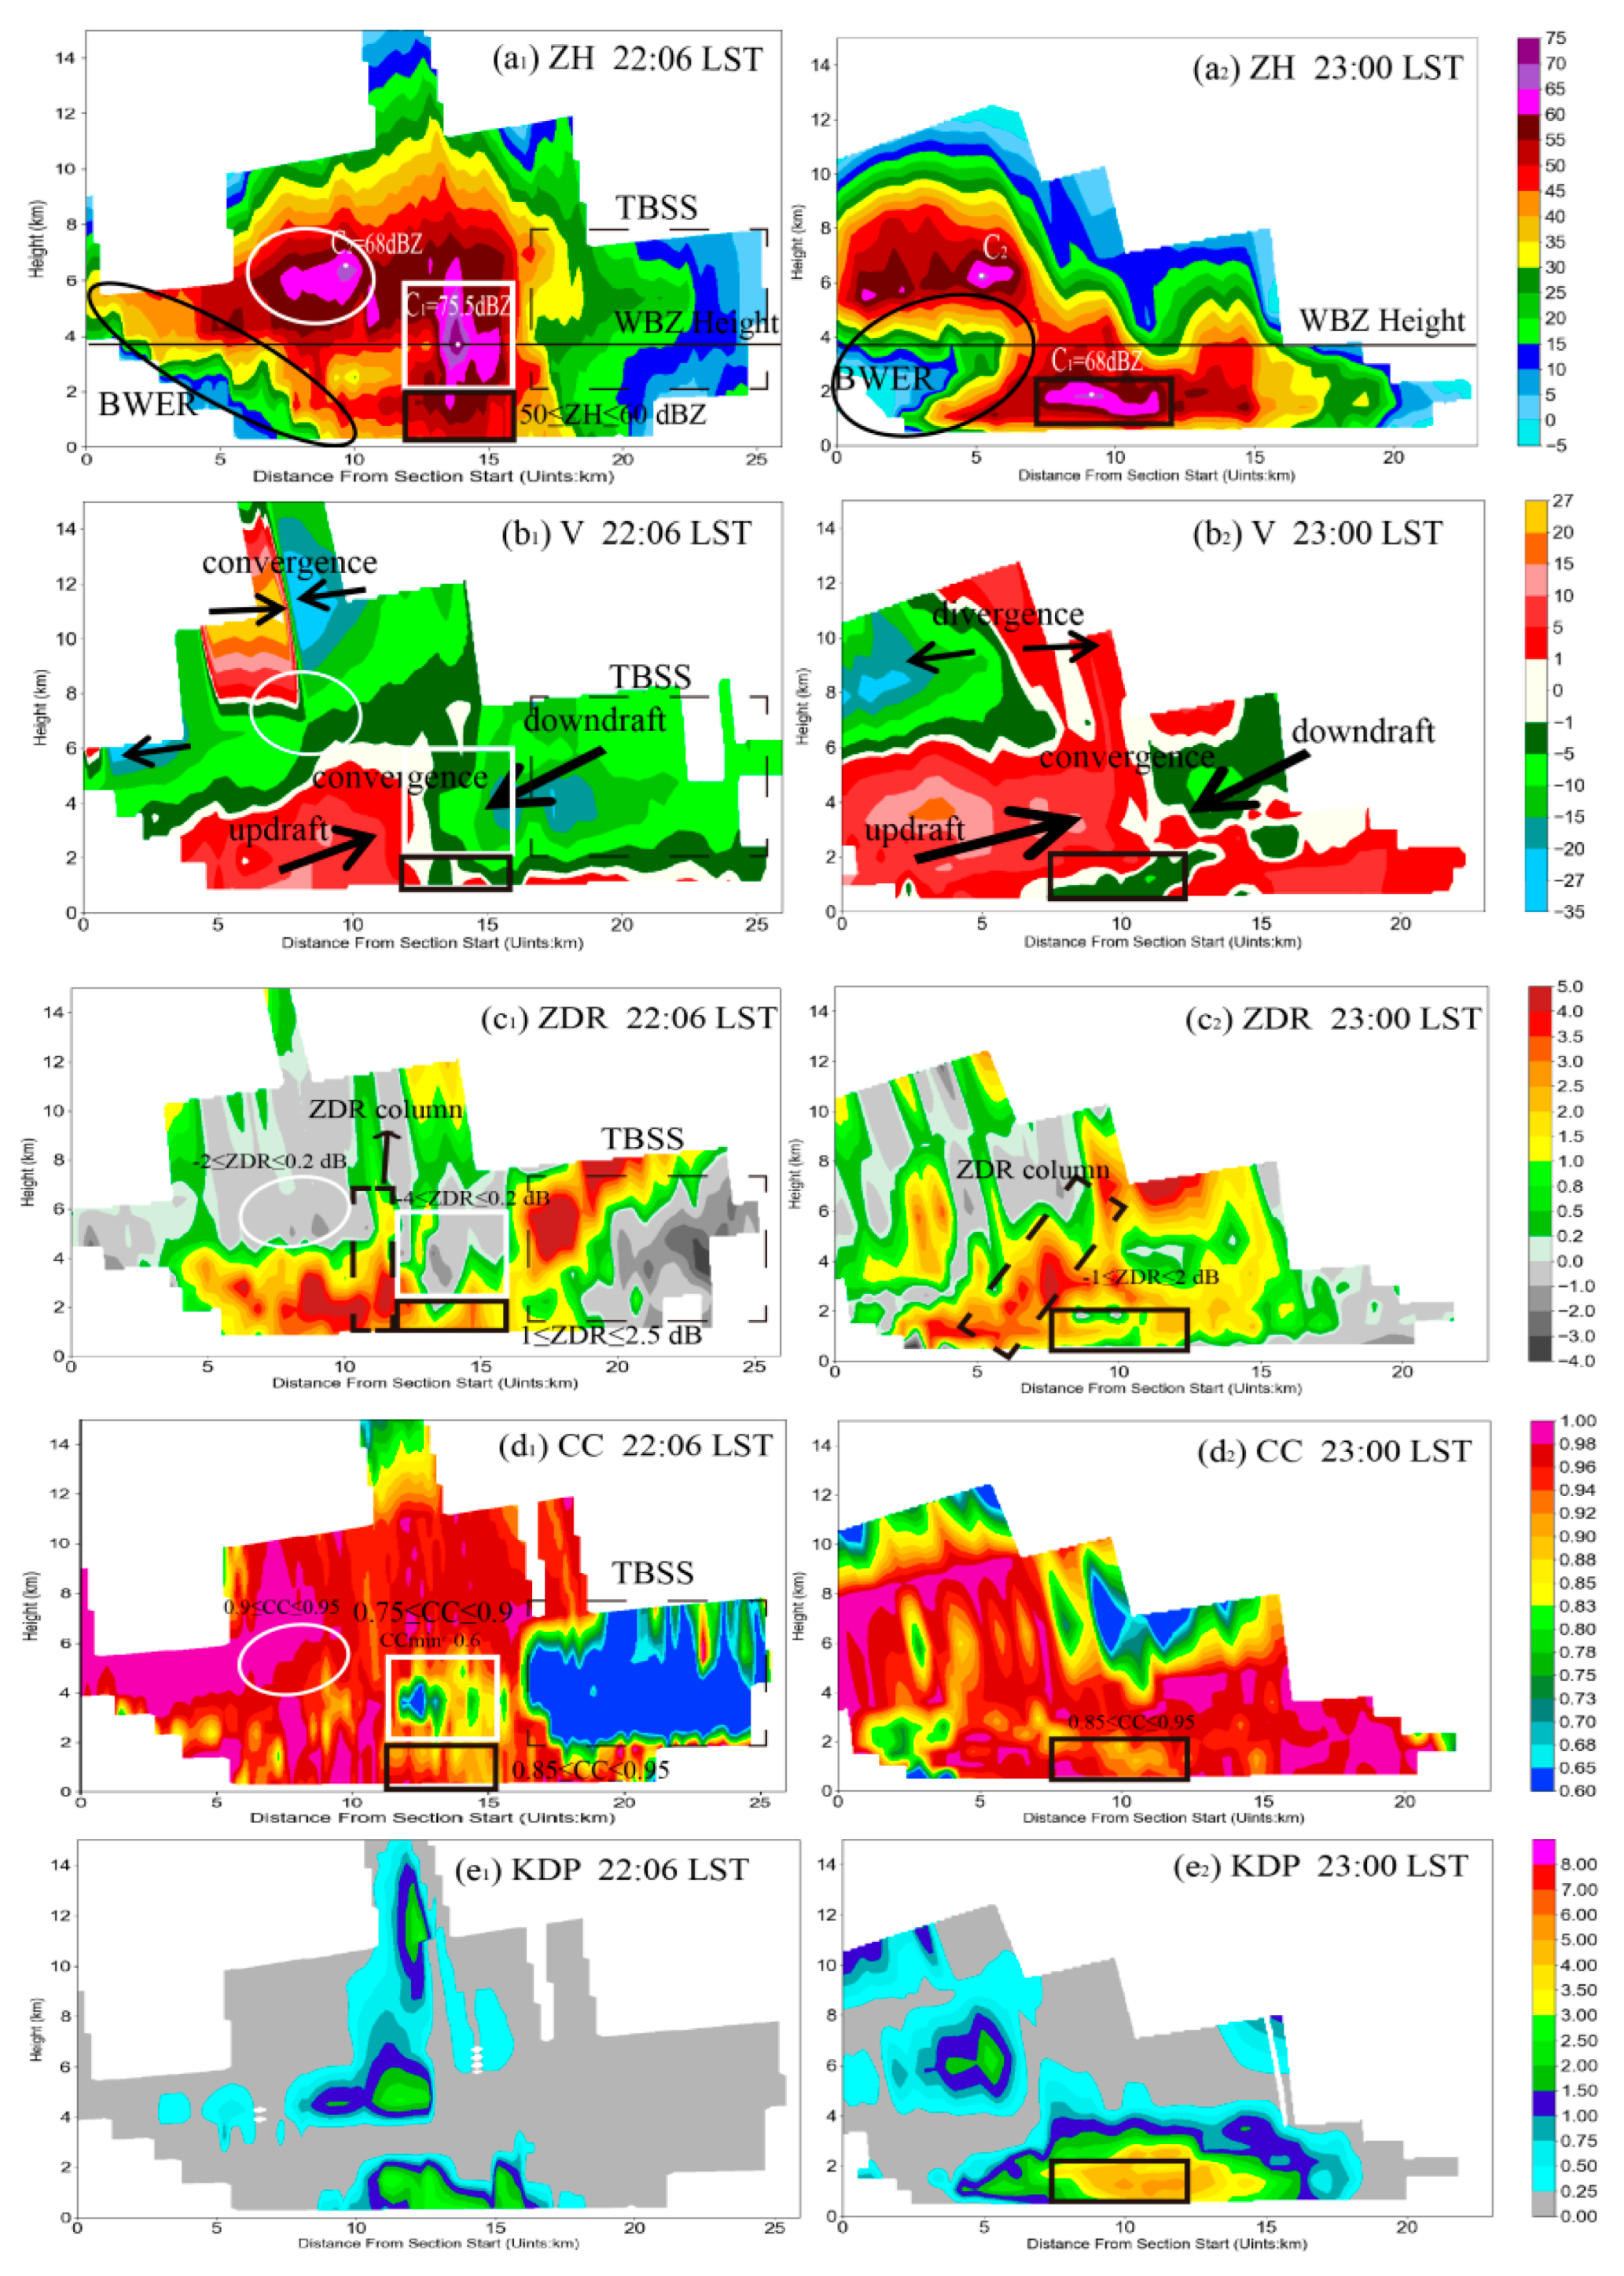
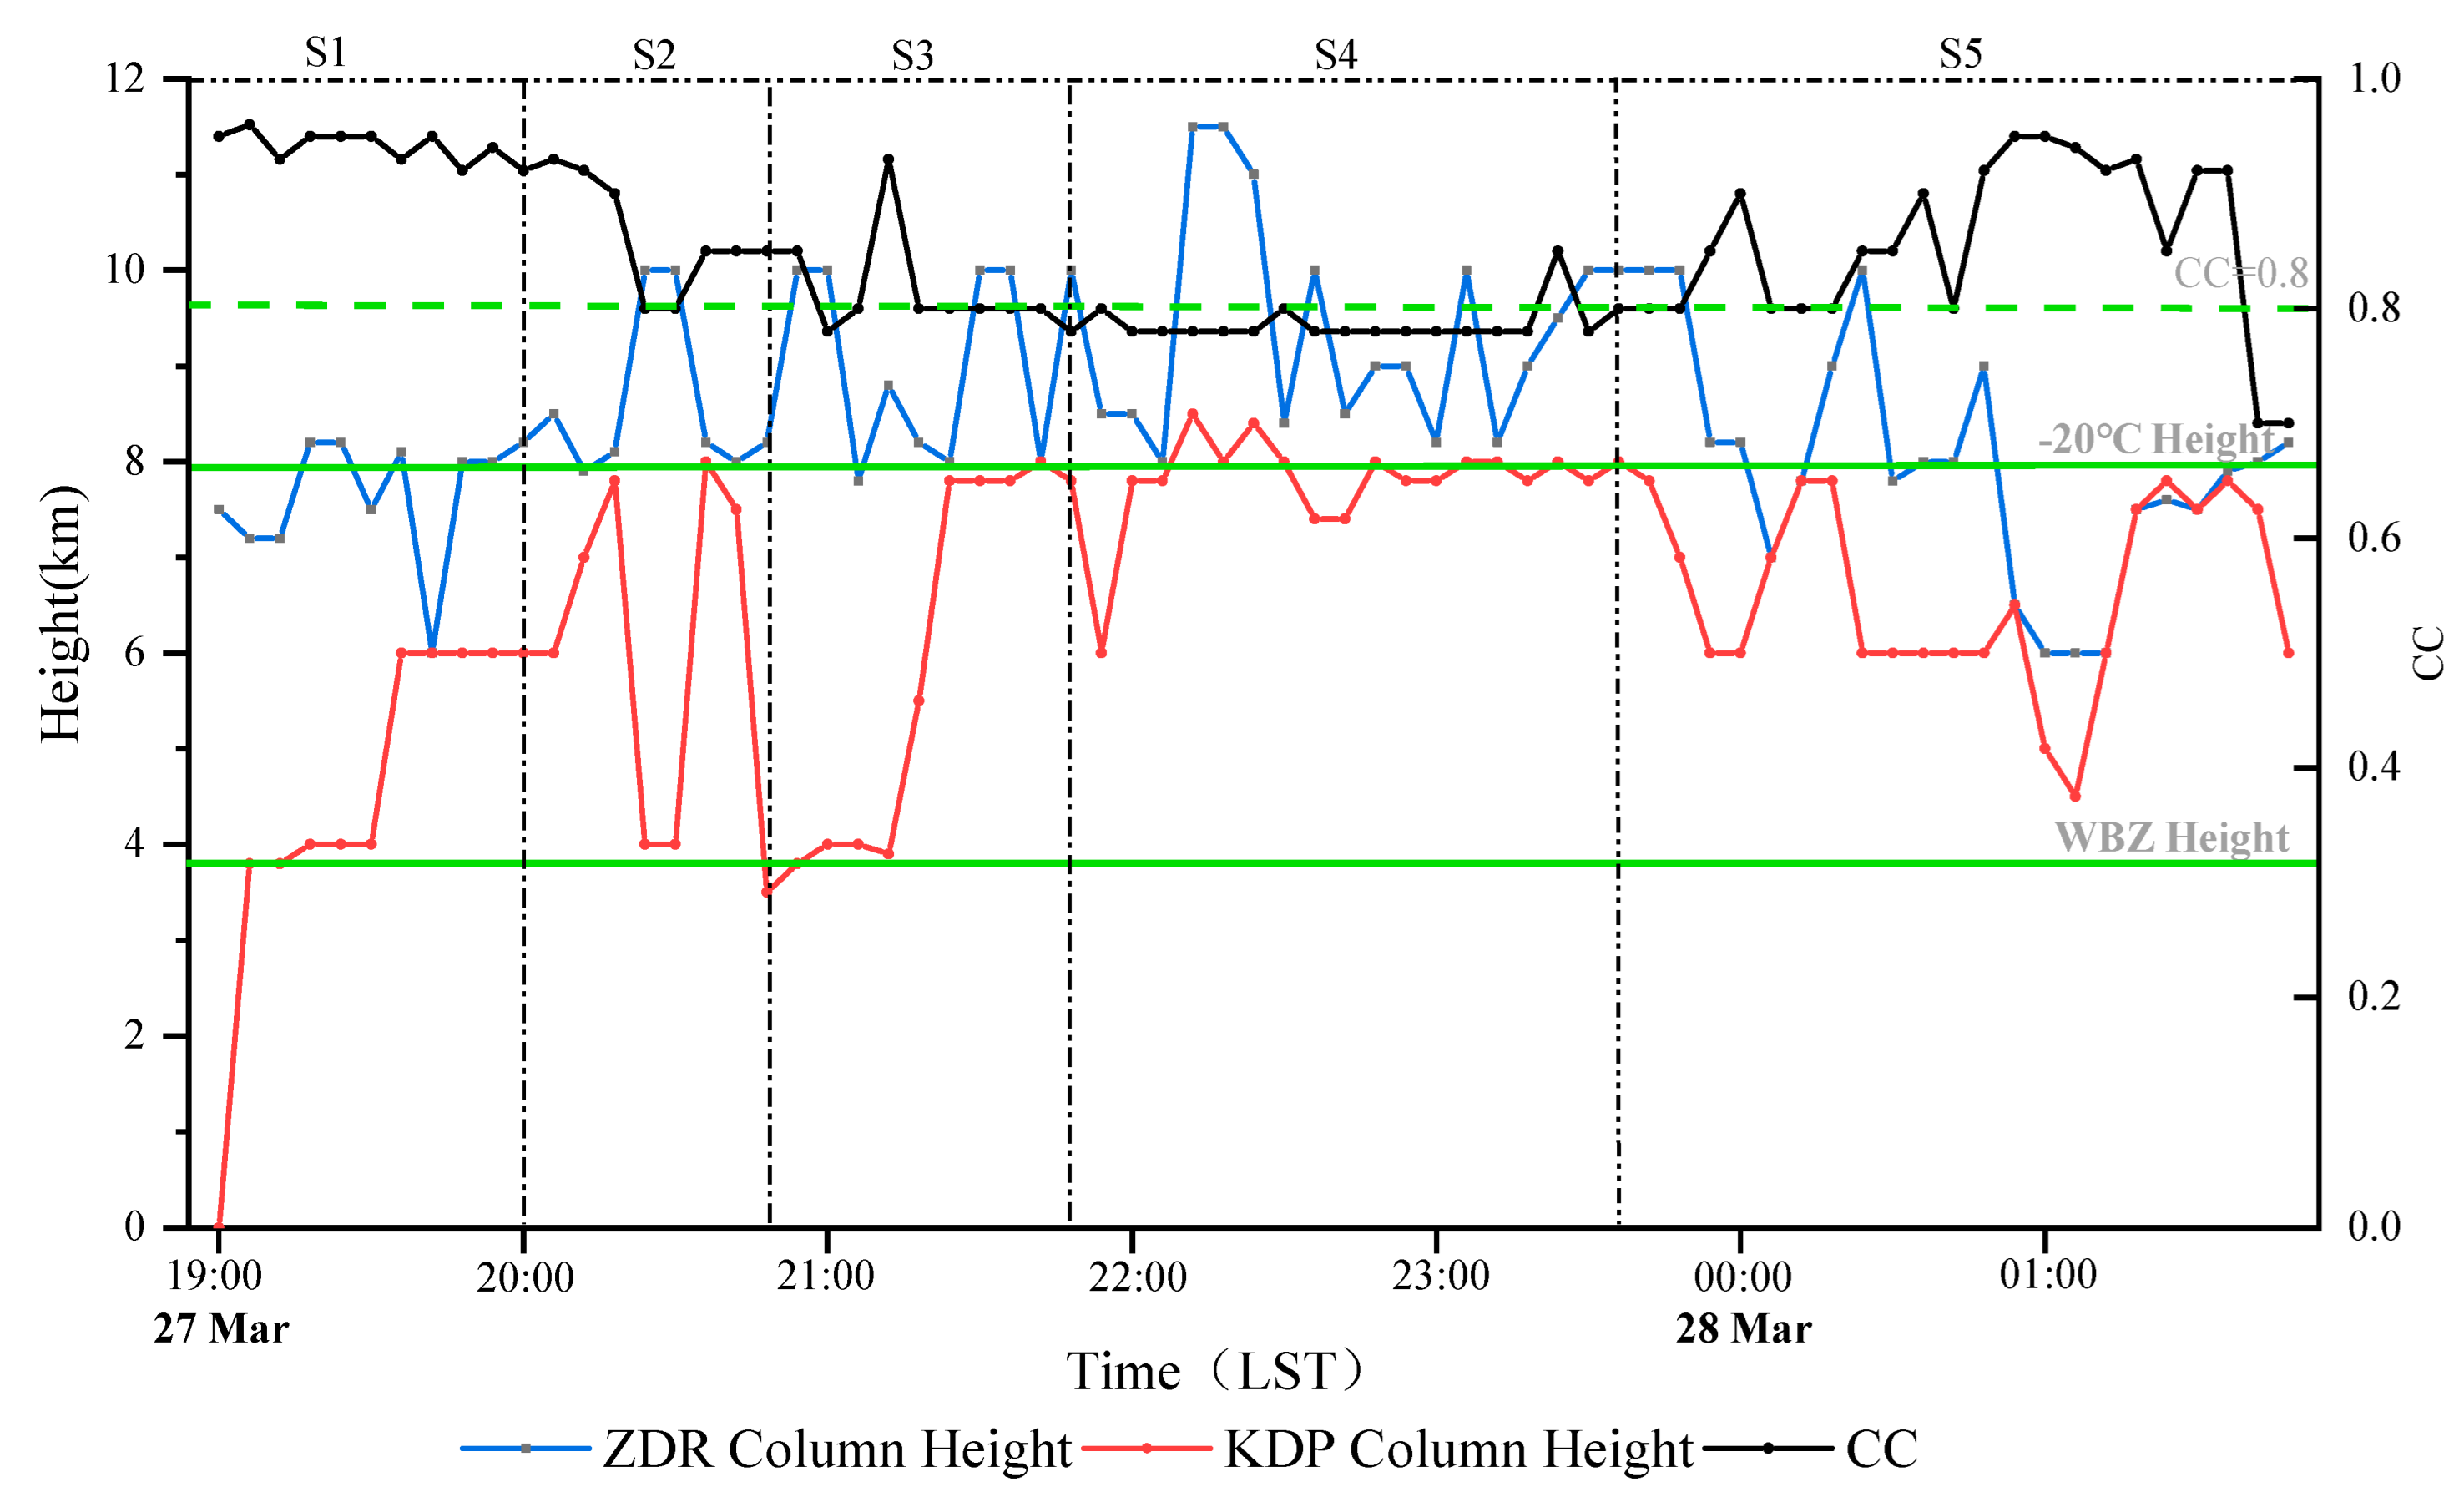
The ZDR arc, ZDR column, and KDP column were clearly observed from the initial stage to the mature stage of the hailstorm (19:00–21:48 LST). During this period, the ZDR column and KDP column increased gradually, while the CC kept decreasing. The ZDR column and KDP column reached their greatest heights (11.5 km and 8.5 km, respectively) during the hailfall stage (21:54–23:00 LST), and a CC valley appeared during this time. In particular, two vertical centers (C1, C2) with strong reflectivity appeared during this stage. C1 was located at 2–4 km, and C2 was located at 6–8 km. The maximum horizontal distance between C1 and C2 was 8 km. This implies that the hailstorm was strongly inclined and featured large hailstones.
(3)
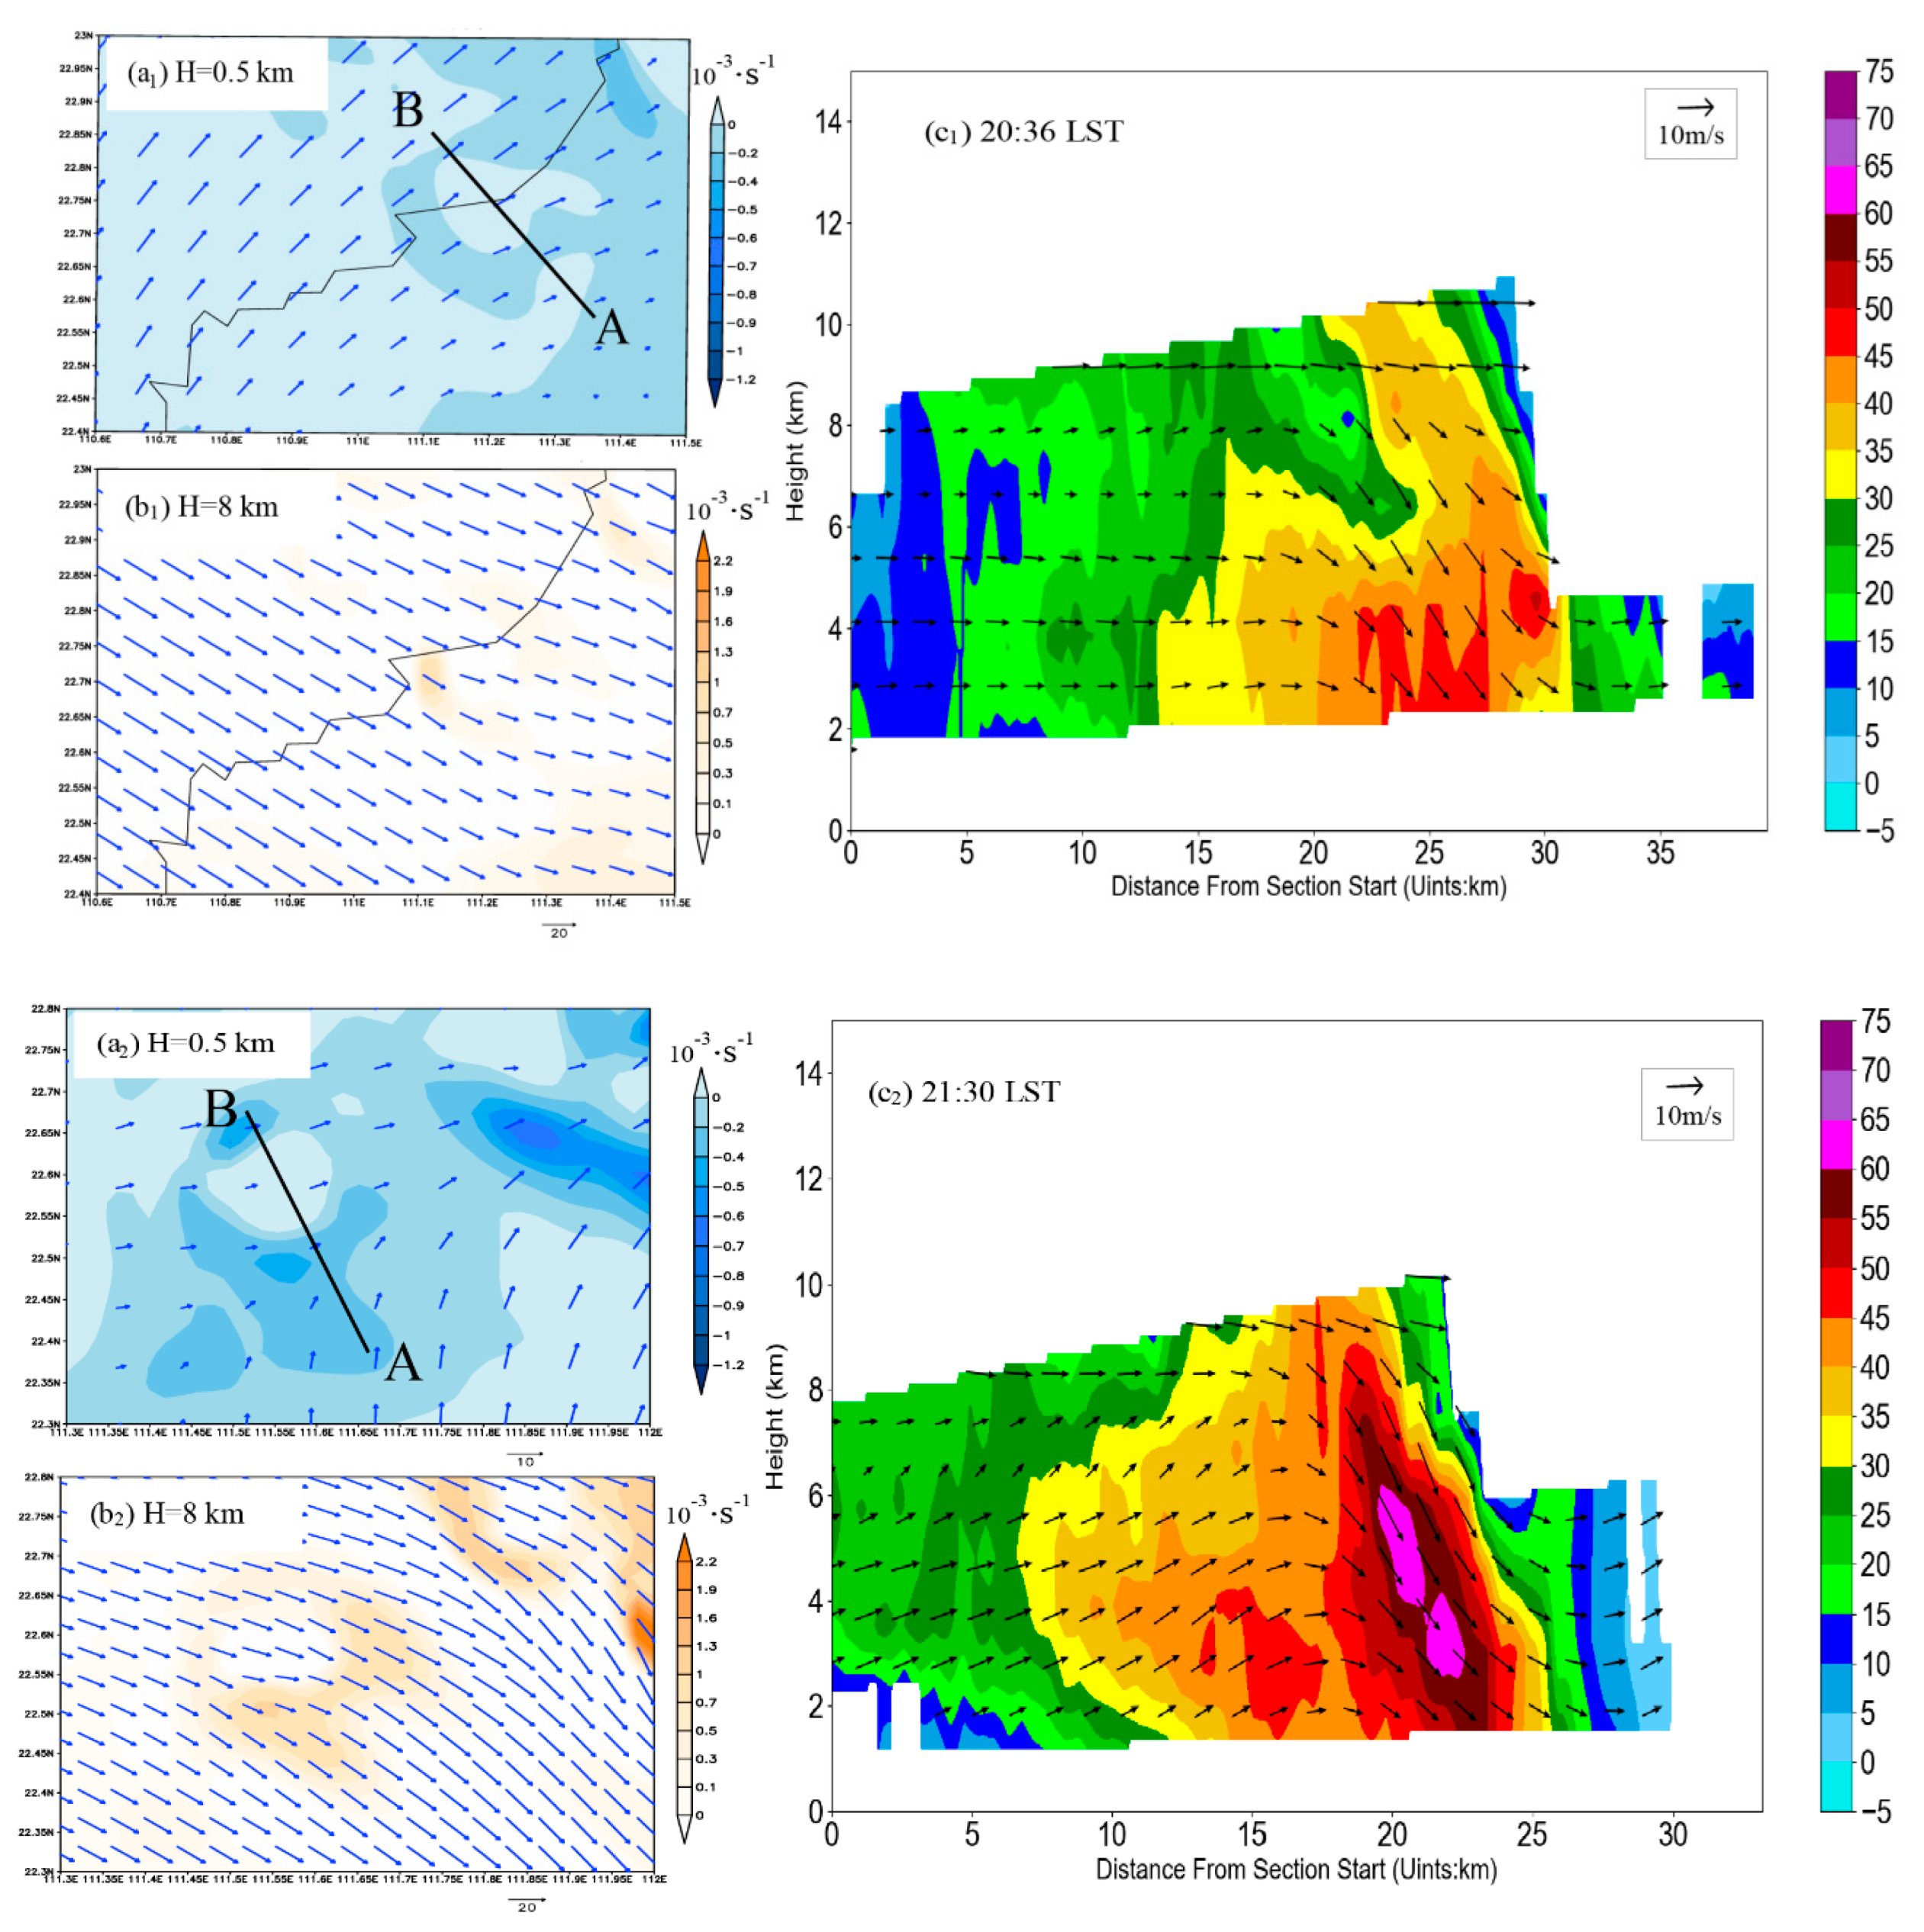
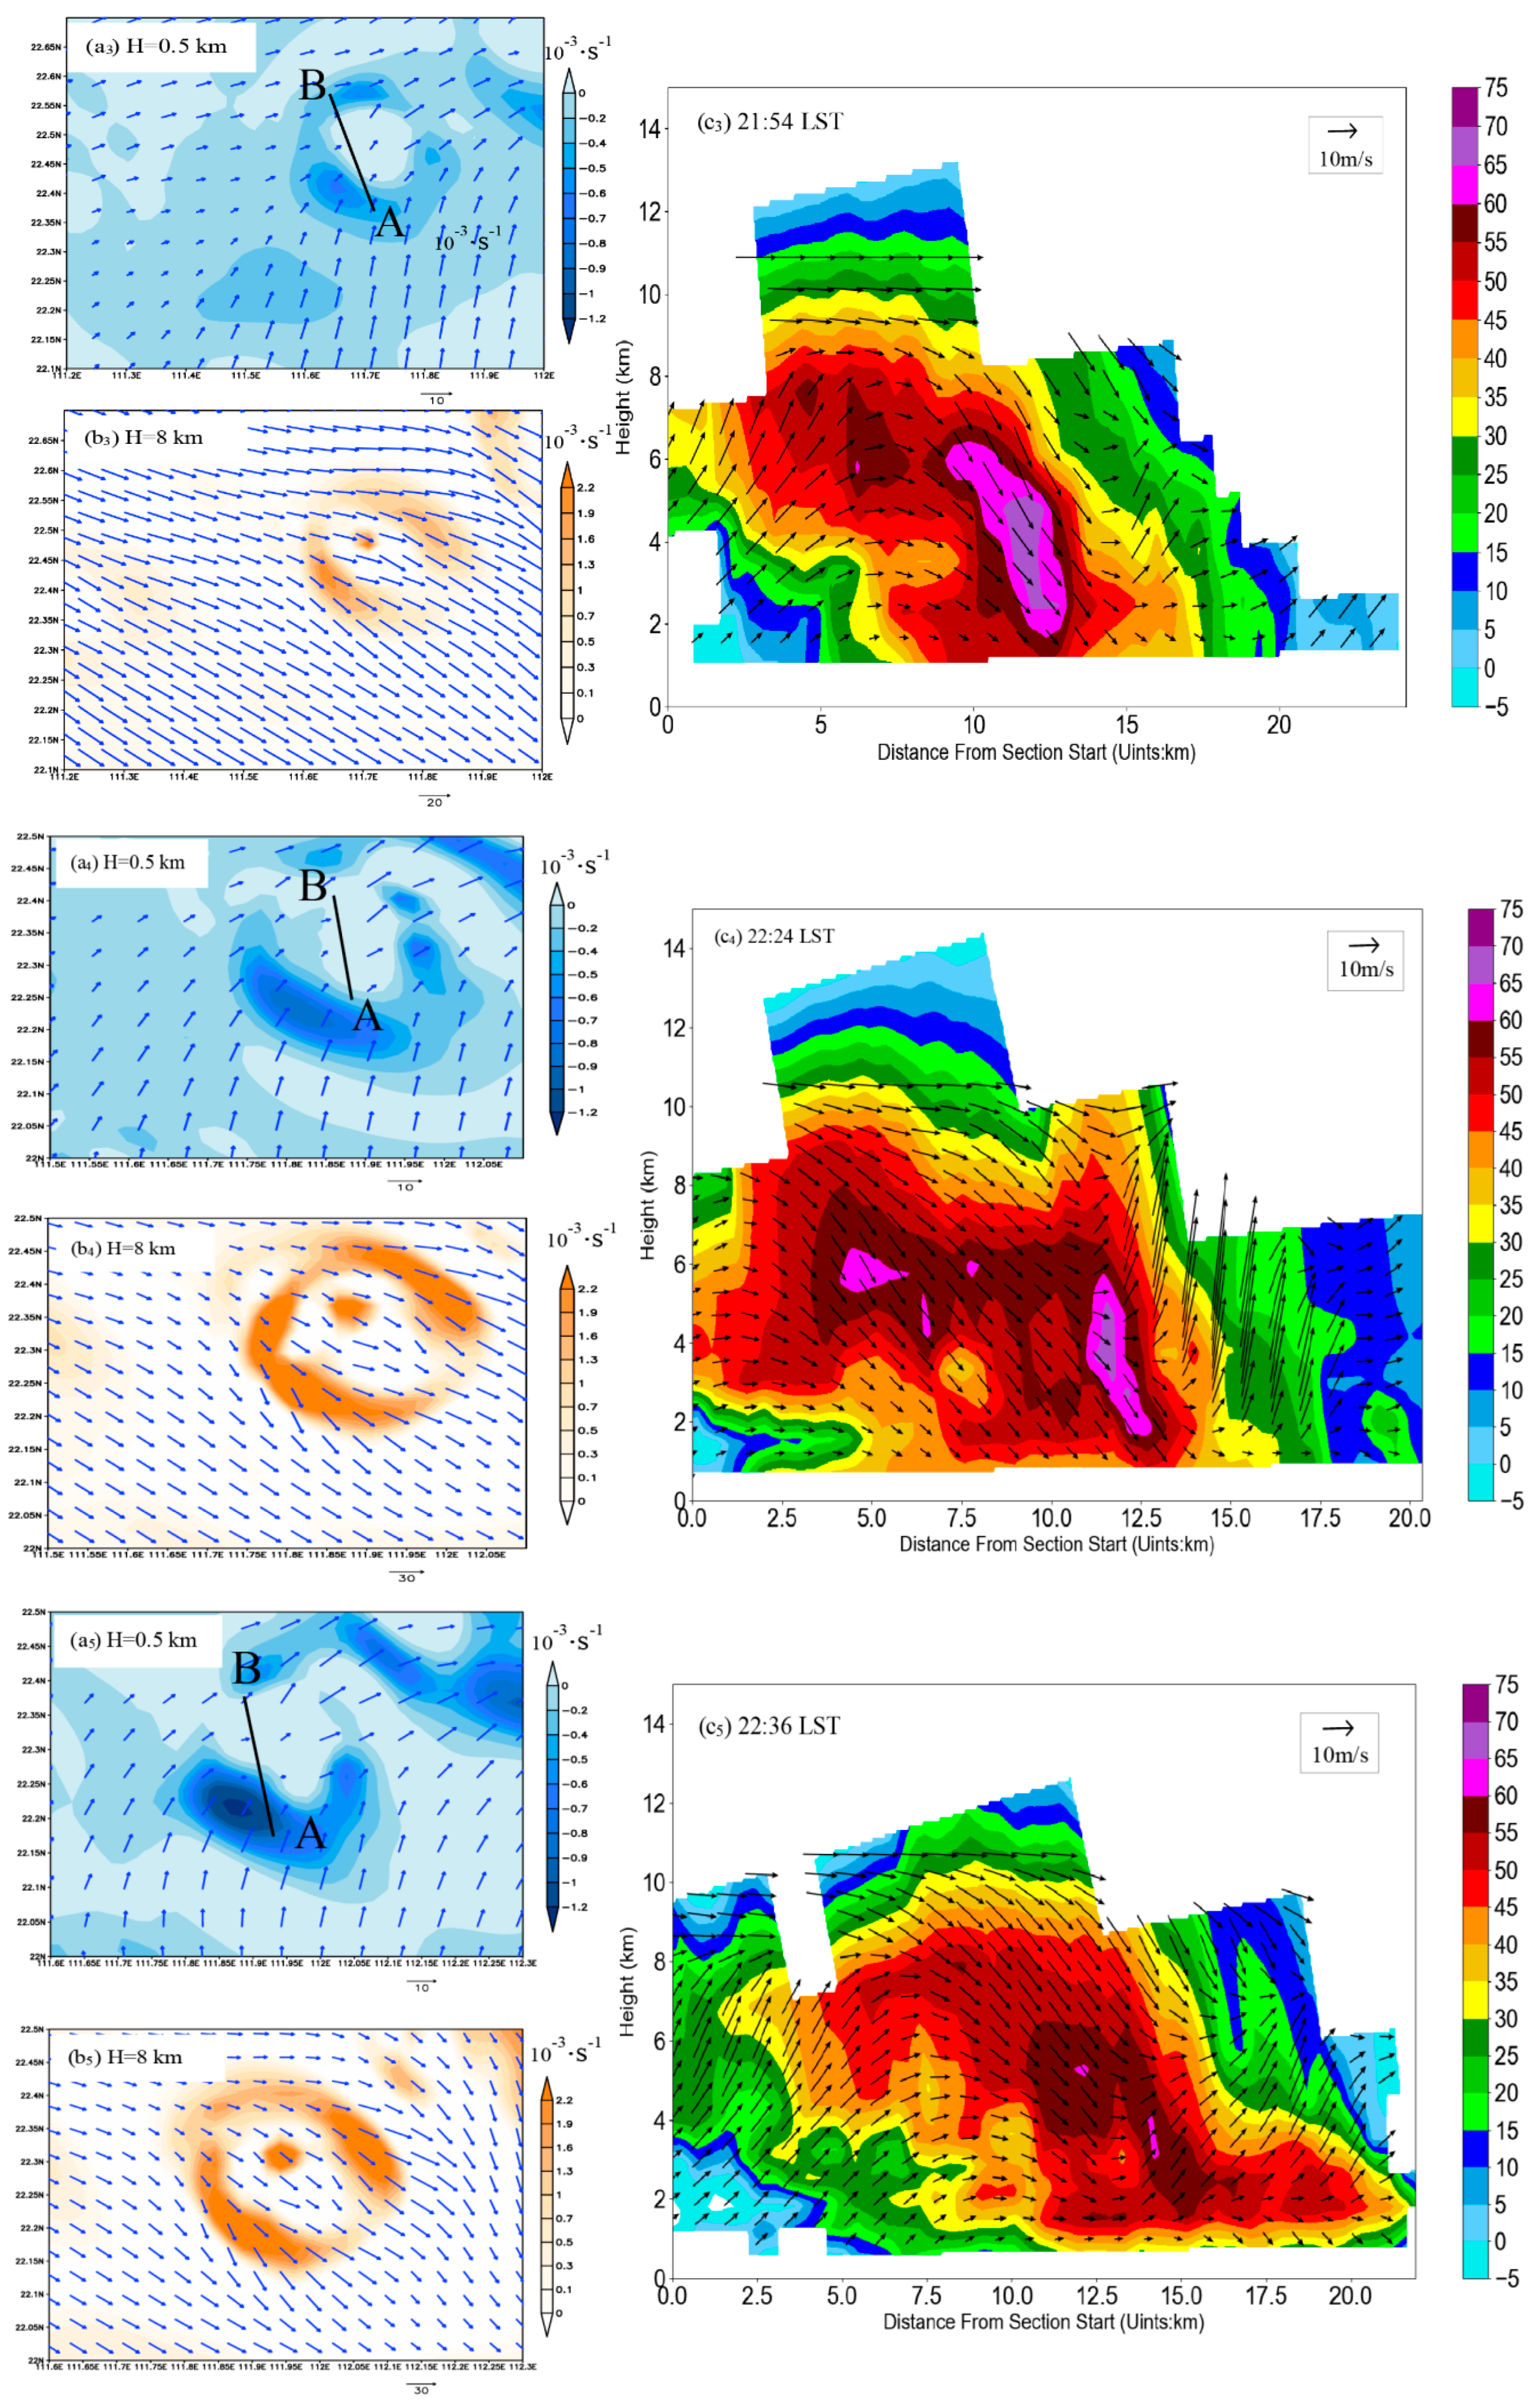
It was found from the analysis of the hydrometeor classifications revealed by the improved HCA and the high-resolution VDRAS that the formation of the inclined structure was closely related to the airflow evolution. The updraft at the BWER on the front side of the hailstorm increased to 20 m∙s−1, which maintained C2 at a high level. An ice-phase process occurred within C2 when the large raindrops at the lower part of C2 were lifted to the vicinity of C2 by the updraft, gradually increasing hailstone size. A sloping downward trajectory was exhibited under the influences of divergent outflow at the higher layer (8 km), ambient horizontal winds and strong vertical wind shear, and weakened updrafts from the hailfall drag.
Few studies on hailstorms with a strong inclined structure have been conducted in the past. This study introduces detailed evolution characteristics of an inclined hailstorm using dual-polarization radar observations and radar data assimilation. However, this study was only based on observations, and specific contributions of different factors to the formation of this inclined structure remain unknown. Therefore, follow-up numerical simulations and more cases analyses are required.
In addition, it is also necessary to collect a large number of samples for statistical and numerical simulation analysis to guess whether the changes in the direction and size of the airflow in the hail storm may be related to the mountain terrain.

Author Contributions

Conceptualization, X.L. and X.Y.; methodology, X.R., X.L. and H.L.; software, H.Z., X.R., Z.G., X.L. and H.L.; validation, H.Z., X.R., X.C. and J.Z.; formal analysis, H.Z., X.R. and S.C.; investigation, H.Z., X.R., X.C. and G.Z.; resources, X.R., Z.G. and X.L.; data curation, X.C. and G.Z.; writing—original draft preparation, H.Z., X.R., Z.G. and X.C. All authors have read and agreed to the published version of the manuscript.

Funding

This research was supported by the Opening Foundation of Key Laboratory of Atmosphere Sounding, the China Meteorological Administration, and the CMA Research Centre on Meteorological Observation Engineering Technology (U2021Z04) and the Guangdong Province Important Area Research and Development Plan (2020B1111200001).

Informed Consent Statement

Informed consent was obtained from all subjects involved in the study.

Conflicts of Interest

The authors declare no conflict of interest.

References

  1. Zhang, X.J.; Tao, Y.; Liu, G.Q.; Peng, Y.X. Study on the evolution of hailstorm and its cloud physical characteristics. Meteorol. Mon. 2019, 45, 415–425. (In Chinese) [Google Scholar]
  2. Baldi, M.; Ciardini, V.; Dalu, J.D.; De Filippis, T.; Maracchi, G.; Dalu, G. Hail occurrence in Italy: Towards a national database and climatology. Atmos. Res. 2014, 138, 268–277. [Google Scholar] [CrossRef]
  3. Púčik, T.; Groenemeijer, P.; Rýva, D.; Kolář, M. Proximity Soundings of Severe and Nonsevere Thunderstorms in Central Europe. Mon. Weather Rev. 2015, 143, 4805–4821. [Google Scholar] [CrossRef]
  4. Raupach, T.H.; Martius, O.; Allen, J.T.; Kunz, M.; Lasher-Trapp, S.; Mohr, S.; Rasmussen, K.L.; Trapp, R.J.; Zhang, Q. The effects of climate change on hailstorms. Nat. Rev. Earth Environ. 2021, 2, 213–226. [Google Scholar] [CrossRef]
  5. Meng, Z.; Zhang, F.; Luo, D.; Tan, Z.; Fang, J.; Sun, J.; Shen, X.; Zhang, Y.; Wang, S.; Han, W.; et al. Review of Chinese atmospheric science research over the past 70 years: Synoptic meteorology. J. Sci. China Earth Sci. 2019, 62, 1946–1991. (In Chinese) [Google Scholar] [CrossRef]
  6. Li, H.; Zhang, D. High-Resolution Modeling of Convective Storms: Progress and Future Challenges. Adv. Meteorol. Sci. Technol. 2021, 11, 75–91. (In Chinese) [Google Scholar]
  7. Battern, L.J. Doppler radar observation of a hailstorm. Appl. Meteor. 1975, 14, 98–108. [Google Scholar]
  8. Miller, R.C. Notes on Analysis and Severe Storm Forecasting Procedures of the Air Force Global Weather Central; Technical Report 200 (Rev); Air Weather Service: Omaha, NE, USA, 1972; 181p. [Google Scholar]
  9. Hubbert, J.; Bringi, V. The effects of three-body scattering on differential reflflectivity signatures. J. Atmos. Ocean. Technol. 2000, 17, 51–61. [Google Scholar] [CrossRef]
  10. Browning, K.A.; Foote, G.B. Airflow and hail growth in supercellstorms and some implications for hail suppression. Quart. J. Roy. Meteor. Soc. 1976, 102, 499–533. [Google Scholar] [CrossRef]
  11. Gobbo, S.; Ghiraldini, A.; Dramis, A.; Dal Ferro, N.; Morari, F. Estimation of Hail Damage Using Crop Models and Remote Sensing. Remote Sens. 2021, 13, 2655. [Google Scholar] [CrossRef]
  12. Chalon, J.P.; Famkhauser, J.C.; Eccles, P.J. Structure of an Evolving Hailstorm, Part 1: General Characteristics and Cellular Structure. Mon. Weather Rev. 2009, 104, 564–575. [Google Scholar] [CrossRef]
  13. Browning, K.A.; Frankhauser, J.C.; Chalon, J.P.; Eccles, P.J.; Strauch, R.G.; Merrem, F.H.; Musil, D.J.; May, E.L.; Sand, W.R. Structure of an Evolving Hailstorm Part V: Synthesis and implications for Hail Growth and Hail Suppression. Mon. Weather Rev. 1976, 104, 603–610. [Google Scholar] [CrossRef]
  14. Xu, F.; Zheng, Y.Y.; Xiao, H.; Mu, X. Mesoscale Characteristics of a Severe Hail Event over the Area Along Yangtze River in Jiangsu. Meteorol Mon. 2016, 42, 567–577. (In Chinese) [Google Scholar]
  15. Park, H.S.; Ryzhkov, A.V.; Zrnić, D.S.; Kim, K.E. The hydrometeor classifification algorithm for the polarimetric WSR-88D: Description and application to an MCS. Weather Forecast. 2009, 24, 730–748. [Google Scholar] [CrossRef] [Green Version]
  16. Pan, J.W.; Wei, M.; Guo, L.J. Dual-polarization radar characteristic analysis of theevolution ofheavy hail supercell in Southern Fujian. J. Meteorol. Mon. 2020, 46, 1608–1620. (In Chinese) [Google Scholar]
  17. Carras, J.N.; Macklin, W.C. The shedding of accreted water during hailstone growth. Q. J. R. Meteorol. Soc. 1973, 99, 639–648. [Google Scholar] [CrossRef]
  18. Grant, L.D.; Van Den Heever, S.C. Microphysical and dynamical characteristics of low-precipitation and classic supercells. Atmos. Sci. 2014, 71, 2604–2624. [Google Scholar] [CrossRef]
  19. Knight, C.; Knight, N. The falling behavior of hailstones. J. Atmos. Sci. 1970, 27, 672–680. [Google Scholar] [CrossRef]
  20. Browning, K. Some inferences about the updraft within a severe local storm. Atmos. Sci. 1965, 22, 669–677. [Google Scholar] [CrossRef]
  21. Straka, J.; Zrnic, D. An algorithm to deduce hydrometeor types and contents from multiparameter radar data.C. In Proceedings of the 26th International Conference on Radar Meteorology, Norman, OK, USA, 24–28 May 1993; pp. 513–516. [Google Scholar]
  22. Straka, J. Hydrometeor fields in a supercell storm as deduced from dual-polarization radar. In Proceedings of the 18th Conference on Severe Local Storms, San Francisco, CA, USA, 19–23 February 1996; pp. 551–554. [Google Scholar]
  23. Liu, L.; Zhang, H.; Wang, Z. Preliminary Research for Method of Hail Detection with C Band Dual Linear Polarization Radar. J. Plateau Meteorol. 1993, 12, 333–337. (In Chinese) [Google Scholar]
  24. Zrnic, D.S.; Ryzhkov, A.; Strala, K. Testing a Procedure for Automatic Classification of Hydrometeor Types. J. Atmos. Ocean. Technol. 2001, 18, 892–913. [Google Scholar] [CrossRef]
  25. Cao, J.W.; Liu, L.P.; Ge, R.S. A study of fuzzy logic method in classification of hydrometeors base on polarimetric rada measurement. J. Chin. J. Atmos. Sci. 2005, 29, 827–836. (In Chinese) [Google Scholar]
  26. Picca, J.; Ryzhkov, A. A dual-wavelength polarimetric analysis of the 16 May 2010 Oklahoma City extreme hailstorm. Mon. Weather Rev. 2012, 140, 1385–1403. [Google Scholar] [CrossRef]
  27. Montopoli, M.; Picciotti, E.; Baldini, L.; Di Fabio, S.; Marzano, F.S.; Vulpiani, G. Gazing inside a giant-hail-bearing Mediterranean supercell by dual-polarization Doppler weather radar. Atmos. Res. 2021, 264, 105852. [Google Scholar] [CrossRef]
  28. Elmore, K.; Flamig, Z.; Lakshmanan, V.; Kaney, B.; Reeves, H.; Farmer, V.; Rothfusz, L. mPING: Crowd-sourcing weather reports for research. Bull. Am. Meteorol. Soc. 2014, 95, 1335–1342. [Google Scholar] [CrossRef]
  29. Schuur, T.J.; Park, H.S.; Ryzhkov, A.V.; Reeves, H.D. Classification of precipitation types during transitional winter weather using the RUC model and polarimetric radar retrievals. J. Appl. Meteorol. Climatol. 2012, 51, 763–779. [Google Scholar] [CrossRef]
  30. Wu, C.; Liu, L.; Wei, M.; Xi, B.; Yu, M. Statistics-based optimization of the polarimetric radar hydrometeor classification algorithm and its application for a squall line in South China. Adv. Atmos. Sci. 2018, 35, 296–316. [Google Scholar] [CrossRef]
  31. Liu, X.; Wan, Q.; Wang, H.; Xiao, H.; Zhang, Y.; Zheng, T.; Feng, L. Raindrop Size Distribution Parameters Retrieved from Guangzhou S-band Polarimetric Radar Observations. J. Meteorol Res. 2018, 32, 571–583. [Google Scholar] [CrossRef]
  32. Li, H.; Wan, Q.; Peng, D.; Liu, X.; Xiao, H. Multiscale analysis of a record-breaking heavy rainfall event in Guangdong, China. Atmos. Res. 2020, 232, 104703. [Google Scholar] [CrossRef]
  33. Sun, J.; Crook, N.A. Dynamical and Microphysical Retrieval from Doppler Radar Observations Using a Cloud Model and Its Adjoint. Part I: Model Development and Simulated Data Experiments. J. Atmos. Sci. 1997, 54, 1642–1661. [Google Scholar] [CrossRef]
  34. Sun, J.Z.; Crook, N.A. Dynamical and microphysical retrieval from Doppler radar observations using a cloud model and its adjoint. Part II: Retrieval experiments of an observed Florida convective storm. J. Atmos. Sci. 1998, 55, 835–852. [Google Scholar] [CrossRef]
  35. Sun, J.; Zhang, Y. Analysis and prediction of a squall line observed during IHOP using multiple WSR-88Dobservations. Mon. Weather Rev. 2008, 136, 2364–2388. [Google Scholar] [CrossRef]
  36. Sun, J.; Chen, M.; Wang, Y. A frequent-updating analysis system based on radar, surface, and mesoscale model data for the Beijing 2008 forecast demonstration project. Weather Forecast 2010, 25, 1715–1735. [Google Scholar] [CrossRef]
  37. Zhou, A.; Zhao, K.; Lee, W.-C.; Huang, H.; Hu, D.; Fu, P. VDRAS and polarimetric radar investigation of a bow echo formation after a squall line merged with a preline convective cell. J. Geophys. Res. Atmos. 2020, 125, e2019JD031719. [Google Scholar] [CrossRef]
  38. Rao, X.; Zhao, K.; Chen, X.; Huang, A.; Hu, S.; Hu, D.; Liu, X. Roles of multi-scale orography in triggering nocturnal convection at a summer rainfall hotspot over the South China coast: A case study. J. Geophys. Res. Atmos. 2022, 127, e2022JD036503. [Google Scholar] [CrossRef]
  39. Zhuang, Z.R.; Xue, S.; Shen, X.S.; Li, X.L. Implementation of CMA-GFS 3D-Var System on the Yin-Yang Grid. J. Trop. Meteorol. 2021, 27, 346–354. [Google Scholar]
  40. Stipanuk, G.S. Algorithms for Generating a Skew-T,log p Diagram and Computing Selected Meteorological Quantities; T.Army Electronics Command Fort: Monmouth, NJ, USA, 1974. [Google Scholar]
  41. Cui, X.; Gu, H.; Cao, Y. Simplification of Barometric Height Formula in Geopotential Height Calculation and Resulted Errors. Meteorol. Sci. Technol. 2017, 45, 307–312. (In Chinese) [Google Scholar] [CrossRef]
  42. Crum, T.D.; Alberty, R.L.; Burgess, D.W. Recording, Archiving, and Using WSR-88D Data. Bull. Am. Meteorol. Soc. 1993, 74, 645–788. [Google Scholar] [CrossRef]
  43. Guo, Z.; Hu, S.; Liu, X.; Chen, X.; Zhang, H.; Qi, T.; Zeng, G. Improving S-Band Polarimetric Radar Monsoon Rainfall Estimation with Two-Dimensional Video Disdrometer Observations in South China. Atmosphere 2021, 12, 831. [Google Scholar] [CrossRef]
  44. Giangrande, S.E.; Mcgraw, R.; Lei, L. An application of linear programming to polarimetric radar differential phase processing. J. Atmos. Ocean. Technol. 2013, 30, 1716–1729. [Google Scholar] [CrossRef]
  45. Chen, G.; Zhao, K.; Zhang, G.; Huang, H.; Liu, S.; Wen, L.; Yang, Z.L.; Yang, Z.W.; Xu, L.; Zhu, W. Improving polarimetric c–band radar rainfall estimation with two–dimensional video disdrometer observations in eastern China. Hydrometeorology 2017, 18, 1375–1391. [Google Scholar] [CrossRef]
  46. Huang, H.; Zhang, G.; Zhao, K.; Giangrande, S.E. A Hybrid Method to Estimate Specific Differential Phase and Rainfall with Linear Programming and Physics Constraints. IEEE Trans. Geosci. Remote Sens. 2016, 55, 96–111. [Google Scholar] [CrossRef]
  47. Guan, L.; Dai, J.; Xu, J.; Yin, C.G. Adaptive calculation of specific differential phase for S-band dual-polarimetric doppler radar. Torrential Rain Disasters. 2019, 38, 668–675. [Google Scholar]
  48. Chen, X.; Zhao, K.; Sun, J.; Zhou, B.; Lee, W.C. Assimilating surface observations in a four-dimensional variational Doppler radar data assimilation system to improve the analysis and forecast of a squall line case. Adv. Atmos. Sci. 2016, 33, 1106–1119. [Google Scholar] [CrossRef]
  49. Xiao, X.; Sun, J.; Chen, M.; Qie, X.; Ying, Z.; Wang, Y.; Ji, L. Comparison of environmental and mesoscale characteristics of two types of mountain-to-plain precipitation systems in the Beijing Region, China. J. Geophys. Res.-Atmos. 2019, 124, 6856–6872. [Google Scholar] [CrossRef]
  50. Xiao, X.; Sun, J.; Chen, M.; Qie, X.; Wang, Y.; Ying, Z. The characteristics of weakly forced mountain-to-plain precipitation systems based on radar observations and high-resolution reanalysis. J. Geophys. Res. Atmos. 2017, 122, 3193–3213. [Google Scholar] [CrossRef]
  51. Zhang, F.; Zhang, Q.; Sun, J. Initiation of an elevated mesoscale convective system with the influence of complex terrain during Meiyu season. J. Geophys. Res. Atmos. 2021, 126, e2020JD033416. [Google Scholar] [CrossRef]
  52. Skamarock, W.C.; Klemp, J.B. A time-split nonhydrostatic atmospheric model for weather research and forecasting applications. J. Comput. Phys. 2008, 227, 3465–3485. [Google Scholar] [CrossRef]
  53. Dolan, B.; Rutledge, S.A. A theory-based hydrometeoridentification algorithm for X-band polarimetric radars. J. Atmos. Oceanic Technol. 2009, 26, 2071–2088. [Google Scholar] [CrossRef] [Green Version]
  54. Dolan, B.; Rutledge, S.A.; Lim, S.; Chandrasekar, V.; Thurai, M. A Robust C-Band Hydrometeor Identification Algorithm and Application to a Long-Term Polarimetric Radar Dataset. J. Appl. Meteorol. Climatol. 2013, 52, 2162–2186. [Google Scholar] [CrossRef]
  55. Vivekanandan, J.; Zrnic, D.S.; Ellis, S.M.; Oye, R.; Ryzhkov, A.V.; Straka, J. Cloud microphysics retrieval using S-band dual-polarization radar measurements. Bull. Amer. Meteor. Soc. 1999, 80, 381–388. [Google Scholar] [CrossRef]
  56. Yu, X.D.; Zheng, Y.Y.; Zhang, A.M.; Yao, Y.Q.; Fang, C. The detection of a severe tornado event in anhui with china new generation weather radar. J. Plateau Meteorol. 2006, 25, 914–924. (In Chinese) [Google Scholar]
  57. Zeng, Z.; Chen, Y.; Zhu, K.; Li, S.Q. Characteristics of atmospheric stratification and melting effect of heavy hail events in Guangdong Province. Chin. J. Ofatmospheric Sci. 2019, 43, 598–617. (In Chinese) [Google Scholar]
  58. Kumjian, M.R.; Ryzhkov, A.V. Polarimetric signatures in supercell thunderstorms. J. Appl. Meteorol. Climatol. 2008, 47, 1940–1961. [Google Scholar] [CrossRef]
  59. Snyder, J.C.; Ryzhkov, A.V.; Kumjian, M.R.; Khain, A.P.; Picca, J. A ZDR column detection algorithm to examine convective storm updrafts. Weather Forecast 2015, 30, 1819–1844. [Google Scholar] [CrossRef]
  60. Wu, H.Y.; Zeng, M.J.; Mei, H.X.; Zhang, B. Study on Sensitivity of Wind Field Variation to Structure and Development of Convective Storms. J. Trop. Meteorol. 2020, 26, 57–70. [Google Scholar]
  61. Kumjian, M.R.; Ryzhkov, A.V.; Reeves, H.D.; Schuur, T.J. A Dual-polarization radar signature of hydrometeor refreezing in winter storms. J. Appl. Meteorol. Climatol. 2013, 52, 2549–2566. [Google Scholar] [CrossRef]
  62. Heinselman, P.L.; Ryzhkov, A.V. Validation of Polarimetric Hail Detection. Weather Forecast 2006, 21, 839–850. [Google Scholar] [CrossRef]
  63. Loney, M.L.; Zrnić, D.S.; Straka, J.M.; Ryzhkov, A.V. Enhanced polarimetric radar signatures above the melting level in a supercell storm. J. Appl. Meteorol. 2002, 41, 1179–1194. [Google Scholar] [CrossRef]
  64. Ryzhkov, A.V.; Kumjian, M.R.; Ganson, S.M.; Zhang, P. Polarimetric radar characteristics of melting hail. Part II: Practical implications. J. Appl. Meteorol. Climatol. 2013, 52, 2871–2886. [Google Scholar] [CrossRef]
  65. Mirkovic, D.; Zrnic, D.S.; Melnikov, V.; Zhang, P. Effects of Rough Hail Scattering on Polarimetric Variables. IEEE Trans. Geosci. Remote Sens. 2021, 60, 1–14. [Google Scholar] [CrossRef]
Figure 1. (a) Terrain height (shade, units: m) over the western part of South China coast. Provincial and municipal borders are marked with black lines. (b) The path of the hailstorm was tracked by radar. In (a), the five radars are represented by a red five-pointed star, with adjacent names in red. The radar scan radius is represented by black circles, with the green dots representing AWS. The orange, yellow, pink, and purple dots are used to mark the location of the automated stations near the area where hail was actually found. Wind profiler radar and sounding radar are marked with brown diamonds and blue triangles, respectively. In (b), the location of the hail is marked with a red triangle, the moderate cyclone is marked with the letter M and a blue circle. The Yangjiang radar station and the sounding stations are marked with a black five-pointed star and a black triangle. The four colored AWSs in (a) are marked with the numbers 1–4, in (b). Numbers indicate time.
Atmosphere 13 01564 g001
Figure 2. Circulation patterns at 20:00 LST on 27 March 2020 (revealed by MICAPS data). (a) 200 hPa; (b) 500 hPa; (c) 925 hPa; (d) ground. Provincial borders are indicated by solid grey lines; land and sea are marked in white and blue, respectively. The study area is marked with a red triangle. In (ac), the solid blue lines (black arrows) represent geopotential height (winds), while the shaded colors represent the wind speed, the long line represents 4 m·s1, the short line represents 2 m·s1, and a flag represents 20 m·s1. The red lines in (a,c,d) indicate temperature. In (b), the red lines represent the geopotential height of 588 gpm.
Atmosphere 13 01564 g002
Figure 3. Skew T−logP diagrams at the Yangjiang station (59663) at (a) 08 LST and (b) 20 LST on 27 March 2020. The values of CAPE, LCL, and LFC were calculated for the near-surface (0 to 500 m) air after the adjustment and are labeled on the top of each panel. A full wind barb is 4 m·s1, and a flag represents 20 m·s1.
Atmosphere 13 01564 g003
Figure 4. Time series of observed and analyzed wind, temperature, and rainfall at AWSs. (a) G2344, Guigang station; (b) G2362, Naliu station; (c) G2354, Beimian station; (d) G2347, Heshui station. The bar graph represents 5–minute rainfall, the solid black line represents the temperature, and the arrow represents the wind.
Atmosphere 13 01564 g004
Figure 5. Mosaics of reflectivity radar at 1.5° elevation at (a) 19:00, (b) 20:30, (c) 21:30, (d) 22:06, (e) 23:00, and (f) 01:00 LST. The plan view of the 1.5° elevation reflectivity factor and ZDR at (g) 20:30 LST, as indicated by the solid black wireframe, and at (h) 21:30 LST, as indicated by the solid black wireframe, where the colored part is ZDR, and the reflectivity factor is marked with black contour lines. Municipal borders are superimposed as black contours.
Atmosphere 13 01564 g005
Figure 6. Time evolution of top, bottom, and strongest shear heights of the mesocyclone in this hailstorm supercell, marked with black dashes, solid blue and solid red lines, respectively. The numbers at the top of the graph are the strongest shear values.
Atmosphere 13 01564 g006
Figure 7. Winds revealed by the Hailing Island wind profile radar from 08:00 on 27 to 00:00 on 28 March (LST). Color is used to divide the wind speed into 8 grades, with 8 different wind speeds represented by the colors in the upper left corner. A long line represents a wind speed of 4 m∙s1, a short line represents 2 m∙s1, and a flag represents 20 m∙s1.
Atmosphere 13 01564 g007
Figure 8. Vertical cross-sections along the black lines given in Figure 5d,e. (a1,a2) ZH (units: dBZ),(b1,b2) radial velocity (units: m∙s−1), (c1,c2) ZDR (units: dB), (d1,d2) CC, and (e1,e2) KDP (units: °/km) observed by Yangjiang radar. Left column, 22:06 LST; right column, 23:00 LST. Vertical cross-sections along the red lines are given in Figure 5d,e. The radial velocity observed by Yangjiang radar at 22:06 (left column) LST and at 23:00 (right column) LST. The left of each figure is the southern end of the cross section.
Atmosphere 13 01564 g008
Figure 9. (a1,a2) Scatter plots of ZDR and ZH at 22:06 and 23:00 LST, respectively. (b1,b2) show the changes in CC with ZH at 22:06 and 23:00 LST, respectively. The median value is marked with a solid red line. Related data are from 1.5° elevation angle.
Atmosphere 13 01564 g009
Figure 10. Time-dependent changes in the ZDR column (blue line), KDP column (red line), and CC (black line) inside the hailstorm. WBZ and −20 °C layer heights are marked with green solid lines, and green dotted lines indicate that the height of CC = 0.8.
Atmosphere 13 01564 g010
Figure 11. A and B represent horizontal winds (arrows) and divergence (shading) of VDRAS reanalysis. (a1a7) At 0.5 km AGL. (b1b7) At 8 km AGL. (c1c7) Vertical cross-sections of winds (arrows) and ZH (shade) along the black lines are given in (a1a7). The vertical velocities are amplified 10 times for visualization.
Atmosphere 13 01564 g011aAtmosphere 13 01564 g011bAtmosphere 13 01564 g011c
Figure 12. A to f represented phase profile. See Figure 11a1–a7 for the location of the section line. The direction of the section line is from bottom (A) to top (B).
Atmosphere 13 01564 g012
Table 1. Main performance indices of YJ-SPOL.
NO. Main VariablesAccuracy
1Wavelength10.8 cm
2Beam width0.95°
3Sea level height105.6 m
4Radial resolution250 m
5Differential reflectivity factor (ZDR)≤0.2 dB
6Differential phase (ΦDP),≤2°
7Specific differential phase (KDP),≤0.2°/km
8Correlation coefficient (CC)≤0.001
Publisher’s Note: MDPI stays neutral with regard to jurisdictional claims in published maps and institutional affiliations.

