Abstract
We report the analysis of nine winter seasons (December, January, February (DJF)) aerosol and lightning data over the Tel-Aviv metropolitan area, Israel’s largest and densest urban region. Hourly averaged aerosol concentrations (PM2.5 and PM10) were obtained from 27 automatic air quality stations operated by the Ministry for Environmental Protection. Lightning data obtained from the Israeli Lightning Detection Network (ILDN) and by the Earth Network Total Lightning Network (ENTLN) for four overlapping seasons showed an irregular pattern, with lower activity during Sunday–Tuesday, and maximum activity on Wednesday and Thursday, but also on Saturday, when less pollution was present. The accepted explanation for the weekend effect is that increased amounts of particles tend to prolong the lifetime of storms and their total lightning amounts and change their intracloud/cloud-to-ground flash ratios. However, our results suggest that lightning is not directly related to the level of ambient pollution, but likely depends on the synergistic effects of desert dust and urban pollution particles in the area that affect the electrical structure of winter thunderstorms. Since the source of desert dust is independent of any regularity that can be attributed to anthropogenic activity (e.g., increased levels of pollution due to the traffic-load in Tel-Aviv), it obscures any weekend–weekday patterns that are often detected in other large metropolitan areas.
1. Introduction
Numerous studies show changes in lightning frequency above and around (especially downwind of) major urban areas compared with their rural surroundings. This may be due to a combination of dynamic factors (wind direction, surface roughness) and thermodynamic ones (instability, aerosol, heat and humidity fluxes) over the built area. A thorough review of the methodologies and data used in evaluating the factors affecting lightning–urban area interactions is given by [1,2] and references therein. Naccarato et al. [3] suggested that both the urban heat island effect (UHI) and pollution play a role in lightning characteristics above the metropolitan area of Sao-Paulo, Brazil. Farias et al. and Bourscheidt et al. [4,5] expanded on [3] work, relying on 11 years of lightning data from the Brazil Lightning Detection Network (BLDN). In the US, Bell et al. [6] reported a weekly cycle in lightning frequency in the south-east of the US, but found only a weak signal over major cities. They reported a clear midweek increase in storm intensity, indicating that increases in aerosol levels lead to the invigoration of storms in regions where convective instability and humidity were high. A similar weekday–weekend difference was reported for the Atlanta, Georgia metropolitan area [7]. In a recent study, Wang et al. [8] showed an increase in lightning activity in Beijing, noting that the response to the concentration of pollutants was not linear, and contributed to the increase in stroke numbers in frontal systems, rather than enlarging the total number of local thunderstorms. Numerical simulations for studying the aerosol effects on deep convective clouds through microphysics were conducted by many groups (see Lim et al., 2011 [9] and references within) and suggest that increased concentrations of ice-phase particles, conducive to charge separation via the non-inductive mechanism, play a major role in the electrical structure and activity of such storms. For example, [10] used a 2D model to simulate the effect of aerosols on the contrast between land and sea thunderstorms, and showed that continental clouds, which contain a larger aerosol concentration and a larger ice mass flux, exhibit 1.5 times more lightning compared with maritime clouds.
This work focuses on winter thunderstorms in central Israel, which are most often produced during the passage of cold fronts of Cyprus Lows [11]. These synoptic scale weather systems are independent of the local conditions over the east coast of the Mediterranean Sea and are usually driven across the sea water by winds in the 500 hPa pressure level. The recorded frequency and nature of Cyprus Lows exhibits inter-monthly variability [12,13]. In an attempt to determine the governing factors of lightning activity in Tel-Aviv, Ziv et al. [14] analyzed 35 different atmospheric predictors and the sea-surface temperature as they related to lightning occurrence. They showed that the intensity of lightning activity in such synoptic scale systems is determined by synoptic scale factors and is mostly affected by thermodynamic factors (4 out of the leading 7), responding exponentially to the thermodynamic factors, particularly to instability. We present here the results of 9 winter seasons (December, January and February (DJF)) to account for the potential effects of urban pollution, through the microphysics of charge separation, on lightning activity in the Tel-Aviv region, possibly manifested in a weekly cycle.
2. Data and Methods
2.1. Region
The Tel-Aviv Metropolitan Area (TAMA) in central Israel is also known as the Gush-Dan urban area and includes 303 localities (cities, town, villages) organized in 3 “rings” centered around the city of Tel-Aviv and resides on the eastern coast of the Mediterranean Sea (mean altitude is +5 m ASL). The integrated urban area of the TAMA is 2291 km2, with a total population of 3.854 million (~44% of the population of Israel, 2017 census). The present research is focused on an area of 900 km2 around central Tel-Aviv (Figure 1). Being the economic center of the country, it experiences heavy traffic loads during morning and evening rush hours, with 5.5 million cars per week passing through the Tel-Aviv Metropolitan Area via the Ayalon Freeway (851,000 daily average, 543,000 on Saturday). All the main train lines connecting the north and south of Israel pass through Tel-Aviv Central, and it also hosts the Ben-Gurion International Airport, with hundreds of flights per day (with a minimum on the weekend, due to the grounding of all Israeli airlines by national regulation).
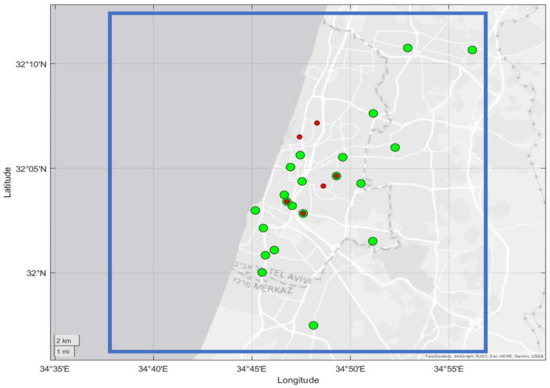
Figure 1.
Research area of the Tel-Aviv metropolitan area and air-monitoring stations used in the present study. During the research period, there were 21 active monitoring stations with continuous PM2.5 records (green dots) and only 6 with PM10 records (red).
2.2. Lightning Data
Since lightning in the Eastern Mediterranean is mostly prevalent during winter months [15,16], we concentrated our search for a weekend effect in thunderstorms occurring during December, January and February (DJF). Precipitation data were obtained from the Israeli Meteorological Service (Ministry of Transportation ims.data.gov.il) and the Ministry of Agriculture Agrometro (meteo.co.il) rain-gauge networks. Lightning data for the periods September 2004–December 2010 and October 2018–March 2020 were obtained from The Israeli Electrical Corporation (ILDN), which is based on 11 LPATS and impact sensors, described in studies by Yair et al. [17]. This data accounts for 9 winter seasons (2004/2005–2009/2010 and 2017/2018–2019/2020). The ILDN only detects cloud-to-ground (CG) strokes and ordinarily does not register intracloud (IC) flashes, and supplies information on time, location, peak current and flash polarity. An additional source was the new Israeli Total Lightning Network (ITLN), which is part of the global ENTLN (Earth Networks Total Lightning Network; Liu and Heckman [18]), that operates 5 sensors in Israel since January 2018; thus, the number of seasons included in the present analysis was limited to 5. This network detects both CG and IC flashes, and thus, gives a more credible account of days when lightning occurred within the study area. The availability of lightning data are presented in Table A1 in the Appendix A.
2.3. Aerosol Data
We obtained aerosol mass loading data (PM2.5 and PM10 in µg/m3) observed by the Israeli Ministry for Environmental Protection air quality monitoring network (http://www.svivaaqm.net/Default.rtl.aspx; accessed 15 September 2021). This network registered hourly values and daily averages of various gasses and pollutants. The national network operates more than 150 stations in the entire country; within the defined region of interest, we selected 21 stations that had the best continuous record of PM2.5 mass concentrations, and 6 that had PM10 data. The stations within the Tel-Aviv Metropolitan Area that were used in this study are presented in Figure 1. The aerosol sensors operated by the Ministry’s network are from the Continuous Particulate Monitor (CPM) model FH 62 C14 by Thermo Scientific. More information is readily available at the manufacturer’s website.
It should be noted that since Israel is located very close to major deserts (Sahara, Sinai Peninsula, Saudi Arabia), there are frequent dust intrusions that lead to a high background average concentration of aerosols, creating a mixture of urban pollution and natural dust. This is a seasonal feature that had been thoroughly researched and is most frequent in spring and fall, but also occurs in the winter months [15]. The data were averaged over 809 days, after excluding 98 days when dust storms were present. The threshold for considering a dusty day was 200 µg m−3, but other values were also considered, with no significant differences in the number of days. The minimum values presented in Figure 2 mark the Jewish Sabbath, lasting from Friday afternoon until Saturday night. During this period, public transportation (trains, buses) is stopped, Israeli airline companies do not fly out of or into the Ben-Gurion International Airport (which is located within the study area) and commercial activity is mostly shut down. Thus, the amount of urban pollution sources is significantly decreased from Friday noon until early Sunday, even though traffic partly resumes late Saturday evening. This effect was observed by Bierle et al. [16], who noted the peculiar behavior of NOx concentrations in Jerusalem, compared with other major cities in the Levant, reflecting cultural and religious differences.

Figure 2.
Hourly averaged mass loading of PM2.5 (orange, left axis) and PM10 (blue, right axis) particles based on 6 stations within the study area for the period 2018–2022, DJF months only. Integer numbers mark midnight of the day (1 = Sunday) and the solid vertical lines mark the midnight hour. A daily cycle, reflecting traffic loads within the Tel-Aviv Metropolitan Area, is evident with a minimum on the Sabbath (Saturday).
3. Results
The analysis of lightning data included only days during December, January and February (DJF) when there was more than one stroke detected within the region of interest. The arrival in Tel-Aviv of weather systems such as Cyprus Lows—the most prevalent winter-time synoptic condition for generating convective clouds and lightning—do not depend on the weekday. Thus, we would expect a rather flat distribution of lightning days throughout the research period.
The data presented in Figure 3a show that the occurrence of thunderstorms during the study period was distributed randomly along weekdays, with a discernable preference for midweek days compared with weekends, with a clear minimum on Monday–Tuesday. There were equal number of storms on Sunday, Wednesday and Saturday, and only Thursday showed a larger value of occurrences. For the ENTLN for the five winter seasons, the basic traits appear, with a minimum on Monday–Tuesday and a maximum on Thursday, though Saturdays show a weaker occurrence rate (Figure 3b).
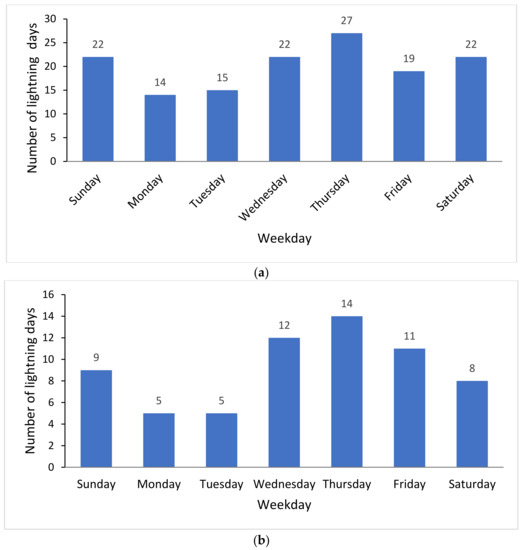
Figure 3.
(a) Weekly distribution of lightning days for the 9 DJF s of the study period, based on 9 winter seasons of ILDN data. (b) Weekly distribution of lightning days for the 5 DJF seasons of 2017/18 and 2021/2022, based on ENTLN data. The lower numbers reflect the shorter period.
Figure 4a shows the total accumulated numbers of cloud-to-ground (CG) strokes detected within the research area based on the ILDN data. While low values appear on Sunday–Tuesday (normal working days in Israel), there were significantly more CG lightning during Wednesday–Thursday and even during the “weekend” period (Friday–mid Saturday), that showed relatively enhanced stroke numbers.
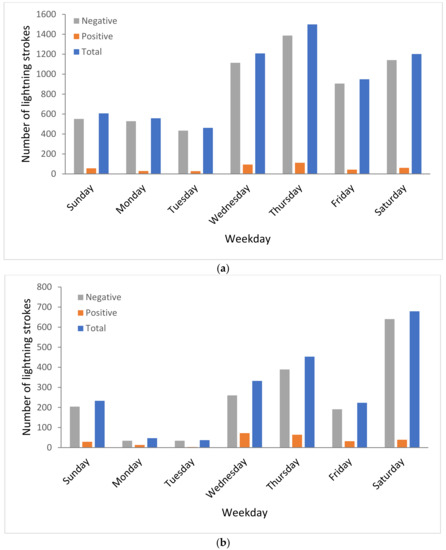
Figure 4.
(a) The weekly distribution of cloud-to-ground strokes (negative, positive, total) detected by the ILDN over the research area for the full study period. (b) The same as (a), based on the ENTLN for the 2017/18 and 2021/22 winter seasons. Note the increased numbers on the Saturday, likely due to contribution of the 4.1.2020 extreme event, studied by Lynn et al. [17].
When calculating the average numbers of strokes per lightning day from the ILDN data base, Sunday presents a minimum of 27.6 strokes per day, while Thursday exhibits the maximum number of 55.5 strokes per day, with Wednesday and Saturday coming second and third, with 54.9 and 54.6 strokes per day, respectively.
Interestingly, the fraction of +CG from the total (percentage) was largest on Sunday and Wednesday, 9.2% and 7.7%, respectively, with a minimum fraction on Friday of 4.5%. The fraction of +CG from the total number of cloud-to-ground strokes in Israel is known to depend on the meteorological conditions [18,19], which differ from month to month, and is highest in December and lowest in January, most likely related to the intensity of wind shear in winter thunderstorms [20]. When looking at the average values of the peak-current for the strokes detected above the Tel-Aviv Metropolitan Area, +CGs are stronger (42 kA) than -CG (15 kA), but no weekly pattern is discernable. This difference in the average current intensity is in line with findings from other places, as reported in [21]. The spatial distribution of lightning within the study area for DJF based on ENTLN data are shown in Figure 5. The coastline is denoted as a black line (north is up). There are clear maxima over the urban area of the greater Tel-Aviv area, with three distinct enhancements located over Jaffa and the Holon-Bat-Yam area, just south of the city center. This offset can be attributed to the interaction between the south-westerly flow from the Mediterranean Sea and the built area, which leads to an enhanced friction and induced convection.
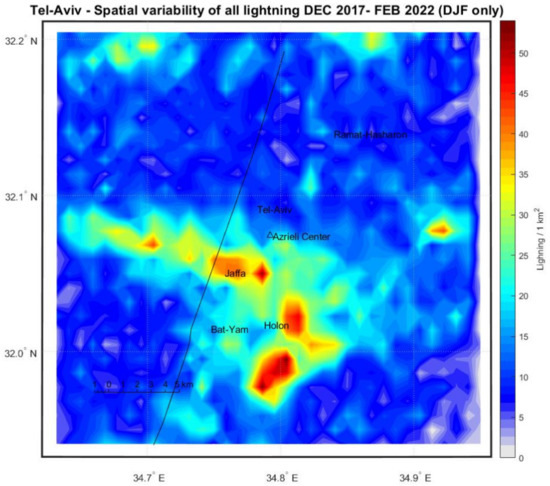
Figure 5.
The spatial distribution of lightning over the study area, based on the ENTLN for the 2017/18 and 2021/22 seasons (5 winters). The Mediterranean Sea is on the left side, and several clear maxima of lightning stroke density are found south of the city center and over peripheral areas.
In order to compare the occurrence days of lightning in Tel-Aviv to other parts on the coastal plain of Israel—which are less urbanized compared with the Tel-Aviv metropolitan area—we defined three equal squares with the same area of 900 km2 and with the same proportion of land/sea coverage of ~60% land, one to the south of Tel-Aviv (the port city of Ashdod) and two to the north (the cities of Netanya 40 km north of Tel-Aviv and Haifa, ~100 km north, that is also major industrial center with Israel’s largest harbor). Figure 6 shows a comparison between the daily numbers of lightning in the four regions for the same research period. As in the case of the 4 January 2020, a storm in Tel-Aviv [20]—a single event on a Friday in the area close to the city of Natanya—generated a local maximum there. However, for the most part, the general trend remains the same, and no weekend minimum is observed.
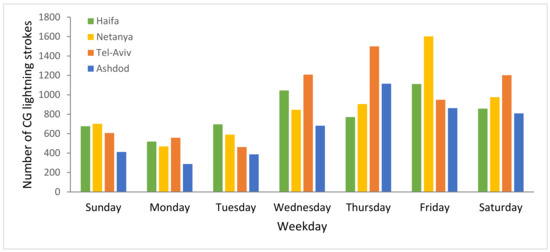
Figure 6.
Cloud-to-ground lightning numbers in each day for Tel-Aviv (red), Haifa (green), Natanya (orange) and Ashdod (blue). A conspicuous minimum is observed on Sunday, Monday and Tuesday in all 4 regions.
The results show that in the three other regions, a conspicuous minimum is clearly observed in the first part of the week, and an enhanced number of lightning strokes are observed in the second part of the week. The effects of single extreme events can affect the maximum amount of lightning in a specific weekday, but the general trend remains.
4. Discussion
The intensity and frequency of lightning activity in the winter months (DJF) on the eastern Mediterranean coast of Israel and above the Tel-Aviv metropolitan area relies on the arrival of cold fronts of Cyprus Lows—the dominant synoptic scale system that produces lightning in this region [22,23]. When searching for the influence of the urban built area on the properties of thunderstorms developing under these meteorological conditions, it was natural to assume that the large urban area of central Israel, with its heat and pollution fluxes, would affect—through changes in cloud microphysics—the electrical activity of these storms. Thus, it can be considered somewhat surprising that no discernible weekday–weekend cycle was detected in lightning activity. We suggest the following explanation for this lack of anthropogenic-induced effect on lightning activity. In a recent paper, [20] showed that the synergistic effects of desert aerosol transported into the eastern Mediterranean with local urban pollution particles contributed to the enhancement of convective activity and lightning. The numerical simulation of this event with the WRF model exemplified this effect by using the factor-separation methodology [24]. This enabled to determine the relative contribution of each type of aerosol, compared with the “clean” (maritime) background.
The case study analyzed by Lynn et al. [17] was based on a severe convective event that occurred in the morning hours of Saturday, 4 January 2020, which resulted in flash floods in southern Tel-Aviv. We note that on the Jewish weekend, which begins on Friday afternoon and terminates on Saturday evening, the ambient levels of urban pollution are supposed to be low (as expected from the weekly cycle of transportation load; Figure 2). However, it may seem that the presence of desert dust in that specific event more than compensated for the supposedly lower PM2.5 concentrations, and led to an increased amount of ice, charging and lightning. We can generalize and conclude that the arrival of Cyprus Lows, and the dust associated with their cold fronts (where lightning activity is most prevalent), is devoid of any dependence of the local pollution. This can explain why lightning activity in winter thunderstorms over Tel-Aviv does not show a well-defined weekly cycle. Another aspect that should be considered is the fact that if the number of aerosols surpasses a certain threshold, this may actually lead to a decrease in lightning activity due to the “boomerang effect” [25]; this is where the competition on water vapor by numerous CCNs leads to the formation of small water droplets and depletes the ice concentration higher up in the thunderstorms, thus, impeding the charge separation and lowering the lightning flash density. This effect was also discovered by Farias et al. [4] over São Paulo (their Figure 6). This possibility further complicates the interplay between dust and pollution and is likely to further obscure any anthropogenic signal in lightning activity over the Tel-Aviv Metropolitan Area.
5. Conclusions
Urban effects on winter lightning activity in the Tel-Aviv, Israel metropolitan area are not as clearly evident as in other major urban areas around the globe, where high pollution levels during weekdays affect cloud microphysics and enhance midweek lightning prevalence by invigorating convection. While the pollution levels in the study area do follow a distinct weekly cycle, in which weekdays show a higher concentration with respect to the weekend, the results from lightning detection networks show—on average—minimum lightning activity during the first part of the week when urban pollution levels are high, contrary to expectation. This is likely the result of the arrival of winter weather systems (Cyprus Lows) that can occur on any given day, and the high ambient concentrations of aerosols due to the proximity to desert sources that may inhibit electrification. The fact that the weekend effect is also missing in other cities along the Mediterranean coast of Israel further supports this conclusion.
Author Contributions
Data curation, M.J. and B.H.L.; Formal analysis, Y.Y.Y.; M.K. and M.J.; Methodology, Y.Y.Y.; Project administration, Y.Y.Y.; Resources, Y.Y.Y. All authors have read and agreed to the published version of the manuscript.
Funding
This research was supported by Israeli Science Foundation collaboration with the Chinese National Science Foundation (ISF-NSFC) grant number 2640/17 and by the Israeli Science Foundation grant number 1848/20.
Institutional Review Board Statement
Not applicable.
Informed Consent Statement
Not applicable.
Data Availability Statement
The PM2.5 and PM10 data can be accessed through the Israeli Ministry of Environmental Protection at: https://svivaaqm.net/ (accessed on 15 September 2021); The ILDN lightning data is proprietary of the Israeli Electrical Corporation. The ENTLN data is available to network members and obtained by request.
Conflicts of Interest
The authors declare no conflict of interest.
Appendix A

Table A1.
Lightning and aerosol data availability.
Table A1.
Lightning and aerosol data availability.
| ENTLN Lightning Stroke Data | ILDN Lightning Stroke Data | Aerosol Data Ministry of Environmental Protection | ||
|---|---|---|---|---|
| 2004 | January | No data | Excluded | |
| February | No data | Excluded | ||
| December | Yes | Yes | ||
| 2005 | January | Yes | Yes | |
| February | Yes | Yes | ||
| December | Yes | Yes | ||
| 2006 | January | Yes | Yes | |
| February | Yes | Yes | ||
| December | Yes | Yes | ||
| 2007 | January | Yes | Yes | |
| February | Yes | Yes | ||
| December | Yes | Yes | ||
| 2008 | January | Yes | Yes | |
| February | Yes | Yes | ||
| December | Yes | Yes | ||
| 2009 | January | Yes | Yes | |
| February | Yes | Yes | ||
| December | No data | Excluded | ||
| 2010 | January | Yes | Yes | |
| February | Yes | Yes | ||
| December | No data | Excluded | ||
| 2011–2017 | No data | Excluded | ||
| 2018 | January | Yes | Yes | Yes |
| February | Yes | Yes | Yes | |
| December | Yes | Yes | Yes | |
| 2019 | January | Yes | Yes | Yes |
| February | Yes | Yes | Yes | |
| December | Yes | Yes | Yes | |
| 2020 | January | Yes | Yes | Yes |
| February | Yes | Yes | Yes | |
| December | Yes | No data | Yes | |
| 2021 | January | Yes | No data | Yes |
| February | Yes | No data | Yes | |
| December | Yes | No data | Yes | |
| January | Yes | No data | Yes | |
| February | Yes | No data | Yes |
References
- Stallins, J.A.; Rose, L.S. Urban Lightning: Current Research, Methods, and the Geographical Perspective. Geogr. Compass 2008, 2, 620–639. [Google Scholar] [CrossRef]
- Rose, L.S.; Stallins, J.A.; Bentley, M.L. Concurrent cloud-to-ground lightning and precipitation enhancement in the Atlanta, Georgia (United States), urban region. Earth Interact. 2008, 12, 1–30. [Google Scholar] [CrossRef]
- Naccarato, K.P.; Pinto, O., Jr.; Pinto, I.R.C.A. Evidence of thermal and aerosol effects on the cloud-to-ground lightning density and polarity over large urban areas of Southeastern Brazil. Geophys. Res. Lett. 2003, 30, 1674. [Google Scholar] [CrossRef]
- Farias, W.; Pinto, O.; Naccarato, K.; Pinto, I. Anomalous lightning activity over the Metropolitan Region of São Paulo due to urban effects. Atmos. Res. 2009, 91, 485–490. [Google Scholar] [CrossRef]
- Bourscheidt, V.; Pinto, O.; Naccarato, K.P. The effects of Sao Paulo urban heat island on lightning activity: Decadal analysis (1999–2009). J. Geophys. Res. Atmos. 2016, 121, 4429–4442. [Google Scholar] [CrossRef]
- Bell, T.L.; Rosenfeld, D.; Kim, K.-M. Weekly cycle of lightning: Evidence of storm invigoration by pollution. Geophys. Res. Lett. 2009, 36, L23805. [Google Scholar] [CrossRef]
- Stallins, J.A.; Carpenter, J.; Bentley, M.L.; Ashley, W.S.; Mulholland, J.A. Weekend–weekday aerosols and geographic variability in cloud-to-ground lightning for the urban region of Atlanta, Georgia, USA. Reg. Environ. Change 2012, 13, 137–151. [Google Scholar] [CrossRef]
- Wang, Y.; Lu, G.; Shi, T.; Ma, M.; Zhu, B.; Liu, D.; Peng, C.; Wang, Y. Enhancement of Cloud-to-Ground lightning activity caused by the urban effect: A case study in the Beijing Metropolitan Area. Remote Sens. 2021, 13, 1228. [Google Scholar] [CrossRef]
- Lim, K.-S.S.; Hong, S.-Y.; Yum, S.S.; Dudhia, J.; Klemp, J.B. Aerosol effects on the development of a supercell storm in a double-moment bulk-cloud microphysics scheme. J. Geophys. Res. 2011, 116, D02204. [Google Scholar] [CrossRef]
- Shi, Z.; Tan, Y.B.; Tang, H.Q.; Sun, J.; Yang, Y.; Peng, L.; Guo, X.F. Aerosol effect on the land-ocean contrast in thunderstorm electrification and lightning frequency. Atmos. Res. 2015, 164–165, 131–141. Atmos. Res. 2015, 164–165, 131–141. [Google Scholar] [CrossRef]
- Altaratz, O.; Levin, Z.; Yair, Y.; Ziv, B. Lightning activity over land and sea on the eastern coast of the Mediterranean. Mon. Wea. Rev. 2003, 131, 2060–2070. [Google Scholar] [CrossRef]
- Alpert, P.; Neeman, B.U.; Shay-El, Y. Inter-monthly variability of cyclone tracks in the Mediterranean. J. Clim. 1990, 3, 1474–1478. [Google Scholar] [CrossRef]
- Alpert, P.; Neeman, B.U.; Shay-El, Y. Climatological analysis of Mediterranean cyclones using ECMWF data. Tellus A Dyn. Meteorol. Oceanogr. 1991, 42, 65–77. [Google Scholar] [CrossRef]
- Ziv, B.; Saaroni, H.; Yair, Y.; Ganot, M.; Baarad, H.; Isaschari, D. Atmospheric factors governing winter thunderstorms in the coastal regions of the eastern Mediterranean. Theor. Appl. Clim. 2008, 95, 301. [Google Scholar] [CrossRef]
- Ganor, E.; Osetinsky, I.; Stupp, A.; Alpert, P. Increasing trend of African dust, over 49 years, in the eastern Mediterranean. J. Geophys. Res. 2010, 115, D07201. [Google Scholar] [CrossRef]
- Beirle, S.; Platt, U.; Wenig, M.; Wagner, T. Highly resolved global distribution of tropospheric NO2 using GOME narrow swath mode data. Atmos. Chem. Phys. 2004, 4, 1913–1924. [Google Scholar] [CrossRef]
- Lynn, B.H.; Yair, Y.; Shpund, J.; Levy, Y.; Qie, X.; Khain, A. Using factor separation to elucidate the respective contributions of desert dust and urban pollution to the January 4th 2020, Tel Aviv lightning and flash flood disaster. J. Geophys. Res. 2020, 125, 24. [Google Scholar] [CrossRef]
- Yair, Y.; Levin, Z.; Altarazt, O. Lightning phenomenology in the Tel-Aviv area from 1989 to 1996. J. Geophys. Res. 1998, 103, 9015–9025. [Google Scholar] [CrossRef]
- Liu, C.; Heckman, S. The application of total lightning detection and cell tracking for severe weather prediction. In Proceedings of the 91st American Meteorological Society Annual Meeting, Seattle, WA, USA, 23–27 January 2011. [Google Scholar]
- Levin, Z.; Yair, Y.; Ziv, B. Positive cloud-to-ground flashes and wind shear in Tel-Aviv thunderstorms. Geophys. Res. Lett. 1996, 23, 2231–2234. [Google Scholar] [CrossRef]
- Rakov, V.; Uman, M. Lightning: Physics and Effect; Cambridge University Press: Cambridge, UK, 2003. [Google Scholar] [CrossRef]
- Shalev, S.; Saaroni, H.; Izsak, T.; Yair, Y.; Ziv, B. The spatiotemporal distribution of lightning over Israel and the neighboring area and its relation to regional synoptic systems. Nat. Hazards Earth Syst. Sci. 2011, 11, 2125–2135. [Google Scholar] [CrossRef]
- Ben-Ami, Y.; Altaratz, O.; Yair, Y.; Koren, I. Lightning characteristics in Eastern Mediterranean thunderstorms during different synoptic systems. Nat. Haz. Earth Syst. Sci. 2015, 15, 2449–2459. [Google Scholar] [CrossRef]
- Stein, U.; Alpert, P. Factor separation in numerical simulations. J. Atmos. Sci. 1993, 50, 2107–2115. [Google Scholar] [CrossRef]
- Altaratz, O.; Koren, I.; Yair, Y.; Price, C. Lightning response to smoke from Amazonian fires. Geophys. Res. Lett. 2010, 37, L07801. [Google Scholar] [CrossRef]
Publisher’s Note: MDPI stays neutral with regard to jurisdictional claims in published maps and institutional affiliations. |
© 2022 by the authors. Licensee MDPI, Basel, Switzerland. This article is an open access article distributed under the terms and conditions of the Creative Commons Attribution (CC BY) license (https://creativecommons.org/licenses/by/4.0/).