1. Introduction
Benefiting by advancements in modern-day means of transportation and mass media, global travel and tourism have been firmly growing the past years, consolidating the tourism sector as a key driver in economic development. In 2019, the last year before the start of the COVID-19 pandemic, international tourist arrivals reached 1460 million, which is a 4% increase over 2018 [
1]. In Europe alone, international tourist arrivals in 2019 reached 744 million, almost 51% of the world’s total, which is a remarkable 4% increase compared to 2018 [
1]. The travel and tourism industry have been steadily flourishing, generating jobs and accounting for about 10% of the global Gross Domestic Product (GDP) [
2]. At the same time, the subset of winter tourism and the ski industry, although relatively stagnant for the past 15 years, account for an approximate 400 million skier visits worldwide [
3].
Greece is widely recognized for its well-developed tourism sector, attracting ca 30 million of tourists every year and being a famous destination especially for beach and cultural recreation. This picture is validated by the total contribution of the tourism sector to the national GDP, which in 2019 reached 20.7% [
2]. Furthermore, about one fifth of all employment in Greece is based on travel and tourism, which is equivalent to 819,800 jobs. All the above indicate that not only this sector of the economy has recovered from the 2008 financial crisis, but it is also exceeding its previous peaks, playing a vital role in the well-being of the Greek economy.
The Greek landscape, being virtually 80% mountainous and with many mountain peaks reaching above 1500 m, carries a significant capability also for the development of the ski industry. However, although ski resorts have been present in Greece from the mid-20th century, ski tourism has been a priority in the development agenda of the local authorities or the government only during the last decade [
4,
5]. There are 22 ski resorts with five lifts or more, attracting about 800,000 total skier visits on average per year [
3], with most of the latter (ca 90%) being dominated by the domestic market. Therefore, ensuring high visitation, in line with the development and modernization of the existing ski resorts, assisted by proximity to seaside attractions, can be the course of action for the rejuvenation and growth of the ski industry and local economies.
Tourism in general is highly sensitive to weather and climate variability [
6,
7,
8,
9]. This is especially true for skiing tourism since the latter is directly dependent on the available climatic resources (snow reliability, wind, precipitation, and temperature conditions). The 6th Assessment Report of the Intergovernmental Panel for Climate Change (IPCC) concludes that there is a significant reduction in North Hemisphere snowfall events and snow cover extent from 1950, coinciding with increasing temperatures especially during late spring [
10]. These changes are further amplified in high altitude mountain regions through various mechanisms and feedbacks [
11,
12,
13]. The decreases in snow cover are projected to continue in the 21st century [
10], making the skiing industry the most directly and immediately affected tourism type by climate change.
There has been a multitude of studies in various countries, addressing the relationship of climate and/or climate change to the ski industry. This growing body of literature can be classified in five separate categories [
14]:
- (i)
Sensitivity of ski tourism to the weather and/or snow conditions;
- (ii)
Impacts of climate change (either historical or future projections) to the season length and ski operations;
- (iii)
Assessment of climate change supply and demand-side impacts through econometric approaches;
- (iv)
Perceptions of the ski industry concerning climate change risk and their suggested response measures;
- (v)
Tourists’ weather preferences and climate change perceptions mainly conducted through on-site surveys.
A subcategory of the latter type of studies is the construction and/or application of climate indices which can describe the climatic suitability and comfort degree of a tourist area. The purpose of the current work is related to this latter type of study. Its main objective is to create a climatic comfort index for skiing conditions, which is ultimately generated through the tourists’ own weather preferences. People’s preferences can be a key factor to comprehending the preferences of the tourist regarding the climatic conditions of the area they wish to visit [
15,
16]. As relevant focused research in the tourism literature is rather limited so far (see for example [
17,
18,
19,
20,
21]) and comprises very few quantitative tools for measuring the climatic suitability of ski resorts, our research work aims to provide further input on the weather preferences of tourists for skiing tourism. This, combined with climate projections, can assist the assessment of future climate change risks for this type of tourist activity and decisions on adaptation measures both by skiers and the ski industry.
2. A Review of Climate Indices
It is widely accepted that the ongoing climate crisis is going to, if not already, have a sizeable negative impact on the ski tourism industry [
14] This is because winter conditions in mountainous areas, and thus the related winter tourism activities, will be affected to a greater extent in comparison to other environments [
22,
23,
24]. Climate change represents a significant threat to the profitability and sustainability of ski tourism due to increased snowfall variability, increased snowmaking requirements, and decreased ski season length [
14].
Ski tourism has been the focus of much attention in tourism and climate change literature [
24,
25]. To assess spatial and temporal climate suitability of a tourist area, both in the current and future climate, appropriate climate indices have been proposed.
The first comprehensive and easy-to-use ‘Tourism Climatic Index’ (TCI) was proposed in the 1980s [
26]. The TCI combines seven different meteorological variables, shown in Equation (1), into one single climate index for general tourism activities (such as sightseeing, shopping, etc.), taking values from 1% to 100%:
where CID is daytime comfort, merging mean monthly maximum temperature (in °C) and mean monthly minimum relative humidity (in %); CIA is daily comfort, merging mean monthly temperature (in °C) and mean monthly relative humidity (in %); P is total monthly precipitation (in mm); S is daily sunshine (hours); and W is monthly average wind speed (in km/h). The relative weights of the variables were based on the author’s personal experience and were not validated against tourists’ stated preferences or visitation data.
Despite its ease of use, the TCI has certain limitations with the most significant being the arbitrariness of the weights used. Moreover, the TCI cannot be customized to diverse tourism types, such as beach or skiing tourism. Even though the TCI or a slightly modified version of it has been widely applied to different regions in the world (see for example [
16,
27,
28,
29,
30,
31,
32,
33,
34]), it has received much criticism with studies contradicting its reliability, mainly due to the subjectiveness of the weighting scheme and the temporal resolution used [
35,
36].
To better represent climate suitability of tourist destinations, de Freitas [
8] observed that individuals respond to the integrated, combined effects of weather elements and not to climatic averages, and identified three distinct facets of climate that are relevant to tourism: (a) thermal, mainly physiological in nature and related to the thermal comfort experienced by the tourist (air temperature, solar radiation, etc.); (b) physical, reflecting the annoyance level and the suitability of a weather profile for a given activity (rain, snow, wind, etc.); and (c) aesthetic, covering the psychological part and the quality of the tourist experience (sunshine, cloudiness, visibility, etc.). Based on this, Scott et al. performed an ex situ survey of undergraduate students from three different countries via questionnaires to record their own stated weather preferences [
37].
Another ex situ survey-based study [
38], starting from the premise that tourists do not prefer a specific ideal temperature but rather a range of temperatures, attempted to extract the climatic thresholds of tourist weather preferences in the Mediterranean region (beach and urban tourism) by using a sample of university students from central and northern Europe.
De Freitas et al. [
36] extended a previous work [
8] and developed the CIT (Climate Index for Tourism) index which uses daily data and incorporates all three aspects of climate effects [
8] but also an overriding scheme where when the physical threshold P (i.e., rain, wind) is exceeded, then the latter overrides the thermal (T) and aesthetic (A) components. The CIT index was validated with self-reported tourist satisfaction, but respondents were mostly from a quite narrow segment of the tourist market (i.e., young adults).
To improve the CIT index, the ‘Modified Climate Index for Tourism’ (MCIT) was proposed [
39], introducing three fundamental changes compared to the CIT, namely visibility and “significant weather” (e.g., rain, lightning, hail, and snow) that can hinder the tourists’ experience were added to the index, while sunshine and clouds were removed. The MCIT has three scores (i.e., unsuitable, marginal, and ideal) and is based on increased temporal resolution (hourly) data.
A different approach is employed in the ‘Climate Tourism Information Scheme’ (CTIS), which is based on climate thresholds and provides all-season frequency classes and frequencies of extreme weather events on a 10-day or monthly time scale [
40,
41]. Matzarakis et al. (2012) [
41] applied the CTIS scheme for three locations of different altitude (i.e., Salzburg airport at 430 m, Rauris at 934 m, and Sonnblick at 3109 m above sea level) in Austria during the different months of the year, without focusing on a particular form of tourism (e.g., skiing tourism).
Other researchers proposed the ‘Tourism Climate Comfort Index’ (TCCI) to assess tourist comfort in several locations in Serbia, including some mountainous ones up to an altitude of 1038 m [
42]. The TCCI uses monthly values of variables such as mean, maximum and minimum air temperature, insolation, relative air humidity and the number of rainy days, but does not consider the particularities of different forms of tourism.
To assess climate comfort mainly for urban and beach tourism, the ‘Holiday Climate Index’ (HCI) was developed [
35]. The index features the overriding feature of physical variables, originally conceptualized by previous research [
8], and uses a weighting system based on the tourists’ stated climatic preferences. Scott et al. (2016) [
35] applied the HCI to some European cities and compared the results with the ones using the TCI index, and found that the HCI leads to a higher climate comfort than the TCI, particularly in shoulder seasons and the winter months, which is more consistent with observed visitation patterns. Furthermore, a mathematically optimized HCI index for beach tourism based on visitation data from Canadian beaches was recently developed [
43], resulting in a stronger fit to observation data on visitors and to a much higher weight for the thermal comfort facet of the index compared to the TCI and the HCI: beach (75% in the optimized index against 50% and 20% in the TCI and HCI: beach, respectively).
The ‘Mediterranean Outdoor Comfort Index’ (MOCI) was constructed and applied to assess climate comfort for beach tourism in Italy [
44]. The MOCI is an empirical index determined through a survey of tourists who were asked to rate their thermal perception by using the ASHRAE seven-point scale (from −three/cold to three/warm) and provide information related to age, gender, clothing, level of activity, etc. This index however exhibits limitations since it is aimed only at the local population of the Mediterranean region.
The industry’s sensitivity to climate change though is decreasing fast during the last two decades due to the wide use of snowmaking infrastructure [
45]. It has been shown [
46] that Swiss ski areas with 30% of ski slopes with snow-making facilities have a 39% lower sensitivity of skier visits to natural snow depth compared to ski areas without. However, this adaptation measure comes with significant adverse environmental impacts and high costs as it requires increased quantities of water and electricity, and requires low background temperature for optimal performance, challenges which are expected to increase in a warming environment with consequent repercussions to ski lift ticket prices [
47].
Although research and survey-based reviews have shed some light on the potential climate change impacts on the skiing industry and the general preferences of tourists visiting ski resorts, very few quantitative measures in the form of a skiing climate index have been proposed so far to connote the climate suitability of skiing locations. A recent study [
21] developed the Ski Climate Index (SCI) for Turkish ski resorts, which is based on fuzzy logic and combines two facets related to tourist satisfaction, namely snow reliability (i.e., number of days with sufficient snow depth for downhill skiing during the winter tourism season from December 1 to March 31) and non-snow components related to aesthetics and comfort (i.e., sunshine, wind, temperature, and humidity). Though, the actual weather preferences of skiers were not explored in developing the SCI, but instead comfort values and thresholds derived from previous studies of a rather theoretical origin, while the combination of the different facets in the SCI was also not end-user driven. Another very recent research [
48] proposed a function for measuring the monthly attractiveness of different regions for various snow-related activities, which combines snow cover and temperature as continuous functions of a snow index and a temperature index, as well as the attractiveness of each month for holidays. This function was then connected to overnight stays, and the whole model was calibrated with observed visitation data in ski areas in Europe. Again, the preferences of skiers were not considered in the attractiveness function.
Responding to the gaps mentioned above, the current study aims to construct an empirical index for measuring the climatic suitability of destinations for snow-related activities based on the stated climatic preferences of skiers, deriving through in situ filling of questionnaires at a large ski resort in southern Europe (namely on Mount Parnassos in Greece). As input to questionnaires was heavily skewed to Greek nationals, the index constructed is mostly indicative of the thermal perceptions of the Greek population and might differ slightly from the perceptions of other ethnicities. Moreover, the ski resort examined is in Greece, a southern European country with usually mild winters and limited natural snow availability, and this may significantly affect the skiers’ weather perceptions and consequently the analytical form of the index which is based on them.
3. Methods
3.1. In Situ Survey
The basic data utilized for the construction of an index suitable for describing the skiing conditions in the current study have been obtained through an on-site survey of skiers on the ski resort of Mount Parnassos in Greece.
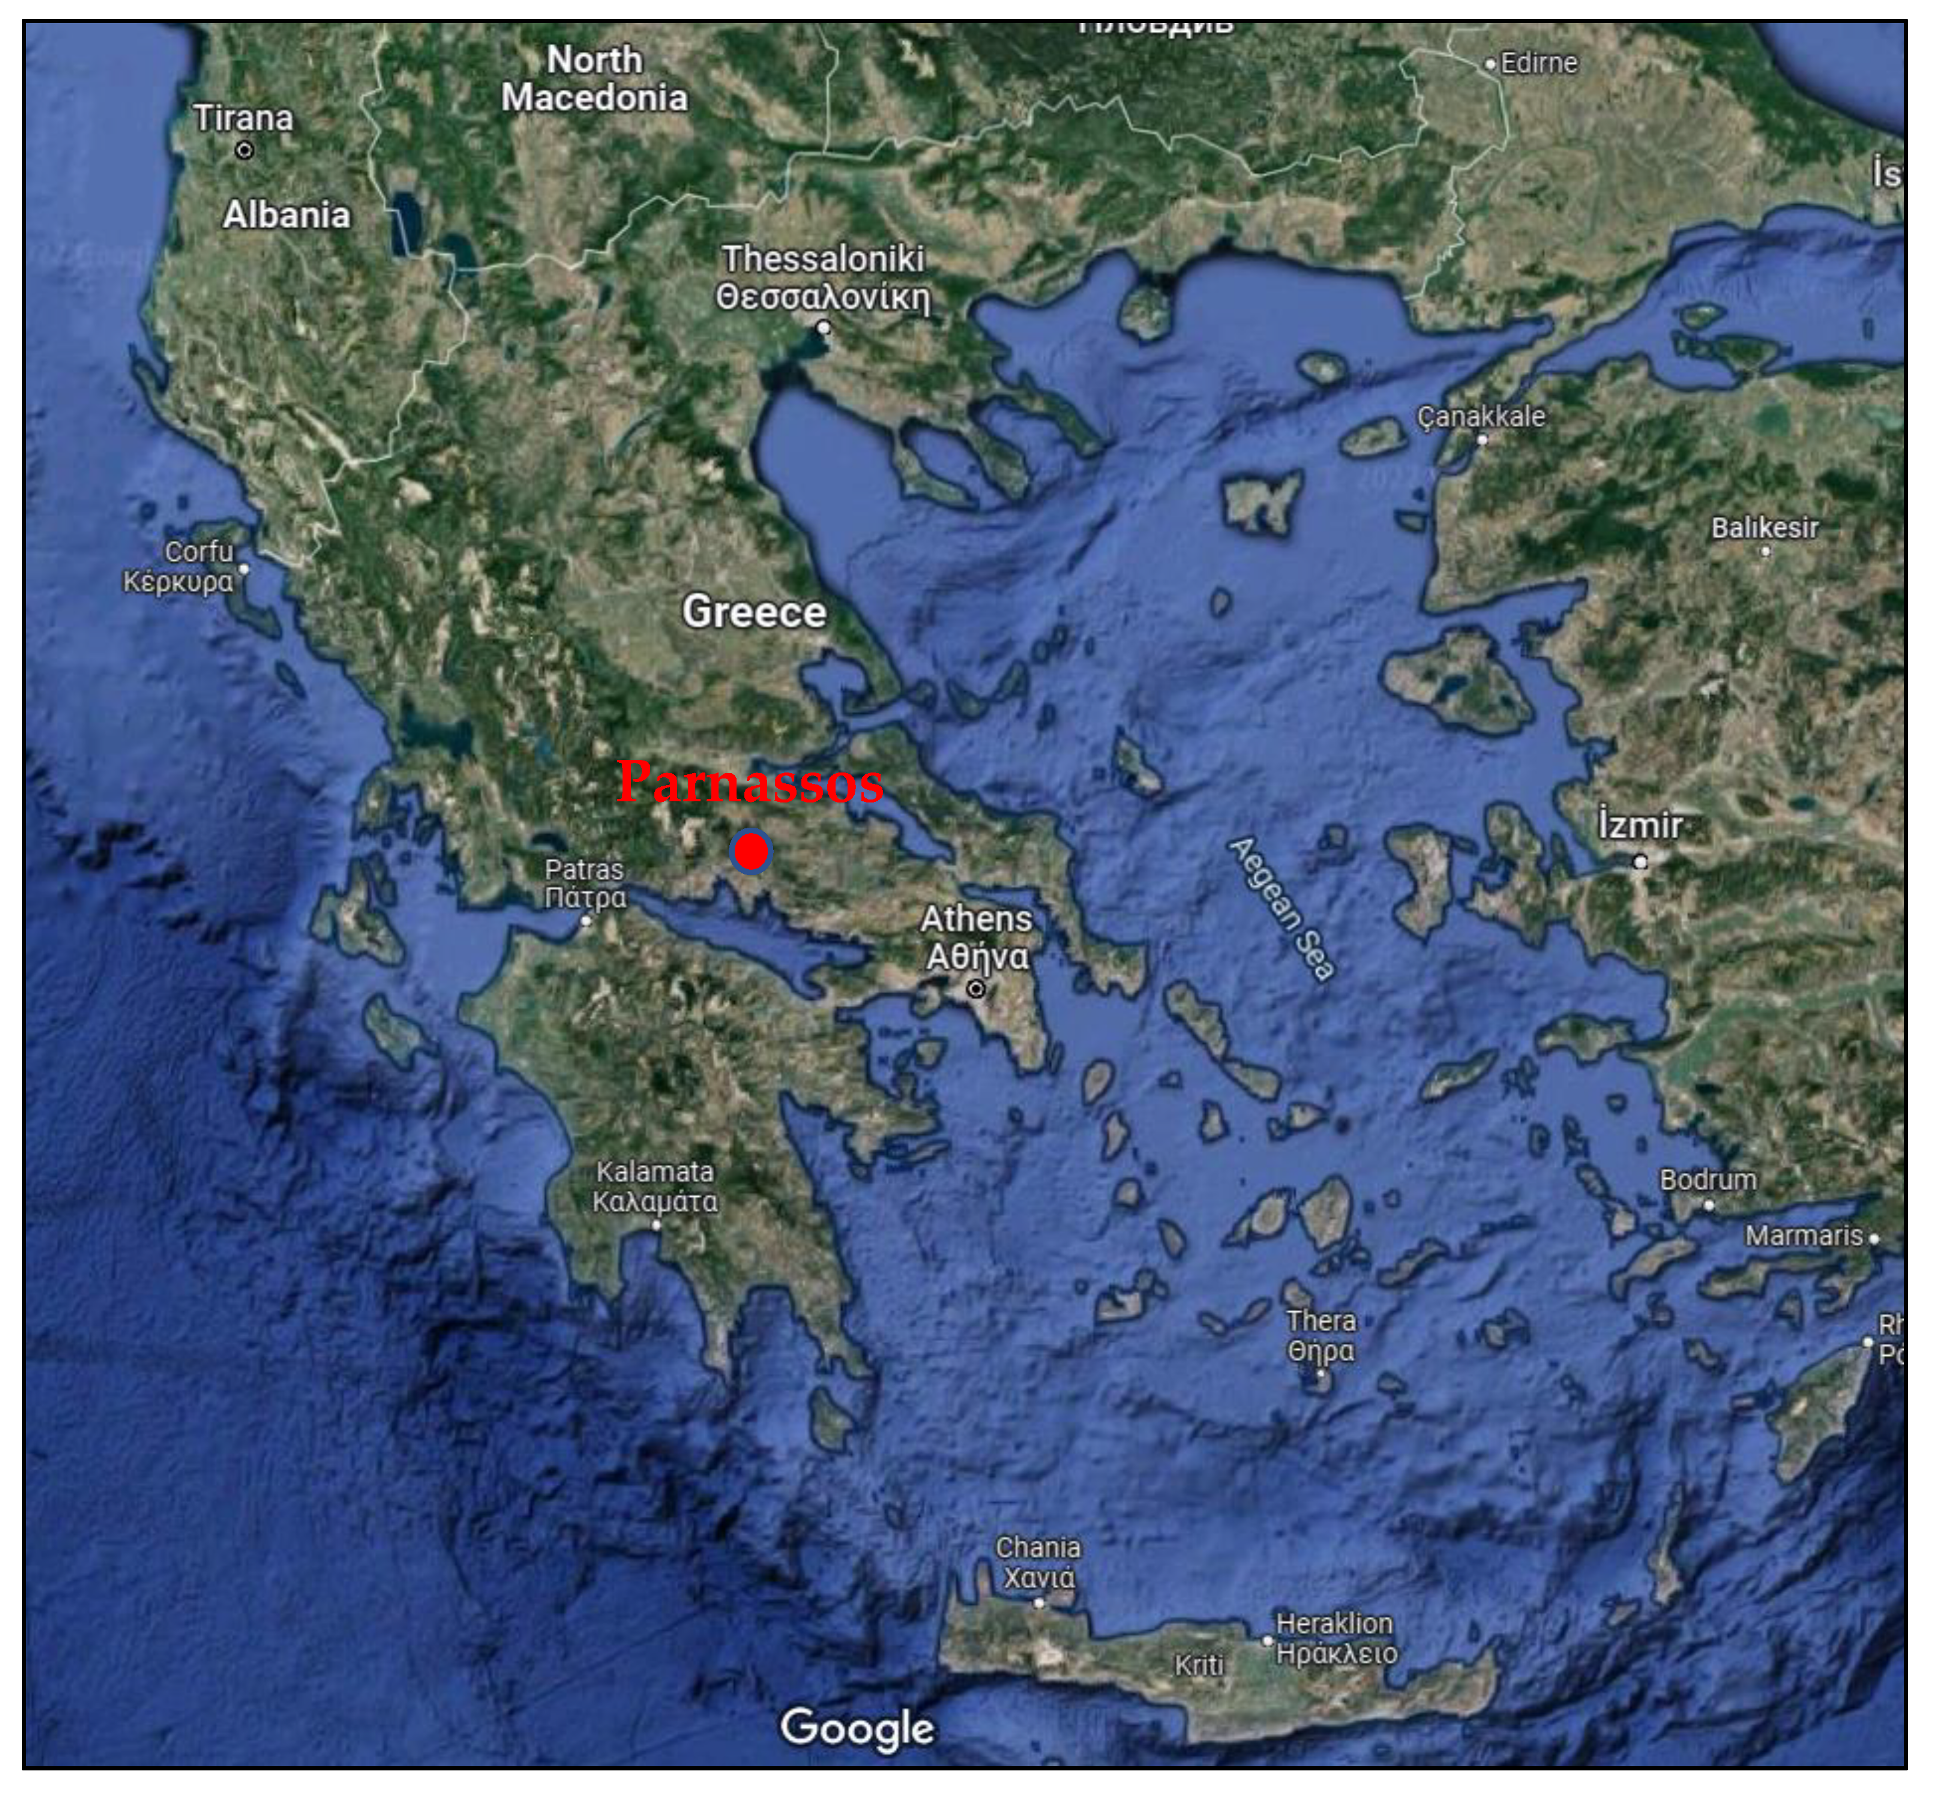
The Mount Parnassos ski resort is the oldest, largest and one of the most technologically advanced ski resorts in Greece, with over 23 skiing slopes at altitudes of 1640–2260 m. The ski resort is in a highly advantageous region, near many cities and most importantly to the capital city of Athens (
Figure 1). The resort is easily accessible by car or bus and features 17 ski lifts, food services, ski equipment rentals and skiing schools, while it does not apply snowmaking. This ski resort was selected due to its popularity and increased number of available respondents as well as its easy accessibility.
The survey was carried out within a 3-day period in March 2019. A total of 111 valid and fully answered questionnaires were collected at the main lodge at an altitude of 1950 m above mean sea level. It is noted that many skiers initially approached claimed they were too tired or pressed for time to respond.
The questionnaire comprised 35 questions in total and was organized in five different sections covering: (i) general information (i.e., nationality, gender, age, level of education etc.); (ii) travel experience in Greece (i.e., factors for choosing the specific ski resort, number of days scheduled to spend there, snow-related activities exercised and their level of skill, etc.); (iii) weather perceptions related to winter tourism (i.e., preferred ideal and unacceptable values or range of values with respect to temperature, snowfall, windiness, cloud cover, etc.); (iv) weather, skiing and travel plans (i.e., preferable adaptation and mitigation techniques of the respondents in unacceptable weather scenarios); and (v) weather at the country of origin to test the presence or not of the so-called ‘backyard hypothesis’ [
49], namely the pattern when the demand is not only affected by weather at the ski area but also by weather at the area from where the tourist comes from.
3.2. Approach to Assess the Climatic Suitability of a Snow-Related Tourism Destination
When constructing a climate index, the choice of climate variables that are most relevant to climate comfort is of primary importance, together with the weights associated with each variable. In this, one should consider that the climatic variables selected to form part of the climate index need to be well understood and gauged by the survey respondents. For example, regarding temperature, the respondents often ask clarifications on whether we refer to the mean, minimum or maximum temperature, the temporal resolution to be considered (i.e., during skiing hours, daily, monthly, etc.), and whether we refer to ambient observed temperature or to human-perceived equivalent temperature (including also relative humidity). It is noted that the choice of the temporal resolution of the data to be used needs to be commensurate with the weather variability observed.
In the approach presented here, the most essential climate variables for snow-related tourism were selected, namely snowfall duration, ambient air temperature, wind speed, and cloudiness. Of the remaining possible weather elements to be considered, snowstorm, fog, and snow depth are either covered by snowfall duration and wind speed or are not easily and accurately gauged by the average skier.
The selected weather variables are utilized to construct a Ski Utility Index (SUI) in the form of a utility function which is ultimately a non-unit measure of a tourism destination’s suitability for snow-related activities. The values of the utility function range from 0 to 100, with 0 representing the unacceptable and 100 the ideal climatic conditions for skiing. It is noted that when referring to ‘skiing’ in the current study, we imply all snow-related winter sports that may be performed at a ski resort. A separate (partial) utility function was developed for each of the four weather variables selected (i.e., snowfall duration, air temperature, wind speed, and cloudiness) and then, these separate functions were combined with the corresponding variables’ weights into the SUI, which reflects the overall climatic suitability of a skiing destination.
3.3. Utility Functions of Climate Variables
Ideally, to construct a utility function for a climate variable one should collect empirical data (e.g., through interviews) on the comparative comfort level for tourists at different levels of this variable and derive a functional relation of comfort with the value of the variable. Such a relation is in general non-linear, and its specific form would require a large amount of data. A first approximation in this case is to assume a linear relation with cut-off in the range of validity [
50]. The procedure followed for the construction of the four utility functions based on this approximation is given next.
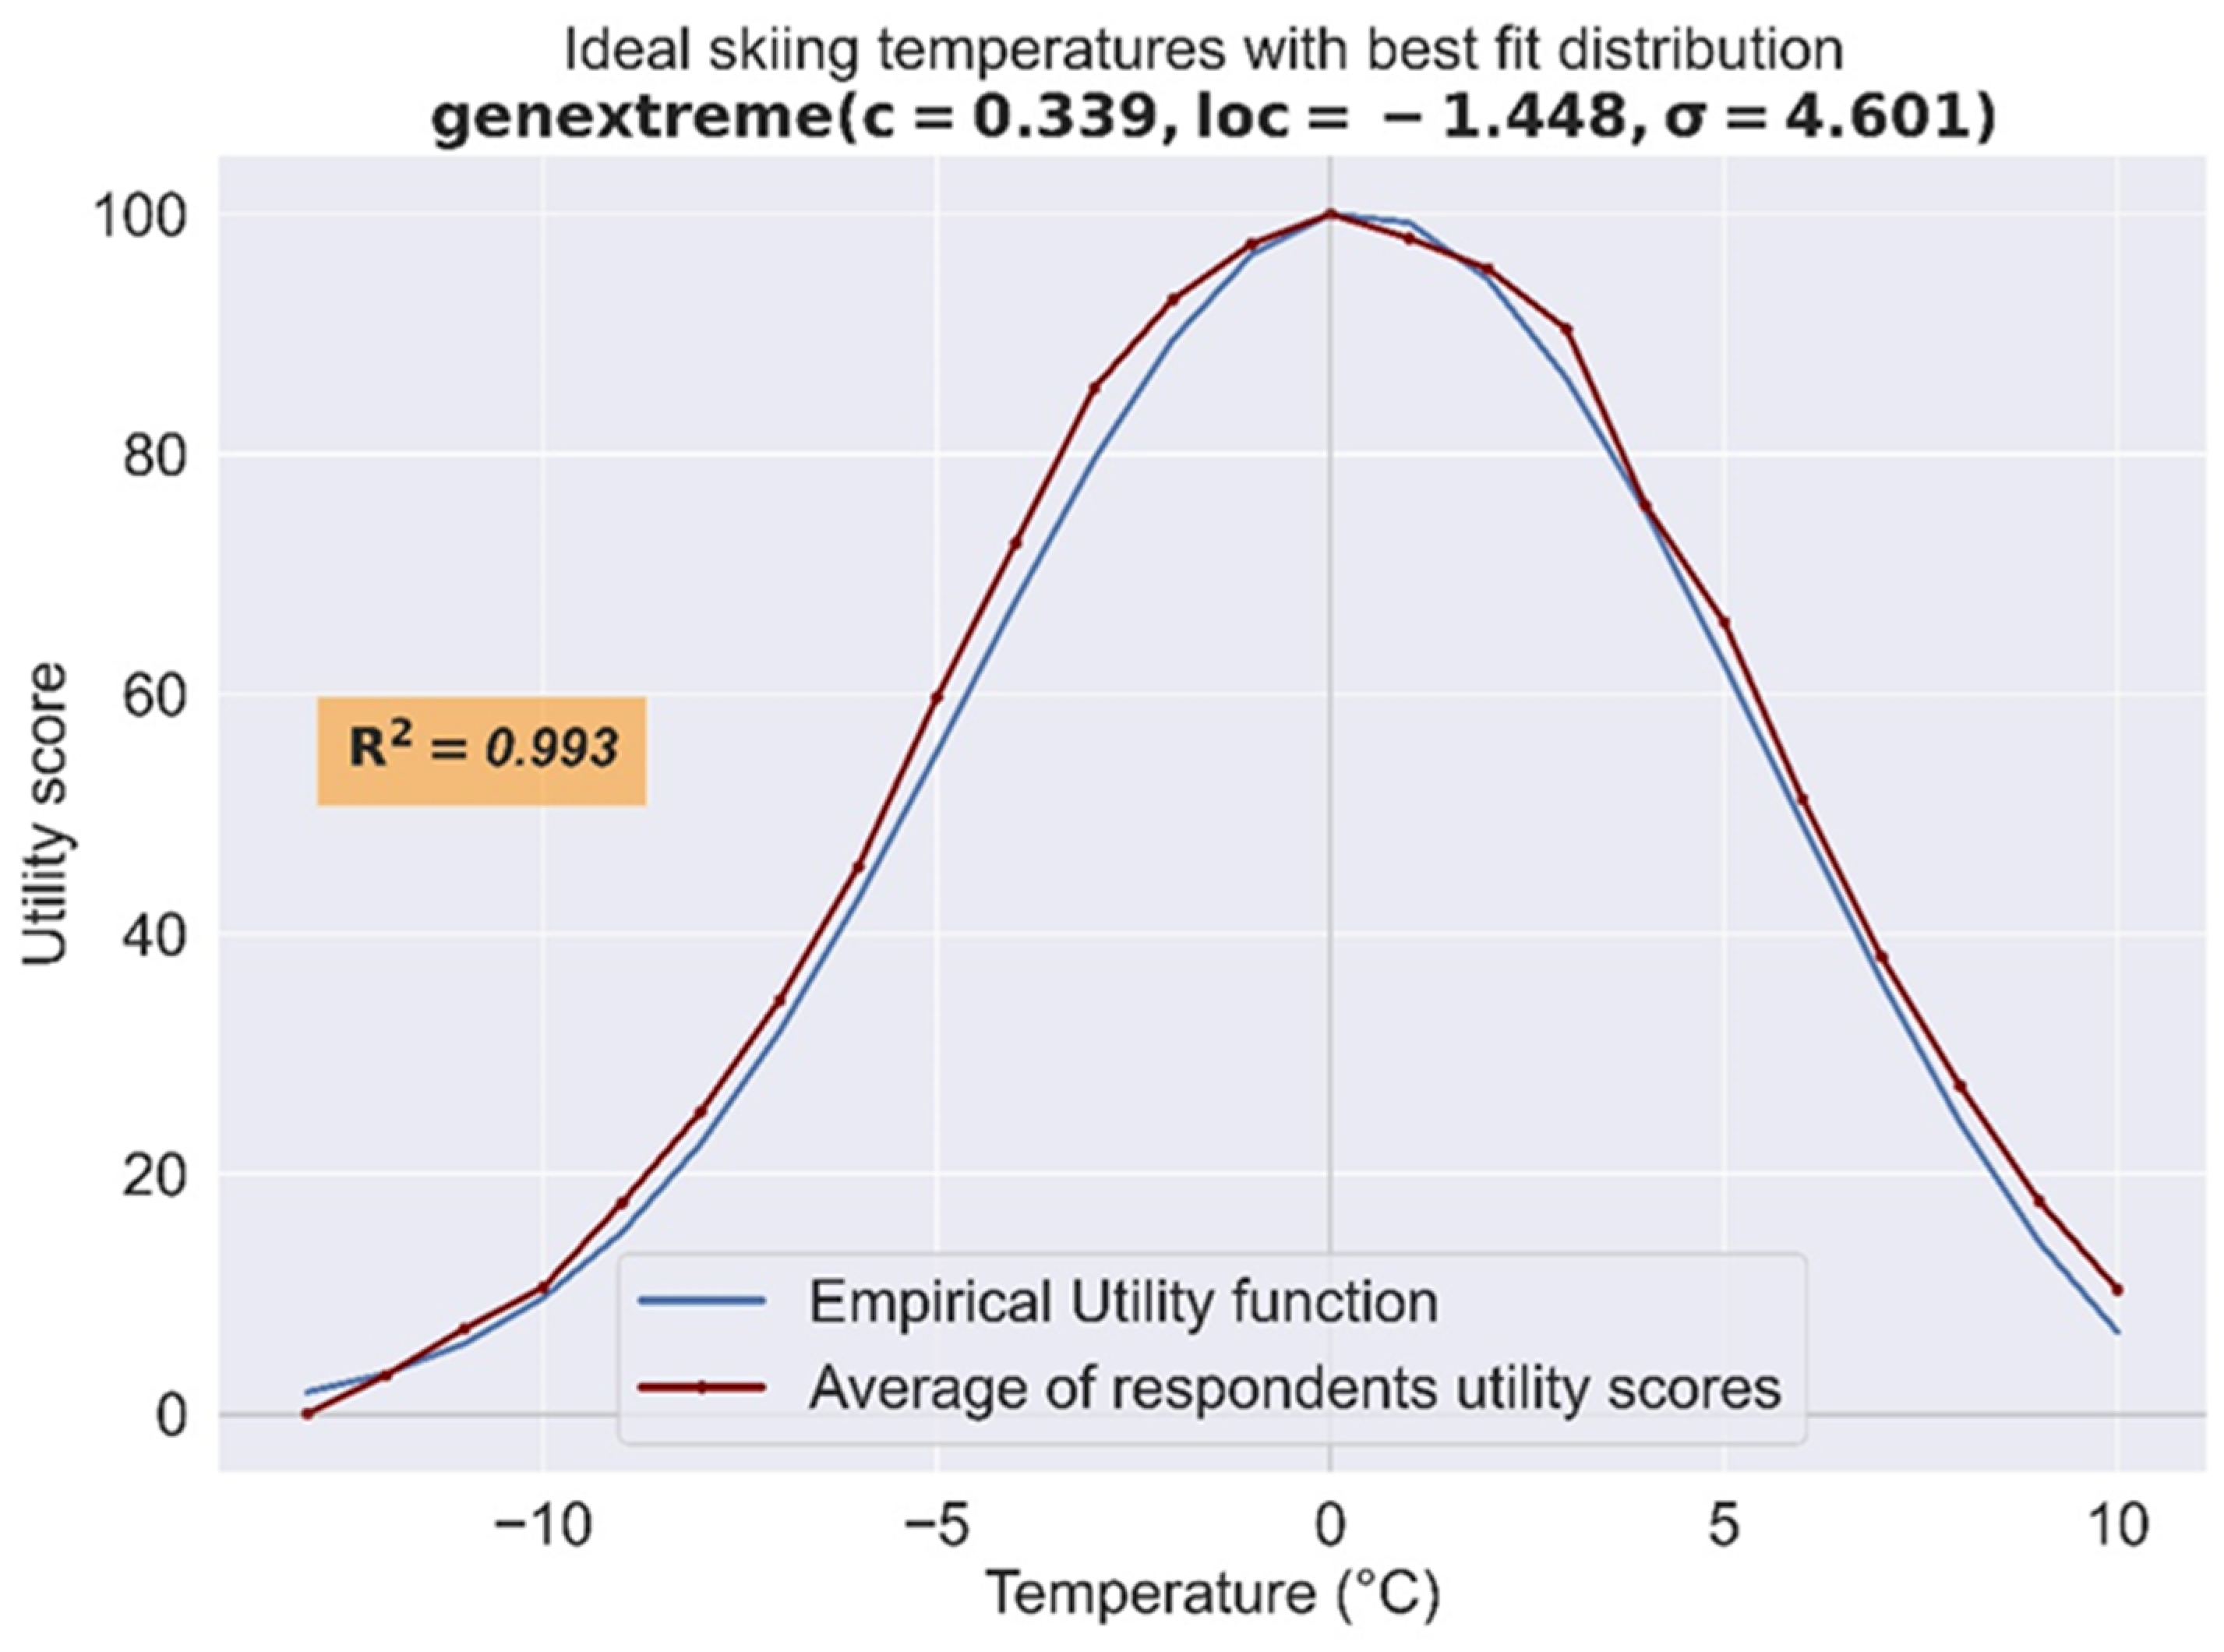
3.3.1. Ambient Air Temperature
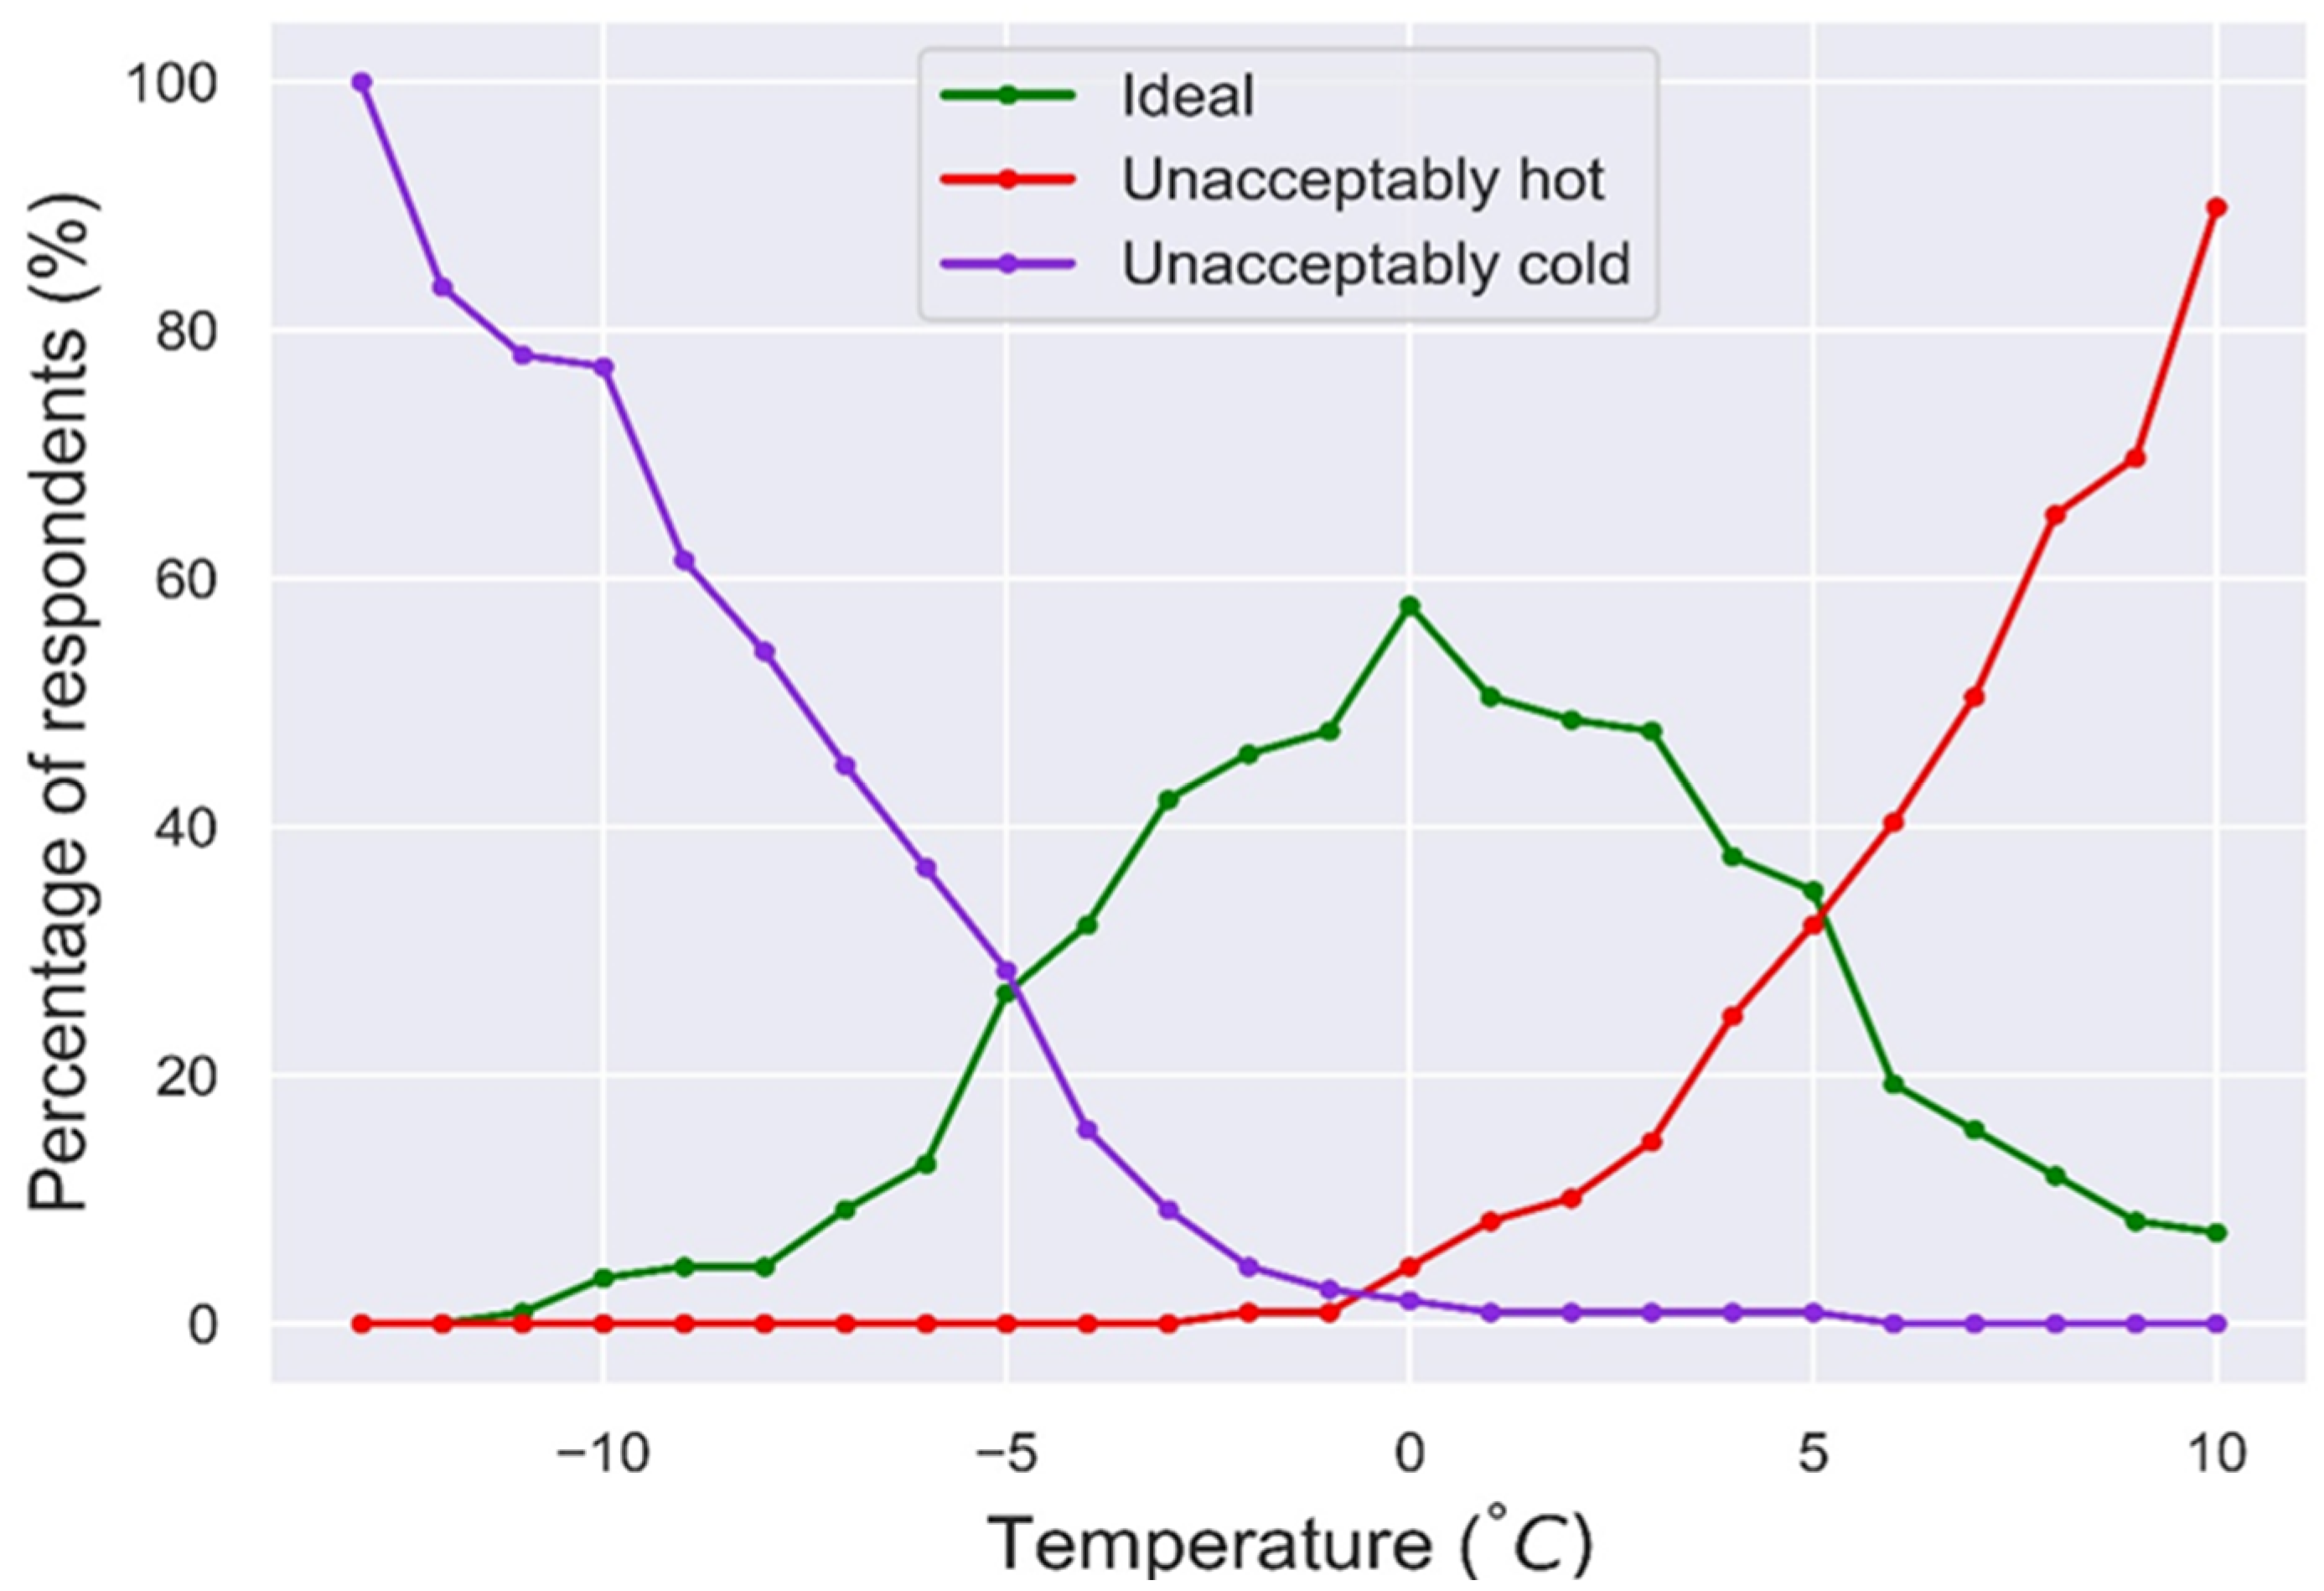
The respondents were asked to indicate the ideal, unacceptably hot, and unacceptably cold temperature value or range of values (Tideal, Thot, Tcold) for skiing. The ideal temperature values correspond to a utility score of 100, while the unacceptably hot and cold both correspond to 0. Keeping in mind the assumption on linear evolution of utility, the utility score of an intermediate temperature value Tn is given by Equations (2)–(4):
where m is the number of respondents and n is the temperature value ranging from −12 °C to 10 °C, with a 1 °C interval step. As this time step may be perceived by respondents as being too small, they were able to select a range of values (instead of a single one) as the ideal, unacceptably hot, and unacceptably cold.
Thus, for each respondent, a temperature utility profile is created. By calculating the mean utility score for each temperature value from the utility scores of all respondents, a ‘composite’ temperature utility score profile is generated, which reflects the temperature preferences of all participants:
Then, this composite temperature utility profile is normalized so that the highest utility score is calibrated to a scale of 0 to 100. The rest values are also calibrated respectively. Thus:
and
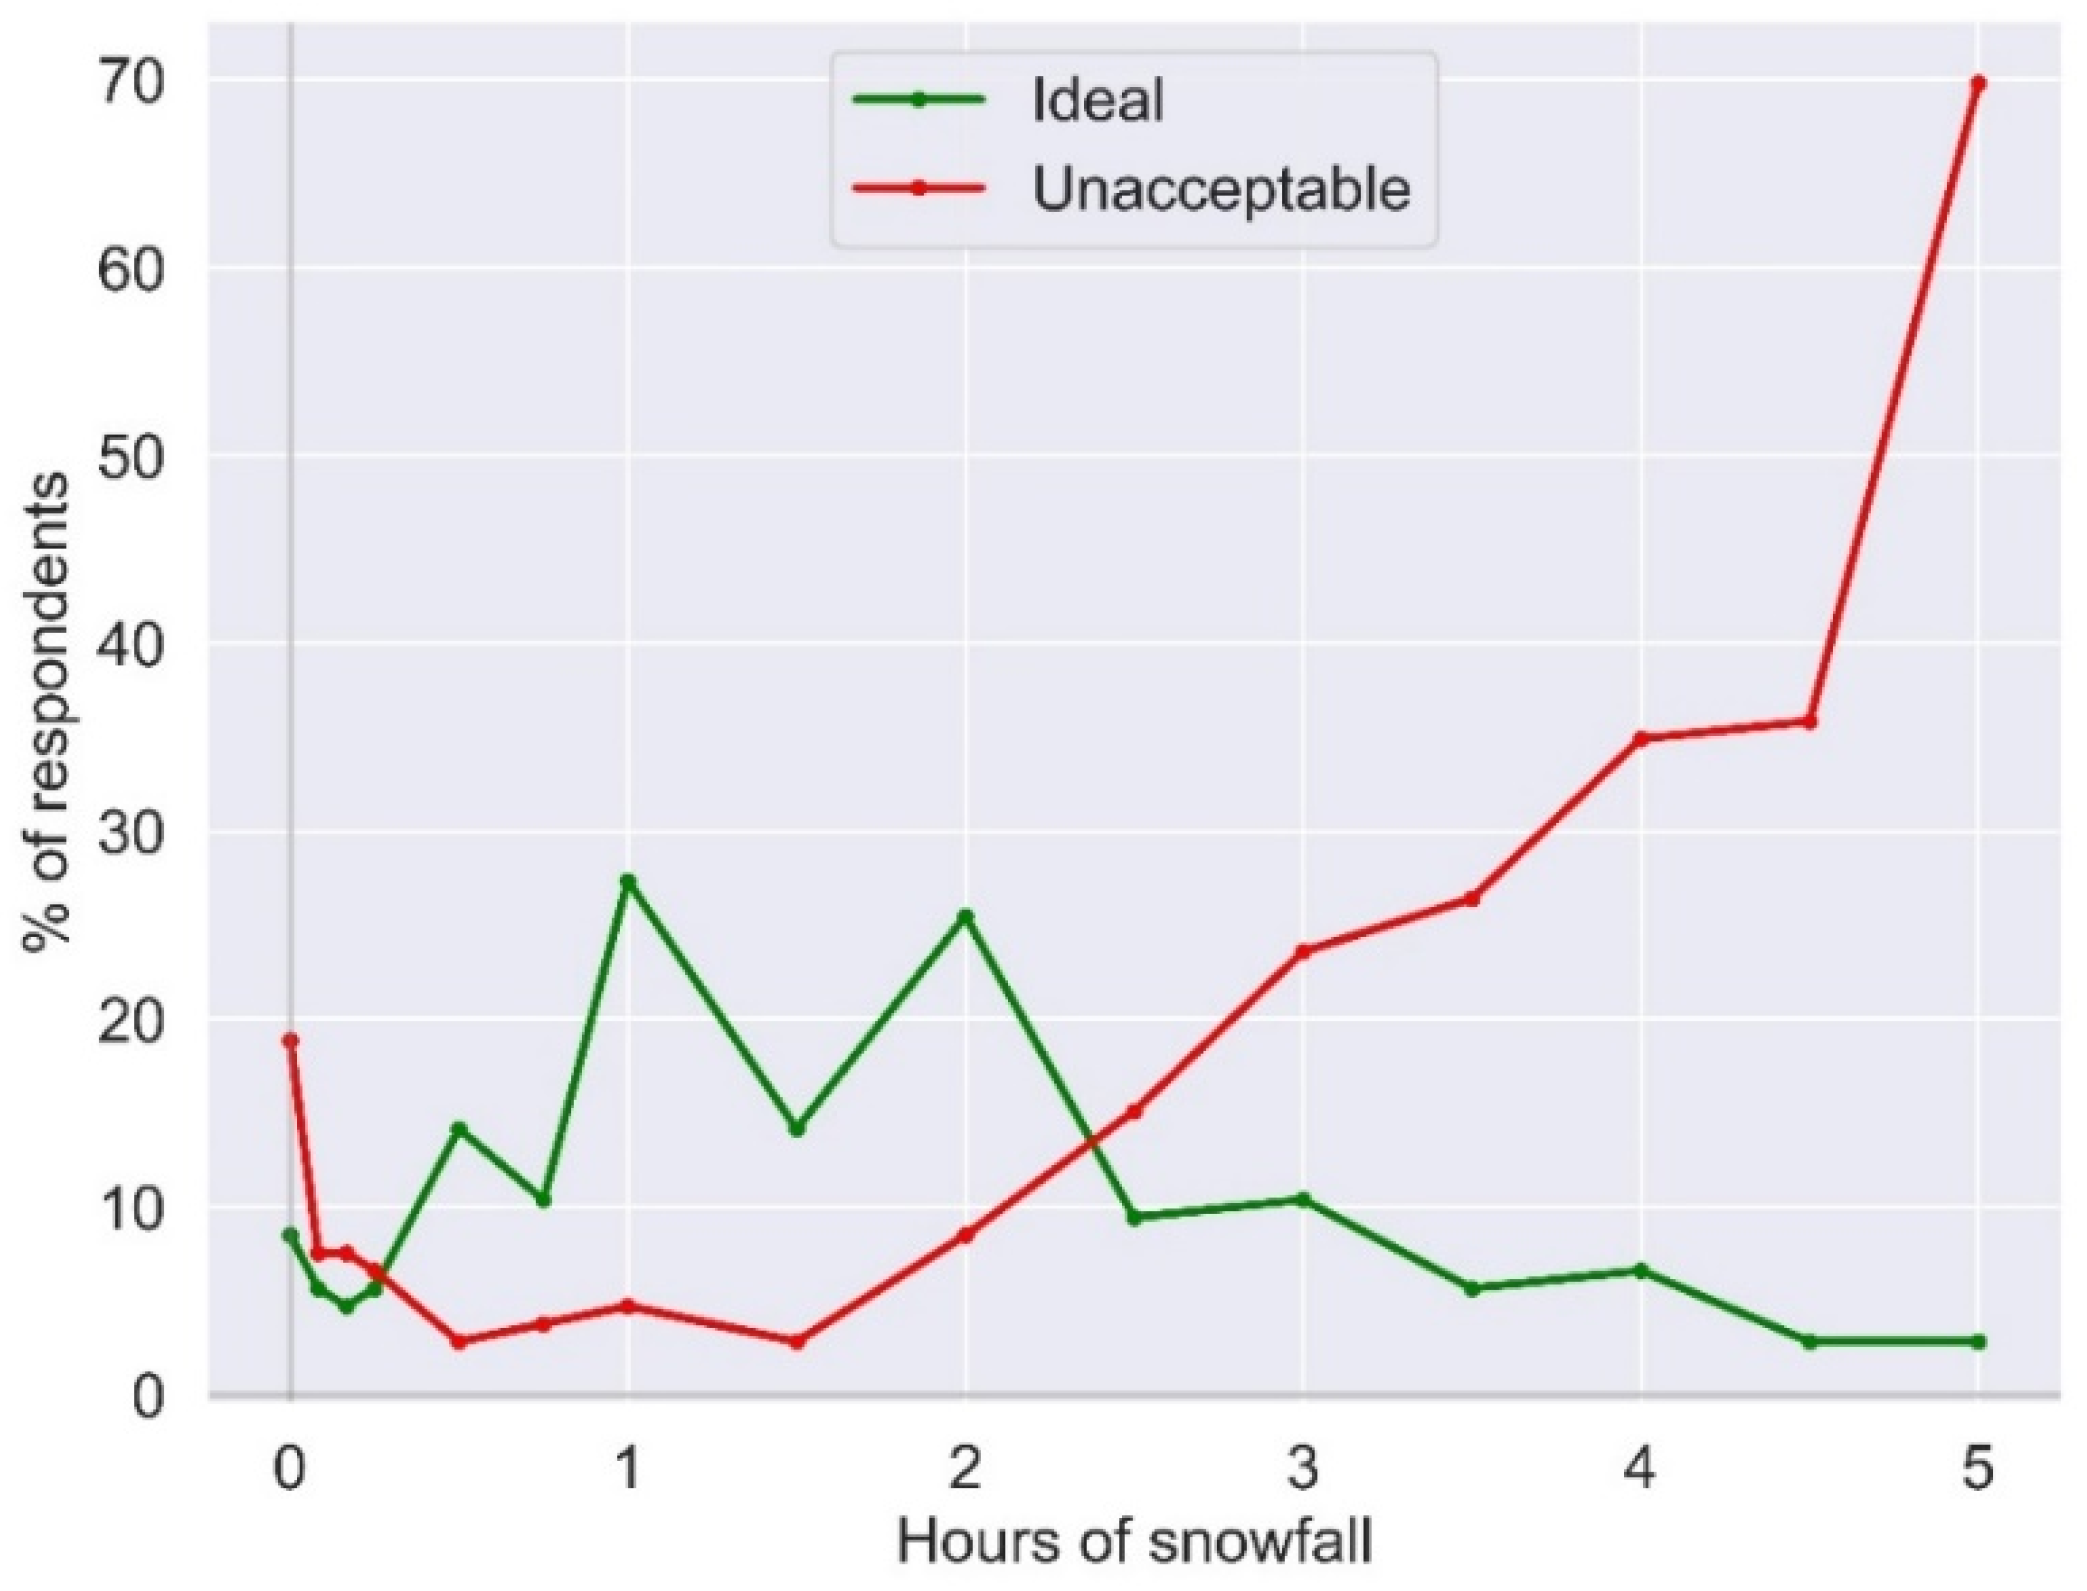
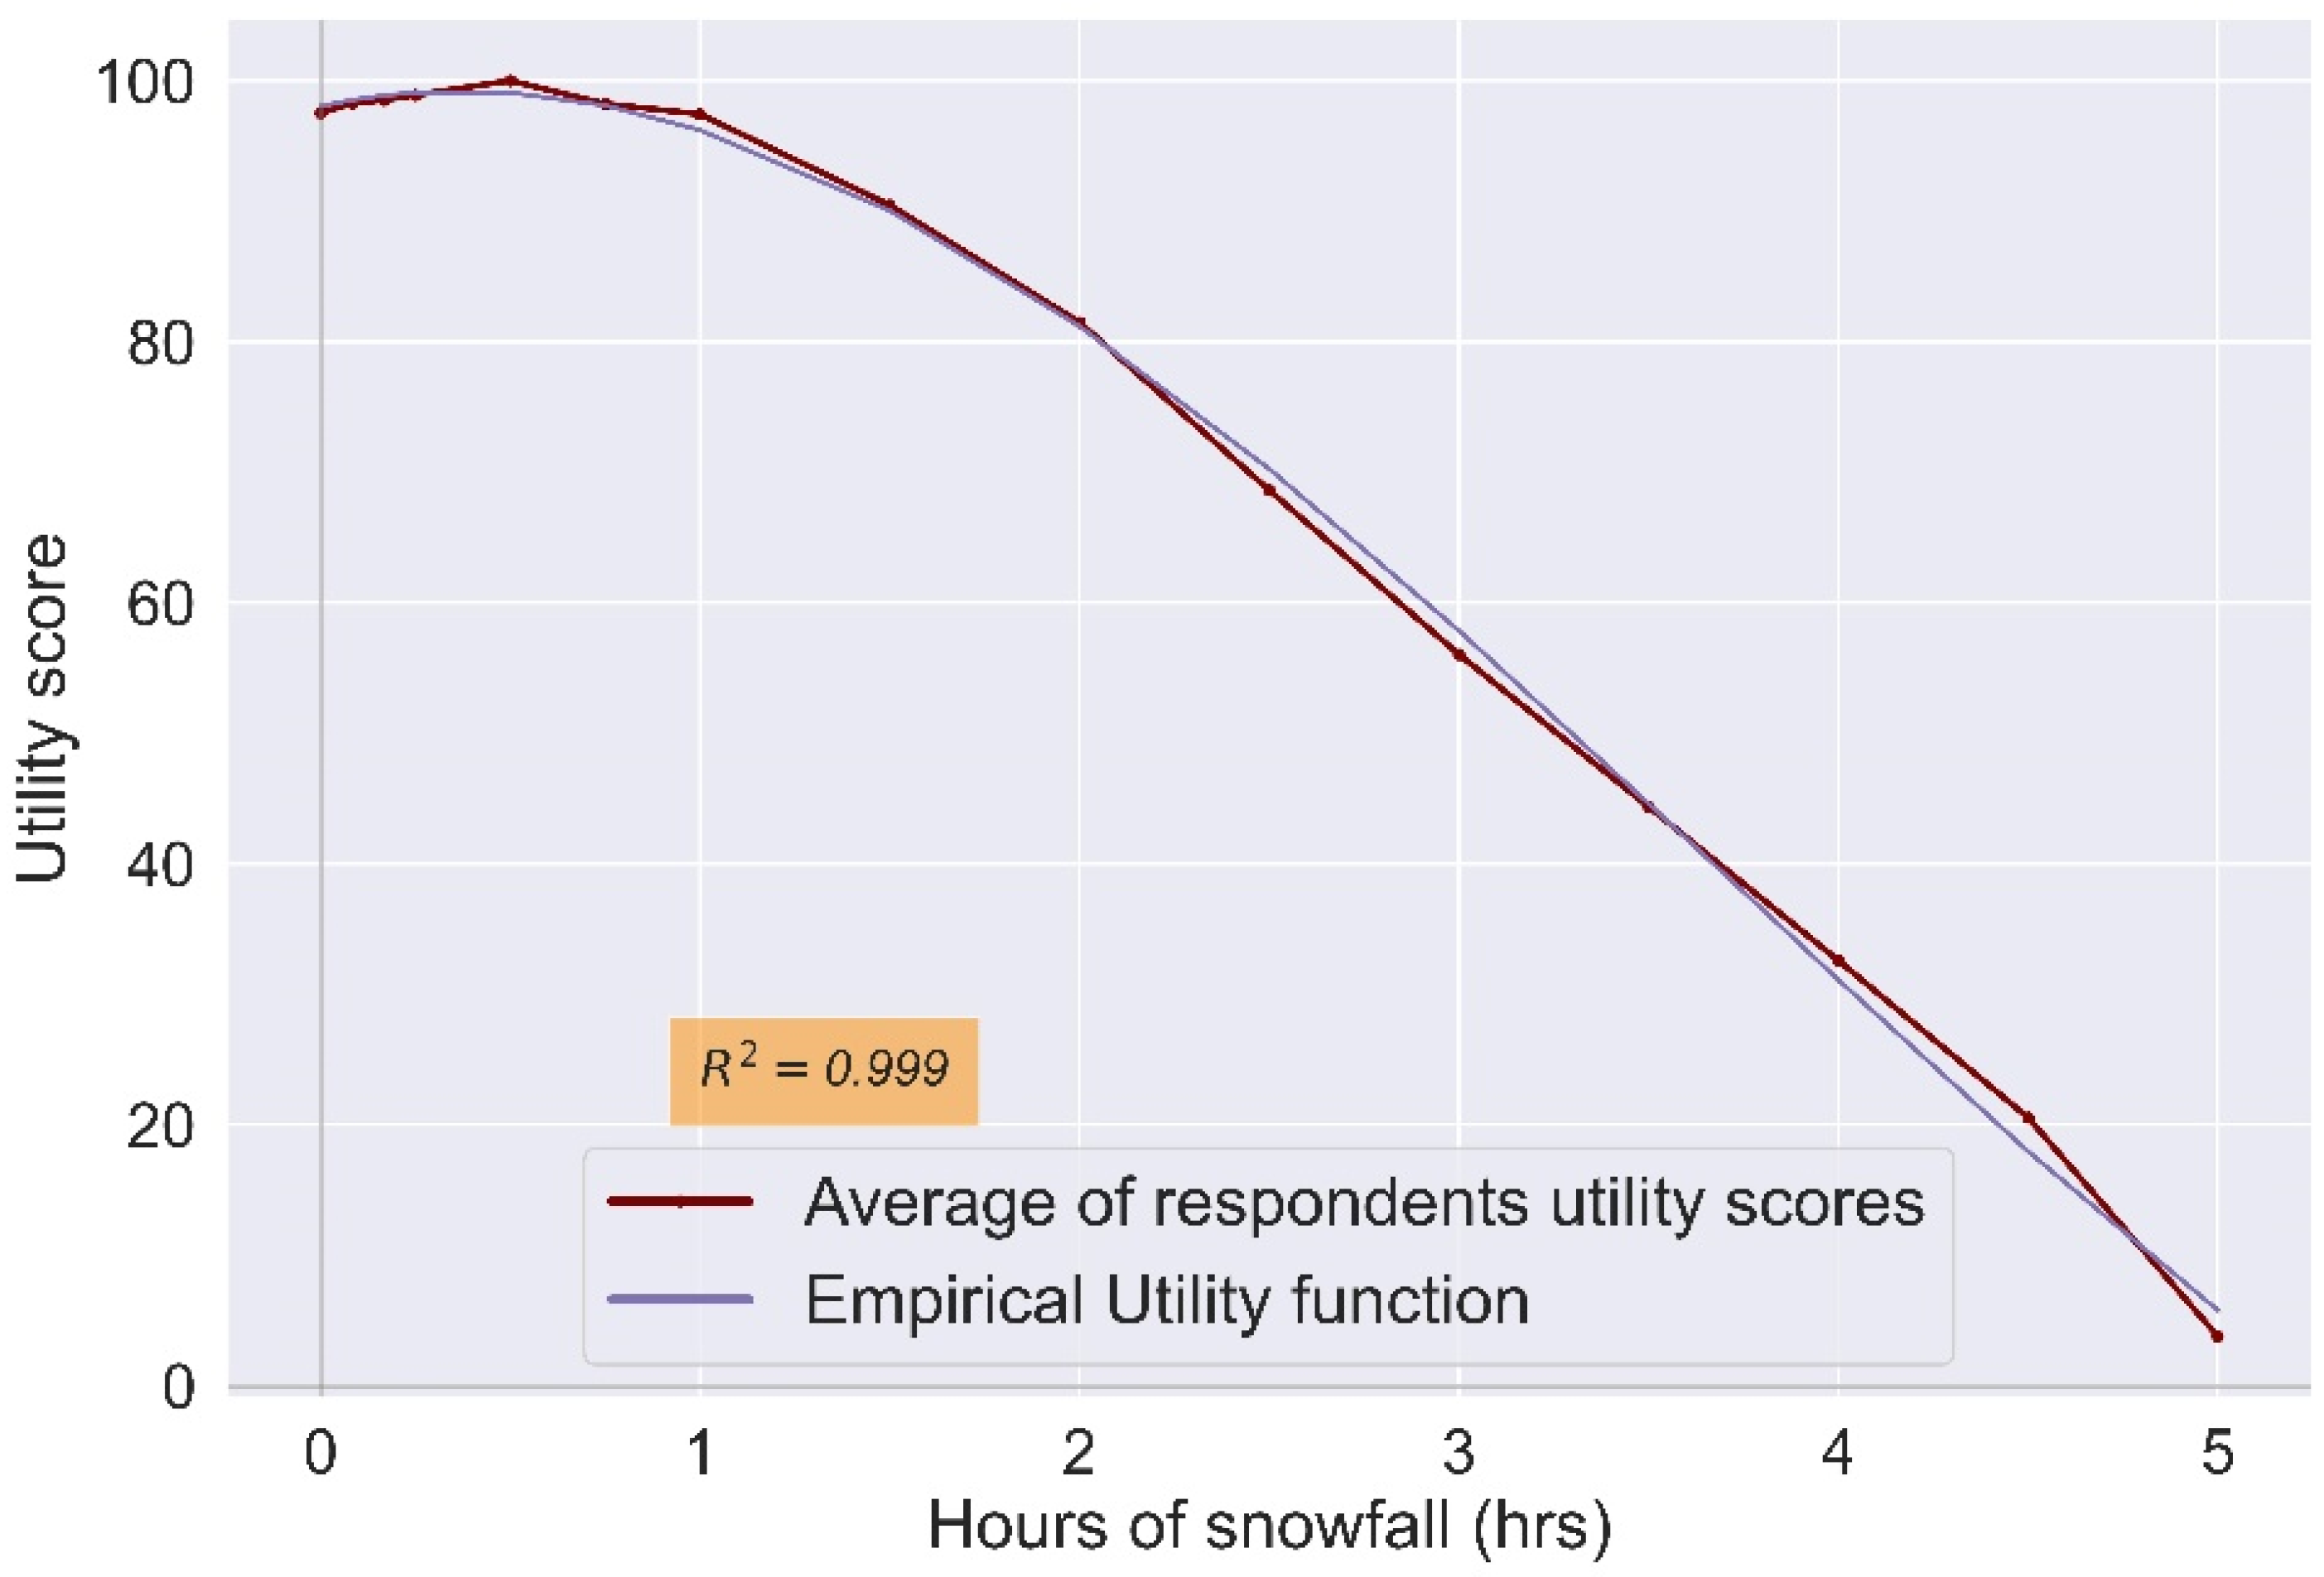
3.3.2. Snowfall Duration
The participants to our survey were asked to rate their preferences by indicating the ideal and unacceptable snowfall duration (Sideal
m and Sunac
m, respectively) in minutes/hours per day during their skiing vacations. The respondents were presented with a scale ranging from 0 min to 5 h (with the latter value assumed to be the maximum time daily that a non-professional skier can spend on mountain slopes) with various interval steps. We assume that unless stated otherwise, any snowfall duration smaller than the stated ideal also corresponds to a score of 100 (i.e., it is also ideal) while a duration higher than the stated unacceptable also corresponds to a zero utility, as snowfall during skiing can be painful and hamper the ability to see clearly. Therefore, the utility score remains equal to the boundary’s value unless stated otherwise (e.g., there were many respondents who judged that a 0 min snowfall is also unacceptable).
.
The utility profiles from all respondents are combined into one aggregate snowfall utility profile. This is achieved by calculating the average of all respondents’ utility scores for each snowfall duration value SU
n as shown in Equation (10):
Next, utility scores are normalized to a 0–100 scale as follows:
3.3.3. Cloudiness
Respondents were asked to rate their preferred sky conditions by indicating the ideal and unacceptable cloud cover (Cideal
m and Cunac
m, respectively), with clear skies at 0% and completely overcast at 100% and a 25% interval step. Participants who did not indicate an unacceptable level of cloudiness were excluded from the calculation of utility. The same procedure as for the other variables was followed to obtain the utility scores of an intermediate cloud cover C
n:
.
Again, the profiles from all respondents are combined into one aggregate cloudiness utility profile:
and then normalized to a 0–100 scale:
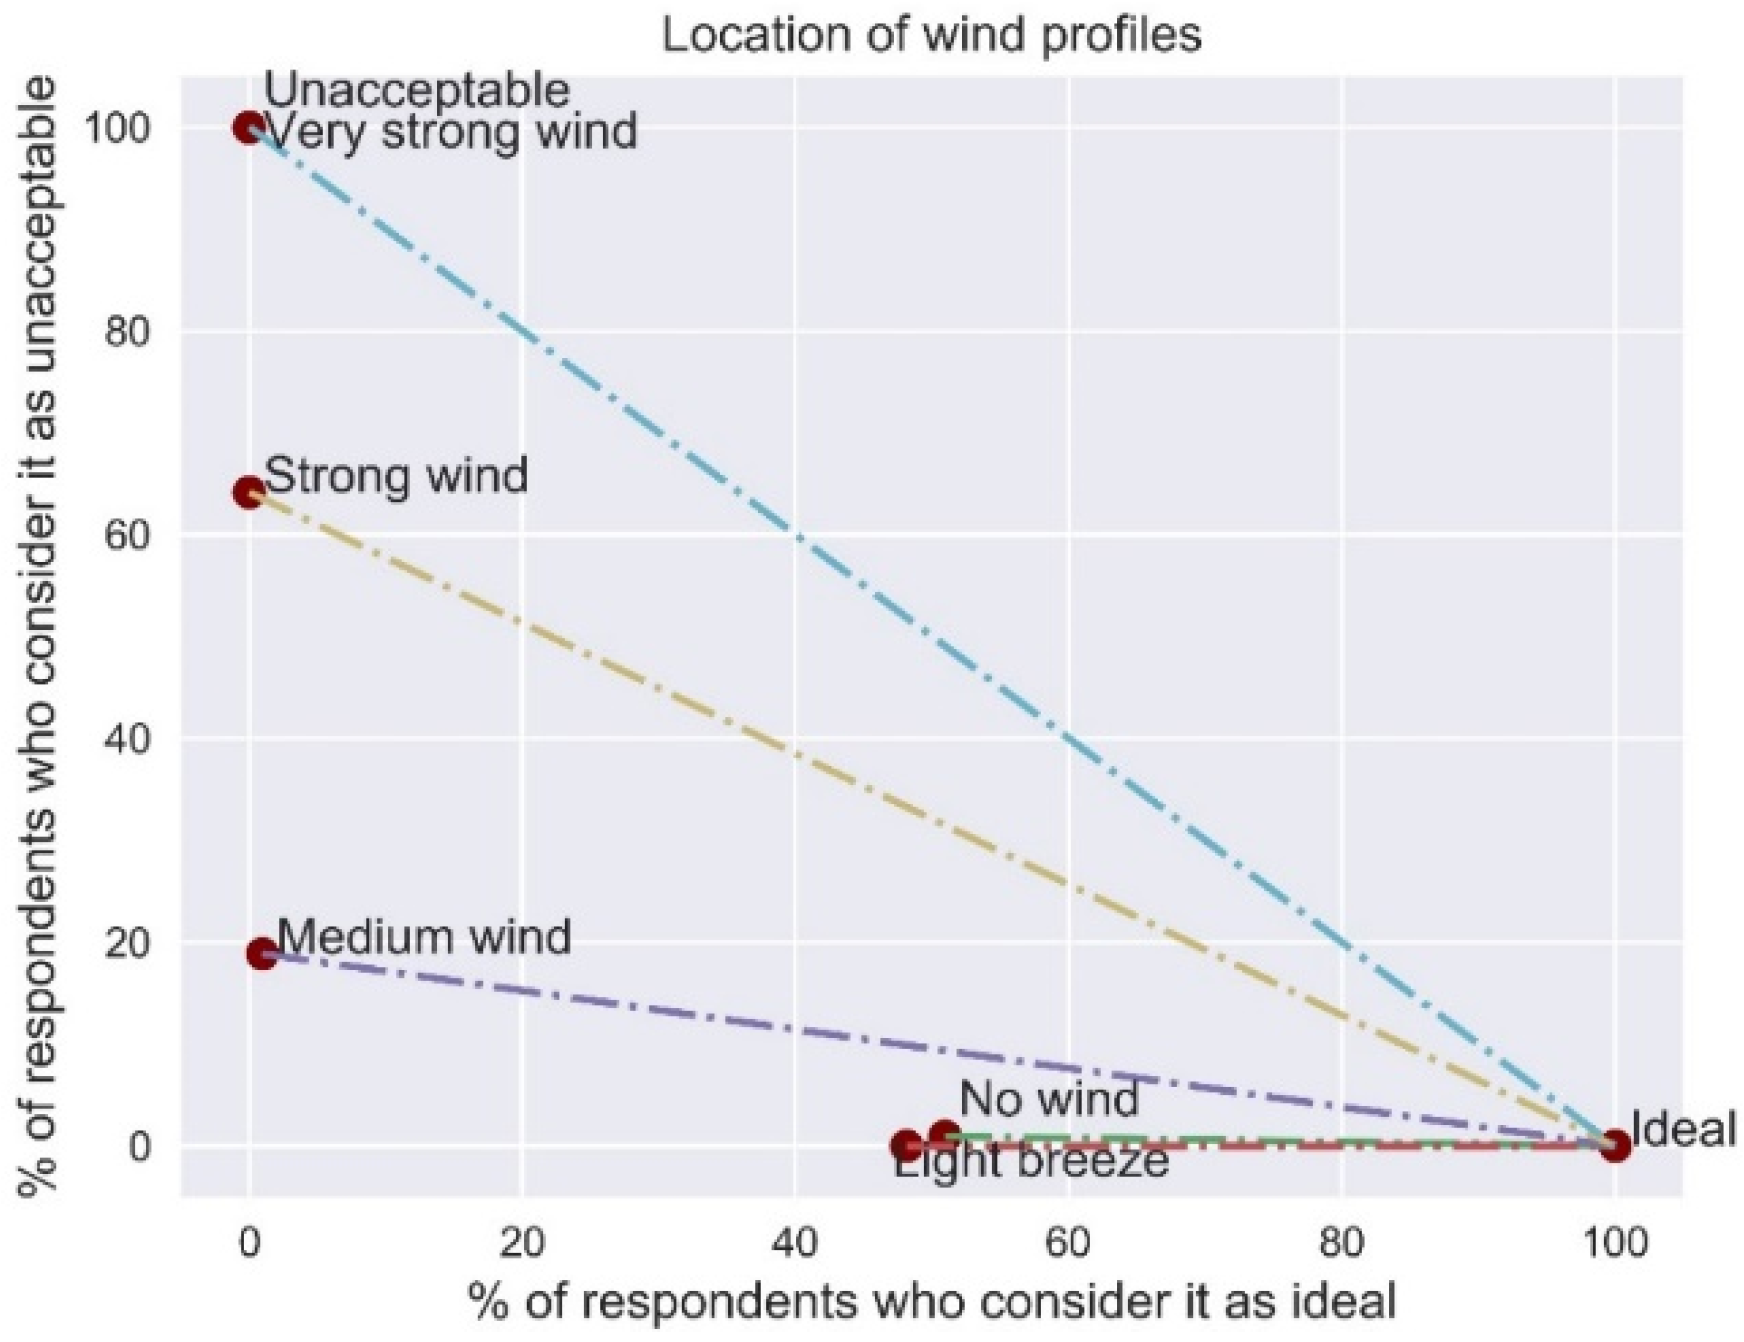
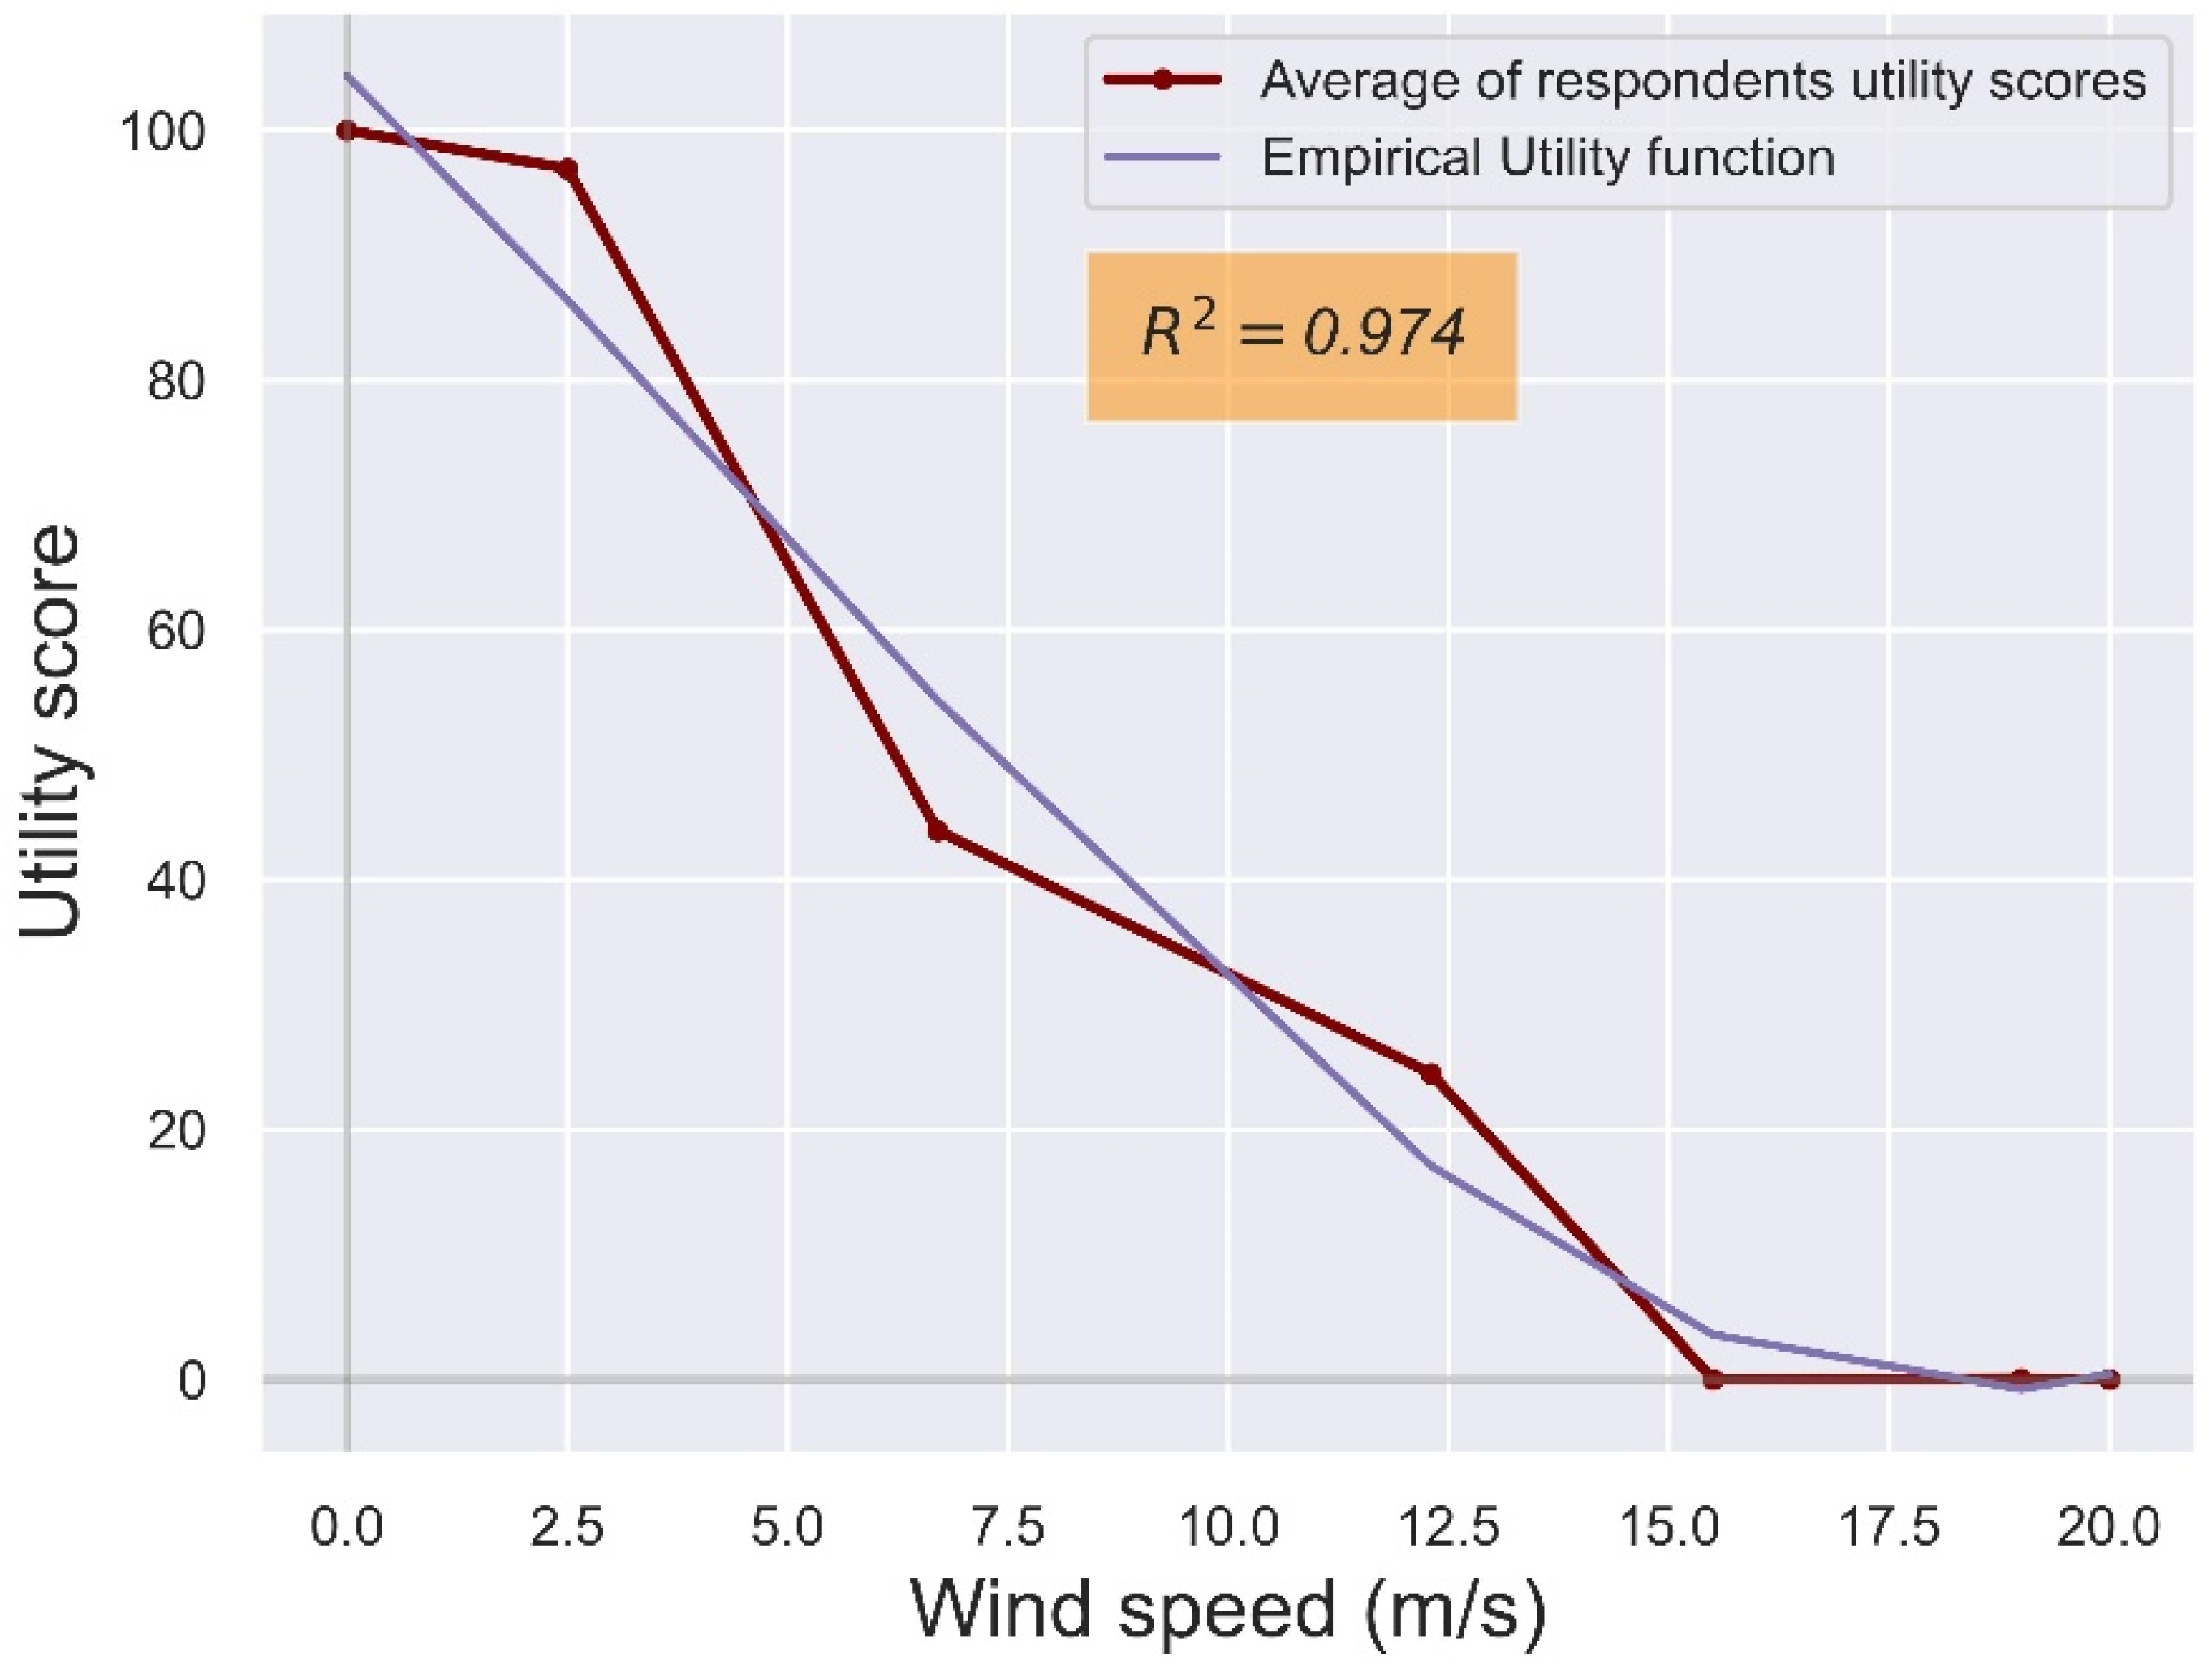
3.3.4. Wind
For wind, the available choices were presented to the survey participants in a qualitative form (i.e., ‘no wind’, ‘light breeze’, ‘moderate wind’, ‘strong wind’, and ‘very strong wind’, and with the wind speed value ranges corresponding to these qualitative wind levels included in parentheses). The correspondence to the usual Beaufort wind scale is given in
Table 1.
The utility function for wind when skiing was based on the approach of previous research [
50]. Thus, the theoretically ideal wind profile would be the one evaluated as ideal by 100% of respondents, and as unacceptable by 0% of them. Likewise, the theoretically unacceptable wind profile would be the one evaluated as unacceptable by 100% of the respondents and as ideal by 0% of them. The distance of the theoretically unacceptable wind profile from the theoretically ideal wind profile would be:
Then, if the percentage of respondents who consider a wind profile as ideal is In and that of those who consider a wind profile as unacceptable is
Un, the different wind profiles have a distance from the theoretically ideal profile given by Equation (18):
The utility score of the different wind profiles
WUn can be calculated by:
For
dn =
dworst, which is the theoretically unacceptable wind profile, the utility score is equal to 0. The calculated utility scores are then normalized, as for the previous variables, to a scale of 0–100:
3.4. Weights of Climatic Variables
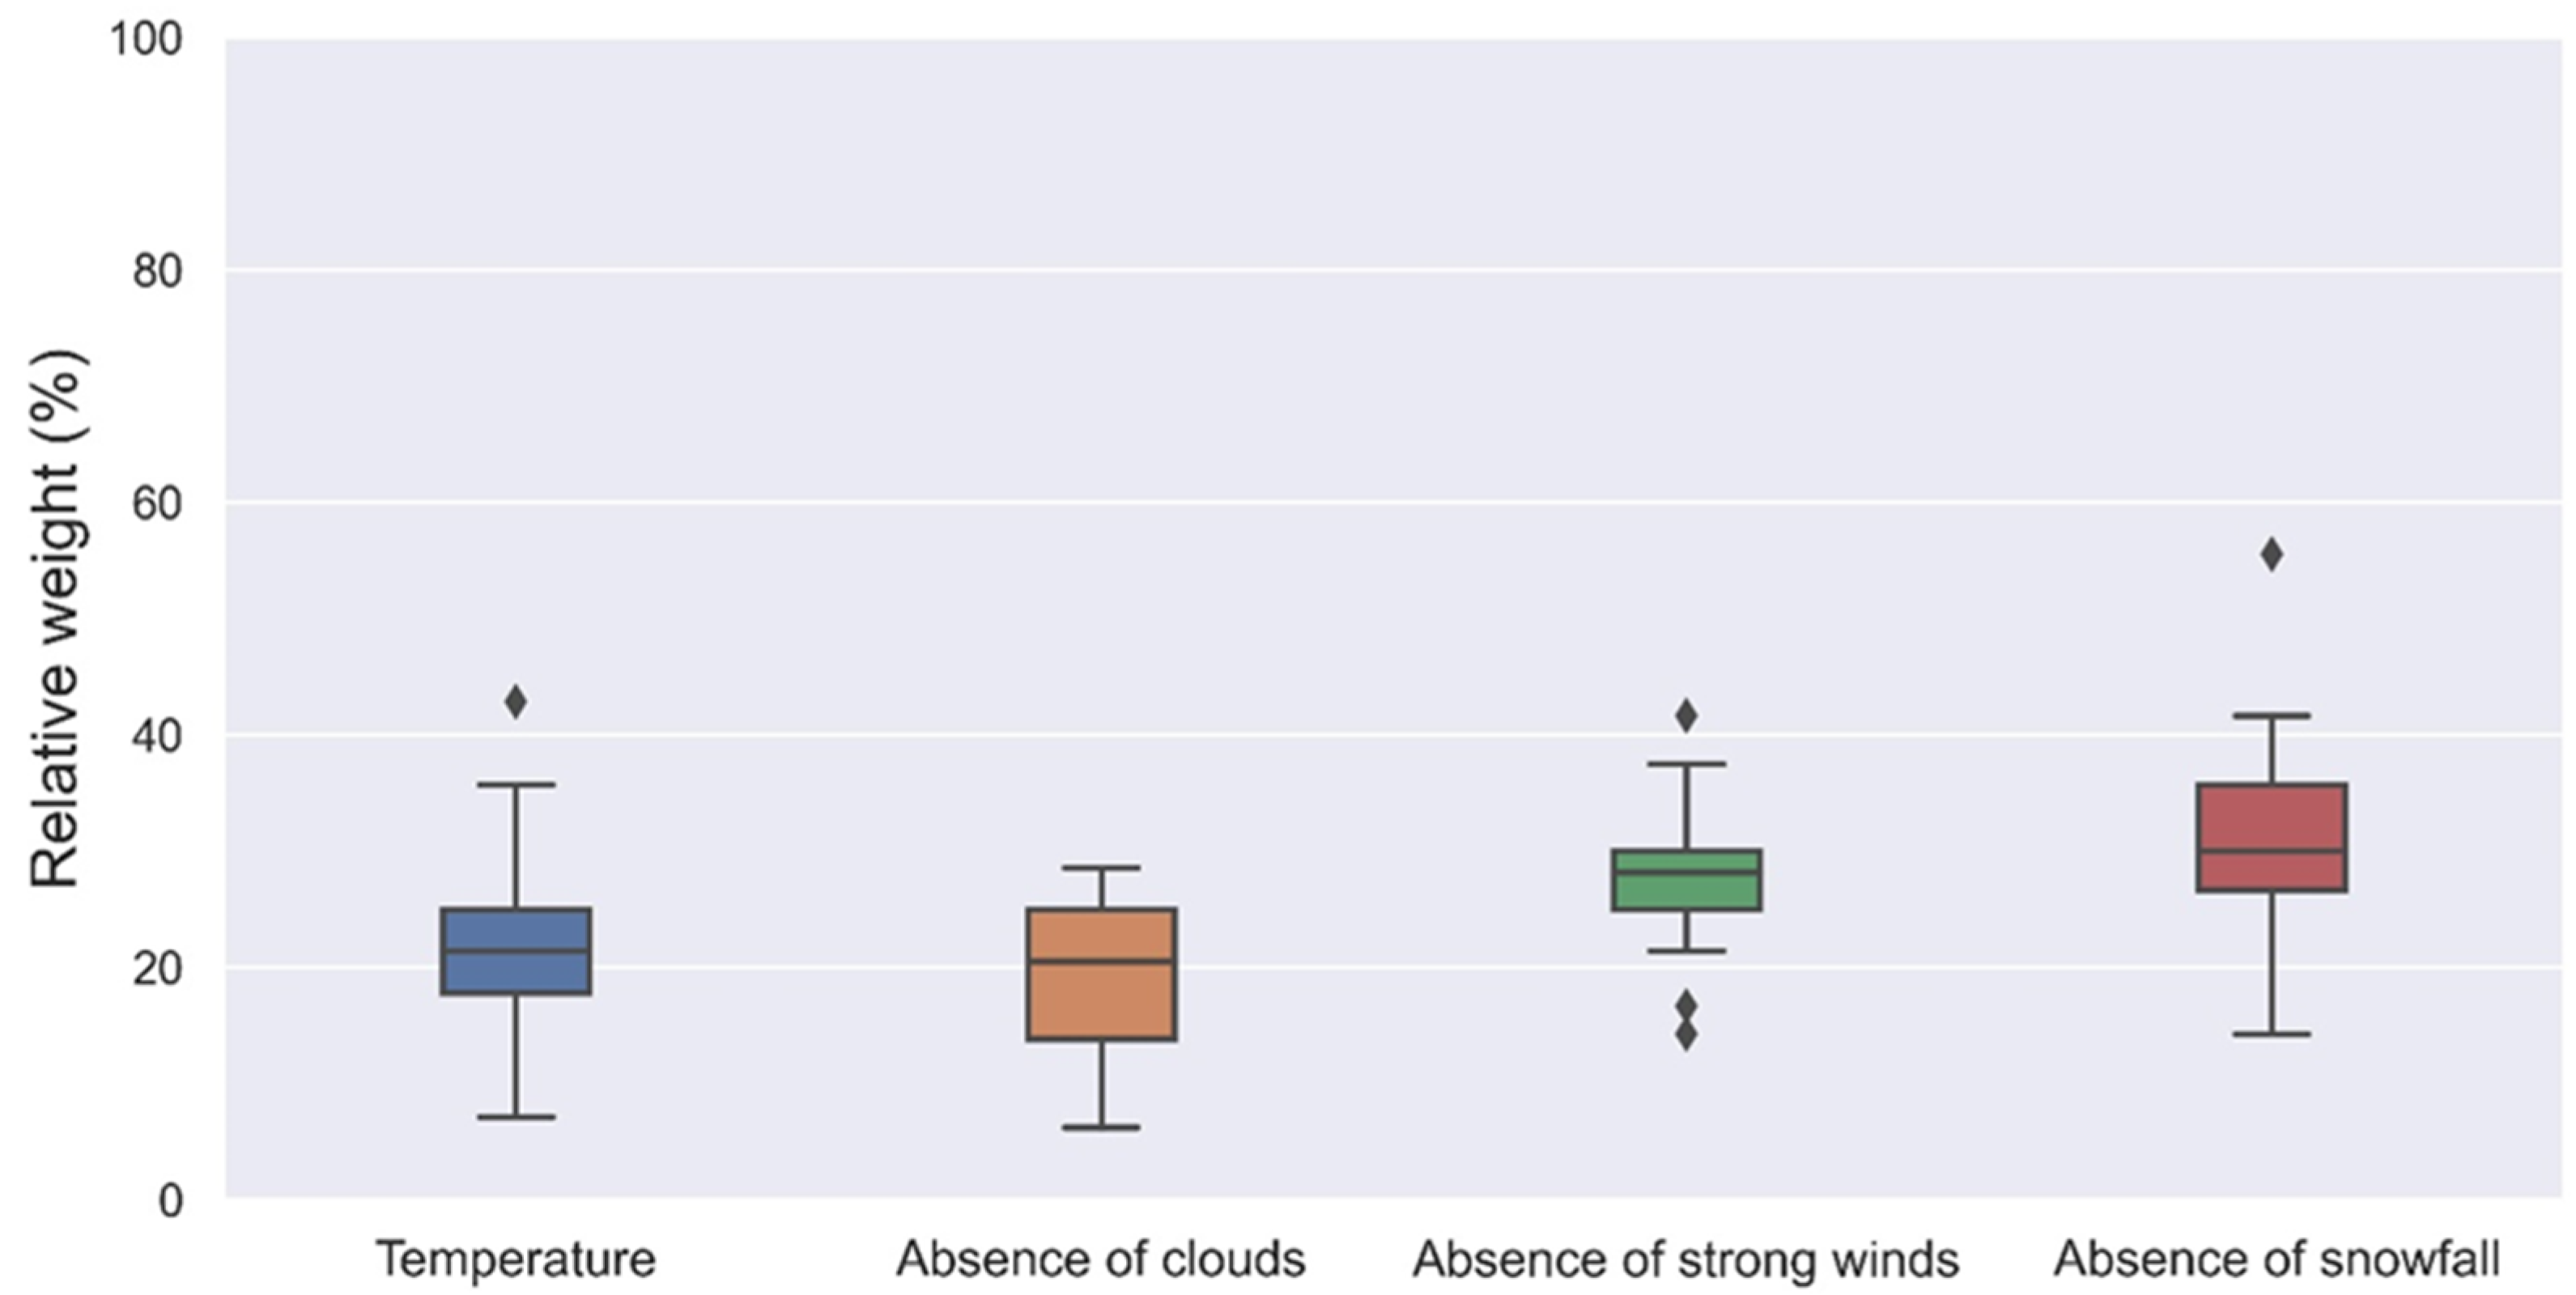
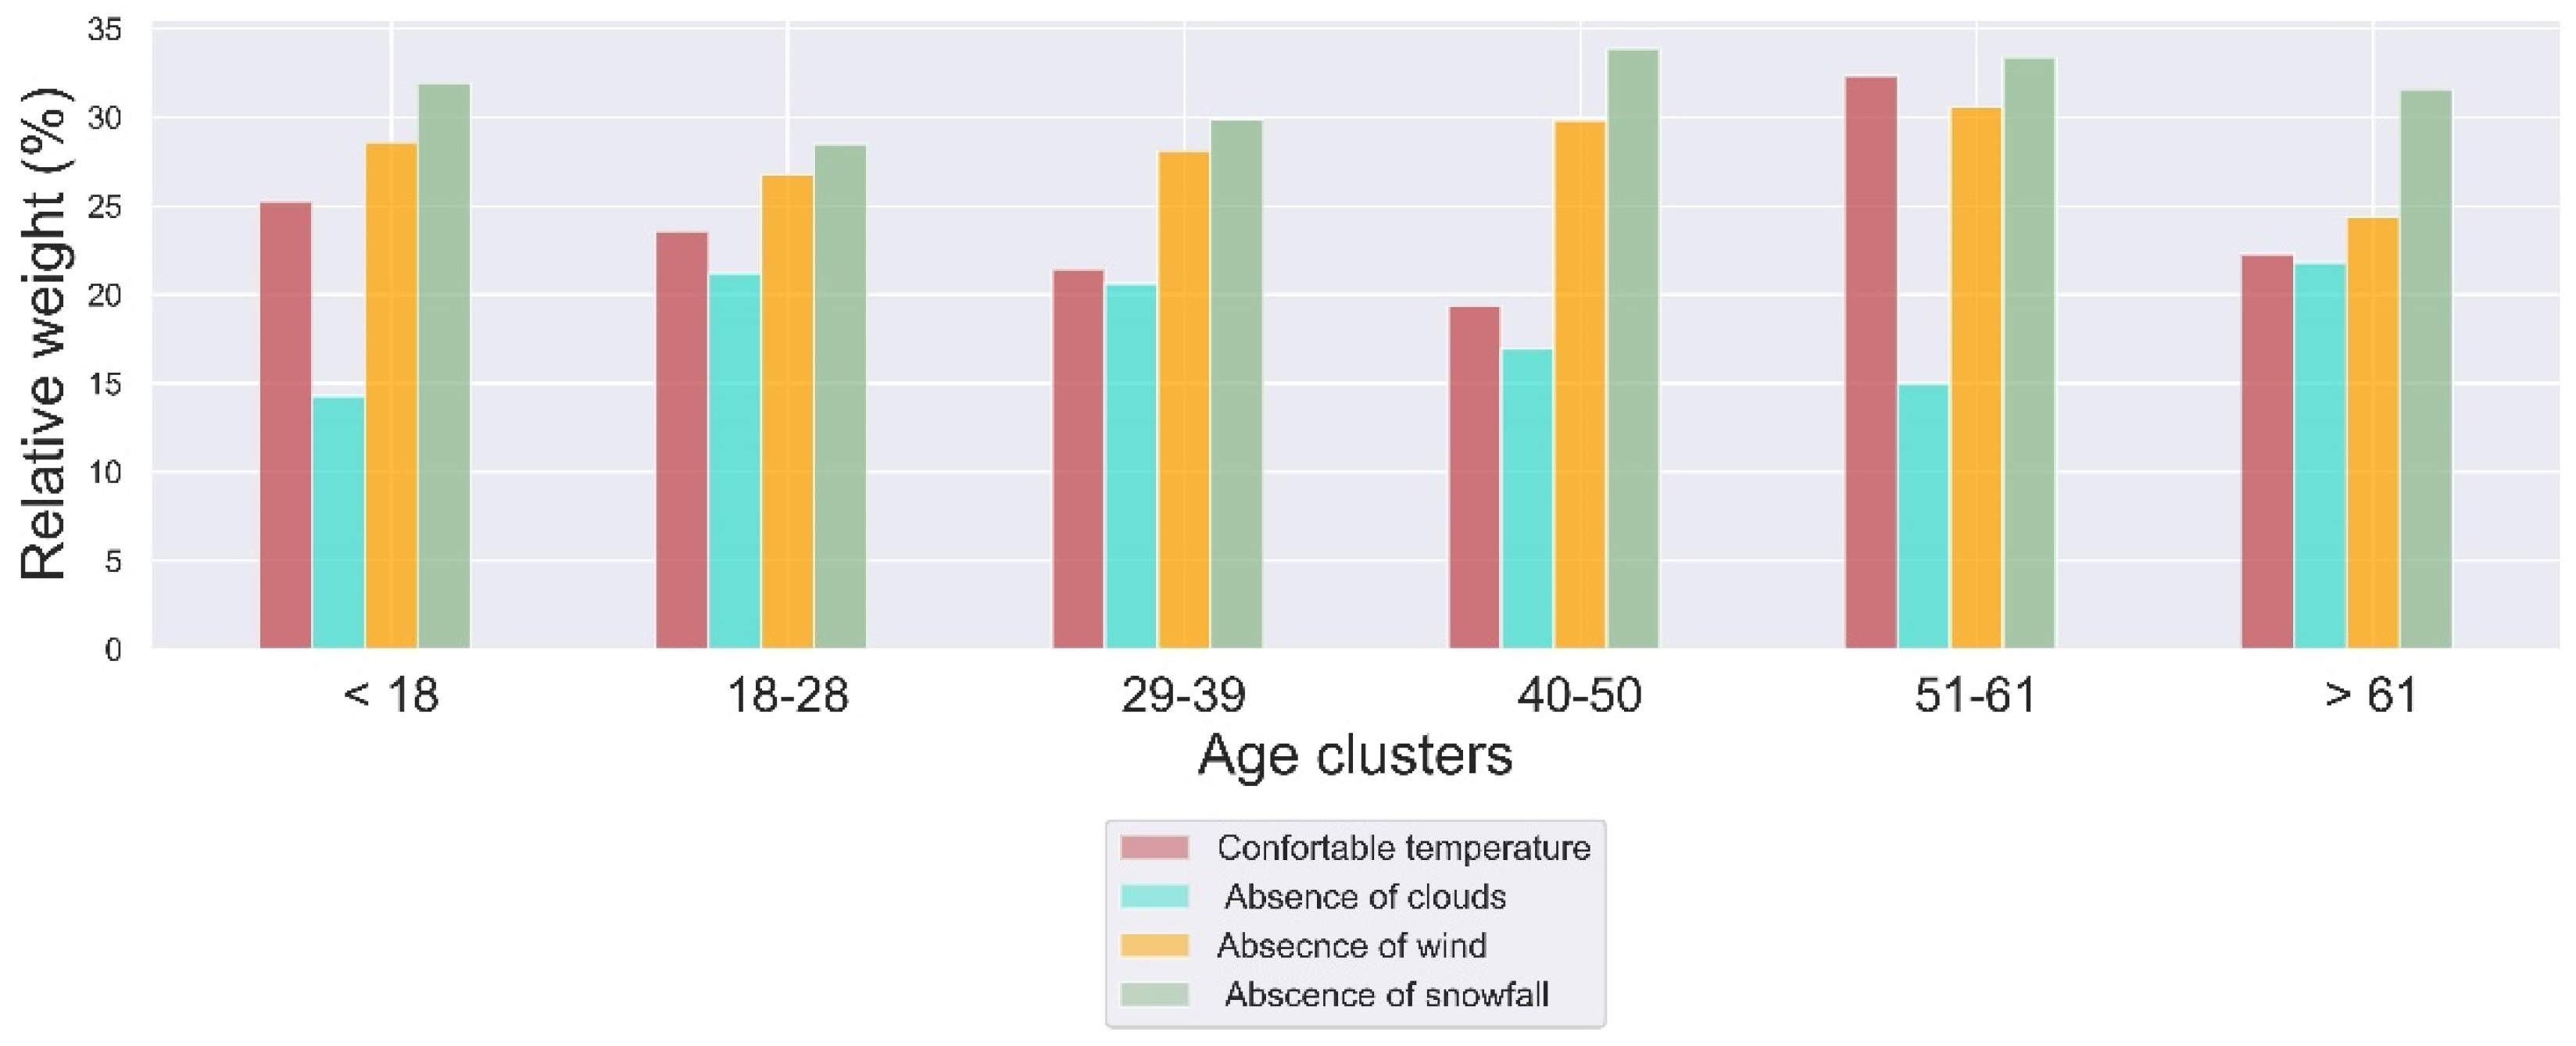
In the current study, the various weights of the four different climatic variables are drawn from the respondents’ own stated preferences. To this purpose, two relevant questions were asked, namely (a) which are the three main reasons for choosing Greece as a winter tourism destination, and (b) how important are some given parameters for selecting the specific ski resort of Parnassos (with the importance ranging from 0 to 5, with 5 being ‘very important’ and 0 being ‘not important at all’). The weights were determined from the answers of respondents who provided a climate-related answer in one or both questions. Thus, responses using words like ‘snow’, ‘climate’, ‘ski’, ‘weather’, ‘snowy mountains’, ‘sun’, etc., in the first question were considered as climate-related and were included in the calculation of the weights. Similarly, responses that evaluated ‘snow reliability’ and/or ‘use of snowmaking equipment’ in the second question were also included in the weight calculation. This procedure was primarily done to sort out the views of the skiers who highly value the factor of weather and climate when planning a skiing vacation. About half (~53%) of the sample surveyed was interested to some degree in the weather/climate factor. After filtering out the ‘climate-driven’ respondents, their answers on a third question were evaluated to compute the weights. Specifically, respondents were asked to rate the importance (from 1 to 5, with 5 being ‘very important’ and 1 being ‘marginally important’) of the different climatic factors influencing their skiing experience, namely comfortable ambient temperature, absence of snowfall, absence of clouds, and absence of strong winds. Then, their answers were converted into a 0–100 percentage range and next were averaged over the whole sample.
3.5. Ski Utility Index (SUI)
After calculating the weights of the different climatic variables, the next step was to deduce the distribution of the utility scores for these climatic variables. Thus, after having determined both the weights and the corresponding utility functions, the following formula gives the SUI score:
Following an approach like the one in the TCI [
26] and the BUI [
50] indices, the climate suitability of a destination resulting from the value of SUI is allocated into one of the seven scoring categories of
Table 2, adopting a classification proposed and validated in tourism literature [
51].
5. Discussion
The current study aims to generate a Skiing Utility Index which measures the climate comfort (on a 0–100 scale) at a given location for skiing and other snow-related activities. In contrast to other studies that calculate similar climate indices either for beach tourism or for all-year leisure tourism, the present index focuses on winter tourism and specifically its segment associated with snow-related activities (skiing, snowboarding, etc.). The SUI index has been developed based on skiers’ stated preferences to better reflect the suitability of winter destinations for this type of tourism.
To this end, an empirical survey was carried out at the ski resort of Parnassos Mountain in Greece. The skiers were asked to rate their preferences on four specific weather variables, namely ambient air temperature, snowfall duration, cloudiness, and wind. The results of this survey were used to develop the SUI, which aggregates the partial utility functions for the four climatic variables. The variables’ weights were derived from the skiers’ views on the importance of those weather elements while skiing.
According to the results, the duration of snowfall within a skiing day was found to be the most critical parameter for skiing as snowfall affects both visibility when skiing as well as snow reliability at a location. The second most important parameter was found to be wind speed, followed by the ambient air temperature and the cloud coverage. Wind speed was evaluated as the second most important climate variable as it can have a serious impact on visibility (snow blowing) and skier stability when skiing. The ambient temperature was not considered to significantly affect skiing as skiers can control any adverse effect of temperature on thermal comfort through the appropriate use of clothing. The ideal temperature for skiing was found to be close to 0 °C, the ideal wind speed between 0–3.3 m/s, the ideal cloud coverage between 0–25% and the snowfall duration between 1–2 h per day.
Although useful in determining the climate comfort for skiing, SUI is inevitably subject to constraints and limitations.
First, our selected climate variables may not fully reflect snow reliability at a specific destination, which is of primary interest for tourists visiting this location for snow-related activities such as skiing or snowboarding. Snow depth could describe snow reliability in a more comprehensive way compared to snowfall duration, but it is usually not included in the data provided by meteorological stations or even weather forecasts while it is difficult to calculate from the outcome of many climate models.
Another limitation is that the link between tourism comfort and climate variables was investigated separately for each selected variable. Therefore, any synergies between the different climate variables were not studied. For example, the combined effect of very low temperatures and high winds can greatly reduce comfort when skiing. Moreover, in the present work we have not considered the potential overriding effects of climatic variables (e.g., some skiers might evaluate wind as more important compared to snowfall duration in the case of extreme wind speeds). Furthermore, snowfall duration selected here to be included in the SUI is not the only factor determining the snow reliability at a destination, as during the past two decades ski resorts have widely adopted snowmaking measures and other adaptation techniques (e.g., snow grooming) to increase ski season length and, consequently, ski tourism demand. Although snowmaking is not applied yet at ski resorts in Greece and thus its omission in the SUI is not critical when applying it to those type of resorts, this is not the case in all winter tourism destinations in other countries, while it may soon become relevant also for Greece in the light of regional climate change risk assessments. For example, short snowfall duration and near-zero ambient temperatures may be ideal for skiers in resorts such as the one on the Parnassos Mountain but far from ideal when considering their effect on snowmaking.
In addition, the development of the SUI was based on the stated preferences of a total of 111 skiers at a specific large ski resort in Greece. The size of this survey sample was rather small, while it comprised mostly domestic skiers and thus the views expressed reflect more the weather preferences of the Greek population. The latter may differ from the views and preferences of tourists in other European destinations due to differences regarding the resorts’ characteristics (e.g., altitude, climatic zone, infrastructure, divergence of offered activities) and socio-economic aspects (e.g., skiers’ age, income, and familiarity with adverse weather conditions during skiing). Furthermore, the questionnaire was distributed in March when temperatures are higher compared to January or February, which may influence the skiers’ expressed weather perceptions and preferences. Finally, the specific ski resort we examined is in Greece, a southern European country with usually mild winters and limited snowfall, which inevitably affects to some extent the skiers’ weather perceptions. Therefore, our results should be taken with caution when applying them to ski resorts with different characteristics, such as at much higher altitudes and with lower typical winter temperatures (e.g., in central and northern Europe), many foreign visitors, or availability of artificial snow.


 ,
, 


