Abstract
Two years of data on cloud condensation nuclei (CCN) measured at the Liupan Mountain (LPS) Meteorological Station from August 2020 to November 2021 were analyzed in this study. The results show that the mean annual CCN concentration was 851 cm−3 and that the mean concentration of CCN increases with the supersaturation degree. The curves of the diurnal variation in CCN concentration show one peak and one valley, which correspond to the diurnal variation in the mixed-layer height and valley wind. Regarding seasonal variations, the CCN concentration, as well as the degree of internal mixing, is higher in the spring and winter, while the degree of external mixing is higher in the summer and autumn. The transport of CCN is closely related to the wind transport evolution, and the southeast and southwest sides of the LPS station contribute more to the CCN concentration in the spring and winter due to central heating in the wintertime. Though correlations between CCN concentration and pressure are scarce, the CCN concentration and temperature (or humidity) are positively (or negatively) correlated, especially in the spring. Furthermore, the 48-h backward trajectory analysis indicates that the sources in the northwest direction are a major contributor to the CCN concentration. The pollutants mainly came from the northwest and southwest sides, according to the analysis of potential sources using the PSCF and CWT approach. The study of CCN evolution and contribution area is beneficial for further research on the physical properties of cloud droplets, the influence of mountains on CCN changes and the role of CCN in terrain cloud precipitation, which are significant for the improvement of weather modification techniques.
1. Introduction
Cloud condensation nuclei (CCN) refer to suspended particles in which atmospheric water vapor condenses on their surface to form cloud droplets (liquid or solid) and atmospheric aerosol particles that can be activated under the supersaturation conditions. The concentration of CCN affects the concentration and initial size distribution of the cloud droplets, which play an important role in the process of atmospheric condensation. It is also an important factor that affects the macro- and micro-characteristics of clouds and the cloud life cycle. CCN participates in the microphysical processes of both warm and cold clouds and affects the formation efficiency of precipitation. It can effectively connect aerosols and clouds; the increase in aerosols leads to an increase in CCN, which causes changes in the number and radius of cloud droplets. Therefore, cloud condensation nuclei are an important aspect of research in the fields of cloud physics, atmospheric chemistry and environmental science. The determination of CCN concentration and source is of great practical significance to the quantitative prediction of precipitation and the study of global climate change [1,2,3,4].
The crucial problem concerning the direct observation of CCN is controlling water vapor conditions in the supersaturated state. The CCN counter (CCNC), recently developed by DMT (Droplet Measuring Technology), is based on the research work of Roberts et al. [5]. Compared with other CCN observation instruments, CCNC is more reliable [6] and widely used in CCN ground observations around the world [7,8,9].
CCN is ubiquitous in the atmosphere. A large number of ground and upper-air observation studies of CCN in different regions have been carried out abroad. Reade et al. [10] measured the CCN number concentrations through cloud chamber experiments, finding that the oceanic air mass is relatively clean and the continental air mass contains more pollutants. Kuwata et al. [11] measured the number concentration of CCN and the size distribution of CCN/CN at different supersaturation levels in Jeju Island, South Korea, and found that the number concentration of CCN/CN increases with particle size. Baumgardner D [12] found that the pattern of diurnal variation in CCN concentration is similar to that of PM2.5 due to urban pollution and emissions. Irwin M [13], who conducted the first study of CCN in the Asian rainforests, found similar hygroscopic properties of aerosols measured in the rainforests of Malaysian Borneo and the Amazon basin. Akua [14] used airborne measurements of aerosols and CCN performed in areas affected by industrial and urban pollution sources. Their results showed that local changes in CCN activity were significant but not on a regional scale, and that CCN activity varied with oxygenated organic components.
These studies showed that CCN mainly comes from the ground, the concentration of CCN decreases with the increase in height, and clouds have a depleting effect on CCN [15]. At present, CCNCs are widely used in China [16,17,18,19,20,21,22,23], and previous research has explored the influence of CCN in different regions of China, such as in the North China Plain [16,17,18], especially in the urban area of Beijing [22,23].
Shuxian Fan et al. [24] measured the concentration of cloud condensation nuclei both on the ground and at high altitudes in the Helan Mountains, which are located in the northwest of Ningxia Province. The results showed that the concentrations of CCN in stratus clouds in Ningxia hardly changed with the altitude, and the source of dust particles had little effect on the concentration of CCN. In Northwest China during the summer of 2007, Yongxin Zhao et al. [25] used a continuous airflow longitudinal thermal gradient cloud condensation nuclei meter to observe and study the CCN in the air (or on the ground). The results show that the CCN in the northwest region mainly originates from the ground, the concentration near the surface is higher, the CCN concentration decreases with the increase in height and the CCN has a clear daily variation. The fitted ground CCN activation spectrum parameters show that the Yinchuan region has continental features, while the Qilian Mountains have clean continental characteristics. Qiujuan Feng et al. [26] carried out CCN observations and research on the ground and in the air in some parts of North China, and the results show that the CCN number concentration has a clear daily variation, and the daily maximum value and daily average value increase with the supersaturation degree. Li et al. [27] observed CCN at three different heights at Mount Huang, and the results show that the variation trend of CCN concentrations at different heights with time is essentially the same and decreases with the increase in height. The diurnal variation curve of the mountain and valley is bimodal, and the peaks appear in the morning and afternoon, respectively, which correspond to the height of the atmospheric boundary layer and the change in the valley wind. Qi Li et al. [28] used the cloud condensation nucleus counter (CCNC) to observe the number concentration of CCN with a supersaturation between 0.2% and 0.8%. The results show that the average number of concentrations of CCN in this area during the observation period was higher than that in coastal areas, mountainous areas, arid areas and clean urban areas. At the same time, the light fog process has a relatively apparent clearing effect on CCN. Jiangchuan Tao et al. [29] found that when the aerosol concentration exceeds 10,000 #/cm3 and the supersaturation ratio is lower than 0.2%, the underestimation of the CCN number concentration will occur.
Liupan Mountain (hereinafter referred to as LPS) experiences more than 150 foggy days each year; therefore, it is a natural laboratory for studying clouds and fog. LPS is located in the southwest of Ningxia Province and the east of Gansu Province. It is one of the few mountains in China that runs from northwest to southeast (with an angle of nearly 30° in the north–south direction). Its ridges are over 2500 m above sea level, and it is an important water source conservation area on the Loess Plateau of western China. Due to the unique topographic effect of LPS, as the airflow passes over the cloud droplets in the mountain, due to the convergence and uplift from the topographic effect, it often reaches the leeward slope in a very short time. This causes an increase in precipitation particles, which often produce precipitation in this area [30,31]. The results of cloud catalysis experiments of hygroscopic agents show that the CCN concentration and droplet spectral distribution at the cloud base are related to precipitation efficiency [2]. Many observations and numerical simulations are carried out on the effects of aerosol, CCN and cloud droplet concentrations on precipitation. This process is complex and changeable, and it is difficult to conclude the exact relationship between CCN and precipitation.
2. Data Description
A cloud condensation nuclei counter is installed at the LPS Meteorological Station, where fog is frequently seen. The number of cloud condensation nuclei affects the concentration and initial size distribution of cloud droplets. During the atmospheric condensation process, the study of its macro- and micro-characteristics and evolution patterns is helpful for analyzing the conditions of catalytic operations. The analysis of the various characteristics and sources of CCN on LPS using counters, meteorological element data and reanalysis data can reveal the influence of CCN on cloud droplets, improve the techniques of weather modification and provide a research basis for the influence of mountains on CCN changes. In other words, CCN research is an important link in understanding the interactions between aerosols, clouds and climate. The Liupanshan area is an important water conservation area in southern Ningxia, and it is practical for carrying out background CCN observations in the local precipitation research and forecast.
2.1. Site Location
LPS Meteorological Observation Station is located in Ningxia Hui Autonomous Region, China (35°39′48″ N,106°12′00″ E, 2845.2 m above sea level). LPS is one of the few western mountains in China that extends from the northwest to the southeast (with an angle of nearly 30° in the north–south direction). It is located on the edge of the East Asian monsoon, and the LPSs are a gateway for oceanic warm and humid air to enter Northwest China and a key region for maintaining the air transport of water vapor. Since the convergence and uplift under the action of the terrain often quickly increase precipitation particles before reaching the leeward slope, precipitation frequently occurs in this area. Using the meteorological observation data of LPS for the past 30 years (from 1989 to 2018), when there is at least one fog observation record within 24 h, it is counted as one foggy day, meaning that the average number of foggy days per year is as high as 153.4 days. The site location of the LPS Meteorological Station is shown in Figure 1.

Figure 1.
Site location of LPS Meteorological Observation Station, Ningxia Hui Autonomous Region, China (Drawing approval number: GS(2019)1696).
2.2. Data
2.2.1. Cloud Condensation Nuclei and Meteorological Data
The cloud condensation nucleus counter, produced by DMT Corporation in the United States, was used to observe cloud condensation nuclei. The cloud condensation nuclei data from August 2020 to November 2021 were obtained using the cloud condensation nucleus counter (CCNC) in the LPS Meteorological Observation Station. The CCN supersaturation was fixed at 0.2%, 0.4%, 0.6%, 0.8%, 1.0%, 1.2% and 1.4%. The supersaturation was increased on the order of 0.2%~1.4%, and the sampling time of each step was 10 min. The data were collected per second and stored in hourly files as a sample. A total of 8116 samples were obtained using the cap quality control method to eliminate abnormal data, which were recorded as “0” with the instrument with “Temps Stabilized”.
Meteorological data, such as wind direction and speed, were obtained with the six-element automatic weather station installed at the LPS Meteorological Station and were collected every minute and stored in hourly files.
2.2.2. NCEP/NCAR Reanalysis Global Reanalysis Meteorological Data
The NCEP/NCAR (National Centers for Environmental Prediction/National Center for Atmospheric Research) global reanalysis meteorological data were downloaded from the NOAA Physical Sciences Laboratory (PSL) (https://psl.noaa.gov/data/gridded/data.ncep.reanalysis.html (accessed on 29 May 2022)). The data were recorded four times a day from 1 January 1948 to the present, and this study used the data from August 2020 to November 2021, which were imported into the HYSPLIT model to acquire the backward trajectories started on LPS.
2.3. Method
The “Openair function library” in Rstudio was used to analyze variations in CCN concentrations, a tool commonly used to interpret air pollution data. Data were recorded hourly, and both the monitoring data and dispersion model output could be analyzed.
HYSPLIT (hybrid single-particle Lagrangian integrated trajectory model)-4, jointly developed by the National Oceanic and Atmospheric Administration (NOAA) Air Resources Laboratory and the Australian Bureau of Meteorology, was used to obtain the backward trajectory and potential sources. The model has relatively complete transport, diffusion and deposition modules that handle multiple meteorological element input fields, physical processes and different types of pollutant emission sources, which are widely used in the transport and deposition of multiple pollutants in various regions.
3. Discussion and Conclusion
3.1. The Temporal Variations in CCN Concentration
3.1.1. The Monthly Variations in CCN Concentration
The trend of monthly mean CCN concentrations at the top of the LPS is shown in Figure 2. From August 2020 to November 2021, the mean CCN concentration was 851 cm−3. Seasonal variation features can be seen, the overall CCN concentration starts to increase in the wintertime, and the CCN concentration in the spring is the largest in all four seasons. When entering the summertime, the CCN concentration decreases. A significant deviation in August 2020 was detected due to a lack of samples, and CCN data from June 2021 are missing due to instrument maintenance.
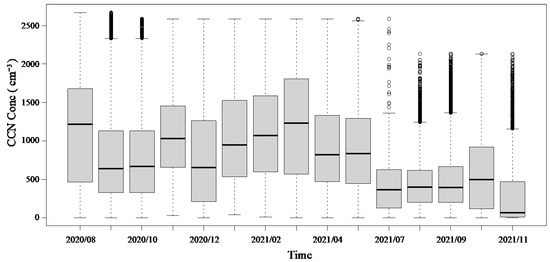
Figure 2.
The monthly concentration of CCN in LPS from August 2020 to November 2021.
The period when the supersaturation is 1.4% is very short because the statistical CCN concentration—from 26 August 2020 to 11 September 2020—is not accurate. Therefore, only the relevant statistical values of CCN under other supersaturation levels are considered in the analysis. After 18 July 2021, the supersaturation levels of 1.0% and 1.2% were not set after the instrument was returned to the factory for maintenance; the supersaturation levels of 1.0% and 1.2% after this date were not analyzed.
As is shown in Figure 3, when the supersaturation values are fixed at 0.2%, 0.4%, 0.6%, 0.8%, 1.0% and 1.2%, the average concentrations of CCN under different supersaturations are 589.6 cm−3, 669.6 cm−3, 815.7 cm−3, 908.0 cm−3, 1120.6 cm−3 and 1182.7 cm−3, respectively. A higher supersaturation state corresponds to a higher CCN concentration. The greater the supersaturation, the higher the CCN concentration after cloud chamber activation and the greater the CCN fluctuation. Although the concentrations are different, the curve of CCN concentration under different supersaturations is similar. A lower supersaturation corresponds to a greater difference in CCN concentrations between two different supersaturations, indicating that at low supersaturation, with the increase in supersaturation, more small particles of CCN were activated [4].
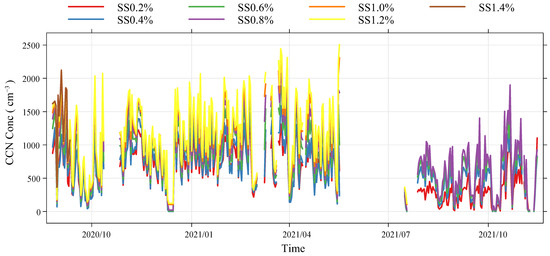
Figure 3.
Temporal variation in CCN concentrations at different supersaturation levels from August 2020 to November 2021.
3.1.2. Diurnal Variation in CCN Concentration
As is shown in Figure 4, it can be clearly detected that the daily variation in the mean CCN concentration presents a “peak and valley” distribution, with a minimum value at 06:00 AM, then it gradually increases, with a peak value at 03:00 PM. The most probable reasons for this changing trend are the mountain up-slop/down-slop wind and the height of the boundary layer. The diurnal variation in CCN concentrations observed in Yinchuan City and also observed in Ningxia Hui Autonomous Region is different from that in Yanyu Yue et al.’s work [4]. The reason for this is that the data time series used in this paper is long, and the time basis for the daily variation in CCN concentrations obtained in Yinchuan is 1 day. Alternatively, the reason for this may be that the changes in the CCN concentrations in high mountains and cities are different.
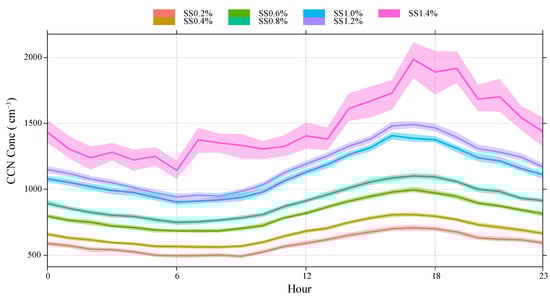
Figure 4.
The diurnal variation in CCN in LPS.
Figure 5 shows the changes in CCN concentrations during the day (08:00 AM to 08:00 PM) and at night (08:00 PM to 08:00 AM), respectively. It can be clearly seen that the CCN concentration during the day gradually increases with the passage of time, and the concentration after nightfall decreases. The main reason for this gradual decline is that the pollutants at the bottom of the mountain are vertically transported upward due to the valley wind blowing during the day. On the contrary, when the mountain wind blows at night, due to the action of the clean air mass from the top of the mountain, the clearing effect of the mountain wind on CCN becomes clear.
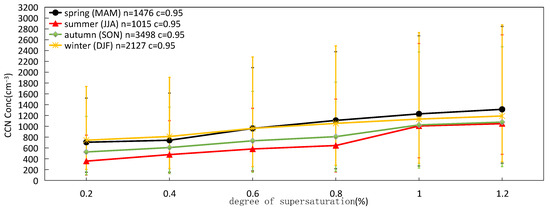
Figure 5.
Seasonal variation in CCN concentration under different degrees of supersaturation in LPS.
Some studies indicate that the diurnal variation in CCN concentrations in high mountains is related to the diurnal variation in the height of the mixed layer. During the daytime, the boundary layer is uplifted [32], and the polluted gas is transported up to the top of the boundary layer through turbulent flow. At night, the pollutants return to the ground with the decline in the boundary layer. At night and in the early morning, the top of the mountain is above the boundary layer, and the aerosol concentration is small. After sunrise, solar radiation gradually increases, and the boundary layer gradually rises from the bottom to the top of the mountain. CCN and aerosol particles are transported upward, and the CCN concentration at the top of the mountain gradually increases. At 05:00 PM, the solar radiation is weakened, the height of the boundary layer is decreased, the vertical mixing effect of the turbulence is weakened, the turbulent diffusion is suppressed, the aerosol particles at the top of the mountain are decreased, and the concentration of CCN also begins to decline. At the same time, the diurnal variation in CCN is also affected by the valley wind. Yan Yin et al. [33], when studying the diurnal variation in Huang Mountain aerosol particles, also determined that the wind blows from the valley to the hillside during the day, and aerosol particles with a high concentration in the lower layer are transported upwards into the air. The aerosols have a certain accumulation effect; the wind blows from the hillside to the valley at night, which leads to a decrease in aerosol concentration.
3.1.3. Seasonal Diurnal Variation in CCN Concentrations in Different Seasons
Under each supersaturation in different seasons, the change in the CCN number concentration is obtained. The data volume of the 1 h file is 1476 in the spring, 1015 in the summer, 3498 in the autumn and 2127 in the winter. Due to the missing data in the spring and summer, the amount of data is relatively small. It can be seen from the CCN number concentration under different degrees of supersaturation in different seasons (Figure 5), when the supersaturation is less than 0.6%, the CCN number concentration values are: winter (981.80 cm−3) > spring (1009.50 cm−3) > autumn (795.29 cm−3) > summer (684.89 cm−3). When the supersaturation degree is greater than 0.6%, the CCN number concentration values are: spring > winter > autumn > summer. The lowest CCN number concentration in the summer may be due to more rain, which has a scouring effect on CCN. The highest CCN concentrations in the spring and winter may be related to coal-fired emissions.
The diurnal variations in CCN concentration in different seasons are shown in Figure 6. The CCN concentrations are higher in the spring and in the winter, with average concentrations of 1009.50 cm−3 and 981.80 cm−3, respectively, and the average CCN concentration in the autumn is 795.29 cm−3. The CCN concentration in the summer is the smallest, with a mean concentration of 684.89 cm−3, and when the summer supersaturation is 1.0% and 1.2%, the diurnal variation in CCN concentration fluctuates greatly due to the small number of 1.0% and 1.2% supersaturation data used in these statistics. The Liupan Mountains often produce precipitation due to their topographic effect in the summer. Therefore, the CCN concentration in the summer may be the lowest compared with other seasons due to the scouring effect of rain. Ningxia is dry, cold and rainy in the winter, with more sunlight in the afternoon and stronger ultraviolet rays. The relatively high CCN concentration in the afternoon in the winter may also be related to particle regeneration under light, especially the strong solar radiation in the afternoon, which is conducive to the transformation of air particles and differs from other research results. For example, in a CCN observation study in Nanjing, an area that always has wet, cold and cloudy days in the autumn and winter, Wang Hui et al. [2] found a clear trough value of CCN concentration in the afternoons of autumn and winter, which may be related to the poor activation ability of aerosols caused by low humidity in the afternoons of autumn and winter. Therefore, different underlying surfaces, differences in aerosol source emissions, environmental meteorological conditions and differences in aerosol physicochemical properties all affect the seasonal variation characteristics of CCN concentration.
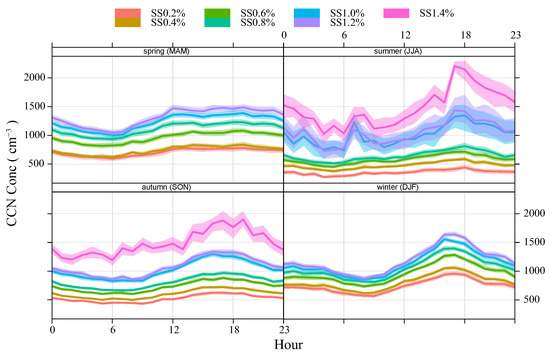
Figure 6.
Seasonal diurnal variation in CCN in LPS.
The variation in CCN concentrations in the four seasons essentially shows a unimodal trend, and due to the small number of samples, the period when the peaks occur in the spring and in the summer may not be as concentrated as in the autumn and in the winter. This is different from the study of cloud condensation nuclei under different weather conditions in Nanjing by Wang Hui et al. [2]. This study found that the diurnal variation in CCN concentration in the spring, autumn and winter has the characteristics of double or triple peaks. The peak value of CCN concentration mainly appeared in the morning and evening, and the trough value appeared in the noon and afternoon. These different results are due to different underlying surfaces. The sampling site in Nanjing is in the city, and the large number of polluting gases emitted at night from industrial areas near the observation point provides an important source of atmospheric aerosols, meaning that CCN easily accumulates in the near-surface atmosphere. Meanwhile, the results of this study are based on mountain ridge sampling in a region far from important emission sources, such as factories. This reflects the largest difference in CCN concentrations between urban and mountainous regions.
The average values of CCN concentrations at different supersaturation levels are shown in Table 1. From the analysis of aerosol mixing characteristics, the degree of internal mixing is higher in the spring and winter, and the degree of external mixing is higher in the summer and autumn.

Table 1.
The seasonal average value of different levels of supersaturation.
3.2. The CCN Transport Characteristics
3.2.1. Relationship between the CCN Concentration and Wind Direction
The relationship between CCN concentration and wind direction was determined. Based on the Openair function library, the horizontal wind evolution of 10 m and the CCN concentration values were analyzed to obtain the average wind direction that corresponds to part of the CCN concentration. As shown in Figure 7, the rose chart of the average CCN concentration in the spring, summer, autumn and winter at the top of LPS is provided.
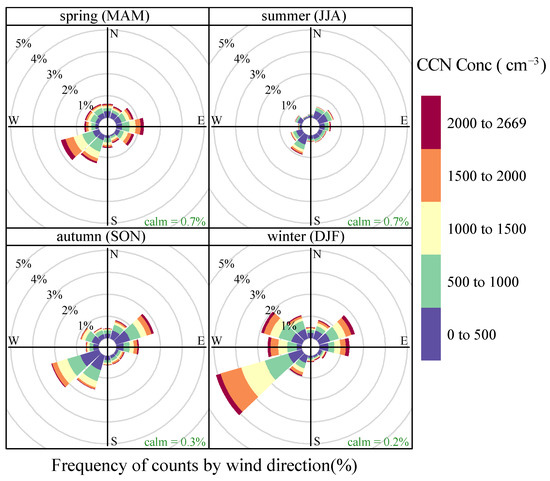
Figure 7.
Contribution of four seasonal wind directions to CCN concentration.
It can be seen that the dominant wind frequency in the southwest is relatively large in the four seasons. The CCN concentration at the LPS station was relatively high under the three wind directions of southwest, northeast and the east. There are two counties adjacent to the southwest of the LPS Station and at the foot of the east side of the mountain, respectively (Longde and Jingyuan counties), which represent the influence of CCN generated by human activities on both sides of the LPS Station. The mean CCN concentrations in other directions were relatively low, showing that the other directions of the site were relatively clean and less affected by human activities.
As shown in Figure 8, the contribution of the LPS Station to the CCN concentration during the daytime mainly derives from the northeast and east, and the next peak value occurred in the southwest wind. The contribution of CCN concentration at night is mainly from the southwest direction of the LPS Station, and this variation pattern is related to the valley wind.
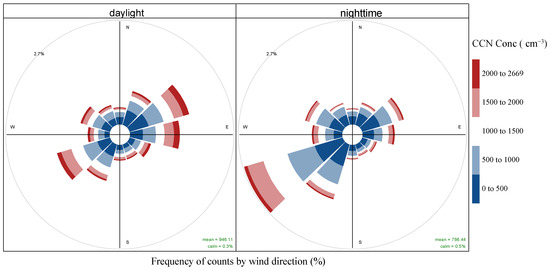
Figure 8.
Contribution of wind directions to CCN concentration during daylight and nighttime.
Figure 9 shows the CCN concentration around the LPS Station according to wind speed and wind direction in polar coordinates based on the Openair function library. It can be seen that the direction on the northwest side of the CCN monitoring point makes little contribution to the CCN concentration because of the position of the station building. In the spring and winter, the concentration of CCN on both sides of the LPS is relatively high and supposedly influences central heating levels in the county from November to March of the following year. During the autumn, the contribution to the CCN concentration of the LPS Station mainly comes from the northeast side. It is worth noting that the predominating wind is from the southwest and northeast directions during the summer, but the maximum CCN concentration comes from the east. Due to the CCN concentration brought by southwest and northeast winds, this concentration is not as high as that brought by the east winds according to the increase in CCN concentration in the air during the summer, as shown in Figure 7.
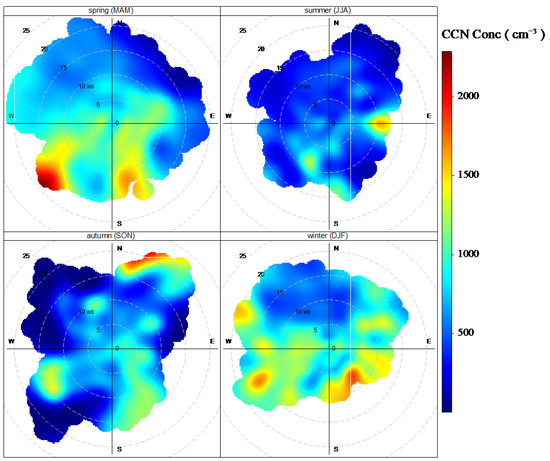
Figure 9.
The analysis of potential sources using the CPF approach of CCN from August 2020 to November 2021.
3.2.2. Relationship between the CCN Concentration and Temperature, Humidity and Pressure
According to the correlation coefficients between CCN concentration and temperature, humidity and pressure under different supersaturation degrees (Table 2), there is little correlation between CCN concentration and pressure, but there are positive and negative correlations with temperature and humidity. During the summer, with a supersaturation of 1.0% and 1.2%, a small correlation is used in these statistics due to the low number of data. Beyond that, the correlation between CCN concentration and meteorological elements is as follows: spring > summer > autumn > winter.
Table 2.
Correlation between CCN concentration and meteorological elements.
3.3. Backward Trajectory Analysis of the CCN Concentration
The HYSPLIT-4 model is used to calculate the 48-h backward trajectories for each month from August 2020 to November 2021. The 48-h backward trajectory is clustered into six clusters, and the western path is proportionately stable in the CCN source path during these two years. Among them, from July to October, there is a CCN source path from the southeast. As shown in Figure 10, the CCN source in the northwest direction accounts for a higher proportion, and it is highly possible that the sources in the northwest direction of the LPS contribute more to the CCN.
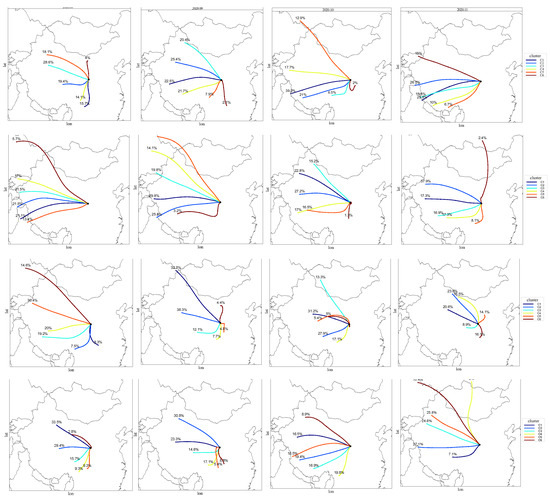
Figure 10.
The 48-h backward trajectory cluster into six clusters from August 2020 to November 2021.
Three different methods were used to analyze the potential sources of CCN and PSCF (potential source contribution function). As shown in Figure 11a, the spring mainly comes from the southwest direction of the LPS, and is considered the main source of Gansu. The urban agglomeration, as the center, has a greater contribution to the CCN of LPS, which indicates the impact of pollutants generated by human activities on the CCN observations. The contribution of pollution sources in the summer comes from the south, mainly due to the influence of the summer monsoon, and the northward lift of the southwest warm and humid airflow affects the LPSs. In autumn and winter, the source of the CCN is mostly from the northwest, and Xinjiang contributes more to this, mainly due to the influence of the winter monsoon, which is caused by cold air from Siberia traveling southward.
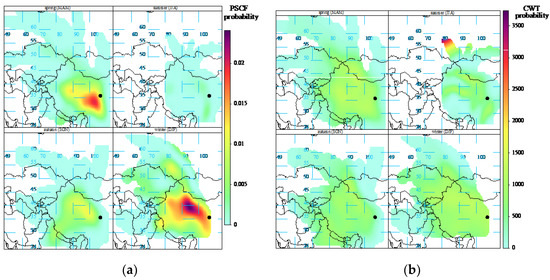
Figure 11.
The analysis of potential sources using the (a) PSCF and (b) CWT approaches of CCN from August 2020 to November 2021.
As shown in Figure 11b, the CWT (concentration-weighted trajectory) concentration-weighted increment shows little change in the spring, autumn and winter. A high concentration of CCN is detected in Russia in the summer. The possible reason for this is a combination of the cold air from Siberia and the warm and humid air from Southwest China in summer. Convective weather commonly intersects at the LPS, and the cold air from Siberia has a greater contribution to the CCN. Located at the northeastern edge of the Qinghai–Tibet Plateau, LPS has little contribution to CCN concentration in the summer. The potential source azimuths analyzed with the PSCF and the CWT methods are essentially consistent with the backward trajectory, and the western path has a larger proportion.
4. Conclusions
The CCN at the LPS station from August 2020 to November 2021 has been investigated. The overall level of CCN concentration was 851 cm−3. The mean concentration of CCN under different supersaturation degrees increases with the supersaturation degree. The concentration value trend of CCN in LPS is: winter > spring > autumn > summer, which may be related to the scouring effect on CCN of more rain in summer and coal-fired emissions in spring and winter. The curves of the diurnal variation in CCN concentration show one peak and one valley, which correspond to the diurnal variation in the mixed layer height and the valley wind.
The CCN concentration is affected by different underlying surfaces, meteorological elements, aerosol source emissions and aerosol physicochemical properties. Temperature and relative humidity have an impact on CCN. The transport of CCN is closely related to the wind transport evolution, and the southeast and southwest sides of the LPS Station contribute more to the CCN concentration in the spring and winter due to the need for central heating during the wintertime. Compared with the high CCN concentration in the city, and because of the industrial areas and traffic pollution sources in the city, the CCN concentration on the Liupan Mountain ridge is generally low, with a clean environment and fewer pollution sources.
The 48-h backward trajectory analysis indicated that the western path always occupies a relatively stable proportion in the CCN source path from August 2020 to November 2021, and the sources in the northwest direction are major contributors to the CCN concentration. The pollutants mainly came from the northwest and southwest sides, according to the analysis of potential sources using the PSCF approach. Regarding the impact of pollutants produced by human activities on the observed values of CCN, summer, autumn and winter are greatly affected by summer and winter monsoons.
The CWT method shows that the contribution of the Siberian cold air to the CCN is greater in the summer. The northeastern edge of the Qinghai–Tibet Plateau has no obvious horizontal contribution to LPS and acts as a heat source in the summer, lifting and transporting air in an upward direction. The potential source azimuths analyzed with the PSCF and CWT methods are essentially consistent with the backward trajectory, and the western path occupies a larger proportion.
The results of this study can provide a theoretical basis and reference for the study of the background CCN parameterization scheme in the Liupan Mountain area, which is conducive to further research on the formation mechanism of cloud precipitation in this area and related parameterization schemes under different fog conditions. Due to the short deployment time and high maintenance of cloud condensation nuclei counters, there are no data for comparison and analysis on both sides of the mountain. Future research should combine the CCN data and droplet spectrum data to analyze the CCN concentration under different fog process conditions, find the relationship between the CCN concentration and fog formation, show the CCN concentration on foggy and sunny days, and determine different sources of fog formation.
Author Contributions
Conceptualization, T.L. and T.T.; methodology, H.W.; software, C.L.; validation, T.T.; resources, Z.S.; data curation, J.M.; writing—original draft preparation, T.L.; writing—review and editing, N.C. and H.Z.; visualization, T.L.; supervision, Z.S.; project administration, L.T. All authors have read and agreed to the published version of the manuscript.
Funding
This research was funded by Key Laboratory for Cloud Physics of China Meteorological Administration grant number (2020Z007) and The Key R & D projects in Ningxia Hui Autonomous Region grant number (2022BEG02010) and Ningxia Natural Science Foundation of China grant number (2022AAC03684).
Institutional Review Board Statement
Not applicable.
Informed Consent Statement
Not applicable.
Data Availability Statement
The NCEP/NCAR (National Centers for Environmental Prediction/National Center for Atmospheric Research) global reanalysis meteorological data were downloaded from the NOAA Physical Sciences Laboratory (PSL) (https://psl.noaa.gov/data/gridded/data.ncep.reanalysis.html (accessed on 29 May 2022)). Due to the confidentiality requirements of special observational data, the original CCN data can be obtained by applying to the Ningxia Meteorological Bureau.
Conflicts of Interest
The authors declare no conflict of interest.
References
- Sax, R.I.; Hudson, J.G. Continentality of the South Florida Summertime CCN Aerosol. J. Atmos. Sci. 2010, 38, 1467–1479. [Google Scholar] [CrossRef]
- Hui, W.; Xiaoli, L.; Linjun, A.; Wei, D. Observational study of cloud condensation nuclei under different weather and visibility in Nanjing. Meteorol. Sci. 2016, 36, 800–809. (In Chinese) [Google Scholar]
- Dahe, Q. Research on China’s Meteorological Development Strategy; Meteorological Press: Beijing, China, 2004. (In Chinese) [Google Scholar]
- Yanyu, Y.; Shengjie, N.; Jianren, S.; Jingjing, L. Observational study on the distribution of cloud condensation nuclei and its causes in drought region. China Environ. Sci. 2010, 30, 593–598. (In Chinese) [Google Scholar]
- Roberts, G.; Nenes, A. A continuous-flow streamwise thermal-gradient CCN chamber for atmospheric measurements. Aerosol Sci. Technol. 2005, 39, 206–221. [Google Scholar] [CrossRef]
- Rose, D.; Gunthe, S.S.; Mikhailov, E.; Frank, G.P.; Dusek, U.; Andreae, M.O.; Pöschl, U. Calibration and measurement uncertainties of a continuous flow cloud condensation nuclei counter (DMT-CCNC): CCN activation of ammonium sulfate and sodium chloride aerosol particles in theory and experiment. Atmos. Chem. Phys. 2008, 8, 1153–1179. [Google Scholar] [CrossRef]
- Ervens, B.; Cubison, M.J.; Andrews, E.; Feingold, G.; Ogren, J.A.; Jimenez, J.L.; Quinn, P.K.; Bates, T.S.; Wang, J.; Zhang, Q.; et al. CCN predictions using simplified assumptions of organic aerosol composition and mixing state:a synthesis from six different locations. Atmos. Chem. Phys. 2010, 10, 4795–4807. [Google Scholar] [CrossRef]
- Kerminen, V.M.; Paramonov, M.; Anttila, T.; Riipinen, I.; Fountoukis, C.; Korhonen, H.; Asmi, E.; Laakso, L.; Lihavainen, H.; Swietlicki, E.; et al. Cloud condensation nuclei production associated with atmospheric nucleation: A synthesis based on existing literature and new results. Atmos. Chem. Phys. 2012, 12, 12037–12059. [Google Scholar] [CrossRef]
- Whitehead, J.D.; Irwin, M.; Allan, J.D.; Good, N.; Mcfiggans, G. A meta analysis of particle water uptake reconciliation studies. Atmos. Chem. Phys. 2014, 14, 11833–11841. [Google Scholar] [CrossRef]
- Reade, L.; Jennings, S.G.; Mcsweeney, G. Cloud condensation nuclei measurements at Mace Head, Ireland, over the period 1994–2002. Atmos. Res. 2006, 82, 610–621. [Google Scholar] [CrossRef]
- Kuwata, M.; Kondo, Y.; Miyazaki, Y.; Komazaki, Y.; Kim, J.H.; Yum, S.S.; Tanimoto, H.; Matsueda, H. Cloud condensation nuclei activity at Jeju Island, Korea in spring 2005. Atmos. Chem. Phys. 2007, 8, 2933–2948. [Google Scholar] [CrossRef]
- Baumgardner, D.; Raga, G.B.; Muhlia, A. Evidence for the formation of CCN by photochemical processes in Mexico City. Atmos. Environ. 2004, 38, 357–367. [Google Scholar] [CrossRef]
- Irwin, M.; Robinson, N.; Allan, J.D.; Coe, H.; McFiggans, G. Size-resolved aerosol water uptake and cloud condensation nuclei measurements as measured above a Southeast Asian rainforest during OP3. Atmos. Chem. Phys. 2011, 11, 11157–11174. [Google Scholar] [CrossRef] [Green Version]
- Asa-Awuku, A.; Moore, R.H.; Nenes, A.; Bahreini, R.; Holloway, J.S.; Brock, C.A.; Middlebrook, A.M.; Ryerson, T.B.; Jimenez, J.L.; DeCarlo, P.F.; et al. Airborne cloud condensation nuclei measurements during the 2006 Texas Air Quality Study. J. Geophys. Res. Atmos. 2011, 116, D11. [Google Scholar] [CrossRef]
- Lixin, S.; Ying, D. Observations of cloud condensation nuclei in North China. Acta Meteorol. Sin. 2007, 65, 644–652. (In Chinese) [Google Scholar]
- Wiedensohler, A.; Cheng, Y.F.; Nowak, A.; Wehner, B.; Achtert, P.; Berghof, M.; Birmili, W.; Wu, Z.J.; Hu, M.; Zhu, T.; et al. Rapid aerosol particle growth and increase in cloud condensation nucleus activity by secondary aerosol formation and condensation: A case study for regional air pollution in northeastern China. J. Geophys. Res. Atmos. 2009, 114, D00G08. [Google Scholar] [CrossRef]
- Deng, Z.Z.; Zhao, C.S.; Ma, N.; Liu, P.F.; Ran, L.; Xu, W.Y.; Chen, J.; Liang, Z.; Liang, S.; Huang, M.Y.; et al. Size-resolved and bulk activation properties of aerosols in the North China Plain. Atmos. Chem. Phys. 2011, 11, 3835–3846. [Google Scholar] [CrossRef]
- Tingting, W. The Characteristic of Cloud Condensation Nuclei in North China Plain. Master’s Thesis, Chinese Academy of Meteorological Sciences, Beijing, China, 2011. (In Chinese). [Google Scholar]
- Rose, D.; Nowak, A.; Achtert, P.; Wiedensohler, A.; Hu, M.; Shao, M.; Zhang, Y.O.M.; Pschl, U. Cloud condensation nuclei in polluted air and biomass burning smoke near the mega-city Guangzhou. China-Part l: Sizeresolved measurements and implications for the modeling of aerosol particle hygroscopicity and CCN activity. Atmos. Chem. Phys. 2010, 10, 3365–3383. [Google Scholar] [CrossRef]
- Leng, C.; Cheng, T.; Chen, J.; Zhang, R.; Tao, J.; Huang, G.; Zha, S.; Zhang, M.; Fang, W.; Li, X.; et al. Measurements of surface cloud condensation nuclei and aerosol activity in downtown Shanghai. Atmos. Environ. 2013, 69, 354–361. [Google Scholar] [CrossRef]
- Meng, J.W.; Yeung, M.C.; Li, Y.J.; Lee, B.Y.L.; Chan, C.K. Size-resolved cloud condensation nuclei(CCN)activity and closure analysis at the HKUST supersite in Hong Kong. Atmos. Chem. Phys. 2014, 14, 10267–10282. [Google Scholar] [CrossRef]
- Gunthe, S.S.; Rose, D.; Su, H.; Garland, R.M.; Achtert, P.; Nowak, A.; Wiedensohler, A.; Kuwata, M.; Takegawa, N.; Kondo, Y.; et al. Cloud condensation nuclei(CCN)from fresh and aged air pollution in the megacity region of Beijing. Atmos. Chem. Phys. 2011, 11, 11023–11039. [Google Scholar] [CrossRef]
- Cheng, Y.F.; Su, H.; Rose, D.; Gunthe, S.S.; Berghof, M.; Wehner, B.; Achtert, P.; Nowak, A.; Takegawa, N.; Kondo, Y.; et al. Size-resolved measurement of the mixing state of soot in the megacity Beijing, China: Diurnal cycle, aging and parameterization. Atmos. Chem. Phys. 2012, 12, 4477–4491. [Google Scholar] [CrossRef]
- Shuxian, F.; Xialan, A. Measurement and analysis of the concentration of cloud condensation nuclei in MT Helanshan area. J. Desert Res. 2000, 20, 107–109. (In Chinese) [Google Scholar]
- Zhao, Y.; Niu, S.; Lv, J.; Xu, J.; Sang, J. Observational analyses on cloud condensation nuclei in northwestem China in summer of 2007. Plateau Meteorol. 2010, 29, 1043–1049. (In Chinese) [Google Scholar]
- Feng, Q.J.; Li, P.R.; Fan, M.Y.; Hou, T.J. Observational analysis of cloud condensation nuclei in some regions of North China. Trans. Atmos. Sci. 2012, 35, 533–540. (In Chinese) [Google Scholar]
- Li, L.; Yin, Y.; Gu, X.S.; Chen, K.; Tan, W.; Yang, L.; Yuan, L. Observational study of cloud condensation nuclei propeaies at various altitudes of Huangshan Mountains. Chin. J. Atmos. Sci. 2014, 38, 410–420. (In Chinese) [Google Scholar]
- Li, Q.; Yin, Y.; Gu, X.; Yuan, L.; Kong, S.; Jiang, Q.; Chen, K.; Li, L. An observational study of aerosol hygroscopic growth factor and cloud condensation nuclei in Nanjing in summer. China Environ. Sci. 2015, 35, 337–346. (In Chinese) [Google Scholar]
- Jiangchuanl, T.; Chunshen, Z.; Nan, M.A.; Mengyu, H. Laboratory Study of Factors Impacting Measurements of the Cloud Condensation Nuclei Number Concentration. J. Peking Univ. (Nat. Sci. Ed.) 2018, 54, 699–704. (In Chinese) [Google Scholar]
- Zhang, P.; Yao, Z.; Jia, S.; Chang, Z.; Sang, J.; Gao, L.; Zhao, W.; Wang, W.; Zhu, X. Study on the Characteristics of Atmospheric Water Resources and Hydrometeor Precipitation Efficiency over the LPS Area. Atmos. Sci. 2020, 44, 421–434. (In Chinese) [Google Scholar]
- Bao-jian, W.; Yu-xia, H.; Jin-hai, H.; Li-juan, W. Relation between Vapour Transportation in the Period of East Asian Summer Monsoon and Drought in Northwest China. Plateau Meteorol. 2004, 23, 912–918. (In Chinese) [Google Scholar]
- Philippin, S.; Betterton, E.A. Cloud condensation nuclei concentrations in Southern Arizona: Instrumentation and early observations. Atmos. Res. 1997, 43, 263–275. [Google Scholar] [CrossRef]
- Yin, Y.; Chen, C.H.; Chen, K.; An, J.; Wang, W.; Lin, Z.; Yan, J.; Wang, J. An observational study of the microphysical properties of atmospheric aerosol at Mt. Huang. Trans. Atmos. Sci. 2010, 33, 129–136. (In Chinese) [Google Scholar]
Publisher’s Note: MDPI stays neutral with regard to jurisdictional claims in published maps and institutional affiliations. |
© 2022 by the authors. Licensee MDPI, Basel, Switzerland. This article is an open access article distributed under the terms and conditions of the Creative Commons Attribution (CC BY) license (https://creativecommons.org/licenses/by/4.0/).