Abstract
The depolarization ratio and backscattering cross sections have been calculated for shapes and size of ice crystals that are typical in cirrus clouds. The calculations are performed in the physical-optics approximation. It is shown that the depolarization ratio approaches some constant when the size of the crystals becomes much larger than the incident wavelength. For the transparent ice crystals, when absorption is absent, the magnitude of this constant strongly depends on crystal shapes. This fact allows inferring the crystal shape from magnitudes of the depolarization ratio in lidar signals. For the lidar wavelengths, where absorption of light is considerable, the depolarization ratio of lidar signals can be used for inferring crystal sizes. Such results are important for the development of algorithms interpreting the signals obtained by both ground-based and space-borne lidars.
1. Introduction
Polarization lidars are prospective tools for studying the microphysical properties of clouds and dust in the atmosphere [1,2]. In these studies, the cloud microphysics is inferred from dimensionless quantities such as the color ratio, lidar ratio and depolarization ratio. Among them, the depolarization ratio is the most common quantity because of the simplicity of its measurement.
At the beginning of lidar studies of atmospheric clouds, the depolarization ratio was used for distinguishing between water-drop and ice-crystal clouds [3,4,5]. Later, there were attempts to infer the ice crystal shapes from magnitudes of the depolarization ratio [6,7,8]. At present, the depolarization ratio is used as one of the important parameters in various numerical models for retrieving cirrus cloud microphysics from the data obtained by combined measurements with lidars, radiometers and radars [9,10,11,12,13,14,15,16,17,18,19,20,21,22,23,24,25].
In spite of the demands of the depolarization ratio for practical needs, magnitudes of the depolarization ratio in cirrus clouds are not reliably known yet. The reason for this is that the problem of light scattering by a single ice crystal has not been solved, both theoretically and numerically [26]. There are several obstacles around the numerical calculation of the depolarization ratio. First, the sizes of the ice crystals range from several, to thousands of micrometers. For the visible wavelengths, the size parameter , where D is the particle size and ¦Ë is the wavelength, reaches several thousand, while up-to-date computers are capable of calculating by rigorous numerical methods only cases of . Second, the light scattered by a large crystal particle at the backward direction proves to be very sensitive to crystal orientation. For randomly oriented crystals, the main portion of computer time is spent on statistical averaging over orientations. Therefore, different approximations and numerical algorithms are used in literature [1,27,28,29] that are not always well coordinated with each other.
In our previous papers [30,31], we presented the depolarization ratio in cirrus clouds for large crystal sizes obtained in physical-optics approximation. However, such calculations for large crystals (at ) demanded large computer resources. Recently, we have recalculated these data using high-performance computing with a IAO SB RAS supercomputer. As a result, we were convinced that the previous data concerning the depolarization ratio should be improved. In particular, such correction is important for the development of algorithms interpreting lidar signals from space-borne lidars [16] such as CALIPSO [11,12,13], EarthCARE, and others. In this paper we show the improved magnitudes of the depolarization ratio in cirrus clouds and present their interpretation.
2. Scattering Matrix and Depolarization Ratio
The light scattered by a particle is a function of the scattering direction , where and are the zenith and azimuthal scattering angles, respectively, and the incident light is assumed to propagate in the direction . The incident and scattered light in the conventional coordinate system on the scattering direction sphere are described by the Stokes vector and In general, these vectors are connected by the so-called phase matrix 4 × 4 [26]
where the distance between the particle and the point of observation is omitted.
In the case of randomly oriented particles, the phase matrix reduces to the 4 × 4 scattering matrix depending on the zenith angle. For the backward direction detected by lidars, the scattering matrix has the following form
In cirrus clouds, the quantities and are usually negligible. Assume that a lidar emits the linearly polarized light
then the backscattered light is equal to
In polarization lidars, the backscattered intensity can be divided into two intensities and corresponding to orientations of the detector polarizer either parallel or perpendicular to polarization of the incident light. By definition, we obtain
This is the ratio
that is conventionally called the depolarization ratio. In notation of the scattering matrix, the depolarization ratio is equal to
3. Depolarization Ratio vs. Crystal Size
While the depolarization ratio for ice crystals of small sizes where is more or less described in the literature [1], only a few papers considering the large crystals with have been published [27,29,30,31]. In this paper, the improved data of the papers [30,31] are presented.
The backscattering matrix for a randomly oriented crystal of Equation (2) is characterized by two quantities and or, equivalently, by the backscattering cross section and the depolarization ratio ¦Ä of Equation (7). These values as functions of the droxtal size are shown in Figure 1a,b. The droxtal shape is drawn in Figure 1a. The droxtal parameters are described in detail in Ref. [32].
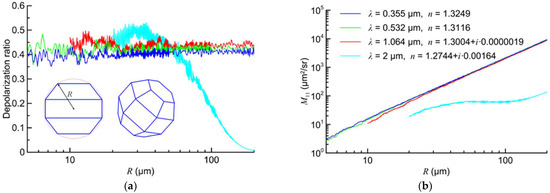
Figure 1.
Depolarization ratio δ (a) and backscattering cross section (b) for droxtals at the conventional lidar wavelengths.
The main feature seen in Figure 1a is that the depolarization ratio has weak dependence on particle size.
However, this feature is valid only for transparent particles, i.e., if the absorption of light determined by the imaginary part of the refractive index n is negligible. Otherwise, absorption leads to a fast decrease of both the depolarization ratio and the backscattering cross section that is demonstrated in Figure 1 for the wavelength of 2 µm.
It is worthwhile to note that Figure 1a also shows small fluctuations of the depolarization ratio. These fluctuations are explained by the interference of the backscattered waves and this phenomenon will be discussed in detail later.
Note, the backscatter has been calculated by our physical-optics approximation. We consider that this approximation is applicable if the particle size is larger than 20 wavelengths of the incident light. In the case of droxtals, the particle size is equal to 2R. Consequently, the curves of Figure 1, calculated in the physical-optics approximation, are presented for R > 10 μm at the wavelength λ = 1.064 μm and for R > 20 μm at the wavelength λ = 2 μm.
We used realistic refractive indices for the calculations presented in Figure 1 [33]. For an explanation of the results shown in Figure 1, we have calculated the scattering matrix for the droxtal with some arbitrary magnitudes of the refractive index. The results are shown in Figure 2.
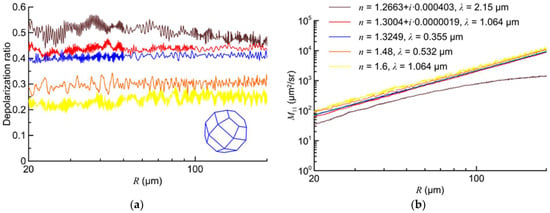
Figure 2.
Depolarization ratio δ (a) and backscattering cross section (b) for droxtals at the arbitrary magnitudes of the refractive index.
In Figure 2a we see the previous regularities. Namely, the depolarization ratios are the functions with weak fluctuations about constants. Moreover, these constants are determined by the real part of the refractive index. The larger the real part of refractive index, the smaller the magnitude for the depolarization ratio. This result is demonstrated in Figure 2a.
Thus, we obtain two important results. First, the depolarization ratio for transparent crystals approaches some constant if crystal size is increasing. Second, this constant decreases for increasing refractive index.
These important results have the following qualitative explanation. Let us remind that the backscattered light within the physical-optics approximation is a set of outgoing spherical waves, where every wave is associated with a geometric-optics plane-parallel beam propagating inside the crystal. Every beam is characterized by its trajectory, describing a succession of reflections by crystal faces. When a crystal size increases, the transverse size of any beam increases too, but the shape of the trajectory remains the same. The depolarization ratio of Equation (6) depends only on the trajectory shape. Consequently, the depolarization ratio does not change at increasing crystal size. On the contrary, a change of the refractive index leads to new geometries of the beam trajectories. It is obvious that the higher the number of reflections along the backscattered trajectories (i.e., the less is the refractive index), the higher the depolarization ratio. This fact is demonstrated in Figure 2.
These conclusions are also supported by our calculations for a crystal with the shape of an arbitrary polyhedron, that are presented in Figure 3 and Figure 4.
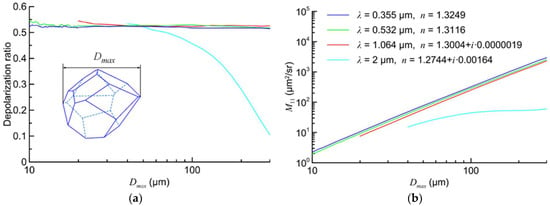
Figure 3.
Depolarization ratio δ (a) and backscattering cross section (b) for arbitrary polyhedron at conventional lidar wavelengths.
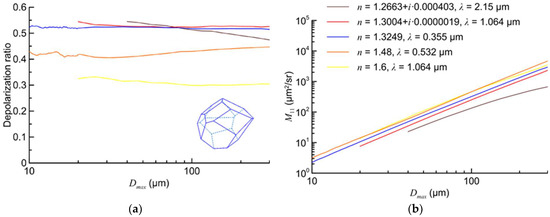
Figure 4.
Depolarization ratio δ (a) and backscattering cross section (b) for arbitrary polyhedron at the artificial magnitudes of the refractive index.
Here, the depolarization ratios for transparent crystals become practically some constants at . For the large sizes , the interference fluctuations of the depolarization ratio are smaller, as compared to Figure 1a. It is explained by the fact that the number of backscattered waves contributing to the total light is more for the arbitrary polyhedron, as compared with regular shapes, like the polyhedron.
4. Depolarization Ratio for Hexagonal Columns and Plates
Ice crystals with shapes of hexagonal columns and plates are common models for cirrus clouds. Their heights L and diameters D are not independent; they obey the empirical equations [34]
where Equations (8) and (9) are valid for columns and Equation (10) is used for plates.
Backscattered light consists of a lot of outgoing spherical waves associated with the geometric-optics beams inside the crystals. The trajectories of the beams for hexagonal ice columns and plates have been well studied earlier [35]. It was shown that the backscatter by the hexagonal ice columns and plates is determined mainly by the so-called corner-reflection trajectories.
The results of our calculations of the scattering matrix for randomly oriented hexagonal ice column and plates, are shown in Figure 5 and Figure 6. It is known that the backscattered light fluctuates because of phase difference among the waves. These fluctuations also remain after averaging over crystal orientations that is shown in Figure 5a at . Then, these fluctuations have been smoothed at by a procedure of moving average. Note that the fracture of the curve of Equation (9) at is well manifested in Figure 5b, and weakly manifested in Figure 5a.
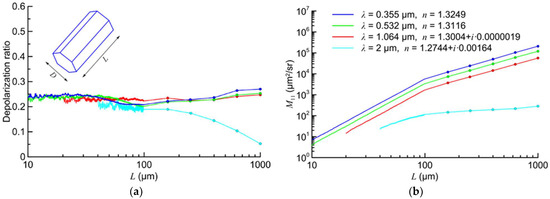
Figure 5.
Depolarization ratio δ (a) and backscattering cross section (b) for hexagonal column at the conventional lidar wavelengths.
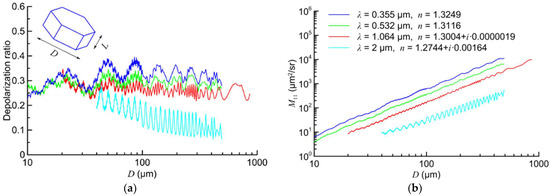
Figure 6.
Depolarization ratio δ (a) and backscattering cross section (b) for hexagonal plate at the conventional lidar wavelengths.
The case of the hexagonal plate presented in Figure 6 leads to more complicated results. Here, the main peculiarity seen in Figure 6a is that the small-scale fluctuations caused by interference among the backscattered waves are added to the large-scale fluctuations. These large-scale fluctuations of the depolarization ratio in Figure 6a are accompanied by the same large-scale fluctuations of the backscattering cross section in Figure 6b.
It is known that the backscattering cross section fluctuates at increasing diameter D because of changing the aspect ratio of the hexagonal plate according to Equation (10). These fluctuations of the backscattering cross section are similar to the well-known fluctuations of light intensity inside a planar waveguide. Consequently, the large-scale fluctuations of the depolarization ratio in Figure 6a are caused by the varying aspect ratio.
In nature, the crystal sizes in clouds are distributed according to some probability laws. A calculation of the backscatter, taking into account such distributions, is a subject of our next paper. Nevertheless, we believe that the small-scale fluctuations will be smoothed after such averaging over size, while the large-scale fluctuations will remain.
Figure 1, Figure 2, Figure 3, Figure 4, Figure 5 and Figure 6 show that the depolarization ratio for transparent ice crystals weakly fluctuates, but it approaches the value that can be assumed as a constant. The magnitudes of the constants are different for different crystal shapes. This fact can be used for inferring crystal shapes from the data of lidar measurements.
Additionally, it is seen that the appearance of light absorption inside crystals at λ = 2 μm leads to the essential decrease of the depolarization ratio (see in the cyan-color curves in Figure 1, Figure 2, Figure 3, Figure 4, Figure 5 and Figure 6). In its turn, this fact can be used for inferring the crystal sizes.
5. Conclusions
In this paper, we have presented the depolarization ratio and backscattering cross sections calculated for the typical ice crystal shapes of cirrus clouds and the wavelengths of conventional lidars. An advantage of these calculations is that they are valid for large crystal sizes up to 1000 μm. Such data are important for the development of algorithms interpreting lidar signals from space-borne lidars such as CALIPSO, EarthCARE, and others.
Additionally, the physical interpretation of the calculated data has been obtained. We show that the depolarization ratio for transparent ice crystals weakly oscillates about a value that can be assumed as a constant. We believe that these oscillations will be smoothed in lidar measurements. However, the fluctuations are considerable for the hexagonal plates. These properties can be used for inferring the shapes of transparent crystals. If the lidar radiation is absorbed by ice crystals at some wavelengths, the depolarization ratio is decreased. This decrease could be used in the lidar study of cirrus clouds for inferring the size of ice crystals, too.
Author Contributions
Conceptualization, N.K., A.K., V.S., D.T., A.B. and Z.W.; methodology, N.K., A.K., V.S., D.T., A.B. and Z.W.; software, N.K., A.K., V.S. and D.T.; validation, N.K., A.K., I.T., A.B. and Z.W.; formal analysis, N.K., A.K. and A.B.; investigation, N.K., A.K., V.S., D.T., A.B. and Z.W.; resources, A.B. and Z.W.; data curation, N.K., V.S. and D.T.; writing—original draft preparation, A.B. and Z.W.; writing—review and editing, A.B. and Z.W.; visualization, N.K. and V.S.; supervision, A.B.; project administration, A.K.; funding acquisition, A.B. All authors have read and agreed to the published version of the manuscript.
Funding
The study was supported by the Russian Science Foundation, grant number 22-27-00282, https://rscf.ru/en/project/22-27-00282/ (accessed on 30 August 2022).
Institutional Review Board Statement
Not applicable.
Informed Consent Statement
Not applicable.
Data Availability Statement
Not applicable.
Acknowledgments
Z.W. and A.B. thank the NSFC (41975038, 42111530028). A.K. thanks the CAS PIFI (2021VTA0009). Z.W. also thanks the CAS YIPA (Y2021113).
Conflicts of Interest
The authors declare no conflict of interest.
References
- Liou, K.-N.; Yang, P. Light Scattering by Ice Crystals. Fundamentals and Applications; Cambridge University Press: Cambridge, UK, 2016; p. 460. [Google Scholar]
- Tsekeri, A.; Amiridis, V.; Louridas, A.; Georgoussis, G.; Freudenthaler, V.; Metallinos, S.; Doxastakis, G.; Gasteiger, J.; Siomos, N.; Paschou, P.; et al. Polarization lidar for detecting dust orientation: System design and calibration. Atmos. Meas. Tech. 2021, 14, 7453–7474. [Google Scholar] [CrossRef]
- Sassen, K. The polarization lidar technique for cloud research: A review and current assessment. Bull. Am. Meteorol. Soc. 1991, 72, 1848–1866. [Google Scholar] [CrossRef]
- Sassen, K.; Cambell, J.R. A mid-latitude cirrus cloud climatology from the facility for atmospheric remote sensing: Part I. Mi-crophysical and synoptic properties. J. Atmos. Sci. 2001, 58, 481–496. [Google Scholar] [CrossRef]
- Sassen, K.; Comstock, J.M. A Midlatitude Cirrus Cloud Climatology from the Facility for Atmospheric Remote Sensing. Part III: Radiative Properties. J. Atmos. Sci. 2001, 58, 2113–2127. [Google Scholar] [CrossRef]
- Del Guasta, M. Simulation of LIDAR returns from pristine and deformed hexagonal ice prisms in cold cirrus by means of “face tracing”. J. Geophys. Res. Earth Surf. 2001, 106, 12589–12602. [Google Scholar] [CrossRef]
- Noel, V.; Chepfer, H.; Ledanois, G.; Delaval, A.; Flamant, P.H. Classification of particle effective shape ratios in cirrus clouds based on the lidar depolarization ratio. Appl. Opt. 2002, 41, 4245–4257. [Google Scholar] [CrossRef] [PubMed]
- Hu, Y. Depolarization ratio–effective lidar ratio relation: Theoretical basis for space lidar cloud phase discrimination. Geophys. Res. Lett. 2007, 34, 29584. [Google Scholar] [CrossRef]
- Wang, Z.; Sassen, K. Cirrus Cloud Microphysical Property Retrieval Using Lidar and Radar Measurements. Part II: Midlatitude Cirrus Microphysical and Radiative Properties. J. Atmos. Sci. 2002, 59, 2291–2302. [Google Scholar] [CrossRef]
- Seifert, P.; Ansmann, A.; Müller, D.; Wandinger, U.; Althausen, D.; Heymsfield, A.J.; Massie, S.T.; Schmitt, C. Cirrus optical properties observed with lidar, radio-sonde, and satellite over the tropical Indian Ocean during the aerosol-polluted north east and clean maritime south west monsoon. J. Geophys. Res. 2007, 112, D17205. [Google Scholar] [CrossRef]
- Hu, Y.; Vaughan, M.; McClain, C.; Behrenfeld, M.; Maring, H.; Anderson, D.; Sun-Mack, S.; Flittner, D.; Huang, J.; Wielicki, B.; et al. Global statistics of liquid water content and effective number concentration of water clouds over ocean derived from combined CALIPSO and MODIS measurements. Atmos. Chem. Phys. 2007, 7, 3353–3359. [Google Scholar] [CrossRef]
- Garnier, A.; Pelon, J.; Vaughan, M.A.; Winker, D.M.; Trepte, C.R.; Dubuisson, P. Lidar multiple scattering factors inferred from CALIPSO lidar and IIR retrivals of semitransparent cirrus cloud optical depths over oceans. Atmos. Meas. Tech. 2015, 8, 2759–2774. [Google Scholar] [CrossRef]
- Garnier, A.; Pelon, J.; Dubuisson, P.; Faivre, M.; Chomette, O.; Pascal, N.; Kratz, D.P. Retrieval of Cloud Properties Using CALIPSO Imaging Infrared Radiometer. Part I: Effective Emissivity and Optical Depth. J. Appl. Meteorol. Clim. 2012, 51, 1407–1425. [Google Scholar] [CrossRef]
- Zubko, E.; Shmirko, K.; Pavlov, A.; Sun, W.; Schuster, G.L.; Hu, Y.; Stamnes, S.; Omar, A.; Baize, R.R.; McCormick, M.P.; et al. Active remote sensing of atmospheric dust using relationships between their depolarization ratios and reflectivity. Opt. Lett. 2021, 46, 2352–2355. [Google Scholar] [CrossRef] [PubMed]
- Chen, W.-N.; Chiang, C.-W.; Nee, J.-B. Lidar ratio and depolarization ratio for cirrus clouds. Appl. Opt. 2002, 41, 6470–6476. [Google Scholar] [CrossRef] [PubMed]
- Sato, K.; Okamoto, H.; Ishimoto, H. Modeling the depolarization of space-borne lidar signals. Opt. Express 2019, 27, A117–A132. [Google Scholar] [CrossRef]
- Mishchenko, M.I.; Sassen, K. Depolarization of lidar returns by small ice crystals: An application to contrails. Geophys. Res. Lett. 1998, 25, 309–312. [Google Scholar] [CrossRef]
- Hayman, M.; Spuler, S.; Morley, B. Polarization lidar observations of backscatter phase matrices from oriented ice crystals and rain. Opt. Express 2014, 22, 16976–16990. [Google Scholar] [CrossRef]
- Hayman, M.; Spuler, S.; Morley, B.; VanAndel, J. Polarization lidar operation for measuring backscatter phase matrices of oriented scatterers. Opt. Express 2012, 20, 29553–29567. [Google Scholar] [CrossRef] [PubMed]
- Hayman, M.; Thayer, J.P. General description of polarization in lidar using Stokes vectors and polar decomposition of Mueller matrices. J. Opt. Soc. Am. A 2012, 29, 400–409. [Google Scholar] [CrossRef]
- Wang, W.; Yi, F.; Liu, F.; Zhang, Y.; Yu, C.; Yin, Z. Characteristics and seasonal variations of cirrus clouds from polarization lidar observations at a 30 degrees N plain site. Remote Sens. 2020, 12, 3998. [Google Scholar] [CrossRef]
- He, Y.; Liu, F.; Yin, Z.; Zhang, Y.; Zhan, Y.; Yi, F. Horizontally oriented ice crystals observed by the synergy of zenith- and slant-pointed polarization lidar over Wuhan (30.5 °N, 114.4 °E), China. J. Quant. Spectr. Radiat. Transf. 2021, 268, 107626. [Google Scholar] [CrossRef]
- Hu, Y.; Vaughan, M.; Liu, Z.; Lin, B.; Yang, P.; Flittner, D.; Hunt, B.; Kuehn, R.; Huang, J.; Wu, D.; et al. The depolarization–attenuated backscatter relation: CALIPSO lidar measurements vs. theory. Opt. Express 2007, 15, 5327–5332. [Google Scholar] [CrossRef] [PubMed]
- O’Connor, E.J.; Illingworth, A.J.; Hogan, R. A Technique for Autocalibration of Cloud Lidar. J. Atmos. Ocean. Technol. 2004, 21, 777–786. [Google Scholar] [CrossRef]
- Sassen, K.; Kayetha, V.K.; Zhu, J. Ice cloud depolarization for nadir and off-nadir CALIPSO measurements. Geophys. Res. Lett. 2012, 39, 53116. [Google Scholar] [CrossRef]
- Mishchenko, M.I.; Hovenier, J.W.; Travis, L.D. Light Scattering by Nonspherical Particles; Academic Press: Cambridge, MA, USA, 2000; p. 720. [Google Scholar]
- Masuda, K.; Ishimoto, H. Backscatter ratios for nonspherical ice crystals in cirrus clouds calculated by geomet-rical-optics-integral-equation method. J. Quant. Spectr. Radiat. Transf. 2017, 190, 60–68. [Google Scholar] [CrossRef]
- Bi, L.; Yang, P.; Kattawar, G.W.; Hu, Y.; Baum, B.A. Scattering and absorption of light by ice particles: Solution by a new physical-geometric optics hybrid method. J. Quant. Spectrosc. Radiat. Transf. 2011, 112, 1492–1508. [Google Scholar] [CrossRef]
- Konoshonkin, A.; Borovoi, A.; Kustova, N.; Okamoto, H.; Ishimoto, H.; Grynko, Y.; Förstner, J. Light scattering by ice crystals of cirrus clouds: From exact numerical methods to physical-optics approximation. J. Quant. Spectrosc. Radiat. Transf. 2017, 195, 132–140. [Google Scholar] [CrossRef]
- Konoshonkin, A.; Borovoi, A.; Kustova, N.; Reichardt, J. Power laws for backscattering by ice crystals of cirrus clouds. Opt. Express 2017, 25, 22341–22346. [Google Scholar] [CrossRef] [PubMed]
- Okamoto, H.; Sato, K.; Borovoi, A.; Ishimoto, H.; Masuda, K.; Konoshonkin, A.; Kustova, N. Interpretation of lidar ratio and depolarization ratio of ice clouds using spaceborne high-spectral-resolution polarization lidar. Opt. Express 2019, 27, 36587–36600. [Google Scholar] [CrossRef]
- Zhang, Z.; Yang, P.; Kattawar, G.W.; Tsay, S.-C.; Baum, B.A.; Huang, H.-L.; Hu, Y.X.; Heymsfield, A.J.; Reichardt, J. Geo-metrical-optics solution to light scattering by droxtal ice crystals. Appl. Opt. 2004, 43, 2490–2499. [Google Scholar] [CrossRef]
- Warren, S.G.; Brandt, R.E. Optical constants of ice from the ultraviolet to the microwave: A revised compilation. J. Geophys. Res. Earth Surf. 2008, 113, 9744. [Google Scholar] [CrossRef]
- Mitchell, D.L.; Arnott, W.P. A Model Predicting the Evolution of Ice Particle Size Spectra and Radiative Properties of Cirrus Clouds. Part II: Dependence of Absorption and Extinction on Ice Crystal Morphology. J. Atmos. Sci. 1994, 51, 817–832. [Google Scholar] [CrossRef]
- Borovoi, A.; Konoshonkin, A.; Kustova, N. Backscattering by hexagonal ice crystals of cirrus clouds. Opt. Lett. 2013, 38, 2881–2884. [Google Scholar] [CrossRef] [PubMed]
Publisher’s Note: MDPI stays neutral with regard to jurisdictional claims in published maps and institutional affiliations. |
© 2022 by the authors. Licensee MDPI, Basel, Switzerland. This article is an open access article distributed under the terms and conditions of the Creative Commons Attribution (CC BY) license (https://creativecommons.org/licenses/by/4.0/).