Article

Arctic Stratosphere Dynamical Processes in the Winter 2021–2022

by
Pavel N. Vargin
1,2,*,
Andrey V. Koval
3,4 and
Vladimir V. Guryanov
5
1
Central Aerological Observatory, Dolgoprudny, 141700 Moscow, Russia
2
Obukhov Institute of Atmospheric Physics, Russian Academy of Science, 119071 Moscow, Russia
3
Atmospheric Physics Department, Saint-Petersburg State University, 199034 Saint-Petersburg, Russia
4
Department of Meteorological Forecasts, Russian State Hydrometeorological University, 195196 Saint-Petersburg, Russia
5
Institute of Environmental Sciences, Kazan Federal University, 420008 Kazan, Russia
*
Author to whom correspondence should be addressed.
Atmosphere 2022, 13(10), 1550; https://doi.org/10.3390/atmos13101550
Submission received: 29 July 2022 / Revised: 30 August 2022 / Accepted: 14 September 2022 / Published: 22 September 2022
(This article belongs to the Section Meteorology)

Abstract

:
The Arctic stratosphere winter season of 2021–2022 was characterized by a stable, cold stratospheric polar vortex with a volume of polar stratospheric clouds (PSC) close to the maximum values since 1980, before the beginning of minor sudden stratospheric warming (SSW) events in the late February and early March and major SSW on 20 March. Analysis of dynamical processes of the Arctic stratosphere using reanalysis data indicates that the main reasons for the strengthening of the stratospheric polar vortex in January–February are the minimum propagation of planetary wave activity from the troposphere to the stratosphere over the past 40 years and its reflection in the upper stratosphere–lower mesosphere in the second half of January. The first minor SSW was limited to the upper polar stratosphere, whereas the second one propagated to the middle and lower stratosphere and led to the disappearance of the PSC, which prevented significant ozone depletion. Both minor and major SSW events led to a weakening of the residual meridional circulation in the upper Arctic stratosphere and its intensification in the middle and lower stratosphere, which contributed to additional warming of the subpolar region and weakening of the polar vortex.

1. Introduction

The circulation of the Arctic stratosphere during the winter season, which usually lasts from November to April, is characterized by strong intraseasonal and interannual variability (e.g., [1]). The main feature of this circulation is the stratospheric polar vortex, which is formed during the polar night. Strengthening or weakening of the polar vortex is due to a nonlinear interaction with wave activity propagating into the stratosphere from the troposphere: primarily planetary waves (PWs) with zonal wave numbers 1–2.
Abrupt weakening of the stratospheric polar vortex, accompanied by a temperature increase by tens of degrees and a zonal circulation deceleration, occurs in the Arctic as a result of sudden stratospheric warming events (SSWs) [2]. In the case of a zonal circulation reversal in the middle stratosphere at a pressure level of 10 hPa at 60° N, events are classified as major SSWs that occur on average twice in three winters.
Generation of most SSWs is associated with an increase in the wave activity propagation from the troposphere to the stratosphere. However, some SSWs, as shown by model experiments, may be caused by internal dynamical processes associated with nonlinear interactions of PWs with the mean flow [3,4,5]. Model simulations showed that PWs with higher zonal wave numbers 3–4 can be amplified in the stratosphere during the SSWs [6].
Analysis of observational data and model calculations showed that the variability of the Arctic stratospheric polar vortex could affect the circulation of the troposphere for 1–2 months (e.g., review by Baldwin [2] and references therein). Among other studies on the stratosphere–troposphere dynamical coupling, some results are necessary to mention. Experiments with idealized GCMs showed that the tropospheric eddy feedbacks are needed to explain the strength of the tropospheric response to stratospheric variability [7,8]. Using a quasi-geostrophic (QG) framework, it was shown that the local tropospheric wave drag is important to amplify the surface response to stratospheric forcing and to maintain and prolong the tropospheric signals over several weeks [9]. Simulations with a complex GCM revealed that the internal tropospheric eddy-driven dynamics play a crucial role in strengthening and maintaining the tropospheric response to stratospheric changes associated with the ozone hole [10]. Using the inversion of the finite amplitude wave activity equation, it was shown that variations in stratospheric wave forcing are too weak to account for the attendant changes and shapes in the tropospheric flow. The indirect effect of tropospheric finite-amplitude wave activity through the residual displacements is needed to amplify and maintain the tropospheric response to stratospheric variability [11].
An increase in the temperature of the polar stratosphere as a result of the SSW leads to a decrease in the volume of the air mass inside the stratospheric polar vortex with conditions sufficient for the formation of polar stratospheric clouds (hereinafter Vpsc). On the PSC particles, the neutral chlorine and bromine components are heterogeneously activated into active compounds [12]. As a result of SSW and the associated increase in temperature, the Vpsc is reduced, and the formation of chlorine and bromine atoms slows down or stops, which prevents severe destruction of the ozone layer. PSCs are also responsible for the removal of nitric acid compounds from the lower polar stratosphere as a result of settling ("denitrification"), which is capable of neutralizing active and dangerous chlorine atoms for the ozone layer. Therefore, the larger Vpsc corresponds to the greater the probability of severe destruction of the ozone layer.
During the SSW, due to changes in the propagation of gravity and planetary waves in the mesosphere, the temperature decreases sometimes by tens of degrees, and the height of the stratopause also changes [2].
Temperature changes associated with SSW affect the dynamic characteristics of the mesosphere and lower thermosphere, e.g., the intensity of a wave with a period of about 10 days [13], as well as the gas composition of this region of the atmosphere; there is a sinking from the upper to the lower mesosphere and upper stratosphere, e.g., nitrogen oxides (NOx) [14]. As a result of increasing NOx concentrations in the polar stratosphere, ozone depletion increases.
It has been suggested that the increase in the maximum volumes of PSCs detected in the Arctic from 1966 to 2003 was due to changes in radiation and dynamic processes caused by an increase in greenhouse gas concentrations [15]. An increase in cases of extreme cold stratospheric winters conducive to ozone depletion in the Northern Hemisphere was reported after the cold Arctic winter 2004–2005 [16].
According to model estimates, especially under the conditions of the extreme scenario of growth in greenhouse gas concentrations (SSP5-8.5), by the end of the 21st century, an increase in the interannual variability of the circulation of the Arctic stratosphere and an increase in the Vpsc are possible, which can lead in some years to significant destruction of the ozone layer [17,18].
The recent winters have been characterized by strong interannual variability in the circulation of the Arctic stratosphere. For instance, a very strong and cold polar vortex in December 2017 and January 2018 was followed by the major SSW in the middle of February that led to the dramatic rise in Arctic stratosphere temperature, as well as to the zonal wind reversal and split of stratospheric polar vortex into two parts in the lower and middle stratosphere, which prevented the strong stratospheric ozone loss in spring [19,20].
The winter of 2018–2019 was characterized by the major SSW at the beginning of January; as a result, the polar vortex remained weakened and warm in the lower stratosphere until the end of the winter season, while, in the middle and upper stratosphere, it recovered quickly [21,22].
The winter of 2019–2020 was characterized by a very cold and stable stratospheric polar vortex, which led to record ozone depletion in the lower polar stratosphere: ~90% on some days [23,24,25,26,27]. This winter was also characterized by zonally asymmetric stratopause [28]. It was suggested that this particular winter anomaly in the Arctic stratosphere was also due to the extreme Indian Ocean dipole [29].
In the winter of 2020–2021, the temperature of the Arctic stratosphere was increased as a result of the major SSW in early January, which lasted about 3 weeks [30,31,32,33].
The present study aimed to investigate the dynamic processes of the Arctic stratosphere in the winter of 2021–2022, which was characterized by a strong stratospheric polar vortex in the early winter, two minor SSWs in the late February and early March, and the major SSW on March 20, which prevented severe ozone depletion.

2. Data and Methods

The study of dynamic processes of the Arctic stratosphere and their interannual variability was carried out using daily global NCEP [34] and ERA5 [35] reanalysis data with an upper boundary at pressure levels 10 hPa (~30 km) and 1 hPa (~48 km), respectively. The anomalies for the NCEP and ERA5 reanalysis data were calculated relative to the climate mean values from 1981 to 2010.
We calculated the amplitudes of PWs dominating in the stratosphere with zonal wave numbers from 1 to 3, the zonal mean meridional heat flux v T ¯ (where v′ and T′ are deviations from the zonal mean values of the meridional wind and temperature), and three-dimensional (3D) Plumb flux vectors characterizing the propagation of wave activity flows [36] (see Supplement S1). The 3D planetary wave activity flux by Plumb in comparison with two-dimensional Eliassen–Palm flux can provide more regionalized information on stratosphere–troposphere dynamic interactions [37] and peculiarities of wave activity propagation (e.g., [38]).
The wave activity reflection index in the upper stratosphere was calculated as the difference between the zonal mean wind at pressure levels of 2 hPa and 10 hPa in the region of 58°–74° N. Its positive values correspond to unfavorable conditions for reflecting wave activity flows, while negative values correspond to favorable ones [39].
To analyze the dynamic coupling of the stratosphere and troposphere, daily anomalies of the geopotential height in the region of 65°–90° N normalized on standard deviation were calculated. After multiplying by −1 (to match the Arctic Oscillation Index), these values correspond to the North Annular Mode (NAM) index [40].
The interannual and intraseasonal variability of the area and volume of the air mass in the lower stratosphere inside the Arctic stratospheric polar vortex with temperatures sufficient for PSC formation of type I (or NAT, i.e., formed from nitric acid trihydrate) was analyzed using estimates provided by NASA Ozone Watch project [41] and calculated according to [42].
The date of the spring breakup of the stratosphere circulation (or the final SSW) was defined as the day with the maximum absolute value of the rate of decrease in the zonal wind in the middle stratosphere by 10 hPa and near its maximum at 62.5° N [43]. Due to strong oscillations in the rate of change of the zonal wind to determine the absolute minimum, the values of its temporal gradient were smoothed over 31 days. If, after the early SSW, the zonal mean flow in the middle stratosphere was restored, as, for example, in the winter of 2017–2018 [19], then the date of the maximum wind weakening at the end of the winter season was chosen as the spring breakup date.
The calculation of the blocking index, taking into account changes in the longitudinal location and intensity of blocking anticyclones over time at a pressure level of 500 hPa, was carried out according to [44] (see Supplement S2).
The residual mean meridional circulation (RMC), caused by the action of atmospheric waves of various spatial and temporal scales, was estimated on the basis of the transformed Eulerian mean approach (TEM) [45] using MERRA-2 reanalysis data [46], whose upper limit reaches ~65 km (~ 0.05 hPa). Conventional formulas for RMC were used (see Supplement S3). The TEM approach provides effective diagnostics of wave impacts on the mean flow and gives the ability to calculate the meridional transport of mass and tracers in the atmosphere. The RMC estimates the residual part of the mean flow, which remains after partial compensation of the Eulerian zonal-mean circulation by the wave-induced eddy mass, momentum, and heat fluxes [47]. Calculation of the RMC (its meridional and vertical components V*, W*) allows to diagnose the wave action on the mean flow and to estimate the processes of transport of atmospheric species in the meridional plane [48].

3. Results

3.1. External Factors Affected Stratospheric Polar Vortex

According to the analysis of observational data, the Arctic stratospheric polar vortex can be influenced by the following external factors: the El Niño/Southern Oscillation (ENSO) e.g., [49], the quasi-biennial cycle of zonal wind oscillations in the equatorial stratosphere (QBO) e.g., [50], the Madden–Julian oscillation (MJO) in the tropics of the Indian Ocean e.g., [51], the Pacific Decadal Oscillation (PDO) e.g., [52], anomalies in the surface temperature of the North Pacific Ocean e.g., [53], and the reduction in ice cover in the Arctic e.g., [54].
In the winter of 2021–2022, a cold ENSO La Niña phase was observed in the equatorial Pacific Ocean, which is usually accompanied by a colder stratospheric polar vortex in the Arctic [40], which does not contribute to the formation of SSWs. However, in recent years, a number of major SSWs (in January 2009, January 2018, and January 2021) occurred in the Arctic during La Niña winter seasons.
The geopotential height anomalies in the troposphere at pressure level of 500 hPa in January 2022 (a negative anomaly in the North Pacific, a positive one over Yakutia, a negative one over the European territory of Russia, and a positive one over Western Europe and the North Atlantic) are comparable to the corresponding anomalies in January 1997 and January 2011, when the cold phase of La Niña was also observed.
In the equatorial stratosphere, the easterly QBO phase is observed when the propagation of wave activity in the stratosphere toward the equator is difficult, which results, as a rule, in the weakening of the stratospheric polar vortex in comparison to winters with a westerly phase [50]. Interestingly, the QBO-East and QBO-West composite differences are not likely to be informative about the mechanism behind the Holton–Tan relationship since many different mechanisms could give rise to the NAM like polar vortex response. Therefore, the transient response of the atmosphere to a forcing on timescales of a few days to understand the forcing mechanism was suggested [55]. Moreover, it was shown that the extratropical QBO early signal during fall could result primarily from the modulation of individual wave life cycles [56] and stratospheric life cycles of wave pulses entering the stratosphere from the troposphere [57].
According to statistics, more than half of the SSWs (13 out of 25) from 1979 to 2013 were observed in winters with increased convection in the tropics of the Western Pacific, which corresponds to the sixth and seventh phases of the Madden–Julian oscillation (MJO) [42]. In January 2022, the MJO was characterized by a lower amplitude; no eastward propagation of associated anomalies was recorded.
The negative PDO phase observed during 2021 intensified by the end of the year: its index reached values close to the maximum over the past 150 years in October (−3.11), in November–December 2021 (−2.73, −2.71), and in January–February 2022 (−2.46, −1.98). An analysis of the ensemble calculations of the MPI-ESM Earth system model showed that most SSWs were observed during the years of the positive PDO phase [52].
In January 2022, positive sea surface temperature (SST) anomalies were observed in the Northern Pacific Ocean. Such anomalies associated with the Pacific Gyre are usually accompanied by a reduced propagation of wave activity from the troposphere to the stratosphere, resulting in a stronger stratospheric polar vortex in the Arctic [53,58].
The reduction in ice cover in the Arctic, in the Barents and Kara Seas, may increase the propagation of wave activity from the troposphere to the stratosphere [54,59]. According to the National Snow and Ice Data Center of the United States (http://nsidc.org/arcticseaicenews/2021/10/, accessed on 15 May 2022), the Arctic ice cover in September (when the annual minimum is observed) of the year 2021 was the largest since 2014, amounting to ~4.9 million square km (mln. sq. km), which is ~1.5 mln. sq. km less than the average long-term values from 1981 to 2010. For comparison, the corresponding area in September 2018 was ~4.71 mln. sq. km, that in September 2019 was ~4.32 mln. sq. km, and that in September 2020 was ~3.92 mln. sq. km.
Thus, the cold La Niña phase, the negative phase of the PDO, and positive SST anomalies in the Northern Pacific presumably were the main favorable external conditions for the cold Arctic stratospheric polar vortex in the winter of 2021–2022.

3.2. Zonal Circulation and Temperature

The circulation of the Arctic stratosphere in the winter of 2021–2022 was characterized by a strong stratospheric polar vortex. Since mid-January 2022, the mean zonal wind at 60° N began to exceed the climate values (Figure 1a). The largest positive anomalies in the mean zonal wind up to ~40 m/s were observed in the middle and upper stratosphere in February.
The first minor SSW event in late February was limited by upper polar stratosphere and did not affect zonal wind at 10 hPa and below (Figure 1b). Then, as a result of the second minor SSW in early March, the zonal mean wind in the upper and middle stratosphere weakened, and its values approached the climate ones. On March 20, the direction of the zonal mean wind in the middle stratosphere at 10 hPa and 60° N changed, which corresponds to the major SSW (Figure 1b).
It is interesting to pay attention to the variability of the zonal mean wind in the upper stratosphere (Figure 1c). In the second half of January, there was a shift of the zonal mean wind maximum from high latitudes (60°–80° N) to the mid-latitude region of 30°–40° N. This period was characterized by the formation of a double structure of the zonal mean wind maximum, which is considered in more detail below.
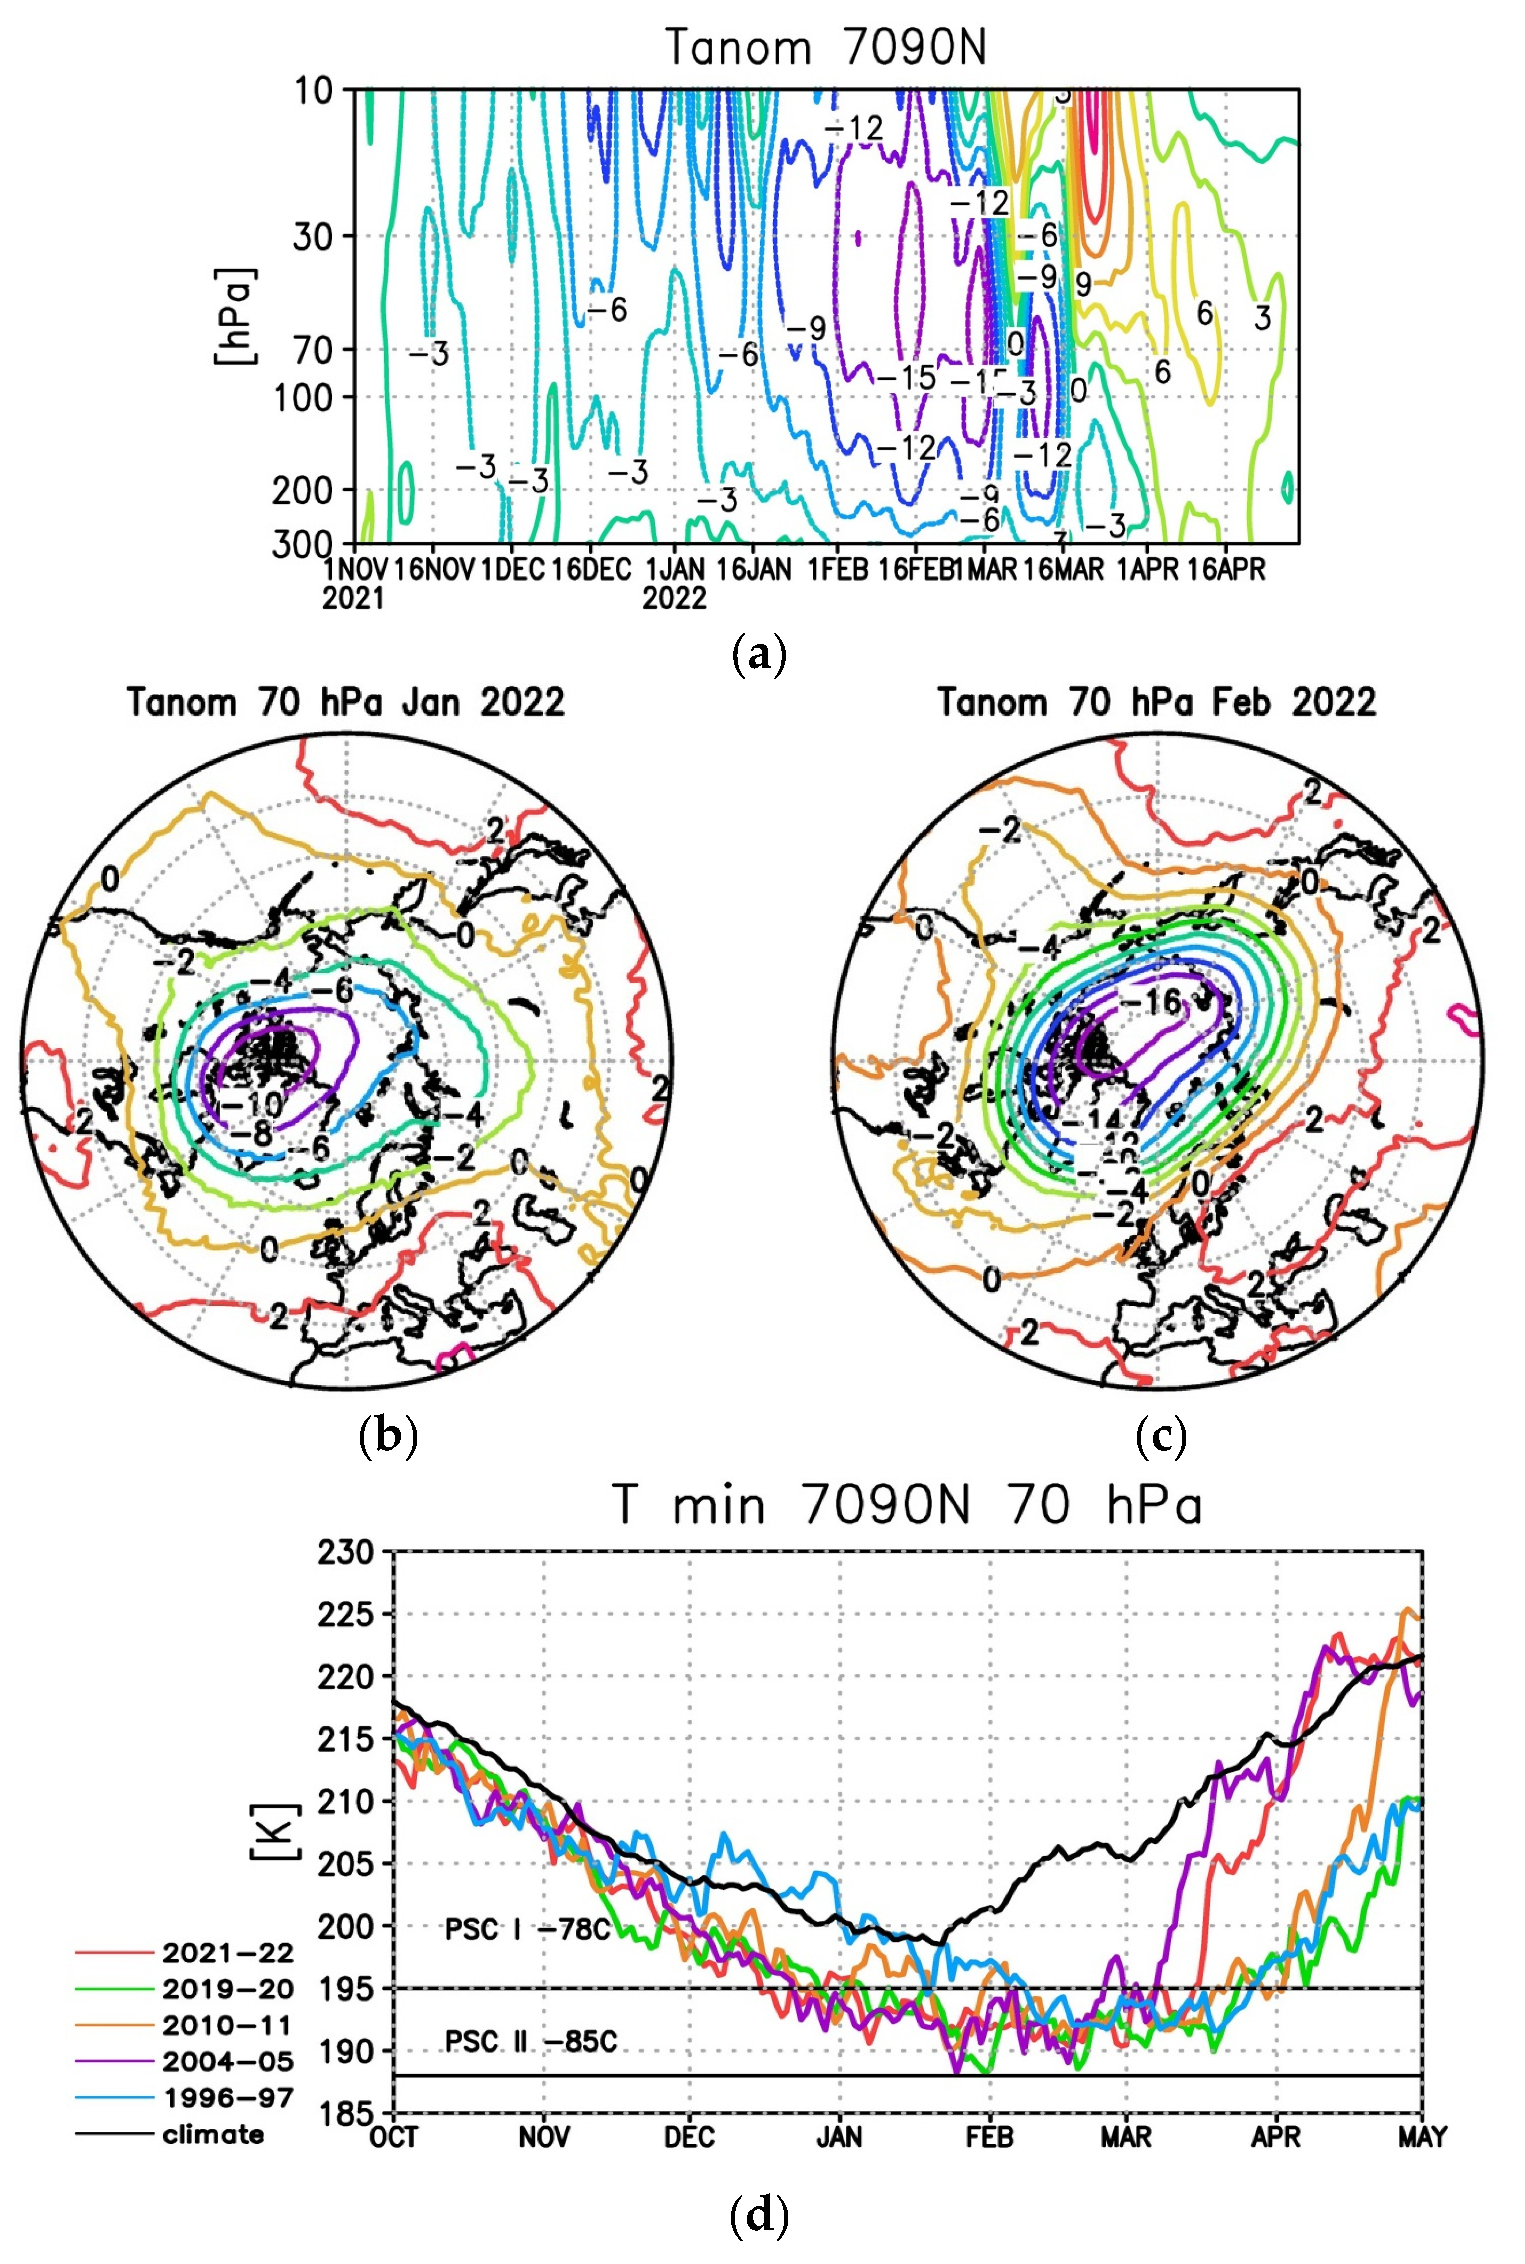
Since January 2022 in the lower stratosphere of the Arctic, a strengthening in negative temperature anomalies was observed up to −15 K in mid-February (Figure 2a). In early March, as a result of a minor SSW, the temperature of the lower polar stratosphere briefly increased, and the anomalies became positive after a repeated temperature decrease was observed with negative anomalies up to −12 K. The monthly negative temperature anomalies in the polar vortex in the lower stratosphere in January reached −10 K, while those in February reached up to −16 K (Figure 2b,c). Only after the major SSW on March 20 did the temperature anomalies in the lower stratosphere become positive.
An analysis of the interannual variability of the minimum temperature of the lower stratosphere of the Arctic shows that, in the winter of 2021–2022, its values were lower than the climatic ones (by several degrees in December–January and by ~15 K in the late February and early March) and close to the corresponding values of the winters with the highest ozone depletion, i.e., 1996–1997, 2004–2005, 2010–2011, and 2019–2020 (Figure 2d). Since mid-March 2022, the minimum temperature of the lower stratosphere of the Arctic was increasing, and, in early April, it already exceeded long-term climatic values and values of seasons with strong ozone layer depletion, with the exception of the winter 2004–2005.

3.3. Planetary Wave Activity

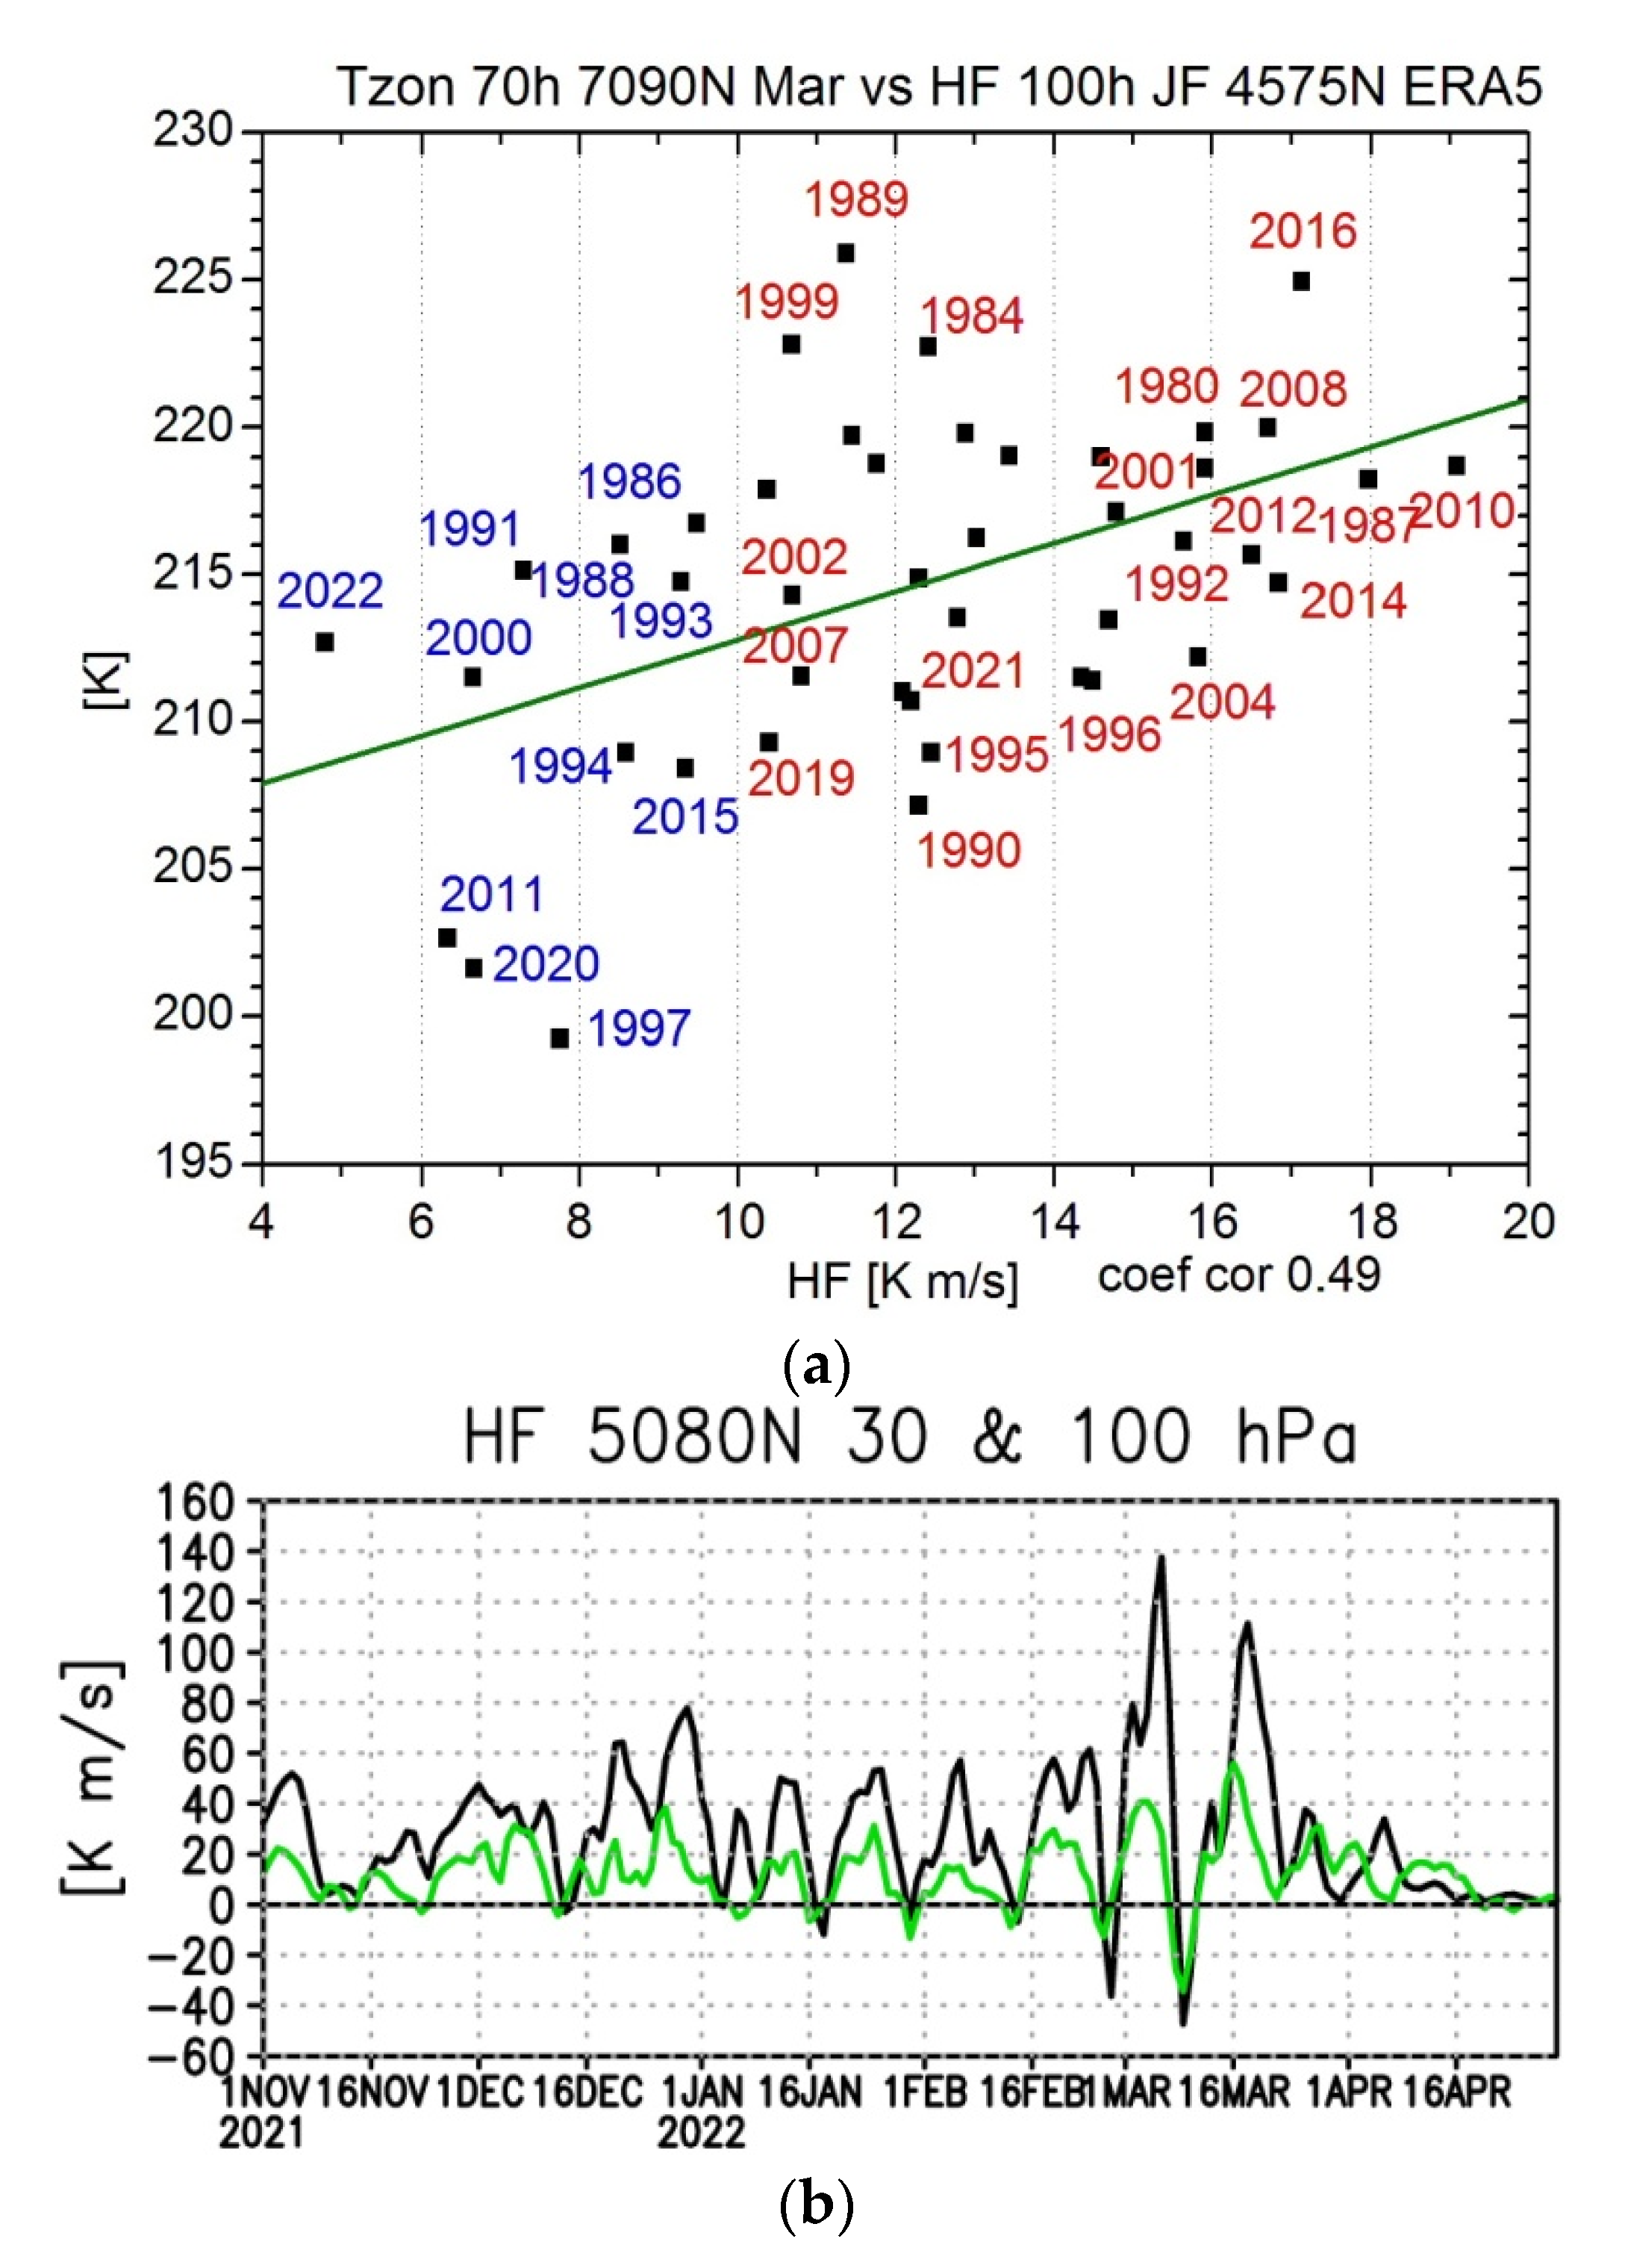
It is known that the intensity of upward wave activity propagation in the lower stratosphere in January–February largely determines the temperature of the lower stratosphere in March [60]. An analysis of the interannual variability of wave activity showed that, in the winter of 2021–2022, the propagation of wave activity, characterized by a zonal mean heat flux in the lower stratosphere at 100 hPa averaged over the region of 45°–75° N, in January–February 2022 was the lowest since 1980 (Figure 3a).
It is important to note that, although in the winters with the highest ozone depletion in the Arctic stratosphere (1996–1997, 2010–2011, 2019–2020) the propagation of wave activity on average in January–February was slightly higher than in January–February 2022, the temperature of the lower stratosphere in these years was on 10–15 K lower in March than in March 2022. This is explained by the minor SSW that occurred in early March and the major SSW on March 20.
During the investigated winter, the first increase in wave activity propagation was observed in the second half of December, and then the strongest increase was observed in late February– early March, accompanied by the minor SSW and in the second half of March during the major SSW (Figure 3b).
Furthermore, the amplitudes of PWs dominating in the stratosphere with zonal wave numbers from 1 to 3 (PW1–PW3) were analyzed for levels from the upper troposphere (300 hPa) to the upper stratosphere (3 hPa) (Figure 3c–f). The wave amplitudes were estimated in the region from 50° N to 70° N using ERA5 reanalysis data.
In the upper stratosphere, PW1 dominated throughout the winter season with maximum values from 1500–1600 gpm at the end of December 2021 and about 1 week later (when the weakening of PW1 was accompanied by a sharp increase in PW2) at the beginning of January 2022 (Figure 3c). It is interesting that the intensification of PW2 in the last days of December was traced from the upper troposphere to the upper stratosphere, which led to an elongation of the shape of the stratospheric polar vortex.
In the middle stratosphere at 10 hPa, PW1 also dominated with a maximum of more than 1000 gpm in early March, when the second minor SSW was observed (Figure 3d). During the major SSW on 20 March, PW1 also intensified, but its values did not exceed 500 gpm.
In the lower stratosphere at 70 hPa, the amplitudes of PW1 and PW2 from November to early March were comparable (Figure 3e). PW1 weakened in mid-March, and PW2 intensified, followed by a sharp intensification of wave 1 at the end of March (i.e., during the major SSW), which peaked at 540 gpm. Thus, the major SSW in the second half of March was accompanied by an increase in the amplitude of PW1 in the lower and middle stratosphere and was characterized by a shift of the stratospheric polar vortex from the pole to Eastern Siberia.
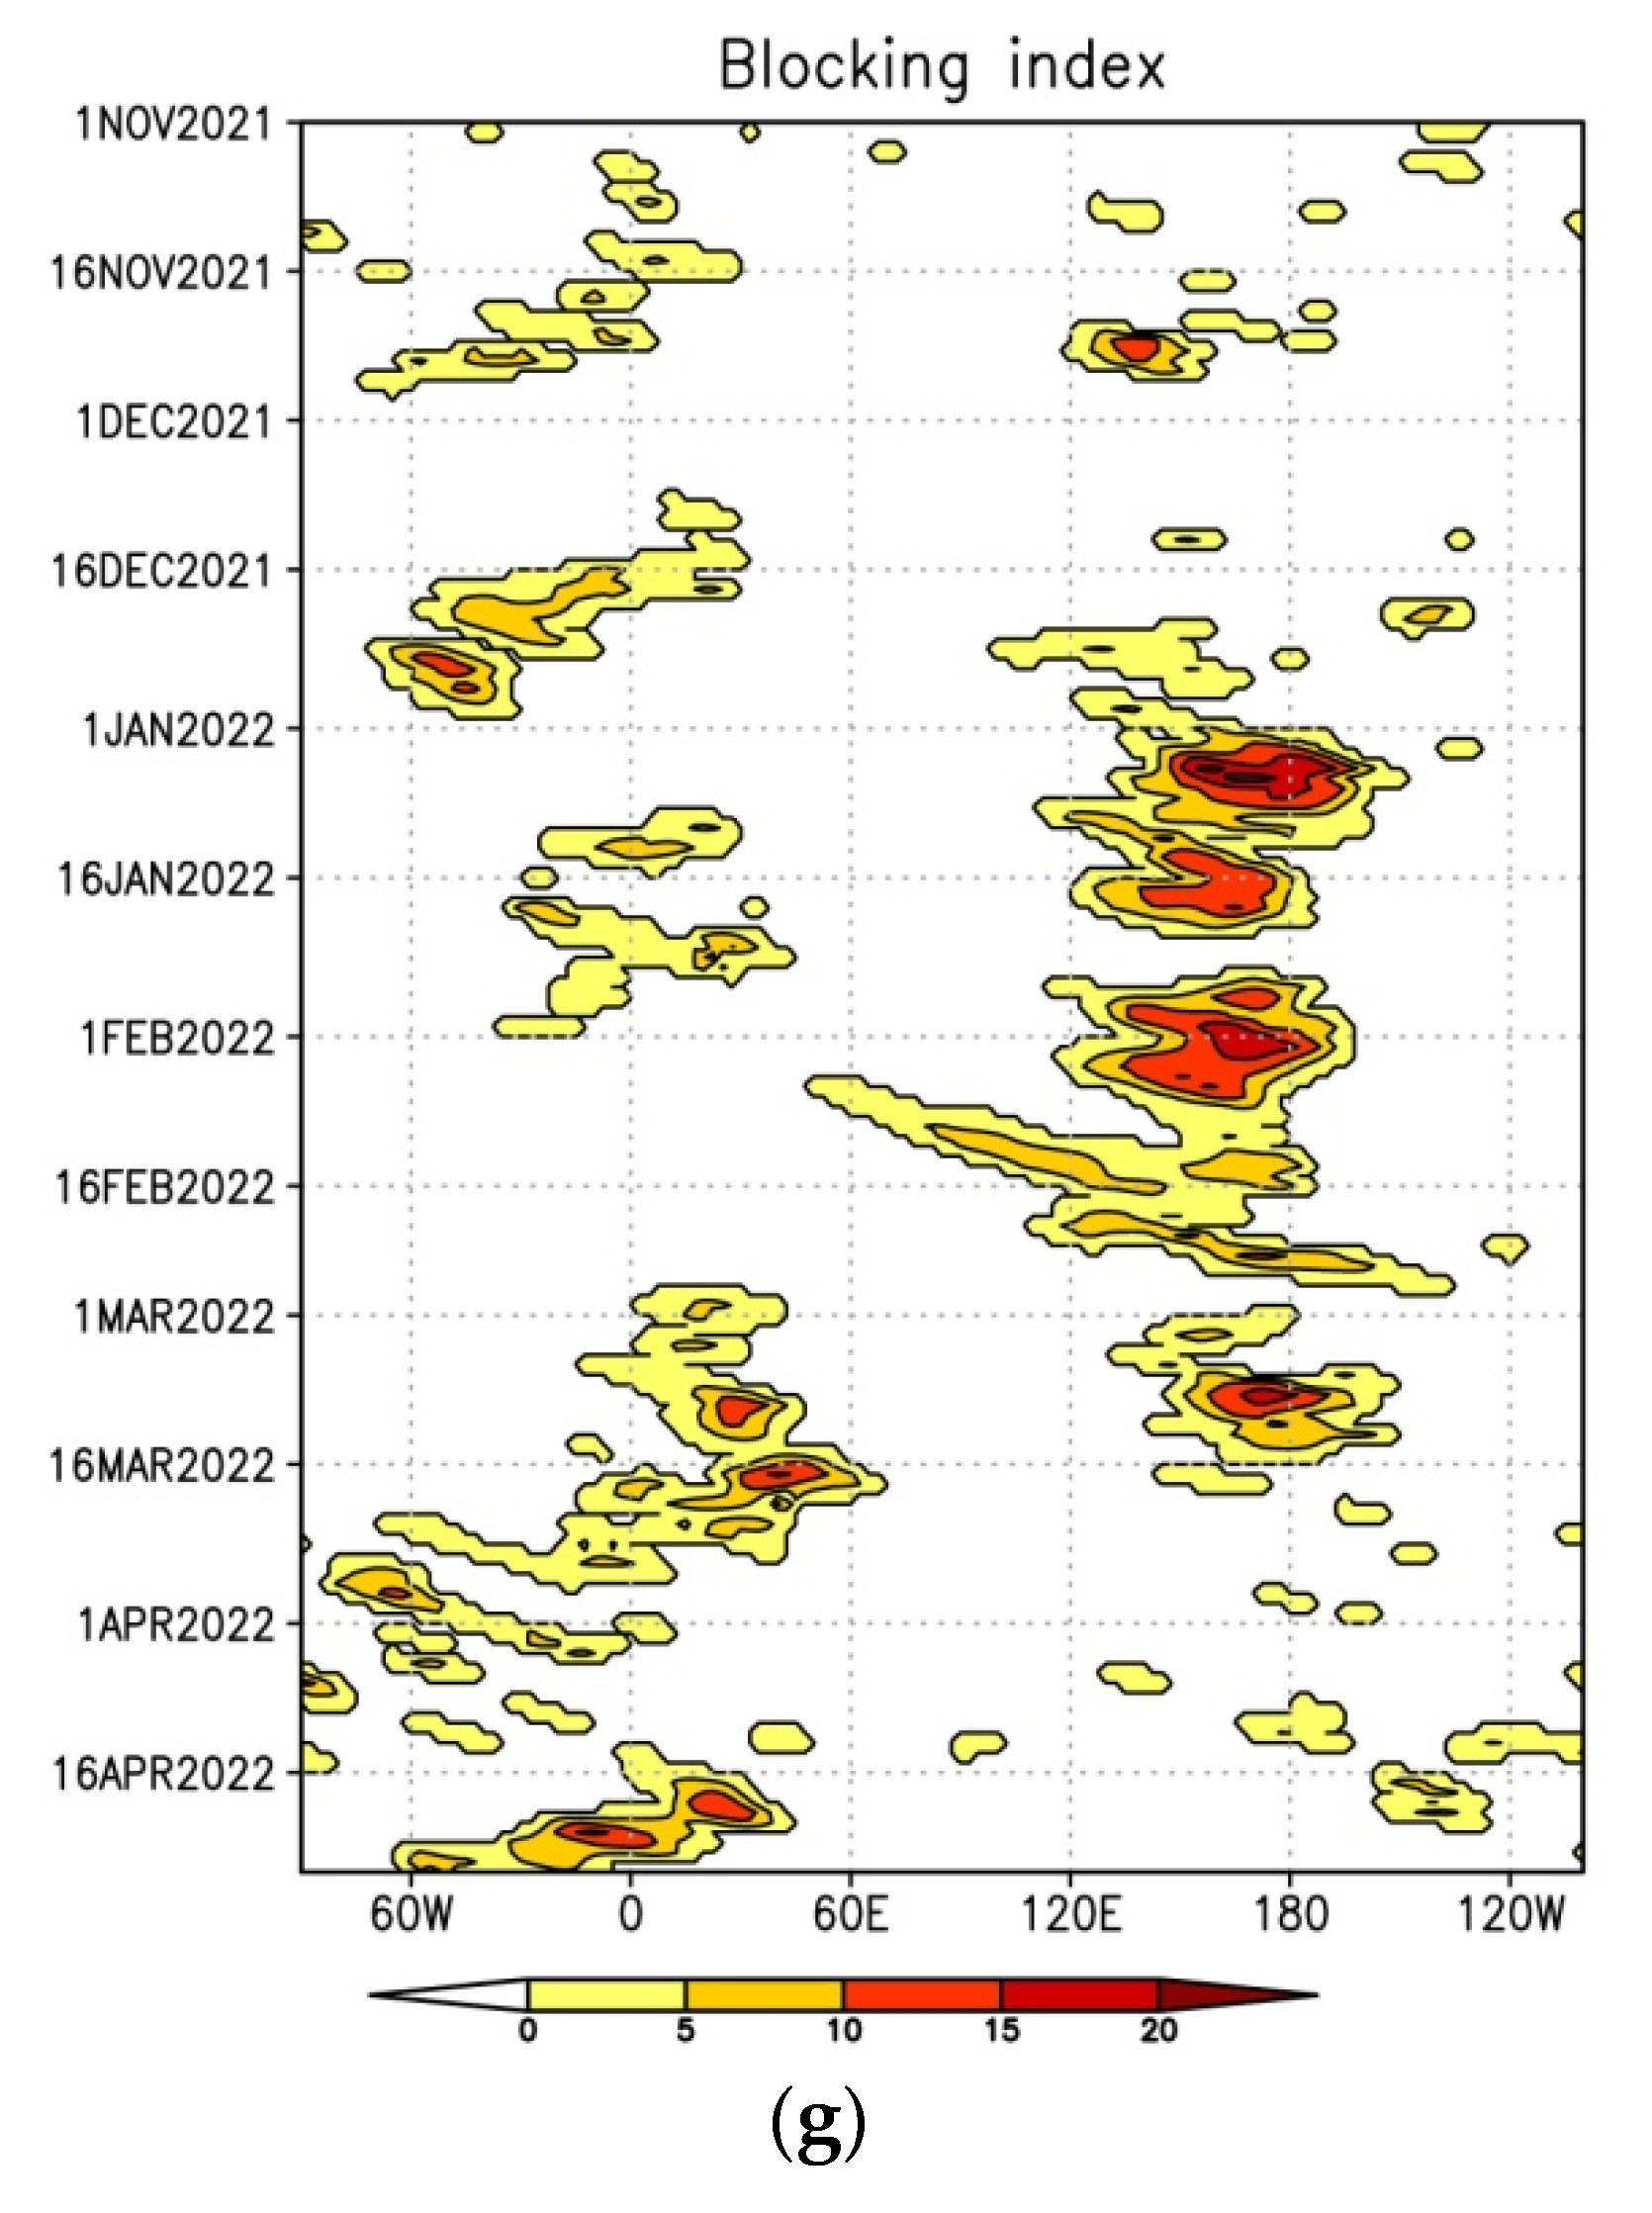
In the upper troposphere, the amplitudes of PW1–3, as expected, were characterized by similar values (Figure 3f). The reason for the intensification of wave 2 in the troposphere in late December 2021–early January 2022, which, as noted earlier, could be traced to the upper stratosphere, was the intensification of two blocking anticyclones: the first one from mid to late December over the North Atlantic, and the second, more intense one over the north Pacific Ocean from late December to mid-March, with a weakening in the second half of February (Figure 3g).
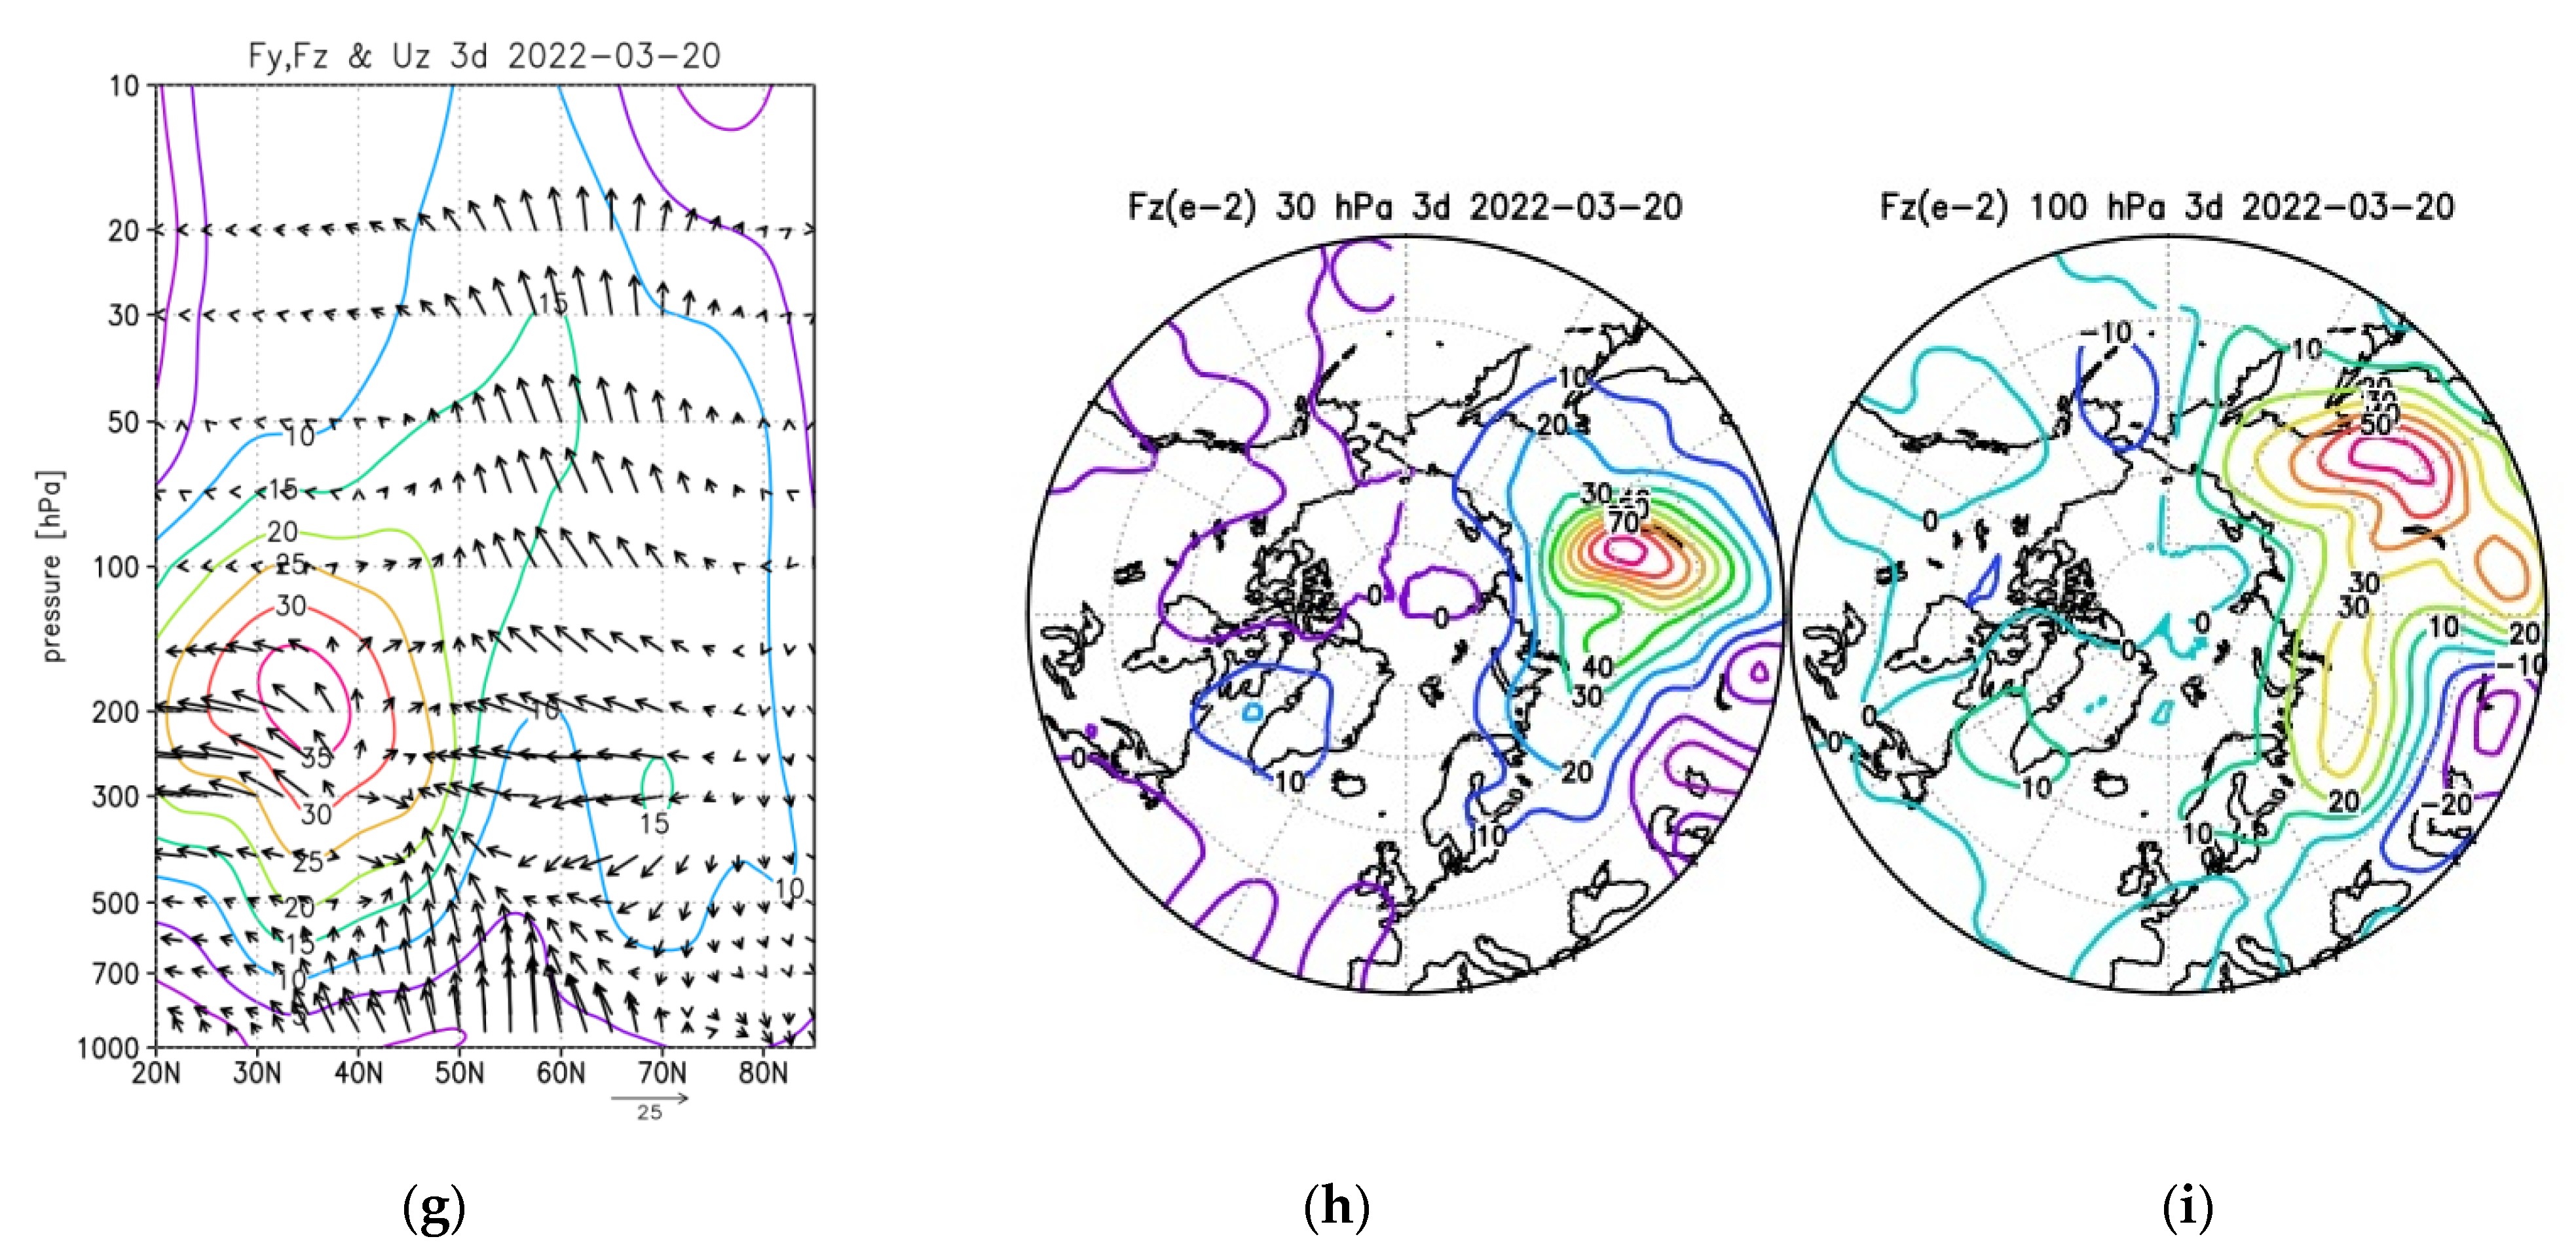
The minor SSW at the beginning of March 2022 was accompanied by an increase in the propagation of wave activity from the troposphere to the stratosphere, which led to a deceleration of the zonal circulation (Figure 4a). In the lower stratosphere, the strongest upward propagation of wave activity was observed over the northeast of Eurasia and less intensive over the north of the Atlantic, while, in the middle stratosphere, it was only over the first region (Figure 4b,c).
About 1 week later, due to the weakening of the zonal mean wind in the middle stratosphere, a reflection of wave activity into the troposphere was observed over the high latitudes of North America (Figure 4d–f). The upward propagation of wave activity decreased. In the lower stratosphere, upward propagation of wave activity was observed over the northeast of Eurasia and the north of the Pacific Ocean, as well as over the north of Scandinavia and the Barents Sea, in the middle stratosphere (over Mongolia), and over the north of China.
During the major SSW, the propagation of wave activity in the lower and middle stratosphere increased and it was strongest over the south of Siberia (Figure 4g–i).
The weakening of the mean zonal wind in the stratosphere during the SSW can lead to conditions when wave activity is reflected downward into the middle–lower stratosphere due to wind shear. This reflection could affect tropospheric circulation and lead to weather anomalies [61,62,63]. Most often, the reflection of wave activity was observed over the north of North America.
Previous studies showed that natural and anthropogenic forcing (including ENSO, QBO, GHG, and ozone-depleting substances) can significantly influence large-scale stratospheric circulation that favors downward wave reflection events and the associated surface impacts (e.g., [64,65]).
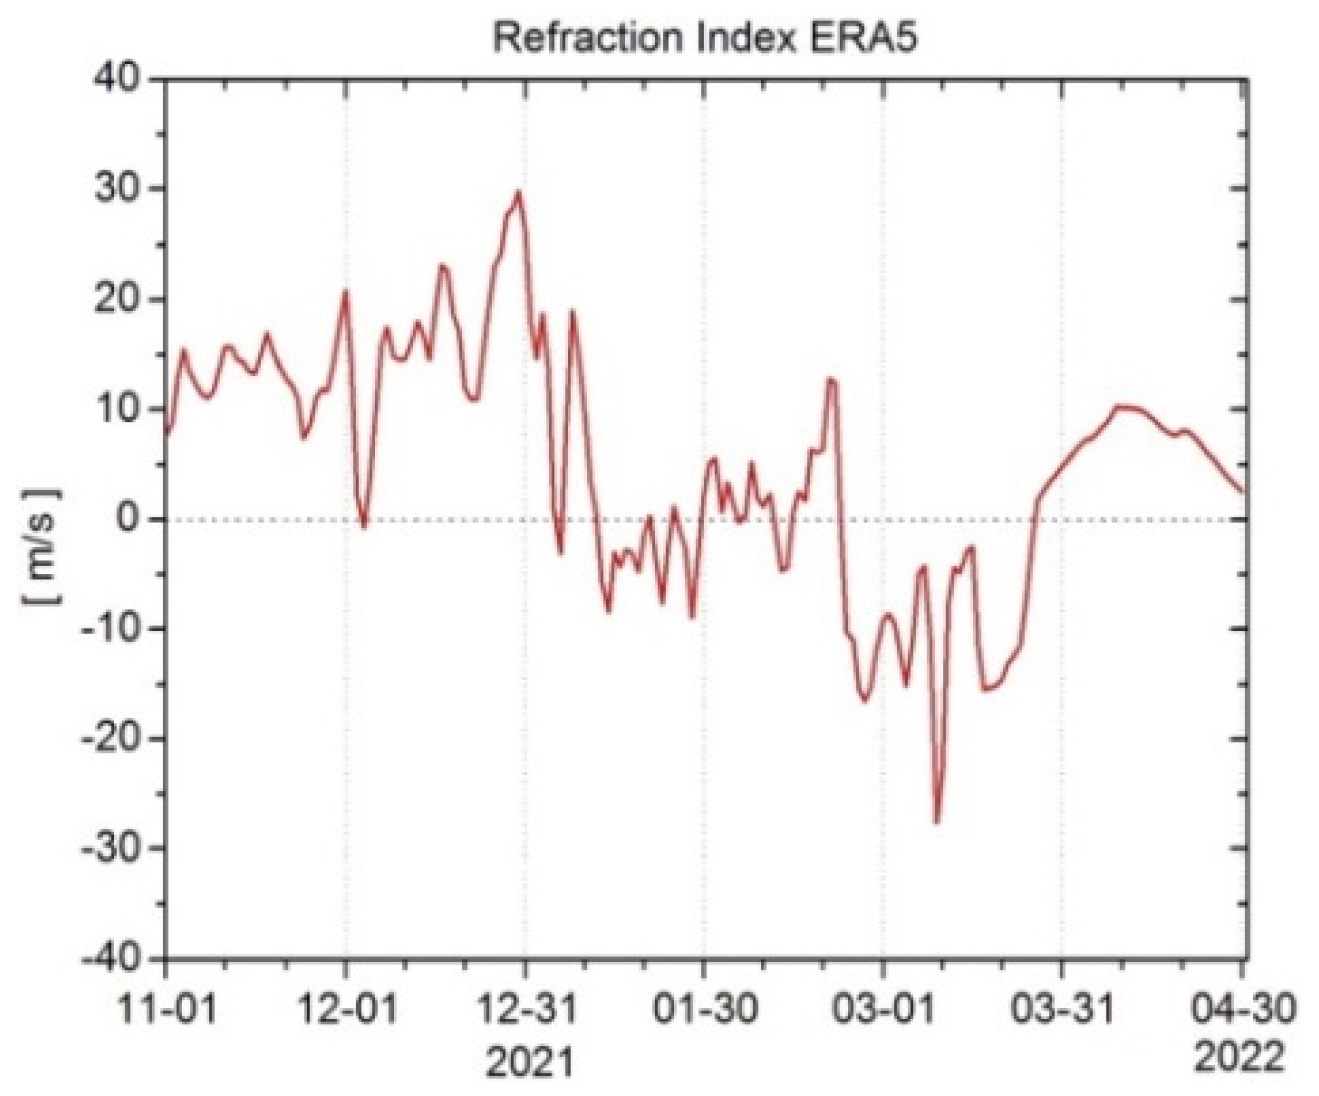
The zonal mean refraction index calculated using the method in [31] shows that the conditions for wave activity reflection in the upper stratosphere were observed in the second half of January, and then since around February 20, when the zonal mean wind decelerated in the upper stratosphere for the first time (Figure 1a), until the end of March 2022 (Figure 5). As shown earlier, the reflection of wave activity was observed in the lower stratosphere over the north of North America after the second minor SSW (Figure 4d–f).

3.4. Northern Annular Mode (NAM)

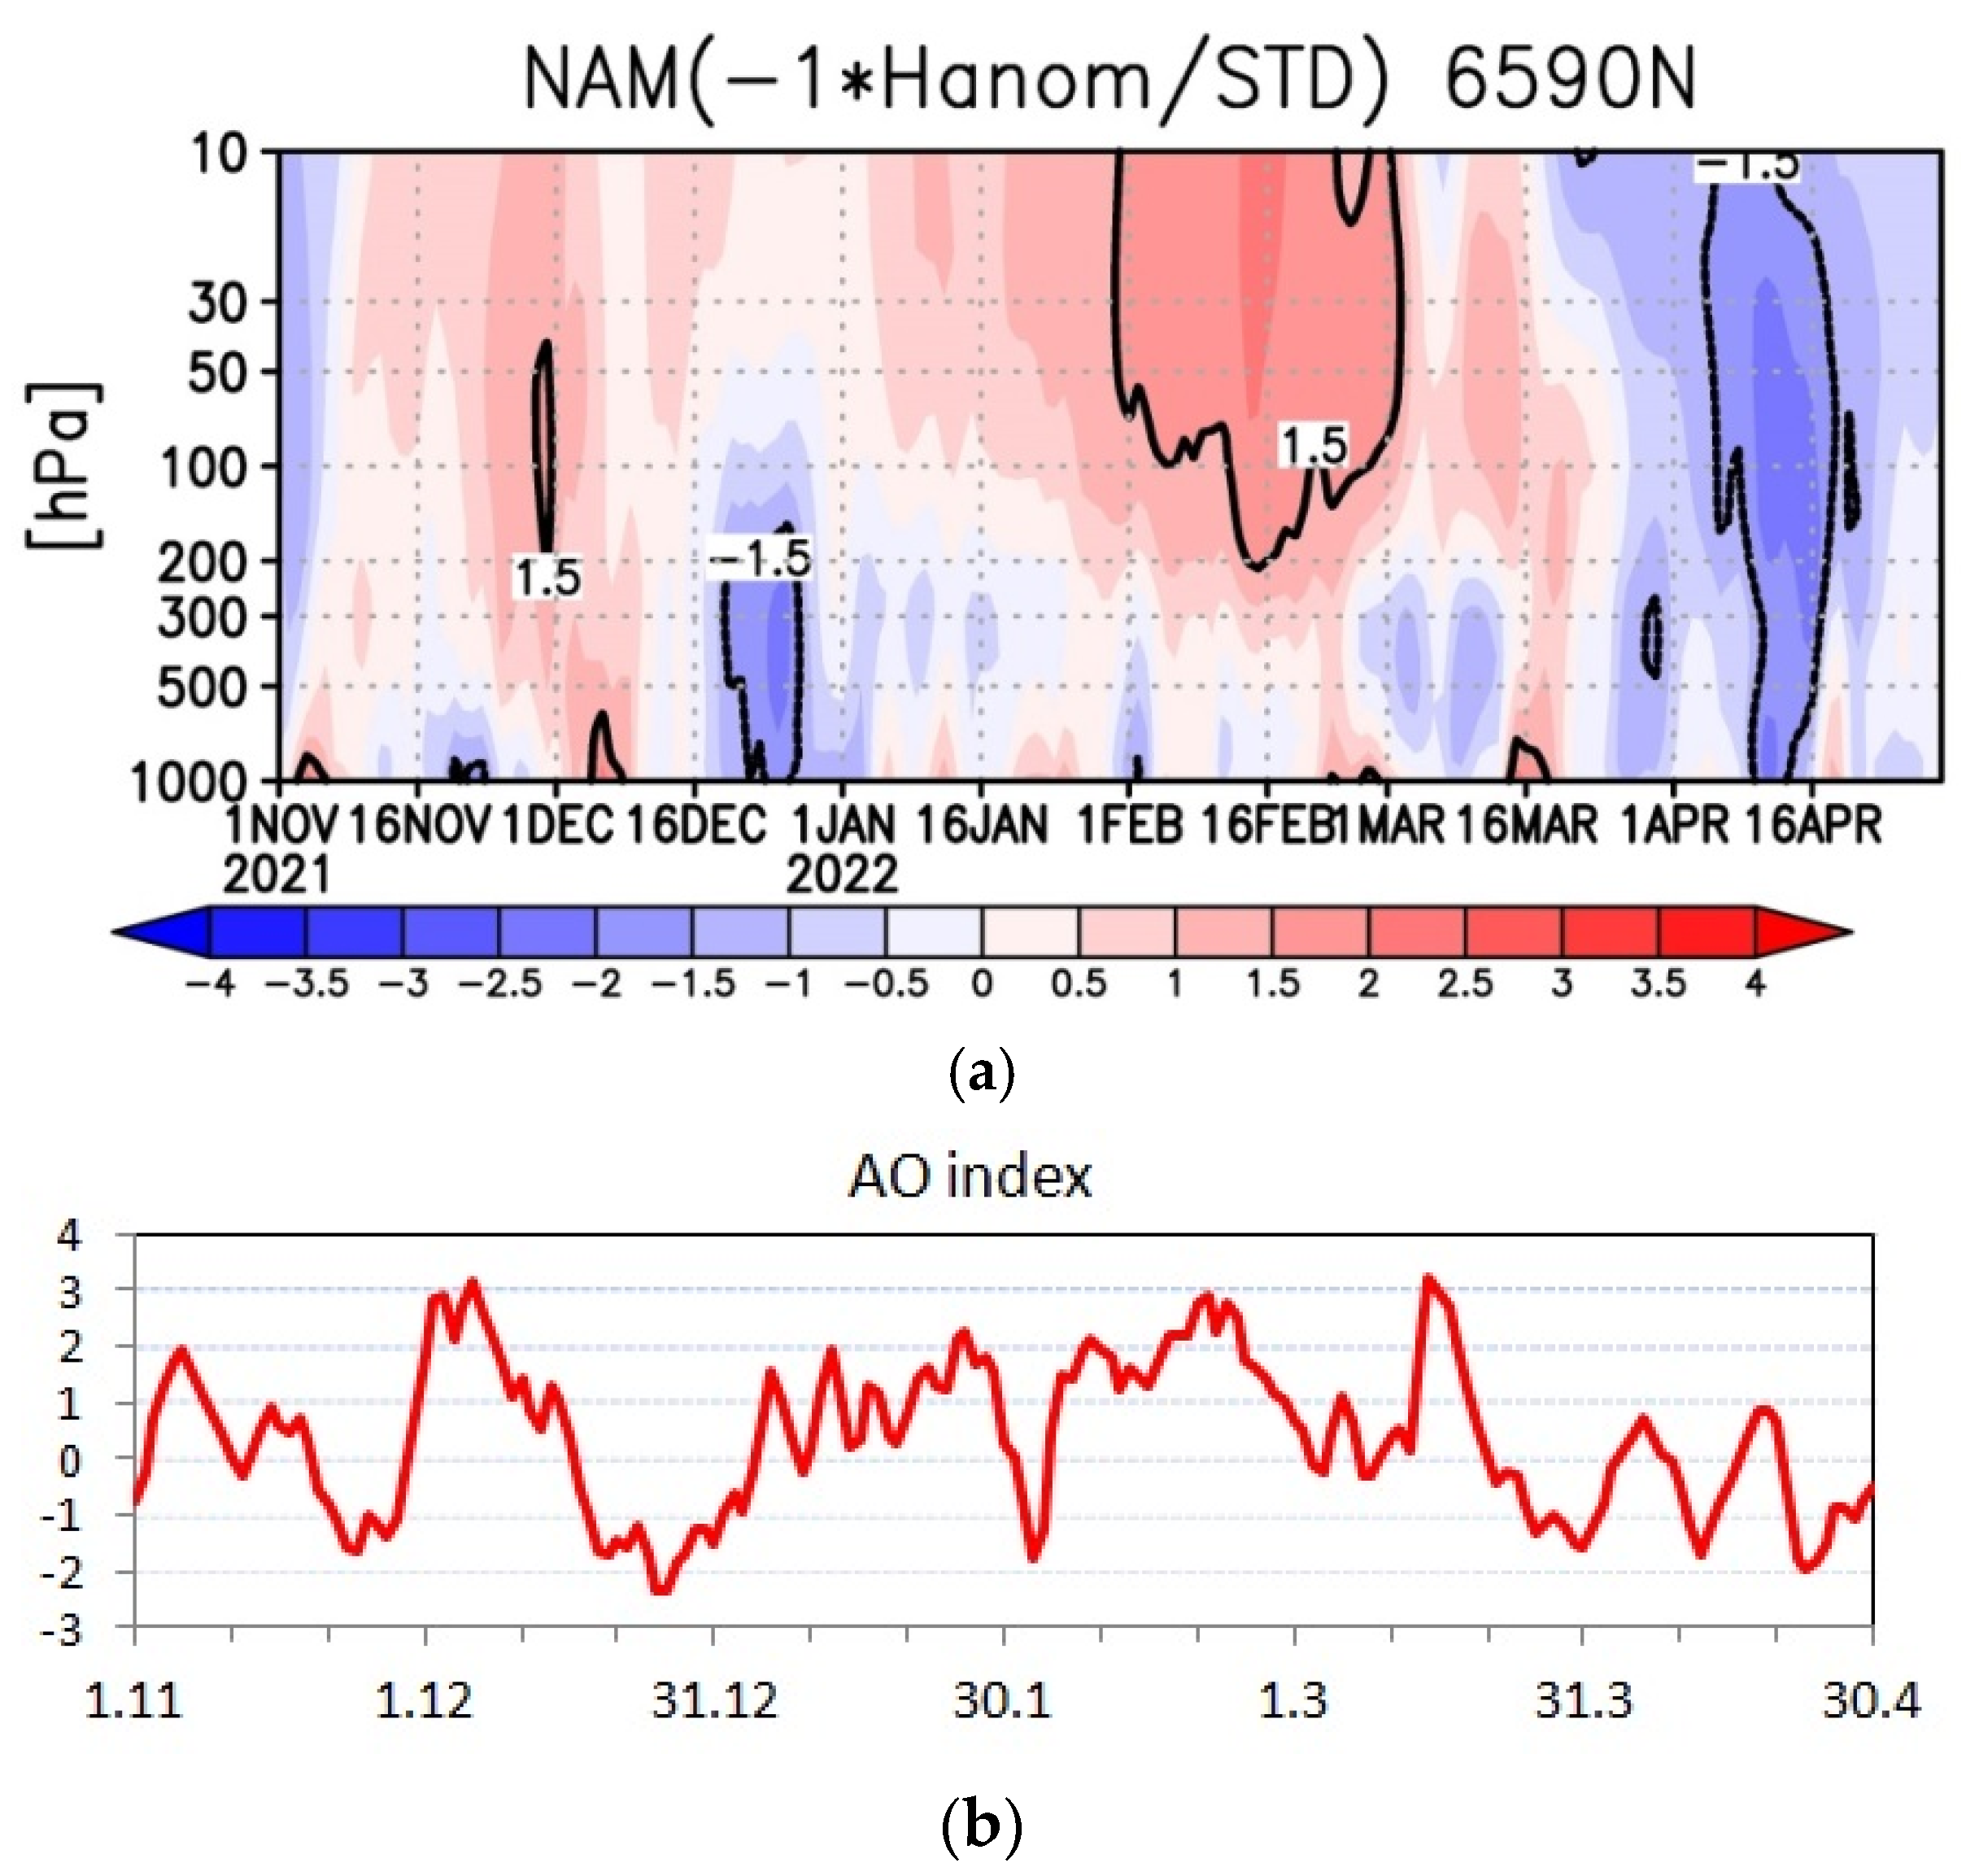
An analysis of changes in the northern annular mode (NAM) showed a strengthening of the stratospheric polar vortex in late November–early December 2021 and a rather rapid and continuous propagation of circulation anomalies from the middle stratosphere to the troposphere (Figure 6a). Approximately from mid-January to the end of February, the next intensification of the stratospheric polar vortex was observed, which, however, was not characterized by the continuous propagation of stratospheric circulation anomalies into the troposphere.
Approximately from 20 March, when the major SSW occurred, the stratospheric polar vortex weakened, which was accompanied in early April by an almost synchronous propagation of circulation anomalies from the lower–middle stratosphere to the lower troposphere, including the propagation of an area with values exceeding 1.5 standard deviation units (σ).
Simultaneously with the propagation of circulation anomalies from the stratosphere to the troposphere in late November–early December 2021, there was a sharp increase in the Arctic oscillation index (AO) from negative values in late November (~−1.5 σ) to values exceeding 3 σ (Figure 6b). By the end of December, the AO index decreased again, to the minimum values for the winter season (to −2.2 σ), which indicated a decrease in zonal and an increase in meridional transport in the troposphere. Furthermore, the AO index raised again and (with the exception of 3 days in early February) remained positive until the end of March. In April, the AO index was predominantly negative.
It can be assumed that the strengthening of the AO index in late November–early December 2021, as well as its weakening in early April 2022, could be associated with the strengthening and weakening of the stratospheric polar vortex, respectively.
Previous studies based on finite-amplitude wave interaction with the mean flow showed that the downward migration of extratropical wind anomalies following SSW and strong vortex events is largely attributable to dynamical adjustments induced by fluctuating finite-amplitude wave forcing [66,67]. The nonconservative effects, on the other hand, contribute to maintaining the downward signals in the recovery stage within the stratosphere, hinting at the importance of mixing and diabatic heating. Presumably, these factors could have been responsible for downward propagation of the NAM index following strong vortex and SSW events in the winter of 2021–2022.

3.5. Changes in Volume of Polar Stratospheric Clouds

As mentioned above, the "volume" of the I type of PSC for the winter in general characterizes the degree of chemical destruction of ozone: a larger Vpsc corresponds to a greater chemical destruction [15,16]. The exception is those winters when, as a result of the SSW and the associated significant increase in temperature, the formed PSCs disappear at the beginning of the spring, i.e., before the period of active ozone depletion.
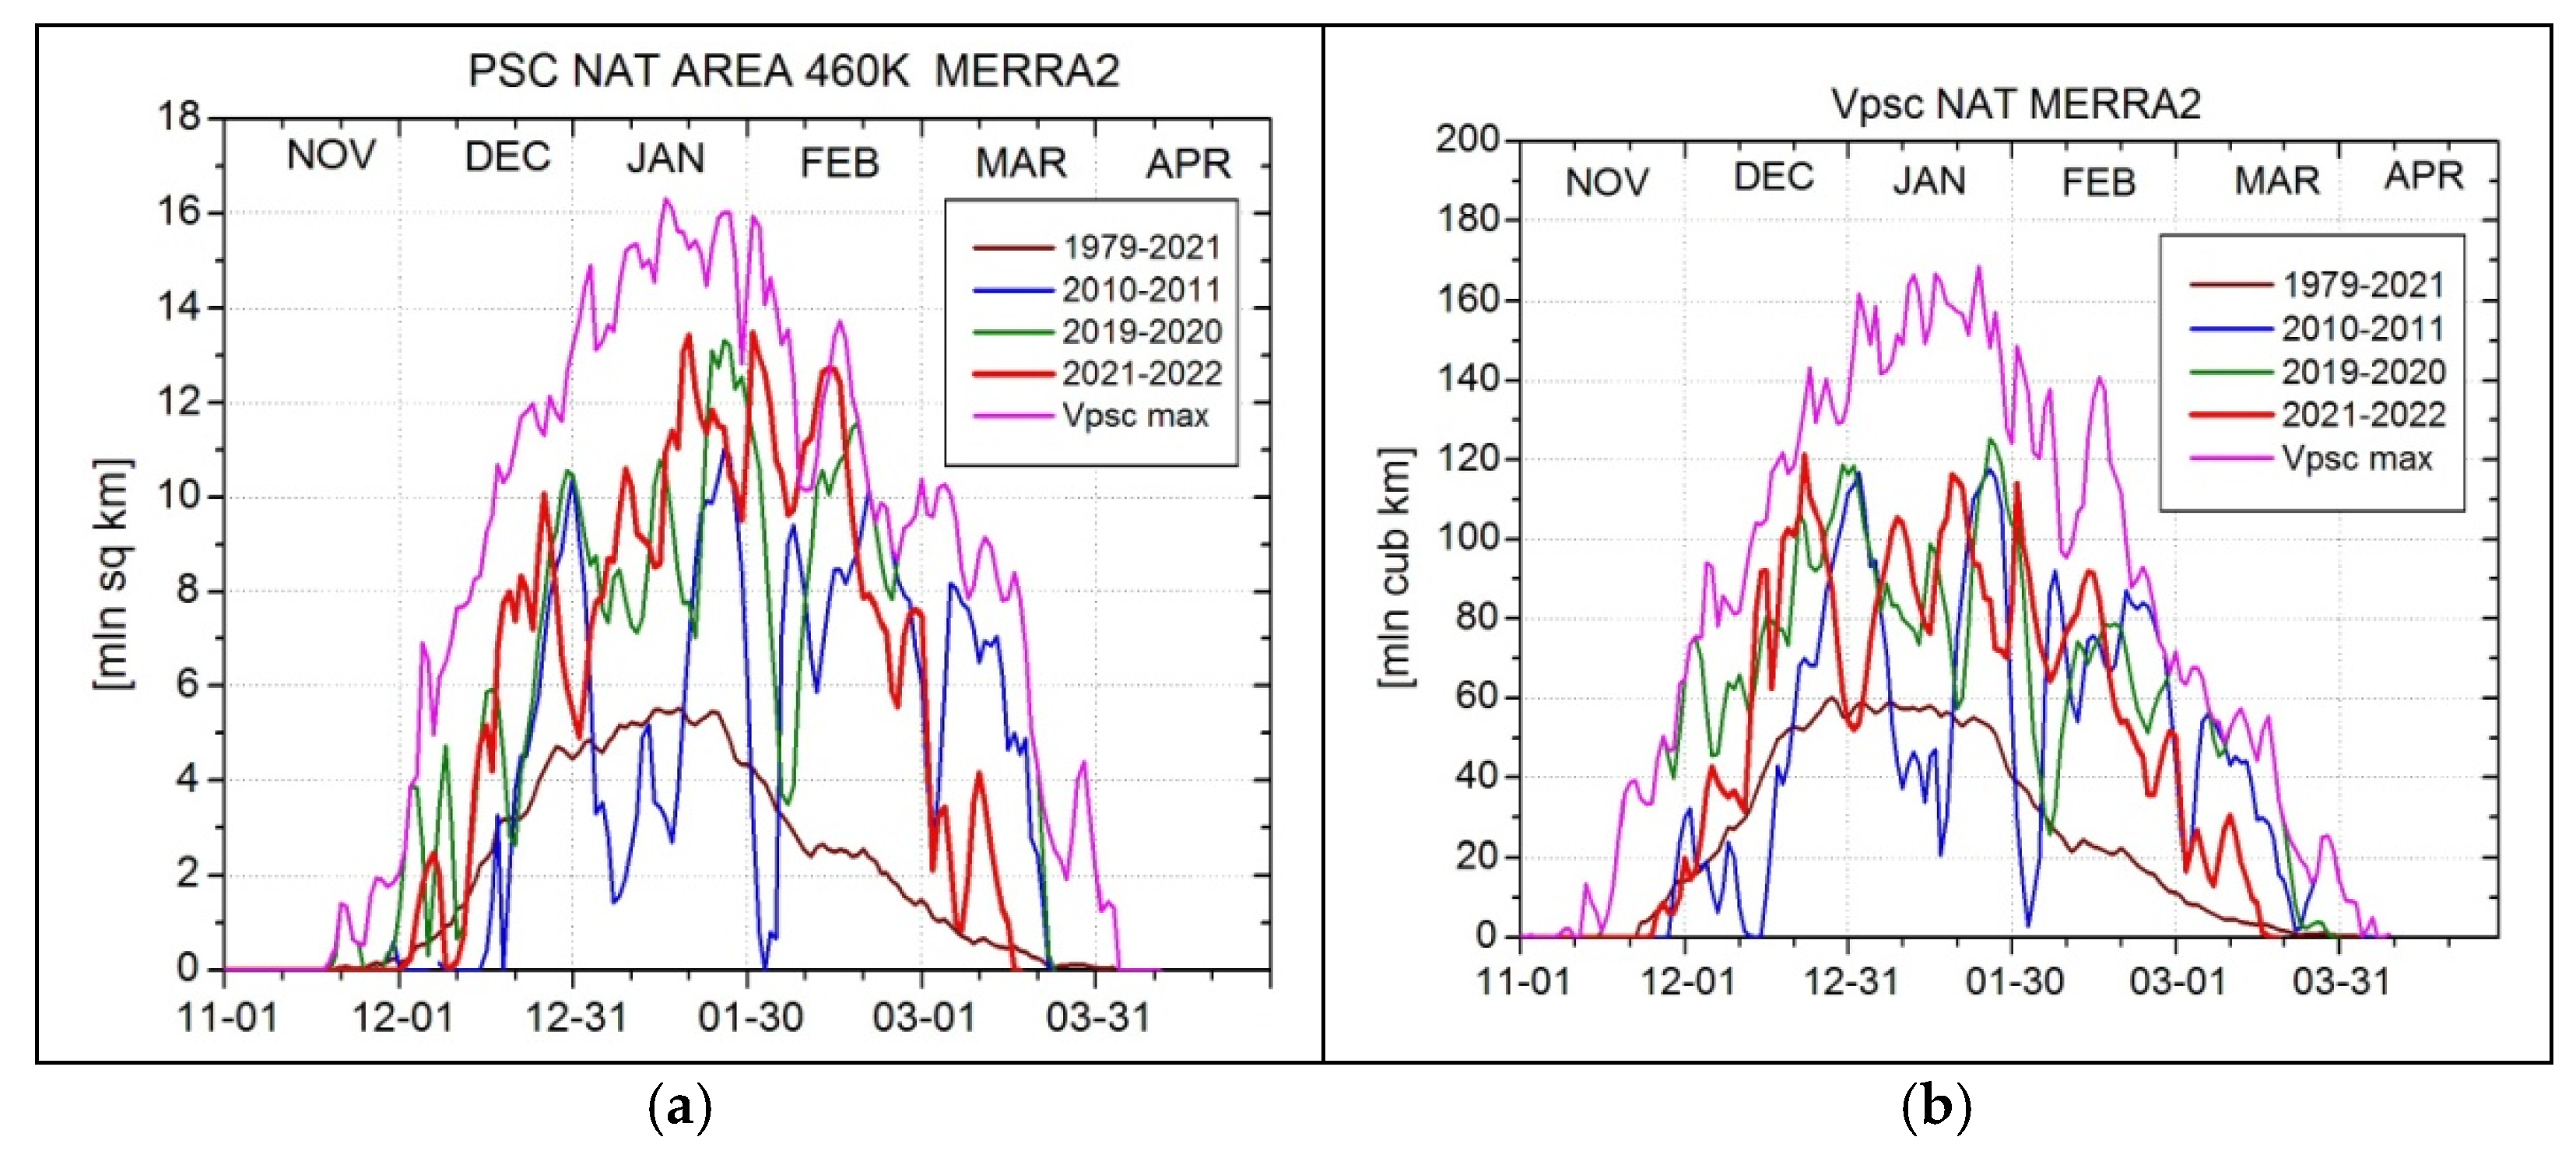
The first half of the 2020–2021 winter was characterized by a stable and cold stratospheric polar vortex. As a result, in December–January, the values of the PSC area in the lower stratosphere and the Vpsc were close to or exceeded the corresponding values of the “coldest” winters of 2010–2011 and 2019–2020, with the greatest ozone depletion for all the years of observations (Figure 7a).
The Vpsc during the winter of 2021–2022 was close to the corresponding values of the winters 2010–2011 and 2019–2020 with the highest ozone layer depletion (Figure 7b). Since the end of February 2022, a rather smooth decrease in the Vpsc was observed due to an increase in heating of the lower stratosphere. In early March, as a result of a minor SSW, there was a sharp decrease in the Vpsc, and, by mid-March, it was close to zero. The average monthly value of the Vpsc in January 2022 was ~89 mln. cub. km, which is slightly less than the ~93 mln. cub. km in January 2020, but more than the 73.7 mln. cub. Km in January 2011. Hence, the minor SSW event in the beginning of March 2022 led to warming of the Arctic lower stratosphere and prevented a strong ozone destruction.
Interestingly, additionally enhanced wave reflection in the Arctic polar stratosphere due to strong vortex events can lead to increased springtime ozone loss through two effects: (1) the direct effect in which the residual circulation is weakened during winter, reducing the typical increase of ozone due to upward planetary wave events; (2) the indirect effect in which the modification of polar temperature during winter leads to more PSC formation that in turn increases ozone destruction in spring [68].

3.6. Spring Breakup of Stratospheric Circulation

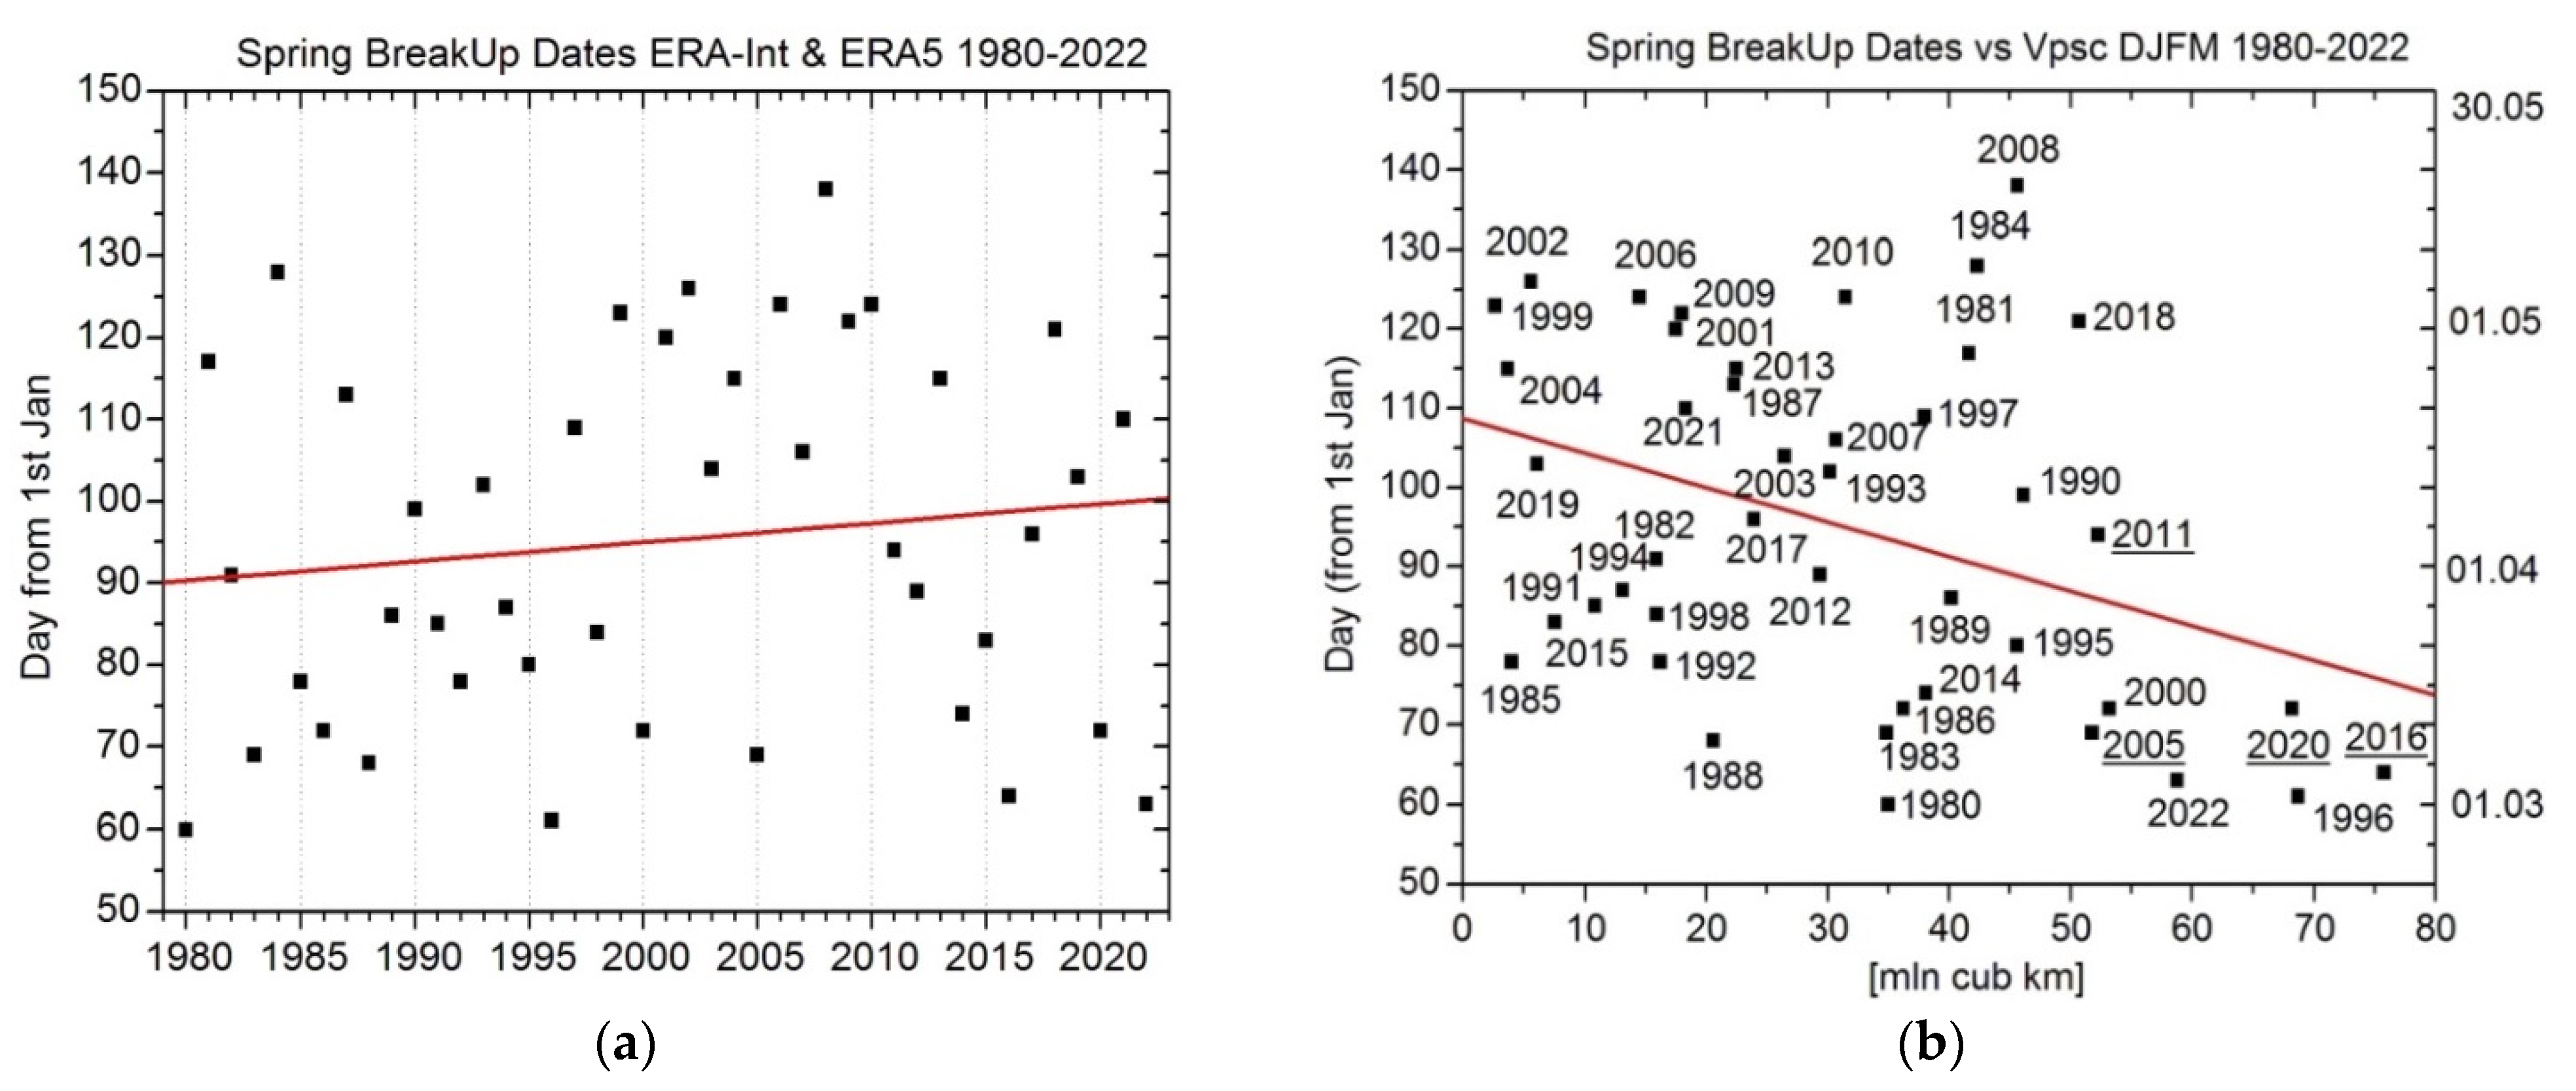
Over the time interval from 1980 to 2022, the trend toward later spring breakup continued, while the observed negative trend was insignificant (Figure 8a). The obtained variability of spring breakup dates is consistent with the results obtained using the NCEP reanalysis data over the period of 1971–2009, with a significant positive trend to later dates [43], as well as with the results obtained using the ERA-Interim reanalysis data over the period of 1980–2017, where the negative trend was found to be insignificant [69].
A weak correlation but with a statistically significant negative trend between the spring breakup dates and the total Vpsc for December–March remained (Figure 8b). Previously, a similar correlation (corr. coef. = − 0.34) was found for the period of 1980–2017 [69]. This is explained by the fact that, after a period of low temperatures in the lower stratosphere of the Arctic in January and the first half of February, when a large Vpsc is formed, a significant warming in the middle stratosphere often follows in March–April with a breakup of circulation.
It was shown that the first empirical orthogonal function (EOF) of intraseasonal temperature variability in the Arctic stratosphere is characterized by the fact that, after an anomaly of one sign in the range of 30–70 hPa in late January–the first half of February, an anomaly of another sign at 10 hPa follows in March–April [70].
The spring breakup of the circulation occurred on 4 March 2022 i.e., 9 days earlier than in the winter of 2019–2020, with record ozone depletion in the Arctic lower stratosphere (March 13), and the average Vpsc for December–March reached ~58 mln. cub. km, which is only on ~10 mln. cub. km less than in the winter 2019–2020.
However, for the destruction of the ozone layer in the Arctic lower stratosphere, the Vpsc in March, when active destruction of the ozone layer begins with the rising sun, is most important. In March 2020, the Vpsc was ~37.6 mln. cub. km, while, in March 2022, it was three times less at ~11.4 mln. cub. km. In the same way, the total daily Vpsc values for March also differed: ~1167 mln. cub. km in 2020 and ~355 mln. cub. km in 2022.

3.7. Changes in the Zonal Mean and Residual Meridional Circulation

In the recent winter of 2019–2020 with a very strong stratospheric polar vortex in February–March, the formation of a double structure of the zonal mean wind jet maximum was observed, in the upper stratosphere–lower mesosphere over the subtropics and over high latitudes with a maximum in the middle stratosphere near 10 hPa [16,50]. This double structure of the zonal mean wind is favorable for reflecting wave activity downward, which leads to strengthening and stabilization of the Arctic stratospheric polar vortex [23,71]. It is supposed that the reasons for the strong polar vortex in 2019–2020 were the weakened propagation of wave activity from the troposphere to the stratosphere and the reflection of wave activity in the upper stratosphere.
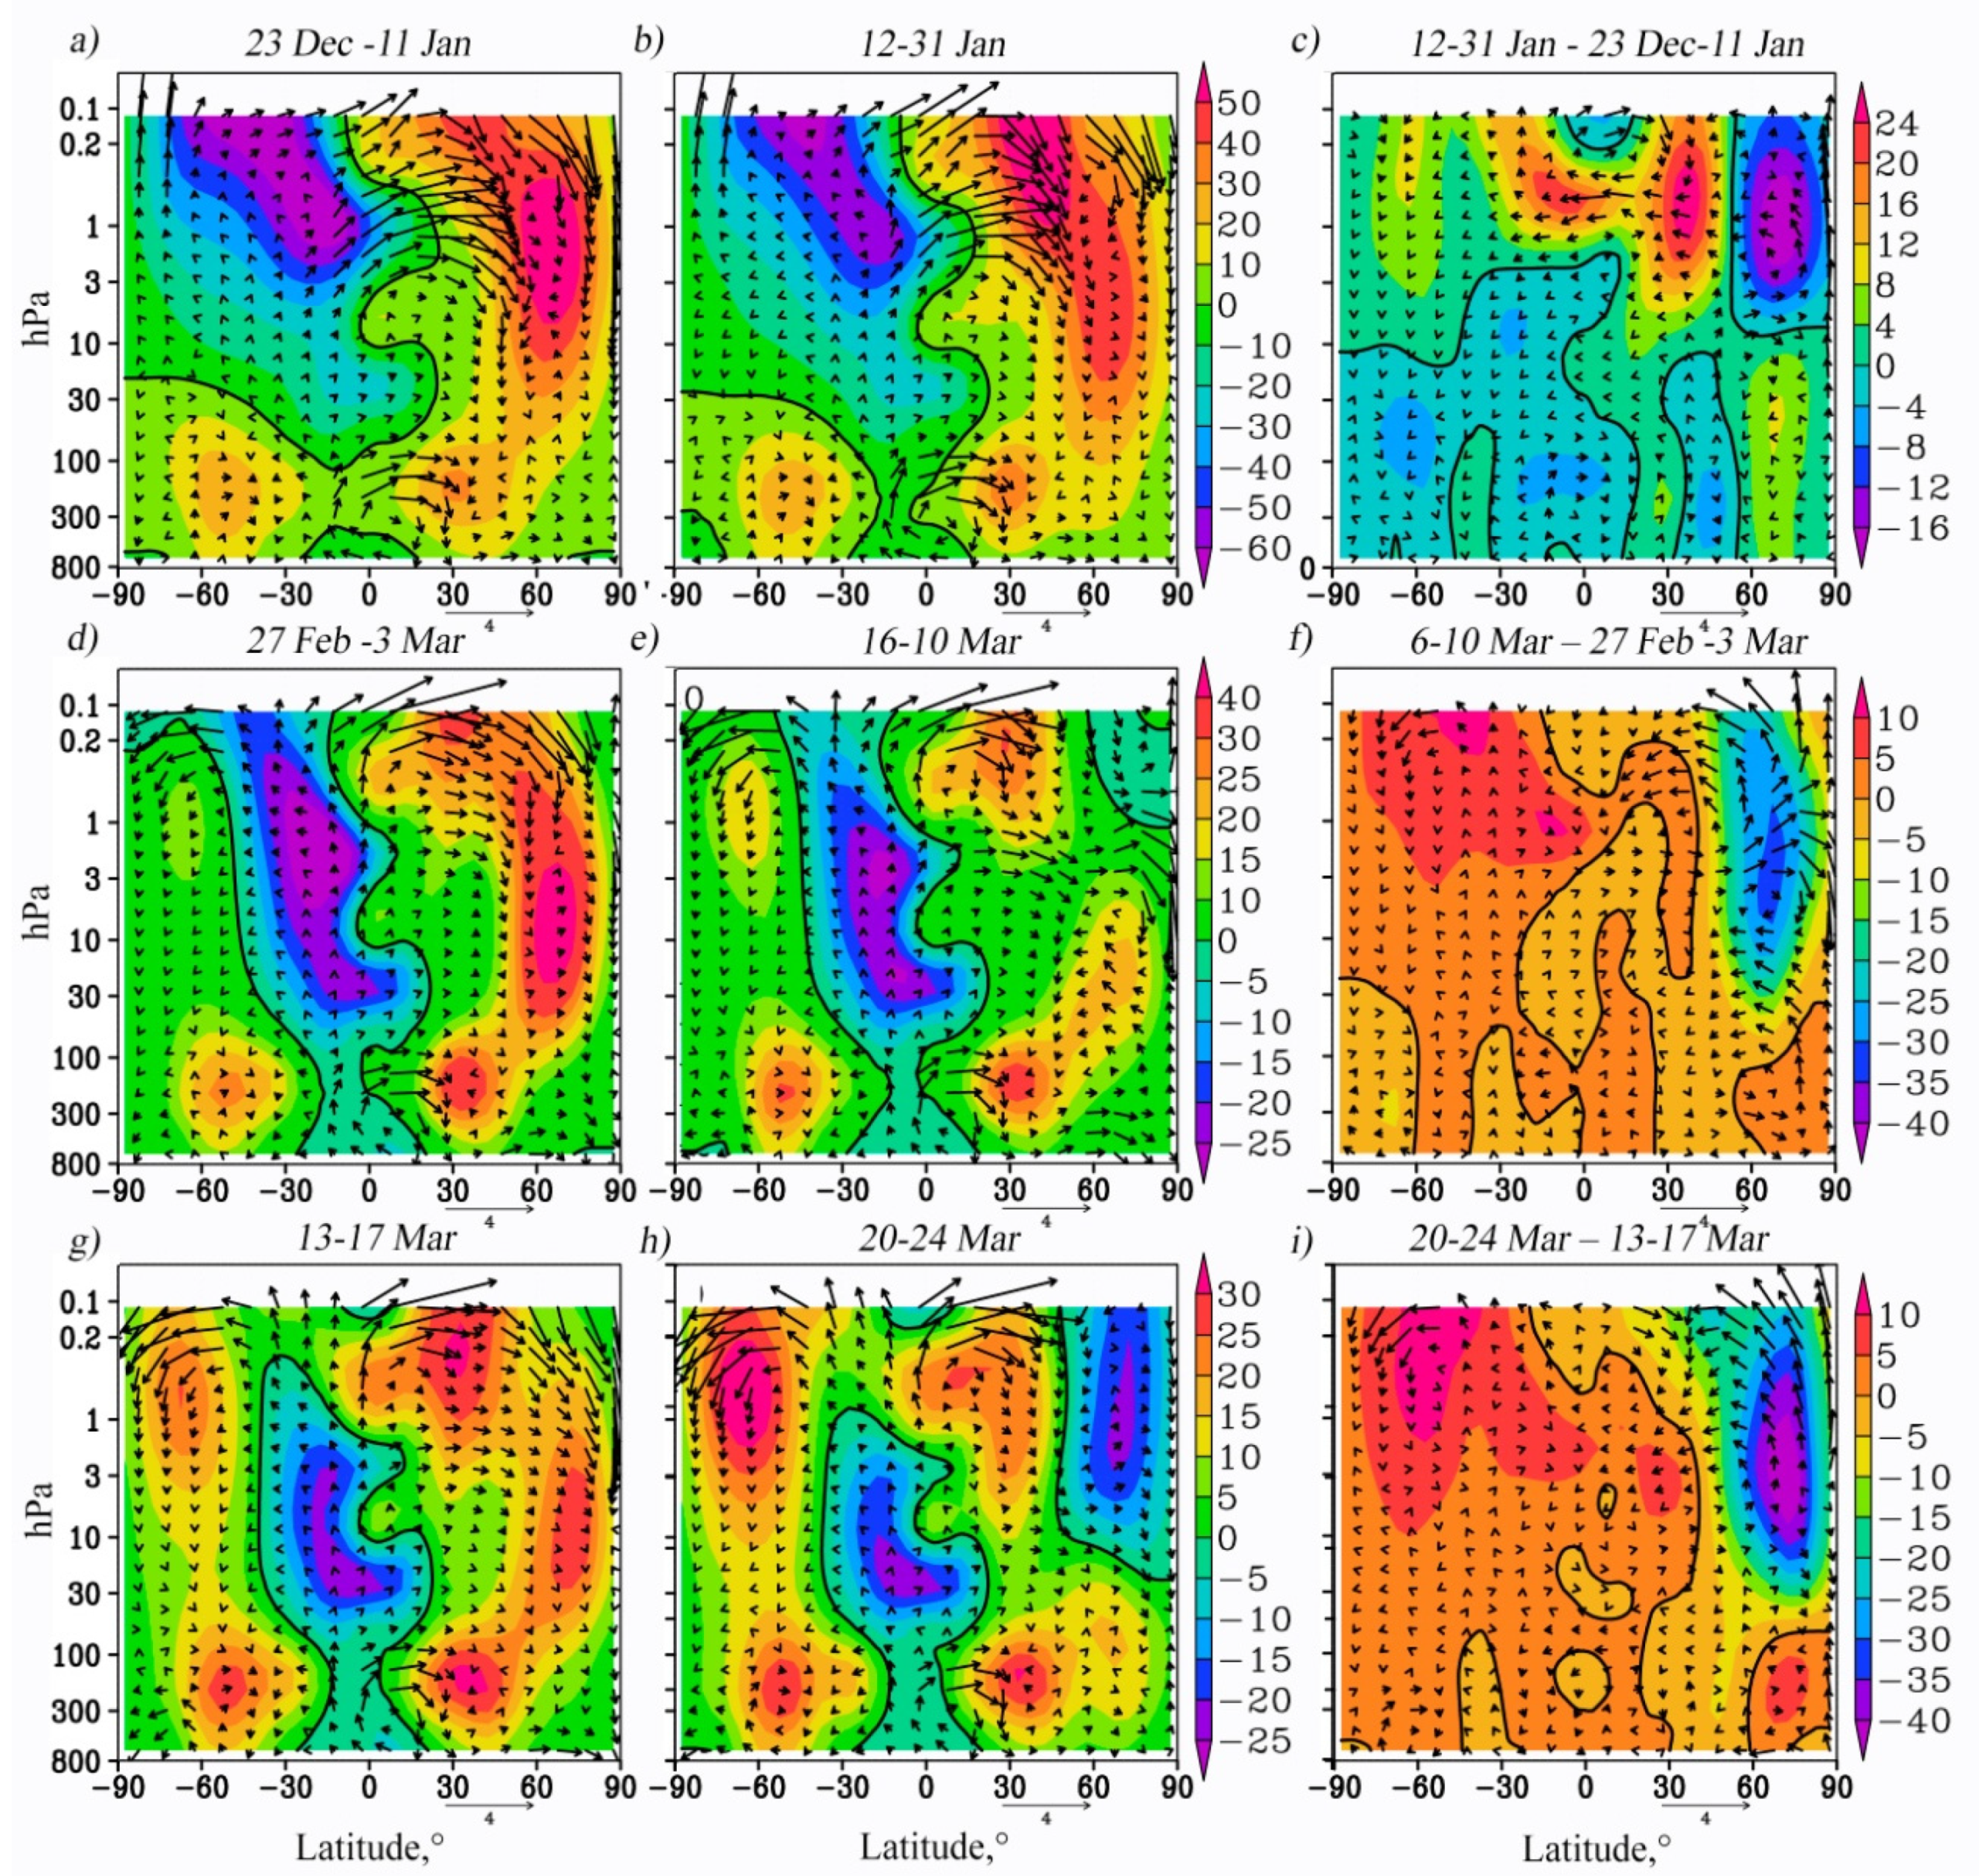
A similar double structure of the zonal mean wind was revealed in the second half of January 2022: the first maximum with speed faster than ~55 m/s in the upper stratosphere–lower mesosphere over the subtropics, and the second maximum with speed up to ~45 m/s near the pressure level of 10 hPa over the latitudes of 60°–70° N (Figure 9b). Such a separation was not observed either in December 2021 or in the first half of January 2022. In the first half of February 2022, the merging of the maxima was observed, accompanied by a shift of the maximum in the upper stratosphere to low latitudes.
An analysis of the changes in the RMC was carried out for the periods of the greatest intensification of the stratospheric polar vortex in January 2022 during the winter season, as well as the minor SSW in early March and the major SSW on 20 March 2022.
Figure 9a,b show the latitude–height distributions of the RMC and the zonal mean zonal wind according to MERRA-2 data, averaged over 20 day time intervals from 23 December 2021 to 11 January 2022, before the formation of the double maximum of the zonal wind and from 12 to 31 January 2022, when a double maximum of the zonal mean wind was observed in the upper stratosphere. The difference between these periods shown in Figure 8c reveals that, in the lower polar stratosphere, the stratospheric polar vortex intensified by up to 15 m/s (i.e., by ~50%). At the same time, in the upper stratosphere, a weakening of the vortex in the polar region and an increase over the region of 30°–50° N were observed. Both the strengthening and the weakening of the mean zonal wind were ~20–25%. Taking into account these changes, one can conclude a shift of the zonal mean wind jet maximum closer to the pole at the bottom and toward middle latitudes at the top, or compression of the polar vortex region in the lower stratosphere and its expansion in the upper stratosphere.
Simultaneously with the indicated deformation of the polar vortex, the RMC slowed down in the upper subpolar stratosphere (its vertical and meridional components). This led to adiabatic cooling of the indicated area. Indeed, during the strengthening of the polar vortex and the formation of the structure of the double maximum from 12 to 31 January, in the middle and high latitudes, a decrease in temperature was observed, with the exception of the subpolar region in the altitude range of 30–40 km, where, on the contrary, a warming occurred. This warming was associated with a shift in this area of the jet stream toward the equator (i.e., a weakening of the zonal wind in this area was observed), which contributed to an increase in the meridional temperature gradient according to the thermal wind theory. Above 35–40 km, a significant weakening of the meridional transport was observed at lower and high latitudes.
Taking into account rapid changes in the dynamics of the Arctic stratosphere occurring during the SSW, we considered changes in the RMC and the zonal mean wind for 5 day periods before and during the minor SSW on 6–8 March (Figure 9d,e) and their difference (Figure 9f), as well as before and during the major SSW on 20 March 2022 (Figure 9g,h) and their increments (Figure 9i).
The comparison of the periods of 13–17 and 20–24 March 2022 (before and during the major SSW), presented in Figure 8g,h, shows a decrease in the mean zonal wind by ~40 m/s due to the major SSW and weakening, up to partial disappearance of the descending branch of the RMC in the upper stratosphere of the Arctic (Figure 9h), which was accompanied by cooling of this area during the major SSW. In the middle and lower polar stratosphere, on the contrary, an increase in the RMC was noticeable, especially in its vertical branch, accompanied by an increase in temperature during the SSW, capable of making an additional contribution to this warming due to the adiabatic warming of the descending flow. As a result of the minor SSW at the beginning of March (Figure 9d–f), the mean zonal wind speed in the middle and upper stratosphere significantly decreased (Figure 9f). In general, the trends were similar to the major SSW; however, the observed effects were weaker; the slowdown of the descending branch of the RMC in the upper Arctic stratosphere and the increase in the lower layers correspond to the cooling and heating of these layers, respectively.

4. Summary

Despite active research in recent years, the mechanisms responsible for the interannual variability of the Arctic stratosphere dynamics in winter still remain not fully understood. In addition to the impact of this variability on the ozone layer and the upper atmosphere, changes in the dynamics of the polar stratosphere can affect the circulation of the troposphere and weather patterns. Extension of our knowledge on the mechanisms of interannual variability of the stratospheric circulation and stratosphere–troposphere dynamical interaction is necessary for improving the modeling of the stratosphere and the development of seasonal forecasting [72]. In addition, it should be noted that, in recent years, there has been an increase in extreme climate events; therefore, studies of this kind, including a detailed analysis of dynamic processes, are very important in terms of identifying various trends and predicting them in the future.
In the course of the study of the circulation of the Arctic stratosphere in the winter of 2021–2022, the main results obtained are described below.
A strong, persistent stratospheric polar vortex was observed from December until the end of February, when the first minor SSW occurred, followed by the second one in early March, which increased the temperature of the Arctic stratosphere and significantly decreased the zonal mean wind.
  • A large volume of PSC formed in the lower stratosphere and was comparable (at the end of February even exceeding) with the corresponding values of the winters with the highest ozone layer depletion (2010–2011 and 2019–2020); it quickly decreased to close to zero values in the middle of March 2022, which prevented significant ozone depletion.
  • Spring breakup of the Northern Hemisphere stratosphere circulation occurred on 4 March 2022, i.e., 1 month earlier than the climatic date from 1980 to 2017 (4 April).
  • The strengthening of the AO index in late November–early December 2021 and the weakening of this index in early April 2022 could be associated with strengthening/weakening of the stratospheric polar vortex. The reasons for the strengthening of the stratospheric polar vortex in winter 2021–2022 presumably were the following: the cold phase of ENSO—La Niña, minimal propagation of wave activity from the lower stratosphere to the middle–upper stratosphere in January–February since 1979 that could also be related to La Niña [73,74], and formation of the zonal mean wind jet structure with a double-peaked maximum in the second half of January 2022.
  • Weakening (strengthening) of the descending branch of the residual circulation, observed in the subpolar upper (middle) stratosphere during both minor and, in particular, major SSW, contributed to additional cooling (warming) of the Arctic stratosphere.
As already mentioned above, a strong interannual variability of the Arctic stratosphere has recently been observed in the presence of the continuing increase in GHGs. Taking into account a possible strengthening of the polar vortex in the coming decades that could impact the polar ozone and circulation of the troposphere, it is important to analyze peculiarities of stratospheric dynamics during cold winters with a persistent and cold stratospheric polar vortex. In this regard, one question follows from our study: Were there any other factors except La Niña that contributed to the lowest upward wave activity propagation in the lower stratosphere in January–February 2022 since the early 1980s?

Supplementary Materials

The following are available online at https://www.mdpi.com/article/10.3390/atmos13101550/s1, S1: three-dimensional Plumb flux vectors formula; S2: blocking index formula, S3: meridional and vertical components of the residual meridional circulation (RMC) formulas.

Author Contributions

Conceptualization, P.N.V.; provision of the reanalysis data, V.V.G.; wave activity analysis, P.N.V. and V.V.G.; calculation of the residual meridional circulation and analysis of its changes, A.V.K. All authors read and agreed to the published version of the manuscript.

Funding

This research was funded by the State Task of the Ministry of Science and Higher Education of the Russian Federation (project no. FSZU-2020-0009).

Data Availability Statement

The MERRA-2 reanalysis dataset can be obtained from https://disc.gsfc.nasa.gov/datasets/M2I6NVANA_5.12.4/summary (accessed on 28 July 2022), the ERA-5 reanalysis dataset: https://www.ecmwf.int/en/forecasts/dataset/ecmwf-reanalysis-v5 (accessed on 28 July 2022), and the NCEP reanalysis dataset: https://psl.noaa.gov/data/gridded/data.ncep.reanalysis.html (accessed on 28 July 2022). Code Availability: All plots in this study were made using Grid Analysis and Display System (GrADS) which is a free software developed thanks to the NASA Advanced Information Systems Research Program.

Acknowledgments

The reanalysis data were provided: ERA5 Copernicus Climate Change Service, MERRA-2 the National Aeronautics and Space Administration (NASA), and NCEP reanalysis Climate Prediction Center (NOAA). Estimates of area and volume of PSC I type (NAT) were provided by the NASA Ozone Watch project. The authors are grateful to the three reviewers for their meticulous reading of the paper and constructive comments and suggestions.

Conflicts of Interest

The authors declare no conflict of interest.

Abbreviations

SSWsudden stratospheric warming
PWplanetary wave
PSCpolar stratospheric clouds
Vpscvolume of air masses with temperature below the threshold of PSC formation
of the type I
RMCresidual mean meridional circulation
AOarctic oscillation
NAMnorthern annular mode

References

  1. Baldwin, M.; Birner, T.; Brasseur, G.; Burrows, J.; Butchart, N.; Garcia, R.; Geller, M.; Gray, L.; Hamilton, K.; Harnik, N.; et al. 100 Years of Progress in Understanding the Stratosphere and Mesosphere. Meteorol. Monogr. 2019, 59, 27.1–27.62. [Google Scholar] [CrossRef]
  2. Baldwin, M.; Ayarzaguena, B.; Birner, T.; Butchart, N.; Butler, A.; Charlton-Perez, A.; Domeisen, D.; Garfinkel, C.; Garny, H.; Gerber, E.; et al. Sudden Stratospheric Warmings. Rev. Geophys. 2021, 58, e2020RG000708. [Google Scholar] [CrossRef]
  3. Holton, J.R.; Mass, C. Stratospheric Vacillation Cycles. J. Atmos. Sci. 1976, 33, 2218–2225. [Google Scholar] [CrossRef]
  4. Pogoreltsev, A.; Savenkova, E.; Aniskina, O.; Ermakova, T.; Chen, W.; Wei, K. Interannual and intraseasonal variability of stratospheric dynamics and stratosphere-troposphere coupling during northern winter. J. Atmos. Sol. Terr. Phys. 2015, 136, 187–200. [Google Scholar] [CrossRef]
  5. Scaife, A.A.; James, I.N. Response of the stratosphere to interannual variability of tropospheric planetary waves. Q. J. R. Meteorol. Soc. 2000, 126, 275–297. [Google Scholar] [CrossRef]
  6. Gavrilov, N.M.; Koval, A.V.; Pogoreltsev, A.I.; Savenkova, E.N. Simulating planetary wave propagation to the upper atmosphere during stratospheric warming events at different mountain wave scenarios. Adv. Space Res. 2018, 61, 1819–1836. [Google Scholar] [CrossRef]
  7. Wittman, M.A.; Polvani, L.M.; Scott, R.K.; Charlton, A.J. Stratospheric influence on baroclinic lifecycles and its connection to the Arctic Oscillation. Geophys. Res. Lett. 2004, 31, L16113. [Google Scholar] [CrossRef]
  8. Song, Y.; Robinson, W.A. Dynamical mechanisms for stratospheric influences on the troposphere. J. Atmos. Sci. 2004, 61, 1711–1725. [Google Scholar] [CrossRef]
  9. Kunz, T.; Greatbatch, R.J. On the Northern Annular Mode Surface Signal Associated with Stratospheric Variability. J. Atmos. Sci. 2013, 70, 2103–2118. [Google Scholar] [CrossRef]
  10. Ogawa, F.; Omrani, N.-F.; Nishii, K.; Nakamura, H.; Keenlyside, N. Ozone-induced climate change propped up by the Southern Hemisphere oceanic front. Geophys. Res. Lett. 2015, 42, 10056–10063. [Google Scholar] [CrossRef] [Green Version]
  11. Lubis, S.W.; Huang, C.S.; Nakamura, N. Role of Finite-Amplitude Rossby Waves and Nonconservative Processes in Downward Migration of Extratropical Flow Anomalies. J. Atmos. Sci. 2018, 75, 1385–1401. [Google Scholar] [CrossRef]
  12. Tritscher, I.; Pitts, M.C.; Poole, L.R.; Alexander, S.P.; Cairo, F.; Chipperfield, M.P.; Groo, J.-U.; Höpfner, M.; Lambert, A.; Luo, B.; et al. Polar stratospheric clouds: Satellite observations, processes, and role in ozone depletion. Rev. Geophys. 2021, 59, e2020RG000702. [Google Scholar] [CrossRef]
  13. Ma, Z.; Gong, Y.; Zhang, S.; Zhou, Q.; Huang, C.; Huang, K.; Li, G. First observational evidence for the role of polar vortex strength in modulating the activity of planetary waves in the MLT region. Geophys. Res. Lett. 2022, 49, e2021GL096548. [Google Scholar] [CrossRef]
  14. Funke, B.; Ball, W.; Bender, S.; Gardini, A.; Harvey, V.; Lambert, A.; López-Puertas, M.; Marsh, D.; Meraner, K.; Nieder, H.; et al. HEPPA-II model–measurement intercomparison project: EPP indirect effects during the dynamically perturbed NH winter 2008–2009. Atmos. Chem. Phys. 2017, 17, 3573–3604. [Google Scholar] [CrossRef]
  15. Rex, M.; Salawitch, R.; Gathen, P.; Harris, N.; Chipperfield, M.; Naujokat, B. Arctic ozone loss and climate change. Geophys. Res. Lett. 2004, 31, L04116. [Google Scholar] [CrossRef]
  16. Rex, M.; Salawitch, R.; Deckelmann, H.; von der Gathen, P.; Harris, N.; Chipperfield, M.; Naujokat, B.; Reimer, E.; Allaart, M.; Andersen, S.; et al. Arctic winter 2005: Implications for stratospheric ozone loss and climate change. Geophys. Res. Lett. 2006, 33, L23808. [Google Scholar] [CrossRef]
  17. Gathen, P.; Kivi, R.; Wohltmann, I.; Salawitch, R.; Rex, M. Climate change favours large seasonal loss of Arctic ozone. Nat. Commun. 2021, 12, 3886. [Google Scholar] [CrossRef]
  18. Vargin, P.N.; Kostrykin, S.V.; Volodin, E.M.; Pogoreltsev, A.I.; Wei, K. Arctic Stratosphere Circulation Changes in the 21st Century in Simulations of INM CM5. Atmosphere 2022, 13, 25. [Google Scholar] [CrossRef]
  19. Vargin, P.N.; Kiryushov, B.M. Major Sudden Stratospheric Warming in the Arctic in February 2018 and Its Impacts on the Troposphere, Mesosphere, and Ozone Layer. Russ. Meteorol. Hydrol. 2019, 44, 112–123. [Google Scholar] [CrossRef]
  20. Wang, Y.; Milinevsky, G.; Evtushevsky, O.; Klekociuk, A.; Han, W.; Grytsai, A.; Antyufeyev, O.; Shi, Y.; Ivaniha, O.; Shulga, V. Planetary Wave Spectrum in the Stratosphere–Mesosphere during Sudden Stratospheric Warming 2018. Remote Sens. 2021, 13, 1190. [Google Scholar] [CrossRef]
  21. Rao, J.; Garfinkel, C.; Chen, H.; White, I. The 2019 New Year Stratospheric Sudden Warming and Its Real-Time Predictions in Multiple S2S Models. J. Geophys. Res. Atmos. 2019, 124, 11155–11174. [Google Scholar] [CrossRef]
  22. Vargin, P.N.; Lukyanov, A.N.; Kiryushov, B.M. Dynamical processes of Arctic stratosphere in the winter 2018–2019. Russ. Meteorol. Hydrol. 2020, 45, 387–397. [Google Scholar] [CrossRef]
  23. Lawrence, Z.; Perlwitz, J.; Butler, A.; Manney, G.; Newman, P.; Lee, S.; Nash, E. The remarkably strong Arctic stratospheric polar vortex of winter 2020: Links to record-breaking Arctic oscillation and ozone loss. J. Geophys. Res. 2020, 125, e2020JD033271. [Google Scholar] [CrossRef]
  24. Wohltmann, I.; von der Gathen, P.; Lehmann, R.; Maturilli, M.; Deckelmann, H.; Manney, G.; Davies, J.; Tarasick, D.; Jepsen, N.; Kivi, R.; et al. Near-complete local reduction of Arctic stratospheric ozone by severe chemical loss in spring 2020. Geophys. Res. Lett. 2020, 47, e2020GL089547. [Google Scholar] [CrossRef]
  25. Smyshlyaev, S.P.; Vargin, P.N.; Motsakov, M.A. Numerical modeling of ozone loss in the exceptional Arctic stratosphere winter-spring of 2020. Atmosphere 2021, 12, 1470. [Google Scholar] [CrossRef]
  26. Lukyanov, A.N.; Vargin, P.N.; Yushkov, V.A. Lagrange Studies of Anomalously Stable Arctic Stratospheric Vortex Observed in Winter 2019–2020. Izv. Atmos. Ocean. Phys. 2021, 57, 247–253. [Google Scholar] [CrossRef]
  27. Tsvetkova, N.D.; Vargin, P.N.; Lukyanov, A.N.; Kirushov, B.M.; Yushkov, V.A.; Khattatov, V.U. Investigation of chemistry ozone destruction and dynamical processes in Arctic stratosphere in winter 2019–2020. Russ. Meteorol. Hydrol. 2021, 46, 597–606. [Google Scholar]
  28. Shi, Y.; Evtushevsky, O.; Shulga, V.; Milinevsky, G.; Klekociuk, A.; Andrienko, Y.; Han, W.; Shi, Y.; Evtushevsky, O.; Milinevsky, G.; et al. Zonal Asymmetry of the Stratopause in the 2019/2020 Arctic Winter. Remote Sens. 2022, 14, 1496. [Google Scholar] [CrossRef]
  29. Hardiman, S.C.; Dunstone, N.J.; Scaife, A.A.; Smith, D.M.; Knight, J.R.; Davies, P.D.; Claus, M.; Greatbatch, R.J. Predictability of European winter 2019/20: Indian Ocean dipole impacts on the NAO. Atmos. Sci. Lett. 2020, 21, e1005. [Google Scholar] [CrossRef]
  30. Wright, C.; Hall, R.; Banyard, T.; Hindley, N.; Mitchell, D.; Seviour, W. Dynamical and Surface Impacts of the January 2021 Sudden Stratospheric Warming in Novel Aeolus Wind Observations, MLS and ERA5. Weather Clim. Dyn. 2021, 2, 1283–1301. [Google Scholar] [CrossRef]
  31. Vargin, P.N.; Guryanov, V.V.; Lukyanov, A.N.; Vyzankin, A.S. Dynamic Processes of the Arctic Stratosphere in the 2020–2021 Winter. Izv. Atmos. Ocean. Phys. 2021, 57, 568–580. [Google Scholar] [CrossRef]
  32. Lu, Q.; Rao, J.; Liang, Z.; Guo, D.; Luo, J.; Liu, S.; Wang, C.; Wang, T. The sudden stratospheric warming in January 2021. Environ. Res. Lett. 2021, 16, 084029. [Google Scholar] [CrossRef]
  33. Hongming, Y.; Yuan, Y.; Guirong, T.; Yucheng, Z. Possible impact of sudden stratospheric warming on the intraseasonal reversal of the temperature over East Asia in winter 2020/21. Atmos. Res. 2022, 268, 106016. [Google Scholar] [CrossRef]
  34. Kalnay, E.; Kanamitsu, M.; Kistler, R.; Collins, W.; Deaven, D.; Gandin, L.; Iredell, M.; Saha, S.; White, G.; Woollen, J.; et al. The NCEP/NCAR 40-year reanalysis project. Bull. Am. Meteorol. Soc. 1996, 77, 437–470. [Google Scholar] [CrossRef]
  35. Hersbach, H.; Bell, B.; Berrisford, P.; Hirahara, S.; Horányi, A.; Muñoz-Sabater, J.; Nicolas, J.; Peubey, C.; Radu, R.; Schepers, D.; et al. The ERA5 global reanalysis 1999-2049. Q. J. R. Meteorol. Soc. 2020, 146, 1999–2049. [Google Scholar] [CrossRef]
  36. Plumb, R. On the Three-Dimensional Propagation of Stationary Waves. J. Atmos. Sci. 1985, 42, 217–229. [Google Scholar] [CrossRef]
  37. Wei, K.; Ma, J.; Chen, W.; Vargin, P. Longitudinal peculiarities of planetary waves-zonal flow interactions and their role in stratosphere-troposphere dynamical coupling. Clim. Dyn. 2021, 57, 2843–2862. [Google Scholar] [CrossRef]
  38. Gečaitė, I. Climatology of Three-Dimensional Eliassen–Palm Wave Activity Fluxes in the Northern Hemisphere Stratosphere from 1981 to 2020. Climate 2021, 9, 124. [Google Scholar] [CrossRef]
  39. Perlwitz, J.; Harnik, N. Downward coupling between the stratosphere and troposphere: The relative roles of wave and zonal mean processes. J. Clim. 2004, 17, 4902–4909. [Google Scholar] [CrossRef]
  40. Baldwin, M.P.; Dunkerton, T.J. Stratospheric Harbingers of Anomalous Weather Regimes. Science 2001, 294, 581–584. [Google Scholar] [CrossRef]
  41. NASA Ozone Watch. Available online: https://ozonewatch.gsfc.nasa.gov/meteorology/about_plots.html (accessed on 1 May 2022).
  42. Lawrence, Z.; Manney, G.; Wargan, K. Reanalysis intercomparisons of stratospheric polar processing diagnostics. Atmos. Chem. Phys. 2018, 18, 13547–13579. [Google Scholar] [CrossRef] [PubMed] [Green Version]
  43. Savenkova, E.N.; Kanukhina, A.Y.; Pogoreltsev, A.I.; Merzlyakov, E.G. Variability of the springtime transition date and planetary waves in the stratosphere. J. Atmos. Sol. Terr. Phys. 2012, 90–91, 1–8. [Google Scholar] [CrossRef]
  44. Tibaldi, S.; Molteni, F. On the operational predictability of blocking. Tellus 1990, 42A, 343–365. [Google Scholar] [CrossRef]
  45. Andrews, D.G.; McIntyre, M.E. Planetary waves in horizontal and vertical shear: The generalized Eliassen–Palm relation and the mean zonal acceleration. J. Atmos. Sci. 1976, 33, 2031–2048. [Google Scholar] [CrossRef]
  46. Gelaro, R.; McCarty, W.; Suárez, M.J.; Todling, R.; Molod, A.; Takacs, L.; Randles, C.; Darmenov, A.; Bosilovich, M.; Reichle, R.; et al. The Modern-Era Retrospective Analysis for Research and Applications, Version 2 (MERRA-2). J. Clim. 2017, 30, 5419–5454. [Google Scholar] [CrossRef] [PubMed]
  47. Shepherd, T.G. Transport in the middle atmosphere. J. Meteorol. Soc. Jpn. 2007, 85, 165–191. [Google Scholar] [CrossRef]
  48. Koval, A.V.; Chen, W.; Didenko, K.A.; Ermakova, T.S.; Gavrilov, N.M.; Pogoreltsev, A.I.; Toptunova, O.N.; Wei, K.; Yarusova, A.N.; Zarubin, A.S. Modelling the residual mean meridional circulation at different stages of sudden stratospheric warming events. Ann. Geophys. 2021, 39, 357–368. [Google Scholar] [CrossRef]
  49. Domeisen, D.I.; Garfinkel, C.I.; Butler, A.H. The teleconnection of El Nino Southern Oscillation to the stratosphere. Rev. Geophys. 2019, 57, 5–47. [Google Scholar] [CrossRef]
  50. Holton, J.R.; Tan, H.-C. The Quasi-Biennial Oscillation in the Northern Hemisphere lower stratosphere. J. Meteorol. Soc. Jpn. 1982, 60, 140–148. [Google Scholar] [CrossRef]
  51. Schwartz, C.; Garfinkel, C.I. Relative roles of the MJO and stratospheric variability in North Atlantic and European winter climate. J. Geophys. Res. Atmos. 2017, 122, 4184–4201. [Google Scholar] [CrossRef]
  52. Ayarzagüena, B.; Manzini, E.; Calvo, N.; Matei, D. Interaction between decadal-to-multidecadal oceanic variability and sudden stratospheric warmings. Ann. N. Y. Acad. Sci. 2021, 1504, 215–229. [Google Scholar] [CrossRef] [PubMed]
  53. Hurwitz, M.; Newman, P.; Garfinkel, C. On the influence of North Pacific sea surface temperature on the Arctic winter climate. J. Geophys. Res. 2012, 117, D19110. [Google Scholar] [CrossRef]
  54. Zhang, P.; Wu, Y.; Smith, K.L. Prolonged effect of the stratospheric pathway in linking Barents–Kara Sea ice variability to the mid-latitude circulation in a simplified model. Clim. Dyn. 2018, 50, 527–539. [Google Scholar] [CrossRef]
  55. Watson, P.A.; Gray, L.J. How Does the Quasi-Biennial Oscillation Affect the Stratospheric Polar Vortex? J. Atmos. Sci. 2014, 71, 391–409. [Google Scholar] [CrossRef]
  56. Silverman, V.; Lubis, S.W.; Harnik, N.; Matthes, K. A Synoptic View of the Onset of the Midlatitude QBO Signal. J. Atmos. Sci. 2021, 78, 3759–3780. [Google Scholar] [CrossRef]
  57. Silverman, V.; Harnik, N.; Matthes, K.; Lubis, S.W.; Wahl, S. Radiative effects of ozone waves on the Northern Hemisphere polar vortex and its modulation by the QBO. Atmos. Chem. Phys. 2018, 18, 6637–6659. [Google Scholar] [CrossRef]
  58. Vargin, P.N.; Kolennikova, M.A.; Kostrykin, S.V.; Volodin, E.M. Influence of equatorial and north Pacific SST anomalies on Arctic stratosphere in INM RAS climate model simulations. Russ. Meteorol. Hydrol. 2021, 46, 1–9. [Google Scholar] [CrossRef]
  59. Hoshi, K.; Ukita, J.; Honda, M.; Nakamura, T.; Yamazaki, K.; Miyoshi, Y.; Jaiser, R. Weak stratospheric polar vortex events modulated by the Arctic sea-ice loss. J. Geophys. Res. 2019, 124, 858–869. [Google Scholar] [CrossRef]
  60. Newman, P.; Nash, E.; Rosenfeld, J. What controls the temperature of the Arctic stratosphere during the spring? J. Geophys. Res. 2001, 106, 19999–20010. [Google Scholar] [CrossRef]
  61. Kodera, K.; Mukougawa, H.; Itoh, S. Tropospheric Impact of Reflected Planetary Waves from the Stratosphere. Geophys. Res. Lett. 2008, 35, 2008GL034575. [Google Scholar] [CrossRef]
  62. Nath, D.; Chen, W.; Wang, L.; Ma, Y. Planetary wave reflection and its impact on tropospheric cold weather over Asia during January 2008. Adv. Atmos. Sci. 2014, 31, 851–862. [Google Scholar] [CrossRef]
  63. Matthias, V.; Kretschmer, M. The Influence of Stratospheric Wave Reflection on North American Cold Spells. Mon. Weather Rev. 2020, 148, 1675–1690. [Google Scholar] [CrossRef]
  64. Lubis, S.W.; Matthes, K.; Omrani, N.-E.; Harnik, N.; Wahl, S. Influence of the Quasi-Biennial Oscillation and Sea Surface Temperature Variability on Downward Wave Coupling in the Northern Hemisphere. J. Atmos. Sci. 2016, 73, 1943–1965. [Google Scholar] [CrossRef]
  65. Lubis, S.W.; Matthes, K.; Harnik, N.; Omrani, N.; Wahl, S. Downward Wave Coupling between the Stratosphere and Troposphere under Future Anthropogenic Climate Change. J. Clim. 2018, 31, 4135–4155. [Google Scholar] [CrossRef]
  66. Lubis, S.W.; Huang, C.S.Y.; Nakamura, N. Role of Finite-Amplitude Eddies and Mixing in the Life Cycle of Stratospheric Sudden Warmings. J. Atmos. Sci. 2018, 75, 3987–4003. [Google Scholar] [CrossRef]
  67. Nakamura, N.; Falk, J.; Lubis, S.W. Why Are Stratospheric Sudden Warmings Sudden (and Intermittent)? J. Atmos. Sci. 2020, 77, 943–964. [Google Scholar] [CrossRef]
  68. Lubis, S.W.; Silverman, V.; Matthes, K.; Harnik, N.; Omrani, N.-E.; Wahl, S. How Does Downward Planetary Wave Coupling Affect Polar Stratospheric Ozone in the Arctic Winter Stratosphere? Atmos. Chem. Phys. 2017, 17, 2437–2458. [Google Scholar] [CrossRef]
  69. Vargin, P.N.; Kostrykin, S.V.; Rakushina, E.V.; Volodin, E.M.; Pogoreltzev, A.I. Study of the Variability of Spring Breakup Dates and Arctic Stratospheric Polar Vortex Parameters from Simulation and Reanalysis Data. Izv. Atmos. Ocean. Phys. 2020, 56, 458–469. [Google Scholar] [CrossRef]
  70. Vorobyeva, V.V.; Volodin, E.M. Investigation of the Structure and Predictability of the First Mode of Stratospheric Variability Based on the INM RAS Climate Model. Russ. Meteorol. Hydrol. 2018, 43, 737–742. [Google Scholar] [CrossRef]
  71. Lukianova, R.; Kozlovsky, A.; Lester, M. Upper stratosphere mesosphere- lower thermosphere perturbations during the formation of the Arctic polar night jet in 2019–2020. Geophys. Res. Lett. 2021, 48, e2021GL094926. [Google Scholar] [CrossRef]
  72. Scaife, A.A.; Baldwin, M.P.; Butler, A.H.; Charlton-Perez, A.J.; Domeisen, D.I.; Garfinkel, C.I.; Hardiman, S.C.; Haynes, P.; Karpechko, A.Y.; Lim, E.-P.; et al. Long-range prediction and the stratosphere. Atmos. Chem. Phys. 2022, 22, 2601–2623. [Google Scholar] [CrossRef]
  73. Taguchi, M.; Hartmann, D.L. Increased occurrence of stratospheric sudden warming during El Niño as simulated by WAACM. J. Clim. 2006, 19, 324–332. [Google Scholar] [CrossRef]
  74. Bell, C.J.; Gray, L.J.; Charlton-Perez, A.J.; Joshi, M.M.; Scaife, A.A. Stratospheric Communication of El Niño Teleconnections to European Winter. J. Clim. 2009, 22, 4083–4096. [Google Scholar] [CrossRef]
Figure 1. Zonal mean wind anomalies at 60° N (colors) and climate mean values (contours) (a); zonal mean wind at 60° N at pressure levels 1, 3, 5, 10, 30, and 70 hPa (b); zonal mean wind anomalies (colors) and climate mean (contours) at pressure level 1 hPa (c) from 1 November 2021 to 30 April 2022.
Atmosphere 13 01550 g001
Figure 2. Temperature anomalies averaged over 70°–90° N from 1 November 2021 to 30 April 2022 (a); lower stratosphere temperature anomalies at a pressure level of 70 hPa in January and February 2022 (b,c); minimum temperature averaged over 70°–90° N at 70 hPa in the winters of 1996–1997, 2004–2005, 2010–2011, 2019–2020, 2021–2022, and climate mean 1979–2020. Horizontal lines correspond to the threshold of PSC formation of the type I and type II (d).
Atmosphere 13 01550 g002
Figure 3. Scatter diagram of lower temperature mean 70°–90° N at pressure level 70 hPa in March and zonal mean heat flux mean 45°–75° N at pressure level 100 hPa in January–February from 1979 to 2022 (a). Zonal mean heat flux averaged over 50°–80° N at pressure levels 30 hPa and 100 hPa (b); amplitudes of PW1–3 averaged over 50°–70° N at pressure levels of 3 hPa (c), 10 hPa (d), 70 hPa (e), 300 hPa (f); time–longitude cross-section of atmospheric blocking index (gpm/degree) at 500 hPa, smoothed by 5 day running mean (g) from 1 November 2021 to 30 April 2022.
Atmosphere 13 01550 g003aAtmosphere 13 01550 g003bAtmosphere 13 01550 g003c
Figure 4. Altitude–latitude diagram of Plumb flux (Fy, Fz components—arrows, Fz is multiplied by 100) (m2/s2) and zonal mean zonal wind (m/s) (contours); vertical component Fz at pressure levels 30 hPa and 100 hPa averaged over the following periods: 2–4 March (ac), 8–10 March (df), and 18–20 March 2022 (gi).
Atmosphere 13 01550 g004aAtmosphere 13 01550 g004b
Figure 5. Zonal mean refraction index of wave activity from 1 November 2021 to 30 April 2022.
Atmosphere 13 01550 g005
Figure 6. Northern annual mode (NAM) index (solid/dashed black lines indicate areas with values exceeding ±1.5 σ) (a); Arctic oscillation index (b) from 1 November 2021 to 30 April 2022.
Atmosphere 13 01550 g006
Figure 7. The area of the region with temperatures sufficient to form PSC I type in the Arctic lower stratosphere at potential temperature level 460 K (~125 hPa) (a) and Vpsc (b) from November to April of 2010–2011, 2019–2020, 2021–2022, and climate mean from 1979 to 2021.
Atmosphere 13 01550 g007
Figure 8. Scatter diagram of spring breakup dates from 1980 to 2022 (a) and Vpsc (mln. cub. km) averaged over December 2021–March 2022 (b). Years with large ozone loss are underlined.
Atmosphere 13 01550 g008
Figure 9. Altitude–latitudinal distributions of the meridional V* and vertical W* components of the residual meridional circulation (m/s) (vectors) and the mean zonal wind (m/s) (shading) from 23 December to 12 January (a), from 12 to 31 January 2022 (b), and the difference between these periods (c); from 27 February to 3 March (d), from 6 to 10 March 2022 (e) and their difference (f); from 13 to 17 March (g), from 20 to 24 March 2022 (h), and their difference (i). The black solid contours correspond to the zero mean zonal wind. The values of W* were multiplied by 200.
Atmosphere 13 01550 g009
Publisher’s Note: MDPI stays neutral with regard to jurisdictional claims in published maps and institutional affiliations.