Abstract
Atmospheric emission of heavy metals from different anthropogenic sources is a great concern to human beings due to their toxicities. In order to disclose the emission levels and the distribution patterns of zinc (Zn) in the modern cement industry with respect to its low boiling point (~900 °C) comparing to the high-temperature (1450 °C) clinker production process, solid samples representing the input and output flow of Zn during the entire production process in two preheater–precalciner cement plants (CPs) were collected and analyzed. For the first time, it was found that the behaviour of Zn inside different precalciner CPs was similar despite a huge difference in the Zn inputs to the CPs; namely, almost all the Zn input was output in clinker, which was then mixed with different additives and retarder to make cement products. The high-temperature clinkerisation process would incorporate Zn into the aluminosilicate of clinker. As a result, there was no enrichment of Zn during clinker production and the atmospheric emission factor was relatively low at 0.002%, or 1.28–9.39 mg Zn·t−1 clinker. Our result for the atmospheric Zn emissions from CPs was much lower than most previous reports, implying the CPs were not a crucial Zn emission source. However, the higher load of Zn in some raw/alternative materials—like nonferrous smelting slag with a Zn content of ~2%—could greatly increase the content of Zn in clinker and cement products. Therefore, further investigation on the environmental stability of Zn in such Zn-laden cement and concrete should be carried out.
1. Introduction
Trace elements in the Earth’s surface system are critical to livestock wellbeing due to their biological functions or toxicities [1]. The abundance of trace elements in the ambient environment is affected by both natural and anthropogenic sources [2,3]. In modern society, human activities are more extensive than at any previous time in the Earth’s history and have deeply influenced the biogeocycling of trace metals [4,5,6].
Zinc (Zn), which is an activator of enzymatic reactions, is one indispensable trace element for plants and microorganisms [7]. However, when the environmental levels of Zn exceed those required by the plant or microorganism, toxic effects can result [8]. Atmospheric emissions of Zn from anthropogenic sources are an important source of Zn, which can then enter the human body by dispersion, deposition, assimilation by plants and transferral through the food chain [9,10]. This can result in adverse human health effects [11,12]. Additionally, excessive exposure to Zn from the ambient air can cause chronic bronchitis, peritonitis, emphysema, asthma and even lung cancer [13]. Therefore, screening and assessing the emission levels and characteristics of various Zn sources is required to regulate the potential risk of this element to public health.
Zn could be released into the environment from a variety of anthropogenic sources, such as coal combustion [14], nonferrous metal smelting [11] and traffic emissions [15,16]. However, there has been little research on the atmospheric emissions and mass flow of Zn within the cement plants (CPs) with respect to its low boiling point (907 °C) comparing to the high-temperature calcination (1450 °C) process [17,18], which produces clinker and is a key part of the whole cement production process. Of public concern is that this calcination process may release Zn into the ambient atmosphere and form a major source of atmospheric environmental pollution [19,20].
Using an emission factor method, Nriagu and Pacyna [19] estimated that the total amount of Zn emitted from cement plants (CPs) globally in 1983 was 1200–6000 tonnes (t). Hua et al. [21] speculated that there was a 5.3-fold increase in Zn emissions from Chinese CPs during 1980–2012, from 132 to 703 t·a−1. Gołuchowska et al. [22] found high Zn levels (1250 mg·kg−1) in the dustfall around a CP and the soil in the vicinity of the CP had increased pH and heavy metal levels. One study indicated that Zn levels in the flue gas of CPs could reach 100 μg·m−3 and were the highest of heavy metals Mn, Se, Te, Sb, As, Cr, Tl, Pb, Ni, Sn, Cu, Hg, Cd, Co and V [20]. However, there has not a detailed mass flow analysis for Zn in CPs, and the distribution pattern, or behavious of Zn inside CPs is not clear.
China has been the world’s largest cement producer and consumer during the past three decades and its cement production yield increased 10-fold from 210 Mt in 1990 to 2390 Mt in 2020 [23,24]. In the past two decades, the cement production technique has changed dramatically from using a shaft technology to a preheater–precalciner technique [21,25]. Guizhou Province in southwest China is a karst region with abundant limestone and coal resources. Its increase in cement production has followed a similar trend to that of the whole country but with a much higher per capita cement output (2.8 t·a−1) than the national average (1.7 t·a−1) [24,26]. Based on this, this study was conducted to provide information on the behaviour of Zn inside two preheater–precalciner CPs in Guizhou, with all input and output solid materials being collected and examined. These two studied CPs are a good representative for the Chinese cement industry, both for the production technology (preheater–precalciner) employed, the popular production capacity and air pollution control devices (APCDs) installed, as well as raw materials used for clinker production, with both using a range of industrial solid waste as the alternative raw materials under the circular economic policy in China. This study aimed to: (1) Explore the distribution of Zn inside these CPs, (2) evaluate the levels of atmospheric release of Zn from the cement industry and (3) determine the degree of Zn enrichment in precalciner CPs. The results obtained from this study will help increase understanding of the behaviour of Zn inside CPs and the possible impacts on the atmospheric environment.
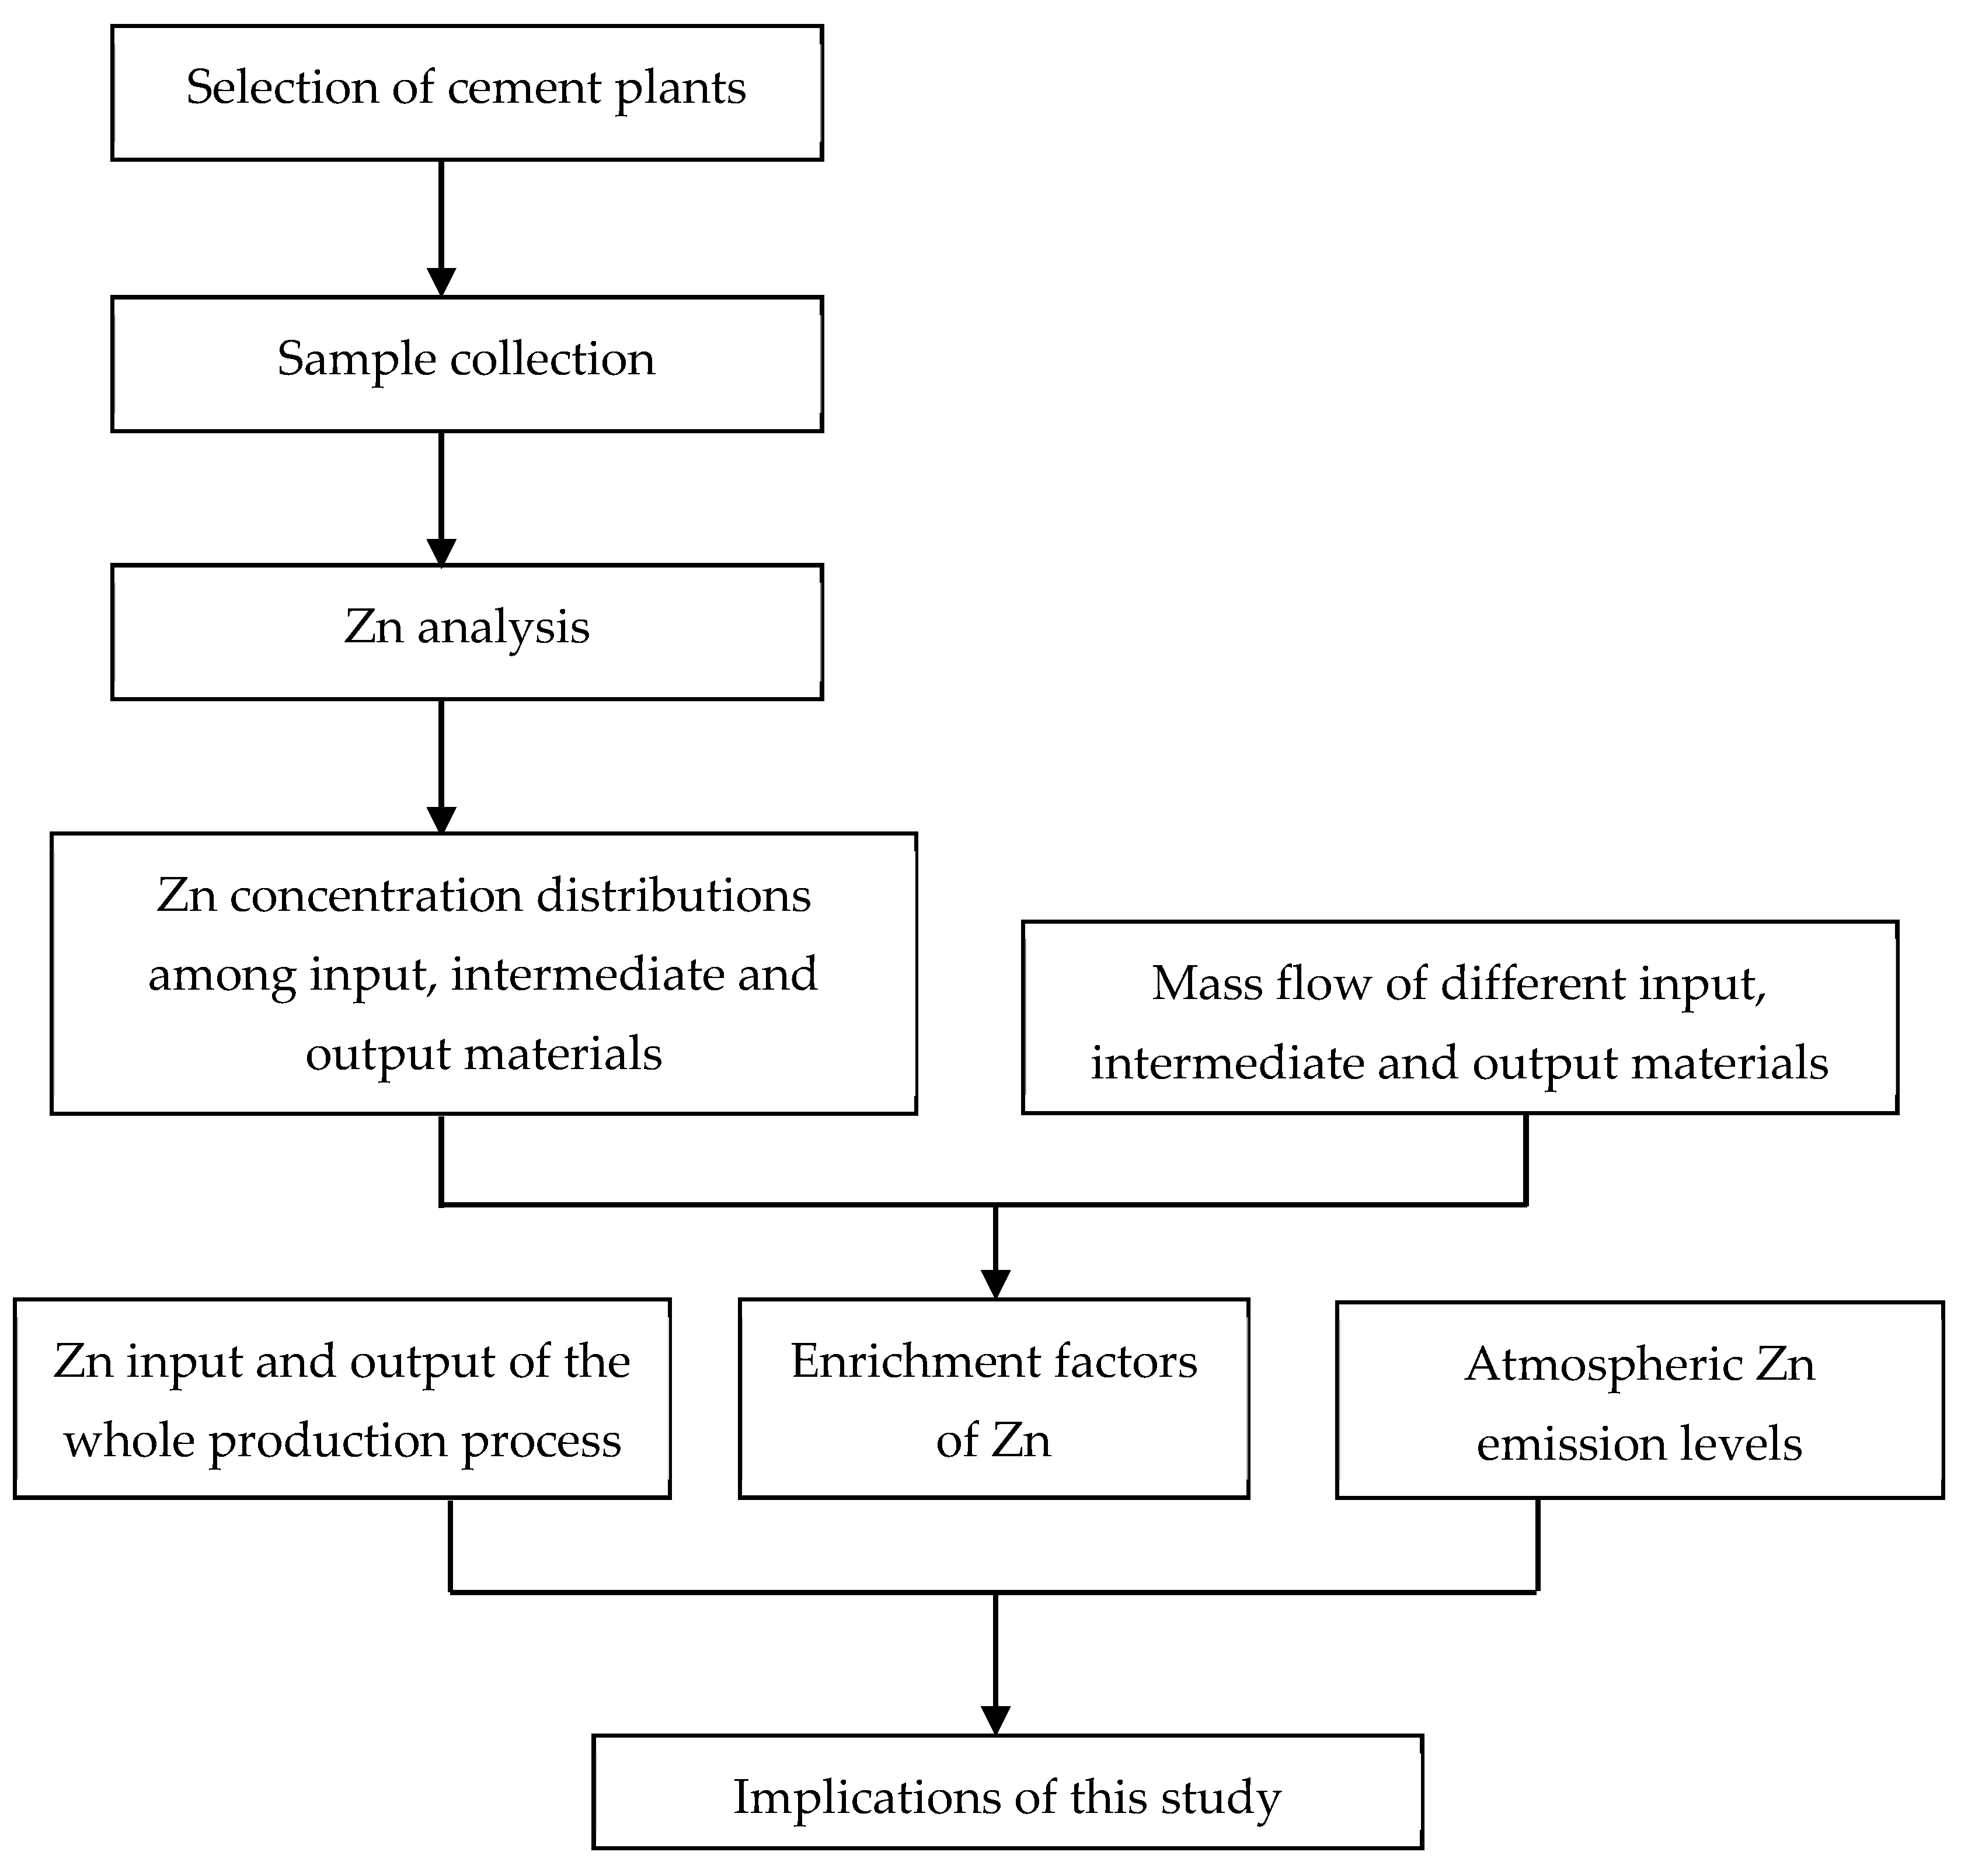
2. Materials and Methods
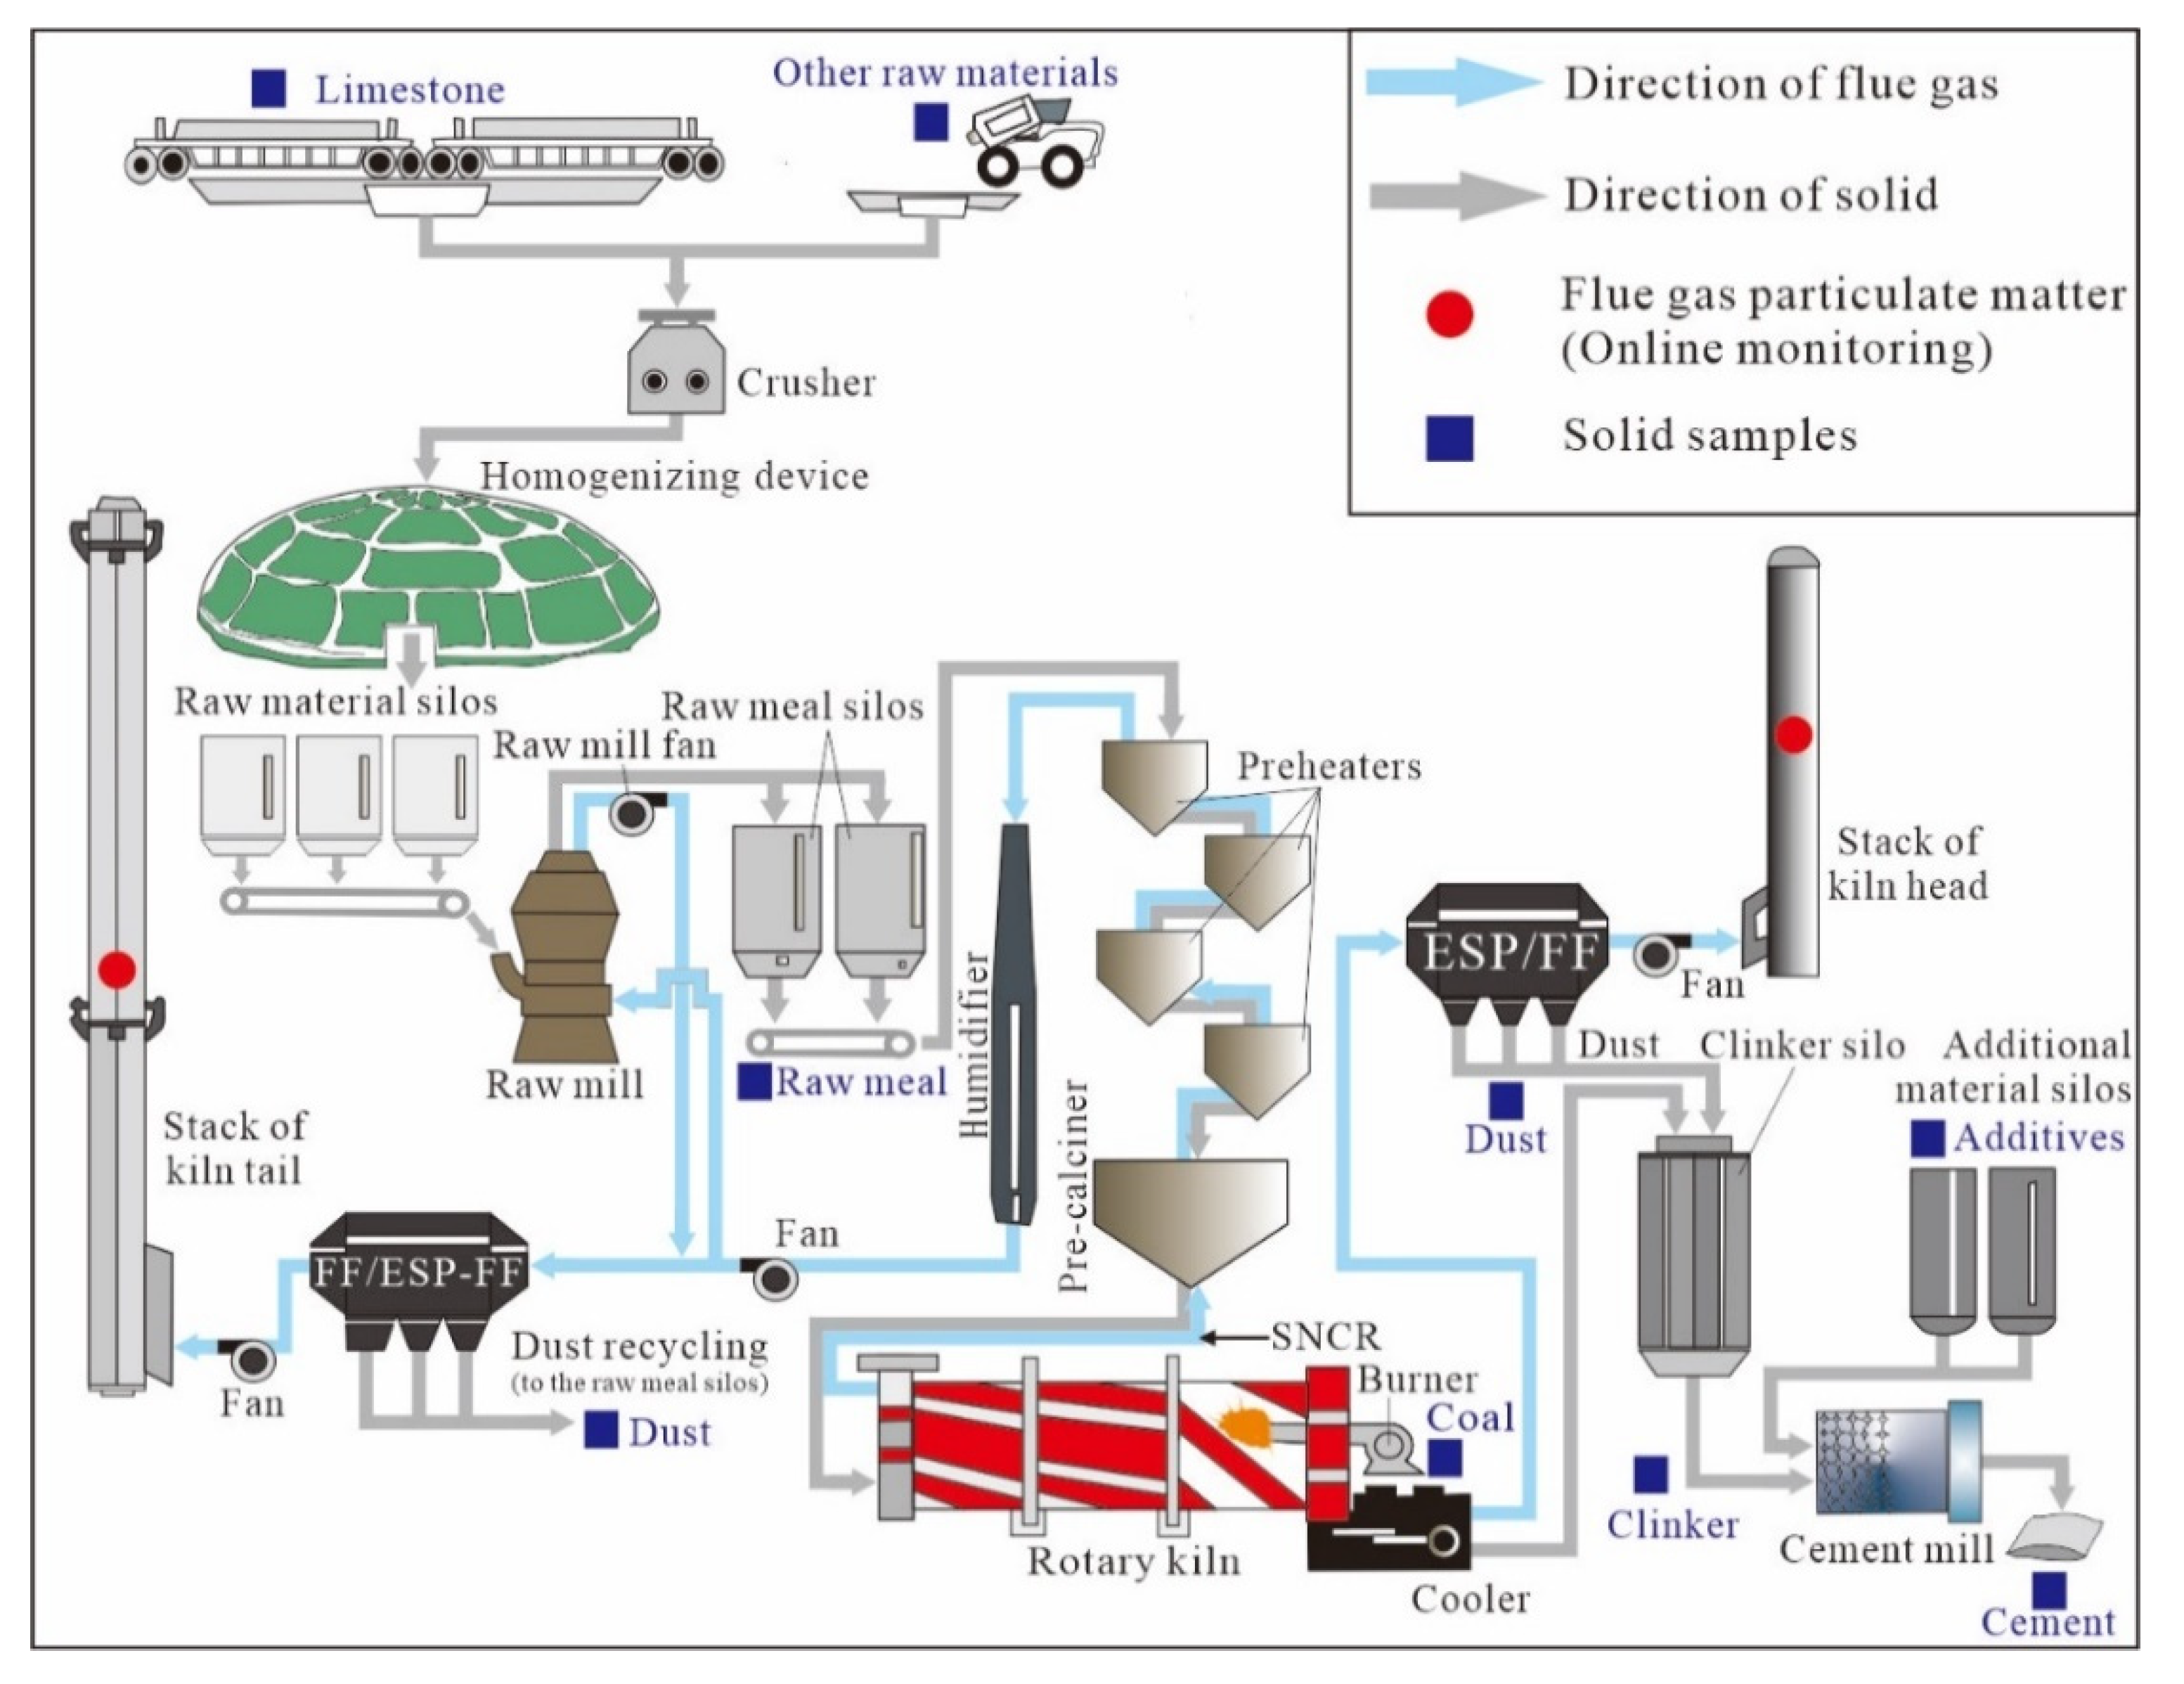
2.1. Cement Plants and Sample Collection
The two CPs are located in central (#1) and western (#2) Guizhou Province. These two CPs each had two production lines but only one line in each plant was investigated as both used the same raw materials, production technology and air pollution control devices (APCDs). The raw or alternative raw materials used in these plants included limestone (mainly CaCO3), shale (mainly to provide Al and Si for cement production), beneficiation waste (waste rocks that provide a variety of trace elements), yellow phosphorus slag (mainly CaO and SiO2), carbide slag (mainly Ca(OH)2), coal slag (providing Si, Ca, Al, Fe and Mn) and nonferrous smelting slag (providing Fe). The coal used by these two CPs was locally produced bituminous or anthracitic coal that formed in the Late Permian. CP#1 had been operating for 0.5 years and CP#2 for about five years at the time of sampling.
The capacity of the investigated production lines was 4500–5000 t clinker·d−1 (Table 1). The APCDs used in these CPs consisted of an electrostatic precipitator (ESP) or fabric filter (FF) at the kiln head and an FF or ESP-FF with selective non-catalytic reduction (SNCR) at the kiln tail (Table 1, Figure A1). The FF/ESP was used to capture particulate matter and the SNCR was designed to control NOx emissions by injecting ammonium hydroxide into the high-temperature zones (800–900 °C).
Table 1.
Information about the studied CPs.
A schematic map for the whole cement production process is shown in Figure A1, where a range of different raw materials that provide calcium (Ca), silicon (Si), aluminium (Al) and iron (Fe) is broken, homogenized, and calcined in a rotary kiln to produce clinker, then the clinker was mixed with additives and retarder to produce cement products, which contain four major compounds: Tricalcium silicate (C3S), dicalcium silicate (C2S), tricalcium aluminate (C3A) and tetracalcium aluminoferrite (C4AF) [27]. The sample collection points in the CPs are indicated in Figure A1. All input and output solid samples were gathered simultaneously, with ~1 kg samples collected three to six times over a 2–3-day period for each CP. The samples included different raw materials (limestone, clay, etc.), intermediate products (raw meal and dust from APCDs), coal, clinker, additives (such as coal fly ash from the coal-fired power plants (CFPPs)), retarder (desulphurisation gypsum) and cement products. The Zn concentration in the stack flue gas was not directly measured in this study due to technical reasons but this parameter was estimated from the particulate matter content in the stack flue gas and the Zn concentration in this particulate matter (or kiln dust). Since the temperature of the stack flue gas was low (70–100 °C), it was believed that all Zn compounds existed in particulate form [17]. Additionally, information about the mass of particulate matter in the stack flue gas and the material inputs and outputs during the whole production process was provided by the CPs. As a result, a total of 36 and 45 solid samples were collected from CP#1 and #2, respectively.
2.2. Sample Preparation and Determination
Solid samples were air-dried and ground to pass a 150 μm nylon sieve. The concentration of Zn in the samples was determined using the method developed by Qi and Grégoire [28], which employed digestion with HF and HNO3 at 190 °C for 24 h in Teflon bombs followed by inductively coupled plasma mass spectrometry (ICP-MS, Analytik Jena, Germany) to determine the Zn concentration.
2.3. Quality Assurance and Quality Control
Quality assurance and quality control methods included the use of low metal reagents, procedure blanks, duplicate samples and certified reference materials during the sample determination process. HF and HNO3 used in the digestion were double distilled to remove possible impurities; deionized water are supplied with a Milli-Q system; the procedure blank of Zn was 0.24 ± 0.26 mg·kg−1 (n = 4). Certified reference materials of limestone (JLS-1), dolomite (JDO-1), soil (GSS-5), basalt (GSR-3), coal (NIST SRM 1632d) and fly ash (NIST SRM 1633c) were digested and analysed along with solid samples. The recovery of Zn ranged from 89.7–110.1% and the difference between duplicates was within 5%.
2.4. Enrichment Factor and Atmospheric Emission Factor Calculations
2.4.1. Enrichment Factor
To explain the cycling and the possibility of enrichment of Zn in the raw mill, pre-calcining-preheating cyclones and rotary kiln systems, an enrichment factor was calculated via Equation (1) to depict the degree of accumulation of a single element during the clinker production process [29]:
When the enrichment factor is close to unity, no Zn enrichment occurs in the system. Factors > 1 indicate that Zn was enriched or retained during the process, with higher values indicating greater Zn enrichment.
2.4.2. Atmospheric Emission Factor
The atmospheric emission factor (EMF) provides an index of Zn emissions from the kiln tail and kiln head in precalciner CPs. The EMF was calculated according to clinker production (mg Zn/t clinker) via Equation (2):
Here, MZn is the amount of Zn emitted into the atmosphere per day (g·d−1) and Mclinker is the daily output of clinker (t·d−1).
3. Results and Discussion
In a precalciner CP, the cement production process has two parts: Clinker production and clinker-to-cement production. The former involves high-temperature processes, while the latter is a low-temperature mixing process. The fate of Zn during the whole production process inside these two CPs was analyzed according to the research framework shown in Figure A2, and will be discussed in turn in the following subsections.
3.1. Concentration of Zn in Different Solid Materials
The concentration of Zn in different solid materials during the whole production process of the two CPs is shown in Figure 1 and Table A1 and Table A2. According to the production directions, they will be discussed in three subsections: Different raw materials and coal, intermediate products (raw meal and kiln dust) and materials in the clinker-to-cement production process. Additionally, the daily material inputs and outputs are provided in Table A3 and Table A4.
Figure 1.
Concentration of Zn in different solid materials during the whole production process of the two CPs. 1 Weighted average of raw materials and coal in the clinker production process; 2 weighted average of additives and retarders.
3.1.1. Raw Materials and Coal
For most raw/alternative materials (limestone, yellow phosphorus slag, carbide slag) and coal, the concentration of Zn was relatively low (<50 mg·kg−1), while raw materials like shale, beneficiation waste and coal slag contained slightly higher concentrations of 90–110 mg·kg−1 (Figure 1 and Table A1). Astonishingly, iron-rich materials from the nonferrous smelting slags had the highest Zn concentration of 19,383 mg·kg−1 or 1.9 wt%, which was 2–3 orders magnitude higher than for the other raw materials. The weighted Zn concentration in different CP#1 and CP#2 raw materials was 365 and 27 mg·kg−1, respectively.
3.1.2. Intermediate Products
Zn concentrations in intermediate products, including raw meal and dust captured from the kiln tail APCDs, are shown in Figure 1 and Table A1. For CP#1, the concentration of Zn in raw meal (343 ± 32 mg·kg−1) was roughly equal to that in raw mix materials (weighted mean of 365 mg·kg−1) and kiln tail dust (320 ± 27 mg·kg−1), and slighter lower than that in clinker (428 ± 25 mg·kg−1). A similar trend was found for CP#2 for the concentration of Zn in raw meal (27 ± 1 mg·kg−1), raw mix materials (weighted mean of 27 mg·kg−1), kiln tail dust (33 ± 3 mg·kg−1) and clinker (49 ± 1 mg·kg−1). The higher zinc concentration in clinker than in raw meal may be due to the 1.5–1.7-fold mass reduction during clinker production [30]. It should be noted that the concentration of Zn in raw meal for CP#1 was very close to the reference limit of Zn in raw meal in China (361 mg·kg−1, GB 30760–2014) [31], while the concentration of Zn in raw meal for CP#2 was well within this limit.
3.1.3. Materials in Clinker-to-Cement Production Process
During the clinker-to-cement production process, material inputs include clinker, dust captured by kiln head APCDs, additives and retarder (desulphurisation gypsum), while the outputs are kiln head stack gas and cement products. For CP#1, the concentration of Zn in kiln head dust, clinker and cement products was much higher than for CP#2 (Figure 1 and Table A1). Again, the content of Zn in kiln head dust (average of 417 and 43 mg·kg−1 for CPs #1 and #2, respectively) was generally similar to that in clinker (428 and 49 mg·kg−1 for CPs #1 and #2, respectively). As the reference limit for Zn in clinker in China is 500 mg·kg−1 (GB 30760–2014) [31], both CPs were within the standard. The Zn concentration in the Portland cement was 357 ± 45 and 60 ± 3 mg·kg−1 for CP#1 and CP#2, respectively. The average content of Zn in Germany’s cement was reported as 140 mg·kg−1 [32], which was higher than for CP#2 but lower than for CP#1. Coal fly ash, coal slag (or bottom ash) and desulphurisation gypsum were supplied by the local coal-fired power plants (CFPPs). The coal fly ash used in the two CPs as an additive contained a much higher Zn concentration (86–214 mg·kg−1) than that of gypsum (6–7 mg·kg−1) and coal bottom ash (87 mg·kg−1). The Zn concentration in the cement products of CP#1 and CP#2 was slightly different to that of clinker due to the incorporation of different additives and retarders.
3.2. Atmospheric Zn Emissions
The concentration of particulate-bound Zn in stack flue gas was somewhat higher at the kiln tail (0.62–1.92 μg·m−3) than at the kiln head (0.29–1.76 μg·m−3; Table A1) but was far below the values (6–100 μg·m−3) reported by Arfala et al. [20] for a CP in Morocco. These results were similar to a CP that co-processed municipal solid waste incineration fly ash in Beijing, which discharged Zn concentrations in the range of 1.3 to 6.0 μg·m−3, which corresponded to a baseline level (without incineration fly ash addition) and a 1.7% addition of incineration fly ash that contained 7000 mg·kg−1 Zn [33].
The EMF of Zn from pre-calcined CPs is the sum of emissions from the kiln tail and kiln head. The EMFs of Zn for the two CPs in this study were in the range of 1.28–9.39 mg Zn·t−1 for clinker and 1.08–9.01 mg Zn·t−1 for cement (Table 2). The Zn EMF for CP#1 was about 9 times higher than for CP#2, which was a result of higher Zn concentrations in the kiln dust in CP#1 than CP#2. The average EMF for the two CPs was 5.34 mg Zn·t−1 for clinker and 5.05 mg Zn·t−1 for cement, which was comparable to the values (1.60–13.95 mg Zn·t−1 for cement) reported by Li et al. [34] but was much lower than the value (980 mg Zn·t−1 for cement) reported by Chen et al. [35]. Combining the average values from this study and the cement production in Guizhou Province in 2020 (1.08 × 10⁸ t, [26]), the total provincial atmospheric Zn emissions in 2020 were estimated to be 545 kg·a−1, which was two times lower than those emitted from coal-fired power plants (1276 kg·a−1) in the same province [36]. The total atmospheric Zn emissions from the whole cement industry in China were estimated to be 12.1 t·a−1 in 2020 based on the amount of cement (2.39 × 10⁹ t) produced in that year [15]; this was much lower than a previous estimation of 703 t·a−1 for Chinese CPs [21] and 14,537 t·a−1 for Chinese coal combustion activities [13].
Table 2.
Atmospheric EMFs of Zn for the two CPs.
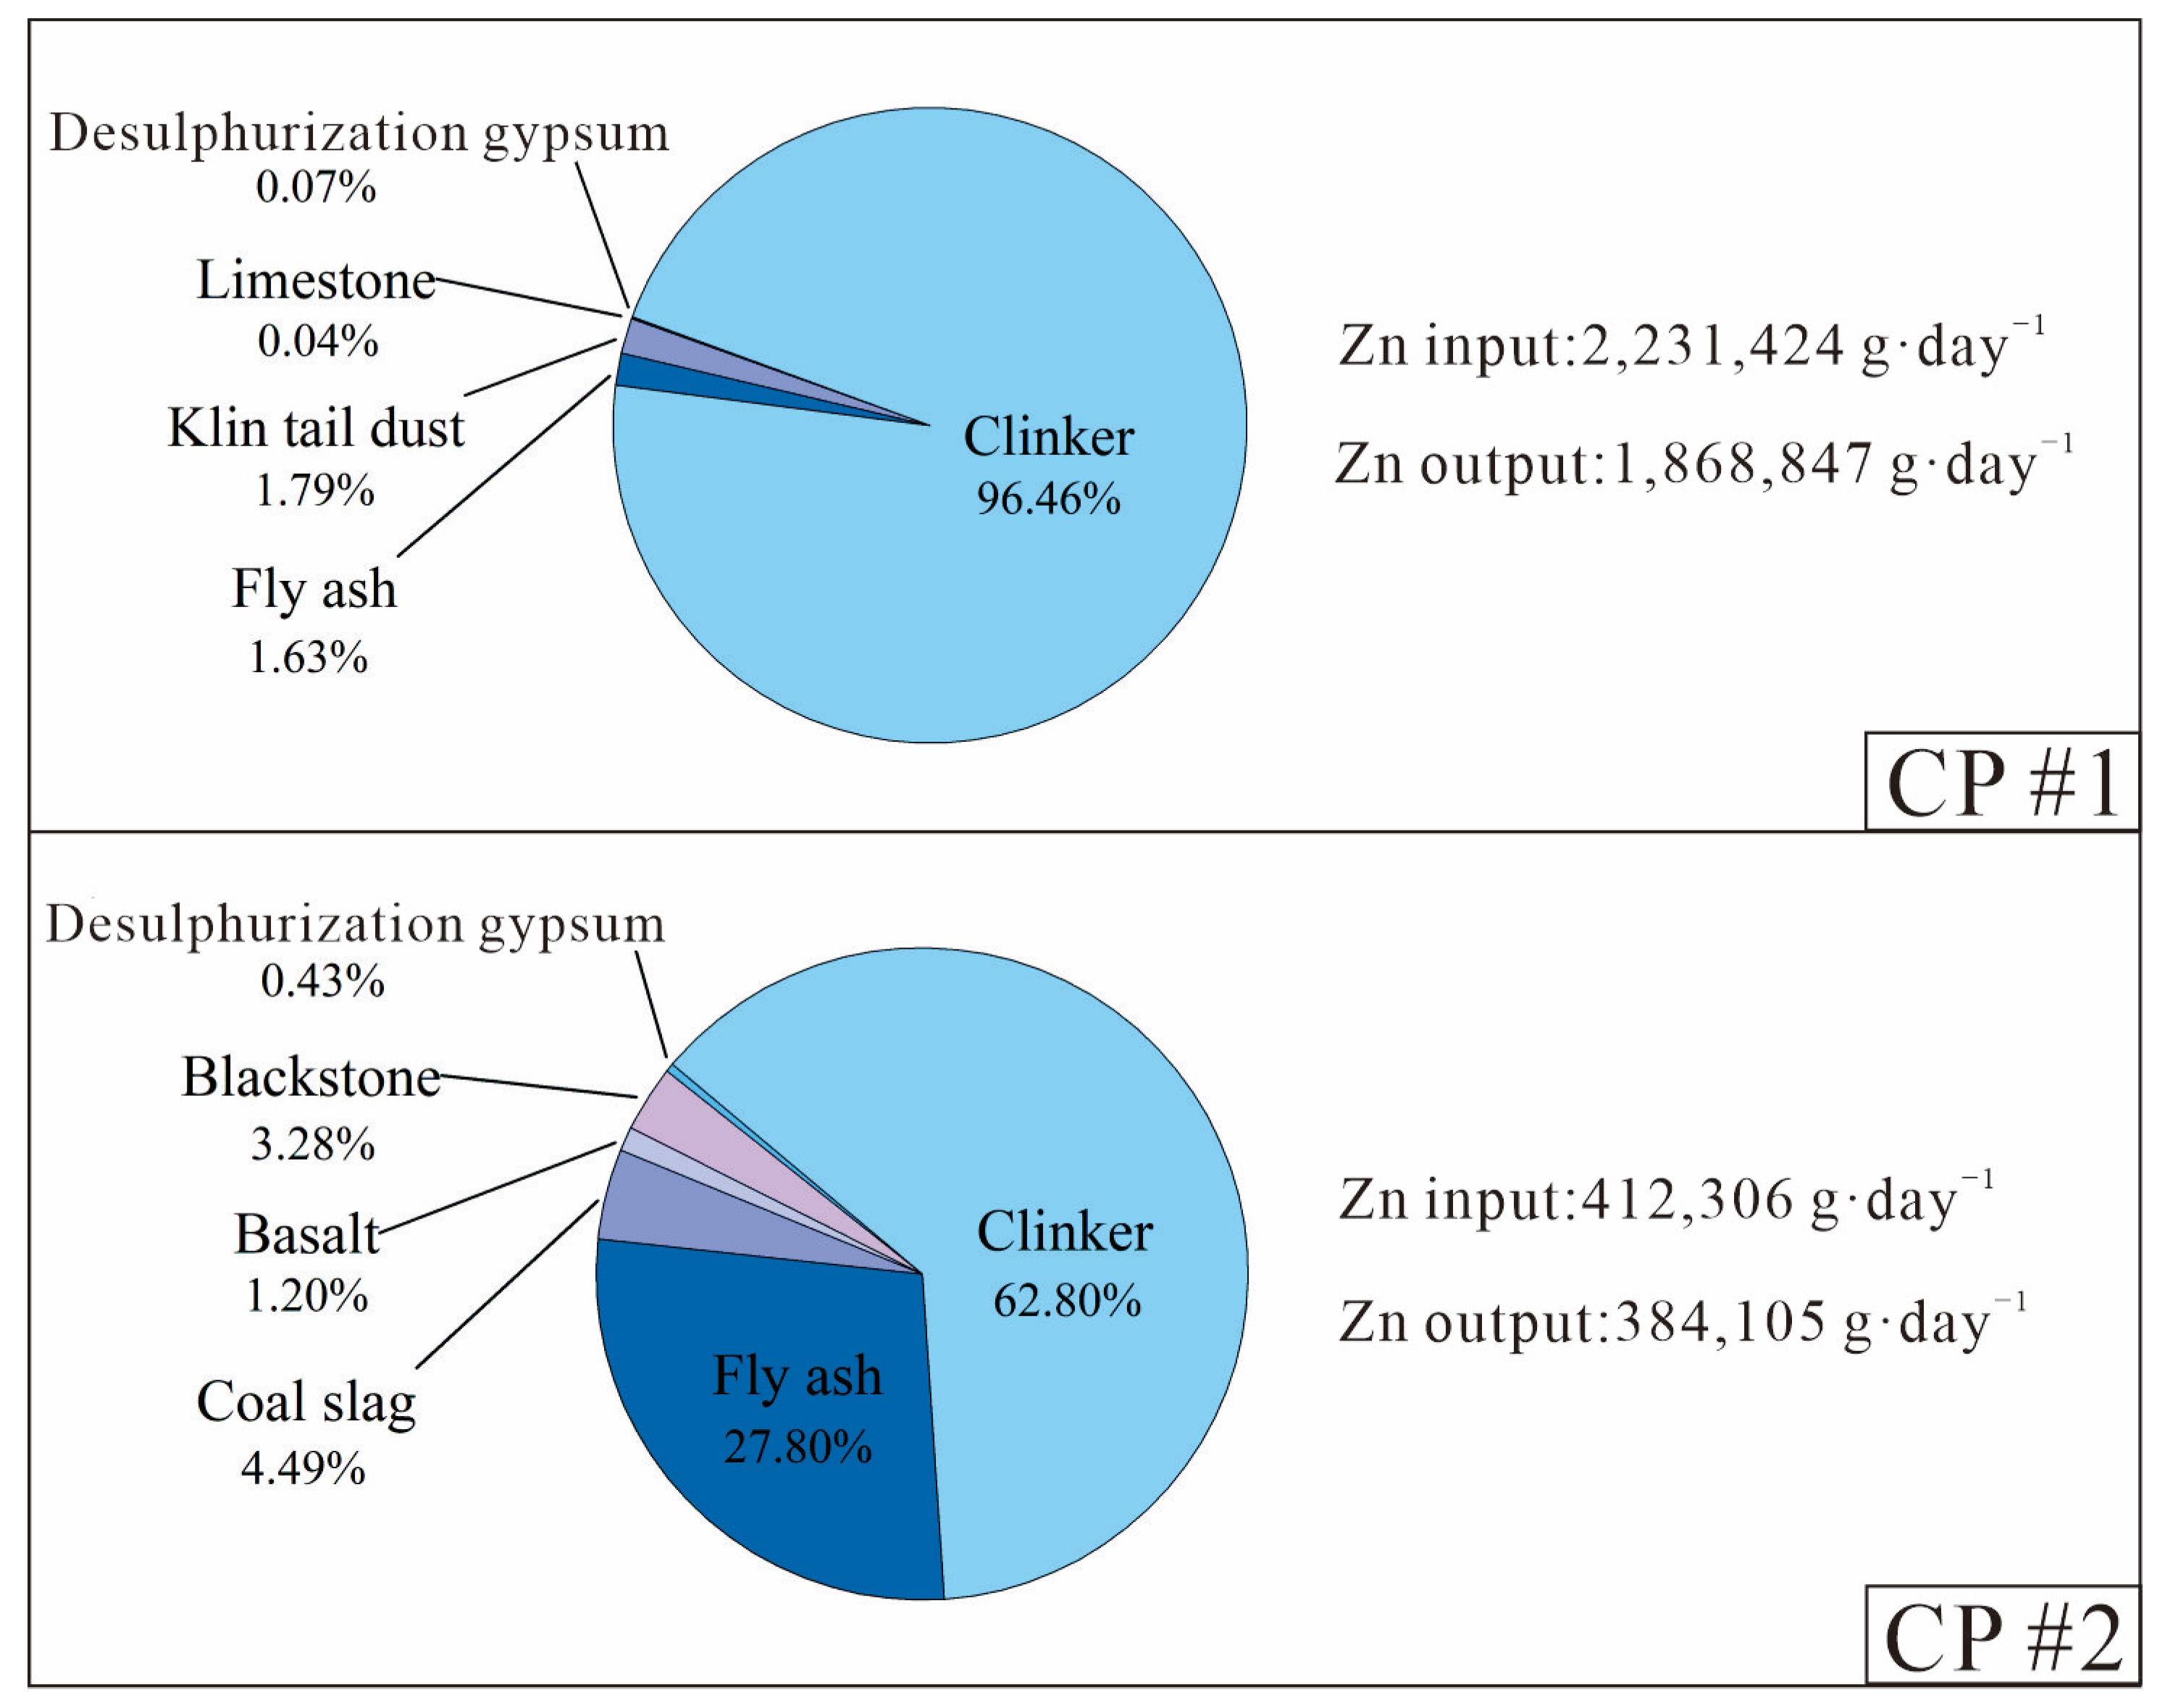
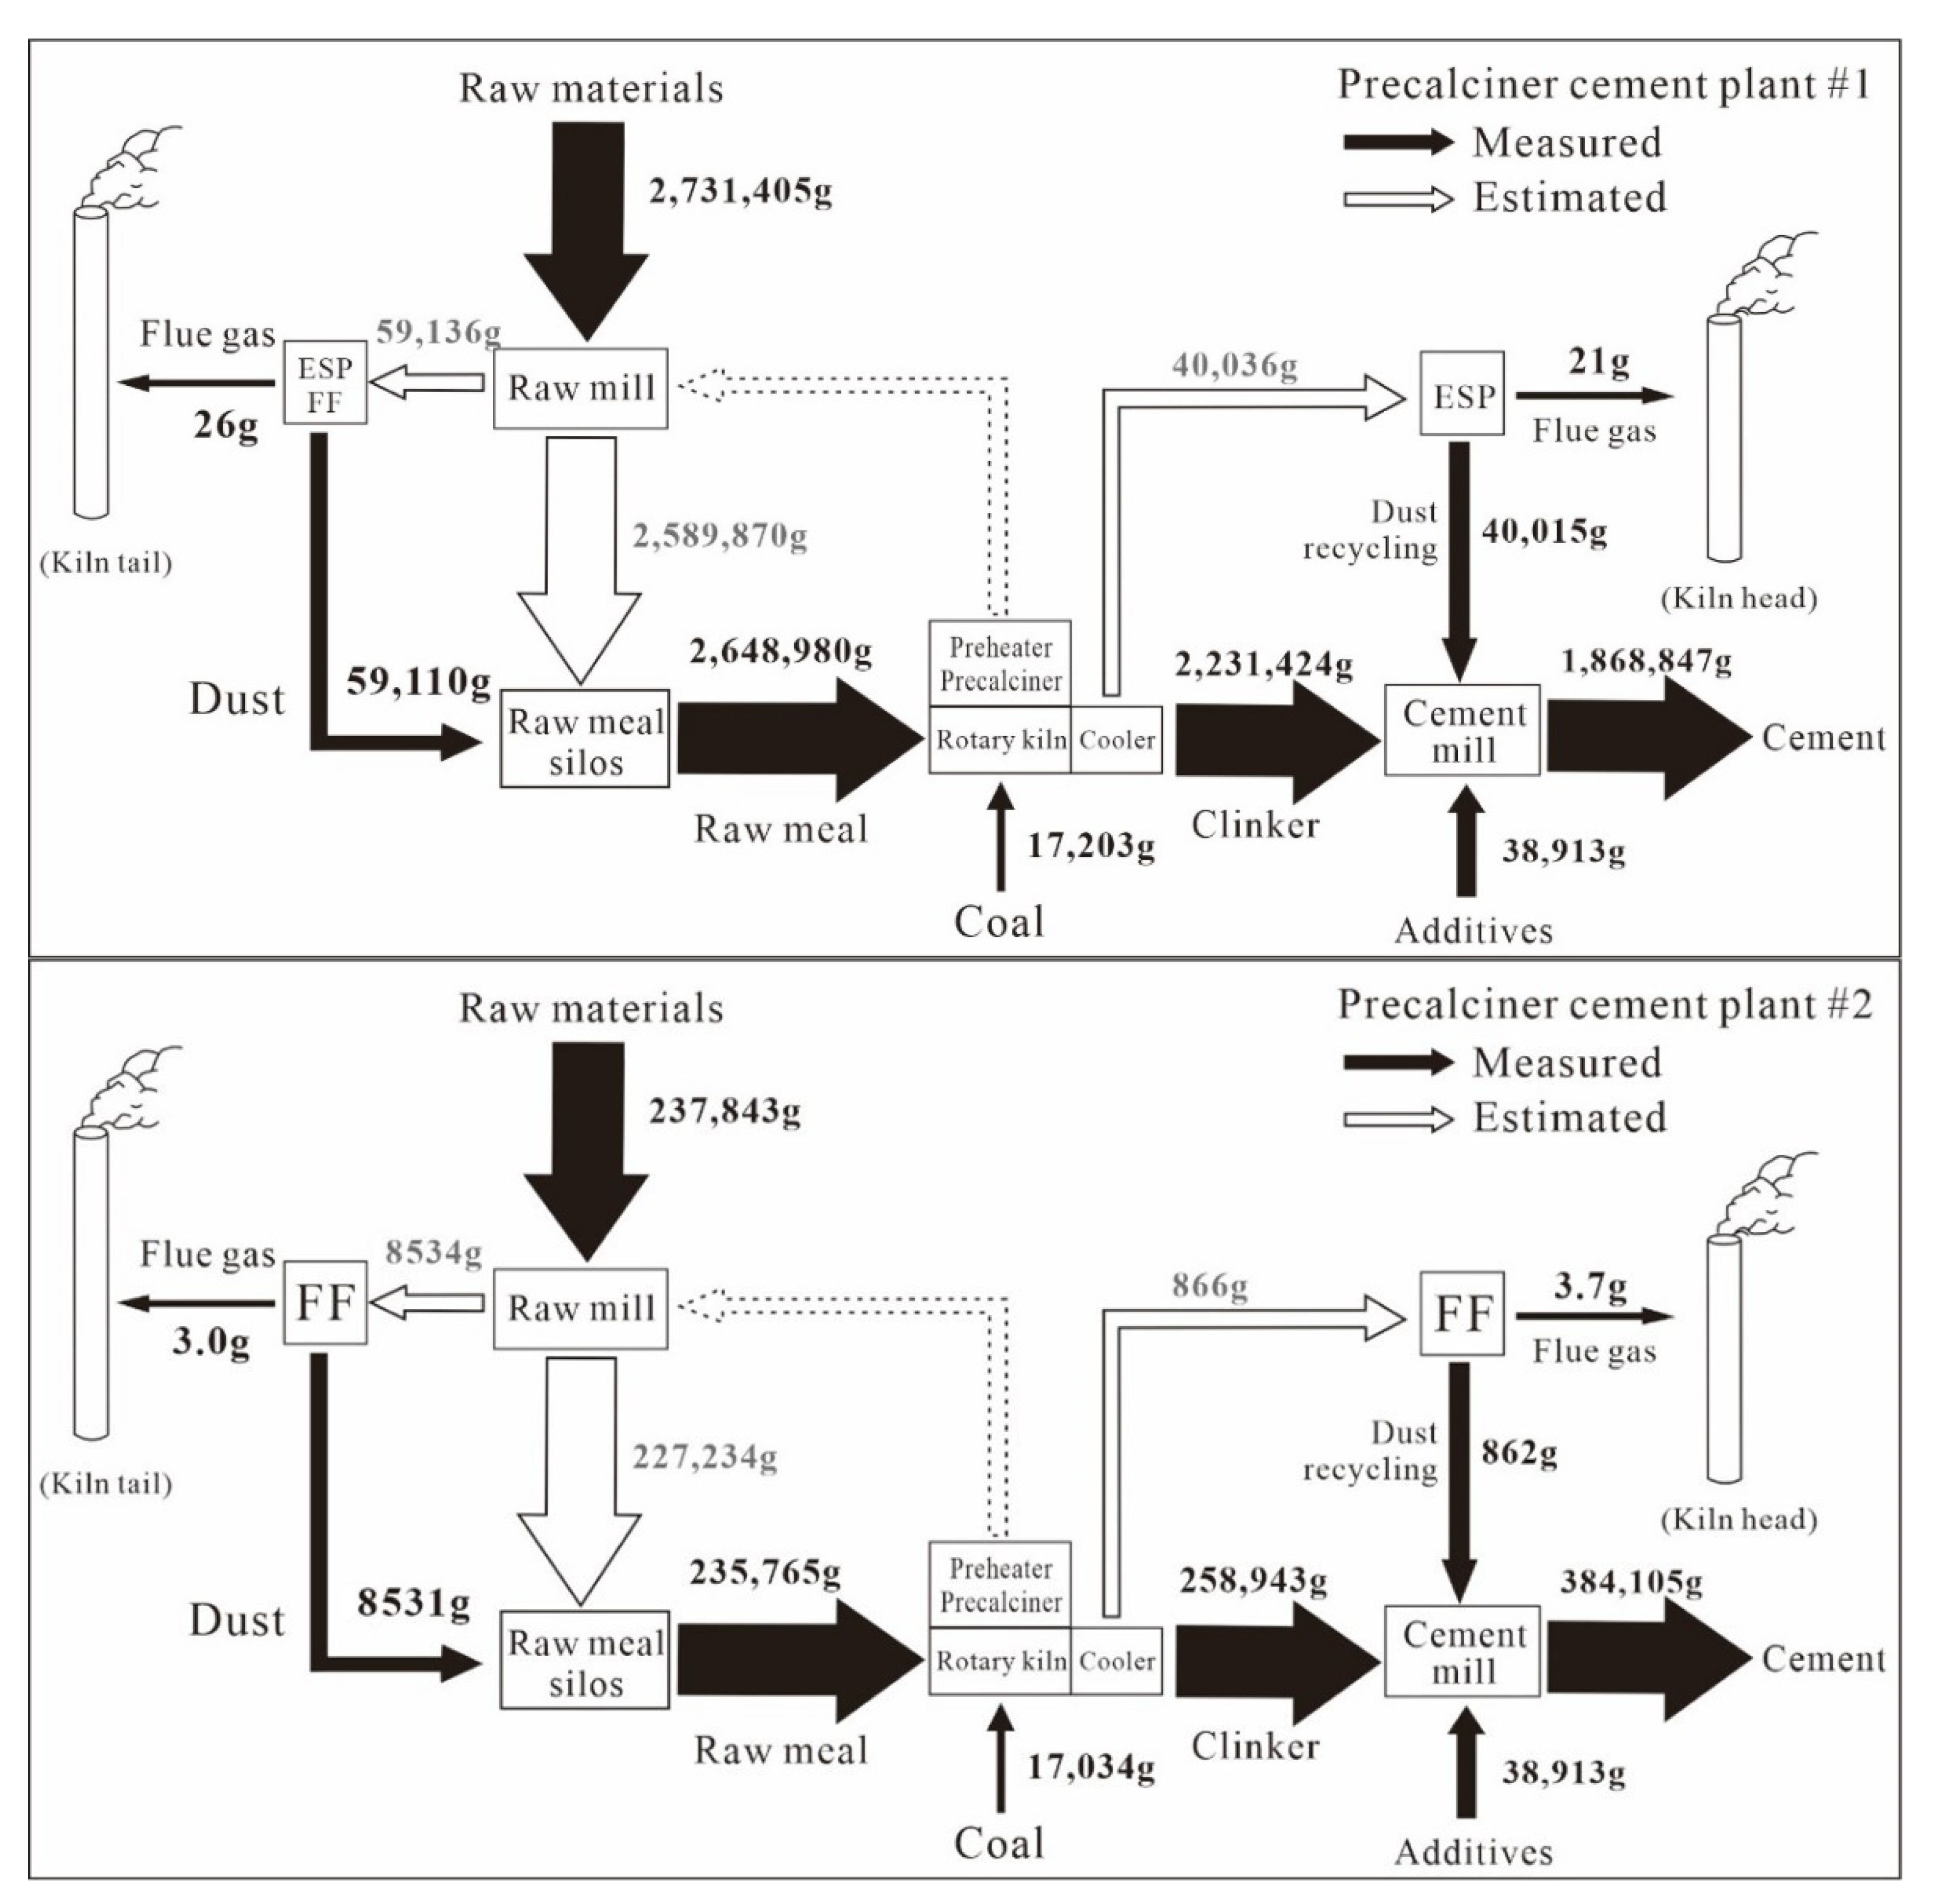
3.3. Mass Flow of Zn during Clinker and Cement Production
During clinker production, limestone was the dominant material and accounted for ~83% of the raw material mass at the two CPs (Table A3 and Table A4). The other raw materials, including shale, iron-rich materials, beneficiation waste, yellow phosphorus slag, carbide slag, coal bottom ash and coal accounted for the other 17% of material inputs. Combined with the Zn concentration in different input/output materials (Table A1 and Table A2) and the associated material mass flows (Table A3 and Table A4), the proportion of each material in the Zn inputs and outputs during the clinker production process and the clinker-to-cement process was calculated (Figure 2 and Figure 3).
Figure 2.
Breakdown of the daily input and output of Zn during the clinker production process of the two CPs.
Figure 3.
Breakdown of the daily Zn inputs and outputs during the clinker-to-cement production process of two CPs.
Figure 2 shows that the iron-rich materials in CP#1, which contained ultra-high Zn content (19,000 mg·kg−1), completely dominated (96.6%) the input volume of Zn, although they only accounted for 1.8% of the total material mass (Table A3). In CP#2, where all raw materials had low Zn concentrations (<120 mg·kg−1), limestone was the main input of Zn and accounted for 66% of the total inputs. Clinker represented almost all (97.5–99.7%) of the Zn outputs from these two CPs. Additionally, the daily Zn inputs and outputs of Zn during the clinker production process were roughly equal at the two CPs (Figure 2 and Figure 3), indicating that almost all Zn inputs from raw materials and fuels ended up in the clinker or were maintained in a dynamic equilibrium of inputs and outputs. While the Zn inputs for CP#1 were 10 times higher than for CP#2, low Zn emission levels (0.002%) in flue gases were observed for both CPs, suggesting that there was minimal atmospheric release.
During the clinker-to-cement production process, clinker was the main Zn input (63–96%), coal fly ash and other additives contributed a lesser portion of 3–36%, while retarder (desulphurisation gypsum) contributed the least (0.5%), both due to its lowest Zn concentration (6–7 mg·kg−1) and low mass contribution (4–5%). However, desulphurisation gypsum and coal fly ash are major contributors for some other metals (e.g., Hg and Tl) in cement products [29,37]. For different brands of Portland cement, such as Portland ordinary cement (P.O 425) and Portland composite cement (P.C 425), there were minimal variations (<10%) in the Zn concentration outputs for the same CP.
The detailed input and output flow of Zn during the whole production process in each CP are shown in Figure 4. Almost all of the Zn inputs from different raw materials (2731 kg·d−1 for CP#1; 238 kg·d−1 for CP#2) and coal (17 kg·d−1 for both CPs) ended up in the clinker (2231 kg·d−1 for CP#1; 259 kg·day−1 for CP#2), some of which was then was incorporated in the cement products (1868 kg·d−1 for CP#1; 384 kg·d−1 for CP#2; Figure 4). The mass balance of Zn, represented by the output/input ratios, during clinker production and clinker-to-cement production was 91% and 87% on average for the two CPs (Figure 2, Figure 3 and Figure 4), respectively. The slight difference was a result of fluctuation in the Zn concentrations of solid samples and the relatively small dataset.
Figure 4.
Zn mass flows throughout the production process in two CPs. (Values are based on one day).
The Zn enrichment factors, calculated from Equation (1), were 0.96 and 0.93 for CP#1 and CP#2, respectively. Both were around 1 and were similar to the enrichment factors for Pb (0.91–1.03) and Cd (0.99–1.1) in CPs [38]. However, during the clinker production, volatile metals like Tl and Hg had much higher enrichment factors (85–148 for Tl and 6–104 for Hg) [29,37], which was ascribed to the accumulation of these elements during the clinker production process. The close to 1 Zn enrichment factor in this study suggested that Zn was roughly balanced during clinker production, with the daily Zn output equivalent to the daily input. In other words, the Zn flow mainly followed the sequence of raw materials to raw meal, then to clinker and finally to cement products. Hence, a much higher Zn input in CP#1 has resulted in a nearly 10-fold increase in Zn concentration in clinker and cement products compared to CP#2; a similar phenomenon was found for cement plants that co-processes high Zn laden municipal solid incineration fly ashes [39].
The observations from this study were very different to previous speculations that Zn would be volatilised at high temperature, condense and be enriched in fly ash, thereby forming a potential or important environmental Zn source—as is the case for coal-fired power plants [13] and Zn smelters [11]. This study indicated that the atmospheric Zn emissions from preheater–precalciner CPs were negligible, as Zn was incorporated into the main minerals of clinkers—such as tetracalcium aluminoferrite (C4AF) by the substitution of Fe atoms, and tricalcium silicate (C3S) and dicalcium silicate (C2S) by replacing Ca ions during the clinkerisation process [27]. The forms of Zn in clinker could be ZnO, Zn2SiO4, ZnAl2O4 and Ca6Zn3Al4O15 [40,41], and the threshold limit of Zn in ordinary Portland clinker was estimated to be 0.7 wt% [41], which is the maximum amount of Zn that could be incorporated into clinker without modifying its phase stability or resulting in the appearance of a new phase.
4. Conclusions
This study disclosed the preheater–precalciner CPs are not an important Zn atmospheric source based on a thorough mass flow analysis of Zn in two precalciner CPs; the mechanism might be the formation of Zn aluminosilicate during the clinkerisation process, which largely restricted the volatilisation of Zn. As a result, Zn kept a dynamic equilibrium during the clinkerisation process with daily Zn inputs from different raw materials and fuels ending up in the clinker; very little Zn (0.002%) was lost to the atmosphere. The average emission factors for Zn in this study were 5.34 mg Zn·t−1 clinker and 5.05 mg Zn·t−1 cement. The total atmospheric Zn emissions from the whole cement industry in Guizhou Province and China in 2020 were estimated to be 0.5 and 12.1 t·a−1, respectively, which was much lower than the previous estimation. Since Zn in clinker and cement products are wholly inherited from the input materials, the utilisation of Zn-containing materials—like metallurgical slags—should be careful, since this will dramatically increase the Zn content in clinker and cement.
Author Contributions
Conceptualization, Z.L.; Data curation, Z.L.; Formal analysis, Z.L.; Funding acquisition, Z.L. and X.F.; Investigation, Z.L., Q.W. and G.S.; Methodology, X.L., Y.H. and G.W.; Project administration, Z.L. and X.F.; Resources, X.F.; Visualization, Y.H.; Writing—original draft, Z.L.; Writing—review & editing, Q.W., X.L., G.S. and X.F. All authors have read and agreed to the published version of the manuscript.
Funding
This research was funded by the Natural Science Foundation of China (No. U1612442), the Guizhou Provincial Natural Science Foundation (No. Qian-Ke-He-Ji-Chu-ZK (2021) Zhong-Dian 044), and the Doctoral Foundation Project of Zunyi Normal College (No. Zun-Shi BS (2018) 15).
Institutional Review Board Statement
Not applicable.
Informed Consent Statement
Not applicable.
Data Availability Statement
All the data are included in the paper and/or Appendix A.
Acknowledgments
The authors would thank Ji Chen, Li Tang and Shan Li for their kindly help for the sample collection and preparation.
Conflicts of Interest
The authors declare no conflict of interest.
Appendix A
Figure A1.
Overview of the cement manufacturing facilities and the sampling site locations.
Figure A1.
Overview of the cement manufacturing facilities and the sampling site locations.

Figure A2.
The research framework of this study.
Figure A2.
The research framework of this study.

Table A1.
Concentration of Zn in different solid materials during the clinker production process.
Table A1.
Concentration of Zn in different solid materials during the clinker production process.
| Zn Input/Output | Materials | Zn Concentration (mg·kg−1) | ||
|---|---|---|---|---|
| Cement Plant #1 Rang (Mean ± Standard Deviation) | Cement Plant #2 Rang (Mean ± Standard Deviation) | |||
| Zn input | Raw/alternative materials | Limestone | 4–5 (5 ± 0, n = 3) a | 16–26 (21 ± 4, n = 3) |
| Shale | 95–127 (108 ± 14, n = 3) | 111 (n = 1) | ||
| Iron-rich materials | 18,262–20,868 (19,383 ± 1095, n = 3) | / b | ||
| Beneficiation waste | / | 85–102 (94 ± 9, n = 2) | ||
| Yellow phosphorus slag | / | 35–48 (41 ± 5, n = 3) | ||
| Carbide slag | / | 32–37 (35 ± 3, n = 2) | ||
| Coal slag | / | 85–90 (87 ± 2, n = 3) | ||
| Fuel | Coal | 18–28 (24 ± 4, n = 3) | 20–33 (26 ± 5, n = 3) | |
| Weighted average | 365 | 27 | ||
| Intermediate products | Raw meal | 308–385 (343 ± 32, n = 3) | 27–28 (27 ± 1, n = 3) | |
| Kiln tail dust | 296–357 (320 ± 27, n = 3) | 30–37 (33 ± 3, n = 3) | ||
| Zn output | Kiln head dust | 393–437 (417 ± 18, n = 3) | 43 (n = 1) | |
| Stack flue gas at the kiln tail | 1.76 c | 0.29 c | ||
| Stack flue gas at the kiln head | 1.92 c | 0.62 c | ||
| Clinker | 393–449 (428 ± 25, n = 3) | 48–50 (49 ± 1, n = 3) | ||
a n is the sample numbers; b not applicable; c unit of Zn concentration in flue gas: μg·m−3.
Table A2.
Concentration of Zn in different input and output materials during the clinker-to-cement production process.
Table A2.
Concentration of Zn in different input and output materials during the clinker-to-cement production process.
| Zn Input/Output | Material | Zn Concentration (Mean ± SD, mg·kg−1) | |
|---|---|---|---|
| Cement Plant #1 Rang (Mean ± Standard Deviation) | Cement Plant #2 Rang (Mean ± Standard Deviation) | ||
| Zn input | Clinker | 393–449 (428 ± 25, n = 3) a | 48–50 (49 ± 1, n = 3) |
| Kiln head dust | 393–437 (417 ± 18, n = 3) | 43 (n = 1) | |
| Fly ash from coal-fired power plants | 79–92 (86 ± 7, n = 3) | 213–215 (214 ± 1, n = 3) | |
| Desulfurization gypsum | 5–6 (6 ± 1, n = 3) | 6–7 (7 ± 0, n = 3) | |
| Limestone | 4–5 (5 ± 0, n = 3) | / b | |
| Bottom ash from coal-fired power plants | / | 85–90 (87 ± 2, n = 3) | |
| Basalt | / | 156–170 (165 ± 6, n = 3) | |
| Black stone | / | 189–292 (225 ± 47, n = 3) | |
| Weighted average | 362 | 65 | |
| Zn output | Cement products | 278–399 (357 ± 45, n = 6) | 58–63 (60 ± 3, n = 6) |
a n is the sample number; b not applicable.
Table A3.
Mass flow of solid materials during the clinker production process of the CPs.
Table A3.
Mass flow of solid materials during the clinker production process of the CPs.
| Material Input/Output | Materials | Mass Flow (t·Day−1) | ||
|---|---|---|---|---|
| Cement Plant #1 | Cement Plant #2 | |||
| Input | Raw/alternative materials | Limestone | 6235 | 7960 |
| Shale | 432 | 52 | ||
| Iron-rich materials | 137 | / a | ||
| Beneficiation waste | / | 494 | ||
| Yellow phosphorus slag | / | 183 | ||
| Carbide slag | / | 165 | ||
| Coal slag | / | 45 | ||
| Fuel | Coal | 723 | 649 | |
| Intermediate products | Raw meal | 7723 | 8600 | |
| Kiln tail dust | 185 | 260 | ||
| Output | Kiln head dust | 134 | 20 | |
| Stack flue gas at the kiln tail | 1486 b | 1046 b | ||
| Stack flue gas at the kiln head | 1098 b | 601 b | ||
| Clinker | 5025 | 5236 | ||
a Not applicable; b unit of flue gas volume: 104 m3·d−1.
Table A4.
Mass flow of solid materials during the clinker-to-cement production process of the CPs.
Table A4.
Mass flow of solid materials during the clinker-to-cement production process of the CPs.
| Material Input/Output | Materials | Mass Flow (t·Day−1) | |
|---|---|---|---|
| Cement Plant #1 | Cement Plant #2 | ||
| Input | Clinker | 5025 | 5236 |
| Kiln head dust | 96 | 20 | |
| Fly ash from coal-fired power plants | 424 | 535 | |
| Desulfurization gypsum | 264 | 271 | |
| Limestone | 212 | / a | |
| Bottom ash from coal-fired power plants | / | 212 | |
| Basalt | / | 30 | |
| Black stone | / | 60 | |
| Output | Cement products | 6021 | 6364 |
a Not applicable.
References
- Lefevre, I.; Vogel-Mikus, K.; Jeromel, L.; Vavpetic, P.; Planchon, S.; Arcon, I.; Elteren, J.T.V.; Lepoint, G.; Gobert, S.; Renaut, J. Differential cadmium and zinc distribution in relation to their physiological impact in the leaves of the accumulating Zygophyllum fabago L. Plant Cell Environ. 2014, 37, 1299–1320. [Google Scholar] [CrossRef] [PubMed]
- Li, M.; Liu, Z.; Chen, J.; Huang, X.; Liu, J.; Xie, Y.; Hu, B.; Xu, Z.; Zhang, Y.; Wang, Y. Characteristics and Source Apportionment of Metallic Elements in PM2.5 at Urban and Suburban Sites in Beijing: Implication of Emission Reduction. Atmosphere 2019, 10, 105. [Google Scholar] [CrossRef] [Green Version]
- Li, Z.; Wang, Q.; Xiao, Z.; Fan, L.; Wang, D.; Li, X.; Du, J.; Cheng, J. Behaviors of Chromium in Coal-Fired Power Plants and Associated Atmospheric Emissions in Guizhou, Southwest China. Atmosphere 2020, 11, 951. [Google Scholar] [CrossRef]
- Bañuelos, G.S.; Ajwa, H.A. Trace elements in soils and plants: An overview. J. Environ. Sci. Health A 1999, 34, 951–974. [Google Scholar] [CrossRef]
- Jean-Soro, L.; Le Guern, C.; Bechet, B.; Lebeau, T.; Ringeard, M.-F. Origin of trace elements in an urban garden in Nantes, France. J. Soils Sediments 2015, 15, 1802–1812. [Google Scholar] [CrossRef]
- Streets, D.G.; Horowitz, H.M.; Lu, Z.; Levin, L.; Thackray, C.P.; Sunderland, E.M. Five hundred years of anthropogenic mercury: Spatial and temporal release profiles. Environ. Res. Lett. 2019, 14, 084044. [Google Scholar] [CrossRef] [Green Version]
- Zhao, S.L.; Duan, Y.F.; Li, Y.N.; Liu, M.; Lu, J.H.; Ding, Y.J.; Gu, X.B.; Tao, J.; Du, M.S. Emission characteristic and transformation mechanism of hazardous trace elements in a coal-fired power plant. Fuel 2018, 214, 597–606. [Google Scholar] [CrossRef]
- Bing, H.; Wu, Y.; Zhou, J.; Liang, J.; Wang, J.; Yang, Z. Mobility and eco-risk of trace metals in soils at the Hailuogou Glacier foreland in eastern Tibetan Plateau. Environ. Sci. Pollut. Res. 2016, 23, 5721–5732. [Google Scholar] [CrossRef]
- Barandovski, L.; Stafilov, T.; Šajn, R.; Frontasyeva, M.; Bačeva Andonovska, K. Atmospheric Heavy Metal Deposition in North Macedonia from 2002 to 2010 Studied by Moss Biomonitoring Technique. Atmosphere 2020, 11, 929. [Google Scholar] [CrossRef]
- Li, X.; Li, Z.; Lin, C.-J.; Bi, X.; Liu, J.; Feng, X.; Zhang, H.; Chen, J.; Wu, T. Health risks of heavy metal exposure through vegetable consumption near a large-scale Pb/Zn smelter in central China. Ecotoxicol. Environ. Saf. 2018, 161, 99–110. [Google Scholar] [CrossRef]
- Bleiwas, D.I.; Di Francesco, C. Historical zinc smelting in New Jersey, Pennsylvania, Virginia, West Virginia, and Washington, D.C., with estimates of atmospheric zinc emissions and other materials. U.S. Geol. Surv. Open-File Rep. 2010, 1131, 189. [Google Scholar]
- Potter, N.A.; Meltzer, G.Y.; Avenbuan, O.N.; Raja, A.; Zelikoff, J.T. Particulate matter and associated metals: A link with neurotoxicity and mental health. Atmosphere 2021, 12, 425. [Google Scholar] [CrossRef]
- Li, R.; Li, J.; Cui, L.; Wu, Y.; Fu, H.; Chen, J.; Chen, M. Atmospheric emissions of Cu and Zn from coal combustion in China: Spatio-temporal distribution, human health effects, and short-term prediction. Environ. Pollut. 2017, 229, 724–734. [Google Scholar] [CrossRef] [PubMed]
- Meij, R. Trace elements behavior in coal-fired power plants. Fuel Process. Technol. 1994, 39, 199–217. [Google Scholar] [CrossRef]
- Liu, K.; Shang, Q.; Wan, C. Sources and Health Risks of Heavy Metals in PM2.5 in a Campus in a Typical Suburb Area of Taiyuan, North China. Atmosphere 2018, 9, 46. [Google Scholar] [CrossRef] [Green Version]
- Hicks, W.; Beevers, S.; Tremper, A.H.; Stewart, G.; Priestman, M.; Kelly, F.J.; Lanoisellé, M.; Lowry, D.; Green, D.C. Quantification of Non-Exhaust Particulate Matter Traffic Emissions and the Impact of COVID-19 Lockdown at London Marylebone Road. Atmosphere 2021, 12, 190. [Google Scholar] [CrossRef]
- Udayanga, W.C.; Veksha, A.; Giannis, A.; Lisak, G.; Chang, V.W.C.; Lim, T.T. Fate and distribution of heavy metals during thermal processing of sewage sludge. Fuel 2018, 226, 721–744. [Google Scholar] [CrossRef]
- Mlakar, T.L.; Horvat, M.; Vuk, T.; Stergarsek, A.; Kotnik, J.; Tratnik, J.; Fajon, V. Mercury species, mass flows and processes in a cement plant. Fuel 2010, 89, 1936–1945. [Google Scholar] [CrossRef]
- Nriagu, J.O.; Pacyna, J.M. Quantitative assessment of worldwide contamination of air, water and soils by trace metals. Nature 1988, 333, 134–139. [Google Scholar] [CrossRef] [PubMed]
- Arfala, Y.; Douch, J.; Assabbane, A.; Kaaouachi, K.; Tian, H.; Hamdani, M. Assessment of heavy metals released into the air from the cement kilns co-burning waste: Case of Oujda cement manufacturing (Northeast Morocco). Sustain. Environ. Res. 2018, 28, 363–373. [Google Scholar] [CrossRef]
- Hua, S.; Tian, H.; Wang, K.; Zhu, C.; Gao, J.; Ma, Y.; Xue, Y.; Wang, Y.; Duan, S.; Zhou., J. Atmospheric emission inventory of hazardous air pollutants from China’s cement plants: Temporal trends, spatial variation characteristics and scenario projections. Atmos. Environ. 2016, 128, 1–9. [Google Scholar] [CrossRef]
- Gołuchowska, B.; Strzyszcz, Z.; Kusza, G. Magnetic susceptibility and heavy metal content in dust from the lime plant and the cement plant in Opole Voivodeship. Arch. Environ. Prot. 2012, 38, 71–80. [Google Scholar] [CrossRef]
- National Bureau of Statistics of China. China Statistical Yearbook; China Statistics Press: Beijing, China, 1991. (In Chinese) [Google Scholar]
- National Bureau of Statistics of China. China Statistical Yearbook; China Statistics Press: Beijing, China, 2021. (In Chinese) [Google Scholar]
- Cai, X.; Cai, B.; Zhang, H.; Chen, L.; Zheng, C.; Tong, P.; Lin, H.; Zhang, Q.; Liu, M.; Tong, Y.; et al. Establishment of high-resolution atmospheric mercury emission inventories for Chinese cement plants based on the mass balance method. Environ. Sci. Technol. 2020, 54, 13399–13408. [Google Scholar] [CrossRef] [PubMed]
- Bureau of Statistics of Guizhou Province. Guizhou Statistical Yearbook; China Statistics Press: Beijing, China, 2021. (In Chinese) [Google Scholar]
- Zhu, J.; Yang, K.; Chen, Y.; Fan, G.; Zhang, L.; Guo, B.; Guan, X.; Zhao, R. Revealing the substitution preference of zinc in ordinary Portland cement clinker phases: A study from experiments and DFT calculations. J. Hazard. Mater. 2021, 409, 124504. [Google Scholar] [CrossRef] [PubMed]
- Qi, L.; Grégoire, D.C. Determination of trace elements in twenty-six Chinese geochemistry reference materials by inductively coupled plasma-mass spectrometry. Geostand. Geoanal. Res. 2000, 24, 51–63. [Google Scholar]
- Li, X.Y.; Li, Z.G.; Wu, T.T.; Chen, J.; Fu, C.C.; Zhang, L.M.; Feng, X.B.; Fu, X.W.; Tang, L.; Wang, Z.K.; et al. Atmospheric mercury emissions from two precalciner cement plants in Southwest China. Atmos. Environ. 2019, 199, 177–188. [Google Scholar] [CrossRef]
- Cui, J.; He, J.; Xiao, Y.; Li, J.; Di, Y. Characterization of input materials to provide an estimate of mercury emissions related to China’s cement industry. Atmos. Environ. 2021, 246, 118133. [Google Scholar] [CrossRef]
- GB 30760-2014; Technical Specification for Coprocessing of Solid Waste in Cement Kiln. General Administration of Quality Supervision, Inspection and Quarantine of the People’s Republic of China and China National Standardization Administration Committee: Beijing, China, 2014. (In Chinese)
- Achternbosch, M.; Bräutigam, K.-R.; Hartlieb, N.; Kupsch, C.; Richers, U.; Stemmermann, P. Impact of the use of waste on trace element concentrations in cement and concrete. Waste Manag. Res. 2005, 23, 328–337. [Google Scholar] [CrossRef] [PubMed]
- Yan, D.; Peng, Z.; Yu, L.; Sun, Y.; Yong, R.; Karstensen, K.H. Characterization of heavy metals and PCDD/Fs from water-washing pretreatment and a cement kiln co-processing municipal solid waste incinerator fly ash. Waste Manag. 2018, 76, 106–116. [Google Scholar] [CrossRef]
- Li, C.; Nie, Z.; Cui, S.; Gong, X.; Wang, Z.; Meng, X. The life cycle inventory study of cement manufacture in China. J. Clean. Prod. 2014, 72, 204–211. [Google Scholar] [CrossRef]
- Chen, C.; Habert, G.; Bouzidi, Y.; Jullien, A. Environmental impact of cement production: Detail of the different processes and cement plant variability evaluation. J. Clean. Prod. 2010, 18, 478–485. [Google Scholar] [CrossRef]
- Zhou, X.; Feng, X.; Bi, X.; Li, X.; Wang, Q.; Li, S.; He, T.; Li, Z. Partitioning behaviors of zinc in eight coal-fired power plants with different fueled coals and air pollution control devices. Environ. Sci. Pollut. Res. 2021, 28, 21599–21609. [Google Scholar] [CrossRef] [PubMed]
- Huang, Y.M.; Liu, J.L.; Feng, X.B.; Hu, G.J.; Li, X.Y.; Zhang, L.M.; Yang, L.; Wang, G.; Sun, G.Y.; Li, Z.G. Fate of thallium during precalciner cement production and the at-mospheric emissions. Process Saf. Environ. Prot. 2021, 151, 158–165. [Google Scholar] [CrossRef]
- Huang, Y.M.; Liu, J.L.; Yang, L.; Li, X.Y.; Hu, G.J.; Wang, G.; Sun, G.Y.; Li, Z.G. Fate of lead and cadmium in precalciner cement plants and their atmospheric releases. ACS Omega 2021, 6, 21265–21275. [Google Scholar] [CrossRef] [PubMed]
- Lederer, J.; Trinkel, V.; Fellner, J. Wide-scale utilization of MSWI fly ashes in cement production and its impact on average heavy metal contents in cements: The case of Austria. Waste Manag. 2017, 60, 247–258. [Google Scholar] [CrossRef] [PubMed]
- Tian, L. Migration and Transformation of Heavy Metals in Co-Processing of Waste Incineration Fly Ash Cement Kiln under Different Pretreatment Modes. Master’s Thesis, Beijing University of Chemical Technology, Beijing, China, 2020. (In Chinese with English Abstract). [Google Scholar]
- Gineys, N.; Aouad, G.; Sorrrentino, F.; Damidot, D. Incorporation of trace elements in Portland cement clinker: Thresholds limits for Cu, Ni, Sn or Zn. Cem. Concr. Res. 2011, 41, 1177–1184. [Google Scholar] [CrossRef]
Publisher’s Note: MDPI stays neutral with regard to jurisdictional claims in published maps and institutional affiliations. |
© 2022 by the authors. Licensee MDPI, Basel, Switzerland. This article is an open access article distributed under the terms and conditions of the Creative Commons Attribution (CC BY) license (https://creativecommons.org/licenses/by/4.0/).


