Article

Assessment of the Atmospheric Deposition of Heavy Metals and Other Elements in the Mountain Crimea Using Moss Biomonitoring Technique

by
Pavel Nekhoroshkov
1,*,
Alexandra Peshkova
1,
Inga Zinicovscaia
1,2,
Konstantin Vergel
1 and
Alexandra Kravtsova
1
1
Frank Laboratory of Neutron Physics, Joint Institute for Nuclear Research, 141980 Dubna, Russia
2
Horia Hulubei National Institute for R&D in Physics and Nuclear Engineering, Nuclear Physics, 30 Reactorului, MG-6, Magurele, 077125 Bucharest, Romania
*
Author to whom correspondence should be addressed.
Atmosphere 2022, 13(4), 573; https://doi.org/10.3390/atmos13040573
Submission received: 27 February 2022 / Revised: 29 March 2022 / Accepted: 30 March 2022 / Published: 2 April 2022
(This article belongs to the Special Issue Atmospheric Metal Pollution Vol.2)

Abstract

:
The atmospheric depositions of heavy metals and other elements on the territory of Crimean Mountains in 2015 was assessed using the moss biomonitoring technique. The neutron activation analysis performed at the installation REGATA of the IBR-2 reactor was used for the determination of the mass fractions of 34 elements (Na, Mg, Al, Cl, K, Ca, Sc, Ti, V, Cr, Mn, Fe, Co, Ni, Zn, As, Se, Br, Rb, Sr, Sb, I, Cs, Ba, La, Ce, Nd, Sm, Eu, Tb, Yb, Ta, Th, and U). Factor analysis, concentration factors, and enrichment factors were used to reveal possible sources of elements in the mosses. The main contributor to the deposition of elements on the mosses was the weathering of rock materials. The second group of elements included Br and I. The agriculture and marine sources of emissions were found to be important factors of atmospheric Br and I, respectively. The representing maps of the distribution of heavy metals and other elements revealed high levels of elements at the South coast of Crimea and near the city of Simferopol. The comparison of the obtained data with the data of biomonitoring studies performed for other mountain regions showed higher levels of Al, V, Cr, Fe, Ni, and As than in the mosses from Bulgaria, Macedonia, and Norway, but lower than in the mosses from Georgia, Turkey, Romania, and Northern Serbia. The presented results could serve as a basis for future monitoring research.

1. Introduction

Nowadays, strategic and important tasks for the sustainable development of any region are natural environment protection, efficient use of natural resources, and providing and enabling a safe environment for human health. To form a comprehensive view of the level of pollution on the studied territory is necessary in order to conduct monitoring of the state of environmental objects.
The moss-biomonitoring technique is often applied to the control of atmospheric deposition. Mosses can be used as appropriate and convenient bioindicators for assessment of the level of air pollution due to their wide-spreading and high accumulation capacity. Because of the absence of a well-developed root system, air is considered the main source of the accumulation of pollutants in mosses [1]. This technique became the basis of the International Cooperative Program on Effects of Air Pollution on Natural Vegetation and Crops in the framework of the European convention on long-range transboundary air pollution (UNECE ICP). The data about concentrations of Al, Sb, As, Cd, Cr, Cu, Fe, Pb, Hg, Ni, V, and Zn in mosses are reported every five years to the UNECE ICP Vegetation program [2].
The moss biomonitoring technique has been successfully applied to assess the atmospheric deposition of heavy metals and other elements in many European countries and in regions of Russia [3].
The mountain forest area of the Crimean Peninsula is poorly studied in terms of the analysis of heavy metals and other trace element concentrations. The existing studies are focused on the determination of several elements in soils of populated areas and on the mercury content in lichens [4]. Several studies have been conducted for the assessment of the sanitary state of atmospheric air [5] and the influence of traffic on air pollution in several cities in Crimea [6]. The importance of the assessment of air quality is determined by the increasing recreational and industrial pressure on the ecosystems of the peninsula.
The determination of the content of heavy metals in the mosses of the mountain part of the Crimean Peninsula would help to establish the background levels of chemical elements in different zones, including protected, residential, and industrial areas. The identification of potential sources of input of potential pollutants is important for the creation of a database for future biomonitoring studies. On the Crimean Peninsula, moss biomonitoring studies are complicated by terrain conditions. The mosses in the study zone grow predominantly in mountain forests and in wet local areas with forests or slopes in the northern direction.
Therefore, the aim of the study was, for the first time, to analyze the atmospheric depositions of heavy metals and other elements using the moss-biomonitoring technique in order to assess the ecological state of the mountain Crimea. The main objectives were the designation of the associations of elements to possible pollution sources, suggesting background values, a comparison of the obtained data with other mountain regions, and the creation of a local analytical database.

2. Materials and Methods

2.1. Studies Area

The Crimean Peninsula is situated in Eastern Europe, washed out by waters of the Black and Azov Sea from all sides (Figure 1). The relief of the Crimean Peninsula can be divided into three parts: the north Crimean plain, the Kerch peninsula, and the Crimean Mountains. The Crimean Mountains are situated along the Black Sea coast, from the Fiolent Cape to Feodosiya City. The west–east direction of the Crimean Mountains forms the subtropical climate of the South Coast. Natural landscapes are represented by coastal oak, hornbeam, and beech forests on parent rocks such as siltstones, mudstones, shales, limestones, and sandstones [6]. The main types of rocks in the sampling sites are calcareous and karst limestones.
Typically, the precipitation levels increase with altitude. In the plane part of Crimea, annual precipitation rarely exceeds 400 mm. On the South Coast at sea level, the precipitation is at the level of 600 mm, while at high altitude yailas (flat mountain pastures) they are between 700–1100 mm per year [7]. The amount of rainfalls affects the spreading of an area where the moss could be found.
Each geographical part of Crimea is characterized by a certain type of soil. The vegetation species in mountain areas are determined by altitudinal zonation.
The industrial sector of the region is presented by the mining of fluxing limestone, the production of cement and other construction materials, salt, consumer good manufacturing, food industry, agriculture, including vineries, and animal husbandry. The primary sources of air pollution in the mountain zone of Crimea, except traffic, are local industries, such as the production of construction materials, agriculture, and heat and power plants in cities.
For the conservation of unique flora and fauna, a high number of protected areas (150) are situated at the peninsula under state management. They have endemic species, which are claimed important at a regional scale [8].

2.2. Sampling

The samples of mosses were collected using a standard technique [9,10,11] in June 2015 at 26 stations in the mountain zone of Crimea (Figure 1). The sampling sites were chosen in forest areas, downwind of slopes with scarce vegetation at a distance of at least 500 m from the roads, where there were potential sources of pollution. In addition, the mosses from st. 12, 14, 17, and 19 were collected in the Crimean Natural Reserve and the Mountain-Forest Reserve of Yalta (natural sanctuaries), and in the Baydar and Ayu-Dag landscape reserves (Figure 1) in order to use the suitable background points for the surrounding areas regarding the relief and climatic conditions. The distance between sampling sites was in the range of 5–50 km, depending on the relief, geographical features of the area, and the presence of mosses.
Pleurozium shreberi was chosen as it was the most frequently found species in the studied zone. It is considered the most used species for the assessment of atmospheric depositions in other countries participating in the ICP Vegetation program [2]. For the analysis, green or green-brown segments of moss corresponding to three years of growth were taken. Each sample of moss was over 500 g wet weight, included 5–10 local subsamples for representativeness, and was collected by hand using separate clear gloves. After this, the samples were stored in air-permeable bags at room temperature and humidity before preparing for analysis [10].
According to the manual [11], the collected samples were cleaned from the parts of substrate and other vegetation, dried at 40 °C for constant weight, and pressed into pills. The water was not used for moss cleaning because of possible washing out of materials from their surface. For irradiation, moss subsamples with a weight around 0.3 g were packed in polyethylene bags for the determination of elements based on short-lived isotopes (Al, Mg, Ca, Cl, Ti, V, and Mn) and aluminum cups for the determination of elements with long-lived isotopes (Na, K, Sc, Cr, Fe, Co, Ni, Zn, As, Se, Br, Rb, Sr, Sb, I, Cs, Ba, La, Ce, Nd, Sm, Eu, Tb, Yb, Ta, Th, and U). The technique is described in detail in [12]. Any contact of the analyzed materials with the metal tools was excluded during the sampling and sample preparation for analysis.

2.3. Analysis

The neutron activation analysis was performed at the REGATA facility of the reactor IBR-2 in the Frank Laboratory of Neutron Physics (Dubna, Russia). Basic properties of neutron activation analysis are described in [13]. For elements determined on short-lived isotopes, the subsamples were irradiated for 3 min at a neutron flux of 1.1 × 10¹² n cm−2 s−1. The induced gamma activities were measured for 15 min using Canberra HP-Ge detectors. The subsamples for long-lived isotopes were irradiated for 4 days at a neutron flux of 1.1 × 10¹¹ n cm−2 s−1 and induced gamma activities were measured during 30 min and 90 min after 4 and 20 days of decay, respectively.
The spectra recording, analysis, and concentration calculations were performed using Genie 2000 and software developed in FLNP JINR [14]. The comparative analysis, in which the analyzed sample and standard were irradiated in the same conditions, was applied for the calculation of the mass fractions of elements.
The quality control (Table 1) was provided using the international certified reference materials SRMs: IAEA-433 (Marine sediment), JRC-IRMM-BCR-667 (Estuarine sediment), NIST-1566b (Oyster tissue), NIST-1549 (Non-Fat Milk Powder), NIST-1633c (Trace elements in coal fly ash), NIST-2711 (Montana II soil), NIST-2711a (Montana I Soil), NIST 1632c (Trace Elements in Coal (Bituminous)), and NIST-1573a (Tomato leaves). The final uncertainty of the mass fraction determination was in the range of 2–10% and 20–25% for several elements. These values are presented in recovery rates and took into account comparisons between stations and other regions. Elements with uncertainties higher than 30% were excluded from further analysis.

2.4. Data Analysis

The statistics were performed using Excel by Microsoft and STATISTICA 10 with TIBCO Software Inc. (Palo Alto, CA, USA), Factor analysis was applied for the separation of the group of elements of different origins and for the analysis of the connections between them. Factor analysis was carried out on a data matrix, where the rows were the 26 sampling sites and the columns were the variables (concentration of Na, Mg, Al, Cl, K, Ca, Sc, Ti, V, Cr, Mn, Fe, Co, Ni, Zn, As, Se, Br, Rb, Sr, Sb, I, Cs, Ba, La, Ce, Nd, Sm, Eu, Tb, Yb, Ta, Th, and U in Crimean mosses). Before analysis, the data were standardized. To determine the number of factors that accounted for the most variation in the factor analysis of a correlation matrix, the Cattell’s scree test and Kaiser criterion were used. Factor loadings >0.71 were considered as appropriate for consideration. For analysis of the features of the element distributions in the studied area, ArcGIS by ESRI (Redlands, CA, USA) was applied. The ranges and type of graphical presentation of elemental mass fractions distribution were chosen based on the recommendations of the UNECE ICP Vegetation Program [11].
For descriptive purposes, the minimal and maximal values, median, means, and background values were calculated for each analyzed element. The significance of the differences between stations was provided by independent pooled samples. The background values (Cb) for each element were calculated according to the approach presented in [15]. The regional Cb was calculated as the mean of four samples collected near the protected areas of st. 12 (Gasphorta mountain), 14 (Peredovoe), 17 (Tylovoe), and 19 (Ayu-Dag Reserve).
The ontamination factor (CF) illustrated the ratio between the levels of element in the sample of moss and its background level [16]. CFs were calculated according to [16], as CF = Ci/Cb, where Ci is the mass fraction (mg/kg) of elements in moss and Cb is the background value (mg/kg) of an element. According to this approach, samples with CF < 1 are considered as unpolluted, CF = 1–2 correspond to a suspected pollution level, CF = 2–3.5–slight pollution, CF = 3.5–8 are moderate, CF = 8–27 are severe, and CF > 27 indicate extreme pollution levels [16].
Enrichment factor (EF) is a ratio that helps to distinguish the elements of an anthropogenic origin from a natural origin [17]. EF is calculated as EF = (Ci/CSc)/(Ci UCC/CSc UCC), where CSc is the mass fraction of Sc in moss from current station, and Ci UCC and CSc UCC are the mass fraction of the element and Sc in the upper continental crust, respectively (data from [18]). According to the approach presented in [17], the elements are characterized as highly enriched (EF > 100), intermediate enriched (10 < EF < 100), and less enriched (EF < 10). In the case of EF = 1 and around, the main source of the element is crustal material. This indicates the influence of soil, dust particles, or the local parent rocks, corresponding to the reference values in the upper continental crust.

3. Results and Discussion

The results of the descriptive statistics and the values of contamination factors for the complete set of data are presented in Table 2.
For potential pollutants (Al, V, Cr, Fe, Co, Ni, Zn, As, and Sb), which are reported manually through moss-biomonitoring [19], the contamination factors were calculated for each station as well (Table 3). The maximum values were found at st. 6 (Foros), to the east of st. 7 (Opolznevoe), and at st. 13 (Chertovaya lestniza pass), with CF in the range of 2–5. Therefore, these sites could be considered as slightly or moderately polluted with the analyzed elements. However, the mentioned elements could accumulate in mosses during the growing period, because of the input of soils and dust [20]. This assumption agrees with the factor analysis. At st. 8 (Bakhchisarai), st. 9 (Inkerman), st. 10 (Sokolynoe), st. 15 (Orlynoe), and st. 22 (Sudak), CF < 1 indicates an unpolluted environment.
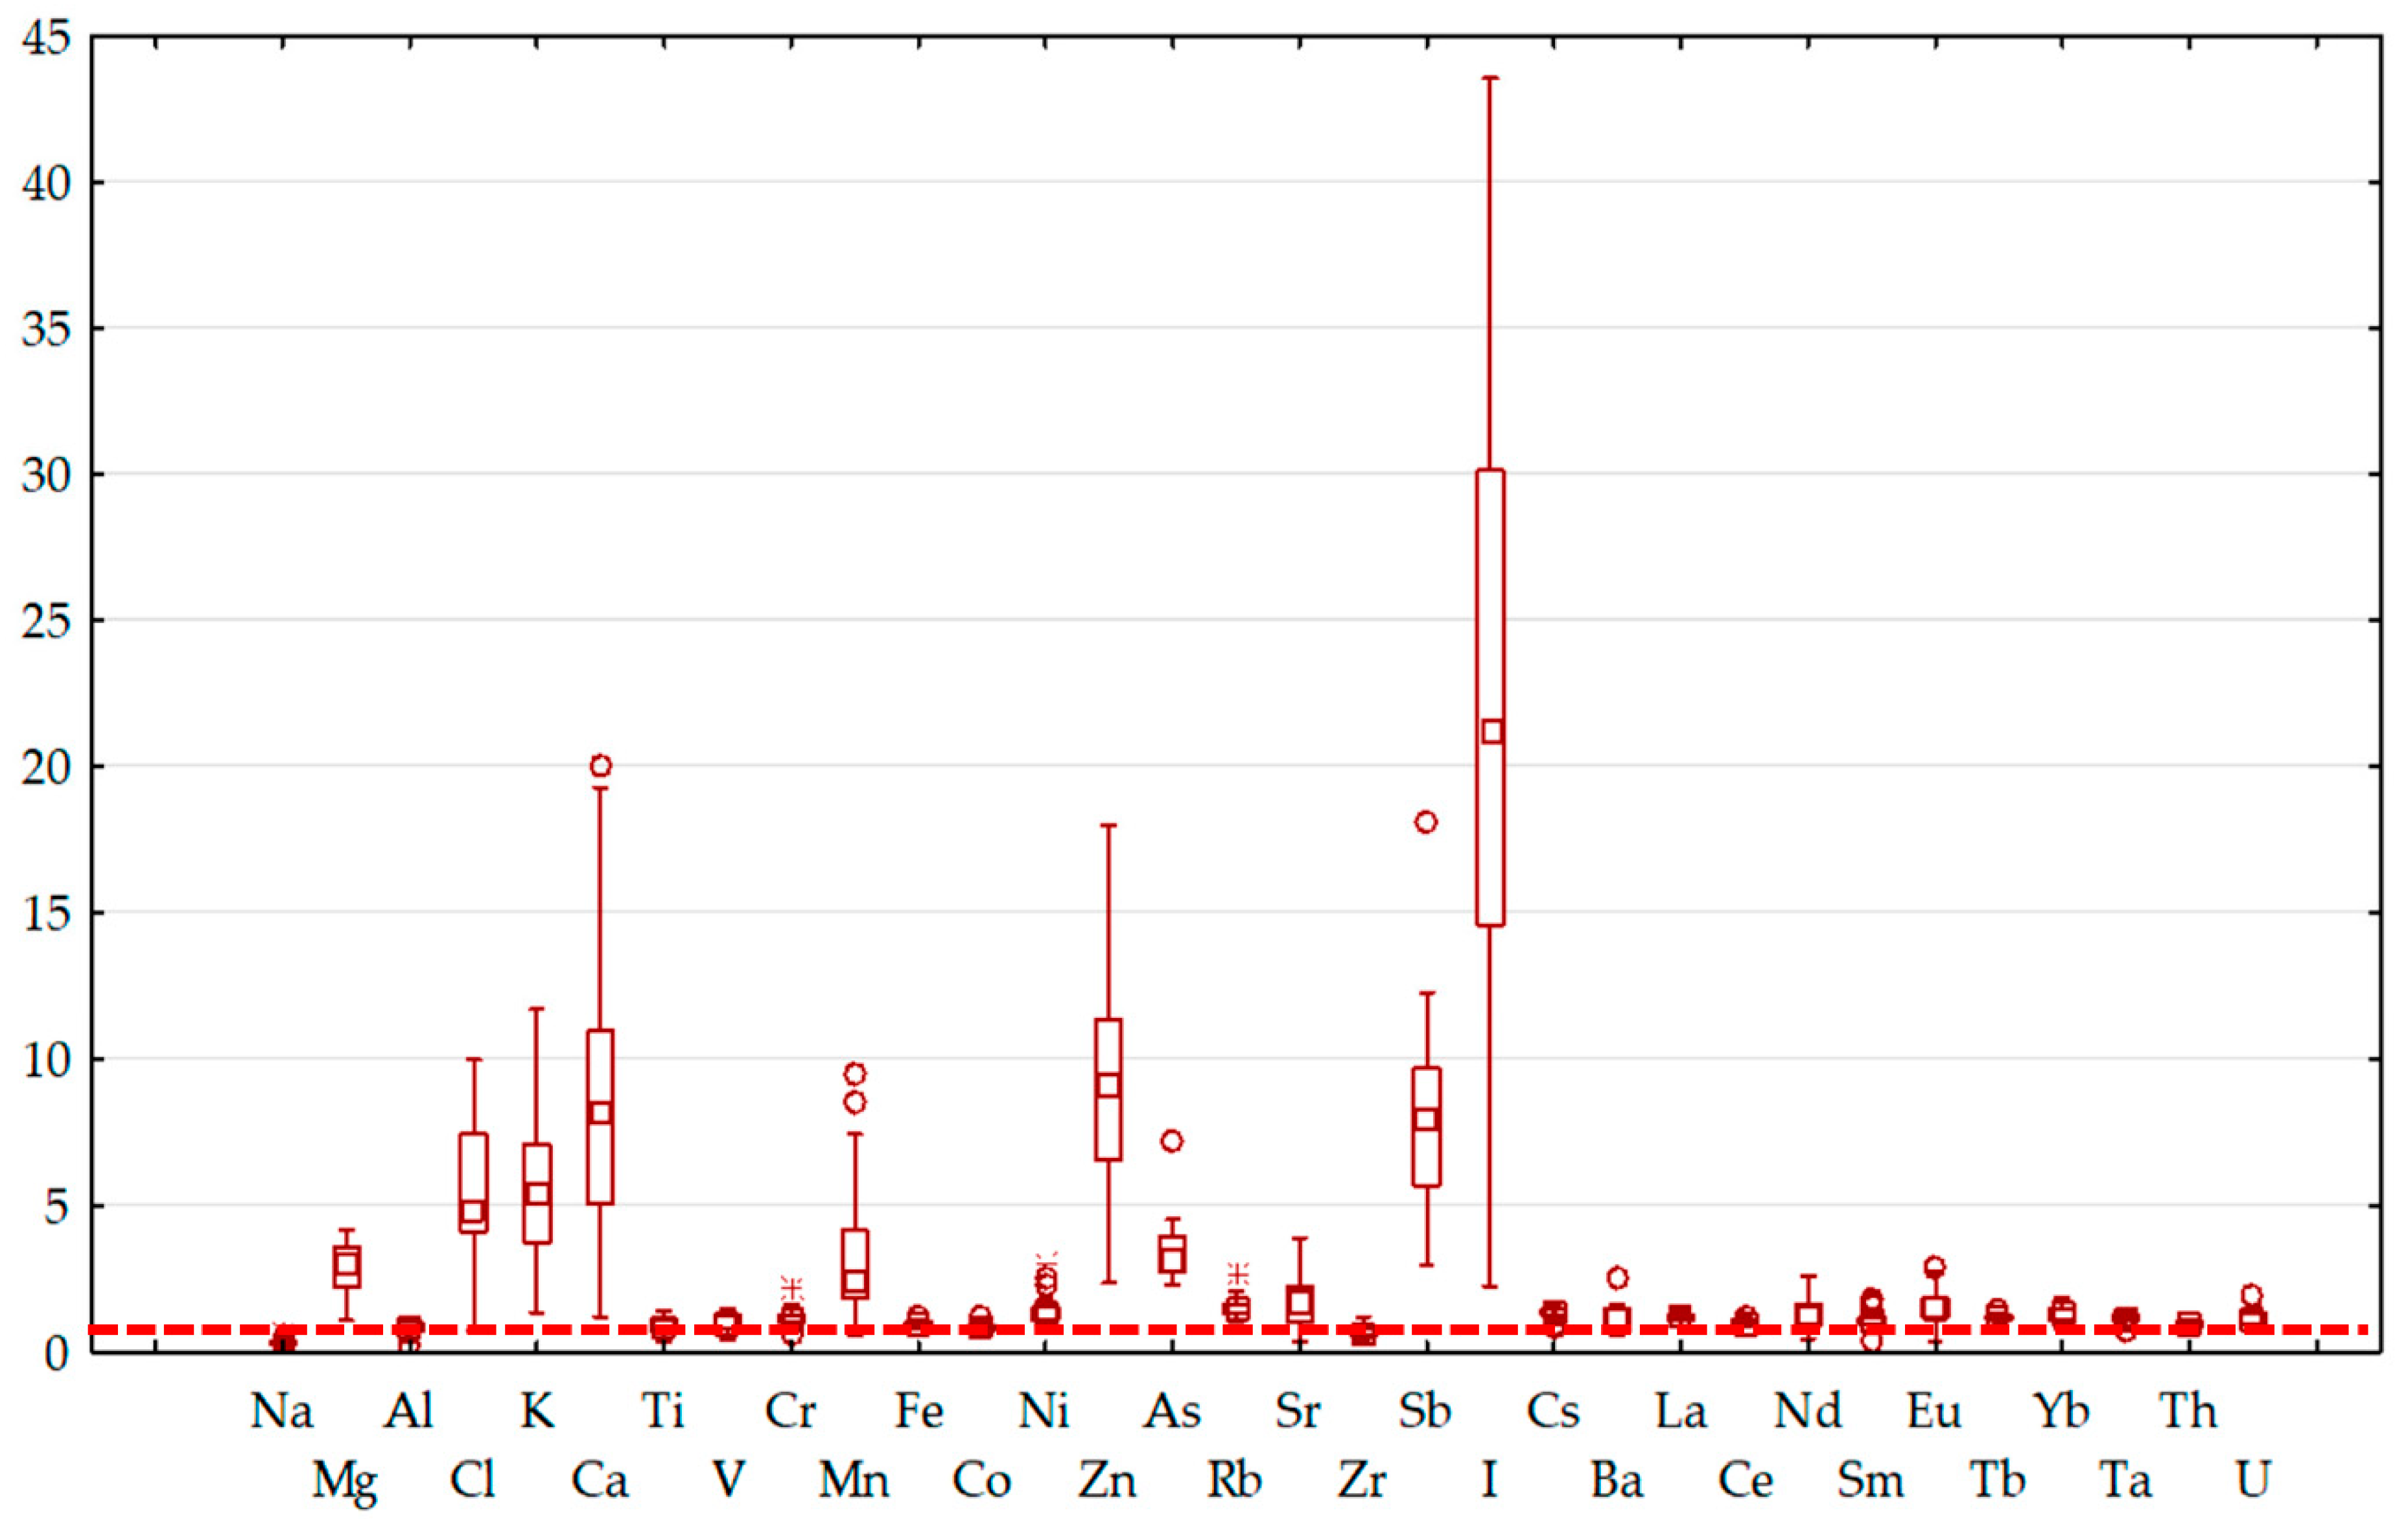
Elements, such as Al, Ti, V, Cr, Fe, Co, Ni, Rb, Sr, and Cs, with EF values around 1 are associated with a lithogenic component with a contribution of material of a rock origin in mosses (Figure 2). The highest enrichment was found for Se, Br, and I with EF > 15 for all samples, as well as for Cl and K (EF > 5). Se and Br are excluded in Figure 2. High values of EF can be explained by the location of the studied region close to the sea. This agrees with the features found by [21]. The anthropogenic contribution of these elements cannot be separated from the natural marine influence. EF of Ca higher than 5 could be explained by the local input of the calcareous rocks (limestones), which affect moss accumulation features through dust particles. Elevated mass fractions of Mg, Mn, Zn, As, nd Sb with EF between 2 and 10 are assumed to be related to anthropogenic sources such as traffic emissions and dust particles from minerals enriched by Mg and Mn [21].
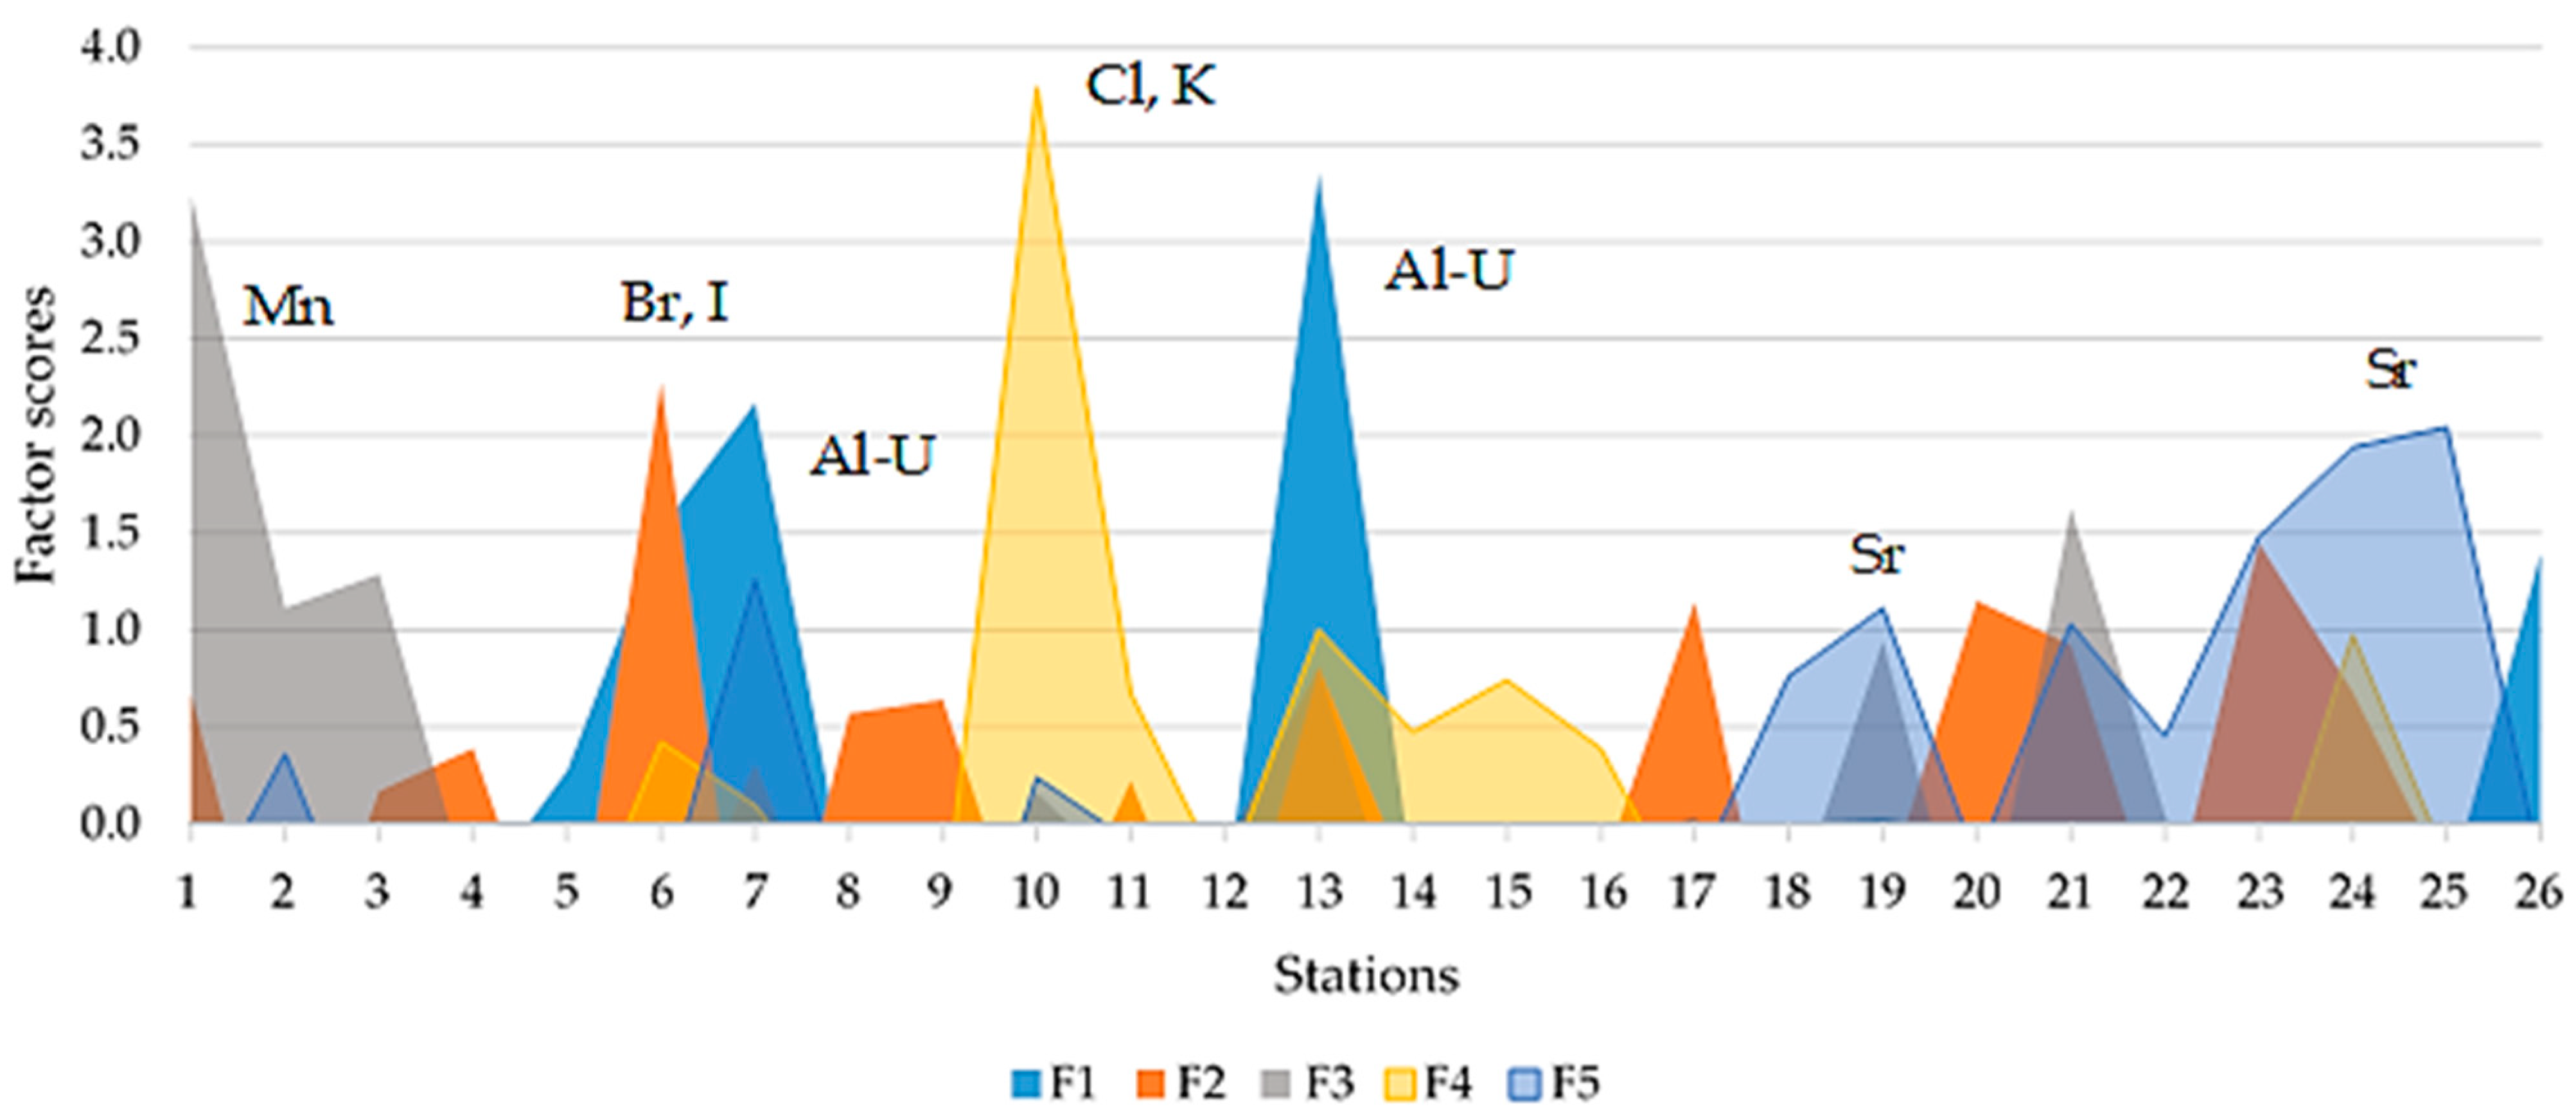
Using factor analysis, five groups of elements of different origins were identified (Table 4, Figure 3):
Factor 1 (64% of explained variance), which includes elements such as Na, Mg, Al, Sc, Ti, V, Cr, Fe, Co, Ni, Zn, As, Se, Rb, Sb, Cs, La, Ce, Nd, Sm, Eu, Tb, Ta, Th, and U, is associated with elements of a terrigenous origin [22,23], except for Zn and As. For the majority of these elements, soil and dust particles are the main source [24]. Mg, Zn, and As with levels of EF > 2 were connected with anthropogenic inputs, such as traffic emissions, and pesticides and herbicides in agricultural areas [21,25]. In the case of Na, EF < 1 may be due to the low retention capacity of this element and, in addition, Na usually shows the behavior of a crustal element in moss [26]. High correlation coefficients of such markers of terrigenous matter such as non-volatile element Sc from one side, and elements such as Al, V, Cr, Fe, Co, and Ni from the other side, point to the connection of them with the weathering processes of rock materials [27,28]. In general, the elements included in Factor 1 had relatively homogenous distributions among the studied zone. The maximum factor scores were found at st. 6 (Foros), st. 7 (Opolznevoe), st. 13 (Chertovaya lestniza), and st. 26 (Fersmanovo). At these sites, the content of corresponding elements in mosses was 2–4 times more than the background.
Factor 2 (10% of explained variance) includes such elements as Br and I. Their accumulation in mosses is explained by the transportation of marine ions from the surface of the Black Sea. The mass fractions of Br and I in the samples from coastal zones, such as st. 6 (Foros), st. 17 (Tylovoe), st. 20 (Nikita), st. 21 (Solnechnogorskoe), and st. 23 (Schebetovka), and at the highland yailas (st. 1, 3, and 4), are 1.5–2 times higher than the background levels.
Factor 3 (7% of explained variance) had only Mn. It is important to note that Ca could be included in this factor, but with a negative low factor loading (–0.65). This factor is difficult to explain because of the unstable behavior of Mn in plants, depending on the sample conditions and local sources. CF = 1.0 for Mn highlights the low levels of this element in mosses from the whole studied zone.
Factor 4 (6% of explained variance) includes Cl and K. The content of Cl in mosses of Crimea corresponded to the background levels, except for three stations, st. 6 (Foros), st. 10 (Sokolynoe), and st. 15 (Orlynoe), with local sources of the element connected with pesticides and herbicides. The concentrations of K exceeded the background values at stations 7 (Opolznevoe), 21 (Solnechnogorskoe), nd 24 (Stary Krym). The sources of K and Cl could be considered as being from the application of fertilizers and pesticides in agricultural practice at st. 6, 7, 21, and 24 [29,30].
Factor 5 (4%) corresponded to the accumulation of Sr in mosses. It is interesting to note that Ca was not included in one factor with Sr, so that was probably connected with additional sources of Ca at st. 7, 18, and 19. It agreed with high levels of EF for Ca. According to Kabata-Pendias [31], the calcareous and argillaceous sedimentary rocks are characterized by a high Sr content. It is usually accumulated in mosses due to dust inputs. The mass fractions of Sr exceeding the background values were found at st. 7 and in the eastern part of the studied zone (st. 23–25). The average CF values for Sr in the studied region, excluding reserves, were in the range of 1.2–1.3.
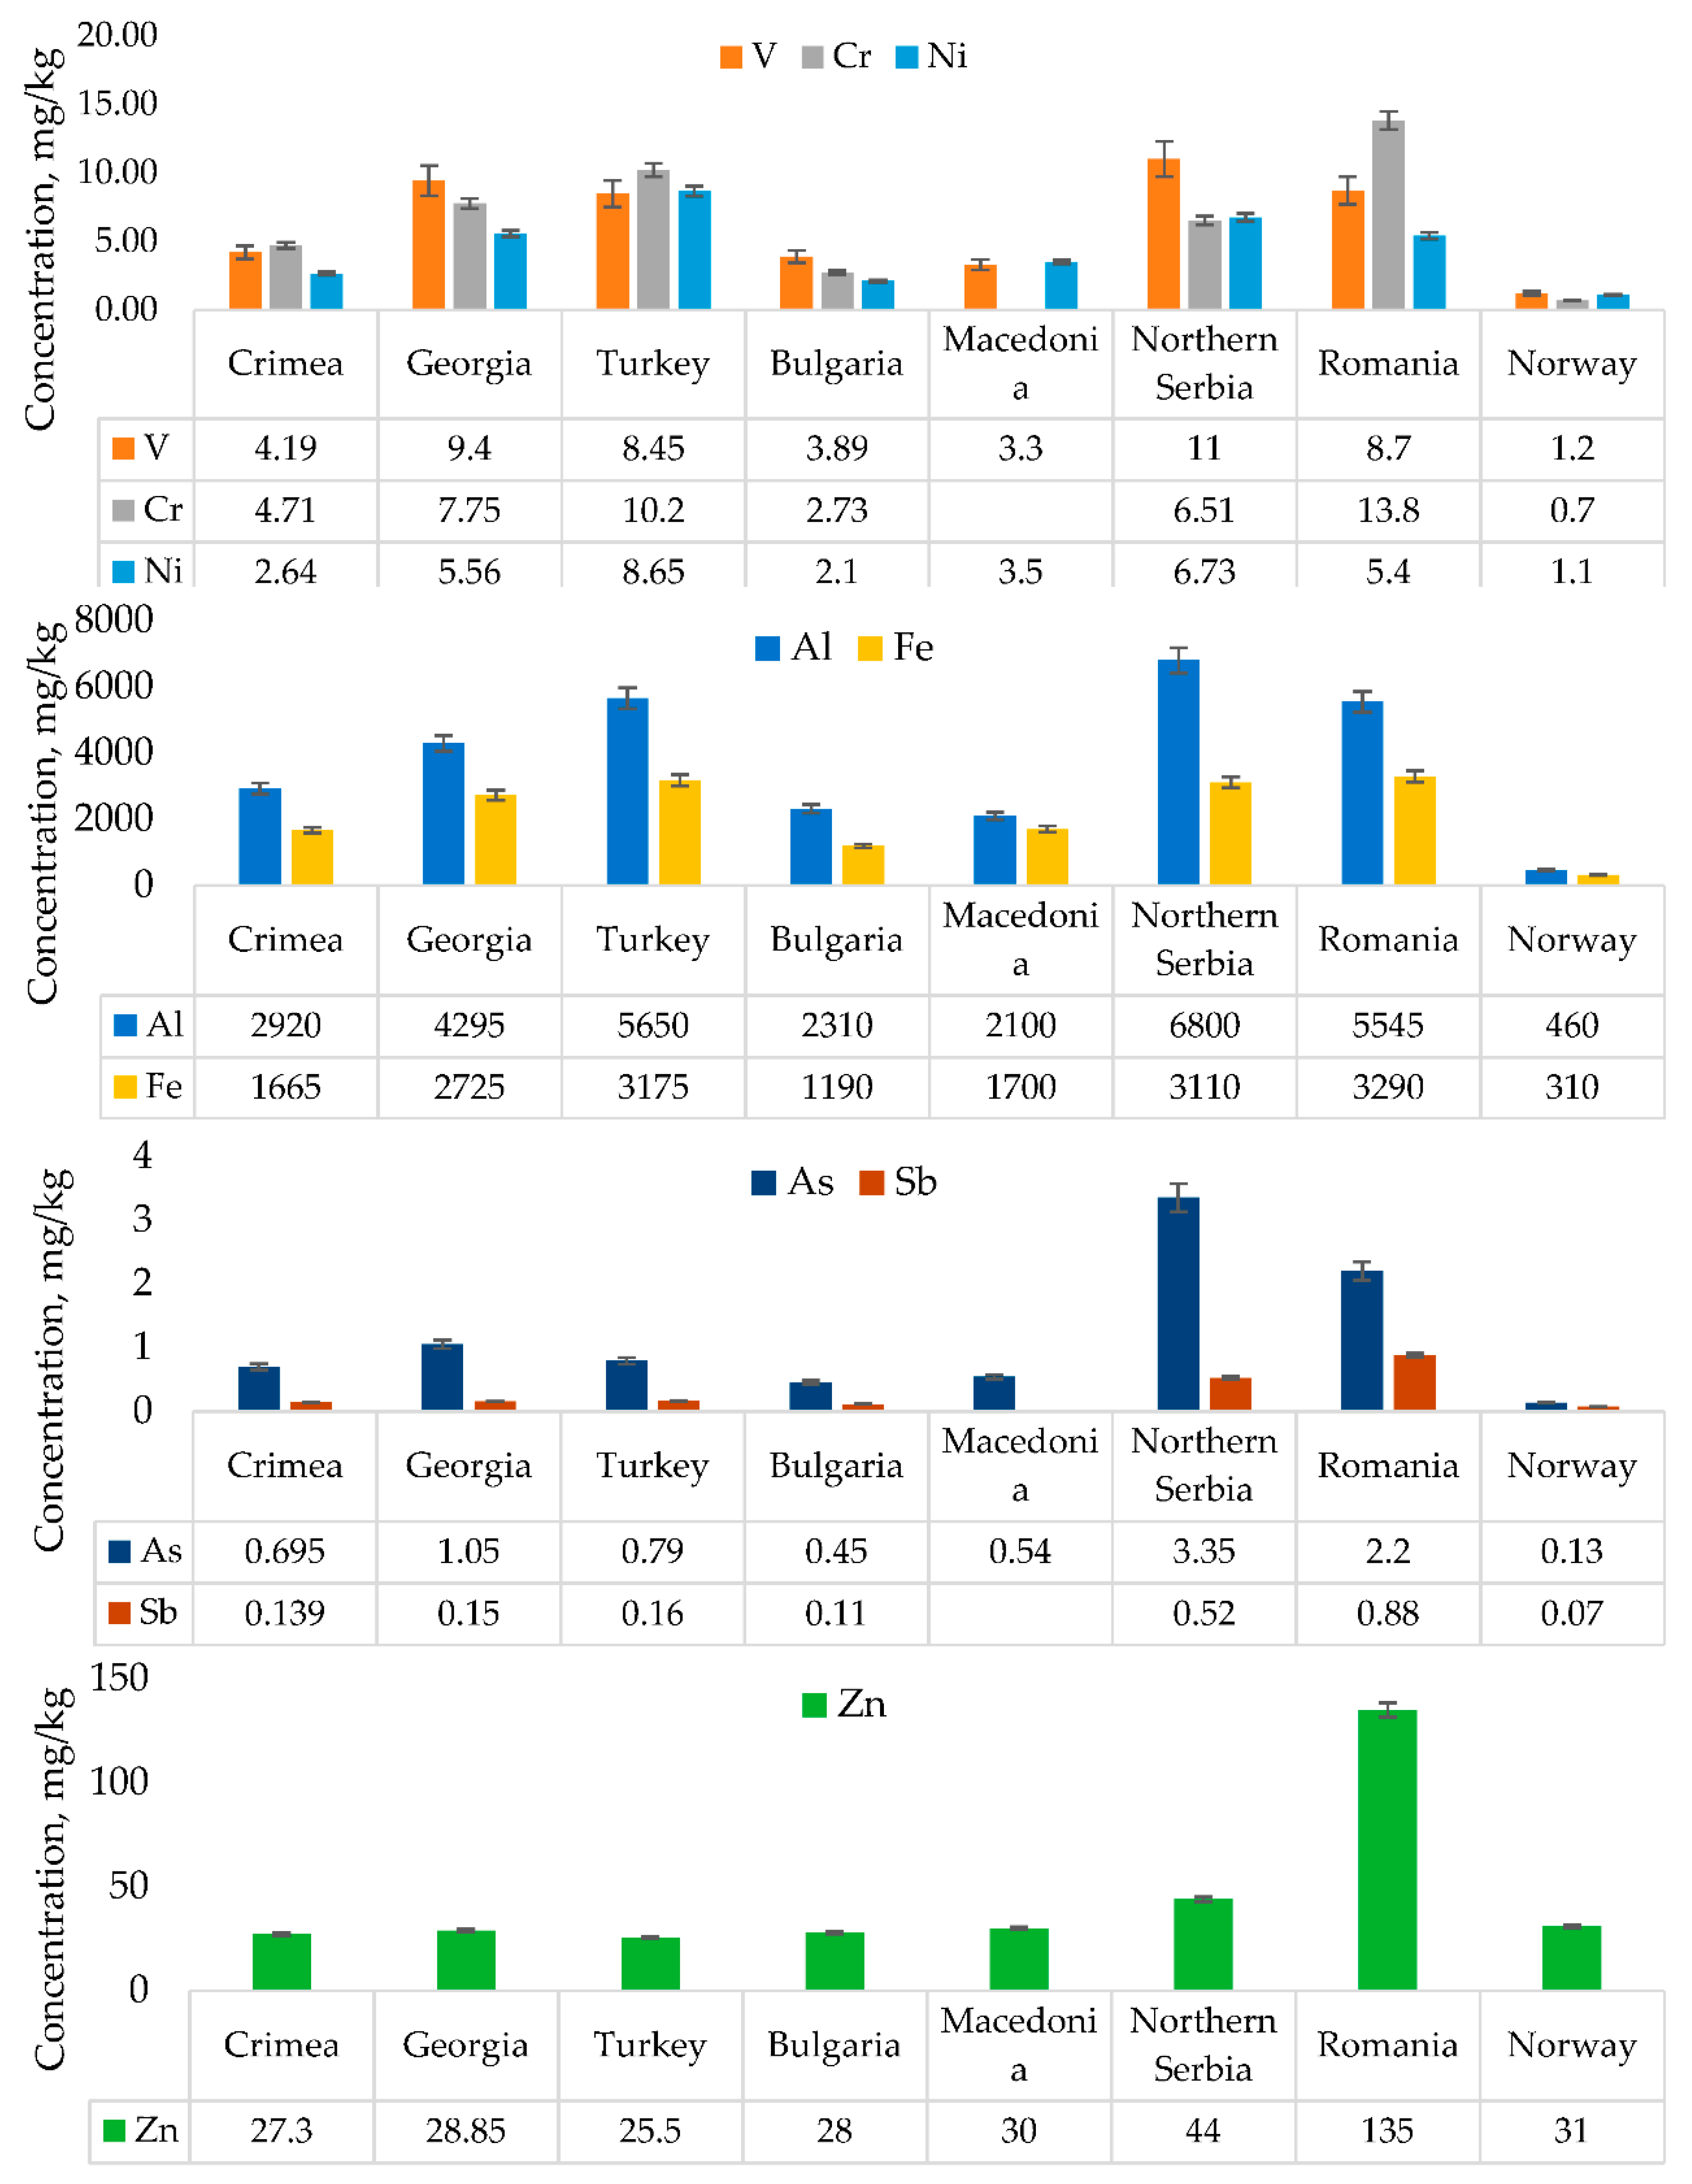
The average values of mass fractions of elements in mosses collected in the mountain zone of Crimea were included in the survey on heavy metals of the international cooperative program (UNECE ICP Vegetation). The data obtained were compared with the appropriate median values in mosses from mountain zones of Georgia [23], Turkey [32], Bulgaria [33], Macedonia [34], Serbia [35], Romania [36], and Norway [37] (Figure 4).
In general, the levels of V, Cr, Ni, Al, Fe, and As in mosses from the mountain Crimea were two to three times lower than in Georgia, Turkey, Romania, and Northern Serbia, but slightly higher than in Bulgaria, Macedonia, and Norway. The mass fractions of Sb and Zn in the mosses from Crimea were almost at the levels of Georgia, Turkey, and Bulgaria. Sb revealed levels that were four to six times lower than the average values in Northern Serbia and Romania. The levels of potential pollutants in Crimea were higher in comparison with Norway. According to the results of the factor analysis and compared with the data for mosses collected in other regions of the world, the presence of heavy metals in the mosses from mountain Crimea could be associated with the geochemical features of the rocks typical for the studied area and with the influence of soil and dust particles.
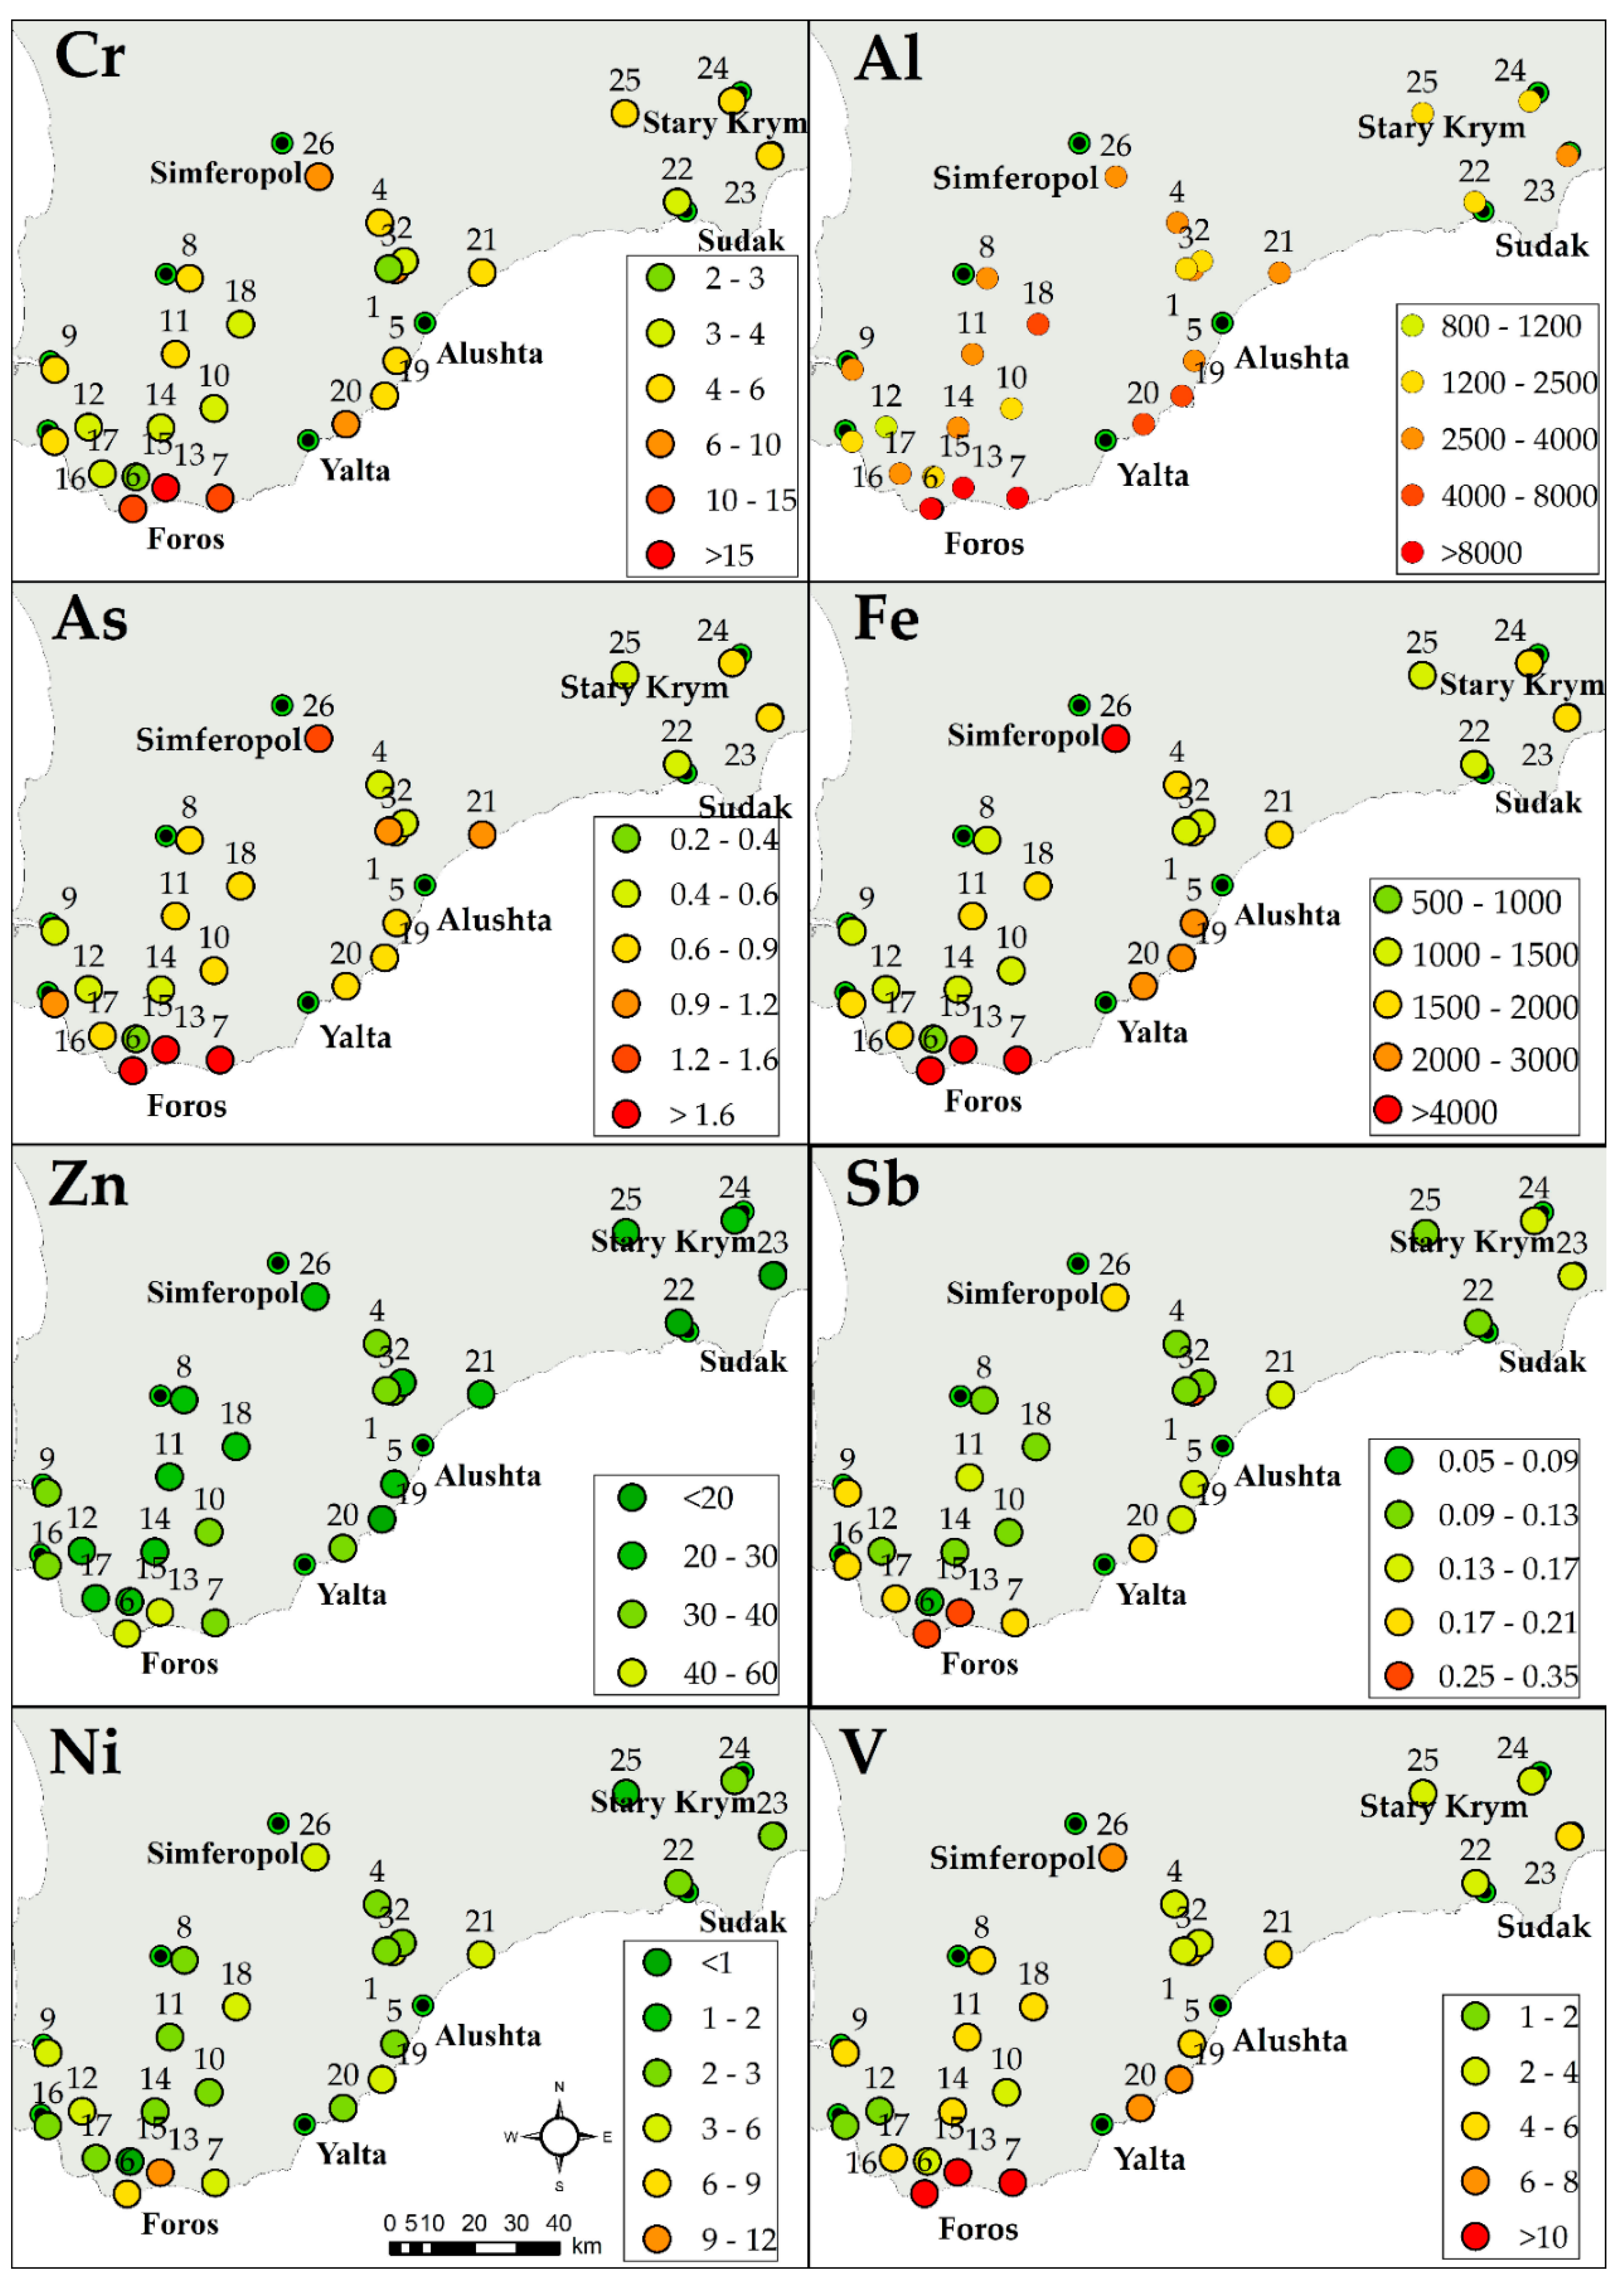
The maps of the spatial distribution of heavy metals in mosses from the mountain Crimea are presented in Figure 5.

Brief Characteristics of Key Elements Reported to the UNECE ICP Vegetation Programme

Aluminum is one of the main soil components. The relatively uniform distribution of Al in the studied zone indicates the contribution of soil particles and the influence of weathering processes [21]. The CF of Al is less than 1.0 for almost the whole of the mountain Crimea.
According to the calculated CF values, contaminations with Cr could be considered as being possible. The maximum content of Cr (>6 mg/kg) was determined at the following coastal sites: st. 6 (Foros); st.7 (Opolznevoe); and in the mountain zone near Simferopol, the largest city of Crimea, at st. 26 (Fersmanovo). Therefore, the construction activities in the reservoir area of fresh water at st. 26 could increase the dust particles, which affected the Cr content in the mosses.
The arsenic content in the moss samples was at the levels of the background. The higher values of As were determined near st. 26 (Fersmanovo), st. 6 (Foros), st. 7 (Opolznevoe), st. 21 (Solnechnogorskoe), st. 1 (Angar pass), and st. 13 (Chertovaya lestniza). At several sites, the high content of As was associated with the use of pesticides or other chemicals in agriculture (vineyards) [38].
Iron is considered to be the main element of a terrigenous origin. In general, the levels of Fe corresponded to the background values in the whole area, except for the samples from the South Coast (st. 5, 6, 7, and 20) and st. 26 (Fersmanovo), where the mass fraction of Fe exceeded 2000 mg/kg. The plowing of land can speed up the weathering process and the transportation of soil and dust particles, which usually contain a high percentage of Fe, K, Ca, and Ti [20]. The vineyards presented in the many places along the South Coast, especially near stations 5, 7, and 20, contributed to the increased content of Fe in the mosses. The open mining of construction limestone near st. 5 and st. 7 led to an increase of the content of Fe in the mosses because of dust particles containing Fe [20].
The levels of Zn at the majority of stations corresponded to the background values. The maximum values exceeding 40 mg/kg were found at st. 6 (Foros) and 13 (Chertovaya lestniza). The content of Sb in the samples corresponded to the background values. The maximum values, which lay in the range of 0.26–0.28 mg/kg, were determined in the highland mountain areas (st. 1 and st. 13) and st. 6 (Foros). The high values of EF for Zn and Sb indicated the anthropogenic sources of pollution for st. 1, 6, and 13. Probable inputs could be transported, as well as deposition of enriched aerosols, to highland areas (st. 13).
Low levels of nickel were found for the whole studied area. The maximum content, which was two times higher than the background levels, was determined at st. 6 (Foros), st. 13 (Chertovaya lestniza), and st. 26 (Fersmanovo).
On average, the mass fractions of V in mosses were at the level of the background. The 3–5-fold exceedance of background values was obtained at st. 6 (Foros), st. 7 (Opolznevoe), and st. 13 (Chertovaya lestniza).
In general, st. 5, 6, 7, and 13 were characterized by high values for most elements of a terrigenous origin (Al and Fe), because of the close presence of open rocks (limestone). Several stations are probably influenced by agricultural practice: Fe at st. 5, 7, and 20 (soil erosion), and As at st. 6, 7, and 21 (application of fertilizers and pesticides).

4. Conclusions

The atmospheric deposition of 34 elements at 26 stations in the mountain Crimea was determined by applying the moss-biomonitoring technique. Most studied elements were included in the first factor and correspond to the terrigenous origin of the additional anthropogenic inputs of dust particles. The second factor contained elements connected with the distribution of marine ions enriched by Br and I. The third factor was associated with Mn due to the anthropogenic inputs of traffic emissions. The fourth factor included elements Cl and K related to pesticides and fertilizers used in agricultural practice. The fifth factor contained Sr and was associated with calcareous and argillaceous sedimentary rocks. By using the geographic information platform ArcGIS, the maps of the spatial distribution of mass fractions of typical heavy metals and other elements in mosses from the studied area were created, which revealed the highest levels of key elements reported to the UNECE ICP Vegetation program (Al, V, Cr, Fe, Ni, As, and Sb) at the South coast of Crimea and near the city of Simferopol. The comparative analysis of the mass fractions of elements in the mountain Crimea showed higher levels of Al, V, Cr, Fe, Ni, and As than in the mosses from Bulgaria, Macedonia, and Norway, but lower than in mosses from Georgia, Turkey, Romania, and Northern Serbia.
The stations situated within protected areas can be considered relatively pristine. This statement was used for the calculation of the average background levels. The exceedance of the background levels of heavy metals was found at the South Coast (st. 6, 7, and 13) and close to Simferopol city (st. 26). The cleanest sites according to this approach were st. 10 (Sokolynoe), st. 18 (Sinapnoe), st. 22 (Sudak city), and st. 25 (Stary Krym), which are situated near the protected and forest areas, far from pollution sources.
Due to the lack of large industrial enterprises and the high number of protected areas, the levels of anthropogenic pressure in Crimea could be considered as low, except for intensive recreational use of the environment.
The data for Al, V, Cr, Fe, Co, Ni, Zn, As, Sb were reported in “Mosses as biomonitors of air pollution: 2015/2016 survey on heavy metals, nitrogen, and POPs in Europe and beyond”, published in 2020, without detailed analysis [2]. The results of this study could be used for further monitoring studies and for regional analysis of the ecological state of the environment.

Author Contributions

Conceptualization, P.N., A.P., I.Z. and A.K.; methodology, P.N., A.P. and A.K.; software, P.N. and K.V.; validation, I.Z.; formal analysis, P.N., A.P. and A.K.; investigation, P.N., A.P. and A.K.; data curation, P.N., A.P. and A.K.; writing—original draft preparation, A.P.; writing—review and editing, P.N. and I.Z.; visualization, A.P.; supervision, I.Z. and P.N.; project administration, I.Z. All authors have read and agreed to the published version of the manuscript.

Funding

This research received no external funding.

Institutional Review Board Statement

Not applicable.

Informed Consent Statement

Not applicable.

Data Availability Statement

The data are available at http://moss.jinr.ru/ (accessed on 26 February 2022).

Acknowledgments

The authors are extremely grateful to Marina Frontasyeva for support of the study.

Conflicts of Interest

The authors declare no conflict of interest.

References

  1. Mahapatra, B.; Dhal, N.K.; Dash, A.K.; Panda, B.P.; Panigrahi, K.C.S.; Pradhan, A. Perspective of mitigating atmospheric heavy metal pollution: Using mosses as biomonitoring and indicator organism. Environ. Sci. Pollut. Res. 2019, 26, 29620–29638. [Google Scholar] [CrossRef]
  2. Frontasyeva, M.; Harmens, H.; Uzhinskiy, A.; Omar Chaligava and Participants of the Moss Survey. Mosses as biomonitors of air pollution: 2015/2016 survey on heavy metals, nitrogen and POPs in Europe and beyond. In Report of the ICP Vegetation Moss SurveyCoordination Centre; Joint Institute for Nuclear Research: Dubna, Russia, 2020. [Google Scholar]
  3. Qarri, F.; Lazo, P.; Allajbeu, S.; Bekteshi, L.; Kane, S.; Stafilov, T. The Evaluation of Air Quality in Albania by Moss Biomonitoring and Metals Atmospheric Deposition. Arch. Environ. Contam. Toxicol. 2019, 76, 554–571. [Google Scholar] [CrossRef]
  4. Evstafeva, E.V.; Bogdanova, A.M.; Bolshunova, T.S.; Baranovskaya, N.V.; Osipova, N.A. Mercury content in the epiphytic lichens of Crimea republic. Bull. Tomsk Polytech. Univ. Geo Assets Eng. 2019, 330, 93–103. [Google Scholar] [CrossRef] [Green Version]
  5. Butyrskaya, I.; Erokin, S.; Erokina, A. The assessment of the sanitary state of atmospheric air of the republic of Crimea. Colloquium-J. 2019, 11, 17–20. [Google Scholar]
  6. Bulgariu, L.; Bezberdaya, L.; Kosheleva, N.; Chernitsova, O.; Lychagin, M.; Kasimov, N. Pollution Level, Partition and Spatial Distribution of Benzo(a)pyrene in Urban Soils, Road Dust and Their PM10 Fraction of Health-Resorts (Alushta, Yalta) and Industrial (Sebastopol) Cities of Crimea. Water 2022, 14, 561. [Google Scholar] [CrossRef]
  7. Gorbunov, R.; Gorbunova, T.; Kononova, N.; Priymak, A.; Salnikov, A.; Drygval, A.; Lebedev, Y. Spatiotemporal aspects of interannual changes precipitation in the Crimea. J. Arid Environ. 2020, 183, 104280. [Google Scholar] [CrossRef]
  8. Cordova, C.E.; Rybak, A.R.; Lehman, P.H. Vegetation Patterns and Conservation Issues in Southern Crimea. Post-Sov. Geogr. Econ. 2013, 42, 362–385. [Google Scholar] [CrossRef]
  9. Harmens, H.; Mills, G.; Hayes, F.; Sharps, K.; Frontasyeva, M. The Participants of the ICP Vegetation. In Air Pollution and Vegetation: ICP Vegetation Annual Report 2014/2015; NERC/Centre for Ecology & Hydrology: Bangor, UK, 2015; p. 35. [Google Scholar]
  10. Vergel, K.; Zinicovscaia, I.; Yushin, N.; Chaligava, O.; Nekhoroshkov, P.; Grozdov, D. Moss Biomonitoring of Atmospheric Pollution with Trace Elements in the Moscow Region, Russia. Toxics 2022, 10, 66. [Google Scholar] [CrossRef] [PubMed]
  11. Harmens, H.; Frontasyeva, M. Heavy Metals, Nitrogen and POPs in European Mosses: 2020 Survey Monitoring Manual; Joint Institute for Nuclear Research: Dubna, Russia, 2015. [Google Scholar]
  12. Pavlov, D.F.; Bezuidenhout, J.; Frontasyeva, M.V.; Goryainova, Z.I. Differences in Trace Element Content between Non-Indigenous Farmed and Invasive Bivalve Mollusks of the South African Coast. Am. J. Anal. Chem. 2015, 6, 886–897. [Google Scholar] [CrossRef] [Green Version]
  13. Greenberg, R.R.; Bode, P.; De Nadai Fernandes, E.A. Neutron activation analysis: A primary method of measurement. Spectrochim. Acta Part B At. Spectrosc. 2011, 66, 193–241. [Google Scholar] [CrossRef]
  14. Dmitriev, A.Y.; Pavlov, S.S. Automation of the quantitative determination of elemental content in samples using neutron activation analysis on the IBR-2 reactor at the frank laboratory for neutron physics, joint institute for nuclear research. Phys. Part Nucl. Lett. 2013, 10, 33–36. [Google Scholar] [CrossRef]
  15. Carballeira, A.; Couto, J.A.; Fernández, J.A. Estimation of Background Levels of Various Elements in Terrestrial Mosses from Galicia (NW Spain). Water Air Soil Pollut. 2002, 133, 235–252. [Google Scholar] [CrossRef]
  16. Fernández, J.A.; Carballeira, A. Evaluation of Contamination, by Different Elements, in Terrestrial Mosses. Arch. Environ. Contam. Toxicol. 2001, 40, 461–468. [Google Scholar] [CrossRef] [PubMed]
  17. Aničić, M.; Tasić, M.; Frontasyeva, M.V.; Tomašević, M.; Rajšić, S.; Mijić, Z.; Popović, A. Active moss biomonitoring of trace elements with Sphagnum girgensohnii moss bags in relation to atmospheric bulk deposition in Belgrade, Serbia. Environ. Pollut. 2009, 157, 673–679. [Google Scholar] [CrossRef] [PubMed]
  18. Rudnick, R.L. Treatise on Geochemistry; Holland, H.D., Turekian, K.K., Eds.; Elsevier: Oxford, UK, 2003; ISBN 0-08-043751-6. [Google Scholar]
  19. Frontasyeva, M.; Harmens, H.; Uzhinskiy, A.; Chaligava, M. Mosses as biomonitors of air pollution: 2015/2016 survey on heavy metals, nitrogen and POPs in Europe and beyond. In The ICP Vegetation Reports to the Working Group on Effects of the Convention on Long-Range Transboundary Air Pollution; Joint Institute for Nuclear Research: Dubna, Russia, 2020. [Google Scholar]
  20. Zhu, Y.; Li, W.; Wang, Y.; Zhang, J.; Liu, L.; Xu, L.; Xu, J.; Shi, J.; Shao, L.; Fu, P.; et al. Sources and processes of iron aerosols in a megacity in Eastern China. Atmos. Chem. Phys. 2022, 22, 2191–2202. [Google Scholar] [CrossRef]
  21. Kabata-Pendias, A.; Szteke, B. Trace Elements in Abiotic and Biotic Environments; Taylor & Francis: Abingdon, UK, 2015; p. 468. [Google Scholar] [CrossRef]
  22. Sorrentino, M.C.; Wuyts, K.; Joosen, S.; Mubiana, V.K.; Giordano, S.; Samson, R.; Capozzi, F.; Spagnuolo, V. Multi-elemental profile and enviromagnetic analysis of moss transplants exposed indoors and outdoors in Italy and Belgium. Environ. Pollut. 2021, 289, 117871. [Google Scholar] [CrossRef] [PubMed]
  23. Chaligava, O.; Shetekauri, S.; Badawy, W.M.; Frontasyeva, M.V.; Zinicovscaia, I.; Shetekauri, T.; Kvlividze, A.; Vergel, K.; Yushin, N. Characterization of Trace Elements in Atmospheric Deposition Studied by Moss Biomonitoring in Georgia. Arch. Environ. Contam. Toxicol. 2020, 80, 350–367. [Google Scholar] [CrossRef] [PubMed]
  24. Kabata-Pendias, A. Trace Elements in Soils and Plants, 4th ed.; Taylor & Francis: Milton Park, GA, USA, 2010; pp. 1–520. [Google Scholar] [CrossRef]
  25. Lazo, P.; Stafilov, T.; Qarri, F.; Allajbeu, S.; Bekteshi, L.; Frontasyeva, M.; Harmens, H. Spatial distribution and temporal trend of airborne trace metal deposition in Albania studied by moss biomonitoring. Ecol. Indic. 2019, 101, 1007–1017. [Google Scholar] [CrossRef]
  26. Gombert, S.; Traubenberg, C.R.; Losno, R.; Leblond, S.; Colin, J.L.; Cossa, D. Biomonitoring of Element Deposition Using Mosses in the 2000 French Survey: Identifying Sources and Spatial Trends. J. Atmos. Chem. 2004, 49, 479–502. [Google Scholar] [CrossRef]
  27. Allajbeu, S.; Yushin, N.S.; Qarri, F.; Duliu, O.G.; Lazo, P.; Frontasyeva, M.V. Atmospheric deposition of rare earth elements in Albania studied by the moss biomonitoring technique, neutron activation analysis and GIS technology. Environ. Sci. Pollut. Res. 2016, 23, 14087–14101. [Google Scholar] [CrossRef]
  28. Barandovski, L.; Frontasyeva, M.V.; Stafilov, T.; Šajn, R.; Ostrovnaya, T.M. Multi-element atmospheric deposition in Macedonia studied by the moss biomonitoring technique. Environ. Sci. Pollut. Res. 2015, 22, 16077–16097. [Google Scholar] [CrossRef] [PubMed]
  29. Zörb, C.; Senbayram, M.; Peiter, E. Potassium in agriculture--status and perspectives. J. Plant Physiol. 2014, 171, 656–669. [Google Scholar] [CrossRef] [PubMed]
  30. Batukaev, A.; Levchenko, S.; Ostroukhova, E.; Boyko, V.; Peskova, I.; Probeigolova, P.; Belash, D.; Lutkova, N. The effect of foliar fertilizing on ecological optimization of the application of fungicides on the productivity and phenolic complex composition of grapes. In BIO Web Conferences; EDP Sciences: Les Ulis, France, 2019; Volume 15, p. 01012. [Google Scholar] [CrossRef]
  31. Kabata-Pendias, A. Trace Elements in Soils and Plants, 3rd ed.; Taylor & Francis: Milton Park, GA, USA, 2000. [Google Scholar] [CrossRef]
  32. Kilic, O.; Belivermis, M.; Sikdokur, E.; Sezer, N.; Erenturk, S.A.; Haciyakupoglu, S.; Chaligava, O.; Frontasyeva, M.; Zinicovscaia, I.; Madadzada, A. Temporal changes of atmospheric deposition of major and trace elements in European Turkey, Thrace region. J. Radioanal. Nucl. Chem. 2021, 329, 371–381. [Google Scholar] [CrossRef]
  33. Hristozova, G.; Marinova, S.; Svozilík, V.; Nekhoroshkov, P.; Frontasyeva, M.V. Biomonitoring of elemental atmospheric deposition: Spatial distributions in the 2015/2016 moss survey in Bulgaria. J. Radioanal. Nucl. Chem. 2020, 323, 839–849. [Google Scholar] [CrossRef]
  34. Stafilov, T.; Šajn, R.; Barandovski, L.; Andonovska, K.B.; Malinovska, S. Moss biomonitoring of atmospheric deposition study of minor and trace elements in Macedonia. Air Qual. Atmos. Health 2017, 11, 137–152. [Google Scholar] [CrossRef]
  35. Frontasyeva, M.V.; Galinskaya, T.Y.; Krmar, M.; Matavuly, M.; Pavlov, S.S.; Povtoreyko, E.A.; Radnovic, D.; Steinnes, E. Atmospheric deposition of heavy metals in northern Serbia and Bosnia-Herzegovina studied by the moss biomonitoring, neutron activation analysis and GIS technology. J. Radioanal. Nucl. Chem. 2004, 259, 141–144. [Google Scholar] [CrossRef]
  36. Stan, O.A.; Lucaciu, A.; Frontasyeva, M.V.; Steinnes, E. New Results from Air Pollution Studies in Romania. In Radionuclides and Heavy Metals in Environment; E14-2000-126; Springer: Dordrecht, The Netherlands, 2001; pp. 179–190. [Google Scholar] [CrossRef]
  37. Steinnes, E.; Uggerud, H.T.; Pfaffhuber, K.A.; Berg, T. Atmospheric deposition of heavy metals in Norway. Natl. Moss Surv. 2017, 58, 387–391. [Google Scholar]
  38. Stranishevskaya, E.; Ostroukhova, E.; Peskova, I.; Levchenko, S.; Matveikina, E.; Shadura, N. Influence of the organic farming system on the composition of Bastardo Magarachskiy grape cultivar as a raw material for production of wines. In E3S Web Conerence; EDP Sciences: Les Ulis, France, 2020; Volume 161, p. 01070. [Google Scholar] [CrossRef] [Green Version]
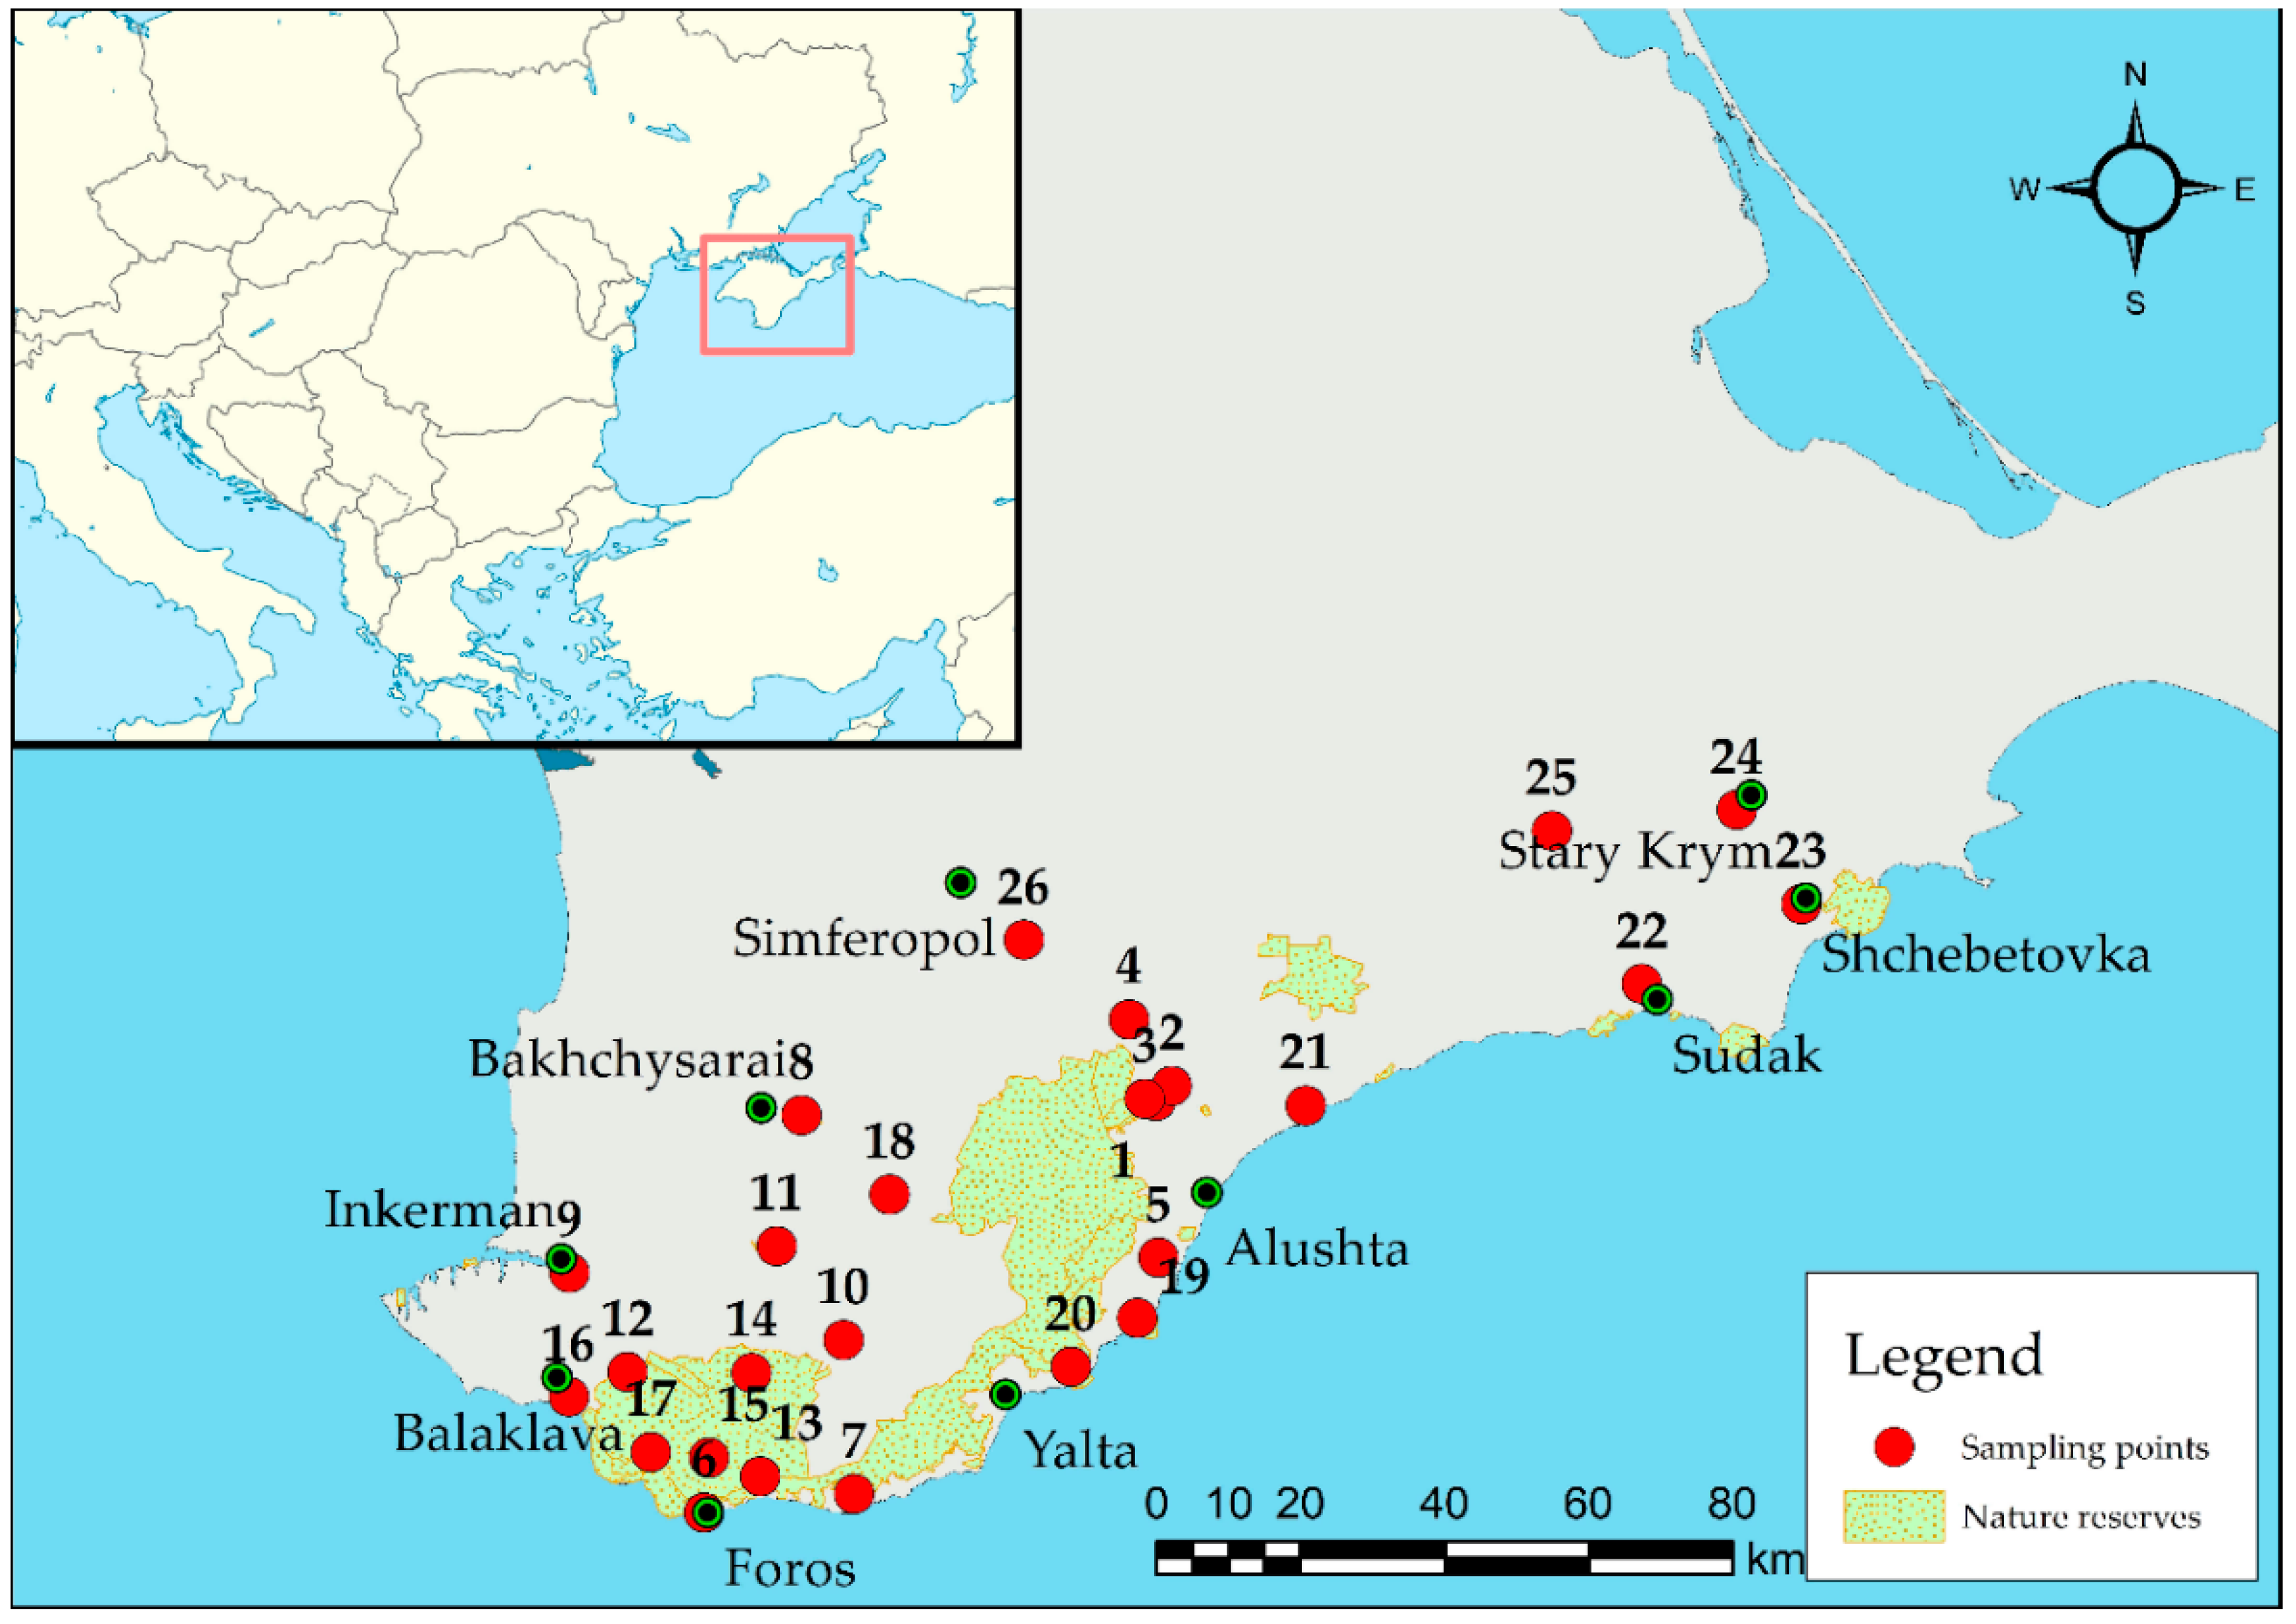
Figure 1. Sampling sites in the mountain Crimea. The main nature reserves are presented in green.
Atmosphere 13 00573 g001
Figure 2. Enrichment factors (EF) of elements in all of the mosses from the studied area. Outliers were presented in red circles. The red dashed line corresponds to EF = 1.
Atmosphere 13 00573 g002
Figure 3. The distribution of the factor scores of five factors among all of the studied sites.
Atmosphere 13 00573 g003
Figure 4. Comparison of the median levels of V, Cr, Ni, Al, Fe, As, and Sb (mg/kg) in mosses from Crimea (present data), Georgia [23], Turkey [32], Bulgaria [33], Macedonia [34], Northern Serbia [35], Romania [36], and Norway [37].
Atmosphere 13 00573 g004
Figure 5. The mass fractions (mg/kg) of Cr, Al, As, Fe, Zn, Sb, Ni, and V in mosses from the mountain Crimea.
Atmosphere 13 00573 g005
Table 1. Quality control of the neutron activation analysis.
SRMsConcentrations, ppmUncertainties, %Recovery Rates, %
DeterminedCertifiedDeterminedCertified
Na2711a12,37712,0008.50.01100.01
Mg1566b1107108510.52.1102
Al1573a5965985.6299.7
Cl1632c114711398.43.6100.7
K43317,02616,6008.413.4102.6
Ca154912,62513,00027.83.897.1
Sc66714.313.725.1104.6
Ti2710a342331107.12.3110.1
V15470.380.3711.68.1101.9
Cr6672181784.79122.6
Mn1573a24324683.398.6
Fe66748,22044,8005.42.2107.6
Co66722.123.01.75.696.1
Ni6671361284.37106.3
Zn6672011752.57.4115
As43318.618.96.61.398.3
Se6671.41.66.6586.9
Br43362672.711.993.2
Rb433112.999.916.48.5113
Sr1633c10409016.46.2115.7
Sb271118.219.43.69.393.9
I15470.280.3033.23094.3
Cs6678.27.82.69104.8
Ba27117347264.45.2101.1
La43334.933.73.44.8103.8
Ce1633c1791805.83099.4
Nd1633c888710.630101.7
Sm4335.35.673095
Eu6671.31.06.11125.6
Tb6670.690.72.42.5101.8
Yb27113.272.77.830121.1
Ta6670.870.92.3299.3
Th66710.510.03.25104.8
U4332.92.54.98.3117.9
Table 2. Mass fractions of elements in samples (mg/kg) and contamination factors (CF).
ElementMinMaxMeanMedianBackgroundCF
Na1851170386262.52531.5
Mg109051702212194019001.2
Al87214,0003869292031581.2
Cl46.535911296.190.91.2
K337090006038596057921.0
Ca489020,90010,383901589321.2
Sc0.363.320.830.590.581.4
Ti548482021561731.2
V1.421.85.84.24.41.3
Cr2.419.95.94.74.211.4
Mn32463143931471.0
Fe93172602157166515321.4
Co0.362.90.810.610.551.5
Ni1.5811.93.592.643.181.1
Zn14.552.328.827.324.51.2
As0.393.090.910.70.641.4
Se0.170.530.280.260.271.1
Br2.679.635.164.875.041.0
Rb3.4127.27.245.56.011.2
Sr13.846.026.826.120.51.3
Sb0.080.280.160.140.141.1
I0.613.111.551.371.421.1
Cs0.161.750.400.270.281.5
Ba16923935321.2
La0.728.392.051.581.421.4
Ce1.6414.43.732.962.751.4
Nd0.516.132.021.681.781.1
Sm0.061.130.280.210.181.6
Eu0.020.30.090.060.042.1
Tb0.020.190.050.030.031.4
Yb0.050.670.180.110.11.7
Ta0.030.230.060.040.051.3
Th0.232.440.620.430.421.5
U0.080.630.190.140.131.4
Table 3. Contamination factor values for selected elements.
No. Contamination Factor (CF)
LocationAlVCrFeCoNiZnAsSb
1Angar pass1.01.01.51.31.51.81.41.11.9
2Slope of Elh-Kaya0.70.70.90.91.10.81.10.80.8
3Chatyr-Dag0.60.70.70.81.10.71.41.60.9
4Perevalnoe 0.80.91.11.01.10.81.30.90.9
5Maliy Mayak1.31.01.21.41.30.81.11.10.9
6Foros3.54.63.33.33.42.71.83.42.0
7Opolznevoe 3.02.93.03.03.41.91.53.01.5
8Bakhchisarai0.91.11.11.01.00.71.11.00.9
9Inkerman0.80.91.30.90.91.11.40.91.5
10Sokolynoe0.70.80.90.90.90.61.31.10.9
11Kuibyshevo0.91.01.11.11.20.81.20.91.2
12Gasphorta0.30.30.70.70.71.21.10.90.9
13Chertovaya lestniza pass4.45.04.74.75.33.72.14.82.0
14Peredovoe1.21.20.90.91.00.81.00.90.8
15Orlynoe0.50.60.60.60.70.50.80.60.6
16Balaklava0.40.51.11.31.40.91.31.41.3
17Tylovoe0.81.00.91.00.90.81.11.01.3
18Sinapnoe1.31.30.91.11.11.00.91.10.7
19Reserve Ayu-Dag1.81.51.41.41.41.20.81.11.1
20Nikita1.51.71.51.51.40.81.31.21.3
21Solnechnogorskoe1.11.21.41.11.31.21.11.41.0
22Sudak0.70.80.80.80.80.60.60.80.8
23Schebetovka1.11.21.21.11.00.90.81.41.1
24Stary Krym0.70.81.21.21.10.81.11.11.0
25Radostnoe0.70.81.20.90.80.60.80.80.7
26Fersmanovo1.21.52.22.82.61.81.12.31.3
The background stations are presented in bold.
Table 4. Factor loadings of the analyzed elements in Crimean mosses.
F1F2F3F4F5 F1F2F3F4F5
Na0.89−0.040.05−0.030.10Br0.200.860.20−0.16−0.04
Mg0.850.290.150.120.22Rb0.950.170.100.180.02
Al0.900.290.060.100.11Sr0.260.150.030.100.84
Cl−0.05−0.02−0.080.890.12Sb0.640.520.290.06−0.20
K0.45−0.150.010.780.02I0.360.78−0.050.050.28
Ca0.100.56−0.61−0.050.25Cs0.970.170.090.130.05
Sc0.980.140.090.100.02Ba0.710.050.390.130.10
Ti0.880.320.100.100.08La0.960.210.110.110.05
V0.880.370.010.120.05Ce0.970.180.100.090.04
Cr0.940.270.110.090.06Nd0.870.210.03−0.010.29
Mn0.210.170.88−0.120.14Sm0.95−0.020.180.160.06
Fe0.970.190.070.080.02Eu0.880.210.130.06−0.10
Co0.960.170.140.11−0.01Tb0.960.170.110.100.03
Ni0.880.270.270.06−0.08Yb0.700.200.520.03−0.12
Zn0.620.400.230.39−0.37Ta0.960.170.110.100.08
As0.930.240.110.140.00Th0.970.160.090.090.05
Se0.570.310.440.46−0.32U0.950.110.120.100.08
The factor loadings >0.7 are presented in red bold type.
Publisher’s Note: MDPI stays neutral with regard to jurisdictional claims in published maps and institutional affiliations.