Article

Can Green Plants Mitigate Ammonia Concentration in Piglet Barns?

1
Leibniz Institute for Agricultural Engineering and Bioeconomy e.V. (ATB), Max-Eyth-Allee 100, 14469 Potsdam, Germany
2
Department of Urban Plant Ecology, Humboldt University Berlin, Unter den Linden 6, 10099 Berlin, Germany
*
Author to whom correspondence should be addressed.
Atmosphere 2021, 12(9), 1150; https://doi.org/10.3390/atmos12091150
Submission received: 3 August 2021 / Revised: 30 August 2021 / Accepted: 1 September 2021 / Published: 7 September 2021

Abstract

:
For animal welfare and for farmers’ health, the concentration of ammonia (NH3) in animal houses should be as low as possible. Plants can remove various atmospheric contaminants through the leaf stomata. This study examined the effect of ornamental plants installed inside a piglet barn on the NH3 concentration in the air. Gas measurements of the air in the ‘greened’ compartment (P) and a control compartment (CTR) took place over two measuring periods (summer–autumn and winter). Differences between the NH3 emissions were calculated based on the ventilation rates according to the CO2 balance. Fairly low mean NH3 concentrations between 2 and 4 ppm were measured. The NH3 emissions were about 20% lower (p < 0.01) in P than in CTR, in summer–autumn and in winter period.

1. Introduction

Ninety-six percent of anthropogenic European ammonia (NH3) emissions originate from agricultural activities [1]. Its release into the atmosphere causes acidification, and its presence in surface water causes eutrophication, which can lead to severe reductions in water quality with subsequent impacts including decreased biodiversity and toxicity effects [2]. Livestock rearing is the main source of NH3 emissions. It accounts for around 75% of the European anthropogenic NH3 emissions in the atmosphere, and pig production, in particular, plays, together with poultry production, a very important role [3]. Pig farms are responsible for approximately 25% of NH3 emissions associated with livestock in Europe [4]. Ammonia is mainly released from the excrements, therefore animal houses and storage systems are the main sources of NH3 emissions in a pig facility [5]. The NH3 concentration in pig barns is considerable, because pigs are mostly intensively bred in warmed up closed structures with forced ventilation and high animal density per square metre [6]. Van der Heyden et al. [7] presented a literature overview of NH3 concentration in various conventional mechanically ventilated pig fattening facilities and reported that NH3 concentration usually ranges from 2 to 87 ppm.
For both animal welfare and for farmers’ health, NH3 concentrations in animal houses should be as low as possible. The maximum concentration of NH3 for long-term exposure (8 h) in animal houses is determined at 20 ppm by European legislation (Commission Directive 2000/39/EC), and for short-term exposure (15 min) at 50 ppm. High NH3 concentrations in animal houses are related to respiratory ailment (e.g., coughing, upper respiratory tract bleeding, excessive secretions, and lung bleeding or inflammation). It can be rapidly absorbed in the upper airways, thereby damaging the upper airway epithelia. At higher concentrations, a certain amount may bypass the upper airways, causing lower lung inflammation and pulmonary oedema. NH3 may also adhere to respirable particulates (<5 µm in aerodynamic diameter) present in animal housing that can reach alveoli and further adversely affect the respiratory function of the lung [8]. Unfortunately, there is still no European legislation defining maximal upper limits of the NH3 concentration in the barn for the animal health, but some countries, such as Germany, have already produced specific legislation for it. The Tierschutz-Nutztierhaltungsverordnung [9] reports that the NH3 concentration in pig barn has to be lower than 20 ppm, in order to protect the animal health and welfare. Several tests, summarised by Wathes et al. [10], showed that weaners were significantly averse to ammonia concentrations of 20 ppm and higher. This is also the NH3 concentration limit for humans indicated by the European legislation, but this could still be too high both for the animals and for the farmers. According to the high risks of chronical and acute diseases of the airways connected to high NH3 concentration in pig barns, Donham et al. [11] have proposed to lower the limits of NH3 concentration in pig buildings to less than 7 ppm for humans and less than 11 ppm for animals.
To maintain a low NH3 concentration in pig barns, different solutions are available. The floor type, the manure management and the pig diet mainly influence the NH3 emissions from pig houses. Frequent removal of manure has been proposed as a measure to diminish the release of emissions from pig buildings. The efficiency of protein use by pigs depends on the dietary composition and the physiological status or the growth stage of the animals [12]. The main dietary strategy proposed for the abatement of pollutant gas emissions is the manipulation of the levels of crude protein (influencing NH3 and N2O) and fibre content (influencing CH4 and CO2) in the diet; moreover, several dietary additives have also been studied in particular for their impact on NH3 emissions [13]. The climatic conditions inside the building also affect the emission levels.
Integrating green plants into animal barns could be an innovative system to mitigate high gas concentrations and to create a pleasant environment both for the animals and for the farmers. Several authors have discussed the capacity of plants to remove various atmospheric contaminants through the leaf stomata [14,15,16]. The absorption through the stomata proceeds in the following sequence: (a) the gas goes into the leaves through the stomata, (b) the gas in the air space in the stomatal cavity dissolves in the aqueous phase of the cell wall matrix, (c) the gas in the aqueous phase reacts with the leaf components. The gas flux into leaves may also be controlled by reactions with cuticular components [17]. The absorption capacity is confirmed for both inorganic and organic compounds [17,18]. In particular, in the group of inorganic compounds that can be absorbed by leaf plants, several gases such as O3, SO2, Cl2, HF [15] and nitrogenous compounds such as NH3 and N2O are listed [19,20,21]. Grundmann et al. [19] analysed the capacity of maize leaves to uptake NH3 from the air and accumulate it in storage compartments, where it is successively metabolised. This uptake mechanism might also change the modelling approach of gas uptake based on passive diffusion. The potential uptake rate they measured was 0.392 mg NH3-N dm−2 h−1. In this study, they also observed that the uptake took place mainly during daylight when the stomata are open. Porter et al. [22] showed that maize leaves could absorb gaseous NH3. Hutchinson [23] monitored the disappearance of NH3 from an airstream flowing through a small chamber containing a single plant seedling and calculated the amount absorbed by the plant as the difference of the amount of NH3 in the inflow and outflow. Their results indicated that plant leaves absorb NH3 from the air and determined that the NH3 uptake rate of soybean was 4.2 µg dm−2 h−1 and that of corn was 5.6 µg dm−2 h−1. Rogers and Aneja [21] also confirmed that plant leaves are a sink for atmospheric NH3. They further observed that the rates at which this absorption occurs is influenced by NH3 concentration (0.20–0.45 ppm), light (0–40,500 lux) and temperature (22–26 °C). In the present study, the effect of different ornamental plants on NH3 concentration in a piglet barn was investigated. The study was carried out in two different seasonal conditions, summer–autumn and winter.

2. Materials and Methods

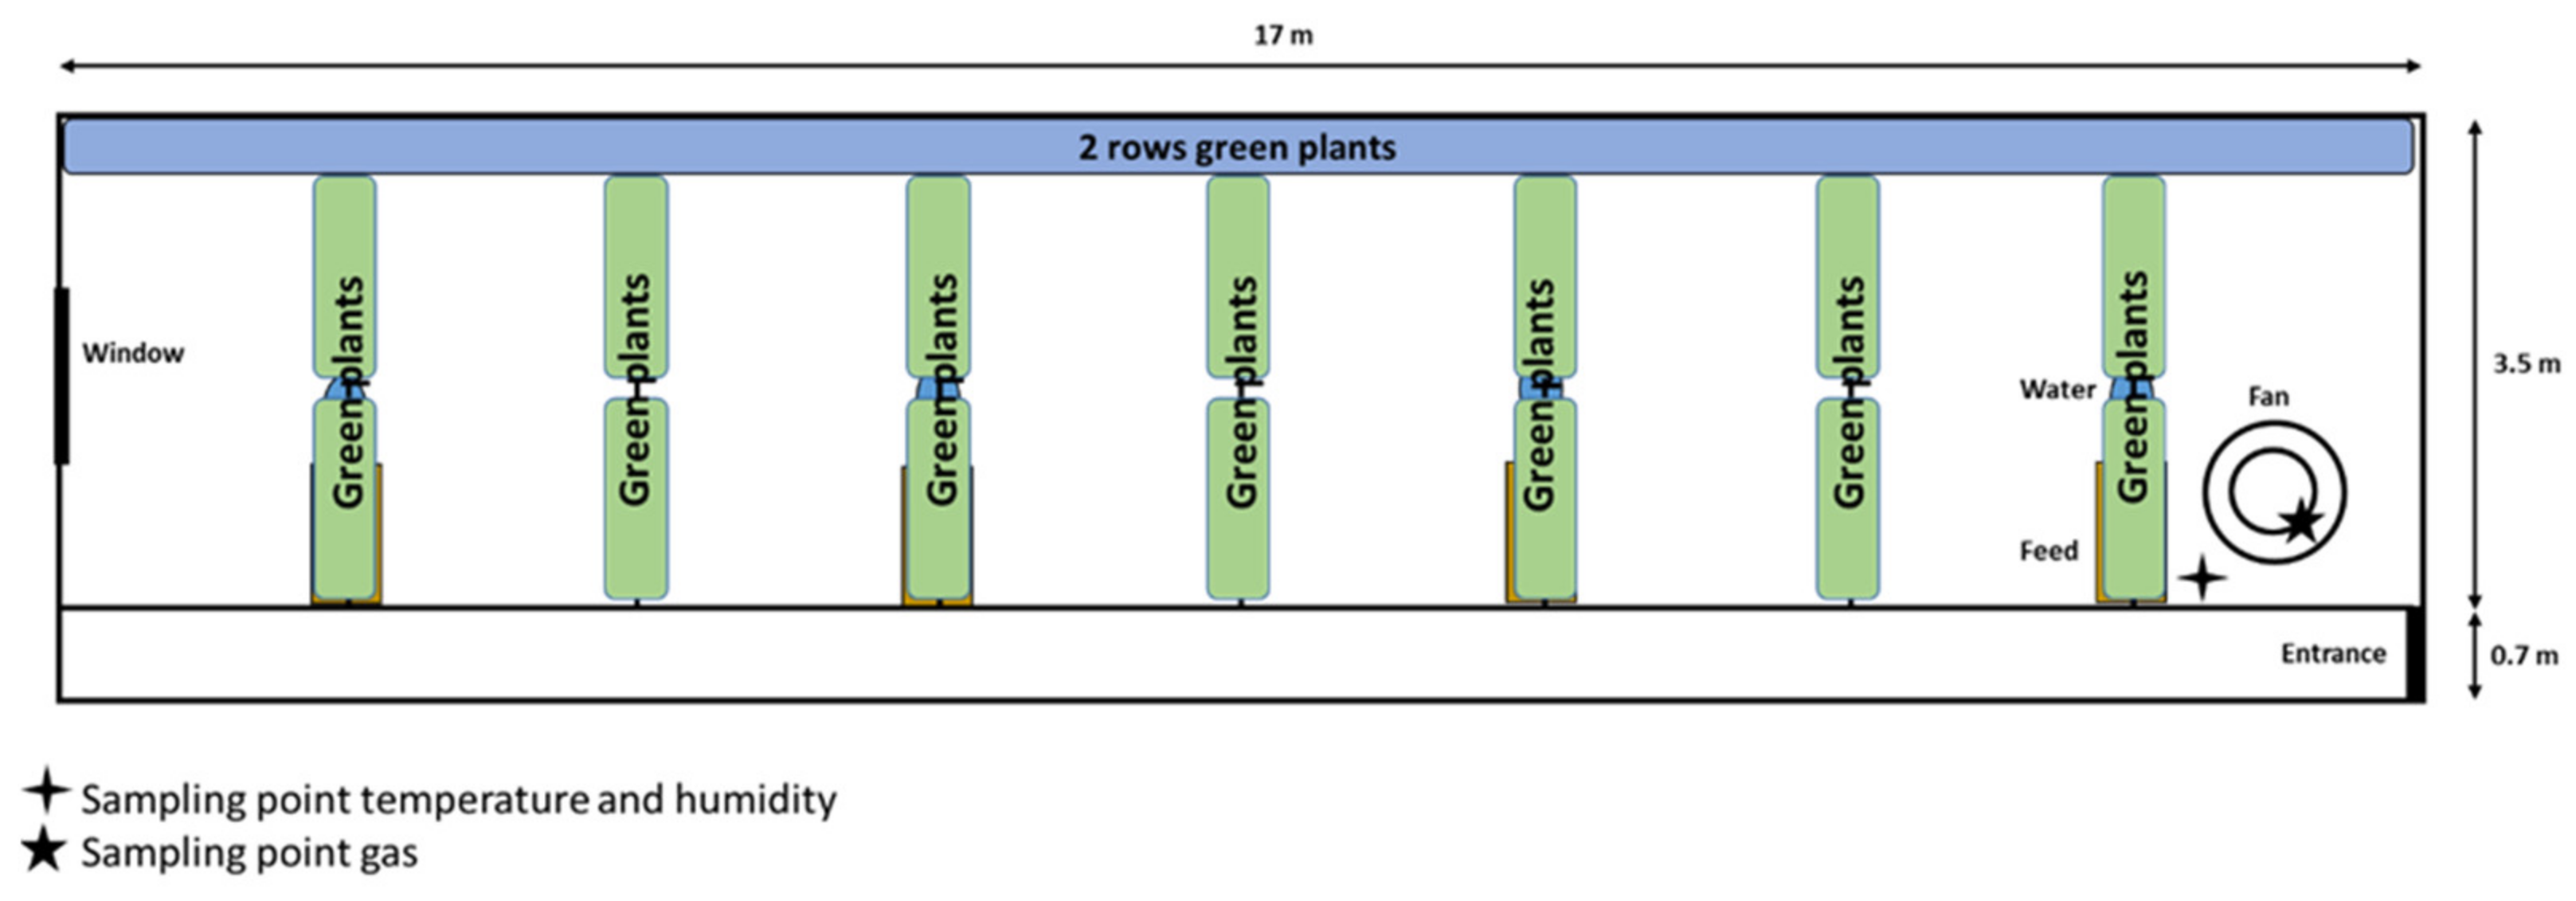
2.1. Pig Barn Description

The study took place in a commercial pig farm (under real production conditions) located in Brandenburg (Germany), where sows, piglets and fattening pigs are bred for meat production. In one animal house, two separate compartments dedicated to the rearing of piglets were selected for the measurements. Each compartment had the dimensions of 4.2 × 17 m (W × L) and height (H) of 2.6 m with plastic slatted floor (Figure 1). Each compartment was divided in eight pens and had a corridor of 0.7 × 17 m (W × L) to access the pens. On one of the two shorter sides of the compartments, there was the entrance and on the other one, there was a window. The window was closed and not used for ventilation. In each pen, there was a heated area for the piglets on the opposite side of the corridor. The ceiling of the barn was covered with wood wool lightweight panels with a porous surface. Fresh air was able to stream into the barn through slots below the roofing, passing the roof insulation and the wood wool lightweight panels. The air of each compartment was extracted through a centrifugal fan with a diameter of 0.6 m (Modell CD606 produced by Echberg, Denmark), located on the barn ceiling 2 metres away from the entrance. The fan activities, as well as the temperature, were regulated according to the animal age by an automatic, electronic system. On the wall close to the piglets at a height of about 150 cm above the floor, there was an additional electric heater for each pen, which could intervene in case of very low temperatures in winter. There was not any additional cooling system. The pig slurry was collected in separate pits underneath the slatted floor. At the end of each growing period, the slurry tanks were emptied, and the compartments were completely cleaned and disinfected. Homogeneous groups of piglets were set up and two growing periods were analysed, summer–autumn (Experiment 1) and winter (Experiment 2).
The piglets were fed ad libitum with an automatic dry-meal feeding system refilled twice a day, at 7:00 a.m. and at 12:00 a.m. The feed quality and quantity were maintained according to the age of the animals. At the beginning and at the end of the growing period all pigs were weighed, the number of dead pigs was regularly recorded. In the first experiment, 148 piglets (4 weeks old) were placed in the compartment with plants (P) and 147 in the control (CTR), about 18–19 piglets per pen (0.4 m2 per animal). For the second experiment only 88 piglets were placed in each compartment, 11 piglets per pen (0.7 m2 per animal). The animals stayed in the compartments for the entire growing period of 8 weeks.

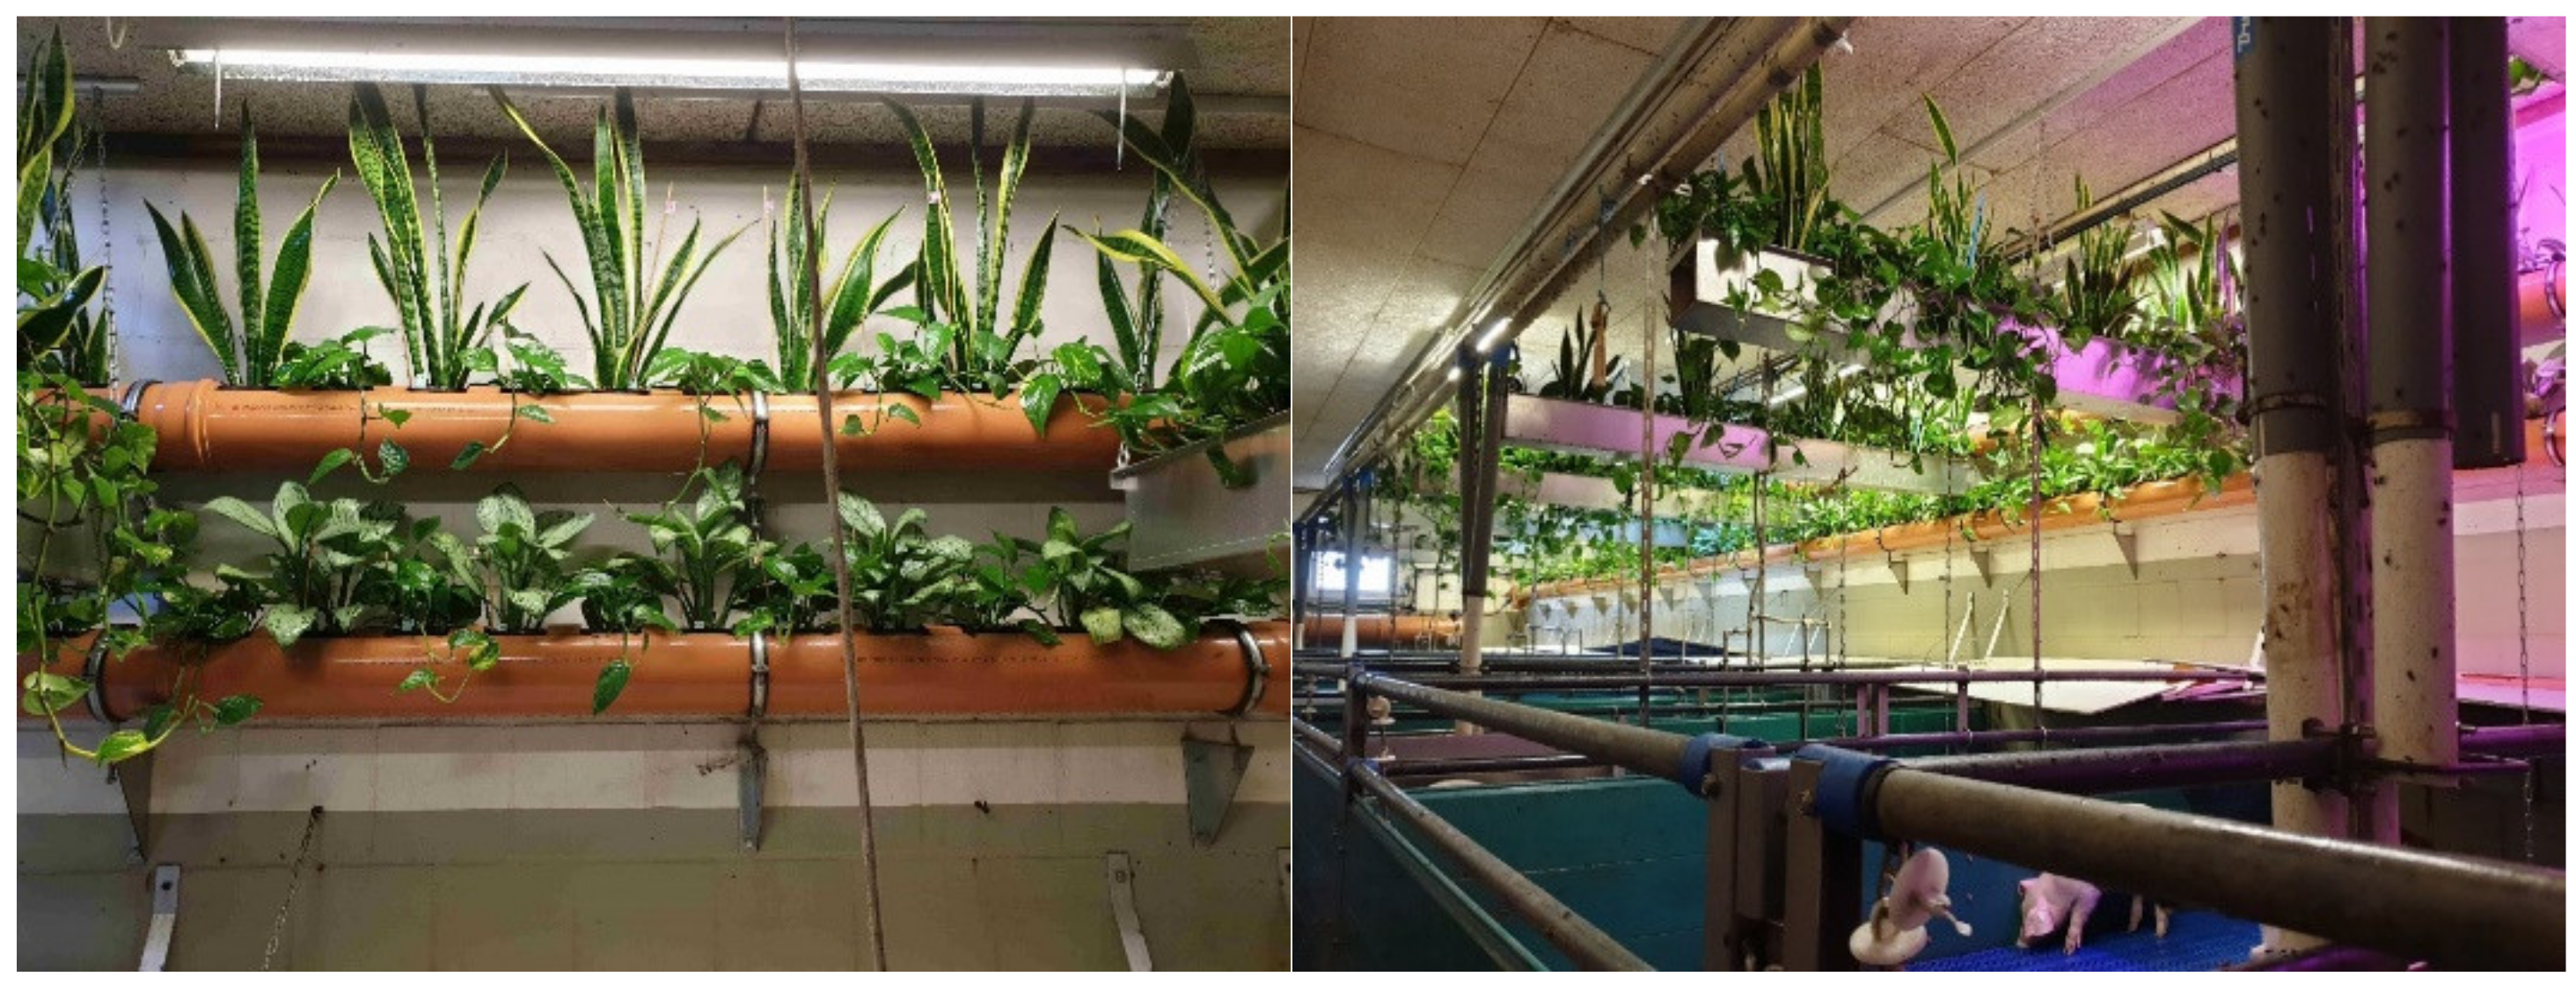
2.2. Description of Green Plant Structure and Management

In one of the two compartments (P) a selection of ornamental plants was hung up in two rows of ready-made pipes with holes on the wall above the heating system (75 cm and 120 cm below the barn ceiling), high enough so that the animals cannot reach the plants. Square pots with a side length of 11 cm were placed in the tubes (Figure 2) and accurately fit and closed with them. The plants were introduced in the compartment P at the beginning of the piglet growing period and remained in the compartment till the end of the piglet growing period for a total of 8 weeks. Another compartment (CTR) without plants was used as control. In the control compartment neither plants nor plant structure were introduced.
The plants were watered by flooding the system four times a day. The water tank (250-L capacity) contained liquid fertiliser (Wuxal super 8-8-6, Hauert MANNA Düngerwerke GmbH, Nürnberg, Germany). The fertiliser was added at the beginning of the experiment directly into the water reservoir (250 mL Wuxal super 8-8-6, pH: 7.23, ec: 1.25 mS). The fertilised solution passed through the upper tube and then into the lower one and back into the reservoir. The ornamental plants were cultivated in a hydro substrate composed of round expanded clay, with a diameter between 4 and 8 mm (CN Hydro, Green Line, CN Consulting, Geesthacht, Germany). To guarantee appropriate lighting for the plants, 1.5 m long neon tubes (Philips Master TL-D, 58 W/840) were installed over the length of the first six pens starting from the window. In the last two pens, closer to the entrance, 1.5 m LED lights were installed (19 W/840, 4000 K). Three additional 1.5-m-long neon tubes (Philips Master TL-D, 58 W/840) were installed longitudinally in a central position between the first two pens, between the central ones and between the last ones. The illuminance varied between 340 and 1480 Lux in the compartment and the values reduced with the distance from the artificial lights. Lower illuminance values were also measured close to the window.
In the first experiment (summer–autumn period) 175 plants were introduced in the whole compartment, 88 in the upper tube and 87 in the lower one. The plants were a mixture of the following cultivars: Chlorophytum comosum, Tradescantia zebrina, Aglaonema commutatum ‘Maria Christina’, Spathiphyllum floribundum, Epipremnum aureum, Mühlenbeckia complexa, Peperomia rotundifolia, Dypsis (Chrysalidocarpus) lutescens and Dieffenbachia seguine.
In the second experiment (winter period) the number of plants in compartment P increased, but the number of cultivars was reduced, selecting those that were better able to adapt to the conditions in the barn and a new cultivar was also introduced. The plant cultivars selected for the second experiment were: Sanseveria trifasciata ‘Laurentii’, Epipremnum aureum, Aglaonema commutatum ‘Maria Christina’. The additional plants were installed in 14 flower boxes between the eight pens, each of them 120 cm long. Each box contained six plants adding 84 plants to the original amount. Thus, in the second experiment (winter) compartment P contained a total of 259 plants.

2.3. Measurement of Air Parameters

Inside and outside temperature (T) and relative humidity (RH) were measured every 5 min throughout the entire growing periods using portable temperature/humidity loggers (Hobo® Pro v2 logger, internal T/RH, Model U23-001, Onset Computer Corporation, Bourne, MA, USA) in both compartments and outside the building. The sensor accuracy for T and RH were, respectively, 0.2 °C over 0 °C to 50 °C and ±2.5% from 10% to 90% RH (typical), to a maximum of ±3.5%. The sensor resolution for T and RH were respectively 0.02 °C at 25 °C and 0.03%. The T and RH sensors were placed at a distance of one metre from the centrifugal fan at a height of approximately two metres, in order to measure the temperature and the humidity of the exhaust air very close in place and time to the gas concentration measurements. The gas concentrations in compartment CTR and P were measured continuously for a period of two weeks at the end of the growing period. During this period, with the higher body mass of the animals and thus an expected higher emission rate, possible differences should be detectable. The gas (CO2 and NH3) concentrations indoor and outdoor were measured by means of a Multicomponent FTIR Gas Analyzer (GASMET CX4000 FTIR Gas Analyzer, Gasmet Technlogies Oy, Helsinki, Finland). The limit of detection for NH3 was given by the manufacturer with 0.1 ppm. The FTIR Gas Analyzer had a combined standard uncertainty of 0.49 mg m−3 (0.65 ppm), certificated for the range of 0 to 15 mg NH3 m−3 [24]. It was calibrated with different calibrating gases containing 500 ppm CO2, 0.5 ppm, 3 ppm and 5 ppm NH3, respectively. The exhaust gas concentrations were measured below the fan at a height of approximately 2 m above the floor; the incoming air was sampled from the space between the barn ceiling and the roof. The incoming and the exhaust air was sampled consecutively for both compartments (inlet CTR–exhaust CTR–inlet P–exhaust P), with 5 repetitions, respectively, resulting in a measuring interval of 5 min. To evaluate the effect of the external temperature on the ventilation rate (VR), the measurements were carried out in two different periods of the year, summer–autumn (experiment 1) and winter (experiment 2).

2.4. Estimation of Ventilation Rate and Gas Emission Rate

Due to the not practicability to directly measure the ventilation rate in both compartments (CTR and P), the ventilation rates were calculated using the CO2 balance. For the CO2 balance the direct (respiration) and indirect (manure and other activities) CO2 emissions from the piglets were considered. The influence of the plants on the CO2 was neglected, because according to the literature, the net CO2 uptake from the plants (5–20 kg m−2 per year) is negligible compared to the large amount of CO2 that is emitted from the animals (around 350 kg CO2 per year) [25,26]. The ventilation rate (VR) was calculated according to Dong et al. [27]:
VR = V CO 2 × 10 6 [ CO 2 e [ CO 2 i
where
VR = ventilation rate (m3 h−1)
VCO2 = specific CO2 production rate of the pigs (m3 h−1)
[CO2]e, [CO2]i = CO2 concentrations of the exhaust and inlet air, respectively (ppm).
106 = conversion of kg to mg.
According to Van Ouwerkerk and Pedersen [28] the difference in CO2 concentration between exhaust air and inlet air should be greater than 200 ppm for the application of the CO2 balance method, in order to minimise the margin error. As determined by Liu et al. [29], this approach can be used for VR estimation also with lower differences between exhaust and inlet air (down to > 50 ppm) with a margin error of less than 20%. In our study, the difference between exhaust and inlet air was always higher than 150 ppm CO2.
As reported in Van Ouwerkerk and Pedersen [28], the CO2 production of the pig barn could be expressed using the indirect calorimetry relationship between total heat production (THP), CO2 production, and respiratory quotient (RQ), and adjusting for environmental temperature effects and CO2 production from manure, which accounts for 4% of the total production:
V CO 2 = 0.0036 × f c × THP × N × 273 16.18 RQ + 5.02 × T i + 273 × K m ,   CO 2
where
THP = total heat production rate of the piglet (W pig−1)
fc = correction factor for diurnal CO2 production (fc = 1 for this study)
N = number of piglets in the barn
RQ = respiratory quotient (RQ = 1 for this study)
K m ,   CO 2 = multiplication factor representing the increase of CO2 production from manure and other activities ( K m ,   CO 2 = 1.04 for this study)
Ti = inside air temperature (°C).
To calculate piglet THP, the piglets (>20 kg body mass) were considered as fattening pigs, as recommended in CIGR [30]. THP values at 20 °C were calculated using the following equation:
THP = 5.09 × m 0.75 + 1 0.47 + 0.003 × m × ( n × 5.09 × m 0.75 5.09 × m 0.75 )
where
m = piglet body mass (kg) and n represents the daily feed energy intake, expressed as n times the maintenance requirement.
As the body mass of the piglets was only recorded twice at the beginning and the end of the growing period, respectively around the 4th and 12th week of the piglet’s life, the body mass of the piglets during the entire growing period was estimated for both groups (CTR and P) by means of pig growing curves calculated by Carr [31]. The value n was also estimated according to the data reported by CIGR [29] and Brown-Brandl [32].
The temperature measured inside the compartments was normalised to the reference temperature of 20 °C by the following equation [27]:
K T H P = 12 × 10 3 × 20 T i + 1
The determined NH3 emission rate (ERNH3) represents the amount of NH3 emitted from one piglet per unit of time. The ERNH3 was calculated from the hourly mean NH3 concentrations and the corresponding calculated VR [27]:
ER NH 3 =   VR × ( NH 3 e NH 3 i ) × δ NH 3 N
where
ERNH3 = emission rate of the gas (mg h−1 pig−1)
δNH3 = NH3 density (kg m−3)
N = number of piglets in the compartment
[NH3]e, [NH3]i = ammonia concentration in the compartment exhaust and inlet air (ppm).

2.5. Statistical Analysis

All data analyses were performed on the hourly averages with JMP 14.0 (SAS Institute Inc., Cary, NC, USA). The Kolmogorov–Smirnov test showed that the data were not normally distributed (p < 0.05); therefore, the data were transformed as Log, in order to apply parametrical statistical procedures. One-way analysis of variance (ANOVA p < 0.01) was applied to evaluate the effect of the plants on the gas concentration in the pig barns and to investigate the effect of different factors on it. The ‘Levene test’ was previously carried out to confirm the homogeneity of the variances. The final body mass of the piglets was compared through a student t-test (p < 0.05)

3. Results and Discussion

3.1. Piglet Body Mass Gain and Mortality during the Entire Growing Period

3.1.1. Experiment 1, Summer–Autumn

At the beginning of the growing period, two homogeneous groups of piglets, composed of 147 animals with a mean body mass of 6.5 kg an−1, were introduced in compartment CTR (Table 1) and 148 piglets with a mean body mass of 6.3 kg an−1 in compartment P. The animals stayed in the two compartments for eight weeks under the same conditions, except for the presence of the plants and the artificial light in P.
During the eight weeks, six dead animals were registered in each of the barns. The mortality rate was about 4% and consistent with data present in literature [33]. In CTR six piglets died in the last two weeks of the growing period, whereas in P most of the deaths occurred during the first week, the adaptation period. The death of piglets during the first week of rearing is not surprising and can occur quite often, on the contrary the death of piglets at the end of this rearing period is uncommon and usually related to environmental factors [34]. Differences in the body mass gain of the piglets between compartment CTR and P were also observed. At the end of the growing period the piglets in P (32.1 kg an−1) were heavier (p < 0.05) than in CTR (30.2 kg an−1), although at the beginning of the growing period the animals in P were slightly lighter than in CTR. The general growth of the piglets in compartment P appeared more efficient than in CTR.

3.1.2. Experiment 2, Winter

In the winter period smaller groups of piglets were introduced in the compartments, only 88 piglets per compartment, but the mean body mass of the piglets at the beginning of the growing period was slightly higher than in experiment 1, 6.9 kg an−1 in both groups.
Additionally, in experiment 2, at the end of the growing period the mean body mass of the piglets in the compartment with the plants showed a higher final mean body mass (p < 0.05), at 33.1 and 31.2 kg an−1 in P and CTR, respectively. Moreover, the mortality in CTR was higher than in P. During the entire growing period only three piglets died (3.4%) in P, but eight died in CTR (9.1%). All the deaths occurred in the first 4 weeks of the growing period.
In barn P, a slightly higher RH occurred, due to the presence of the plants, but it did not affect the growth and the health of the piglets, because it did not exceed the normal values for the piglet growing, based on the reports of other studies [35].

3.2. Gas Concentration and Ventilation Rate during the Last Two Weeks of the Growing Period

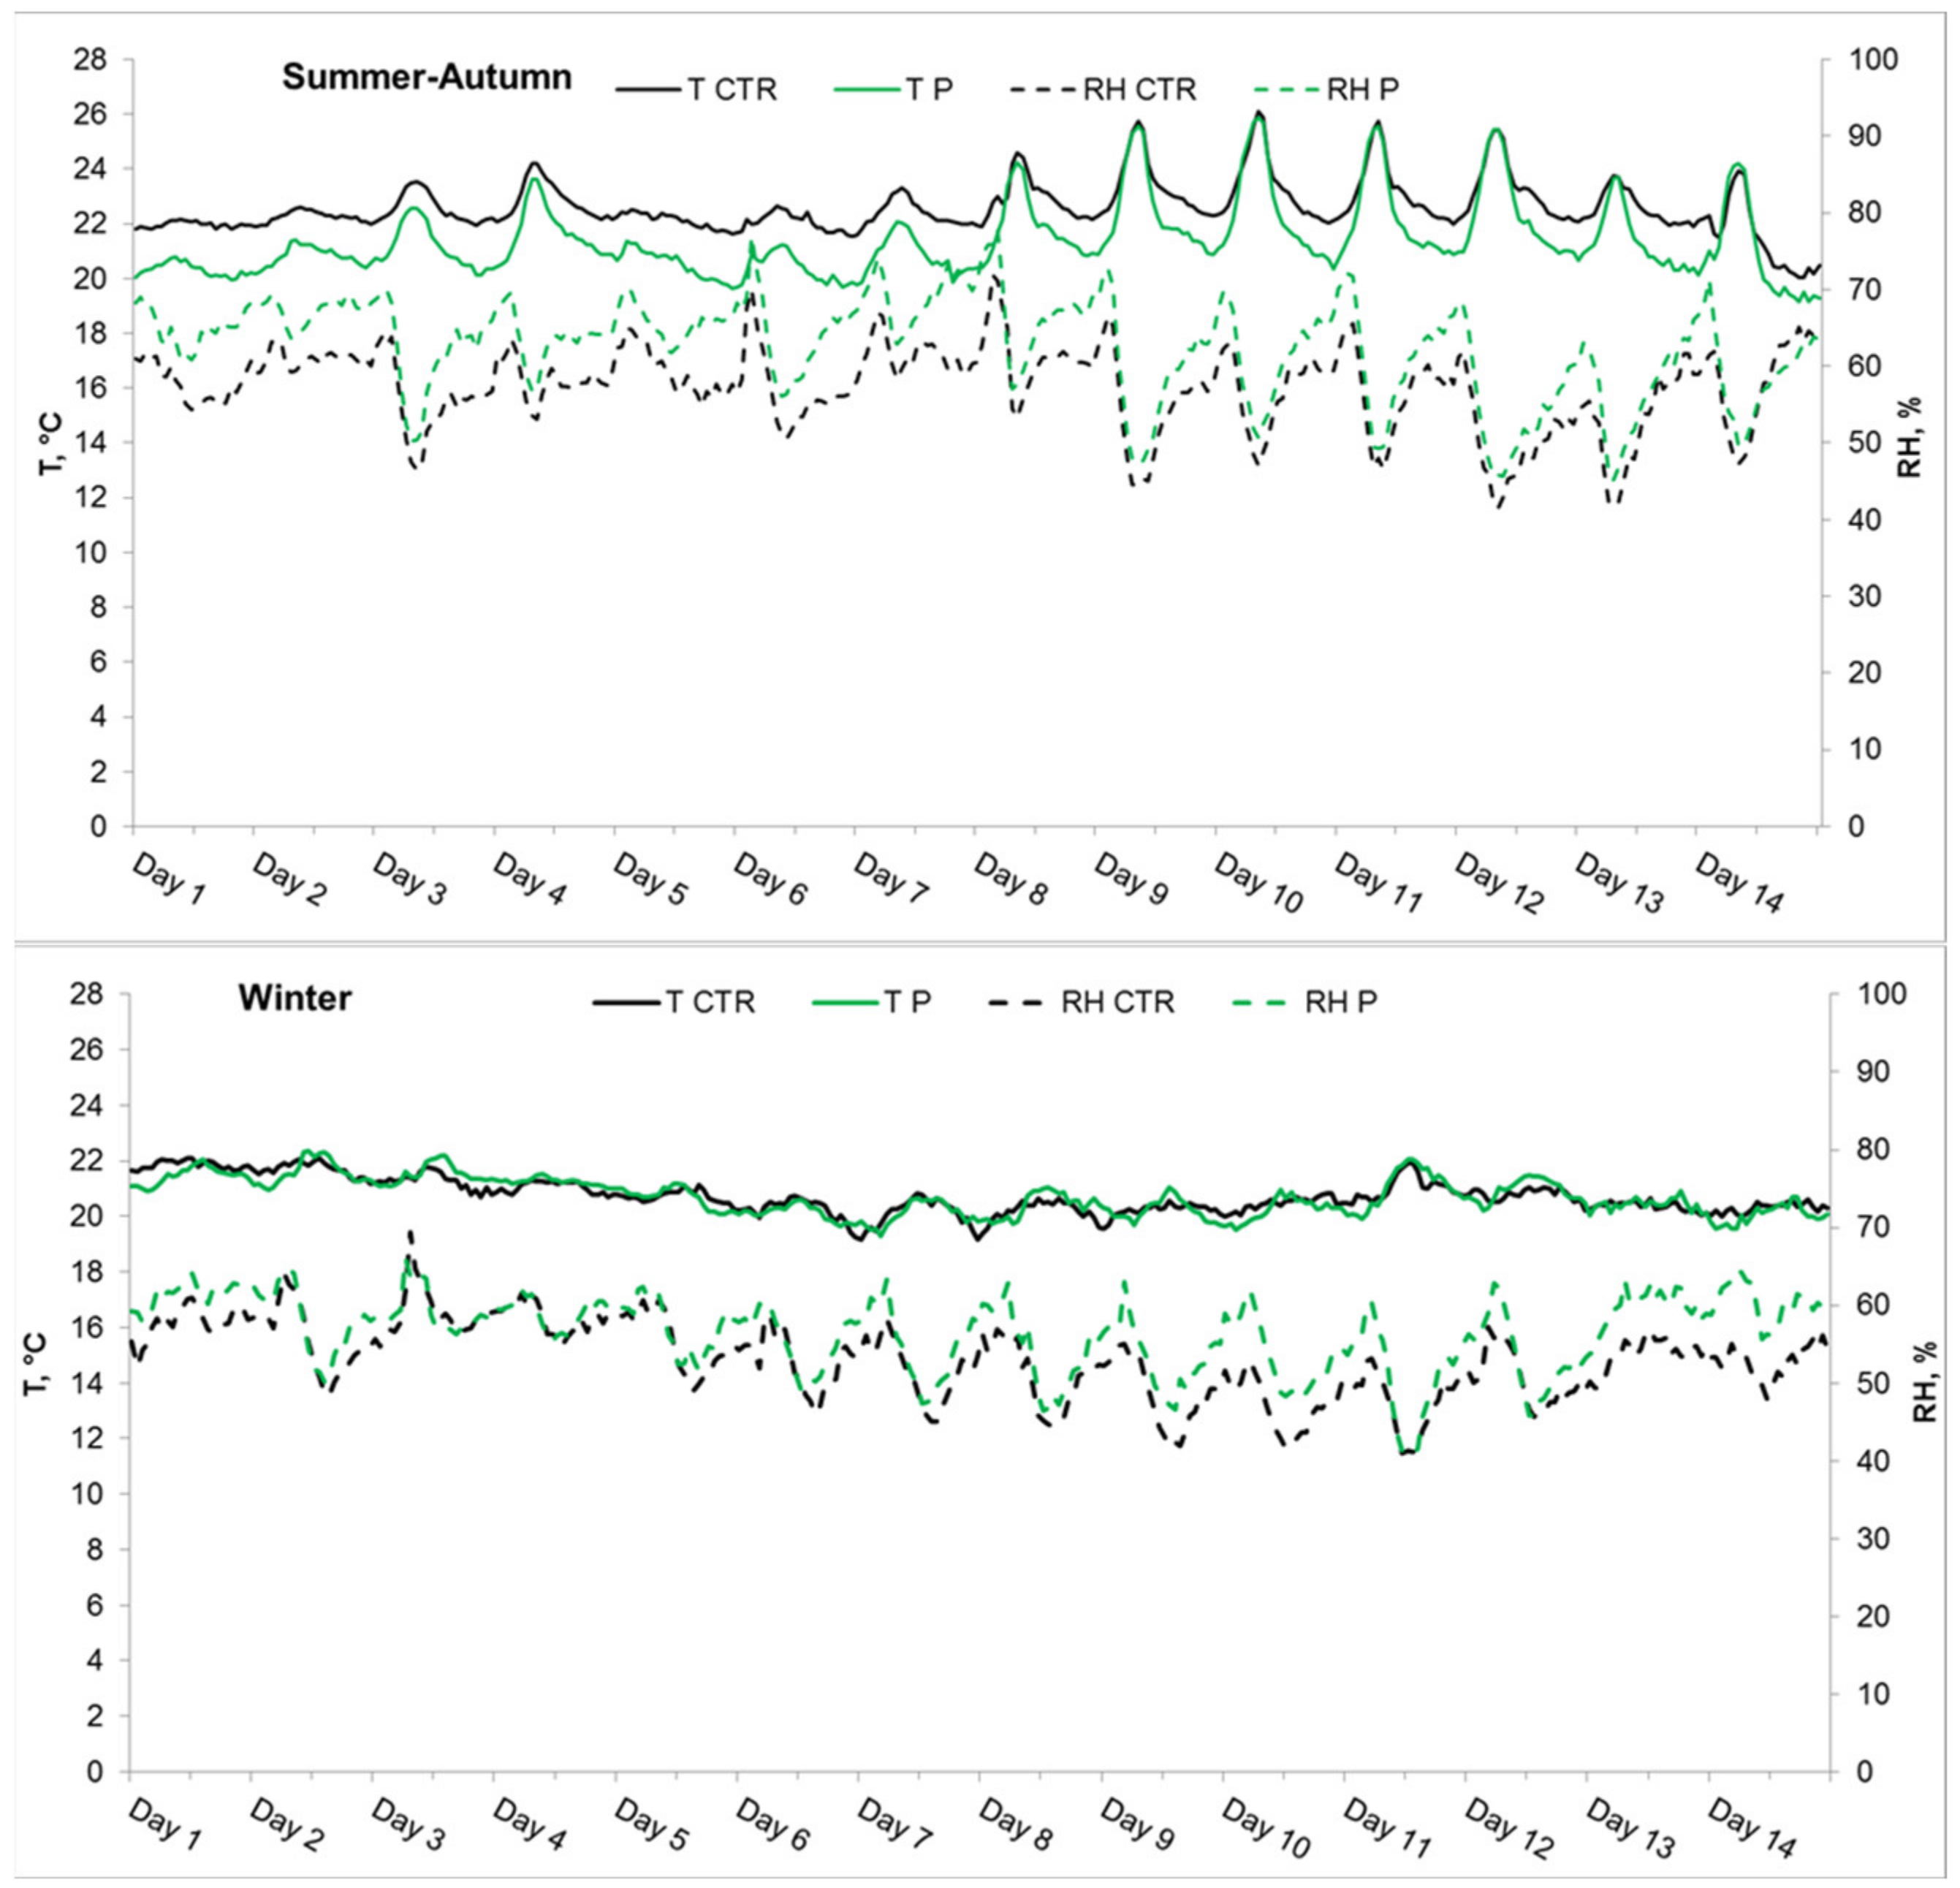
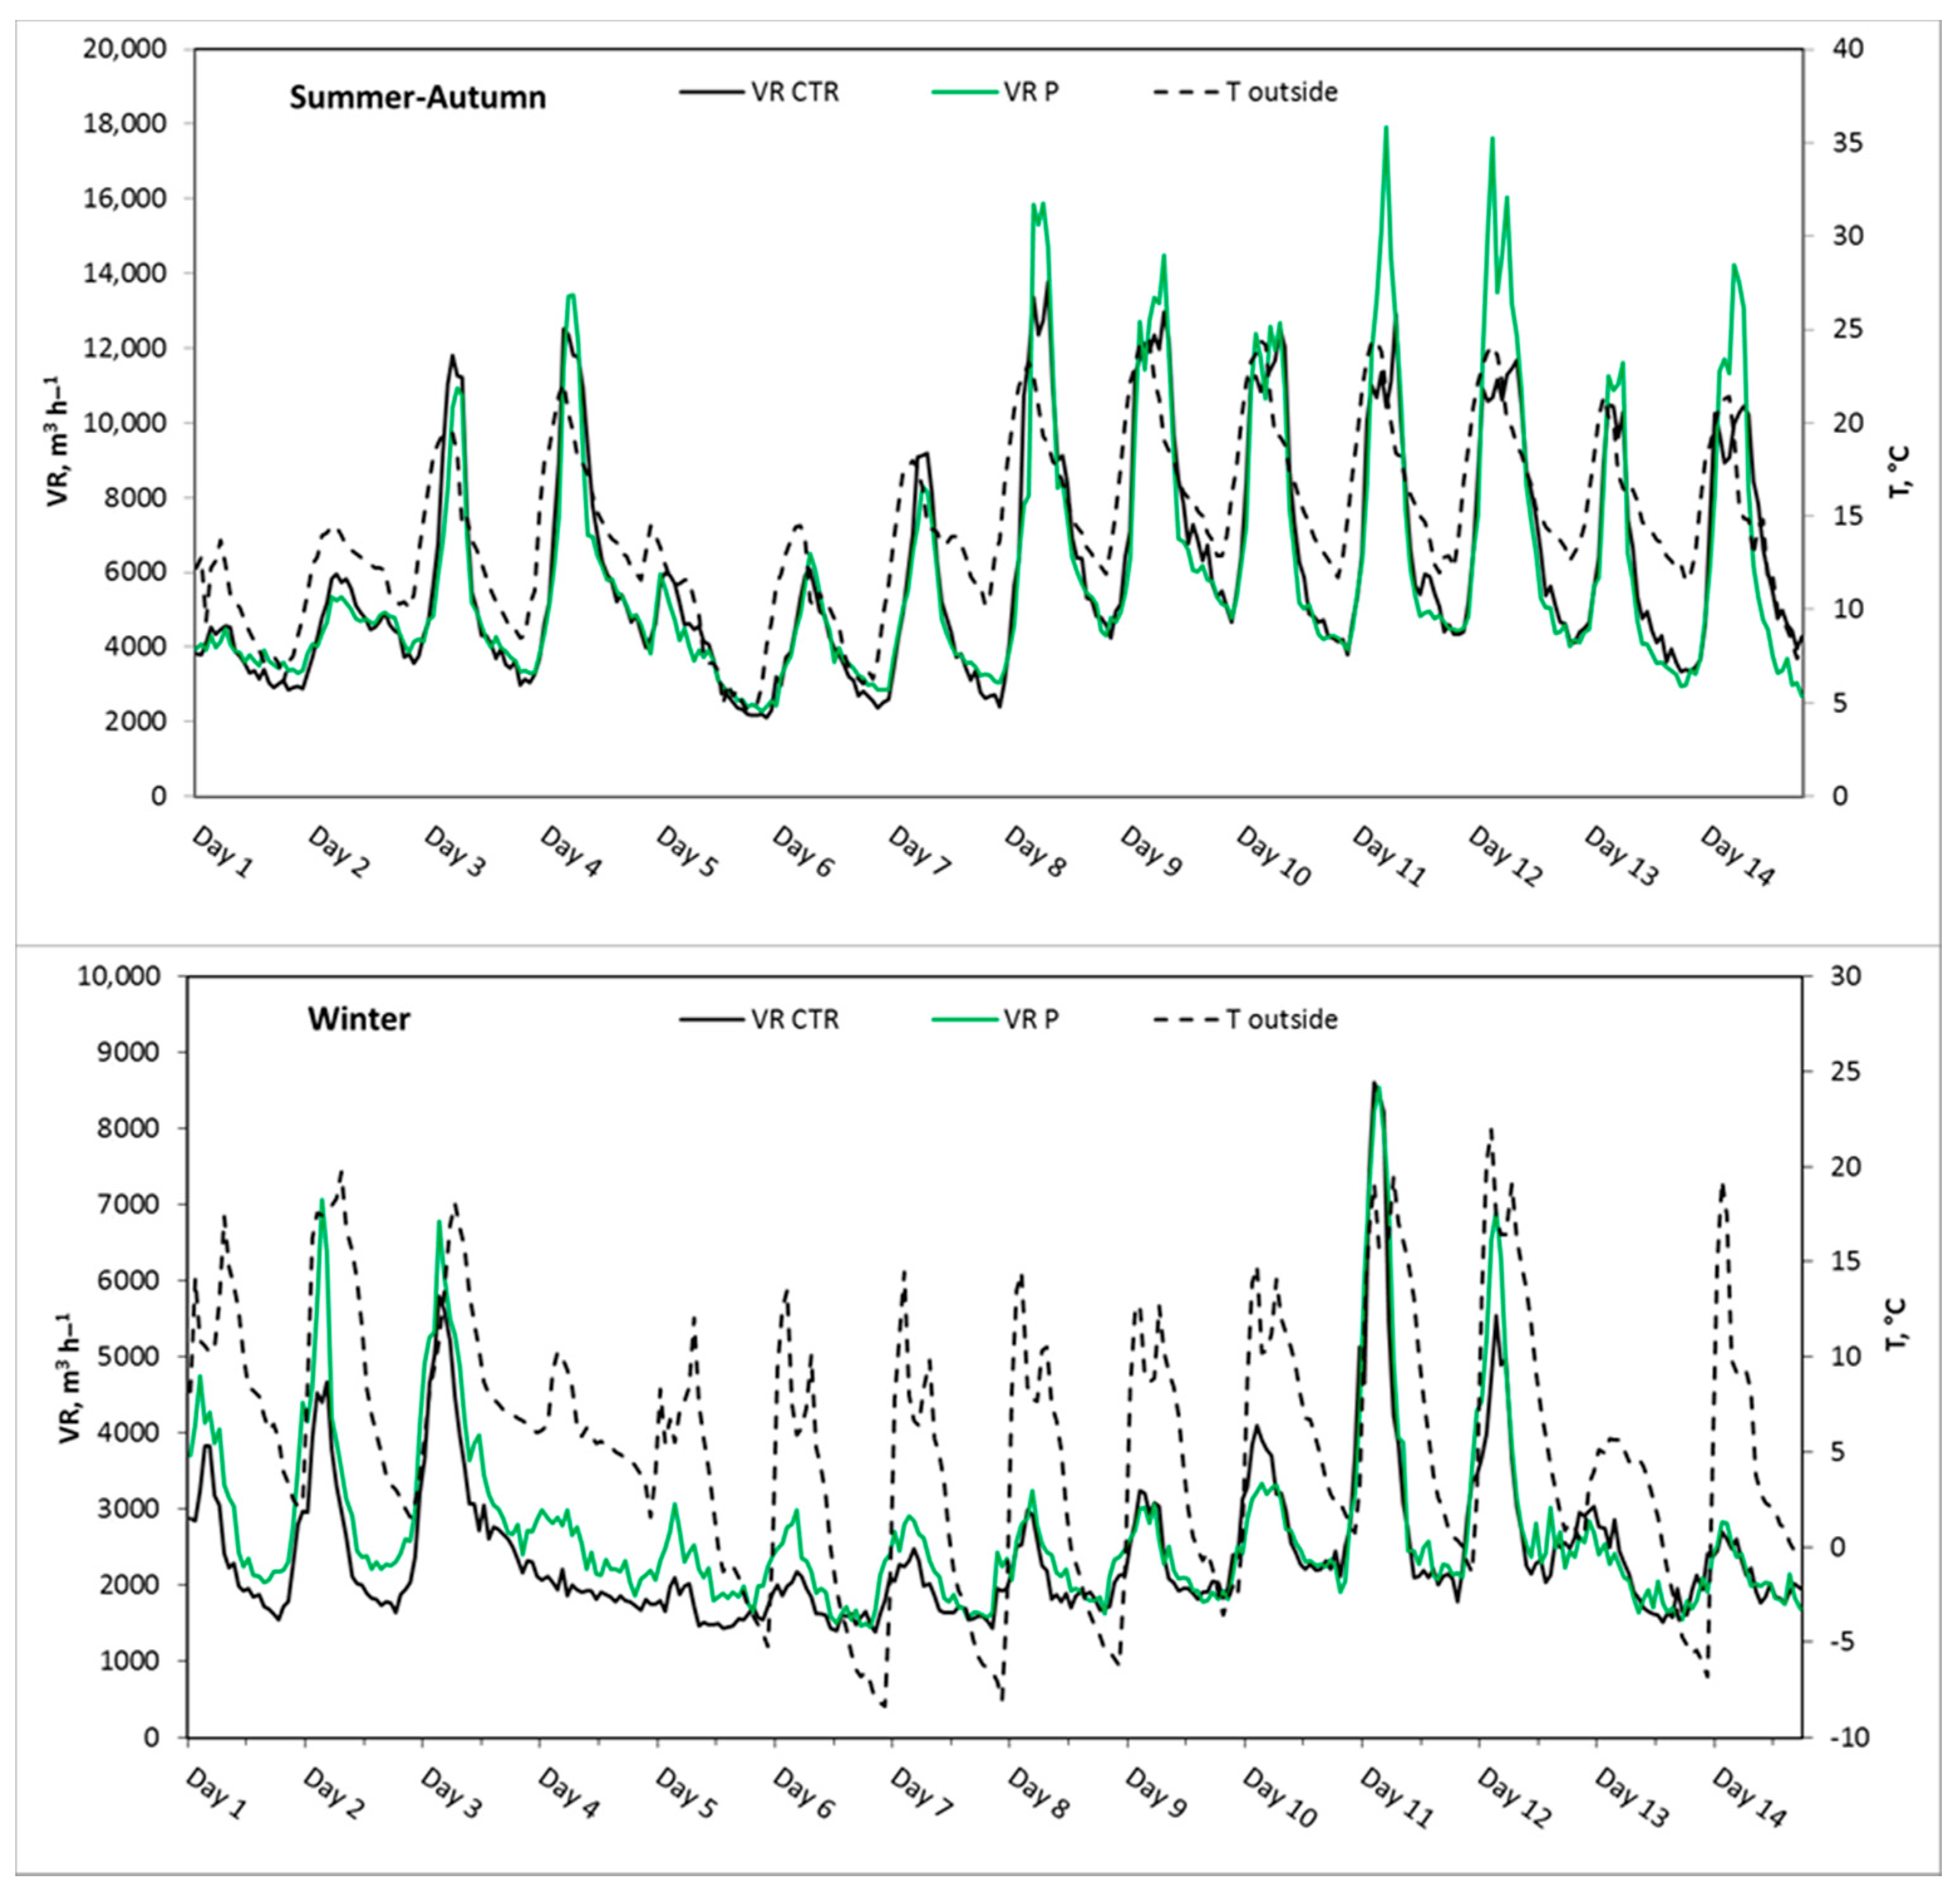
3.2.1. Experiment 1, Summer–Autumn

T and RH showed the same trend in both compartments (CTR and P), with higher temperatures and lower humidity during the days and lower temperatures and higher humidity during the nights (Figure 3). The mean temperature in CTR (22.6 °C) was slightly higher than in P (21.4 °C) (Table 2). According to the recommended temperatures for piglets at the end of the rearing period, the temperatures were a little bit higher, but still within a comfortable range for the animals [35]. The humidity, measured near the ventilation fan, ranged between 42 and 72% in CTR and between 45 and 78% in P. The transpiration of the plants and, in parts a slight evaporation of the water remaining in the plantation system, may explain the higher humidity in barn P [36,37]. RH and T values in this range are within the recommended range for pigs [35,38]. For the plants these levels of temperature and humidity were also suitable for their growth [39].
As determined by the CO2 balance, the VR varied throughout the whole day, with higher VR during the daytime and lower VR at night (Figure 4), following the external temperature. The mean ventilation rate in summer–autumn was similar in the two compartments, 6050 m3 h−1 and 6060 m3 h−1 (about 33 air changes per hour, ACH), respectively in CTR and in P. The recommended ventilation rate for pigs in summer reported by Pluske et al. [40] is 2.10 m3 h−1 per kg pig. According to the body mass of the piglets in the last two weeks of the rearing period (from 23 to 32 kg) this would result in 48–67 m3 h−1 per piglet. The ventilation rate per animal was approximately 43 m3 h−1 per piglet in both compartments in our study. This was lower than the value recommended by Pluske et al. [40], but still in a normal range, considering that the measurements were carried out in summer–autumn. Furthermore, lower yearly mean values of approximately 30 m3 h−1 per piglet have also been reported in the literature [41].
Ni et al. [42] reported CO2 concentrations between 2000 and 2300 ppm in a pig fattening barn and van der Heyden et al. [7] found a wider range between 1000 and 5000 ppm in a review of pig farms in Europe. The CO2 concentrations in the compartments were in a normal range, according to the age and the body mass of the piglets and far below the critical limit fixed by the legislation for the farmers (5000 ppm) (Commission Directive 2006/15/EC) and the ones fixed for the pigs, as reported in the German legislation for the animal welfare (3000 ppm) [9]. Moreover, the low animal density per square metre and the forced ventilation operating all day and night contributed to maintain these low values. The NH3 concentrations were low, but within a normal range regarding the body mass and the number of the animals [7,43] and very far from the critical limit defined by legislation. The NH3 concentration was about 17% lower (p < 0.01) in the compartment with plants (P) compared to the one without plants (CTR), with values of around 2.0 ppm and 2.4 ppm, respectively. Due to the quite low NH3 concentration in the two compartments, an uncertainty of measurement is to be expected in the range of this difference. This assessment is supported by experience from our own measurements, as well as other tests and studies [24,44].

3.2.2. Experiment 2, Winter

In winter the temperature variation in the compartments between day and night was lower compared to the summer–autumn period. This was due to the fact that no cooling device was installed, and temperature regulation was achieved by ventilation rate only. The temperature in both compartments during the entire winter period ranged between 19 and 22 °C and the humidity values between 40 and 70%. The humidity in winter was also higher (p < 0.01) for the entire period in P (56.4%) compared to CTR (53.0%).
During the winter experiment the number of plants in compartment P increased by 50%, in order to improve their impact on gas mitigation. Due to the farm management, the number of piglets in the compartments changed; the winter experiment started with only 88 animals per compartment.
The ventilation rate was lower than in summer–autumn, because of the lower external temperatures and the reduced number of animals, and differed in the two compartments, 2390 m3 h−1 in CTR and 2670 m3 h−1 in P, although the internal temperatures were the same in both compartments. Pluske et al. [40] reported 1.60 m3 h−1 per kg pig as recommended ventilation rate for the wintertime in pig barns. According to the body mass of piglets in our study in the last two weeks of the rearing period this results in a ventilation rate of 35–53 m3 h−1 per piglet. The ventilation rate per animal was approximately 31 m3 h−1 per piglet in both compartments in our study. Zimmerman et al. [41] indicates lower values, about 23 m3 h−1 for piglet. Despite the reduced number of animals in the compartments, CO2 and NH3 concentrations were higher than in summer–autumn. This is explained by the lower ventilation rates. The CO2 concentration was slightly less than 1200 ppm in both compartments and the NH3 concentration was 4.0 ppm and 3.2 ppm, respectively, in CTR and P. As in the first experiment, also in the second experiment the ammonia concentration in compartment P was lower than in CTR.

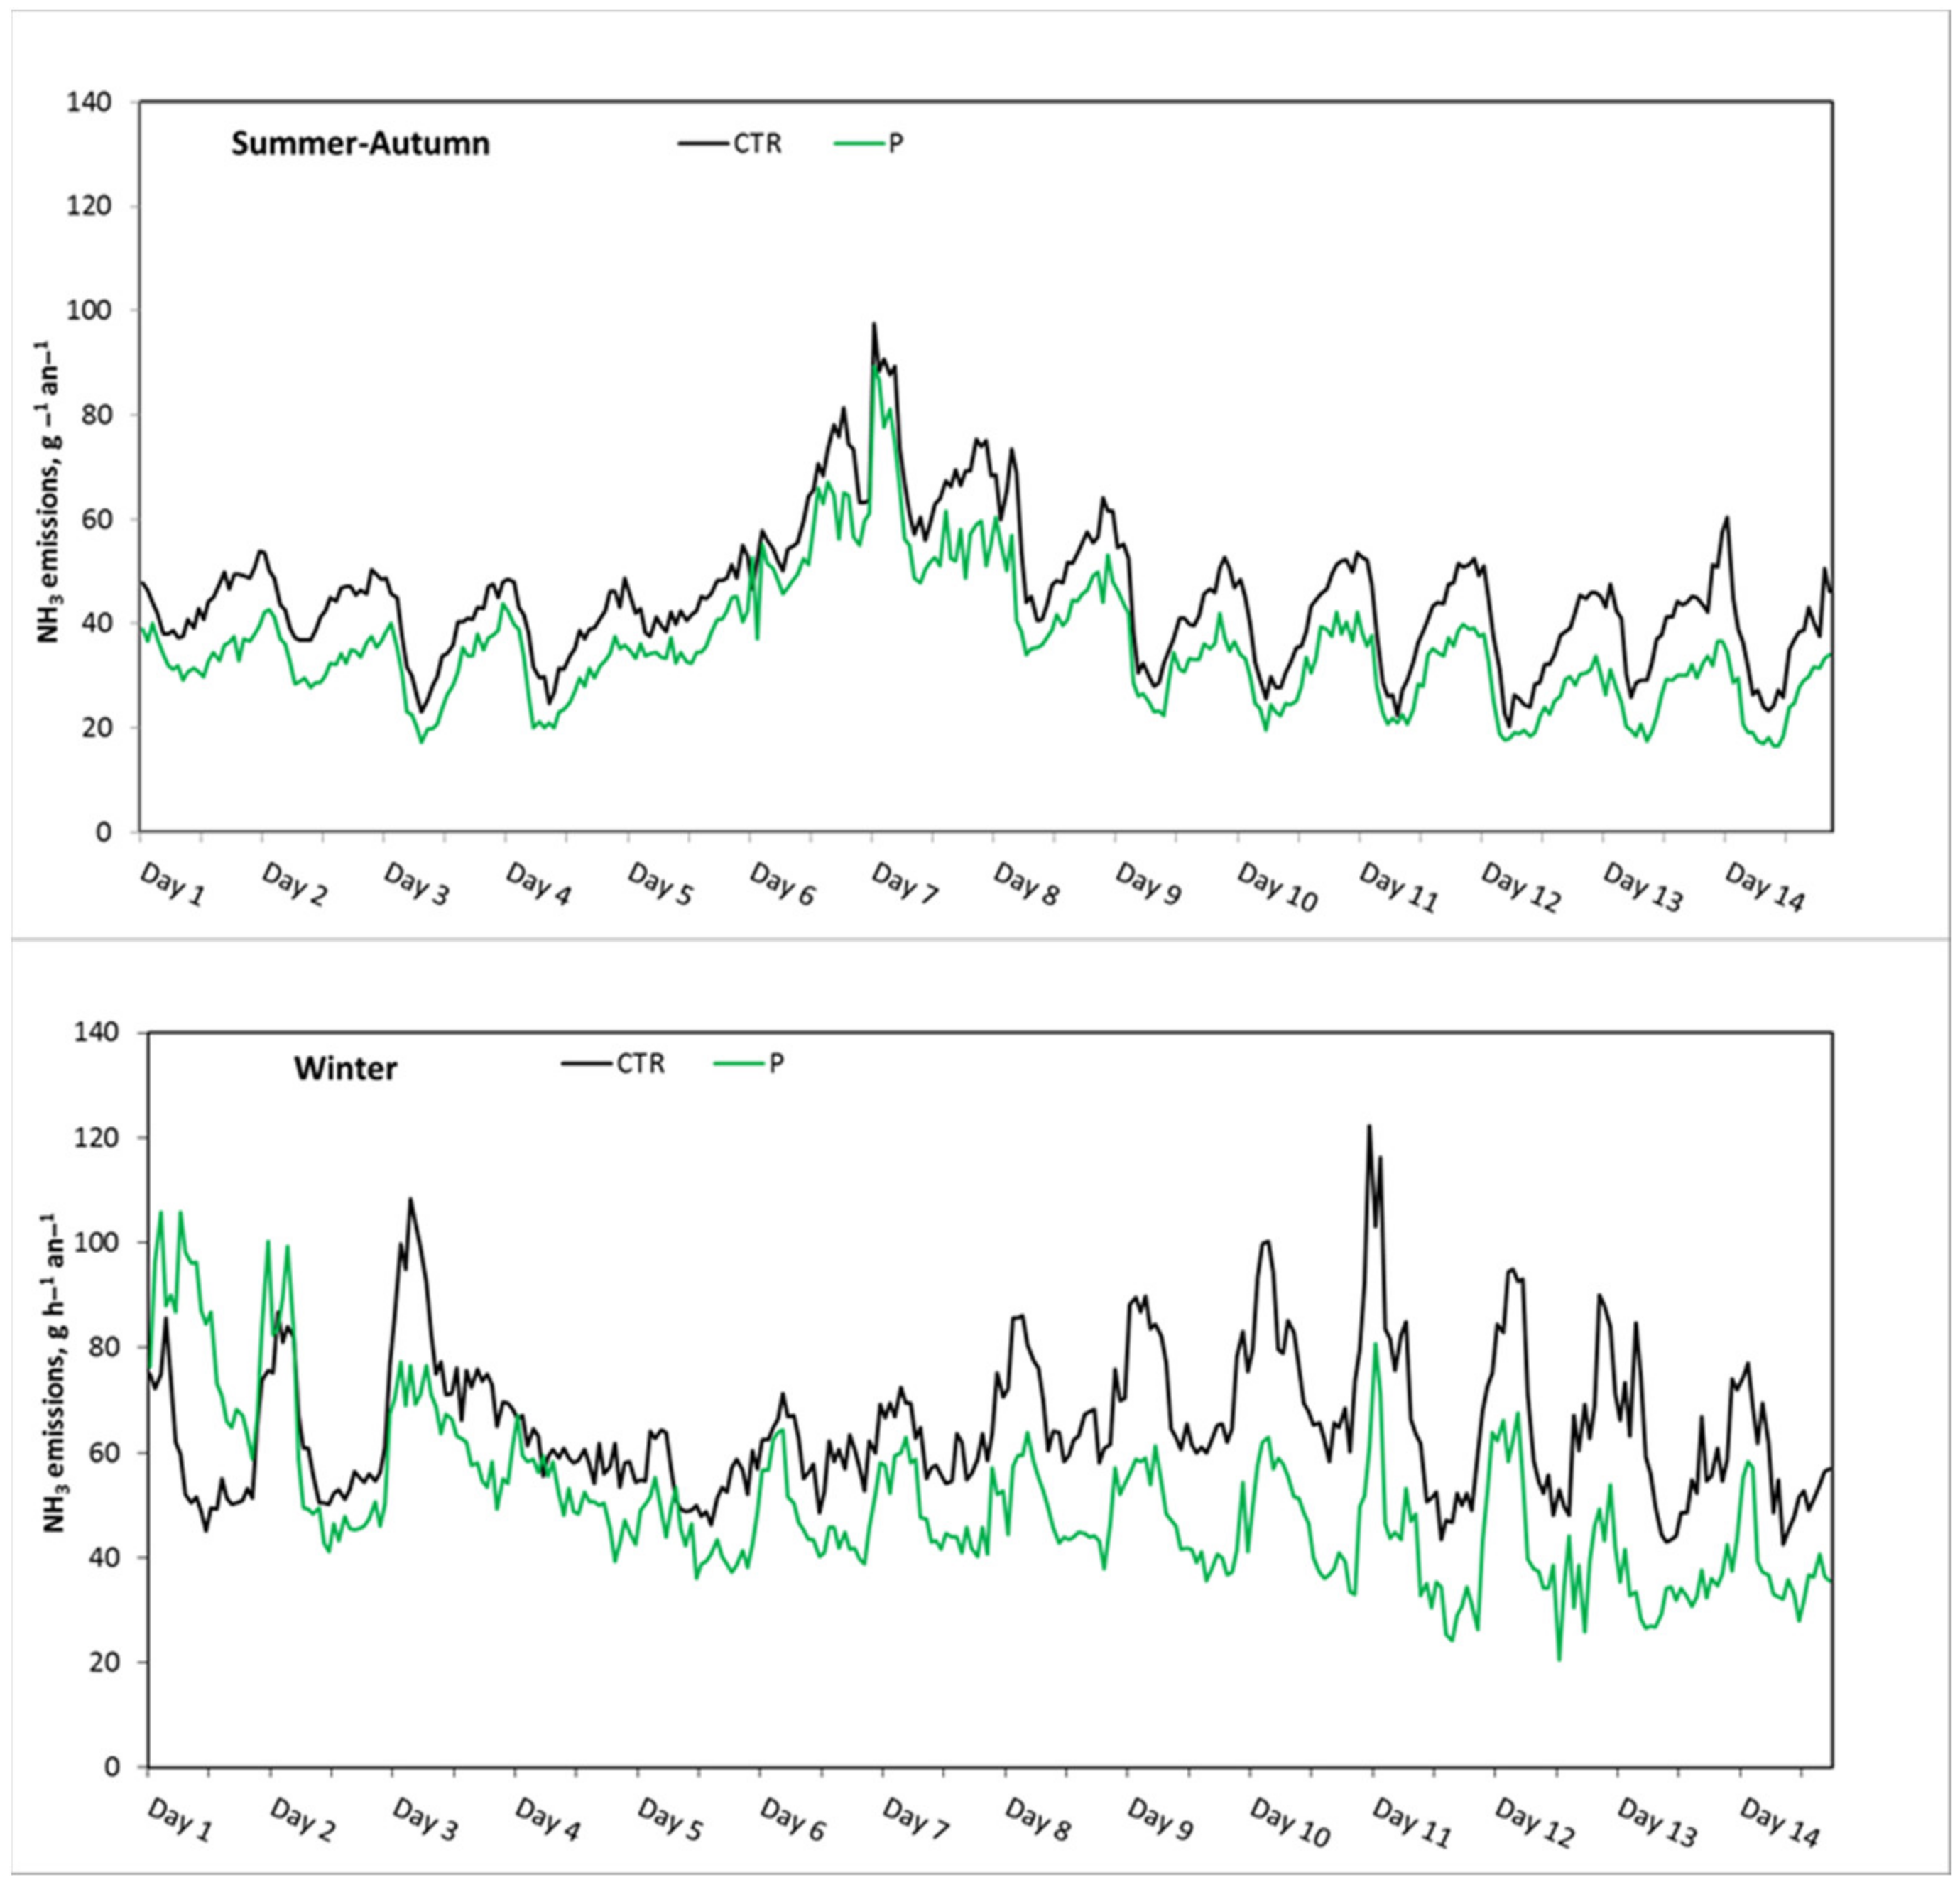
3.3. Ammonia Emission Rate during the Last Two Weeks of the Growing Period

The mean NH3 emissions in experiment 1 were 45.3 ± 13.2 and 35.7 ± 12.3 mg h−1 an−1 in compartment CTR and P, respectively. The daily differences between day- and night-time were in the range of 20–30 mg h−1 an−1 (Figure 5). In experiment 2, the mean NH3 emissions were 65.4 ± 13.9 and 50.7 ± 16.8 mg h−1 an−1 in CTR and P, respectively. Here, not only the mean emissions, but also the daily differences between day and night-time, were higher. The daily differences between day and night-time raised in the winter experiment up to 50 mg h−1 an−1. In both experiments, the NH3 emissions did not increase during the last two weeks of the piglet growing period.
Misselbrook et al. [45] reported for fattening pigs with a body mass of 20 up to more than 110 kg a daily N-NH3 emission of 79.2 g per LU (livestock unit, 500 kg) and for fatteners below 20 kg body mass a daily N-NH3 emission of 27.8 g per LU. For the latter, a N-NH3 emission of about 60–70 mg h−1 an−1 can be calculated for piglets with a body mass of 25–30 kg. Overall, very few studies have been carried out in piglet barns [46,47], and NH3 emissions of between 30 and 50 mg h−1 an−1 have been measured for piglets with a body mass between 10 and 27 kg. This corresponds with the results of our study.
In both of our experiments (summer–autumn and winter), the NH3 emissions were about 20% lower in P compared to CTR (p < 0.01). This corresponds to the margin of error in the calculated VR. It could be speculated that the lower NH3 emissions in compartment P were attributed to the capacity of the plants to uptake NH3 from the barn air, as reported in previous studies [22,48,49]. A contribution to the absorption of the NH3 from the air could also come from the substrate used for the plant cultivation (expanded clay) and the water used for the plant irrigation. In any case, it is reasonable to consider this to be very small, because the plant pots were accurately closed in the tubes and the substrate quantity in contact with the air was very small. Moreover, the increased amount of plants (+50%) and related irrigation and plant substrate surface showed no further improvement in the reduction of ammonia in the air. From this it could be speculated, that the plant cultivation substrate and the irrigation had nearly no effect on the NH3 emissions decrease. An explanation for the similar NH3 reduction rates in both experiments could be the effect of other factors, playing an important role on the NH3 uptake by the plants. Ammonia uptake from the atmosphere by plants is influenced and regulated by several factors such as the plant cultivar, the type and the dimensions of the leaves, the dust concentration in the air, the ammonia concentration in the air and the humidity [48]. Porter et al. [22] showed that corn seedlings could absorb NH3 through the leaves, but this capacity was affected by the NH3 concentration in the air. Increasing the concentration of NH3 in the air from 1 to 10 ppm, the leaf absorption of NH3 strongly decreased by 30%. Air humidity positively affects the ammonia absorption by the leaves because of the high solubility of NH3 in water [49]. In our study, the higher air humidity in the compartments P versus CTR could explain only 7% of the lower NH3 emission.
The range for NH3 absorption by the plant leaves is quite large and varies between 0.0015 and 0.025 mg N-NH3 dm−2 h−1 [20,21,22,23]. According to the foliar surface in the barn and the difference in the ammonia concentrations between the barn CTR and P, an absorption of approximately 0.5 mg N-NH3 dm−2 h−1 in experiment 1 and approximately 0.2 mg N-NH3 dm−2 h−1 in experiment 2 was calculated. At the same time, also the NH3 concentration in the air, which the plants were exposed to, had a wide range from 0.03 to 0.05 ppm [20] to 10 ppm [22]. In Lockyer and Whitehead [20] the plants were exposed to a very low NH3 concentration, and as a consequence, the absorption was less than 0.006 mg N-NH3 dm−2 h−1. A study by Grundmann et al. [19] observed an aerial ammonia absorption capacity in maize leaves ranging between 0.3 and 0.5 mg N-NH3 dm−2 h−1, exposed to an NH3 concentration of about 40 ppm. According to the results determined in the present study, it could be speculated that the plants can absorb NH3 from the atmosphere and that this activity can also take place under less suitable environmental conditions, such as those created in experiments at laboratory scale.

4. Conclusions

In the present study various ornamental plants were introduced in a piglet barn for the entire growing period of 8 weeks, in order to observe the effect on the ammonia emissions. CO2 and NH3 concentrations were measured in a compartment equipped with plants and another one without plants (control), simultaneously. The ventilation rates were calculated by means of the CO2 balance. Measurements were carried out in summer–autumn and winter. The installation of the green plants in the piglet compartment showed no negative effects on the animals; on the contrary, slightly higher body mass gains (+1.9 kg, appr. +6%) occurred in this compartment, compared to the control. The presence of these plants, including associated irrigation, increased relative humidity by about 9% in summer–autumn and 6% in winter. The NH3 concentrations measured in the compartments were rather low, the maximum of the mean hourly values did not exceed 6 ppm. NH3 emissions were about 20% lower in the plant compartment than in the control compartment, in both the summer–autumn and winter measurement periods. However, this difference was within the range of measurement uncertainty (0.5–1 ppm), which was determined mainly by the low NH3 concentrations and the ventilation rates calculated by means of the CO2 balance. Further studies should focus on single factors affecting the ammonia emissions: the air temperature and humidity, the ventilation rate, the ammonia concentration, the dust in the air as well as the plant irrigation system and cultivation substrate.

Author Contributions

Conceptualisation, M.J. and S.M.; methodology, S.M., M.J. and W.B.; software, S.M.; validation, S.M., W.B. and M.J.; formal analysis, S.M.; investigation, S.M., M.J. and H.G.; resources, M.J.; data curation, S.M. and W.B.; writing—original draft preparation, S.M.; writing—review and editing, S.M., W.B. and M.J.; visualisation, S.M.; supervision, M.J., S.M. and W.B.; project administration, S.M. and M.J.; funding acquisition, M.J. All authors have read and agreed to the published version of the manuscript.

Funding

This study received funding from the European Union within the EIP AGRI operational group scheme. Operational Groups are intended to bring together multiple actors such as farmers, researchers, advisers and businesses.

Institutional Review Board Statement

Not applicable.

Informed Consent Statement

Not applicable.

Data Availability Statement

Data are contained within the article. Restrictions apply to the availability of additional data due to privacy issues. Data were obtained from a farm and are available from the corresponding author with the permission of the farm.

Acknowledgments

The project “Stallgrün” was run in cooperation with the farm “Agrargenossenschaft Ranzig e.G.”, the companies “KFL GmbH Löwenberg” and “Böhmer GALABAU GmbH” and the research institution “Frankenförder Forschungsgesellschaft mbH”. We would like to thank all partners for their contribution and the support throughout the whole project.

Conflicts of Interest

The authors declare no conflict of interest.

References

  1. Giannakis, E.; Kushta, J.; Bruggeman, A.; Lelieveld, J. Costs and benefits of agricultural ammonia emission abatement options for compliance with European air quality regulations. Environ. Sci. Eur. 2019, 31, 93. [Google Scholar] [CrossRef] [Green Version]
  2. Oenema, O.; Velthof, G.L.; Amann, M.; Klimont, Z.; Winiwarter, W. Emissions from Agriculture and Their Control Potentials (Tsap Report 3); International Institute for Applied Systems Analysis (IIASA), European Commission: Laxenburg, Austria, 2012. [Google Scholar]
  3. Webb, J.; Menzi, H.; Pain, B.F.; Misselbrook, T.H.; Dämmgen, U.; Hendriks, H.; Döhler, H. Managing ammonia emissions from livestock production in Europe. Environ. Pollut. 2005, 135, 399–406. [Google Scholar] [CrossRef]
  4. Xu, W.; Zheng, K.; Liu, X.; Meng, L.; Huaitalla, R.M.; Shen, J.; Hartung, E.; Gallmann, E.; Roelcke, M.; Zhang, F. Atmospheric NH3 dynamics at a typical pig farm in china and their implications. Atmos. Pollut. Res. 2014, 5, 455–463. [Google Scholar] [CrossRef] [Green Version]
  5. Philippe, F.X.; Cabaraux, J.F.; Nicks, B. Ammonia emissions from pig houses: Influencing factors and mitigation techniques. Agric. Ecosyst. Environ. 2011, 141, 245–260. [Google Scholar] [CrossRef]
  6. Dong, H.; Kang, G.; Zhu, Z.; Tao, X.; Chen, Y.; Xin, H.; Harmon, J.D. Ammonia, methane and carbon dioxide concentrations and emissions of a hoop grower-finischer swine barn. Trans. Asabe 2009, 52, 1741–1747. [Google Scholar] [CrossRef]
  7. Van der Heyden, C.; Demeyer, P.; Volcke, E.I.P. Mitigating emissions from pig and poultry housing facilities through air scrubbers and biofilters: State-of-the-art and perspectives. Biosys. Eng. 2015, 134, 74–93. [Google Scholar] [CrossRef]
  8. Wathes, C.M.; Demmers, T.G.M.; Xin, H. Ammonia concentrations and emissions in livestock production facilities: Guidelines and limits in the USA and UK. In Proceedings of the ASAE Annual International Meeting, Las Vegas, NV, USA, 27–30 July 2003; pp. 1–11. [Google Scholar]
  9. Verordnung zum Schutz Landwirtschaftlicher Nutztiere und Anderer zur Erzeugung Tierischer Produkte Gehaltener Tiere bei Ihrer Haltung (Tierschutz-Nutztierhaltungsverordnung—TierschnutztV). Verbraucherschutz, Bundesministerium der Justiz und für Verbraucherschutz Ed., Germany. 2001. Available online: https://www.gesetze-im-internet.de/tierschnutztv/ (accessed on 12 June 2021).
  10. Wathes, C.M.; Jones, J.B.; Kristensen, H.H.; Jones, E.K.M.; Webster, A.J.F. Aversion of pigs and domestic fowl to atmospheric ammonia. Trans. Am. Soc. Agric. Eng. 2002, 45, 1605–1610. [Google Scholar]
  11. Donham, K.J.; Thorne, P.S.; Breuer, G.M.; Powers, W.; Marquez, S.; Reynolds, S.J. Exposure limits related to air quality and risk assessment. In Iowa Concentrated Animal Feeding Operations Air Quality Study; Iowa State University and The University of Iowa Study Group: Iowa City, IA, USA, 2002; Chapter 8; pp. 164–183. [Google Scholar]
  12. Dourmad, J.Y.; Garcia-Launay, F.; Narcy, A. Pig nutrition: Impact on nitrogen, phosphorus, Cu and Zn in pig manure and on emissions of ammonia, greenhouse gas and odours. In Proceedings of the Batfarm European Workshop Reconciling Livestock Management to the Environment, Rennes, France, 19–20 March 2013. [Google Scholar]
  13. Philippe, F.X.; Nicks, B. Review on greenhouse gas emissions from pig houses: Production of carbon dioxide, methane and nitrous oxide by animals and manure. Agric. Ecosyst. Environ. 2014, 199, 10–25. [Google Scholar] [CrossRef] [Green Version]
  14. ERDA. Atmosphere surface exchange of particulate and gaseous pollutants. In Proceedings of the Fourteenth ERDA Air Cleaning Conference, San Valley, ID, USA, 2 August 1974; Volume 38. [Google Scholar]
  15. Hill, A.R. Reproductive behaviour of metopolophium-festucae (theobald) at different temerpatures and on different host plants. Ann. Appl. Biol. 1971, 67, 289–295. [Google Scholar] [CrossRef]
  16. Rasmussen, K.H.; Taheri, M.K. Global emissions and antural processes for removal of gaseous pollutants. Water Air Soil Pollut. 1975, 4, 33–64. [Google Scholar] [CrossRef]
  17. Omasa, K.; Endo, R.; Tobe, K.; Kondo, T. Gas diffusion model analysis of foliar absorption of organic and inorganic air pollutants. Phyton Ann. Rei Bot. A 2002, 42, 135–148. [Google Scholar]
  18. Hörmann, V.; Brenske, K.R.; Ulrichs, C. Suitability of test chambers for analyzing air pollutant removal by plants and assessing potential indoor air purification. Water Air Soil Pollut. 2017, 228, 1–13. [Google Scholar] [CrossRef]
  19. Grundmann, G.L.; Lensi, R.; Chamalet, A. Delayed NH3 and N2O uptake by maize leaves. New Phytot. 1993, 124, 259–263. [Google Scholar] [CrossRef]
  20. Lockyer, D.R.; Whitehead, D.C. The uptake of gaseous ammonia by the leaves of italian ryegrass. J. Exp. Bot. 1986, 37, 919–927. [Google Scholar] [CrossRef]
  21. Rogers, H.H.; Aneja, V.P. Uptake of atmospheric ammonia by selected plant species. Environ. Exp. Bot. 1980, 20, 251–257. [Google Scholar] [CrossRef]
  22. Porter, L.K.; Viets, F.G.; Hutchinson, G.L. Air containing nitrogen-15 ammonia: Foliar absorption by corn seedlings. Science 1972, 175, 759–761. [Google Scholar] [CrossRef] [PubMed]
  23. Hutchinson, G.L.; Millington, R.J.; Peters, D.B. Atmospheric ammonia: Absorption by plant leaves. Science 1972, 175, 771–772. [Google Scholar] [CrossRef] [PubMed]
  24. TÜV Rheinland Energie und Umwelt GmbH. Test Report 936/21220683/A; TÜV Rheinland Energie und Umwelt GmbH: Köln, Germany, 2013. [Google Scholar]
  25. Sage, R.; Kubien, D.S. The temperature response of C3 and C4 photosynthesis. Plant Cell Environ. 2007, 30, 1086–1106. [Google Scholar] [CrossRef]
  26. Guo, W.J.; Lee, N. Effect of leaf and plant age, and day/night temperature on net CO2 uptake in phalaenopsis amabilis var. Formosa. J. Am. Soc. Hort. Sci. 2006, 131, 320–326. [Google Scholar] [CrossRef] [Green Version]
  27. Dong, H.; Zhu, Z.; Shang, B.; Kang, G.; Zhu, H.; Xin, H. Emissions of greenhouse gases from a typical chinese swine farrowing barn. Trans. Asabe 2007, 50, 1037–1044. [Google Scholar] [CrossRef] [Green Version]
  28. Van Ouwerkerk, E.N.J.; Pedersen, S. Application of the Carbon Dioxide Mass Balance Method to Evaluate Ventilation Rates in Livestock Buildings. In Proceedings of the XII CIGR World Congress on Agricultural Engineering, Milan, Italy, 29 August–1 September 1994; pp. 516–529. [Google Scholar]
  29. Liu, Z.; Powers, W.; Harmon, J.D. Estimating ventilation rates of animal houses through CO2 balance. Trans. Asabe 2016, 59, 321–328. [Google Scholar]
  30. CIGR. Heat and moisture production at animal and house levels. In CIGR Section II, 4th Report of Working Group on Climatisation of Animal Houses; Danish Institute of Agricultural Sciences: Slagelse, Denmark; Research Centre Bygholm: Horsens, Denmark, 2002. [Google Scholar]
  31. Carr, J. Garth Pig Stockmanship Standards; 5m Publishing: Sheffield, UK, 1998. [Google Scholar]
  32. Brown-Brandl, T.M.; Nienaber, J.A.; Xin, H.; Gates, R.S. A literature review of swine heat production. Trans. ASAE 2004, 47, 259–270. [Google Scholar] [CrossRef]
  33. Maderbacher, R.S.G.; Winter, P.; Baumgartner, W. Abgangsursachen in einem schweinezuchtbetrieb [causes of mortality in a swine breeding establishment]. Dtsch Tierarztl Wochenschr. 1993, 100, 468–473. [Google Scholar]
  34. Gebhardt, J.T.; Tokach, M.D.; Dritz, S.S.; DeRouchey, J.M.; Woodworth, J.C.; Goodband, R.D.; Henry, S.C. Postweaning mortality in commercial swine production II: Review of non-infectious contributing factors. Transl. Anim. Sci. 2020, 4, 462–484. [Google Scholar] [CrossRef] [PubMed]
  35. Wang, X.S.; Zhao, X.Y.; He, Y.; Wang, K.Y. Cough sound analysis to assess air quality in commercial weaner barns. Comput. Electron. Agric. 2019, 160, 8–13. [Google Scholar] [CrossRef]
  36. Han, K.S.; Ruan, L.W. Effects of indoor plants on air quality: A systematic review. Environ. Sci. Pollut. R. 2020, 27, 16019–16051. [Google Scholar] [CrossRef]
  37. Xu, K.; Zheng, C.M.; Ye, H. The transpiration characteristics and heat dissipation analysis of natural leaves grown in different climatic environments. Heat Mass Transfer. 2020, 56, 95–108. [Google Scholar] [CrossRef]
  38. Huynh, T.T.T.; Aarnink, A.J.A.; Gerrits, W.J.J.; Heetkamp, M.J.H.; Canh, T.T.; Spoolder, H.A.M.; Kemp, B.; Verstegen, M.W.A. Thermal behaviour of growing pigs in response to high temperature and humidity. Appl. Anim. Behav. Sci. 2005, 91, 1–16. [Google Scholar] [CrossRef]
  39. Pennisi, B.V. Growing indoor plants with success. In Bulletin University of Georgia; Fort Valley State University: Fort Valley, GA, USA; University of Georgia: Athens, GA, USA; U.S. Department of Agriculture: Washington, DC, USA, 2020; pp. 1–28. Available online: https://extension.uga.edu/publications/detail.html?number=B1318&title=Growing%20Indoor%20Plants%20with%20Success (accessed on 15 May 2021).
  40. Pluske, J.R.; Le Dividich, J.; Verstegen, M.W.A. Weaning the Pig: Concepts and Consequences; Wageningen Academic Pub.: Wageningen, The Netherlands, 2003. [Google Scholar]
  41. Zimmerman, J.J.; Karriker, L.A.; Ramirez, A.; Schwartz, K.J.; Stevenson, G.W.; Zhang, J. Diseases of Swine, 11th ed.; Wiley-Blackwall: Hoboken, NJ, USA, 2019; p. 1136. [Google Scholar]
  42. Ni, J.Q.; Heber, A.J.; Lim, T.T.; Tao, P.C.; Schmidt, A.M. Methane and carbon dioxide emission from two pig finishing barns. J. Environ. Qual. 2008, 37, 2001–2011. [Google Scholar] [CrossRef]
  43. Hinz, T.; Linke, S. A comprehensive experimental study of aerial pollutants in and emissions from livestock buildings. Part 1. Methods. J. Agric. Econ. Res. 1998, 70, 111–118. [Google Scholar] [CrossRef]
  44. Zhuang, S.; Brusselman, E.; Sonck, B.; Demeyer, P. Validation of Five Gas Analysers for Application in Ammonia Emission Measurements at Livestock Houses According to the VERA Test Protocol. Appl. Sci. 2020, 10, 5034. [Google Scholar] [CrossRef]
  45. Misselbrook, T.H.; Van der Weerden, T.J.; Pain, B.F.; Jarvis, S.C.; Chambers, B.J.; Smith, K.A.; Phillips, V.R.; Demmers, T.G.M. Ammonia emission factors for UK agriculture. Atmos. Environ. 2000, 34, 871–880. [Google Scholar] [CrossRef]
  46. Aarnink, A.J.A.; Keen, A.; Metz, J.H.M.; Speelman, L.; Verstegen, M.W.A. Ammonia emission patterns during the growing periods of pigs housed on partially slatted floors. J. Agric. Econ. Res. 1995, 62, 105–116. [Google Scholar] [CrossRef]
  47. Aarnink, A.J.A.; van den Berg, A.J.; Keen, A.; Hoeksma, P.; Verstegen, M.W.A. Effect of slatted floor area on ammonia emissions and on the excretory and lying behavious of growing pigs. J. Agric. Econ. Res. 1996, 64, 299–310. [Google Scholar]
  48. Givan, G.V. Metabolic detoxification of ammonia in tissues of higher plants. Phytochemistry 1979, 18, 375–382. [Google Scholar] [CrossRef]
  49. Husted, S.; Schjoerring, J.K. Ammonia flux between oilseed rape plants and the atmosphere in response to changes in leaf temperature, light intensity, and air humidity—Interactions with leaf conductance and apoplastic NH4+ and H+ concentrations. Plant Physiol. 1996, 112, 67–74. [Google Scholar] [CrossRef] [PubMed] [Green Version]
Figure 1. Drawing of the piglet compartment P. The blue area indicates where the plants were installed during the first experiment (summer–autumn), the green area indicates where further plants were installed in the second experiment (winter).
Atmosphere 12 01150 g001
Figure 2. Plant system introduced in compartment.
Atmosphere 12 01150 g002
Figure 3. Temperature (T) and relative humidity (RH) in the compartments CTR and P in the two measuring periods (summer–autumn and winter).
Atmosphere 12 01150 g003
Figure 4. Ventilation rate (VR) in the compartments CTR and P and the outside temperature (T outside) in the two measuring periods (summer–autumn and winter).
Atmosphere 12 01150 g004
Figure 5. NH3 emissions in the compartments CTR and P in the two measuring periods (summer–autumn and winter).
Atmosphere 12 01150 g005
Table 1. Description of the piglet groups in the two compartments CTR and P, during the two analysed growing periods.
No. PigsAge Body Mass
Dayskg
StartEndStartEndStartEnd
Experiment 1
(summer–autumn)
CTR14714128836.5 ± 1.330.2 ± 4.6
P14814228836.3 ± 1.532.1 * ± 5.1
Experiment 2
(winter)
CTR888028826.9 ± 1.331.2 ± 4.2
P888528826.9 ± 1.633.1 * ± 4.7
For the body mass the mean values ± standard deviation are reported. The symbol * indicates significant differences from the control (p < 0.05).
Table 2. Gas concentrations, ventilation rates (VR), temperatures and humidity in the compartments CTR and P for the last two weeks of the analysed growing periods (summer–autumn and winter).
Summer-
Autumn
CTRPOutside
CO2NH3VRTRHCO2NH3VRTRHCO2NH3T
ppmppmm3 h−1°C%ppmppmm3 h−1°C%ppmppm°C
Mean
SD
965
248
2.4
1.2
6050
3330
22.6
0.9
57.2
5.5
980
274
2.0 *
1.1
6060
2910
21.4 *
1.4
62.5 *
6.5
425
39
0.5
0.1
14.4
4.6
Min5260.5226020.041.65810.5210019.145.23770.24.6
Max16306.017,90026.171.917905.913,80025.977.75630.924.4
WinterCTRPOutside
CO2NH3VRTRHCO2NH3VRTRHCO2NH3T
ppmppmm3 h−1°C%ppmppmm3 h−1°C%ppmppm°C
Mean
SD
1177
183
4.0
0.5
2390
1060
20.7
0.6
53.0
5.0
1162
203
3.2 *
0.4
2670 *
1170
20.7
0.7
56.4 *
5.0
482
57
1.0
0.3
5.4
6.6
Min6382.397019.240.96571.9133019.340.74230.5−8.3
Max16005.2861022.169.416305.3854022.366.16801.722.0
The symbol * indicates significant differences between the compartment with plants (P) and the control (CTR) (p < 0.01).
Publisher’s Note: MDPI stays neutral with regard to jurisdictional claims in published maps and institutional affiliations.

