Article

Analysis of Marine Diesel Engine Emission Characteristics of Different Power Ranges in China

College of Marine Engineering, Dalian Maritime University, Dalian 116026, China
*
Author to whom correspondence should be addressed.
Atmosphere 2021, 12(9), 1108; https://doi.org/10.3390/atmos12091108
Submission received: 4 August 2021 / Revised: 23 August 2021 / Accepted: 24 August 2021 / Published: 27 August 2021
(This article belongs to the Special Issue Ocean Environment Modelling and Air Emissions from Shipping)

Abstract

:
In order to accurately assess China’s port air pollution caused by the shipping industry, two main methods can be used to calculate the emissions of ships, including the method based on ship fuel consumption and the method based on ship activities. Both methods require accurate diesel engine emission factors, or specific emissions. In this paper, the emission characteristics of NOX, CO, CO2 and THC from 197 domestic marine diesel engines were tested under bench test conditions by a standard emission measurement system. The diesel engines were divided into six Classes, A~F, according to their power distribution, and the fuel-based emission factors and energy-based emission factors of marine main engine and auxiliary engine meeting IMO NOX Tier II standards were given. The results showed that the main engine fuel-based emission factors of NOX, CO, CO2 and THC from Class A to Class F were 33.25~76.58, 2.70~4.33, 3123.92~3166.47 and 1.10~2.64 kg/t-fuel, respectively; and the energy-based emission factors were 6.57~11.75, 0.56~0.81, 530.28~659.71 and 0.18~0.61 g/kW h, respectively. The auxiliary engine fuel-based emission factors of NOX, CO, CO2 and THC from Class A to Class D were 27.17~39.81, 2.66~5.12, 3113.01~3141.34 and 1.16~2.87 kg/t-fuel respectively; and their energy-based emission factors were 6.06~8.33, 0.47~0.77, 656.86~684.91 and 0.21~0.61 g/kW h, respectively. The emission factors for different types of diesel engines were closely related to the diesel engine load, and the relation between them could be expressed by quadratic polynomial or power function. The results of this paper provide valuable data for the estimation of waterway transportation exhaust emissions and comprehensive understanding of the emission characteristics of marine diesel engines.

1. Introduction

Seaborne trade can bring huge economic benefits to the world, accounting for more than 80% of global trade, and it is still growing [1,2]. At the same time, such trade activities also lead to the destruction of coastal and port ecological environments. According to relevant research, 70% of ship exhaust emissions occur within 400 km of land [3,4]. Therefore, ship exhaust emissions have been considered as one of the most important sources of air pollution in port cities and inland river areas, which has a serious impact on global climate change and human health [5,6,7,8,9]. Therefore, the relevant departments need to master accurate data and emission characteristics of ship exhaust emissions, formulate reasonable policies to reduce environmental pollution caused by ship exhaust emissions and protect human health. At present, there are two methods for evaluating ship exhaust emissions, including fuel-based (top-down) and activity-based (bottom-up) approaches [10,11,12,13]. Usually, the top-down approach applies to large-scale measurements of ship emissions, such as on a global or national scale. The bottom-up approach is suitable for estimating ship emissions from a single ship or fleet at a particular location and during a particular period of activity, and then aggregating the data based on time and space [4]. Regardless of which assessment approach is used, effective emission factors need to be obtained, including fuel-based emission factors and energy-based emission factors. Usually, the emission factors can be expressed as the pollutant quality per unit power per unit time of the diesel engine (g/kW h) or the pollutant quality per unit fuel quality (g/kg-fuel) [10]. Emission factors are the basic data of ship exhaust gas assessment approaches, which play a crucial role in the reliability and accuracy of the assessment results. Early studies showed that the uncertainty of different pollutant emission factors could reach up to 50% when the ships were in different navigation conditions [4,14]. Therefore, reasonable emission factors should be selected in the process of building a ship exhaust emission inventory.
For the marine diesel engine emission factors research, some institutions started earlier, and provided valuable reference data, such as the International Maritime Organization (IMO), the Intergovernmental Panel on Climate Change (IPCC), the European Environment Agency (EEA), the United States Environmental Protection Agency (USEPA), the Swedish Environmental Institute (IVL), Lloyd’s Register of Shipping (LR) and so on. In addition to some emission factors given by the above-mentioned research institutions, many researchers have also performed relevant research on emission factors. Cooper et al. [15] tested the emission factors of 22 marine auxiliary engines from 6 ships at berth, and obtained the specific emission factors of NOX, CO, THC, CO2, SO2 and PM within a given load range. The emission factors varied greatly among different models and load conditions. Moldanová et al. [16] conducted a real ship study on a large cargo ship and obtained that the emission factor of PM was 5.3 g/kg based on fuel consumption, which was lower than the global average level. Hulskotte et al. [17] compiled statistics on the activities of 89 ocean-going ships berthed in Rotterdam port, established the fitting relationship between the total tonnage of various ships and fuel consumption, and pointed out that the emission factors of different diesel engines were related to the fuel used. Chu-Van et al. [18] conducted real ship testing on the exhaust gas emission factors on a single cargo ship in cruising, berthing and maneuvering navigation and compared the results with other literature. The research results showed that the emission factors of CO, HC, PM and PN during maneuvering voyages were much higher than those in cruising state.
In addition, Chinese scholars have also performed research on emission factors. Fu et al. [19] and Yin et al. [20], respectively, took the freight ships in the Grand Canal as their research object and carried out shipboard tests on the emission factors of inland river transport ships in China, and preliminarily formed the emission factors of inland river ships under different operating conditions with power under 300 kW. Huang et al. [8] and Peng et al. [21] used portable equipment to measure the emission factors of the marine diesel engines, and gave the emission factors under different sailing conditions. Wang et al. [22] tested the emission characteristics of CO, THC, NOX and PM on 50 ships, and statistically analyzed the emission data according to the year and type of diesel engines. Zhang et al. [23,24,25] carried out real ship tests on different types of ships, gave emission factors of different types of ships under different sailing conditions and compared them with relevant literature to analyze the reasons for the differences. Xing et al. [13] summarized the emission test report of marine diesel engine bench testing, and gave the emission factors under the IMO NOX Tier I and Tier II standards. As far as the domestic research status is concerned, although the research on the emission characteristics of ship pollutants is more in-depth, the emission test data are generally less, which creates difficulties in providing enough data support for the establishment of an emission inventory in China. The average emission factor is more suitable for large-scale estimated inventories [23,26]. Currently, a number of researchers have established domestic ship emission inventories, while most ship emission inventories are based on foreign emissions factors [27,28,29,30,31]. The research on emission characteristics of diesel engines from different manufacturers, different models and different power ranges is very limited. Therefore, how to determine appropriate regional emission factors reflecting the characteristics of ship emissions is an urgent problem to be solved.
In this paper, 197 domestic marine diesel engines were tested under bench test conditions and analyzed statistically, aiming to reveal and master the emission characteristics of various ocean-going and inland river ships diesel engines produced in China. According to IMO NOX technical code [32], the gaseous compounds specific emission of NOX, CO, CO2 and THC of various types of marine diesel engines were tested and summarized, mainly including fuel-based emission factors and energy-based emission factors.

2. Experimental Section

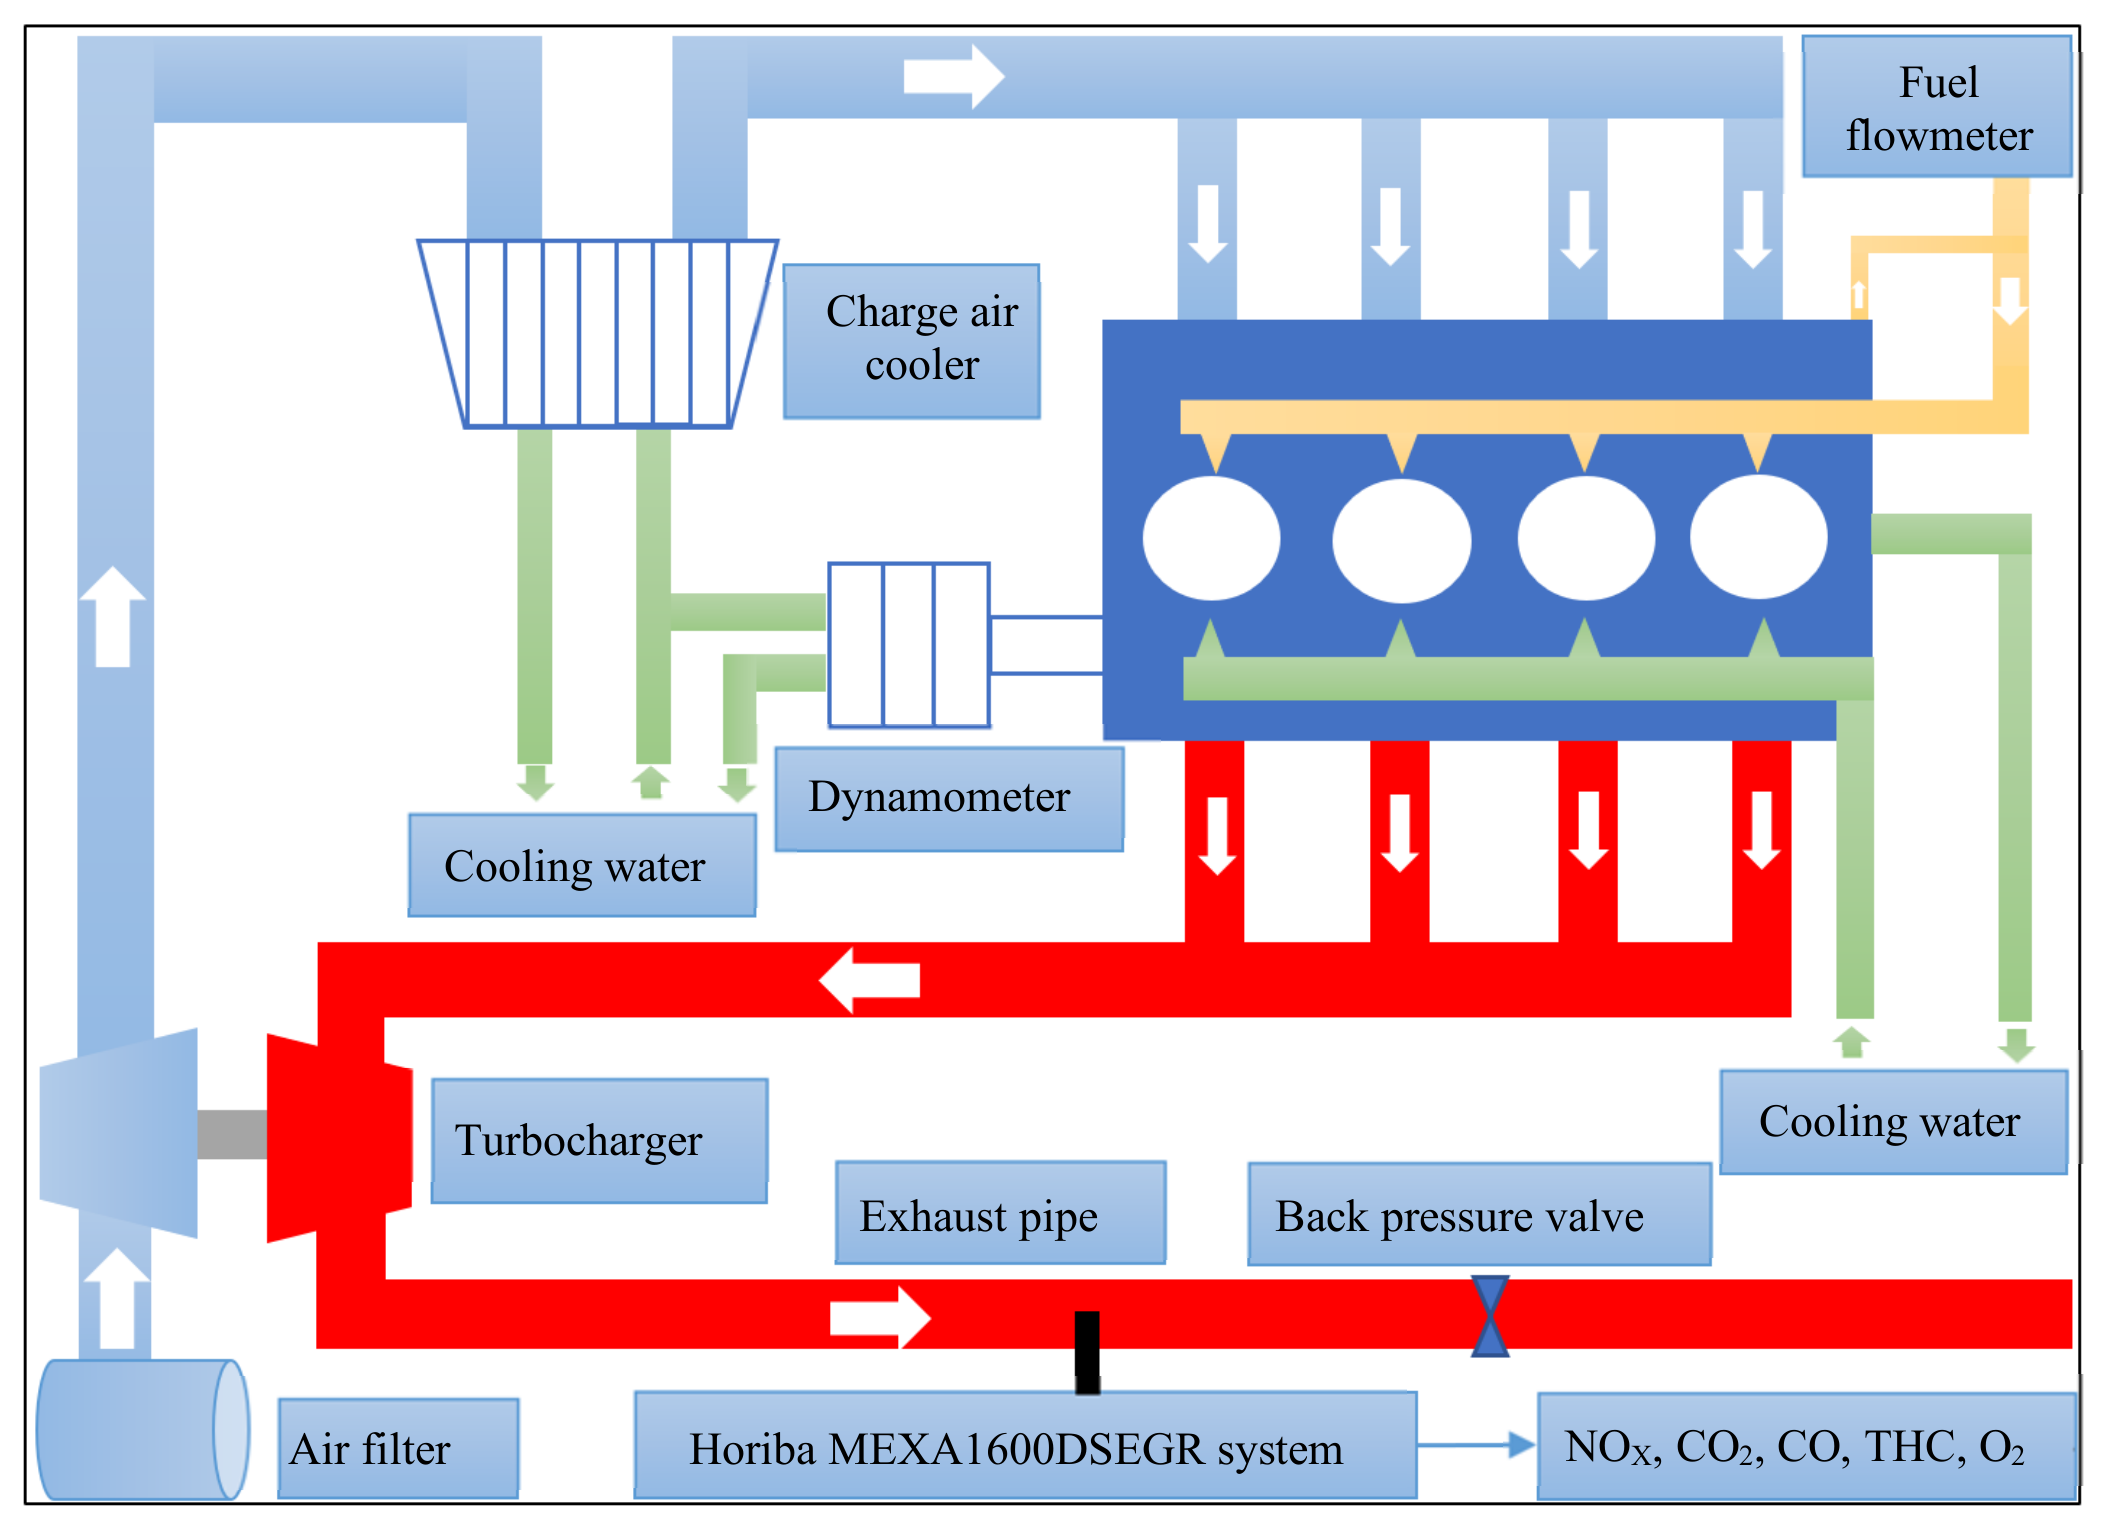
2.1. Test Bench and Conditions

Diesel engines are required to undergo a bench emission test before being installed on a ship. Before carrying out a diesel engine bench emission test, it is very important to ensure that the test bench meets the test requirements. In general, the schematic diagram of diesel bench emission test is shown in Figure 1. Before carrying out the diesel engine bench emission test, it is necessary to ensure that the environmental parameter (fa) meets the test requirements (0.93 ≤ fa ≤ 1.07) [32,33]. The exhaust emission measurement system should be located at least 10 times the diameter of the exhaust pipe behind the turbocharger and close to the diesel engine, so as to ensure that the sampling exhaust temperature is higher than 190 °C. In addition, the exhaust back pressure must be guaranteed to meet the design conditions. Before formal measurement, the emission measurement system should be warmed up for more than 2 h. During the test, in order to ensure the accuracy of the measurement results, the recording time of each measured load point should not be less than 10 min. Fuel consumption is an important parameter to reflect the performance of a diesel engine. In order to accurately calculate the exhaust flow, it is necessary to accurately record fuel consumption. Controlling these test conditions at basically the same level can greatly reduce the differences between different tests.

2.2. Emission Measurement System

The MEXA 1600DSEGR exhaust analyzer manufactured by HORIBA (Kyoto, Japan) is mainly used for emission bench testing, which tests the contents of nitrogen oxides (NOX), carbon dioxide (CO2), carbon monoxide (CO), total hydrocarbon (THC) and oxygen O2 in engine exhaust. The measurement equipment is mainly composed of the following detection modules: chemiluminescent detector (CLD) for NOX, non-dispersive infrared analyser (NDIR) for CO2 and CO, heated flame ionization detector (HFID) for THC, paramagnetic detector (PMD) for O2, and heating and cooling modules for controlling temperature. The equipment has been approved by the China Classification Society (CCS). The test principle meets the requirements of IMO code [32,33]. In order to ensure the accuracy of the test results, the equipment conducts linearization calibration and NOX conversion efficiency check every three months before the test, and the conversion efficiency is greater than 90%. Before each test, the leakage inspection test should be carried out. Before and after the test, zero and span calibrations by standard gases should be carried out to ensure the accuracy of the measuring instrument.

2.3. Test Engines

According to their different uses, marine diesel engines can be divided into the categories of main engine for propulsion (ME), auxiliary engine for generator (AE) and so on. The ME includes two-stroke (2S) and four-stroke (4S) diesel engines, while the AE mainly refers to the four-stroke diesel engine. In this paper, a total of 197 domestic marine diesel engines were tested under bench test conditions. The two-stroke diesel engine mainly includes S-MC-C, S-ME-B, S-ME-C and G-ME-C series types with cylinder bore of 500~800 mm from MAN Energy Solutions and RT-Flex and X series diesel engines with cylinder bore of 580~720 mm from Wärtsilä. The two-stroke diesel engines include a power range of 4320~26,000 kW and a speed range of 67.6~127 r/min. The four-stroke diesel engines mainly include different series of marine diesel engines with cylinder bore of 105~330 mm produced by different diesel engine manufacturers in China. These engines have a power range of 130~4000 kW and a speed range of 600~2425 r/min. The statistical results of this study can reflect the marine diesel engine emission levels meeting IMO NOX Tier II limit.

2.4. Test Cycles

According to IMO marine diesel engine NOX technical code [32,33], the exhaust gas components of the marine diesel engine emission bench test mainly include NOX, CO2, CO and THC. This paper mainly includes two types of test cycle report: the E3 test cycle for propeller-law-operated main engines and the D2 test cycle for constant-speed auxiliary engines. During the bench test, the diesel engines run for more than 15 min at each load point, the first 5 min being for transition and stabilization and the last 10 min for data recording. In the recording process, the experimental data should be recorded three times to eliminate errors caused by the fluctuation of experimental data. Finally, the mean value of the three measurements should be taken for calculation. The test cycle and weighting factors of each test load are shown in Table 1.

2.5. Data Calculating Method

In this paper, the carbon balance method [32,33] is used to calculate the emission factors of gas pollutants. The method assumes that only hydrocarbons (HC), CO and CO2 contain carbon in all combustion products of diesel engines [19,21]. The fuel mass flow rate and operating power can be measured during the diesel engine emission bench test. According to IMO NOX technical code, the mass flow rate of an individual exhaust gas component can be calculated according to the exhaust gas concentration. The fuel-based emission factor, energy-based emission factor and individual gas component can be calculated based on the above conditions. The method can be expressed in accordance with the following:
EF f = i = 1 n Q mags , i   ×   W F , i / Q mf , i
EF e = ( i = 1 n Q mags , i ×   W F , i ) / ( i = 1 n P i   ×   W F , i )   ×   10 3
where: EFf: fuel-based emission factor (kg/t-fuel); Qmags: emission mass flow rate of individual gas (kg/h); Qmf: fuel flow rate (t/h); WF: weighting factor, as described in Table 1; i: test power point, as described in Table 1; EFe: energy-based emission factor (g/kW h); P: power of each test load point (kW).

2.6. Fuel Information

The fuel used in all the bench tests is general light diesel fuel. After each test, the fuel was sampled and sent to a special testing institution for elemental analysis, which included carbon (C), hydrogen (H), oxygen (O), nitrogen (N) and sulfur (S). According to the analysis report, C, 85.22~86.83%; H, 12.47~14.12%; N, 0.01~0.41%; O, 0.02~0.77%; and S, 0.00~0.19%.

3. Results and Discussion

In the process of data statistics, the diesel engines are divided into six distribution regions according to their discrete degree of power distribution. Class A, 130~600 kW; Class B, 601~1200 kW; Class C, 1201~2000 kW; Class D, 2001~4000 kW; Class E, 4001~10,000 kW; and Class F, 10,001~26,000 KW. Class A, B, C and D are four-stroke diesel engines, while Class E and F are two-stroke diesel engines.

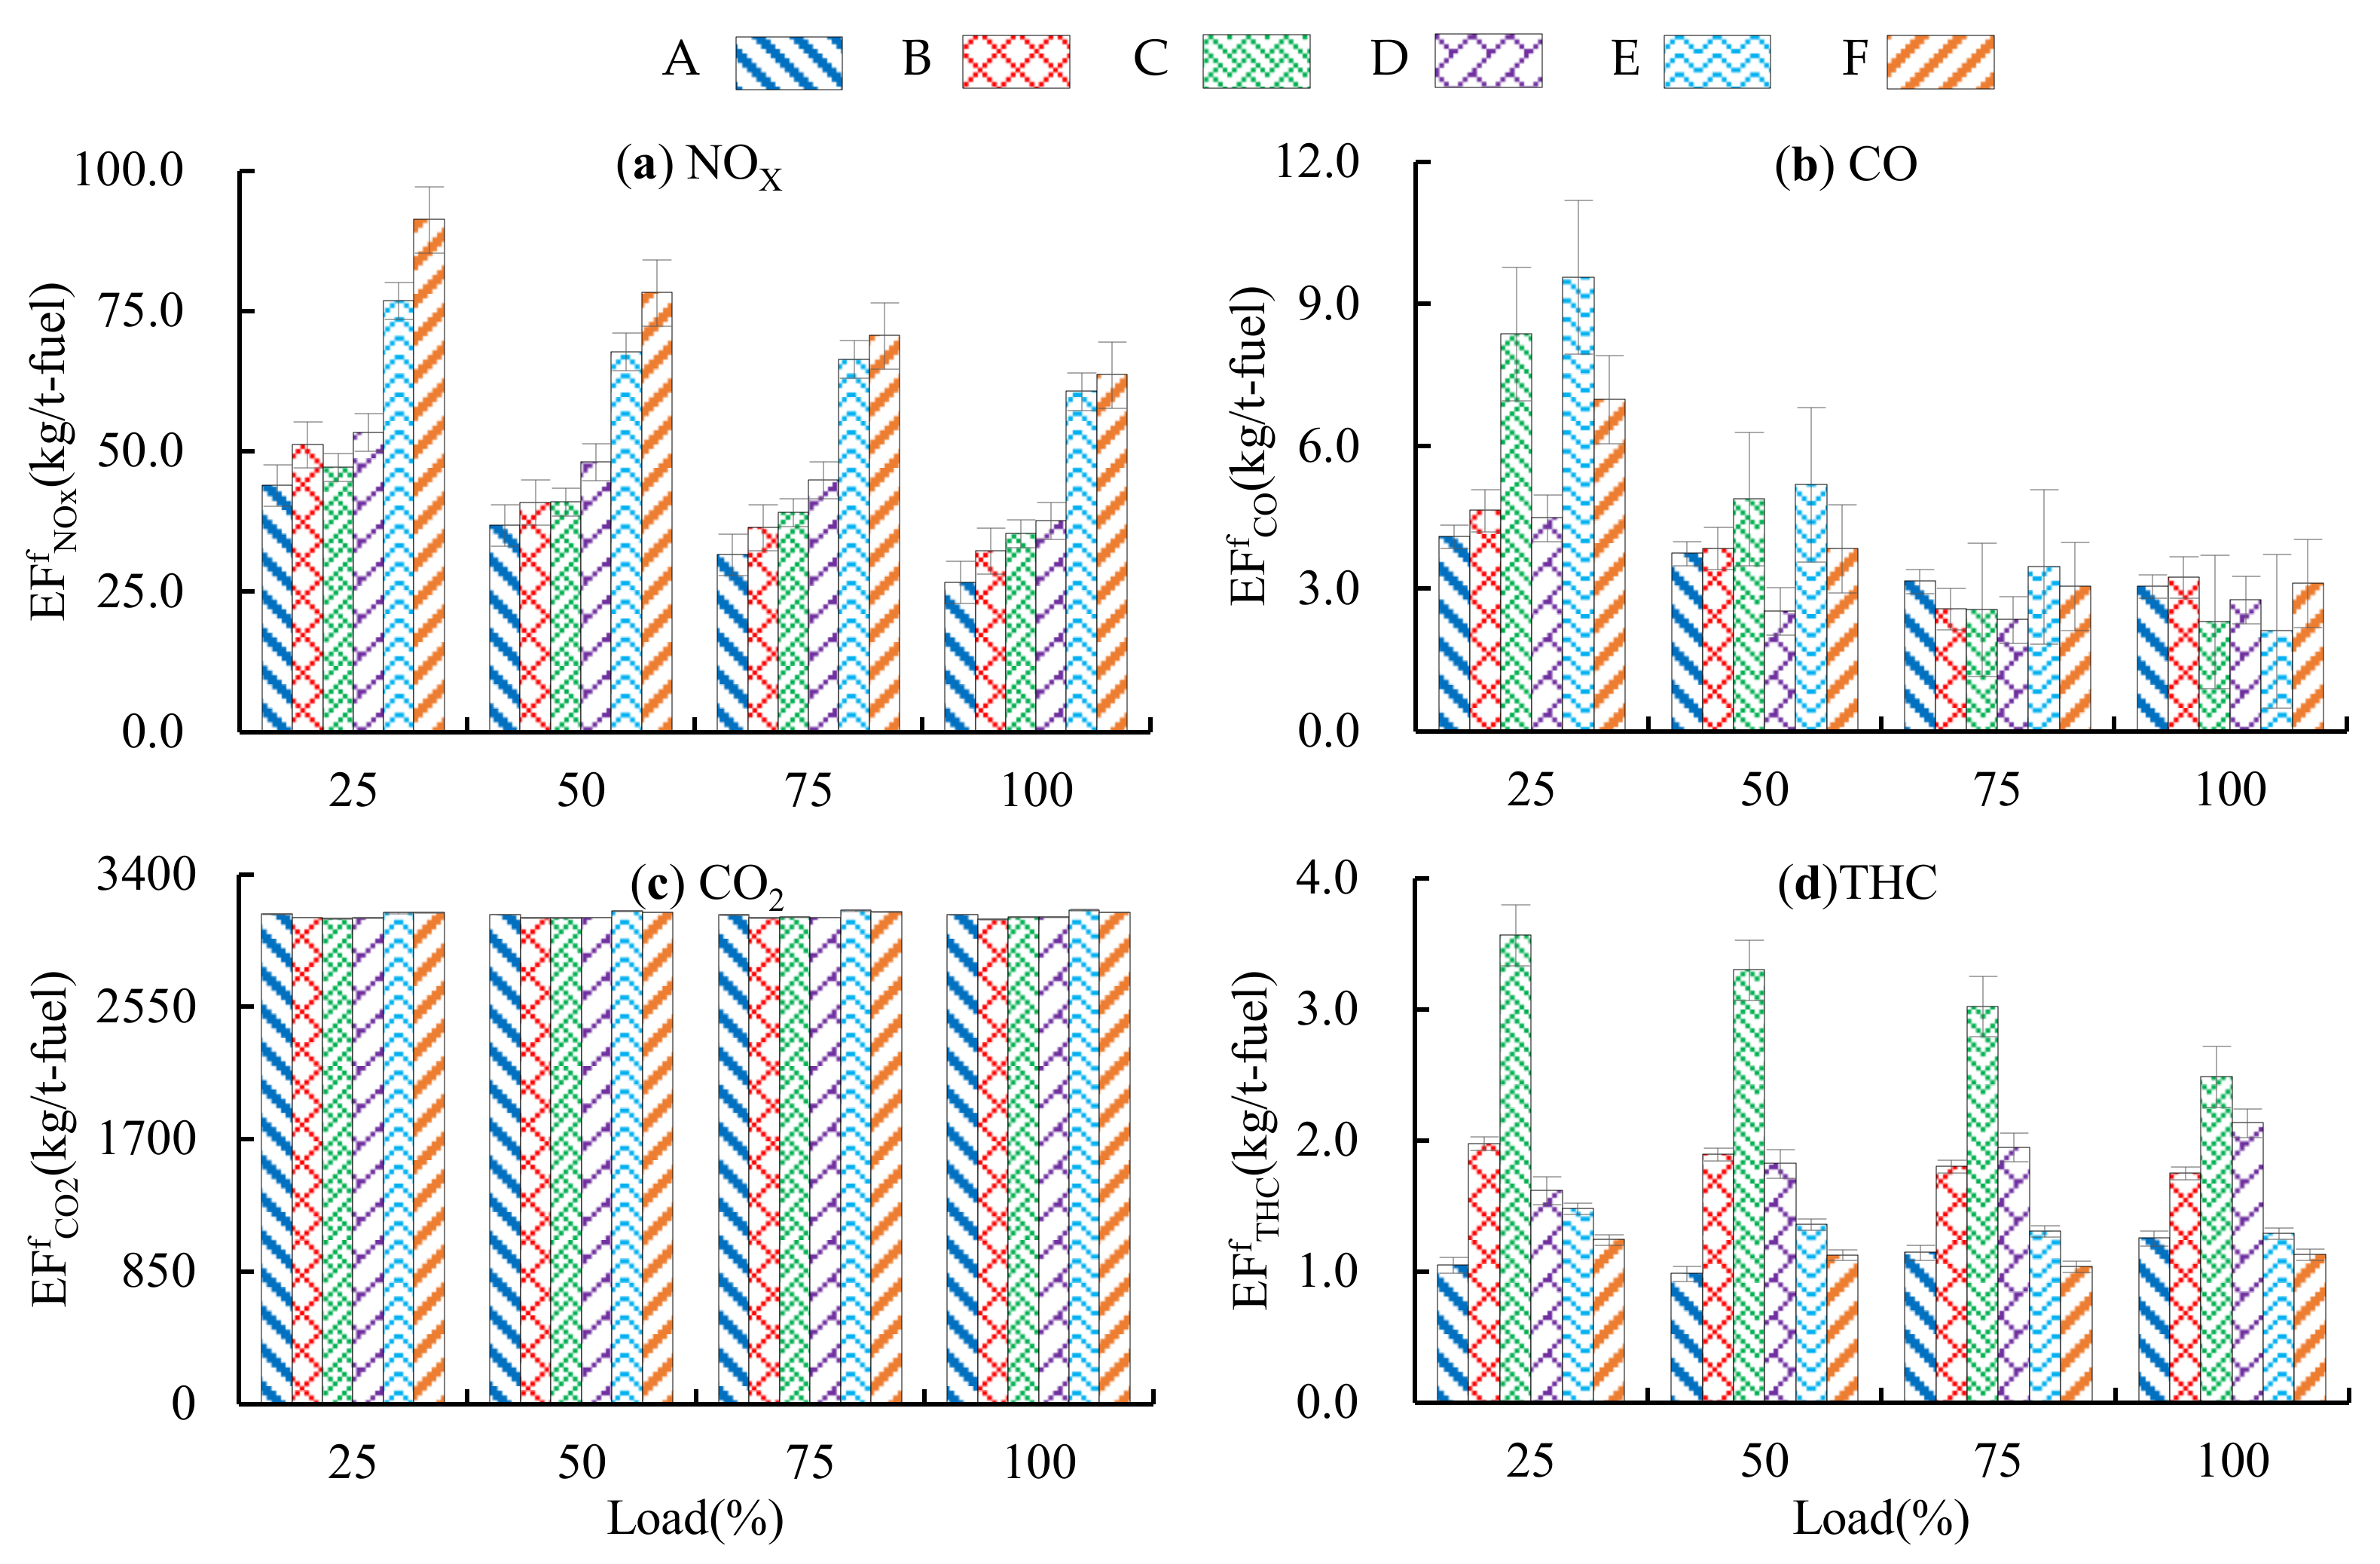
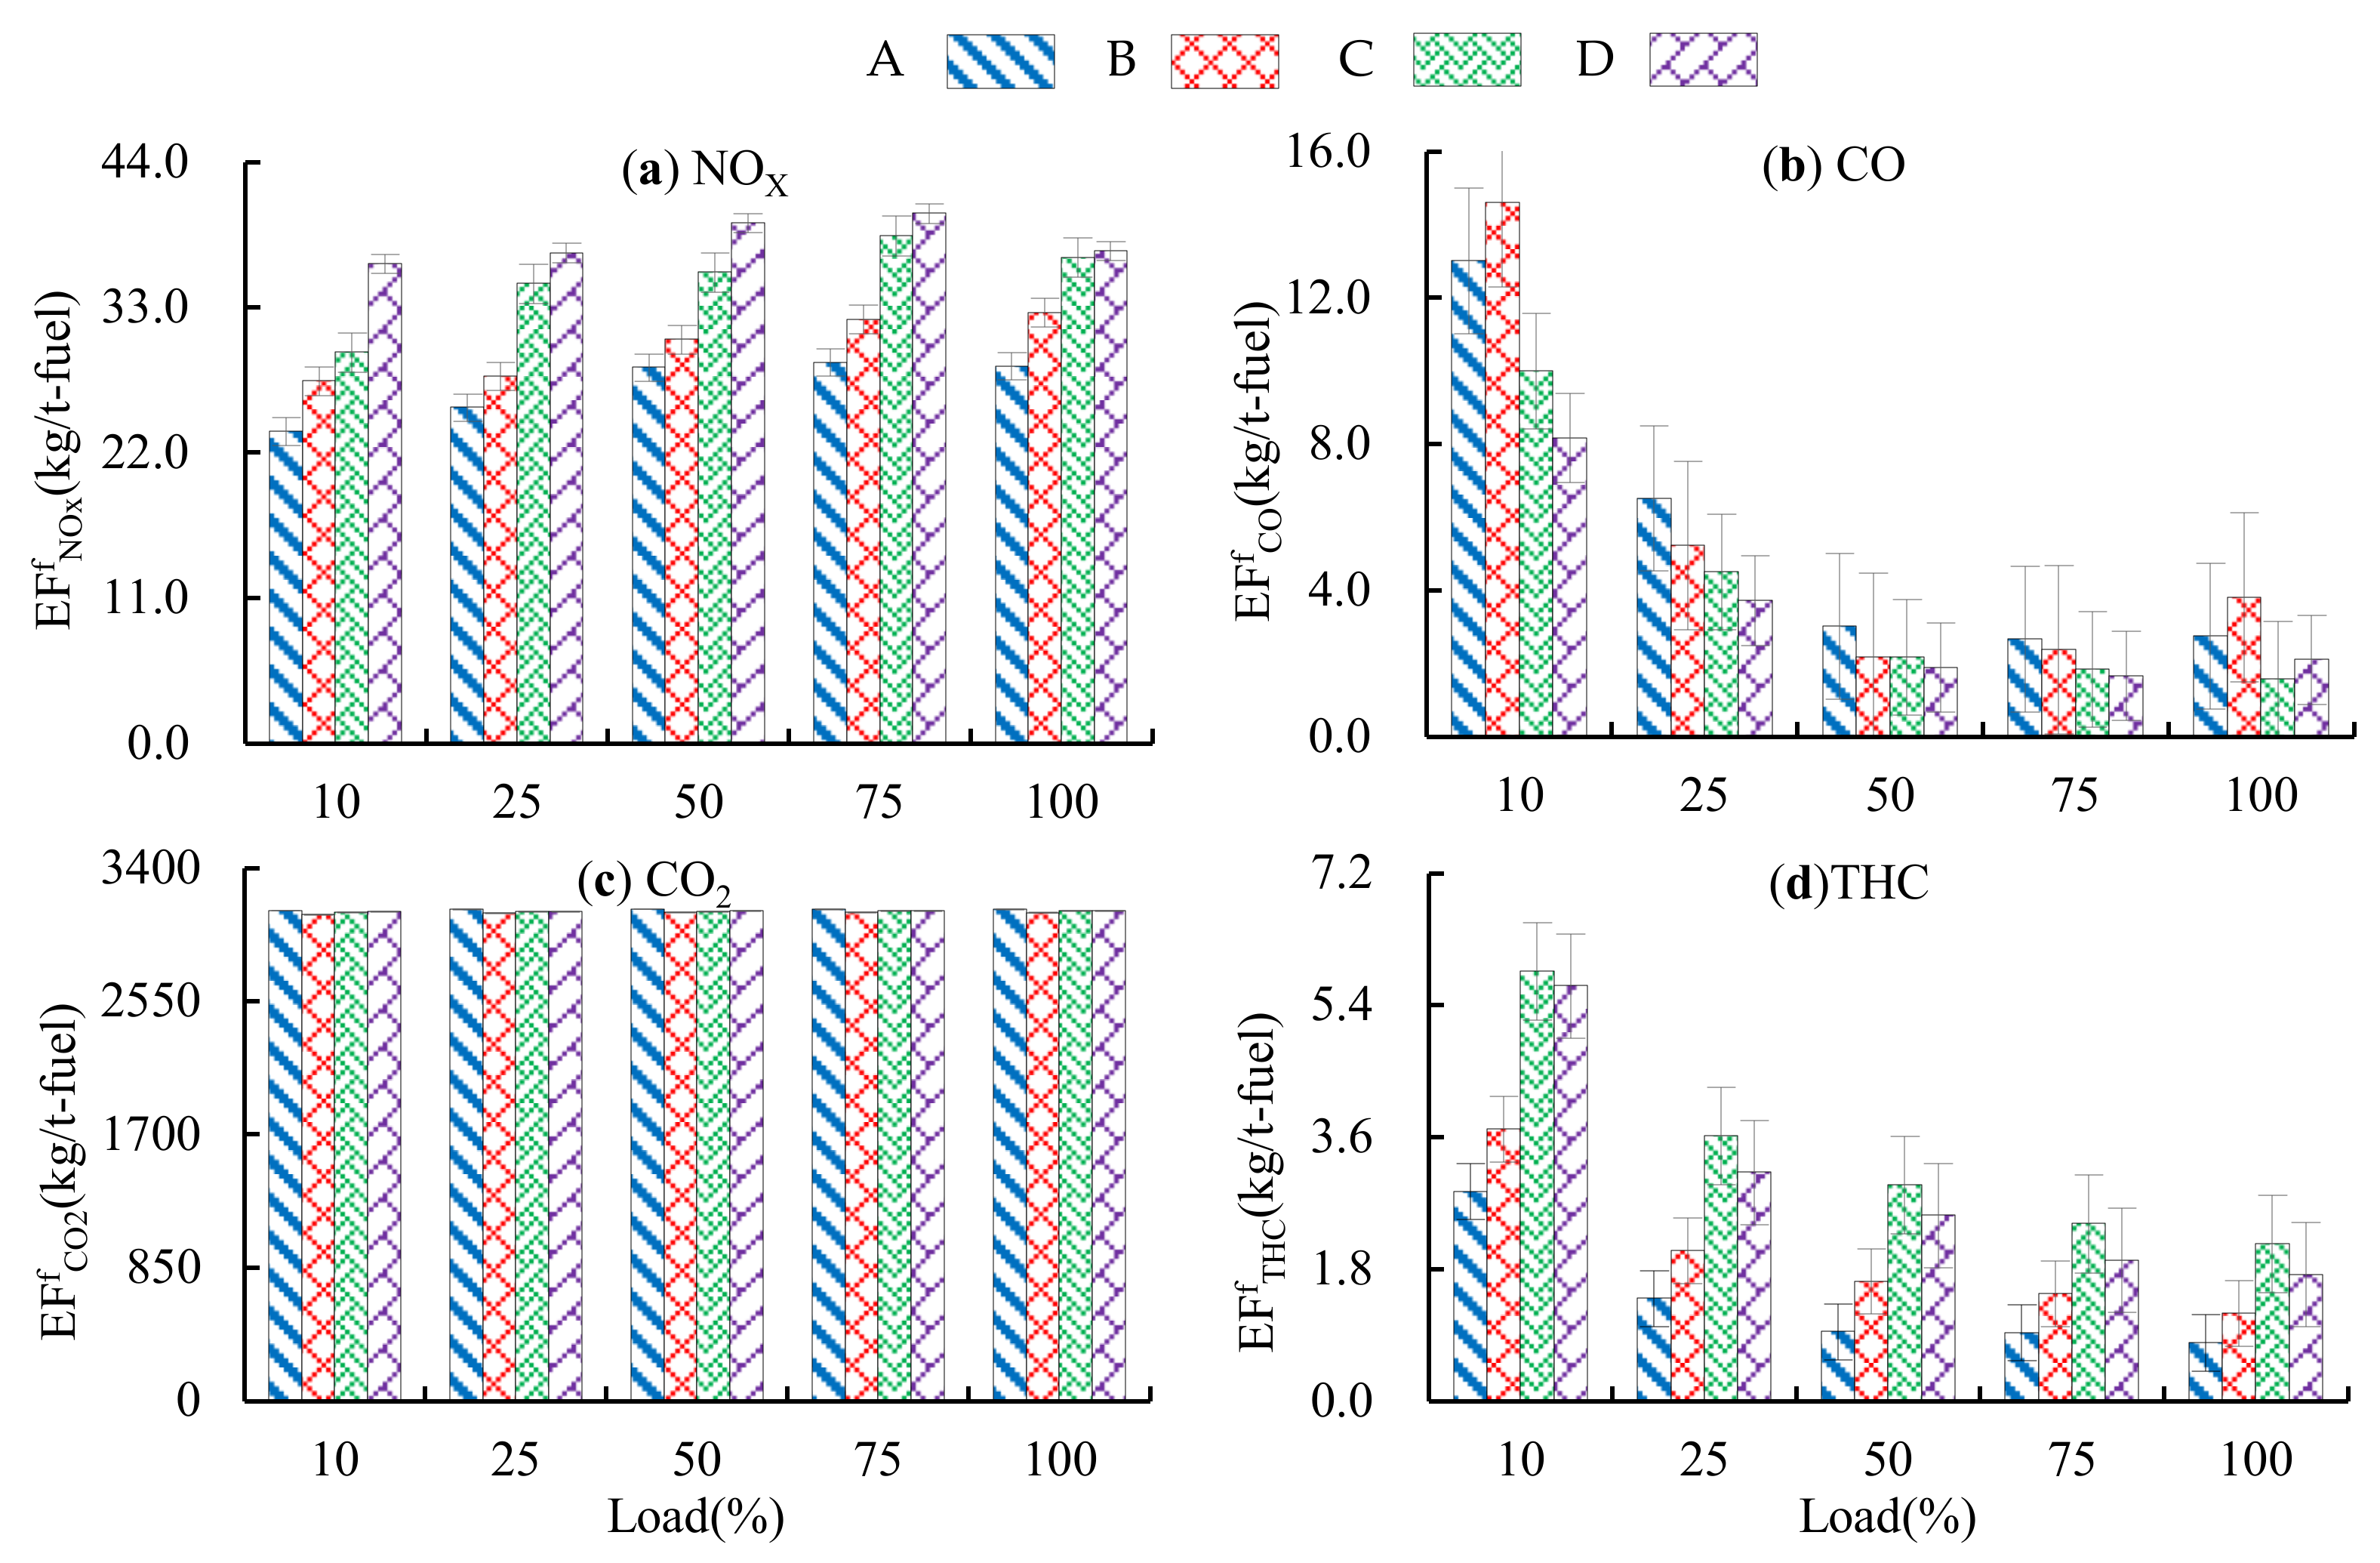
3.1. Fuel-Based Average Emission Factors

Based on the mass flow rate of the individual exhaust gas and fuel flow rate of diesel engines, the fuel-based emission factors of NOX, CO, CO2 and THC of each type of diesel engine can be calculated according to Equation (1), as shown in Table 2. The results shown in Table 2 are the average results of the statistics.

3.2. Fuel-Based Emission Factors Analysis

For different types and different power range of diesel engines, the fuel-based emission factors at each test load point are calculated and averaged. The emission factors at each test load point vary with the diesel engine load as shown in Figure 2 and Figure 3.
For the NOX fuel-based emission factor, it can be seen from Table 2 that with the increase of ME load, the NOX fuel-based emission factor shows a trend of gradual increase, conforming to the results of Sinha et al. [34]. Moreover, Class E and F are large two-stroke engines with lower speed and the two-stroke ME specific emission is significantly higher than the four-stroke. It can be seen from the working principle that the crankshaft of two-stroke diesel engine does work once per revolution, which leads to a higher thermal load. In addition, the combustion process of two-stroke diesel engines is close to adiabatic, which results in higher combustion temperature; therefore, more NOX will be generated [23]. The NOX fuel-based emission factor of Class D is 35.97% higher than that of Class A. As can be seen from Figure 2a, in the same power range, with the increase of ME load, the NOX fuel-based emission factor shows a downward trend. At the same load percentage, the NOX fuel-based emission factor increases with the increase of the ME power. For the AE, the NOX fuel-based emission factor variation trend is consistent with the ME, but within the same power range, the AE specific emission is less than that of the ME, which is 18.29%, 19.97%, 7.68% and 11.94% smaller, respectively, as shown in Table 2. High temperature, oxygen enrichment and long-term retention of nitrogen and oxygen in the cylinder are the main reasons for the formation of NOX in diesel engines [23]. As can be seen from Table 1, the AE runs at a higher rated speed and the retention time of nitrogen and oxygen in the cylinder is shorter, so the AE NOX fuel-based emission factor is lower than ME. If the AE’s 10% power point is also well optimized, then the weighted value of NOX is generally lower than ME.
The CO fuel-based emission factor shows a trend of gradual decrease for the four-stroke ME, and the CO fuel-based emission factor of Class D is 33.50% smaller than Class A, as shown in Table 2. A previous study has demonstrated that CO is mainly dependent on engine power, and the lower the engine power, the higher the CO emissions [34]. This is because the diesel engine CO emissions mainly depend on the excess air coefficient, combustion temperature and the uniformity of the fuel-air mixture in the combustion chamber [23]. In the same power range, the CO fuel-based emission factor shows a downward trend, and the specific emissions at 75% and 100% load points are similar, as shown in Figure 2b. This is because the usual load point for the ME is between 75% and 85% of maximum continuous rate (MCR), so the diesel engine is well optimized at 75% of the load point. For the AE, the CO fuel-based emission factor shows a trend of gradual decrease, which is consistent with the change trend of ME CO fuel-based emission factor. Similarly, the smaller the power, the higher the specific emissions of the engine. As shown in Figure 3b, the specific emission at the 10% load point is significantly higher, because the diesel engine has a small load and a relatively low combustion temperature, which easily leads to incomplete combustion.
The CO2 fuel-based emission factor is independent of engine load and type, as shown in Figure 2c and Figure 3c, but closely related to the carbon content of the fuel [11,23]. The given CO2 fuel-based emission factor reference value is 3206 kg/t-fuel [11], while the calculated values in this paper are from 3113.01 to 3166.47 kg/t-fuel. The result of this study shows that the combustion efficiency of domestic diesel engine is lower than the IMO reference value, between 97.10% and 98.77%, as shown in Table 2.
The THC fuel-based emission factor shows a trend of increasing first and then decreasing, which is partly consistent with previous research. Previous studies have shown that hydrocarbon emissions are dependent on engine power, and lower-power engines emit more hydrocarbons [23,34]. However, in this study, the Class C ME THC fuel-based emission factor is significantly higher at every test point. For the AE, the THC fuel-based emission factor is similar to that of ME. Hydrocarbons can also be generated when the fuel is not completely burned, especially at the edge of the combustion chamber. In addition, hydrocarbon generation depends on engine power utilization [34]. As shown in Figure 3d, at the 10% load point of AE, the engine power utilization rate is lower and therefore the hydrocarbon emission is higher.

3.3. Energy-Based Average Emission Factors

Based on the mass flow rate of individual exhaust gas and engine power, the energy-based emission factors of NOX, CO, CO2 and THC of each type of diesel engine can be calculated according to Equation (2), as shown in Table 3. The results shown in Table 3 are the average results of the statistics. In this paper, the NOX energy-based emission factors are all within the IMO Tier II standard limit.
For different types and power ranges of diesel engines, the energy-based emission factors at each test load point are calculated and averaged. The emission factors at each test load point vary with the diesel engine load as shown in Figure 4 and Figure 5.
For the NOX energy-based emission factor, it can be seen from Table 3 that with the increase of ME power, the NOX energy-based emission factor shows a trend of gradual increase, consistent with the fuel-based emission factor change trend. This trend is also consistent with the functional relationship between the two emission factors, that is, the ratio of the energy-based emission factor to the specific fuel consumption is the fuel-based emission factor [11]. Similarly, the two-stroke ME specific emission is significantly higher than the four-stroke’s. In addition to the reasons mentioned in Section 3.2, two-stroke diesel engines operate at lower speed with a relatively low emission limit of 14.4 g/kW h, while the four-stroke diesel engines with a speed of more than 500 rpm usually, and the emission limit is calculated according to the formula 44n−0.23 [33]. Therefore, the emission limit is quite different, leading to obvious differences in the calculation results in this paper. In general, AE has a smaller energy-based emission factor than ME, except for Class C AE. Under the same load point percentage, the NOX energy-based emission factor increases with the power increase for both the ME and AE, as shown in Figure 4a and Figure 5a. The ME CO and THC energy-based emission factors have no obvious change trend. However, the AE CO and THC energy-based emission factors decrease with the load increase. The CO2 energy-based emission factor is proportional to the specific fuel consumption. The two-stroke diesel engine specific fuel consumption is less than that of four-stroke diesel engine, so the corresponding CO2 energy-based emission factor is less than that of a four-stroke diesel engine, as shown in Figure 4c. The AE’s 10% power point has a higher specific fuel consumption, which also shows a higher CO2 energy-based emission factor, as shown in Figure 5c.

3.4. Energy-Based Emission Factors Regression Analysis

In order to explore the relationship between energy-based emission factors and diesel engine load, this paper makes a regression analysis of the relationship between diesel engine load and energy-based emission factors. After regression analysis, it is found that under the condition of the maximum coefficient of determination (R2), the relation between ME load and NOX energy-based emission factors can be fitted by quadratic polynomial (Class A, D and F) or power function (Class B, C and E), and the relation between ME load and CO, CO2 and THC energy-based emission factors can be fitted by quadratic polynomial. The relation between AE load and energy-based emission factors can be fitted by power function. The fitting relation can be expressed as follows and the equation coefficients are listed in Table 4.
EF r = a   ×   LP 2 + b   ×   LP + c
EF r = a   ×   LP - b
where EFr: regression analysis emission factor (g/kW h); LP: load percentage; a, b, c: equation coefficient.

3.5. Uncertainty Analysis

In the process of bench testing, data collection and statistical analysis, it is inevitable that there will be uncertainty factors, such as measurement error or data underrepresentation, which makes the emission factors obtained by statistical analysis have a certain uncertainty. When the statistical analysis results of this study are used in the emission inventory calculation, the following factors may lead to errors in the calculation results. Firstly, the emission levels of different engine types vary greatly, even in the same family/group, and thus the emission levels will be different. Secondly, the statistical results in this paper reflect the emission level of the new machines when they leave the factory. After some years of use, their emission levels may be changed, resulting in errors in the calculation. Therefore, the diesel engine performance degradation coefficient should be considered in the actual use process. Thirdly, the fuel oil used in the diesel engine emission test is light diesel oil, while the actual operating ships mainly use heavy fuel oil (HFO) or marine diesel oil (MDO), which will lead to errors in the calculation results, so the fuel correction coefficient should be considered [11].

4. Conclusions

Through statistical analysis of a large number of marine diesel engine bench emission test results, the marine diesel engine emission technology levels in China can be obtained comprehensively and accurately. The research results of this paper are as follows.
(1)
The marine ME NOX fuel-based emission factors from Class A to Class F are 33.25, 38.51, 39.83, 45.21, 66.01 and 76.58 kg/t, respectively. The CO fuel-based emission factors were 4.06, 3.78, 3.22, 2.70, 4.33 and 3.77 kg/t, respectively. The CO2 fuel-based emission factors are 3140, 3125, 3125, 3124, 3166 and 3158 kg/t, respectively. The THC fuel-based emission factors are 1.16, 1.83, 2.64, 1.82, 1.33 and 1.10 kg/t, respectively. The marine AE NOX fuel-based emission factors from Class A to Class D are 27.17, 30.82, 36.77 and 39.81 kg/t, respectively. The CO fuel-based emission factors are 5.12, 4.48, 3.05 and 2.66 kg/t, respectively. The CO2 fuel-based emission factors are 3141, 3113, 3123 and 3124 kg/t, respectively. The THC fuel-based emission factors are 1.16, 1.86, 2.87 and 2.54 kg/t, respectively.
(2)
The marine ME NOX energy-based emission factors from Class A to Class F are 6.57, 7.61, 8.02, 8.84, 11.09 and 11.75 g/kW h, respectively. The CO energy-based emission factors are 0.81, 0.63, 0.56, 0.57, 0.64 and 0.57 g/kW h, respectively. The CO2 energy-based emission factors are 656.74, 655.88, 659.71, 631.91, 534.99 and 530.28 g/kW h, respectively. The THC energy-based emission factors are 0.24, 0.37, 0.61, 0.37, 0.22 and 0.18 g/kW h, respectively. The marine AE NOX energy-based emission factors from Class A to Class D are 6.06, 6.74, 8.11 and 8.33 g/kW h, respectively. The CO energy-based emission factors are 0.77, 0.68, 0.56 and 0.47 g/kW h, respectively. The CO2 energy-based emission factors are 683.78, 684.91, 676.60 and 656.86 g/kW h, respectively. The THC energy-based emission factors are 0.21, 0.35, 0.61 and 0.48 g/kW h, respectively.
(3)
The diesel engine emission factors under different loads are analyzed in this paper. The NOX, CO, THC emission factor are closely related to the diesel engine type and load. The CO2 fuel-based emission factor is independent of engine load and type, but closely related to the fuel carbon content. The ME emission is an important source of ship exhaust emission. If the baseline emission factors are used to establish a Chinese ship exhaust emission inventory, when the top-down methodology is used to evaluate the ship’s exhaust emissions, the CO calculation results will be significantly reduced and the THC calculation results will be significantly amplified. When the bottom-up approach is used to evaluate the ship exhaust emissions, the NOX and THC calculation results will be significantly amplified. Usually, the bottom-up method provides a more correct representation of the ship emission inventory. Therefore, reasonable emission factors should be selected when establishing regional ship exhaust emission inventory.
(4)
Based on the regression analysis method, this paper studies the relationship between the energy-based emission factors and the diesel engine load. The results show that the relationship between the energy-based emission factors and the diesel engine load satisfied the quadratic polynomial or power function.
The research results of this paper, meeting the IMO NOX Tier II emission standard, can provide reliable basic data for the compilation of ship exhaust emission inventory in China and also provide a basis for the formulation of relevant policies.

Author Contributions

Conceptualization, P.S. and S.D.; methodology, H.X.; software, H.Q.; validation, P.S., S.D. and Z.M.; formal analysis, H.X.; investigation, Z.M., Y.Y. and H.Q.; resources, P.S.; data curation, P.S.; writing—original draft preparation, Z.M.; writing—review and editing, Z.M., Y.Y. and Y.Z.; visualization, Z.M. and Y.Y.; supervision, P.S.; project administration, P.S.; funding acquisition, P.S. All authors have read and agreed to the published version of the manuscript.

Funding

This research was funded by the Fundamental Research Funds for the Central Universities, China, Grant number 3132019330.

Institutional Review Board Statement

Not applicable.

Informed Consent Statement

Not applicable.

Data Availability Statement

The data presented in this study are available on request from Exhaust Gas Analysis Center of Dalian Maritime University or the corresponding author. The data are not publicly available due to their large size.

Conflicts of Interest

The authors declare no conflict of interest.

References

  1. UNCTAD. Review of Maritime Transport 2019; United Nations Publications: New York, NY, USA, 2019; Available online: https://unctad.org/system/files/official-document/rmt2019_en.pdf (accessed on 24 May 2021).
  2. Peng, W.; Yang, J.; Corbin, J.; Trivanovic, U.; Lobo, P.; Kirchen, P.; Rogak, S.; Gagne, S.; Miller, J.W.; Cocker, D. Comprehensive analysis of the air quality impacts of switching a marine vessel from diesel fuel to natural gas. Environ. Pollut. 2020, 266, 115404. [Google Scholar] [CrossRef]
  3. Endresen, Ø.; Sørgård, E.; Sundet, J.K.; Dalsøren, S.; Isaksen, I.S.A.; Berglen, T.F.; Gravir, G. Emission from international sea transportation and environmental impact. J. Geophys. Res. Space Phys. 2003, 108, 4560. [Google Scholar] [CrossRef]
  4. Toscano, D.; Murena, F. Atmospheric ship emissions in ports: A review. Correlation with data of ship traffic. Atmos. Environ. X 2019, 4, 100050. [Google Scholar] [CrossRef]
  5. Olivié, D.J.L.; Cariolle, D.; Teyssèdre, H.; Salas, D.; Voldoire, A.; Clark, H.; Saint-Martin, D.; Michou, M.; Karcher, F.; Balkanski, Y.; et al. Modeling the climate impact of road transport, maritime shipping and aviation over the period 1860-2100 with an AOGCM. Atmos. Chem. Phys. 2012, 12, 1449–1480. [Google Scholar] [CrossRef] [Green Version]
  6. Liu, H.; Fu, M.; Jin, X.; Shang, Y.; Shindell, D.; Faluvegi, G.; Shindell, C.; He, K. Health and climate impacts of ocean-going vessels in East Asia. Nat. Clim. Chang. 2016, 6, 1037–1041. [Google Scholar] [CrossRef]
  7. Corbett, J.J.; Winebrake, J.J.; Green, E.H.; Kasibhatla, P.; Eyring, V.; Lauer, A. Mortality from ship emissions: A global assessment. Environ. Sci. Technol. 2007, 41, 8512–8518. [Google Scholar] [CrossRef]
  8. Huang, C.; Hu, Q.Y.; Wang, H.Y.; Qiao, L.P.; Jing, S.A.; Wang, H.L.; Zhou, M.; Zhu, S.H.; Ma, Y.G.; Lou, S.R.; et al. Emission factors of particulate and gaseous compounds from a large cargo vessel operated under real-world conditions. Environ. Pollut. 2018, 242, 667–674. [Google Scholar] [CrossRef]
  9. Sharafian, A.; Blomerus, P.; Mérida, W. Natural gas as a ship fuel: Assessment of greenhouse gas and air pollutant reduction potential. Energy Policy 2019, 131, 332–346. [Google Scholar] [CrossRef]
  10. Miola, A.; Ciuffo, B. Estimating air emissions from ships: Meta-analysis of modelling approaches and available data sources. Atmos. Environ. 2011, 45, 2242–2251. [Google Scholar] [CrossRef]
  11. International Maritime Organization (IMO). Third IMO GHG Study 2014 Executive Summary and Final Report; International Maritime Organization (IMO): London, UK, 2014; pp. 1–295.
  12. Nunes, R.A.O.; Alvim-Ferraz, M.D.C.; Martins, F.; Sousa, S. The activity-based methodology to assess ship emissions—A review. Environ. Pollut. 2017, 231, 87–103. [Google Scholar] [CrossRef]
  13. Xing, H.; Duan, S.-L.; Huang, L.-Z.; Han, Z.-T.; Liu, Q.-A. Testbed-Based Exhaust Emission Factors for Marine Diesel Engines in China. Huan Jing Ke Xue Huanjing Kexue 2016, 37, 3750–3757. [Google Scholar]
  14. Cooper, D.; Gustafsson, T. Methodology for Calculating Emissions from Ships: 1. Update of Emission Factors; SMHI Swedish Meteorological and Hydrological Institute: Norrköping, Sweden, 2004; pp. 8–40.
  15. Cooper, D. Exhaust emissions from ships at berth. Atmos. Environ. 2003, 37, 3817–3830. [Google Scholar] [CrossRef]
  16. Moldanová, J.; Fridell, E.; Popovicheva, O.; Demirdjian, B.; Tishkova, V.; Faccinetto, A.; Focsa, C. Characterisation of partic-ulate matter and gaseous emissions from a large ship diesel engine. Atmos. Environ. J. 2009, 43, 2632–2641. [Google Scholar] [CrossRef]
  17. Hulskotte, J.H.J.; Denier van der Gon, H.A.C. Fuel consumption and associated emissions from seagoing ships at berth derived from an on-board survey. Atmos. Environ. 2010, 44, 1229–1236. [Google Scholar] [CrossRef]
  18. Chu-Van, T.; Ristovski, Z.; Pourkhesalian, A.M.; Rainey, T.; Garaniya, V.; Abbassi, R.; Jahangiri, S.; Enshaei, H.; Kam, U.-S.; Kimball, R.; et al. On-board measurements of particle and gaseous emissions from a large cargo vessel at different operating conditions. Environ. Pollut. 2018, 237, 832–841. [Google Scholar] [CrossRef] [Green Version]
  19. Fu, M.; Ding, Y.; Ge, Y.; Yu, L.; Yin, H.; Ye, W.; Liang, B. Real-world emissions of inland ships on the Grand Canal, China. Atmos. Environ. 2013, 81, 222–229. [Google Scholar] [CrossRef]
  20. Yin, H.; Ding, Y.; Ge, Y.S.; Ye, W.T.; Wang, J.F.; Bai, T.; Qian, L.Y. Emissions characteristics of diesel engines for inland waterway vessels in China. Res. Environ. Sci. 2014, 27, 470–476. [Google Scholar]
  21. Peng, Z.; Ge, Y.; Tan, J.; Fu, M.; Wang, X.; Chen, M.; Yin, H.; Ji, Z. Emissions from several in-use ships tested by portable emission measurement system. Ocean Eng. 2016, 116, 260–267. [Google Scholar] [CrossRef]
  22. Wang, C.; Hao, L.; Ma, D.; Ding, Y.; Lv, L.; Zhang, M.; Wang, H.; Tan, J.; Wang, X.; Ge, Y. Analysis of ship emission charac-teristics under real-world conditions in China. Ocean Eng. 2019, 194, 106615. [Google Scholar] [CrossRef]
  23. Zhang, F.; Chen, Y.J.; Tian, C.G.; Lou, D.M.; Li, J.; Zhang, G.; Matthias, V. Emission factors for gaseous and particulate pol-lutants from offshore diesel engine vessels in China. Atmos. Chem. Phys. 2016, 16, 6319–6334. [Google Scholar] [CrossRef] [Green Version]
  24. Zhang, F.; Chen, Y.; Chen, Q.; Feng, Y.; Shang, Y.; Yang, X.; Gao, H.; Tian, C.; Li, J.; Zhang, G.; et al. Real-world emission factors of gaseous and particulate pollutants from marine fishing boats and their total emissions in China. Environ. Sci. Technol. 2018, 52, 4910–4919. [Google Scholar] [CrossRef] [PubMed]
  25. Zhang, F.; Chen, Y.; Cui, M.; Feng, Y.; Yang, X.; Chen, J.; Zhang, Y.; Gao, H.; Tian, C.; Matthias, V.; et al. Emission factors and environmental implication of organic pollutants in PM emitted from various vessels in China. Atmos. Environ. 2018, 200, 302–311. [Google Scholar] [CrossRef]
  26. Tzannatos, E. Ship emissions and their externalities for Greece. Atmos. Environ. 2010, 44, 2194–2202. [Google Scholar] [CrossRef]
  27. Chen, D.; Wang, X.; Li, Y.; Lang, J.; Zhou, Y.; Guo, X.; Zhao, Y. High-spatiotemporal-resolution ship emission inventory of China based on AIS data in 2014. Sci. Total Environ. 2017, 609, 776–787. [Google Scholar] [CrossRef] [PubMed]
  28. Fan, Q.; Zhang, Y.; Ma, W.; Ma, H.; Feng, J.; Yu, Q.; Yang, X.; Ng, S.K.W.; Fu, Q.; Chen, L. Spatial and Seasonal Dynamics of Ship Emissions over the Yangtze River Delta and East China Sea and Their Potential Environmental Influence. Environ. Sci. Technol. 2016, 50, 1322–1329. [Google Scholar] [CrossRef]
  29. Fu, Q.; Shen, Y.; Zhang, J. On the ship pollutant emission inventory in Shanghai Port. J. Saf. Environ. 2012, 12, 57–63. [Google Scholar]
  30. Song, S. Ship emissions inventory, social cost and eco-efficiency in Shanghai Yangshan port. Atmos. Environ. 2014, 82, 288–297. [Google Scholar] [CrossRef]
  31. Yang, J.; Yin, P.-L.; Ye, S.-Q.; Wang, S.-S.; Zheng, J.-Y.; Ou, J.-M. Marine Emission Inventory and Its Temporal and Spatial Characteristics in the City of Shenzhen. Huan Jing Ke Xue Huanjing Kexue 2015, 36, 1217–1226. [Google Scholar]
  32. International Maritime Organization (IMO). Amendments to Technical Code on Control of Emission of Nitrogen Oxides from Marine Diesel Engines; International Maritime Organization (IMO): London, UK, 2008; pp. 1–100.
  33. China Classification Society (CCS). Technical Code on Control of Emission of Nitrogen Oxides from Marine Diesel Engines; China Classification Society (CCS): Beijing, China, 2017; pp. 1–93. [Google Scholar]
  34. Sinha, P.; Hobbs, P.V.; Yokelson, R.; Christian, T.J.; Kirchstetter, T.W.; Bruintjes, R. Emissions of trace gases and particles from two ships in the southern Atlantic Ocean. Atmos. Environ. 2003, 37, 2139–2148. [Google Scholar] [CrossRef]
Figure 1. Schematic diagram of diesel engine bench emission test.
Atmosphere 12 01108 g001
Figure 2. Relationship of fuel-based emission factors against engine load for ME. Fuel-based emission factors at four load points for the main engine. (a) NOX fuel-based emission factors, (b) CO fuel-based emission factors, (c) CO2 fuel-based emission factors, and (d) THC fuel-based emission factors. The relationship between diesel engine power and speed is cubic equation.
Atmosphere 12 01108 g002
Figure 3. Relationship of fuel-based emission factors against engine load for AE. Fuel-based emission factors at five load points for the auxiliary engine. (a) NOX fuel-based emission factors, (b) CO fuel-based emission factors, (c) CO2 fuel-based emission factors, and (d) THC fuel-based emission factors. The auxiliary engine works at a constant speed.
Atmosphere 12 01108 g003
Figure 4. Relationship of energy-based emission factors against engine load for ME. Energy-based emission factors at four load points for the main engine. (a) NOX energy-based emission factors, (b) CO energy-based emission factors, (c) CO2 energy-based emission factors, and (d) THC energy-based emission factors. The relationship between diesel engine power and speed is cubic equation.
Atmosphere 12 01108 g004
Figure 5. Relationship of energy-based emission factors against engine load for AE. Energy-based emission factors at five load points for the auxiliary engine. (a) NOX energy-based emission factors, (b) CO energy-based emission factors, (c) CO2 energy-based emission factors, and (d) THC energy-based emission factors. The diesel engine works at a constant speed.
Atmosphere 12 01108 g005
Table 1. Test cycle and weighting factors.
Test CycleParameterTest Power Point
E3Power100%75%50%25%-
Speed100%91%80%63%-
Weighting factor0.200.500.150.15-
D2Power100%75%50%25%10%
Speed100%100%100%100%100%
Weighting factor0.050.250.300.300.10
Table 2. Fuel-based emission factor (kg/t-fuel).
Power Range (kW)UseEFfNOxEFfCOEFfCO2EFfTHC
x ± s (1)n (2)x ± snx ± snx ± sn
130~600 (Class A)ME33.25 ± 6.82384.06 ± 3.15363140 ± 22361.16 ± 0.9435
601~1200 (Class B)ME38.51 ± 5.64133.78 ± 1.43123125 ± 15101.83 ± 0.9913
1201~2000 (Class C)ME39.83 ± 6.47113.22 ± 0.84103125 ± 20102.64 ± 1.3110
2001~4000 (Class D)ME45.21 ± 2.89132.70 ± 1.14123124 ± 14121.82 ± 0.6011
4001~10,000 (Class E)ME66.01 ± 5.34144.33 ± 1.99143166 ± 26151.33 ± 0.4015
10,001~26,000 (Class F)ME76.58 ± 2.39123.77 ± 2.56123158 ± 36121.10 ± 0.4911
Baseline [11]ME73.75 2.77 3206 3.08 + 0.06 (3)
130~600 (Class A)AE27.17 ± 6.81465.12 ± 3.15453141 ± 27421.16 ± 0.8441
601~1200 (Class B)AE30.82 ± 4.51204.48 ± 1.65203113 ± 30191.86 ± 0.7419
1201~2000 (Class C)AE36.77 ± 3.14123.05 ± 0.99113123 ± 22132.87 ± 1.2811
2001~4000 (Class D)AE39.81 ± 5.29162.66 ± 1.01163124 ± 16162.54 ± 0.9015
(1) x represents the mean, and s represents the standard deviation; (2) n represents the number of samples. (3) EFfTHC baseline consists of two parts: NMVOC baseline before + and CH4 baseline after +.
Table 3. Energy-based emission factor (g/kW h).
Power Range (kW)UseEFeNOxEFeCOEFeCO2EFeTHC
x ± s (1)n (2)x ± snx ± snx ± sn
130~600 (Class A)ME6.57 ± 1.25380.81 ± 0.6536656.74 ± 25.78370.24 ± 0.2035
601~1200 (Class B)ME7.61 ± 1.25130.63 ± 0.3412655.88 ± 10.86110.37 ± 0.2113
1201~2000 (Class C)ME8.02 ± 1.06110.56 ± 0.2010659.71 ± 28.23100.61 ± 0.3811
2001~4000 (Class D)ME8.84 ± 0.64130.57 ± 0.3213631.91 ± 12.47120.37 ± 0.1311
4001~10,000 (Class E)ME11.09 ± 1.22150.64 ± 0.3015534.99 ± 11.38150.22 ± 0.0615
10,001~26,000 (Class F)ME11.75 ± 1.15120.57 ± 0.3112530.28 ± 12.19120.18 ± 0.0811
Baseline [11]ME14.38 0.54 607 0.60 + 0.01 (3)
130~600 (Class A)AE6.06 ± 1.20460.77 ± 0.3742683.78 ± 44.80450.21 ± 0.1541
601~1200 (Class B)AE6.74 ± 0.86200.68 ± 0.2218684.91 ± 21.62190.35 ± 0.1619
1201~2000 (Class C)AE8.11 ± 0.67120.56 ± 0.2212676.60 ± 19.20130.61 ± 0.2712
2001~4000 (Class D)AE8.33 ± 0.85160.47 ± 0.1716656.86 ± 18.64160.48 ± 0.1715
(1) x represents the mean, and s represents the standard deviation; (2) n represents the number of samples. (3) EFfTHC baseline consists of two parts: NMVOC baseline before + and CH4 baseline after +.
Table 4. Coefficients of fitting formulas for energy-based emission factors (g/kW h).
EFrCoefficientsUseA B C D E F
EFrNOxaME4.4866.7507.3602.02510.4302.025
AE5.6396.3127.5717.528--
bME−10.8550.3580.252−7.7180.187−7.404
AE0.1410.1380.0940.141--
cME12.061--13.426-16.206
R2ME0.9980.9970.9940.9900.9930.996
AE0.8480.8300.8620.922--
EFrCOaME−1.5541.9953.5332.2612.412−1.484
AE0.4700.3760.2730.287--
bME1.482−2.844−6.335−3.361−4.7352.130
AE0.9200.9951.1410.903--
cME0.6801.6323.2611.6762.708−0.148
R2ME0.6830.8590.9920.9770.9920.677
AE0.9440.9130.9740.910--
EFrCO2aME187.467208.788162.377234.809138.482150.192
AE598.766614.658612.775593.429--
bME−252.016−288.915−272.459−366.696−192.703−206.388
AE0.2540.2080.1970.208--
cME731.774743.473761.148764.994597.147595.228
R2ME0.9950.9340.9830.9990.9480.977
AE0.9080.9110.9250.906--
EFrTHCaME0.2060.149−0.036−0.5490.1380.194
AE0.1390.2260.4450.324--
bME−0.202−0.271−0.3260.685−0.226−0.278
AE0.7620.6930.6050.671--
cME0.2660.4910.8820.2530.3100.275
R2ME0.8850.9990.9990.6650.9990.959
AE0.9130.9630.9900.984--
Publisher’s Note: MDPI stays neutral with regard to jurisdictional claims in published maps and institutional affiliations.

