
The Analysis of Long-Term Trends in the Meteorological and Hydrological Drought Occurrences Using Non-Parametric Methods—Case Study of the Catchment of the Upper Noteć River (Central Poland)


Abstract
1. Introduction
- (1)
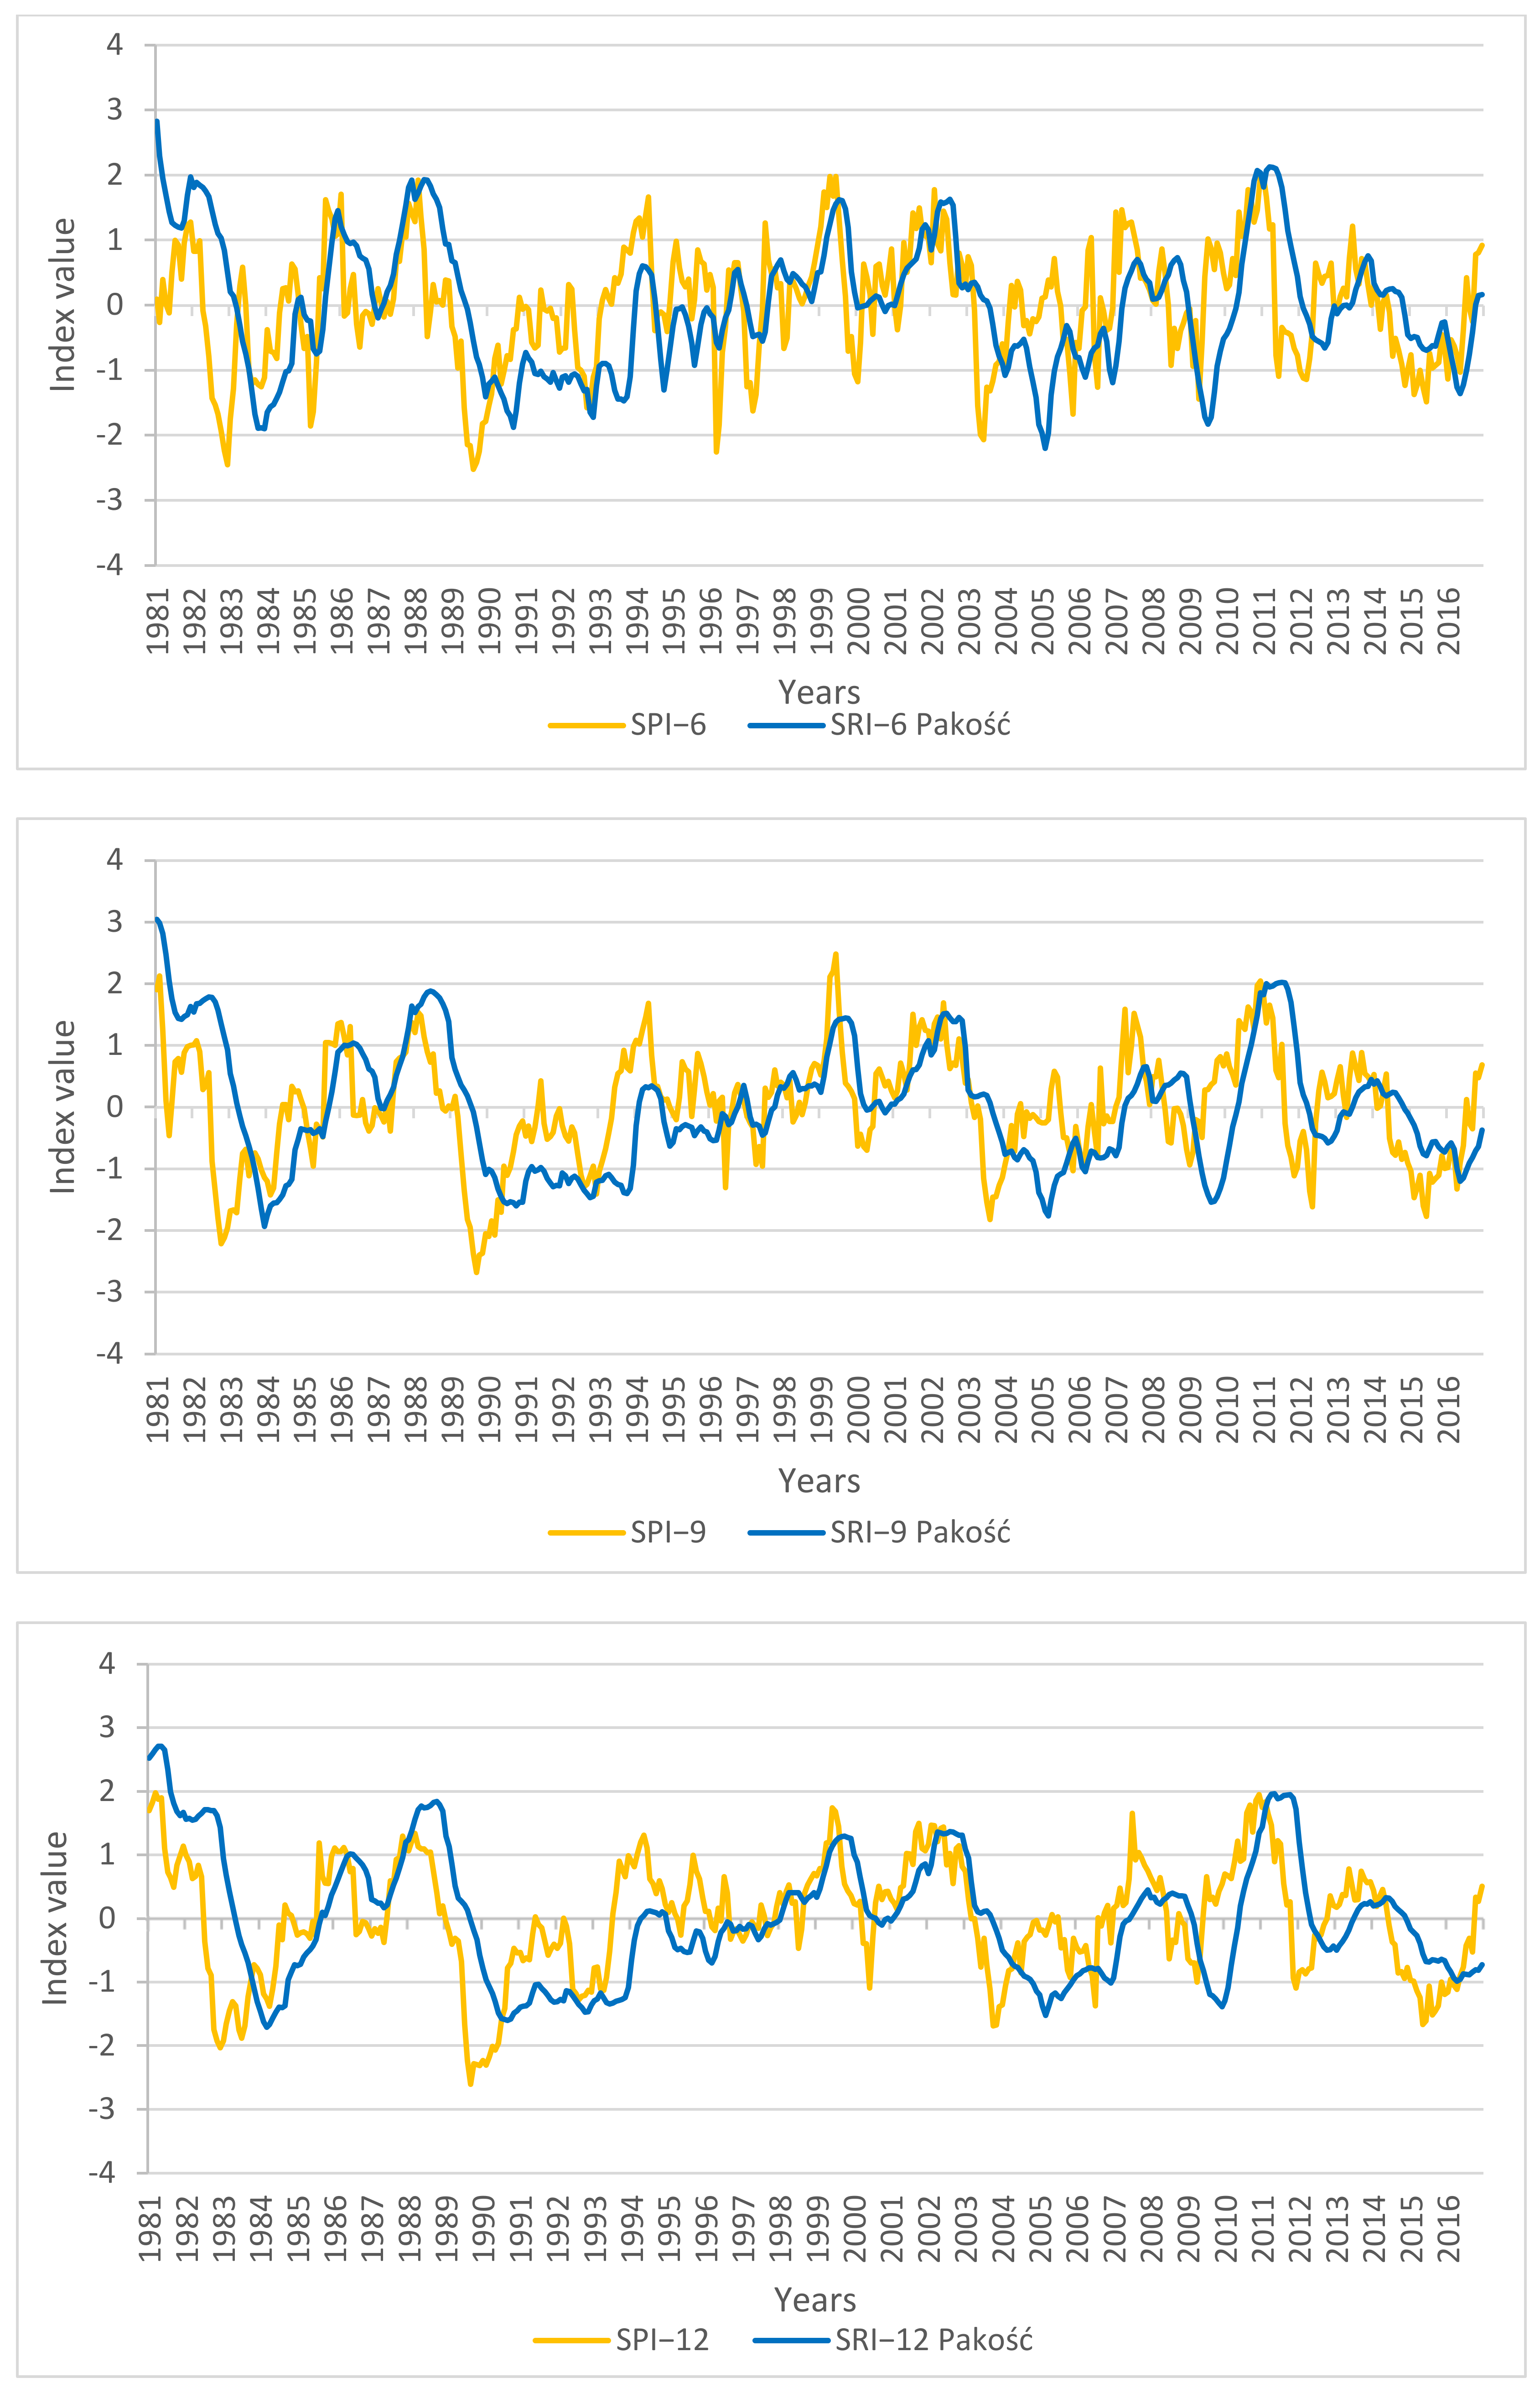
- the identification of meteorological droughts based on SPI indicators, and hydrological droughts based on SRI indicators in various time scales (1, 3, 6, 9 and 12 months)
- (2)
- trend determination using the Mann-Kendall (MK) test and Theil-Sen estimator
- (3)
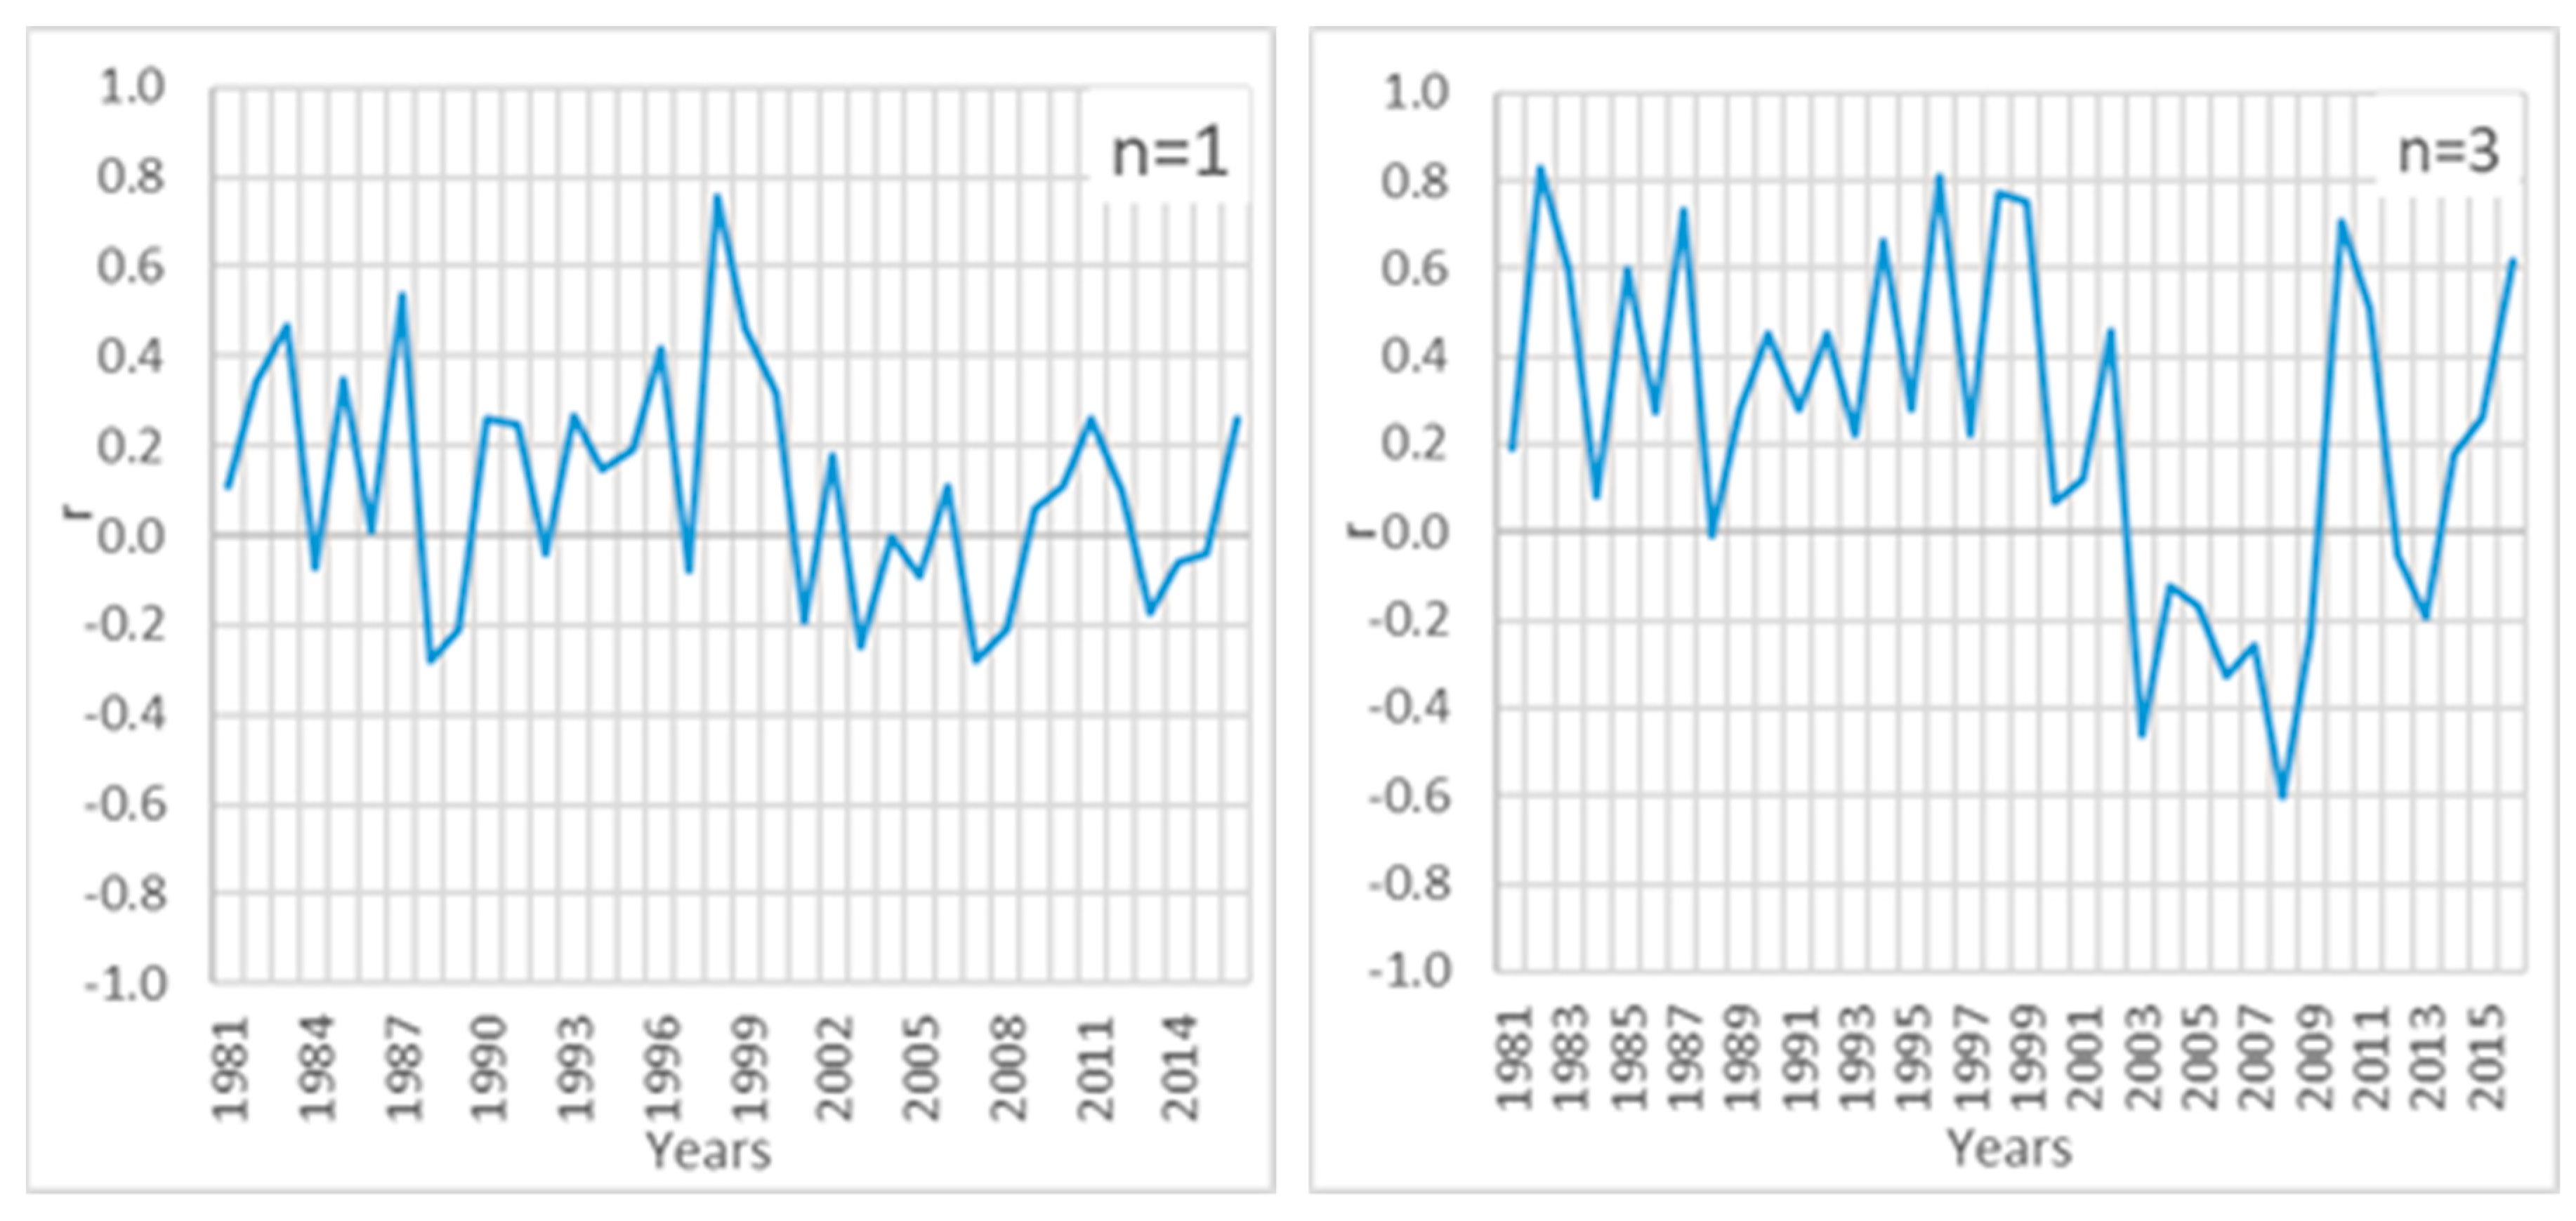
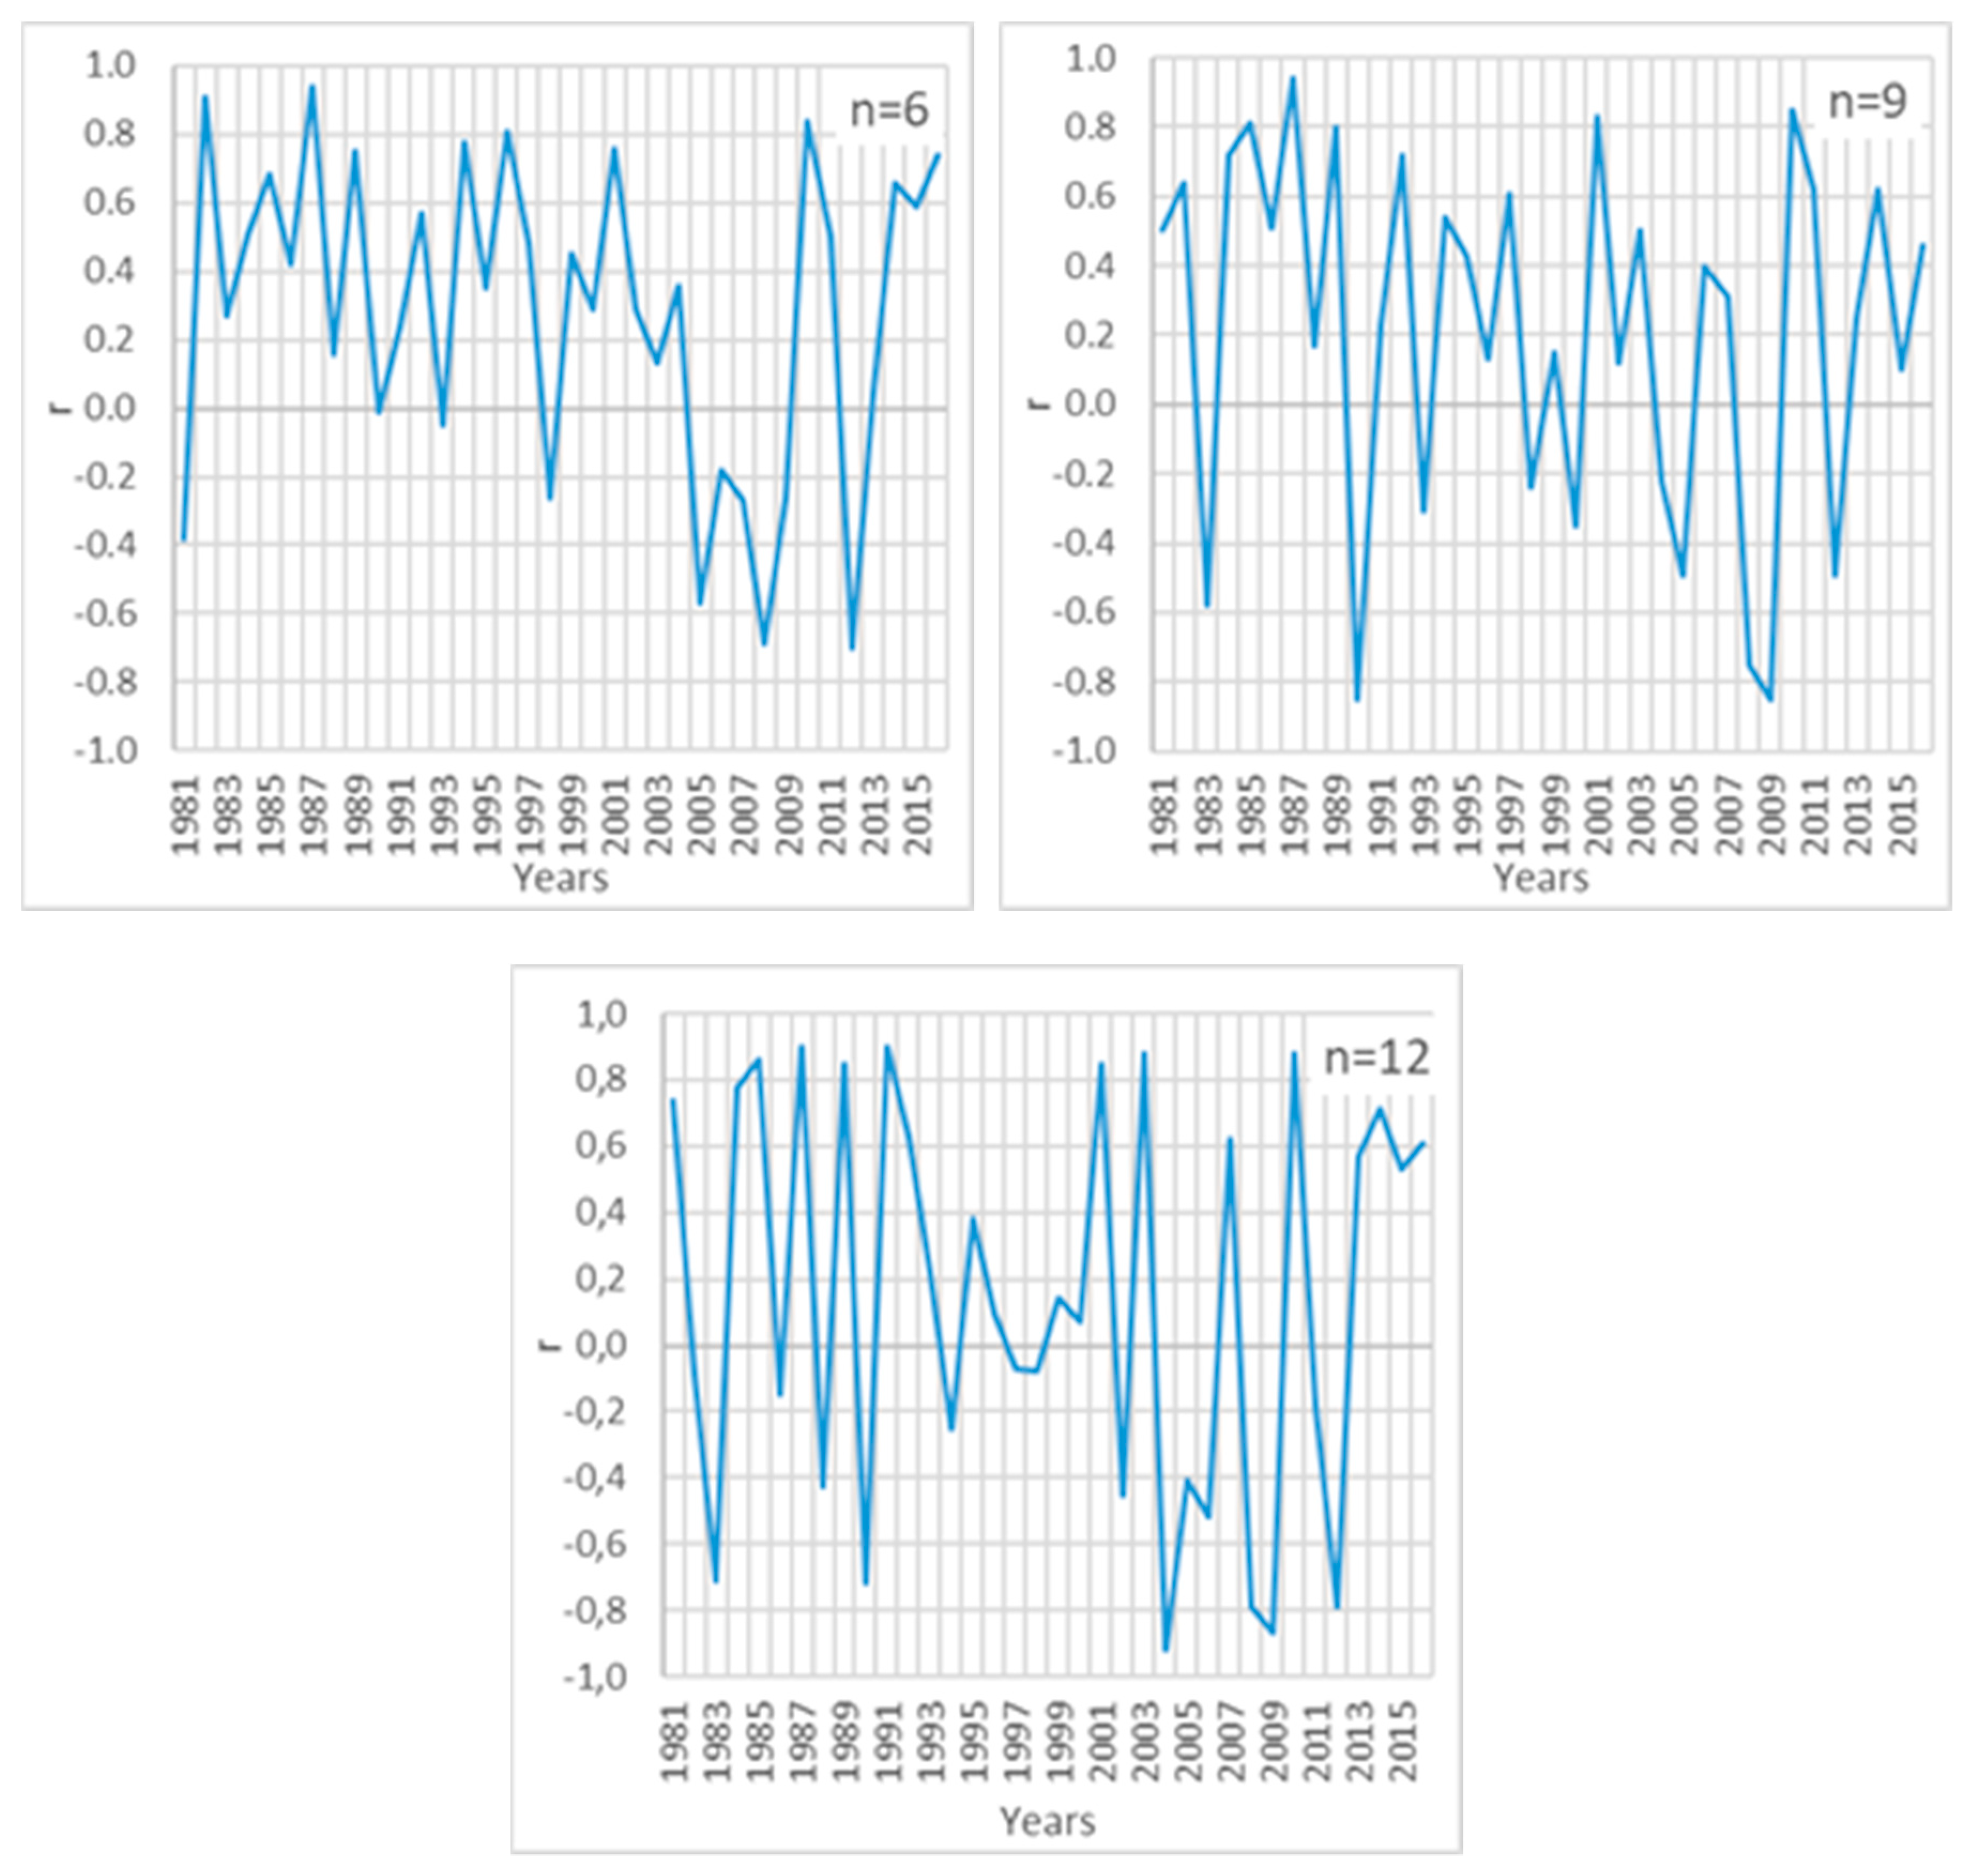
- the determination of a relationship between SPI and SRI by means of Pearson’s correlation analysis.
2. Materials and Methods
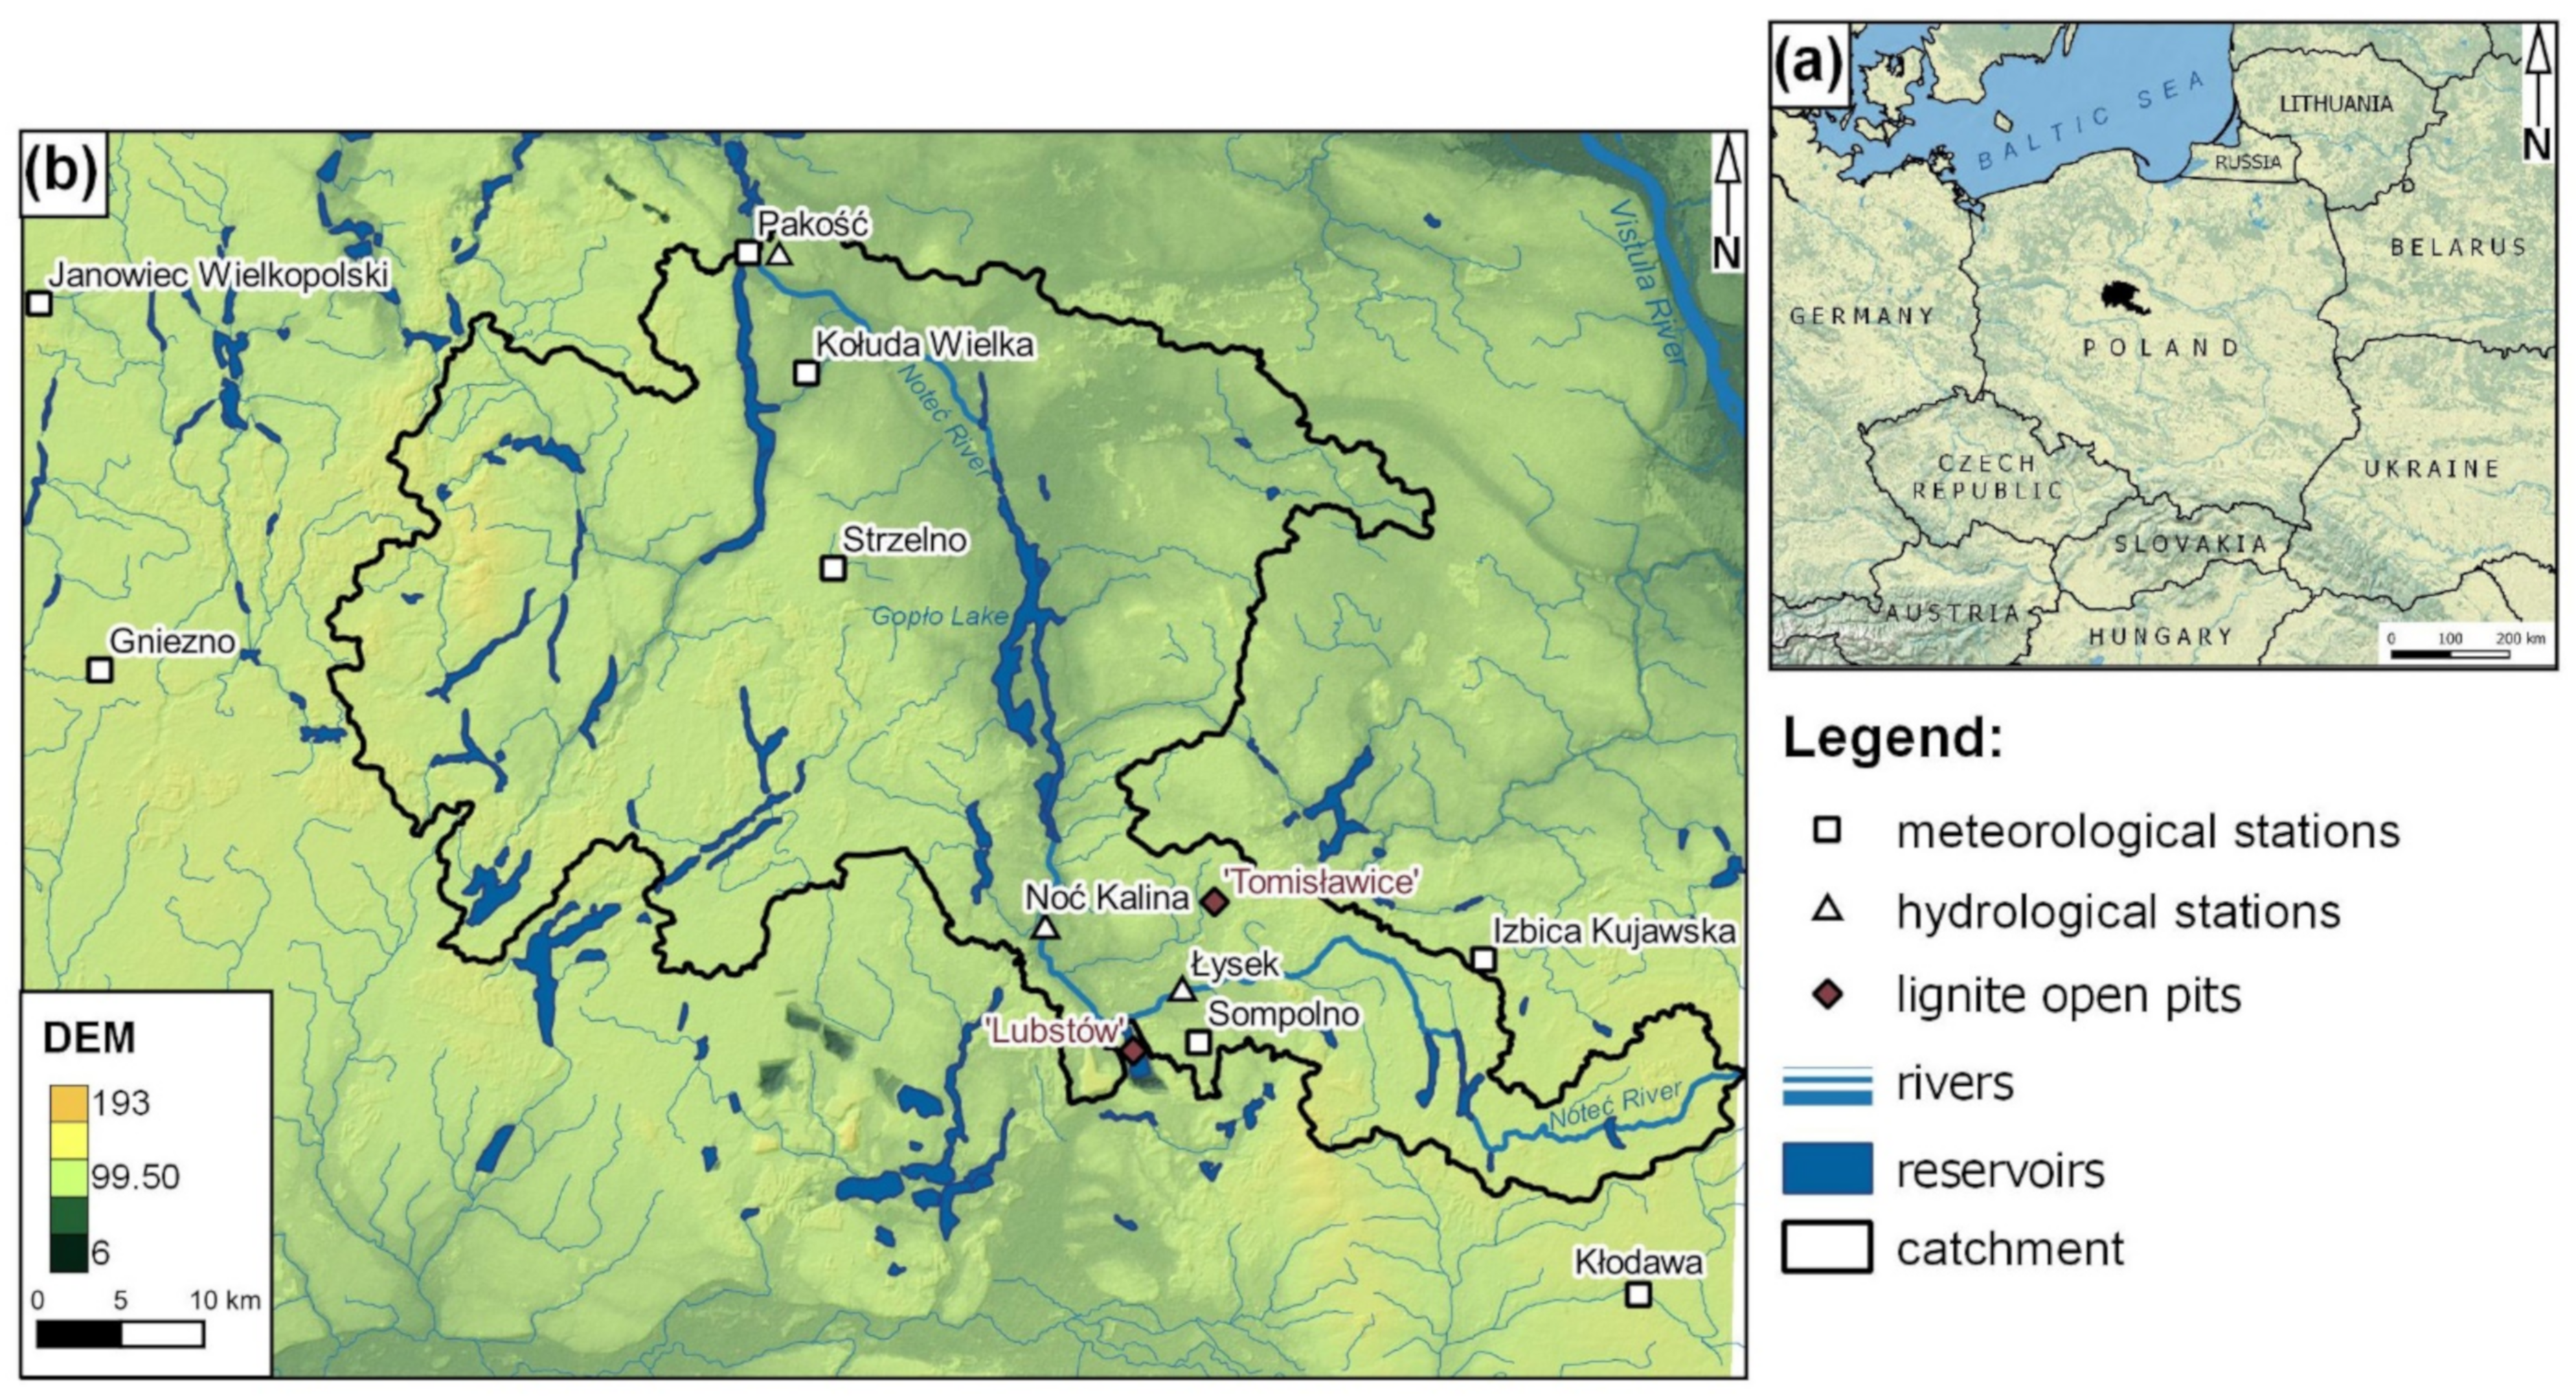
2.1. Study Area and Dataset
2.2. Standardized Precipitation Index (SPI) and Standardized Runoff Index (SRI)
- SPI, SRI—Standardized Precipitation Index, Standardized Runoff Index
- —transformed sum of precipitation, discharges
- µ—mean value of the normalized index x
- σ—standard deviation of index x
2.3. Mann–Kendall Test
- xj and xk—values of the variable in individual years j and k, where j > k,
- n—the series count (number of years).
2.4. Sen’s Slope
2.5. Pearson’s Correlation Analysis
3. Results and Discussion
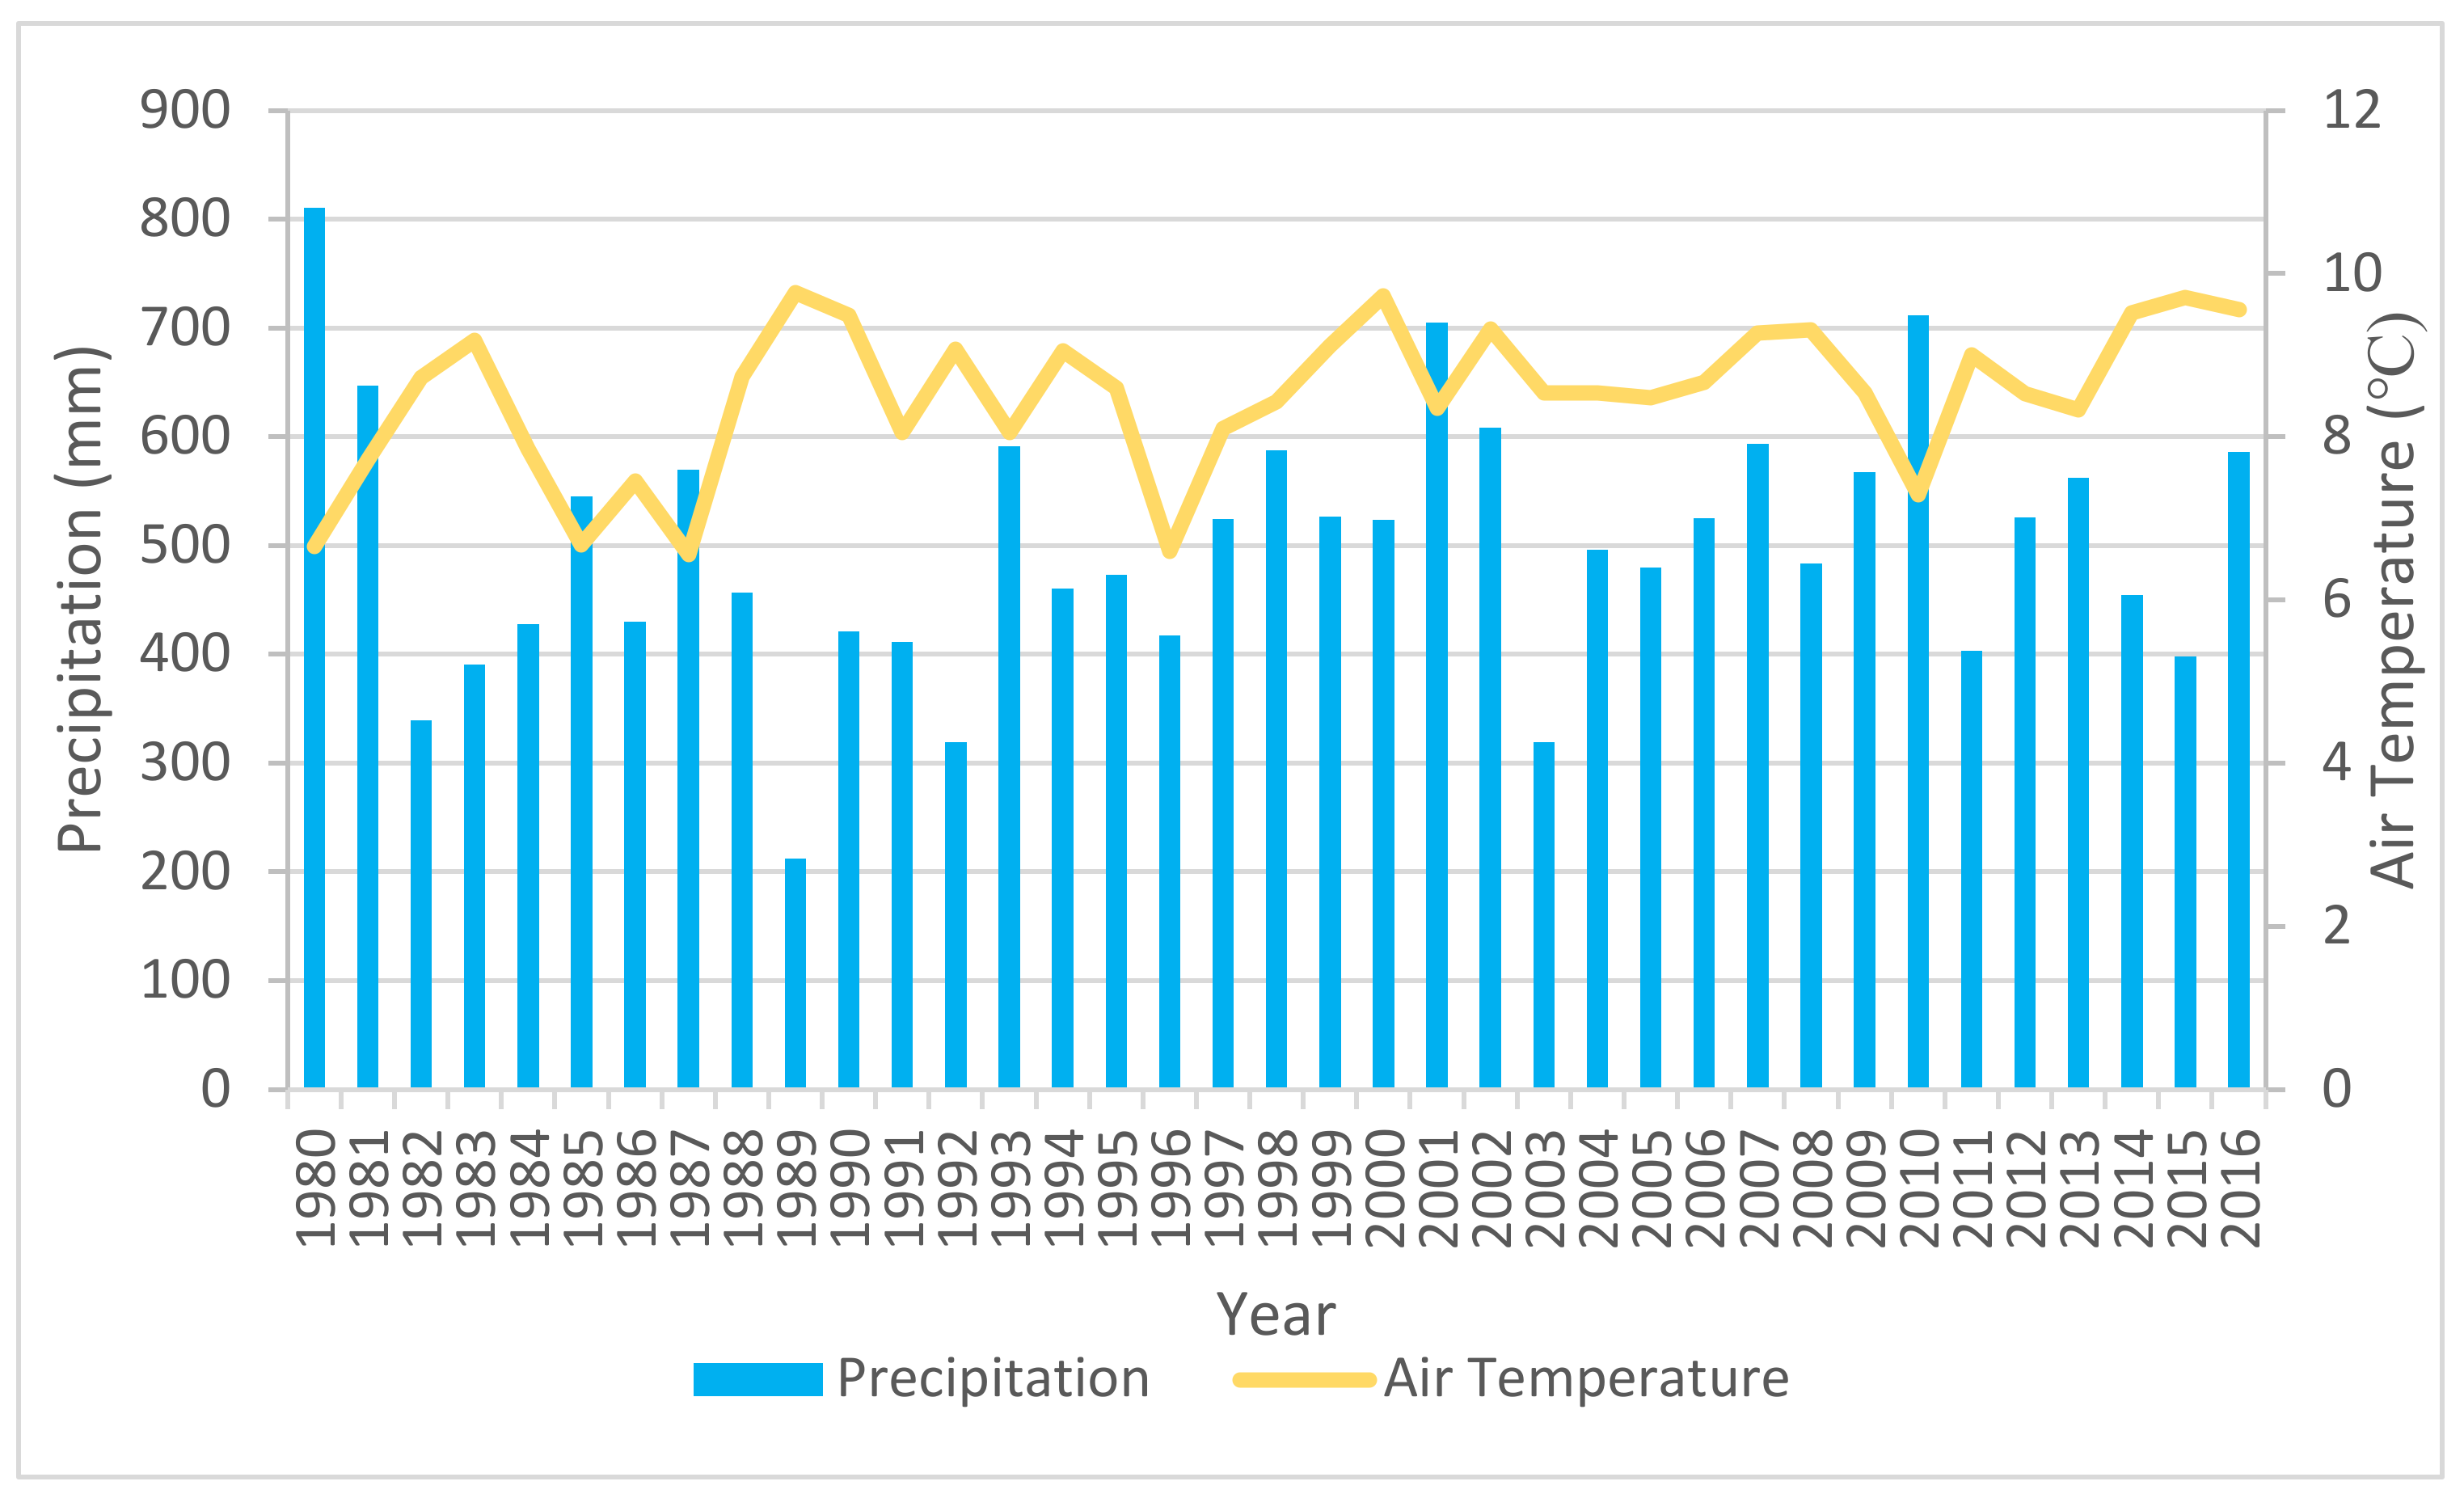
3.1. The Characteristics of Droughts in the Period of 1981–2016
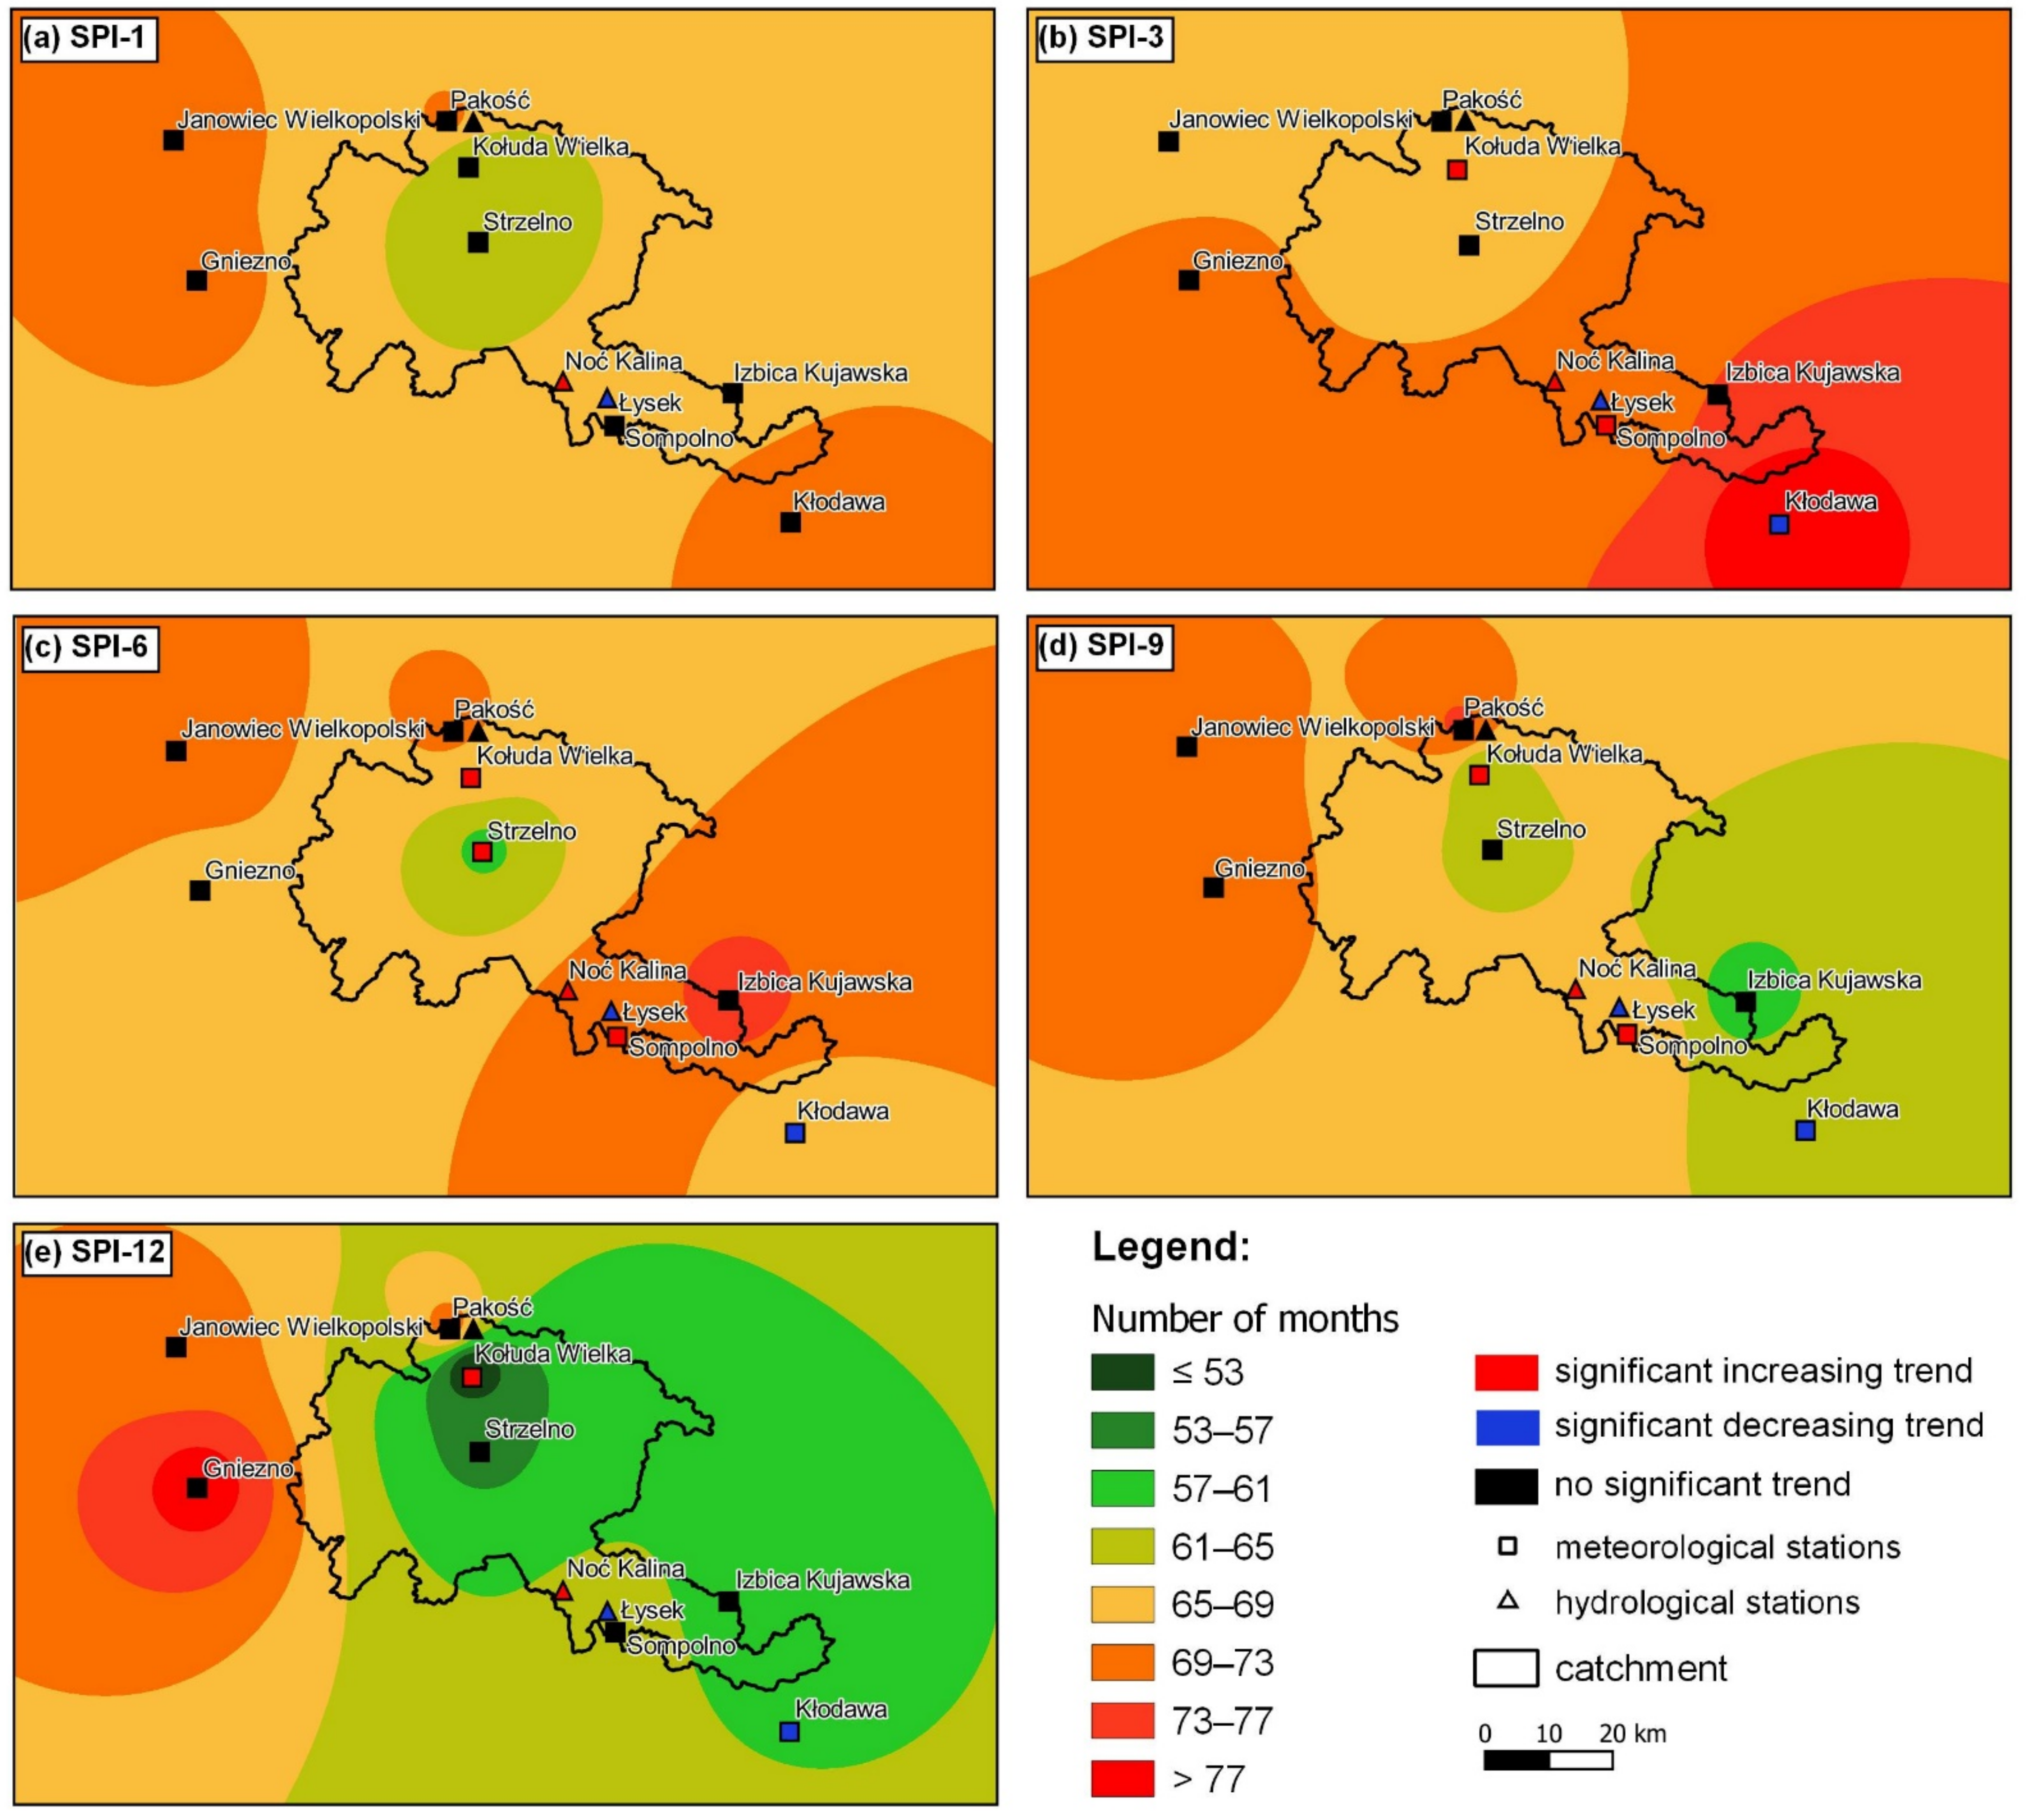
3.2. Trends in Meteorological and Hydrological Drought Occurrences
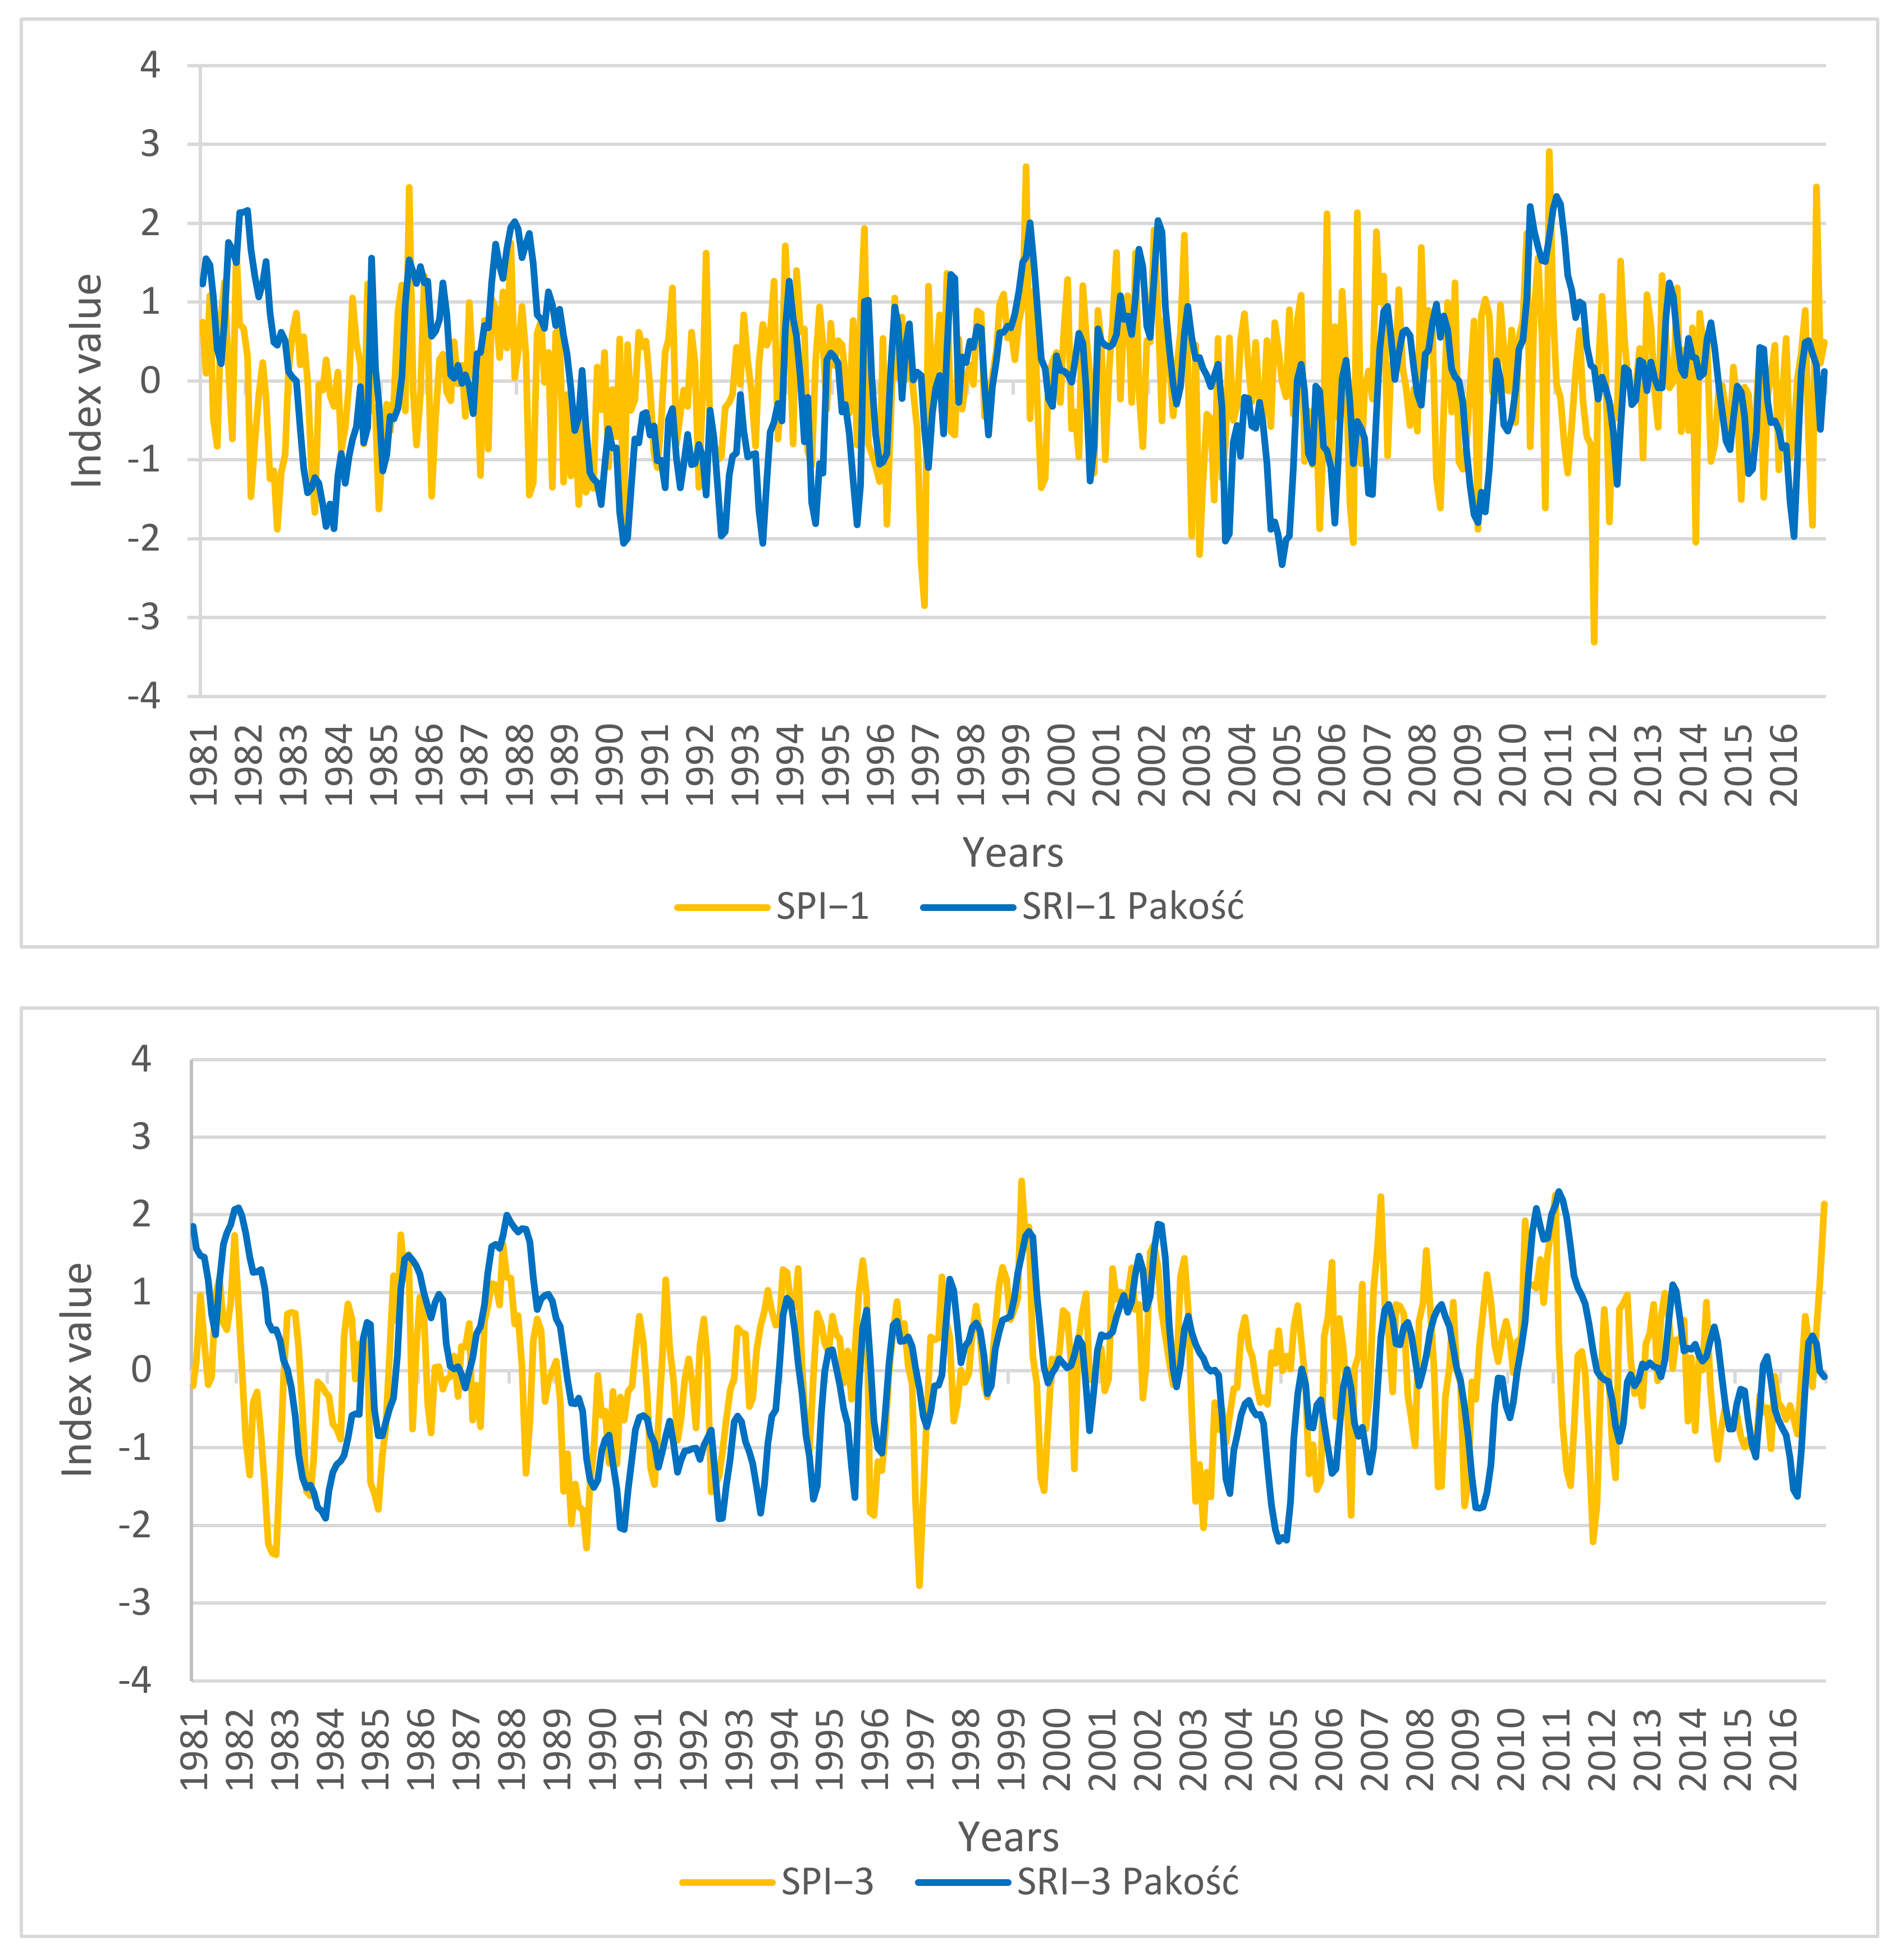
3.3. Correlations between SPI and SRI Values
3.4. Discussion
4. Conclusions
- -
- Statistically significant trends, at the significance level of 0.05, were identified at three out of eight meteorological stations, based on the Mann–Kendall test and the Sen slope.
- -
- An increase in meteorological drought occurrences was recorded at the Kłodawa station (downward trend), while a decrease in droughts was recorded at the Sompolno and Kołuda Wielka stations.
- -
- Hydrological droughts showed an upward trend at the Łysek station, while a decrease in the trend was recorded at the Noć Kalina station, and both were statistically significant. No changes in the trend were found at the Pakość station.
- -
- The analysis of the correlation between meteorological and hydrological droughts in individual years showed a strong relationship in dry years e.g., 1982 and 1989. The maximum correlation index was 0.94 and was identified over longer accumulation periods i.e., 6 and 9 months.
- -
- The anthropogenic effects related to the operation of an open cast lignite mine may have had an impact on the relationship between droughts.
Author Contributions
Funding
Institutional Review Board Statement
Informed Consent Statement
Data Availability Statement
Conflicts of Interest
References
- Nalbantis, I.; Tsakiris, G. Assessment of Hydrological Drought Revisited. Water Resour. Manag. 2009, 23, 881–897. [Google Scholar] [CrossRef]
- Chen, S.-T.; Kuo, C.-C.; Yu, P.-S. Historical trends and variability of meteorological droughts in Taiwan. Hydrol. Sci. J. 2009, 54, 430–441. [Google Scholar] [CrossRef]
- Roodari, A.; Hrachowitz, M.; Hassanpour, F.; Yaghoobzadeh, M. Signatures of human intervention—Or not? Downstream intensification of hydrological drought along a large Central Asian river: The individual roles of climate variability and land use change. Hydrol. Earth Syst. Sci. 2021, 25, 1943–1967. [Google Scholar] [CrossRef]
- Bae, H.; Ji, H.; Lim, Y.-J.; Ryu, Y.; Kim, M.-H.; Kim, B.-J. Characteristics of drought propagation in South Korea: Relationship between meteorological, agricultural, and hydrological droughts. Nat. Hazards 2019, 99, 1–16. [Google Scholar] [CrossRef]
- Faridatul, M.; Ahmed, B. Assessing Agricultural Vulnerability to Drought in a Heterogeneous Environment: A Remote Sensing-Based Approach. Remote Sens. 2020, 12, 3363. [Google Scholar] [CrossRef]
- Dai, A. Drought under global warming: A review. Wiley Interdiscip. Rev. Clim. Chang. 2011, 2, 45–65. [Google Scholar] [CrossRef]
- Tian, L.; Yuan, S.; Quiring, S. Evaluation of six indices for monitoring agricultural drought in the south-central United States. Agric. For. Meteorol. 2018, 249, 107–119. [Google Scholar] [CrossRef]
- Wilhite, D.A.; Glantz, M.H. Understanding: The Drought Phenomenon: The Role of Definitions. Water Int. 1985, 10, 111–120. [Google Scholar] [CrossRef]
- Bąk, B.; Kubiak-Wójcicka, K.K. Assessment of meteorological and hydrological drought in Torun (central Poland town) in 1971–2010 based on standardized indicators. In Proceedings of the Water Resources and Wetlands Conference, Tulcea, Romania, 8–10 September 2016; Gastescu, P., Bretcan, P., Eds.; pp. 164–170. Available online: http://www.limnology.ro/wrw2016/proceedings/22_Bak_Kubiak.pdf (accessed on 15 July 2021).
- Hasan, H.H.; Razali, S.F.M.; Muhammad, N.S.; Hamzah, F.M. Assessment of probability distributions and analysis of the minimum storage draft rate in the equatorial region. Nat. Hazards Earth Syst. Sci. 2021, 21, 1–19. [Google Scholar] [CrossRef]
- Zhao, F.; Wu, Y.; Sivakumar, B.; Long, A.; Qiu, L.; Chen, J.; Wang, L.; Liu, S.; Hu, H. Climatic and hydrologic controls on net primary production in a semiarid loess watershed. J. Hydrol. 2018, 568, 803–815. [Google Scholar] [CrossRef]
- Wu, J.; Chen, X.; Love, C.A.; Yao, H.; Chen, X.; AghaKouchak, A. Determination of water required to recover from hydrological drought: Perspective from drought propagation and non-standardized indices. J. Hydrol. 2020, 590, 125227. [Google Scholar] [CrossRef]
- Jehanzaib, M.; Sattar, M.N.; Lee, J.-H.; Kim, T.-W. Investigating effect of climate change on drought propagation from meteorological to hydrological drought using multi-model ensemble projections. Stoch. Environ. Res. Risk Assess. 2019, 34, 7–21. [Google Scholar] [CrossRef]
- Gleick, P. Water, Drought, Climate Change, and Conflict in Syria. Weather. Clim. Soc. 2014, 6, 331–340. [Google Scholar] [CrossRef]
- Craft, K.E.; Mahmood, R.; King, S.A.; Goodrich, G.; Yan, J. Twentieth century droughts and agriculture: Examples from impacts on soybean production in Kentucky, USA. Ambio 2015, 44, 557–568. [Google Scholar] [CrossRef][Green Version]
- Holman, I.; Hess, T.; Rey, D.; Knox, J. A Multi-Level Framework for Adaptation to Drought Within Temperate Agriculture. Front. Environ. Sci. 2021, 8. [Google Scholar] [CrossRef]
- Spinoni, J.; Barbosa, P.; Bucchignani, E.; Cassano, J.; Cavazos, T.; Christensen, J.H.; Christensen, O.B.; Coppola, E.; Evans, J.; Geyer, B.; et al. Future Global Meteorological Drought Hot Spots: A Study Based on CORDEX Data. J. Clim. 2020, 33, 3635–3661. [Google Scholar] [CrossRef]
- IPCC. Changes in Climate Extremes and Their Impacts on the Natural Physical Environment. In Managing the Risks of Extreme Events and Disasters to Advance Climate Change Adaptation: Special Report of the Intergovernmental Panel on Climate Change; Field, C.B., Barros, V., Stocker, T.F., Qin, D., Dokken, D.J., Ebi, K.L., Mastrandrea, M.D., Mach, K.J., Plattner, G.-K., Allen, S.K., et al., Eds.; Cambridge University Press: Cambridge, UK, 2012. [Google Scholar]
- Vicente-Serrano, S.M.; Dominguez-Castro, F.; McVicar, T.R.; Tomas-Burguera, M.; Peña-Gallardo, M.; Noguera, I.; López-Moreno, J.I.; Peña, D.; El Kenawy, A. Global characterization of hydrological and meteorological droughts under future climate change: The importance of timescales, vegetation-CO2 feedbacks and changes to distribution functions. Int. J. Clim. 2019, 40, 2557–2567. [Google Scholar] [CrossRef]
- Chiang, F.; Mazdiyasni, O.; AghaKouchak, A. Evidence of anthropogenic impacts on global drought frequency, duration, and intensity. Nat. Commun. 2021, 12, 2754. [Google Scholar] [CrossRef]
- Jehanzaib, M.; Kim, T.-W. Exploring the influence of climate change-induced drought propagation on wetlands. Ecol. Eng. 2020, 149, 105799. [Google Scholar] [CrossRef]
- Gao, L.; Zhang, Y. Spatio-temporal variation of hydrological drought under climate change during the period 1960–2013 in the Hexi Corridor, China. Arid Land 2016, 82, 157–171. [Google Scholar] [CrossRef]
- Ndehedehe, C.E.; Agutu, N.O.; Ferreira, V.G.; Getirana, A. Evolutionary drought patterns over the Sahel and their teleconnections with low frequency climate oscillations. Atmos. Res. 2019, 233, 104700. [Google Scholar] [CrossRef]
- Bazrafshan, O.; Zamani, H.; Shekari, M. A copula-based index for drought analysis in arid and semi-arid regions in Iran. Nat. Resour. Model. 2020, 33, e12237. [Google Scholar] [CrossRef]
- Dikici, M. Drought analysis with different indices for the Asi Basin (Turkey). Sci. Rep. 2020, 10, 1–12. [Google Scholar] [CrossRef]
- Mahdavi, P.; Kharazi, H.G.; Eslami, H.; Zohrabi, N.; Razaz, M. Drought occurrence under future climate change scenarios in the Zard River basin, Iran. Water Supply 2020, 21, 899–917. [Google Scholar] [CrossRef]
- Buras, A.; Rammig, A.; Zang, C.S. Quantifying impacts of the 2018 drought on European ecosystems in comparison to 2003. Biogeosciences 2020, 17, 1655–1672. [Google Scholar] [CrossRef]
- Kubiak-Wójcicka, K.; Nagy, P.; Zeleňáková, M.; Hlavatá, H.; Abd-Elhamid, H. Identification of Extreme Weather Events Using Meteorological and Hydrological Indicators in the Laborec River Catchment, Slovakia. Water 2021, 13, 1413. [Google Scholar] [CrossRef]
- Emadodin, I.; Corral, D.; Reinsch, T.; Kluß, C.; Taube, F. Climate Change Effects on Temperate Grassland and Its Implication for Forage Production: A Case Study from Northern Germany. Agriculture 2021, 11, 232. [Google Scholar] [CrossRef]
- Koffi, B.; Kouadio, Z.A.; Kouassi, K.H.; Yao, A.B.; Sanchez, M. Impact of Meteorological Drought on Streamflows in the Lobo River Catchment at Nibéhibé, Côte d’Ivoire. J. Water Resour. Prot. 2020, 12, 495–511. [Google Scholar] [CrossRef]
- Awange, J.L.; Mpelasoka, F.; Goncalves, R. When every drop counts: Analysis of Droughts in Brazil for the 1901-2013 period. Sci. Total Environ. 2016, 566–567, 1472–1488. [Google Scholar] [CrossRef] [PubMed]
- Hari, V.; Rakovec, O.; Markonis, Y.; Hanel, M.; Kumar, R. Increased future occurrences of the exceptional 2018–2019 Central European drought under global warming. Sci. Rep. 2020, 10, 1–10. [Google Scholar] [CrossRef]
- Kubiak-Wójcicka, K. Assessment of water resources in Poland. In Quality in Water Resources in Poland; Zeleňáková, M., Kubiak-Wójcicka, K., Negm, A.M., Eds.; Springer International Publishing: Cham, Switzerland, 2021; pp. 15–34. [Google Scholar] [CrossRef]
- Somorowska, U. Changes in Drought Conditions in Poland over the Past 60 Years Evaluated by the Standardized Precipitation-Evapotranspiration Index. Acta Geophys. 2016, 64, 2530–2549. [Google Scholar] [CrossRef]
- Szwed, M. Variability of precipitation in Poland under climate change. Theor. Appl. Clim. 2018, 135, 1003–1015. [Google Scholar] [CrossRef]
- Kubiak-Wójcicka, K. Dynamics of meteorological and hydrological droughts in the agricultural catchments. Res. Rural Dev. 2019, 1, 111–117. [Google Scholar] [CrossRef]
- Tomczyk, A.M.; Szyga-Pluta, K. Variability of thermal and precipitation conditions in the growing season in Poland in the years 1966–2015. Theor. Appl. Clim. 2018, 135. [Google Scholar] [CrossRef]
- Osuch, M.; Romanowicz, R.J.; Booij, M.J. The influence of parametric uncertainty on the relationships between HBV model parameters and climatic characteristics. Hydrol. Sci. J. 2015, 60, 1299–1316. [Google Scholar] [CrossRef]
- Łabędzki, L.; Bak, B. Indicator-based monitoring and forecasting water deficit and surplus in agriculture in Poland. Ann. Wars. Univ. Life Sci. SGGW Land Reclam. 2015, 47, 355–369. [Google Scholar] [CrossRef]
- Kuśmierek-Tomaszewska, R.; Żarski, J.; Dudek, S. Assessment of Irrigation Needs in Sugar Beet (Beta vulgaris L.) in Temperate Climate of Kujawsko-Pomorskie Region (Poland). Agronomy 2019, 9, 814. [Google Scholar] [CrossRef]
- Łabedzki, L. Estimation of local drought frequency in central Poland using the standardized precipitation index SPI. Irrig. Drain. 2007, 56, 67–77. [Google Scholar] [CrossRef]
- Tokarczyk, T.; Szalińska, W. Combined analysis of precipitation and water deficit for drought hazard assessment. Hydrol. Sci. J. 2014, 59, 1675–1689. [Google Scholar] [CrossRef]
- Kubiak-Wójcicka, K.; Bąk, B. Monitoring of meteorological and hydrological droughts in the Vistula basin (Poland). Environ. Monit. Assess. 2018, 190, 691. [Google Scholar] [CrossRef]
- Tokarczyk, T.; Szalińska, W.; National Research Institute. Drought Hazard Assessment in the Process of Drought Risk Management. Acta Sci. Pol. Form. Circumiectus 2018, 3, 217–229. [Google Scholar] [CrossRef]
- Łabędzki, L.; Bąk, B. Impact of meteorological drought on crop water deficit and crop yield reduction in Polish agriculture. J. Water Land Dev. 2017, 34, 181–190. [Google Scholar] [CrossRef]
- Kubiak-Wójcicka, K.; Juśkiewicz, W. Relationships between meteorological and hydrological drought in a young-glacial zone (north-western Poland) based on Standardised Precipitation Index (SPI) and Standardized Runoff Index (SRI). Acta Montan. Slovaca 2020, 25, 517–531. [Google Scholar] [CrossRef]
- Bąk, B.; Kubiak-Wójcicka, K. Impact of meteorological drought on hydrological drought in Toruń (central Poland) in the period of 1971–2015. J. Water Land Dev. 2017, 32, 3–12. [Google Scholar] [CrossRef]
- Radzka, E. The assessment of atmospheric drought during vegetation season (according to Standardized Precipitation Index SPI) in central-eastern Poland. J. Ecol. Eng. 2015, 16, 87–91. [Google Scholar] [CrossRef]
- Grzywna, A.; Bochniak, A.; Ziernicka-Wojtaszek, A.; Krużel, J.; Jóźwiakowski, K.; Wałega, A.; Cupak, A.; Mazur, A.; Obroślak, R.; Serafin, A. The analysis of spatial variability of precipitation in Poland in the multiyears 1981–2010. J. Water Land Dev. 2020, 46, 105–111. [Google Scholar] [CrossRef]
- Bąk, B. Warunki klimatyczne Wielkopolski i Kujaw. Woda-Środowisko-Obszary Wiejskie 2003, 3, 11–39. [Google Scholar]
- Natural Earth. Free Vector and Raster Map Data @ naturalearthdata.com. Available online: https://www.naturalearthdata.com/downloads/10m-cultural-vectors and https://www.naturalearthdata.com/downloads/10m-raster-data/10m-natural-earth-1 (accessed on 12 July 2021).
- Wektorowe Warstwy Tematyczne aPGW. Available online: https://dane.gov.pl/pl/dataset/599/resource/672,wektorowe-warstwy-tematyczne-apgw/table (accessed on 12 July 2021).
- SRTM 1 Arc-Second Global. Available online: https://earthexplorer.usgs.gov/ (accessed on 3 June 2021). [CrossRef]
- Baza Danych Obiektów Ogólnogeograficznych. Available online: https://mapy.geoportal.gov.pl/imap/Imgp_2.html?locale=pl&gui=new&sessionID=5160004 (accessed on 15 July 2021).
- Hydro IMGW-PIB. Available online: https://hydro.imgw.pl/#map/19.5,51.5,7,true,true,0 (accessed on 15 July 2021).
- QGIS Quick Map Services Plugin. OSM Standard. Plugin Was Used on 13–15 July 2021. Author of the Plugin: NextGIS. Base Map from: OpenStreetMap and OpenStreetMap Foundation. Detailed Information about Copyright and License of the OpenStreetMap. Available online: https://www.openstreetmap.org/copyright (accessed on 15 July 2021).
- Przybyłek, J. Aktualne problemy odwadniania złóż węgla brunatnego w Wielkopolsce. Górnictwo Odkrywkowe 2018, 59, 5–14. [Google Scholar]
- Kubiak-Wójcicka, K.; Machula, S. Influence of Climate Changes on the State of Water Resources in Poland and Their Usage. Geosciences 2020, 10, 312. [Google Scholar] [CrossRef]
- Tomaszewski, E.; Kubiak-Wójcicka, K. Low-flows in Polish rivers. In Management of Water Resources in Poland; Zeleňáková, M., Kubiak-Wójcicka, K., Negm, A.M., Eds.; Springer International Publishing: Cham, Switzerland, 2021; pp. 205–228. [Google Scholar] [CrossRef]
- McKee, T.B.; Doesken, N.J.; Kleist, J. The relationship of drought frequency and duration to time scales. In Proceedings of the 8th Conference of Applied Climatology, Anaheim, CA, USA, 17–22 January 1993; pp. 179–184. [Google Scholar]
- World Meteorological Organization (WMO); Global Water Partnership (GWP). Handbook of Drought Indicators and Indices; Integrated Drought Management Tools and Guidelines Series 2; Svoboda, M., Fuchs, B.A., Eds.; Integrated Drought Management Programme (IDMP): Geneva, Switzerland, 2016; ISBN 978-92-63-11173-9. [Google Scholar]
- Guttman, N.B. Accepting the Standardized Precipitation Index: A calculation algorithm. J. Am. Water Resour. Assoc. 1999, 35, 311–322. [Google Scholar] [CrossRef]
- Lloyd-Hughes, B.; Saunders, M. A drought climatology for Europe. Int. J. Clim. 2002, 22, 1571–1592. [Google Scholar] [CrossRef]
- Fang, W.; Huang, S.; Huang, Q.; Huang, G.; Wang, H.; Leng, G.; Wang, L. Identifying drought propagation by simultaneously considering linear and nonlinear dependence in the Wei River basin of the Loess Plateau, China. J. Hydrol. 2020, 591, 125287. [Google Scholar] [CrossRef]
- Łabędzki, L. Actions and measures for mitigation drought and water scarcity in agriculture. J. Water Land Dev. 2016, 29, 3–10. [Google Scholar] [CrossRef]
- Lorenzo-Lacruz, J.; Morán-Tejeda, E.; Vicente-Serrano, S.M.; López-Moreno, J.I. Streamflow droughts in the Iberian Peninsula between 1945 and 2005: Spatial and temporal patterns. Hydrol. Earth Syst. Sci. 2013, 17, 119–134. [Google Scholar] [CrossRef]
- Sahoo, R.N.; Dipanwita, D.; Khanna, M.; Kumar, N.; Bandyopadhyay, S.K. Drought assessment in the Dhar and Mewat Districs of India using meteorological and remote-sensing derived indices. Nat. Hazards 2015, 77, 733–751. [Google Scholar] [CrossRef]
- Shukla, S.; Wood, A. Use of a standardized runoff index for characterizing hydrologic drought. Geophys. Res. Lett. 2008, 35. [Google Scholar] [CrossRef]
- Bayissa, Y.; Maskey, S.; Tadesse, T.; Van Andel, S.J.; Moges, S.; Van Griensven, A.; Solomatine, D. Comparison of the Performance of Six Drought Indices in Characterizing Historical Drought for the Upper Blue Nile Basin, Ethiopia. Geosciences 2018, 8, 81. [Google Scholar] [CrossRef]
- Vicente-Serrano, S.M.; Lopez-Moreno, I.; Beguería, S.; Lorenzo-Lacruz, J.; Azorin-Molina, C.; Morán-Tejeda, E. Accurate Computation of a Streamflow Drought Index. J. Hydrol. Eng. 2012, 17, 318–332. [Google Scholar] [CrossRef]
- Mann, H.B. Nonparametric tests against trend. Econometrica 1945, 13, 245–259. [Google Scholar] [CrossRef]
- Kendall, M.G. Rank Correlation Methods; Charles Grin: London, UK, 1975. [Google Scholar]
- Silva, A.; Filho, M.; Menezes, R.; Stosic, T.; Stosic, B. Trends and Persistence of Dry–Wet Conditions in Northeast Brazil. Atmosphere 2020, 11, 1134. [Google Scholar] [CrossRef]
- Bacanli, G. Trend analysis of precipitation and drought in the Aegean region, Turkey. Meteorol. Appl. 2017, 24, 239–249. [Google Scholar] [CrossRef]
- Hu, M.; Dong, M.; Tian, X.; Wang, L.; Jiang, Y. Trends in Different Grades of Precipitation over the Yangtze River Basin from 1960 to 2017. Atmosphere 2021, 12, 413. [Google Scholar] [CrossRef]
- Gocic, M.; Trajkovic, S. Analysis of changes in meteorological variables using Mann-Kendall and Sen’s slope estimator statistical tests in Serbia. Glob. Planet. Chang. 2013, 100, 172–182. [Google Scholar] [CrossRef]
- Tuan, N.H.; Canh, T.T. Analysis of Trends in Drought with the Non-Parametric Approach in Vietnam: A Case Study in Ninh Thuan Province. Am. J. Clim. Chang. 2021, 10, 51–84. [Google Scholar] [CrossRef]
- Kuriqi, A.; Ali, R.; Quoc Bao, P.; Gambini, J.M.; Gupta, V.; Malik, A.; Nguyen Thi Thuy, L.; Joshi, Y.; Duong Tran, A.; Van Thai, N.; et al. Seasonality shift and streamflow flow variability trends in central India. Acta Geophys. 2020, 68, 1461–1475. [Google Scholar] [CrossRef]
- Abeysingha, N.S.; Rajapaksha, U.R.L.N. SPI-Based Spatiotemporal Drought over Sri Lanka. Hindawi Adv. Meteorol. 2020. [Google Scholar] [CrossRef]
- Sen, P.K. Estimates of the regression coefficient based on Kendall’s tau. J. Am. Stat. Assoc. 1968, 63, 1379–1389. [Google Scholar] [CrossRef]
- Achite, M.; Krakauer, N.; Wałęga, A.; Caloiero, T. Spatial and Temporal Analysis of Dry and Wet Spells in the Wadi Cheliff Basin, Algeria. Atmosphere 2021, 12, 798. [Google Scholar] [CrossRef]
- RStudio Team. RStudio: Integrated Development Environment for R; RStudio PBC: Boston, MA, USA, 2021. [Google Scholar]
- Wickham, H.; Bryan, J. Readxl: Read Excel Files. R Package Version 1.3.1. 2019. Available online: https://CRAN.R-project.org/package=readxl (accessed on 17 July 2021).
- Pohlert, T. Trend: Non-Parametric Trend Tests and Change-Point Detection. R package Version 1.1.4. 2020. Available online: https://CRAN.R-project.org/package=trend (accessed on 17 July 2021).
- Reference Manual. Package “Trend”. Non-Parametric Trend Tests and Change-Point Detection. Available online: https://cran.r-project.org/web/packages/trend/trend.pdf (accessed on 8 August 2021).
- Portela, M.M.; Espinosa, L.A.; Zelenakova, M. Long-Term Rainfall Trends and Their Variability in Mainland Portugal in the Last 106 Years. Climate 2020, 8, 146. [Google Scholar] [CrossRef]
- Ionita, M.; Tallaksen, L.M.; Kingston, D.G.; Stagge, J.H.; Laaha, G.; Van Lanen, H.A.J.; Chelcea, S.M.; Haslinger, K. The European 2015 drought from a climatological perspective. Hydrol. Earth Syst. Sci. Discuss. 2016. [Google Scholar] [CrossRef]
- Hanel, M.; Rakovec, O.; Markonis, Y.; Maca, P.; Samaniego, L.; Kyselý, J.; Kumar, R. Revisiting the recent European droughts from a long-term perspective. Sci. Rep. 2018, 8, 1–11. [Google Scholar] [CrossRef]
- Pińskwar, I.; Choryński, A.; Kundzewicz, Z.W. Severe Drought in the Spring of 2020 in Poland—More of the Same? Agronomy 2020, 10, 1646. [Google Scholar] [CrossRef]
- Barker, L.J.; Hannaford, J.; Parry, S.; Katie, A.; Smith, K.A.; Tanguy, M.; Prudhomme, C. Historic hydrological droughts 1891–2015: Systematic characterisation for a diverse set of catchments across the UK. Hydrol. Earth Syst. Sci. Discuss. 2019. [Google Scholar] [CrossRef]
- Solarczyk, A.; Kubiak-Wójcicka, K. The exhaustion of water resources in the Kuyavian-Pomeranian voivodship in drought condition in 2015. Res. Rural Dev. Water Manag. 2019, 1, 118–125. [Google Scholar] [CrossRef]
- Ziernicka-Wojtaszek, A.; Kopcińska, J. Variation in Atmospheric Precipitation in Poland in the Years 2001–2018. Atmosphere 2020, 11, 794. [Google Scholar] [CrossRef]
- Wachowiak, G. Wpływ zrzutów wód kopalnianych na wielkość przepływów wody w rzekach w początkowym okresie odwadniania odkrywki “Tomisławice” KWB “Konin”. Górnictwo i Geoinżynieria 2011, 35, 153–166. [Google Scholar]
- Bewick, V.; Cheek, L.; Ball, J. Statistics review 7: Correlation and regression. Crit. Care 2003, 7, 451–459. [Google Scholar] [CrossRef] [PubMed]
- Salimi, H.; Asadi, E.; Darbandi, S. Meteorological and hydrological drought monitoring using several drought indices. Appl. Water Sci. 2021. [Google Scholar] [CrossRef]
- El-Afandi, G.; Morsy, M.; Kamel, A. Estimation of Drought Index over the Northern Coast of Egypt. IJSRSET 2016, 2, 335–344. [Google Scholar]


| Meteorological Station | Altitude (m a.s.l.) | Latitude | Longitude | Total Precipitation during the Year (mm) | ||
|---|---|---|---|---|---|---|
| Average | Maximum/Year | Minimum/Year | ||||
| Izbica Kujawska | 120 | 52°26′ N | 18°46′ E | 529.3 | 817.6/2010 | 309.6/2011 |
| Pakość | 75 | 52°48′ N | 18°05′ E | 513.5 | 704.1/2010 | 291.4/1989 |
| Kołuda Wielka | 85 | 52°44′ N | 18°09′ E | 500.1 | 810.7/1980 | 212.5/1989 |
| Strzelno | 105 | 52°38′ N | 18°11′ E | 542.5 | 816.9/1980 | 246.6/1989 |
| Sompolno | 96 | 52°23′ N | 18°31′ E | 516.0 | 847.6/2010 | 302.7/1989 |
| Gniezno | 124 | 52°33′ N | 17°34′ E | 506.6 | 708.5/2010 | 282.2/1982 |
| Janowiec Wielkopolski | 95 | 52°46′ N | 17°29′ E | 519.6 | 760.2/2010 | 275.5/1982 |
| Kłodawa | 120 | 52°15′ N | 18°55′ E | 531.2 | 763.2/2001 | 306.4/1989 |
| Hydrological Station | The Catchment Area (km2) | Average Multi-Year Discharge (m3·s−1) | Maximum Discharge (m3·s−1) | Minimum Discharge (m3·s−1) |
|---|---|---|---|---|
| Łysek | 303.32 | 0.74 | 10.7 | 0.001 |
| Noć Kalina | 426.11 | 1.47 | 16.7 | 0.05 |
| Pakość | 2301.98 | 5.08 | 69.3 | 0.53 |
| SPI, SRI Value | Category |
|---|---|
| SPI/SRI ≥ 2.0 | Extremely wet |
| 2.0 > SPI/SRI ≥ 1.5 | Severely wet |
| 1.5 > SPI/SRI ≥ 1.0 | Moderately wet |
| 1.0 > SPI/SRI > −1.0 | Normal |
| −1.0 ≥ SPI/SRI > −1.5 | Moderately dry |
| −1.5 ≥ SPI/SRI > −2.0 | Severely dry |
| SPI/SRI ≤ −2.0 | Extremely dry |
| Parameters of Droughts | SPI−1 | SPI−3 | SPI−6 | SPI−9 | SPI−12 |
|---|---|---|---|---|---|
| Izbica Kujawska | |||||
| Number of months with SPI ≤ −1.0 | 67 | 73 | 75 | 59 | 59 |
| Number of months with SPI ≥ 1.0 | 58 | 68 | 68 | 63 | 65 |
| Minimum value of the index | −3.00 | −2.81 | −2.30 | −2.93 | −2.53 |
| Maximum value of the index | 3.59 | 2.83 | 2.53 | 2.47 | 2.33 |
| Sompolno | |||||
| Number of months with SPI ≤ −1.0 | 66 | 71 | 72 | 68 | 63 |
| Number of months with SPI ≥ 1.0 | 61 | 57 | 66 | 67 | 66 |
| Minimum value of the index | −3.50 | −2.61 | −2.70 | −2.55 | −2.57 |
| Maximum value of the index | 3.25 | 2.67 | 2.65 | 2.93 | 2.77 |
| Strzelno | |||||
| Number of months with SPI ≤ −1.0 | 62 | 68 | 60 | 64 | 56 |
| Number of months with SPI ≥ 1.0 | 70 | 67 | 66 | 69 | 68 |
| Minimum value of the index | −3.27 | −3.01 | −3.09 | −3.13 | −2.99 |
| Maximum value of the index | 3.37 | 2.94 | 2.39 | 2.90 | 2.28 |
| Kołuda Wielka | |||||
| Number of months with SPI ≤ −1.0 | 62 | 66 | 66 | 62 | 49 |
| Number of months with SPI ≥ 1.0 | 65 | 68 | 72 | 55 | 55 |
| Minimum value of the index | −3.43 | −2.71 | −3.32 | −3.47 | −3.38 |
| Maximum value of the index | 3.16 | 2.90 | 2.37 | 2.75 | 2.62 |
| Pakość | |||||
| Number of months with SPI ≤ −1.0 | 70 | 69 | 71 | 74 | 71 |
| Number of months with SPI ≥ 1.0 | 66 | 70 | 69 | 69 | 72 |
| Minimum value of the index | −3.54 | −2.83 | −2.80 | −2.67 | −2.69 |
| Maximum value of the index | 2.80 | 2.64 | 2.35 | 2.90 | 2.12 |
| Gniezno | |||||
| Number of months with SPI ≤ −1.0 | 70 | 70 | 68 | 72 | 79 |
| Number of months with SPI ≥ 1.0 | 64 | 65 | 67 | 67 | 61 |
| Minimum value of the index | −3.43 | −2.95 | −2.73 | −2.73 | −2.66 |
| Maximum value of the index | 2.50 | 2.37 | 2.45 | 2.70 | 2.10 |
| Janowiec Wielkopolski | |||||
| Number of months with SPI ≤ −1.0 | 71 | 67 | 72 | 70 | 71 |
| Number of months with SPI ≥ 1.0 | 66 | 62 | 66 | 65 | 68 |
| Minimum value of the index | −3.22 | −2.83 | −2.70 | −2.79 | −2.72 |
| Maximum value of the index | 2.73 | 2.26 | 2.35 | 2.09 | 2.07 |
| Kłodawa | |||||
| Number of months with SPI ≤ −1.0 | 73 | 81 | 66 | 65 | 61 |
| Number of months with SPI ≥ 1.0 | 52 | 72 | 74 | 68 | 69 |
| Minimum value of the index | −3.09 | −2.92 | −2.60 | −2.72 | −2.46 |
| Maximum value of the index | 3.26 | 2.26 | 2.35 | 2.58 | 2.35 |
| Parameters of Droughts | SRI−1 | SRI−3 | SRI−6 | SRI−9 | SRI−12 |
|---|---|---|---|---|---|
| Pakość | |||||
| Number of months with SPI ≤ −1.0 | 75 | 77 | 77 | 81 | 79 |
| Number of months with SPI ≥ 1.0 | 68 | 67 | 73 | 75 | 76 |
| Minimum value of the index | −2.33 | −2.20 | −2.20 | −1.93 | −1.71 |
| Maximum value of the index | 2.34 | 2.30 | 2.83 | 3.05 | 2.71 |
| Noć Kalina | |||||
| Number of months with SPI ≤ −1.0 | 77 | 83 | 86 | 101 | 99 |
| Number of months with SPI ≥ 1.0 | 72 | 76 | 67 | 58 | 59 |
| Minimum value of the index | −3.16 | −3.10 | −2.79 | −2.23 | −2.25 |
| Maximum value of the index | 2.49 | 2.31 | 1.97 | 2.05 | 1.92 |
| Łysek | |||||
| Number of months with SPI ≤ −1.0 | 29 | 28 | 28 | 30 | 36 |
| Number of months with SPI ≥ 1.0 | 26 | 31 | 31 | 32 | 40 |
| Minimum value of the index | −5.22 | −5.18 | −5.09 | −4.96 | −4.77 |
| Maximum value of the index | 1.52 | 1.64 | 1.40 | 2.00 | 1.77 |
| Stations | Parameters | SPI | ||||
|---|---|---|---|---|---|---|
| SPI−1 | SPI−3 | SPI−6 | SPI−9 | SPI−12 | ||
| Kłodawa | Z | −1.817 | −2.429 | −3.179 | −3.755 | −4.318 |
| S | −5.45 × 10³ | −7.28 × 10³ | −9.53 × 10³ | −1.12 × 10⁴ | −1.29 × 10⁴ | |
| var_S | 8.99 × 10⁶ | 8.99 × 10⁶ | 8.99 × 10⁶ | 8.99 × 10⁶ | 8.99 × 10⁶ | |
| p-value | 0.0692 | 0.0151 | 0.0015 | 0.0002 | 1.58 × 10⁻⁵ | |
| Sen’s slope | −0.0007 | −0.0010 | −0.0013 | −0.0016 | −0.0018 | |
| N | D | D | D | D | ||
| Izbica Kujawska | Z | −0.434 | 0.125 | 0.251 | 0.033 | −0.451 |
| S | −1.30 × 10³ | 3.76 × 10² | 7.54 × 10² | 9.90 × 101 | −1.35 × 10³ | |
| var_S | 8.99 × 10⁶ | 8.99 × 10⁶ | 8.99 × 10⁶ | 8.99 × 10⁶ | 8.99 × 10⁶ | |
| p-value | 0.6646 | 0.9005 | 0.8017 | 0.9739 | 0.6523 | |
| Sen’s slope | −0.0002 | 5.4386 × 10⁻⁵ | 0.0001 | 1.50 × 10⁻⁵ | −0.0002 | |
| N | N | N | N | N | ||
| Sompolno | Z | 1.253 | 2.180 | 2.413 | 2.090 | 1.648 |
| S | 3.76 × 10³ | 6.54 × 10³ | 7.24 × 10³ | 6.27 × 10³ | 4.94 × 10³ | |
| var_S | 8.99 × 10⁶ | 8.99 × 10⁶ | 8.99 × 10⁶ | 8.99 × 10⁶ | 8.99 × 10⁶ | |
| p-value | 0.2102 | 0.0293 | 0.0158 | 0.0366 | 0.0994 | |
| Sen’s slope | 0.0005 | 0.0009 | 0.0010 | 0.0009 | 0.0007 | |
| N | I | I | I | N | ||
| Strzelno | Z | 1.223 | 1.728 | 2.034 | 1.341 | 0.908 |
| S | 3.67 × 10³ | 5.18 × 10³ | 6.10 × 10³ | 4.02 × 10³ | 2.72 × 10³ | |
| var_S | 8.99 × 10⁶ | 8.99 × 10⁶ | 8.99 × 10⁶ | 8.99 × 10⁶ | 8.99 × 10⁶ | |
| p-value | 0.2214 | 0.0840 | 0.0412 | 0.1801 | 0.3641 | |
| Sen’s slope | 0.0005 | 0.0007 | 0.0008 | 0.0006 | 0.0004 | |
| N | N | I | N | N | ||
| Gniezno | Z | 0.453 | 1.272 | 1.916 | 1.790 | 1.506 |
| S | 1.36 × 10³ | 3.81 × 10³ | 5.75 × 10³ | 5.37 × 10³ | 4.52 × 10³ | |
| var_S | 8.99 × 10⁶ | 8.99 × 10⁶ | 8.99 × 10⁶ | 8.99 × 10⁶ | 8.99 × 10⁶ | |
| p-value | 0.6503 | 0.2035 | 0.0553 | 0.0734 | 0.1322 | |
| Sen’s slope | 0.0002 | 0.0005 | 0.0008 | 0.0007 | 0.0006 | |
| N | N | N | N | N | ||
| Janowiec Wlkp. | Z | −0.109 | −0.100 | −0.048 | −0.683 | −0.931 |
| S | −3.27 × 10² | −3.01 × 10² | −1.45 × 10² | −2.05 × 10³ | −2.79 × 10³ | |
| var_S | 8.99 × 10⁶ | 8.99 × 10⁶ | 8.99 × 10⁶ | 8.99 × 10⁶ | 8.99 × 10⁶ | |
| p-value | 0.9134 | 0.9203 | 0.9617 | 0.4946 | 0.3517 | |
| Sen’s slope | −4.40 × 10⁻⁵ | −3.78 × 10⁻⁵ | −1.81 × 10⁻⁵ | −0.0003 | −0.0004 | |
| N | N | N | N | N | ||
| Kołuda Wielka | Z | 1.700 | 3.251 | 4.178 | 5.084 | 4.336 |
| S | 5.10 × 10³ | 9.75 × 10³ | 1.25 × 10⁴ | 1.52 × 10⁴ | 1.30 × 10⁴ | |
| var_S | 8.99 × 10⁶ | 8.99 × 10⁶ | 8.99 × 10⁶ | 8.99 × 10⁶ | 8.99 × 10⁶ | |
| p-value | 0.08918 | 0.0012 | 2.95 × 10⁻⁵ | 3.69 × 10⁻⁷ | 1.45 × 10⁻⁵ | |
| Sen’s slope | 0.0007 | 0.0013 | 0.0016 | 0.0019 | 0.0016 | |
| N | I | I | I | I | ||
| Pakość | Z | 0.175 | 0.834 | 1.207 | 0.844 | 0.284 |
| S | 5.27 × 10² | 2.50 × 10³ | 3.62 × 10³ | 2.53 × 10³ | 8.51 × 10² | |
| var_S | 8.99 × 10⁶ | 8.99 × 10⁶ | 8.99 × 10⁶ | 8.99 × 10⁶ | 8.99 × 10⁶ | |
| p-value | 0.8607 | 0.4044 | 0.2274 | 0.3986 | 0.7768 | |
| Sen’s slope | 7.48 × 10⁻⁵ | 0.0003 | 0.0005 | 0.0003 | 0.0001 | |
| N | N | N | N | N | ||
| Stations | Parameters | SRI | ||||
|---|---|---|---|---|---|---|
| SRI−1 | SRI−3 | SRI−6 | SRI−9 | SRI−12 | ||
| Łysek | Z | −5.342 | −5.412 | 5.692 | −5.974 | −6.2735 |
| S | −1.60 × 10⁴ | −1.62 × 10⁴ | −1.71 × 10⁴ | −1.79 × 10⁴ | −1.88 × 10⁴ | |
| var_S | 8.99 × 10⁶ | 8.99 × 10⁶ | 8.99 × 10⁶ | 8.99 × 10⁶ | 8.99 × 10⁶ | |
| p-value | 9.19 × 10⁻⁸ | 5.97 × 10⁻⁸ | 1.25 × 10⁻⁸ | 2.32 × 10⁻⁹ | 3.53 × 10⁻¹⁰ | |
| Sen’s slope | −0.0013 | −0.0014 | −0.0015 | −0.0017 | −0.0019 | |
| D | D | D | D | D | ||
| Noć Kalina | Z | 4.076 | 3.798 | 3.032 | 2.444 | 2.214 |
| S | 1.22 × 10⁴ | 1.14 × 10⁴ | 9.09 × 10³ | 7.33 × 10³ | 6.64 × 10³ | |
| var_S | 8.99 × 10⁶ | 8.99 × 10⁶ | 8.99 × 10⁶ | 8.99 × 10⁶ | 8.99 × 10⁶ | |
| p-value | 4.58 × 10⁻⁵ | 0.00014 | 0.0024 | 0.0145 | 0.0268 | |
| Sen’s slope | 0.0017 | 0.0016 | 0.0013 | 0.0010 | 0.0008 | |
| I | I | I | I | I | ||
| Pakość | Z | −0.784 | −1.032 | −1.134 | −1.428 | −1.488 |
| S | −2.35 × 10³ | −3.10 × 10³ | −3.40 × 10³ | −4.28 × 10³ | −4.46 × 10³ | |
| var_S | 8.99 × 10⁶ | 8.99 × 10⁶ | 8.99 × 10⁶ | 8.99 × 10⁶ | 8.99 × 10⁶ | |
| p-value | 0.433 | 0.3019 | 0.2566 | 0.1533 | 0.1368 | |
| Sen’s slope | −0.0003 | −0.0004 | −0.0005 | −0.0006 | −0.0007 | |
| N | N | N | N | N | ||
Publisher’s Note: MDPI stays neutral with regard to jurisdictional claims in published maps and institutional affiliations. |
© 2021 by the authors. Licensee MDPI, Basel, Switzerland. This article is an open access article distributed under the terms and conditions of the Creative Commons Attribution (CC BY) license (https://creativecommons.org/licenses/by/4.0/).
Share and Cite
Kubiak-Wójcicka, K.; Pilarska, A.; Kamiński, D. The Analysis of Long-Term Trends in the Meteorological and Hydrological Drought Occurrences Using Non-Parametric Methods—Case Study of the Catchment of the Upper Noteć River (Central Poland). Atmosphere 2021, 12, 1098. https://doi.org/10.3390/atmos12091098
Kubiak-Wójcicka K, Pilarska A, Kamiński D. The Analysis of Long-Term Trends in the Meteorological and Hydrological Drought Occurrences Using Non-Parametric Methods—Case Study of the Catchment of the Upper Noteć River (Central Poland). Atmosphere. 2021; 12(9):1098. https://doi.org/10.3390/atmos12091098
Chicago/Turabian StyleKubiak-Wójcicka, Katarzyna, Agnieszka Pilarska, and Dariusz Kamiński. 2021. "The Analysis of Long-Term Trends in the Meteorological and Hydrological Drought Occurrences Using Non-Parametric Methods—Case Study of the Catchment of the Upper Noteć River (Central Poland)" Atmosphere 12, no. 9: 1098. https://doi.org/10.3390/atmos12091098
APA StyleKubiak-Wójcicka, K., Pilarska, A., & Kamiński, D. (2021). The Analysis of Long-Term Trends in the Meteorological and Hydrological Drought Occurrences Using Non-Parametric Methods—Case Study of the Catchment of the Upper Noteć River (Central Poland). Atmosphere, 12(9), 1098. https://doi.org/10.3390/atmos12091098