
The Impact of COVID-19 Confinement Measures on the Air Quality in an Urban-Industrial Area of Portugal


Abstract
:1. Introduction
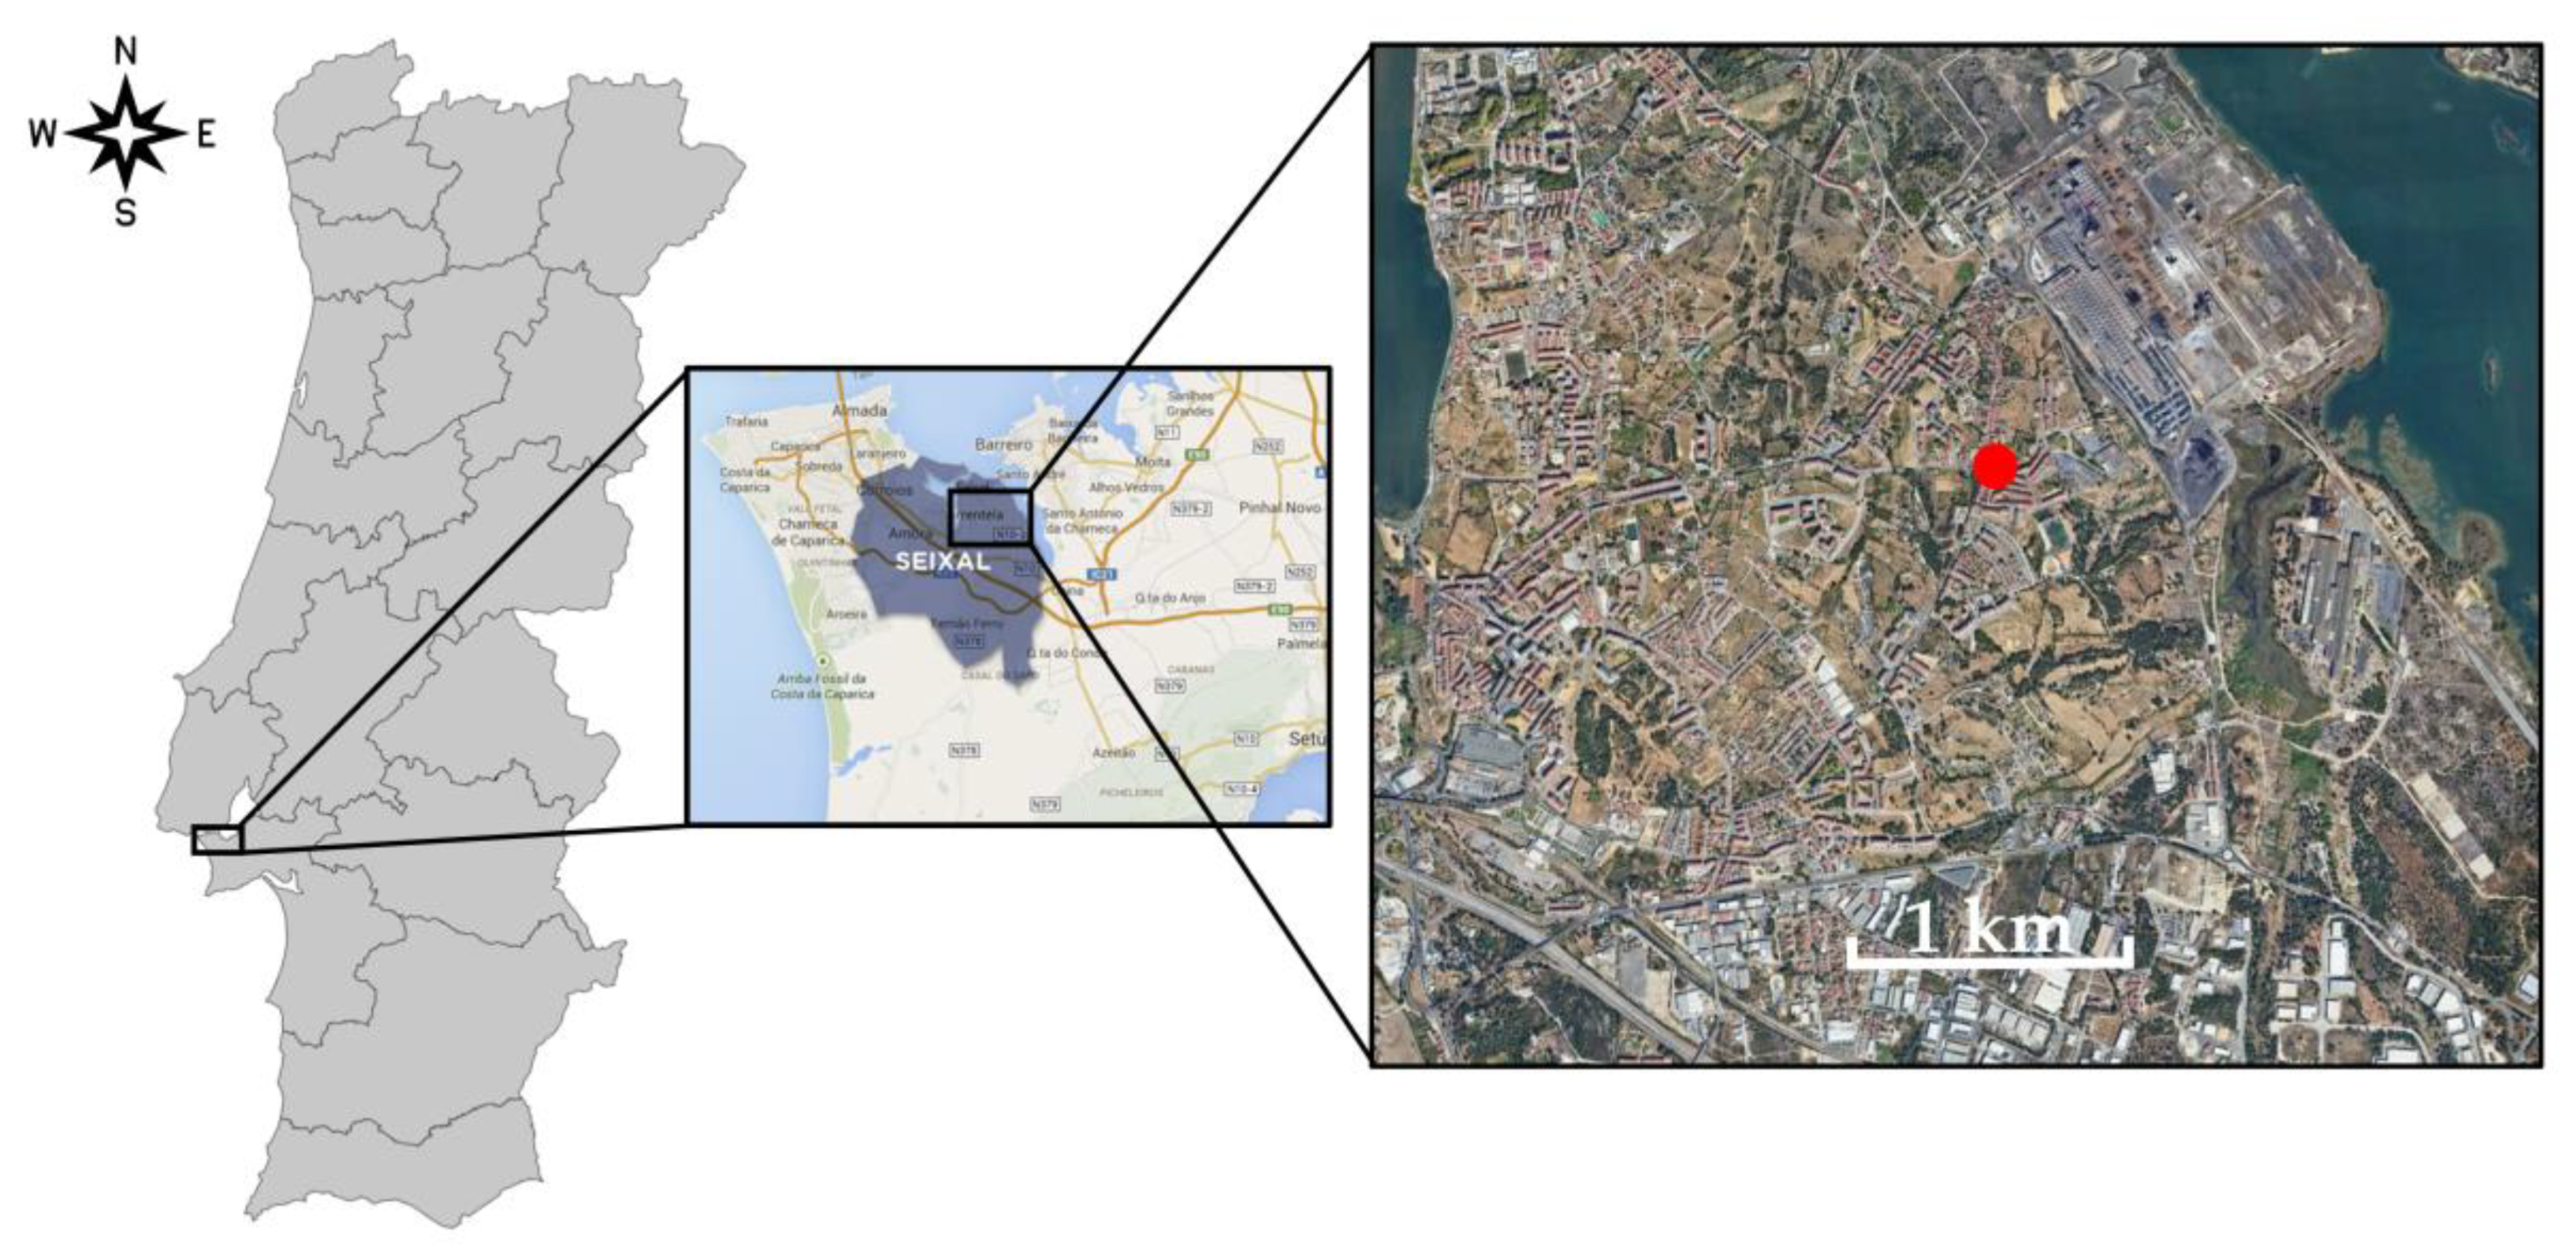
2. Materials and Methods
3. Results
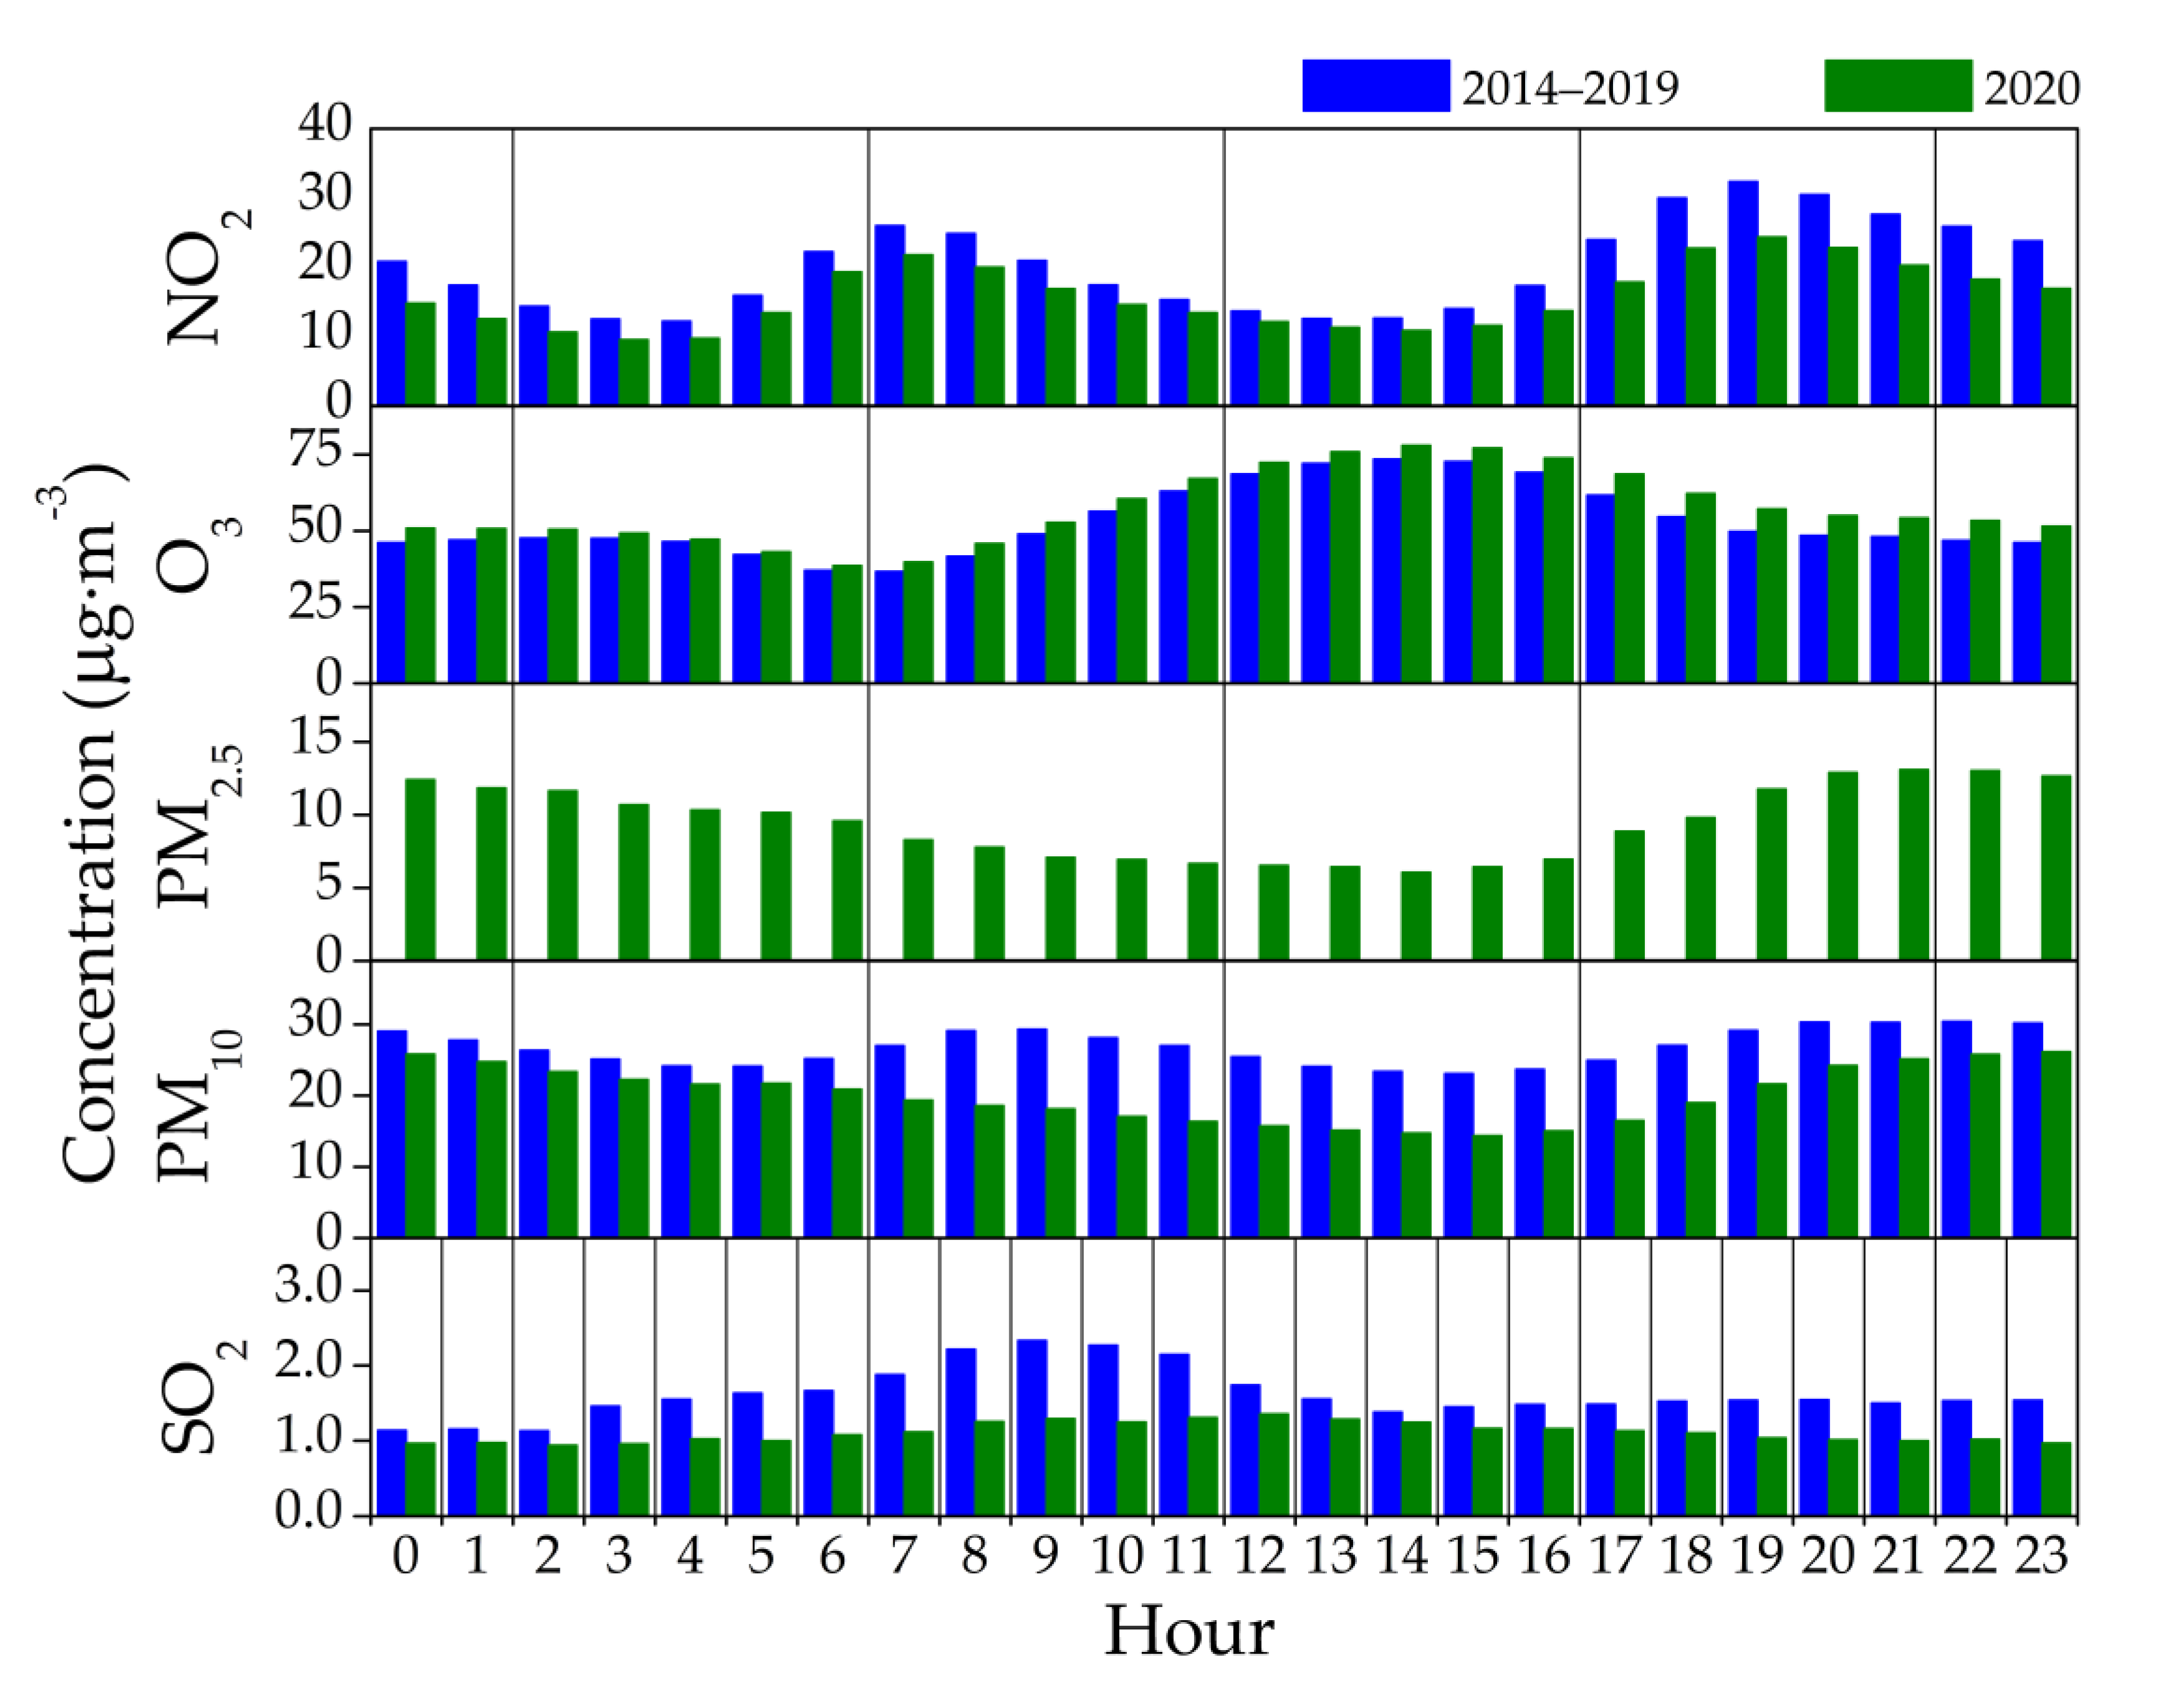
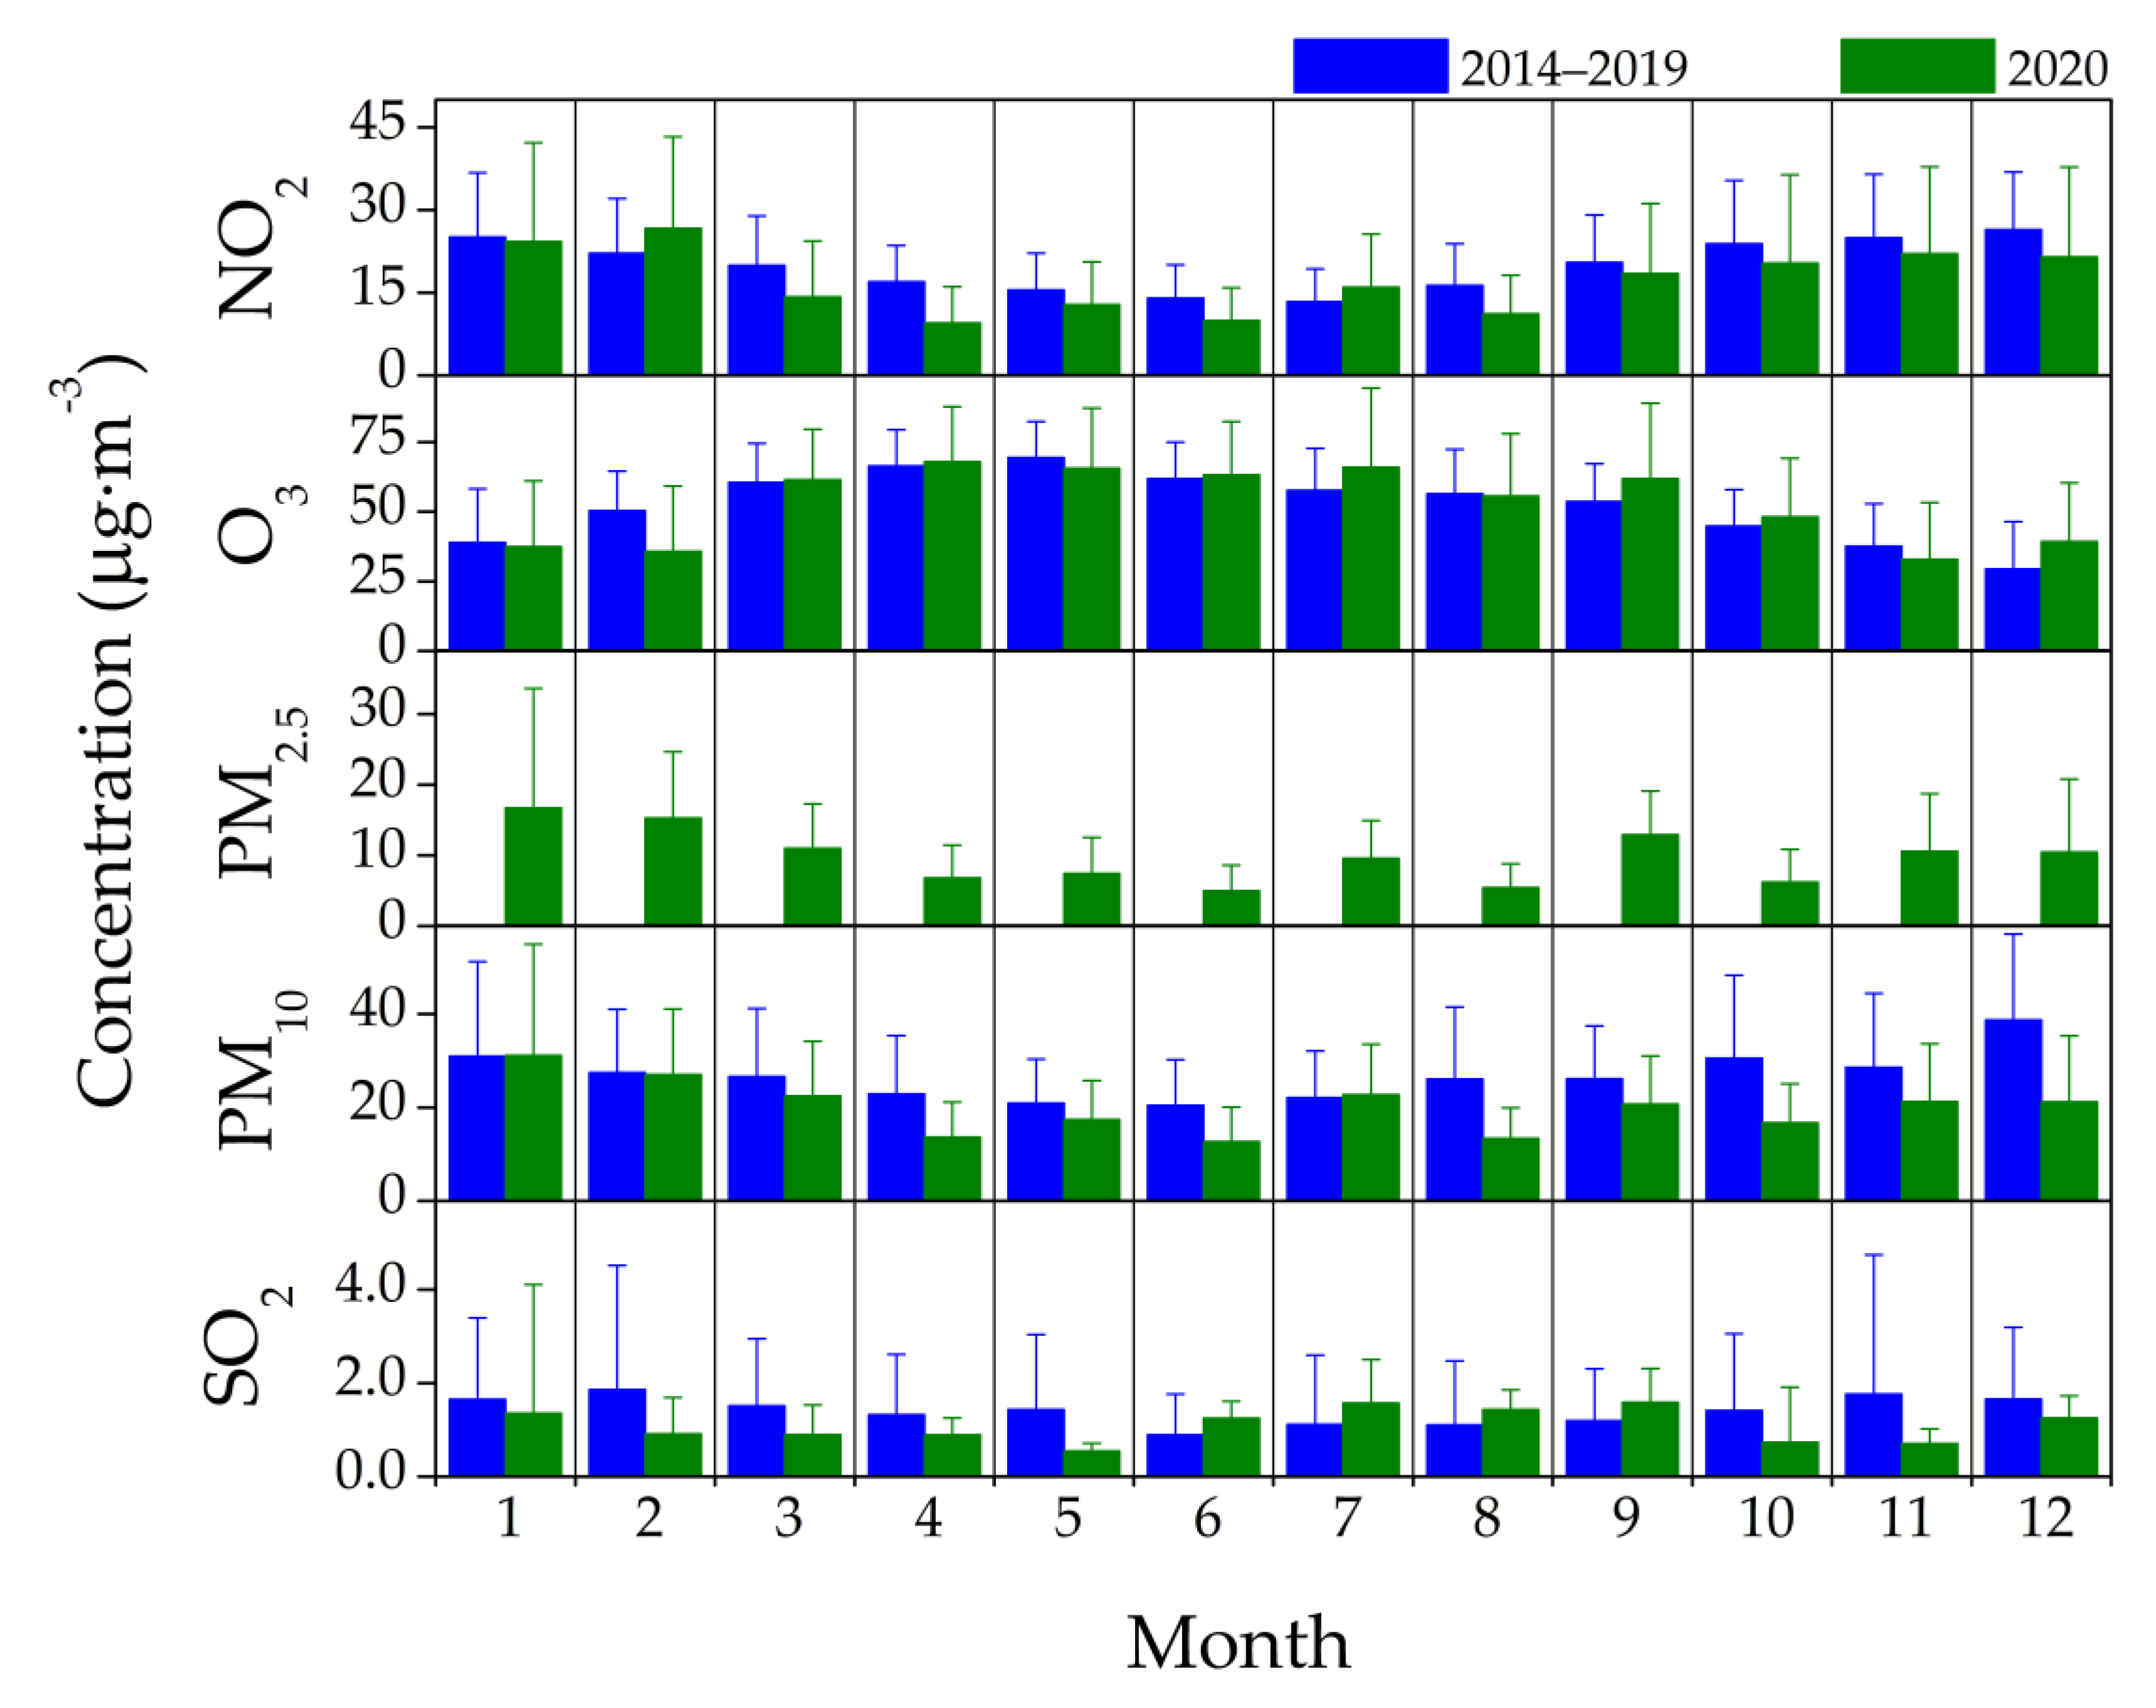
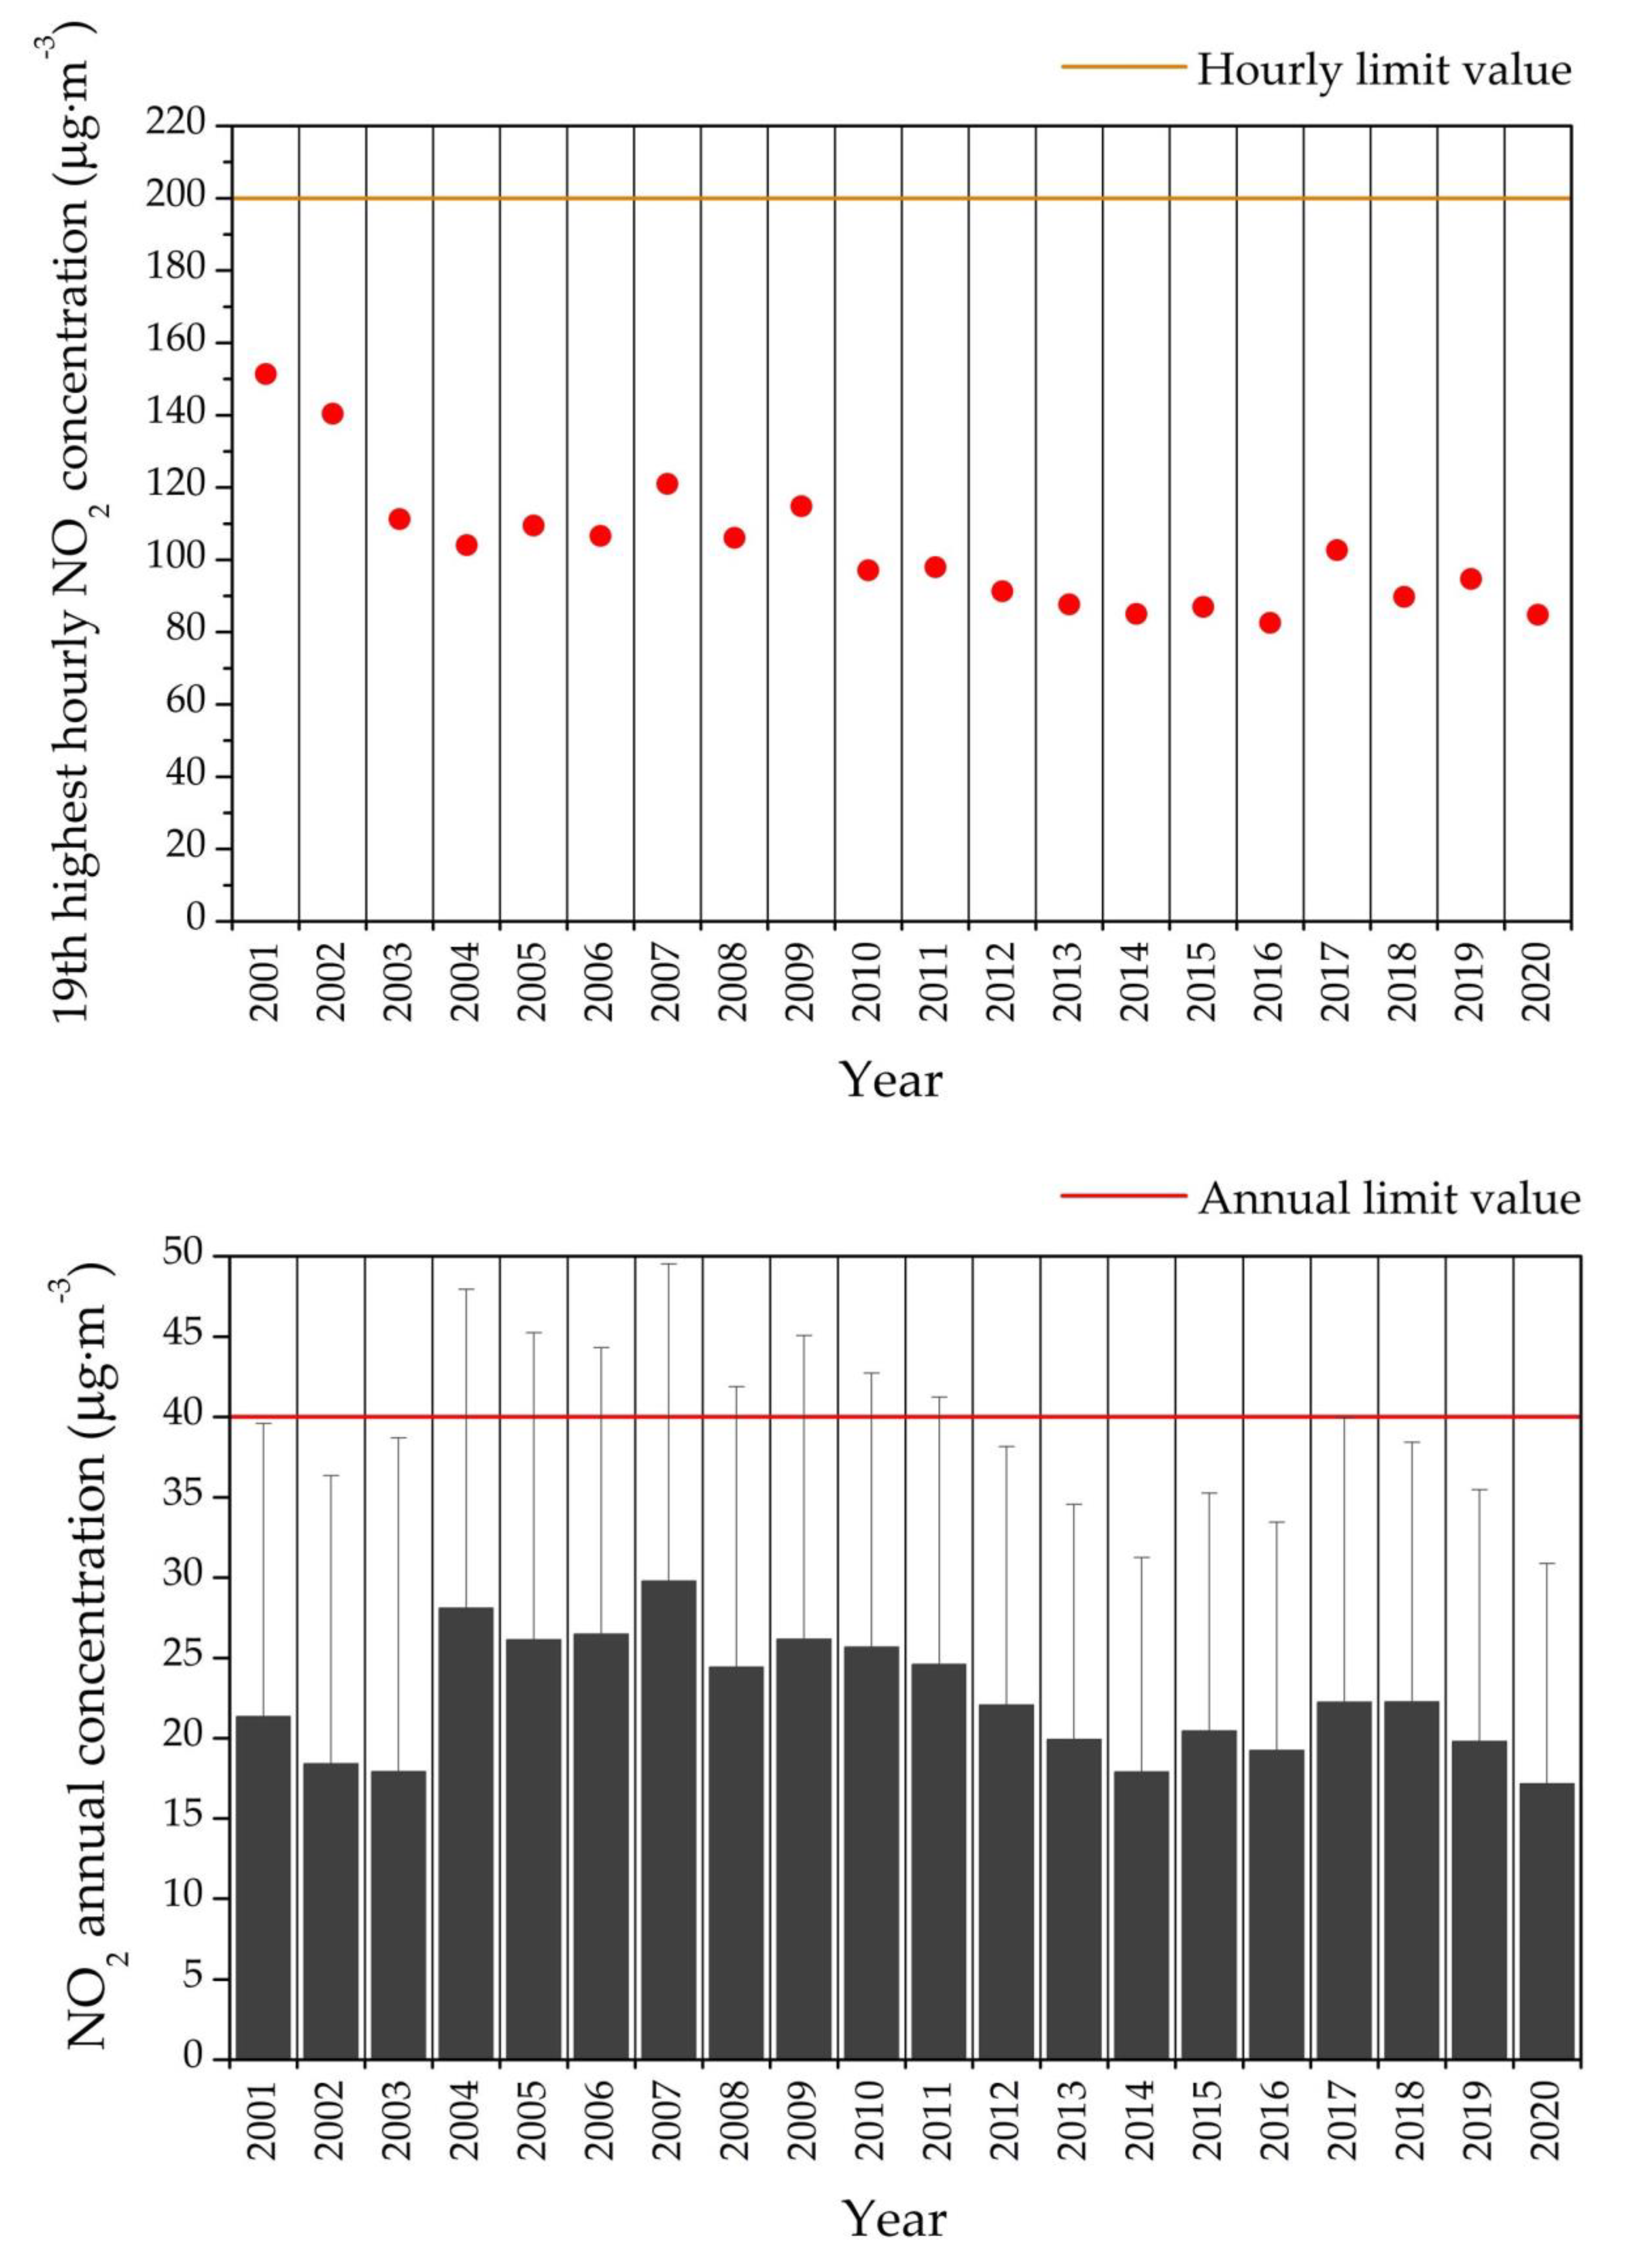
3.1. Air Quality Temporal Analysis and Legal Compliance
3.1.1. NO2
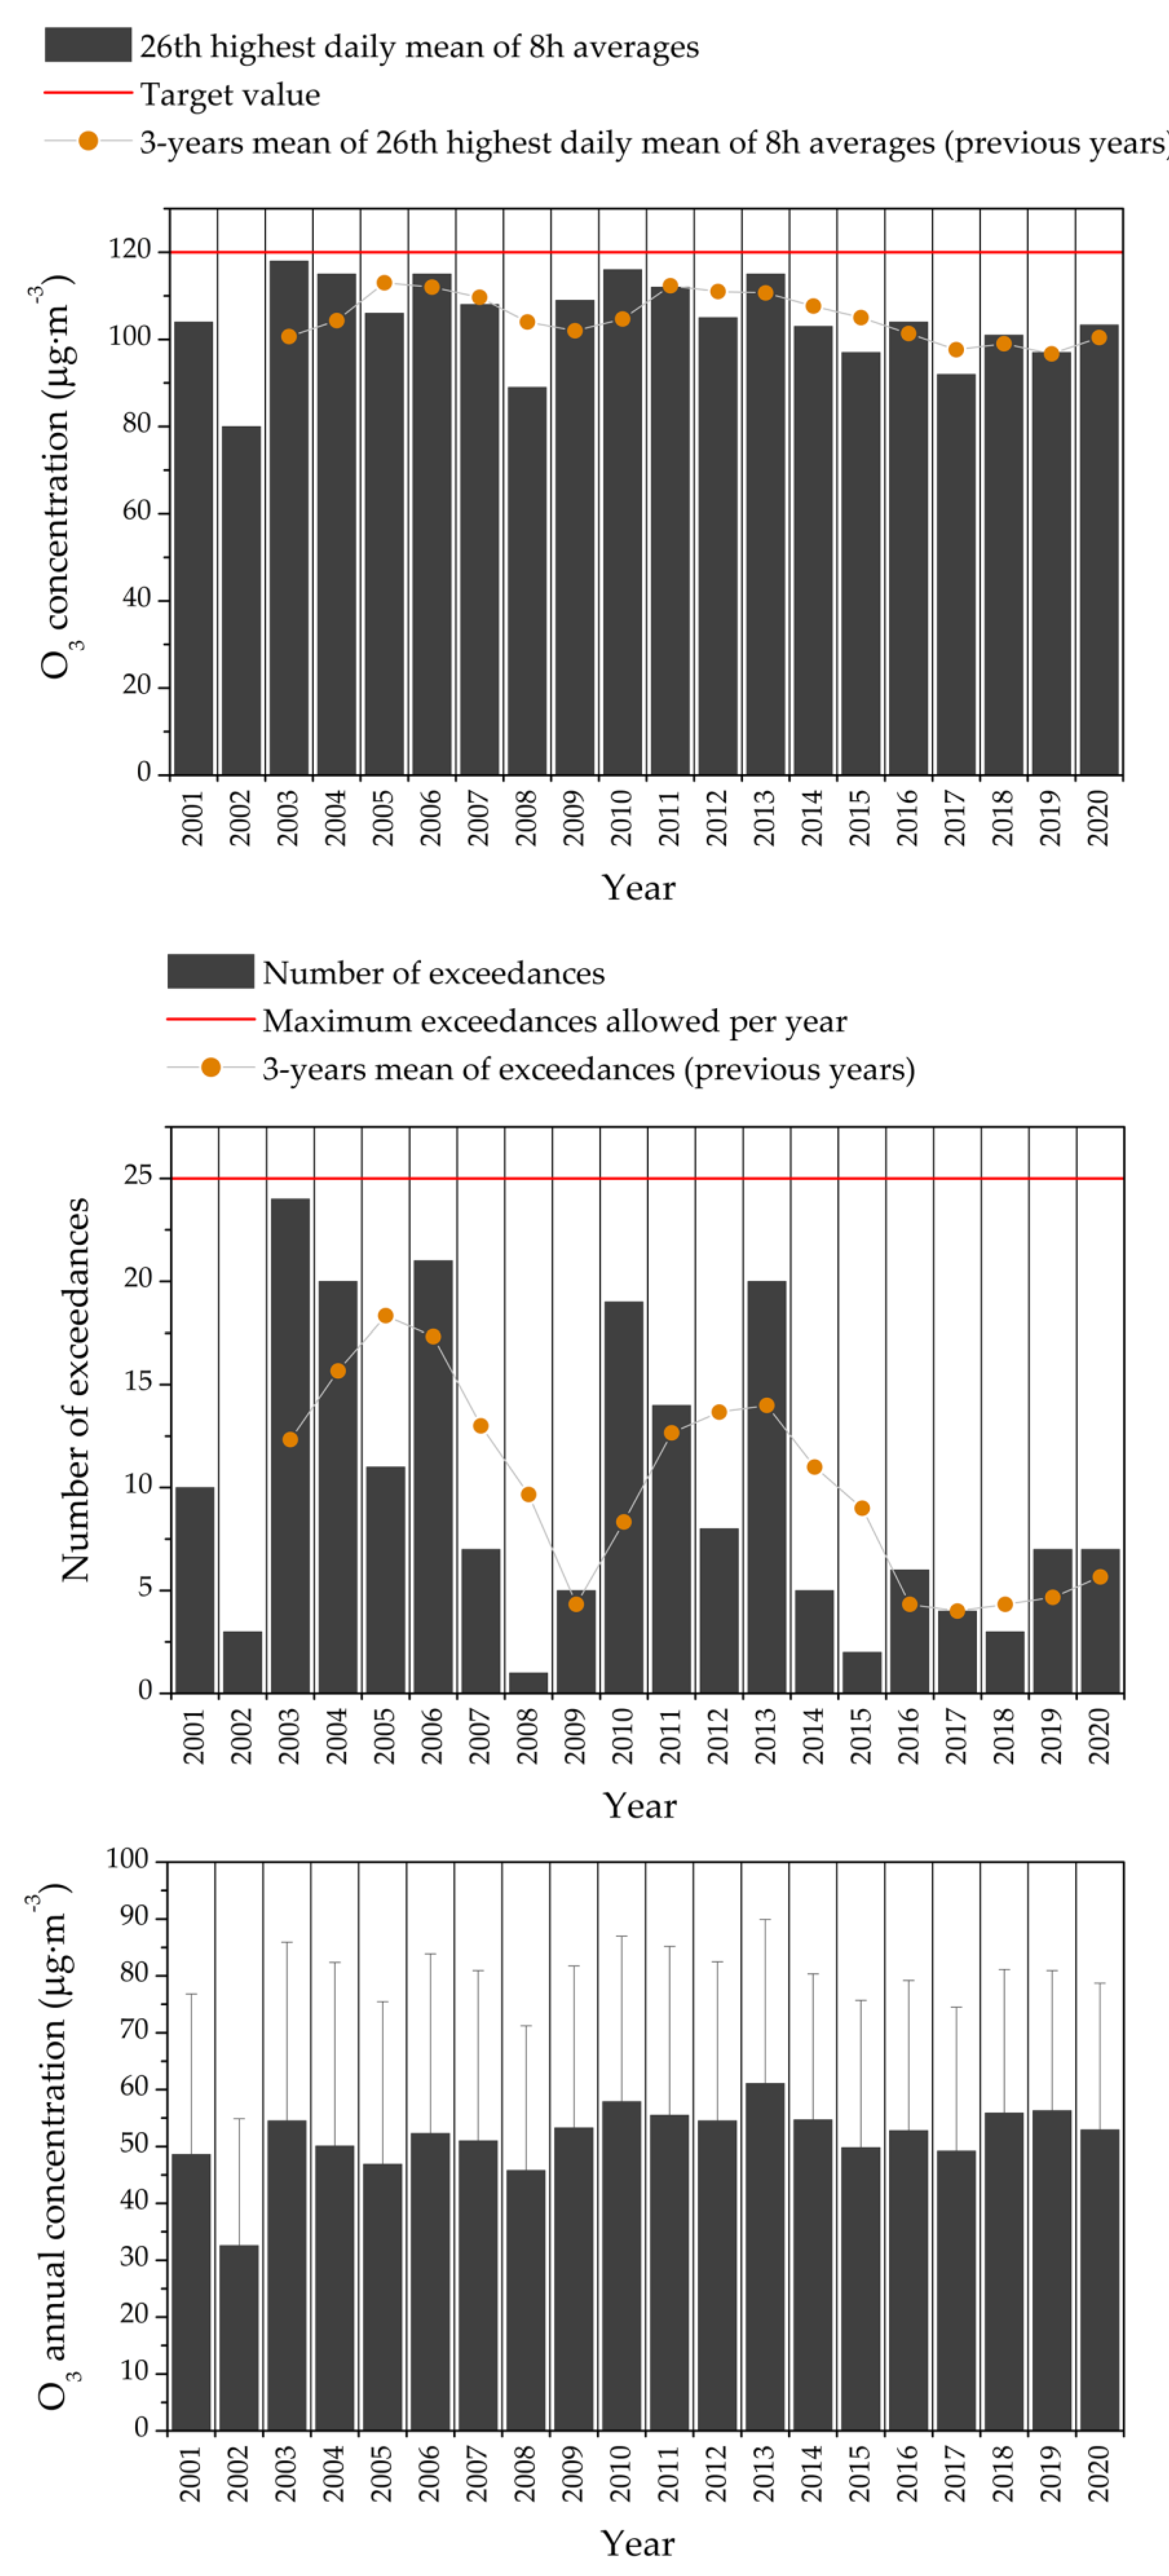
3.1.2. O3
3.1.3. PM2.5
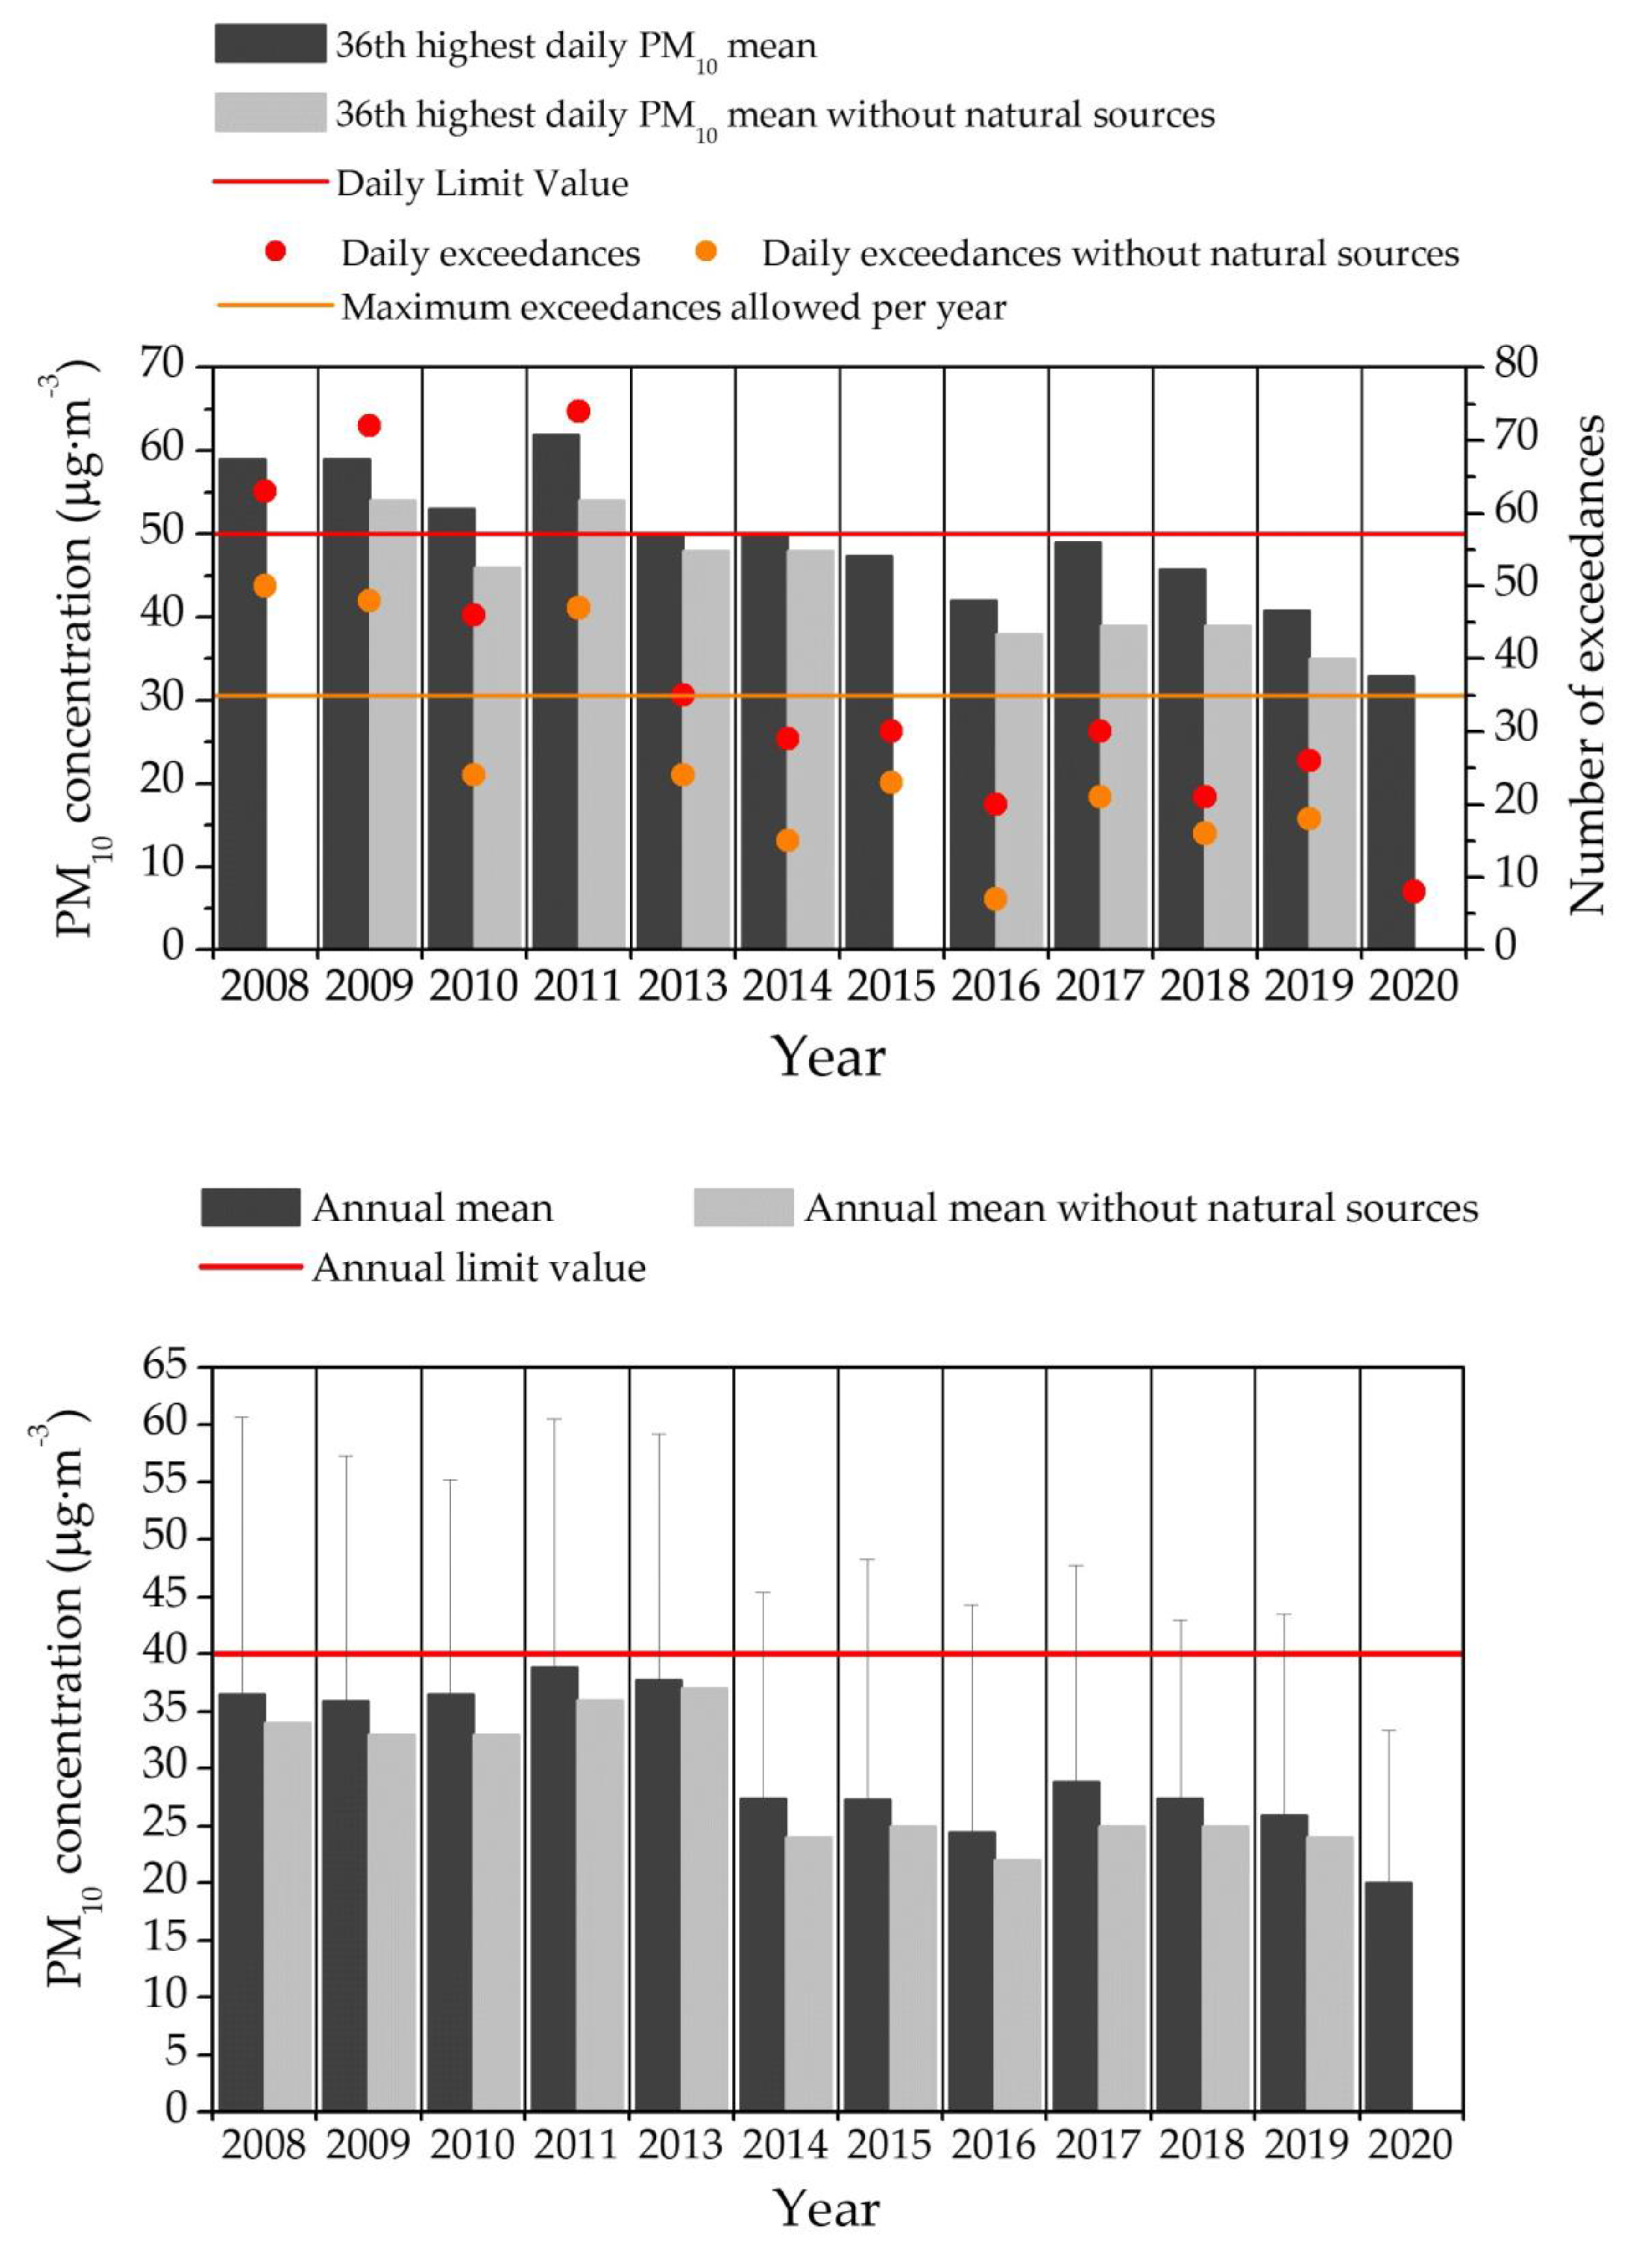
3.1.4. PM10
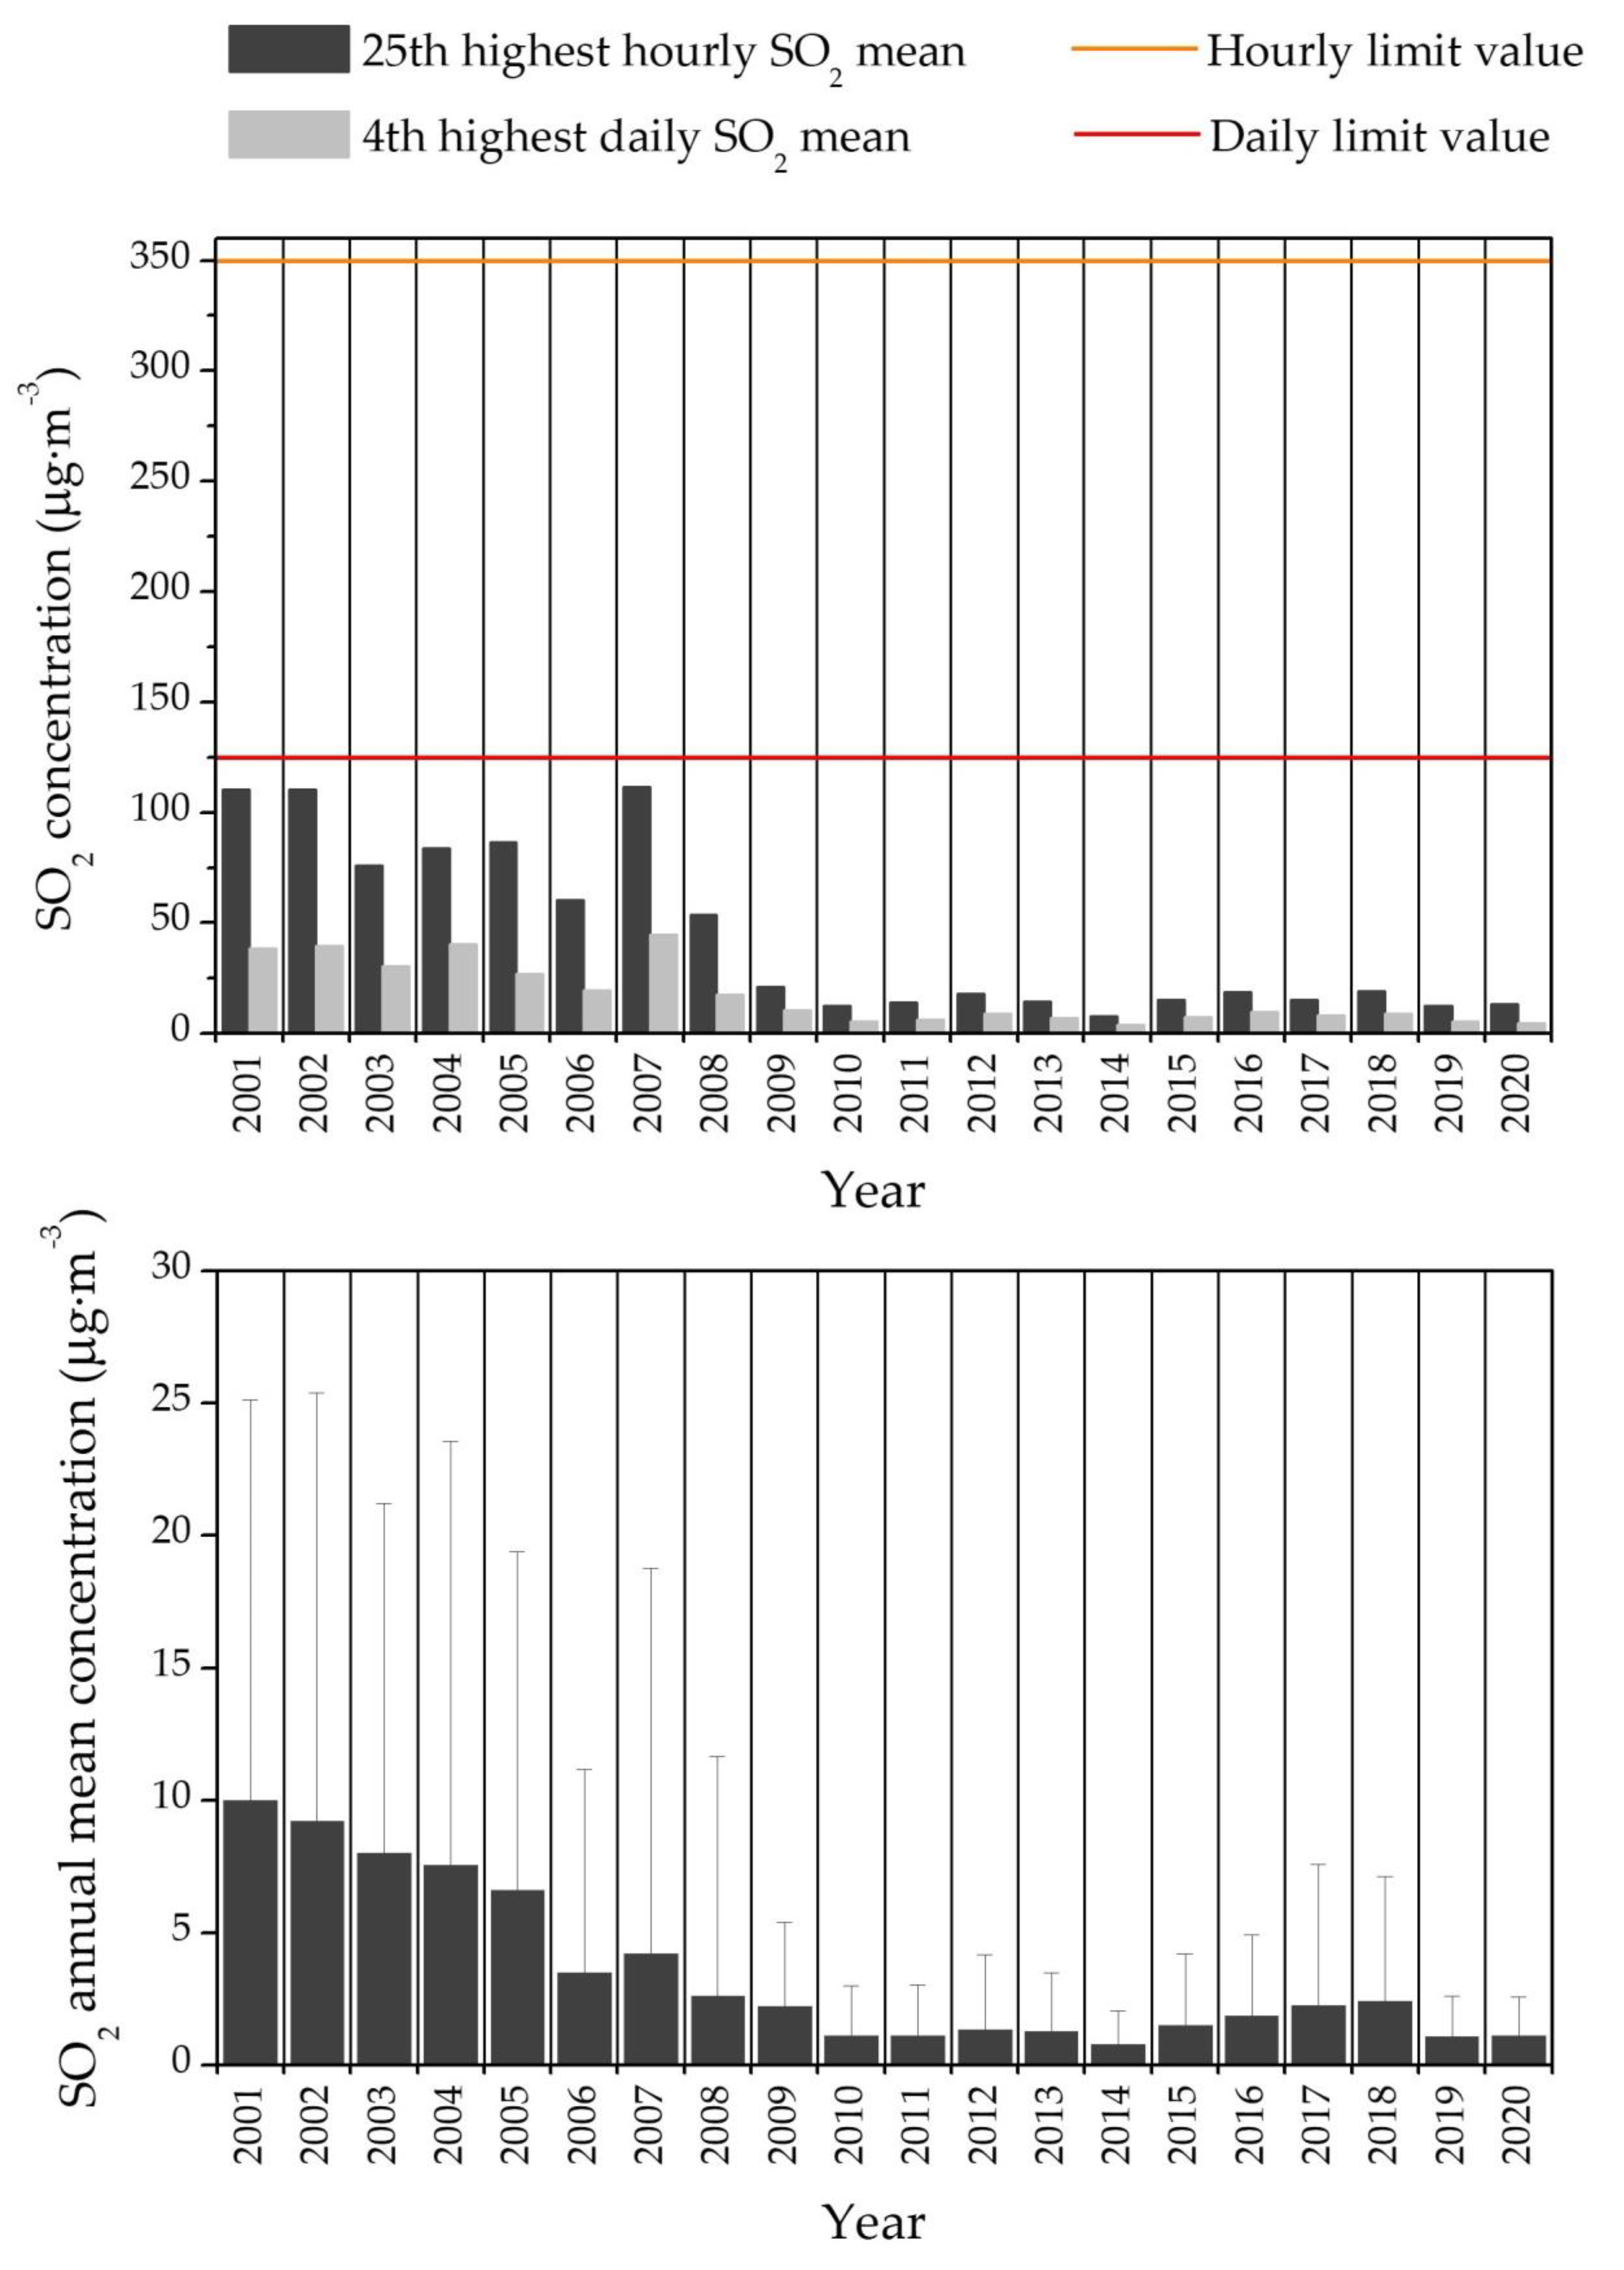
3.1.5. SO2
3.2. Impact of COVID-19 Containment Measures on Air Quality
4. Conclusions
Supplementary Materials
Author Contributions
Funding
Data Availability Statement
Acknowledgments
Conflicts of Interest
References
- He, G.; Pan, Y.; Tanaka, T. The short-term impacts of COVID-19 lockdown on urban air pollution in China. Nat. Sustain. 2020, 3, 1005–1011. [Google Scholar] [CrossRef]
- Bauwens, M.; Compernolle, S.; Stavrakou, T.; Müller, J.F.; Van Gent, J.; Eskes, H.; Levelt, P.F.; van der A, R.; Veefkind, J.P.; Vlietinck, J.; et al. Impact of coronavirus outbreak on NO2 pollution assessed using TROPOMI and OMI observations. Geophys. Res. Lett. 2020, 47, e2020GL087978. [Google Scholar] [CrossRef]
- Liu, F.; Page, A.; Strode, S.A.; Yoshida, Y.; Choi, S.; Zheng, B.; Lamsal, L.N.; Li, C.; Krotkov, N.A.; Eskes, H.; et al. Abrupt decline in tropospheric nitrogen dioxide over China after the outbreak of COVID-19. Sci. Adv. 2020, 6, eabc2992. [Google Scholar] [CrossRef]
- Chauhan, A.; Singh, R.P. Decline in PM 2.5 concentrations over major cities around the world associated with COVID-19. Environ. Res. 2020, 187, 109634. [Google Scholar] [CrossRef] [PubMed]
- Mahato, S.; Pal, S.; Ghosh, K.G. Effect of lockdown amid COVID-19 pandemic on air quality of the megacity Delhi, India. Sci. Total Environ. 2020, 730, 139086. [Google Scholar] [CrossRef] [PubMed]
- Baldasano, J.M. COVID-19 lockdown effects on air quality by NO2 in the cities of Barcelona and Madrid (Spain). Sci. Total Environ. 2020, 741, 140353. [Google Scholar] [CrossRef]
- Cristina, M.; Abbà, A.; Bertanza, G.; Pedrazzani, R.; Ricciardi, P.; Carnevale, M. Lockdown for CoViD-2019 in Milan: What are the effects on air quality? Sci. Total Environ. 2020, 732, 139280. [Google Scholar] [CrossRef]
- Tobías, A.; Carnerero, C.; Reche, C.; Massagué, J.; Via, M.; Minguillón, M.C.; Alastuey, A.; Querol, X. Changes in air quality during the lockdown in Barcelona (Spain) one month into the SARS-CoV-2 epidemic. Sci. Total Environ. 2020, 726, 138540. [Google Scholar] [CrossRef]
- Kroll, J.H.; Heald, C.L.; Cappa, C.D.; Farmer, D.K.; Fry, J.L.; Murphy, J.G.; Steiner, A.L. The complex chemical effects of COVID-19 shutdowns on air quality. Nat. Chem. 2020, 12, 777–779. [Google Scholar] [CrossRef]
- Huang, X.; Ding, A.; Gao, J.; Zheng, B.; Zhou, D.; Qi, X.; Tang, R.; Wang, J.; Ren, C.; Nie, W.; et al. Enhanced secondary pollution offset reduction of primary emissions during COVID-19 lockdown in China. Natl. Sci. Rev. 2021, 8, 2. [Google Scholar] [CrossRef]
- Bao, R.; Zhang, A. Does lockdown reduce air pollution? Evidence from 44 cities in northern China. Sci. Total Environ. 2020, 731, 139052. [Google Scholar] [CrossRef]
- Justino, A.R.; Canha, N.; Gamelas, C.; Coutinho, G.T.; Kertesz, Z.; Almeida, S.M. Contribution of micro-PIXE to the charac-terization of settled dust events in an urban area affected by industrial activities. J. Radioanal. Nucl. Chem. 2019, 322, 1953–1964. [Google Scholar] [CrossRef]
- PORDATA—Base de Dados Portugal Contemporâneo. Available online: www.pordata.pt (accessed on 15 June 2021).
- Joly, M.; Peuch, V.H. Objective classification of air quality monitoring sites over Europe. Atmos. Environ. 2012, 47, 111–123. [Google Scholar] [CrossRef]
- APA QualAR. Qualidade do AR. Available online: https://qualar.apambiente.pt/node/indice-qualar (accessed on 16 September 2019).
- Gama, C.; Relvas, H.; Lopes, M.; Monteiro, A. The impact of COVID-19 on air quality levels in Portugal: A way to assess traffic contribution. Environ. Res. 2021, 193, 110515. [Google Scholar] [CrossRef]
- Monteiro, A.; Russo, M.; Gama, C.; Lopes, M.; Borrego, C. How economic crisis influence air quality over Portugal (Lisbon and Porto)? Atmos. Pollut. Res. 2018, 9, 439–445. [Google Scholar] [CrossRef]
- ETC/ATNI Report 16/2019: Air Quality Trends in Europe: 2000–2017. Assessment for surface SO2, NO2, Ozone, PM10 and PM2.5—Eionet Portal. Available online: https://www.eionet.europa.eu/etcs/etc-atni/products/etc-atni-reports/etc-atni-report-16-2019-air-quality-trends-in-europe-2000-2017-assessment-for-surface-so2-no2-ozone-pm10-and-pm2-5-1 (accessed on 16 June 2021).
- European Environment Agency Air quality in Europe—2020 Report—European Environment Agency. 2020. Available online: https://www.eea.europa.eu/publications/air-quality-in-europe-2020-report (accessed on 21 June 2021).
- Ensemble Forecast—WMO SDS-WAS. Available online: https://sds-was.aemet.es/forecast-products/dust-forecasts/ensemble-forecast# (accessed on 21 June 2021).
- CCDRC. Plano de Melhoria da Qualidade do Ar na Região Centro. 2010. Available online: http://www.ccdrc.pt/index.php?option=com_docmanview=downloadid=3211Itemid=739 (accessed on 28 July 2021).
- Gama, C.; Pio, C.; Monteiro, A.; Russo, M.; Fernandes, A.P.; Borrego, C.; Baldasano, J.M.; Tchepel, O. Comparison of methodologies for assessing desert dust contribution to regional PM10 and PM2.5 levels: A one-year study over Portugal. Atmosphere 2020, 11, 134. [Google Scholar] [CrossRef] [Green Version]
- Oliveira, M.; Delerue-Matos, C.; Pereira, M.C.; Morais, S. Environmental particulate matter levels during 2017 large forest fires and megafires in the center region of Portugal: A public health concern? Int. J. Environ. Res. Public Health 2020, 17, 1032. [Google Scholar] [CrossRef] [Green Version]
- EEA Air Quality in Europe—2019 Report—EEA Report No 10/2019; Publications Office of the European Union: Luxembourg, 2019; Available online: https://www.eea.europa.eu/publications/air-quality-in-europe-2019 (accessed on 25 June 2021).
- Augusto, S.; Ratola, N.; Tarín-Carrasco, P.; Jiménez-Guerrero, P.; Turco, M.; Schuhmacher, M.; Costa, S.; Teixeira, J.P.; Costa, C. Population exposure to particulate-matter and related mortality due to the Portuguese wildfires in October 2017 driven by storm Ophelia. Environ. Int. 2020, 144, 106056. [Google Scholar] [CrossRef] [PubMed]
- Turco, M.; Jerez, S.; Augusto, S.; Tarín-Carrasco, P.; Ratola, N.; Jiménez-Guerrero, P.; Trigo, R.M. Climate drivers of the 2017 devastating fires in Portugal. Sci. Rep. 2019, 9, 13886. [Google Scholar] [CrossRef] [PubMed]
- Silva, A.V.; Oliveira, C.M.; Canha, N.; Miranda, A.I.; Almeida, S.M. Long-term assessment of air quality and identification of aerosol sources at Setúbal, Portugal. Int. J. Environ. Res. Public Health 2020, 17, 5447. [Google Scholar] [CrossRef] [PubMed]
- Calvo, A.I.; Alves, C.; Castro, A.; Pont, V.; Vicente, A.M.; Fraile, R. Research on aerosol sources and chemical composition: Past, current and emerging issues. Atmos. Res. 2013, 120–121, 1–28. [Google Scholar] [CrossRef]
- Gama, C.; Monteiro, A.; Pio, C.; Miranda, A.I.; Baldasano, J.M.; Tchepel, O. Temporal patterns and trends of particulate matter over Portugal: A long-term analysis of background concentrations. Air Qual. Atmos. Health 2018, 11, 397–407. [Google Scholar] [CrossRef] [Green Version]
- Sharma, S.; Zhang, M.; Anshika; Gao, J.; Zhang, H.; Kota, S.H. Effect of restricted emissions during COVID-19 on air quality in India. Sci. Total Environ. 2020, 728, 138878. [Google Scholar] [CrossRef]
- Liu, F.; Wang, M.; Zheng, M. Effects of COVID-19 lockdown on global air quality and health. Sci. Total Environ. 2021, 755, 142533. [Google Scholar] [CrossRef]
- European Dataportal. The COVID-19 Related Traffic Reduction and Decreased Air Pollution in Europe. Available online: https://data.europa.eu/en/impact-studies/covid-19/covid-19-related-traffic-reduction-and-decreased-air-pollution-europe (accessed on 22 June 2021).
- Collins, W.J.; Stevenson, D.S.; Johnson, C.E.; Derwent, R.G. Tropospheric ozone in a global-scale three-dimensional Lagrangian model and its response to NO(x) emission controls. J. Atmos. Chem. 1997, 26, 223–274. [Google Scholar] [CrossRef]
- Sillman, S. Chapter 12 The relation between ozone, NOx and hydrocarbons in urban and polluted rural environments. Dev. Environ. Sci. 2002, 1, 339–385. [Google Scholar] [CrossRef]
- Sicard, P.; De Marco, A.; Agathokleous, E.; Feng, Z.; Xu, X.; Paoletti, E.; Rodriguez, J.J.D.; Calatayud, V. Amplified ozone pollution in cities during the COVID-19 lockdown. Sci. Total Environ. 2020, 735, 139542. [Google Scholar] [CrossRef] [PubMed]
- Menut, L.; Bessagnet, B.; Siour, G.; Mailler, S.; Pennel, R.; Cholakian, A. Impact of lockdown measures to combat Covid-19 on air quality over western Europe. Sci. Total Environ. 2020, 741, 140426. [Google Scholar] [CrossRef]
- Siciliano, B.; Carvalho, G.; da Silva, C.M.; Arbilla, G. The impact of COVID-19 partial lockdown on primary pollutant concentrations in the atmosphere of Rio de Janeiro and São Paulo megacities (Brazil). Bull. Environ. Contam. Toxicol. 2020, 105, 2–8. [Google Scholar] [CrossRef]
- Ordóñez, C.; Garrido-Perez, J.M.; García-Herrera, R. Early spring near-surface ozone in Europe during the COVID-19 shutdown: Meteorological effects outweigh emission changes. Sci. Total Environ. 2020, 747, 141322. [Google Scholar] [CrossRef] [PubMed]
- Gaubert, B.; Bouarar, I.; Doumbia, T.; Liu, Y.; Stavrakou, T.; Deroubaix, A.; Darras, S.; Elguindi, N.; Granier, C.; Lacey, F.; et al. Global changes in secondary atmospheric pollutants during the 2020 COVID-19 pandemic. J. Geophys. Res. Atmos. 2021, 126, e2020JD034213. [Google Scholar] [CrossRef] [PubMed]


| Percentage of Collected Data Per Year (%) | |||||
|---|---|---|---|---|---|
| Air Pollutant | |||||
| Year | NO2 | O3 | PM2.5 | PM10 | SO2 |
| 2001 | 95.4 | 93.6 | n.a. | n.a. | 99.7 |
| 2002 | 99.1 | 97.9 | n.a. | n.a. | 99.2 |
| 2003 | 58.0 | 99.7 | n.a. | n.a. | 98.8 |
| 2004 | 72.3 | 98.9 | n.a. | n.a. | 99.1 |
| 2005 | 92.0 | 91.0 | n.a. | n.a. | 92.5 |
| 2006 | 98.5 | 99.9 | n.a. | n.a. | 99.7 |
| 2007 | 98.8 | 96.5 | n.a. | n.a. | 98.9 |
| 2008 | 99.1 | 97.1 | n.a. | 93.3 | 99.7 |
| 2009 | 95.2 | 98.2 | n.a. | 96.6 | 99.7 |
| 2010 | 95.2 | 99.2 | n.a. | 83.9 | 97.9 |
| 2011 | 94.8 | 91.3 | n.a. | 93.7 | 99.6 |
| 2012 | 67.5 | 93.3 | n.a. | n.a. | 94.8 |
| 2013 | 76.8 | 93.1 | n.a. | 44.7 | 98.6 |
| 2014 | 93.3 | 85.7 | n.a. | 92.5 | 98.8 |
| 2015 | 99.0 | 99.4 | n.a. | 94.0 | 98.0 |
| 2016 | 97.8 | 99.6 | n.a. | 90.1 | 99.3 |
| 2017 | 85.2 | 98.4 | n.a. | 91.3 | 99.1 |
| 2018 | 90.1 | 95.3 | n.a. | 98.3 | 98.5 |
| 2019 | 99.9 | 96.0 | n.a. | 98.3 | 99.8 |
| 2020 | 98.2 | 99.5 | 93.6 | 99.7 | 98.2 |
Publisher’s Note: MDPI stays neutral with regard to jurisdictional claims in published maps and institutional affiliations. |
© 2021 by the authors. Licensee MDPI, Basel, Switzerland. This article is an open access article distributed under the terms and conditions of the Creative Commons Attribution (CC BY) license (https://creativecommons.org/licenses/by/4.0/).
Share and Cite
Gamelas, C.; Abecasis, L.; Canha, N.; Almeida, S.M. The Impact of COVID-19 Confinement Measures on the Air Quality in an Urban-Industrial Area of Portugal. Atmosphere 2021, 12, 1097. https://doi.org/10.3390/atmos12091097
Gamelas C, Abecasis L, Canha N, Almeida SM. The Impact of COVID-19 Confinement Measures on the Air Quality in an Urban-Industrial Area of Portugal. Atmosphere. 2021; 12(9):1097. https://doi.org/10.3390/atmos12091097
Chicago/Turabian StyleGamelas, Carla, Leonor Abecasis, Nuno Canha, and Susana Marta Almeida. 2021. "The Impact of COVID-19 Confinement Measures on the Air Quality in an Urban-Industrial Area of Portugal" Atmosphere 12, no. 9: 1097. https://doi.org/10.3390/atmos12091097
APA StyleGamelas, C., Abecasis, L., Canha, N., & Almeida, S. M. (2021). The Impact of COVID-19 Confinement Measures on the Air Quality in an Urban-Industrial Area of Portugal. Atmosphere, 12(9), 1097. https://doi.org/10.3390/atmos12091097