Article

Geometrical Assessment of Sunlit and Shaded Area of Urban Trees Based on Aligned Orthographic Views

by
Marcel Gangwisch
1,2,*,
Dominik Fröhlich
1,
Andreas Christen
2 and
Andreas Matzarakis
1,2
1
Research Centre Human Biometeorology, Deutscher Wetterdienst, D-79104 Freiburg, Germany
2
Chair of Environmental Meteorology, Institute of Earth and Environmental Sciences, Faculty of Environment and Natural Resources, University of Freiburg, D-79085 Freiburg, Germany
*
Author to whom correspondence should be addressed.
Atmosphere 2021, 12(8), 968; https://doi.org/10.3390/atmos12080968
Submission received: 23 June 2021 / Revised: 22 July 2021 / Accepted: 26 July 2021 / Published: 28 July 2021
(This article belongs to the Section Atmospheric Techniques, Instruments, and Modeling)

Abstract

:
To quantify the ecosystem services of trees in urban environments, it is necessary to assess received direct solar radiation of each tree. While the Sky View Factor (SVF) is suitable for assessing the total incoming short- and longwave radiation fluxes, its information is limited to specific points in space. For a spatial analysis, it is necessary to sample the area for SVF. A new geometrical method, Area View Factor (AVF), for the calculation of sunlit areas is proposed. AVF is the ratio of the unhidden, projected surface of an object to the whole projected surface of an object in a complex environment. Hereby, a virtual, orthographic camera is oriented in accordance to the sun’s position in the 3D model domain. The method is implemented in the microscale model SkyHelios, utilizing efficient rendering techniques to assess AVF of all urban trees in parallel. The method was applied to Rieselfeld in Freiburg, Germany. The assessed sunlit area is compared to the SVF at the top of each tree and solar altitude angle, revealing a strong relationship between sunlit areas to solar altitude angles. This study shows that AVF is an efficient methodology to assess received direct radiation of urban trees. Based on AVF, it is possible to identify urban areas with shaded and sunlit trees, but it can also be applied to other objects in complex environments. Therefore, AVF is applicable for urban architecture or energetic research questions.

1. Introduction

The urban morphology describing the composition, layout, and form of a city has great impact on the radiation absorption of urban trees [1,2,3]. Trees in streets and parks can be shaded by urban obstacles (e.g., by buildings and other trees), so that the absorption of direct and diffuse shortwave radiation is limited [4,5,6].
Radiation fluxes (especially photosynthetically active radiation (PAR; 0.34–0.71 μm)), which are modified by the processes of absorption, emission, reflection, and transmission in the complex urban environment, have great impact on the ecosystem services of urban trees and therefore on the micro- and bioclimate in cities [4,7,8,9].
Tree physiological processes (e.g., transpiration and photosynthesis), which are controlled by these radiation fluxes, provide microclimatic regulations as ecosystem services through cooling by shading and transpiration [10,11,12,13,14]. These processes modify the local meteorological conditions of the microclimate (e.g., increased humidity and decreased air temperature [15]) and therefore human thermal bioclimate [16,17].
Quantifying the impact of ecosystem services on the urban microclimate as well as the assessment of ecological and financial benefits [18,19] is required for improved and optimized urban planning, architecture, human thermal comfort and health.
In order to quantify the impact of trees on the urban microclimate, it is necessary to quantify radiation fluxes modified by the urban morphology. Interception of solar irradiance by urban trees depends on the position of the sun (solar azimuth and zenith angle) in relation to the observed model domain. The absorption may be limited due to attenuation by the urban morphology.
The urban morphology can be characterized by various geometrical indicators for layout and density [20,21]. These provide an explicit or parametric specification of the morphology. It can be explicitly specified by geometrical properties of buildings and trees (position, shape, and height) describing the volume and location of green and gray infrastructure in urban districts. The orientation of buildings and vegetation in relation to the sunpath, depict the exposure of building facades and leafs surfaces towards the sun. The Height/Width ratio (H/W-ratio) is the aspect ratio of streets determined by the height of surrounding buildings in relation to the width of streets indicate the openness of urban streets. Sky View Factors (SVF) in open spaces [22,23] is a dimensionless parameter describe the exposure of a point in space to the open sky vault.
To specify the urban morphology in a parametric way, the mean distance between buildings is an indicator for the horizontal, spatial density of an urban district. Frontal and planar area densities (e.g., complexity and site coverage) are indicators for the vertical and horizontal density of urban forms, respectively.
To determine direct and diffuse shortwave irradiance on a single point in space the local, spherical Sky View Factor (SVF) [22,24,25] is the most commonly used parameter. Spherical SVF is the fraction of the visible sky of the upper hemisphere and is dependent on the Point of View (POV). SVF can be assessed from rendered fish-eye imagery [22,24,26,27] or real photographs as well as from approaches based on Monte Carlo computational ray tracing [28,29,30].
These techniques have been integrated into numerous numerical Urban Climate Models (UCMs) on the micro- and local scale to assess the thermal effects of urban structures [31]. Discrete Urban Canopy models (UCs) represent the urban morphology of typical street canyons in two-dimensional tiles. The physical processes can be modeled in one (e.g., Town Energy Balance model (TEB) [32], Arizona State University Single-Layer Urban Canopy Model (ASLUM) [33]), or more layers (see, e.g., in [30,33,34]) within the canopy to depict the surface energy balance (SEB) in the complex urban environment. However, individual building structures (e.g., from CityGML) cannot be represented. Besides Urban Canopy models, there are models for numerical fluid simulations (CFDs) in urban areas (e.g., ENVI-met [35,36] and PALM-4U [37,38,39,40]). Turbulence-resolving models are highly accurate but at the same time computationally costly and require a high-performance computing infrastructure (HPC), which is usually not available to municipalities and are at the same time difficult to operate. The subsequently presented method was integrated into SkyHelios, a three-dimension microscale model, which is capable of continuous Sky View Factor estimation in urban areas. SkyHelios applies vectorized geospatial data to resolve the urban morphology as individual buildings and trees of the respective study area in a vectorized three-dimensional scenery [41,42].
In this article, POV is changed to the source of shortwave radiation (e.g., sun) in order to calculate sun-lit areas of urban trees on an object-oriented basis, which are exposed to the point source of the shortwave radiation. The sunlit area is hereby expressed as the ratio between sunlit projected area in relation to fully projected area of the tree canopy. The ratio between these projected areas is called Area View Factor (AVF). This information is available on an object-oriented basis and represents the exposure of the whole object towards the sun, in contrast to SVF which considers the complete upper hemisphere, including incoming longwave reflectance radiation of the surrounding surfaces for a single point in space. By calculating AVF on an object-based basis, it is then possible to perform calculations for the entire urban tree canopy without having to resolve individual leaves. Therefore, AVF can be utilized in the (Two-) big-leaf model for transpiration and photosynthesis calculations [8,9,43].
The calculation of AVF is implemented by aligned orthographic views, assuming the rays of the sun to be in parallel. These synthetically rendered views are analyzed using image processing techniques to map pixel values to individual trees, allowing for the calculation of AVF for each tree in the whole study area at once.
With the aid of this new method, first the sunlit area of each tree canopy in a study area can be calculated in order to subsequently describe the tree physiological processes driven by the absorption of direct solar radiation. Furthermore, it is also possible to calculate the sunlit area of any object in an urban environment in relation to seasonal and daily conditions. This could be, e.g., photovoltaic systems, but also building facades or horizontal surfaces in a street canyon. Based on the calculation of the Area View Factor for each tree canopy, the following research questions will be addressed: (1) How does the sun-lit area of a tree canopy change over the course of the day? (2) What is the influence of urban morphology on tree canopy shading? (3) How are AVF and SVF related to each other?

2. Methodology and Data

2.1. Lambert’s Cosine Law

A way to describe the irradiance on a horizontal surface is given by Lambert’s cosine law. The law states that irradiance to a horizontal surface varies in relation to the orientation of the surface towards a point source of shortwave radiation, usually the sun [9]:
I = I 0 · cos ( Θ ) = I 0 · sin ( β )
This relationship is illustrated in Figure 1, showing the irradiance ( I 0 , W   m 2 ) for given solar radiation input and solar altitude angle ( β , °). Θ is of same magnitude as β for geometrical reason. In the complex urban environment it is not possible to directly relate the irradiance to a given surface, because the surface might be obscured by other objects.

2.2. SkyHelios

SkyHelios [24,25,41] is an urban microscale model with the ability to estimate crucial parameters of the urban environment running on desktop machines. It is a steady-state, time-independent model capable of estimating several thermal indices [42]: Physiologically Equivalent Temperature (PET [44,45]), Universal Thermal Climate Index (UTCI [46]) and Perceived Temperature (PT [47]). Furthermore, SkyHelios can compute different environmental factors: sunshine duration, shading, wind speed, and direction for areas of interest (AOIs) as well as points of interest (POIs). Beside that, SkyHelios can estimate the aerodynamic roughness, based on different approaches [48]. The development of SkyHelios is focused on some key aspects, to keep the software efficient, fast, and free of charge:
  • Reduction of time complexity by heavy utilization of cheap graphics processing units (GPU) and parallelism on 64 bit machines.
  • Reduction of costs by open source third party frameworks and libraries.
  • Strong compliance with open standards of the Open Geospatial Consortium (OGC) by supporting well standardized data formats [49].
By creating virtual, three-dimensional (3D) scenes from 3D urban geoinformation (e.g., CityGML LOD 0, 1 and 3D-Shapefiles), SkyHelios can be classified as a 3D city model, which bears great potential in general [50]. All 3D entities in the 3D scene are based on vectorial geodata, allowing for the specification of spatial resolution for all results on demand. The 3D scene is managed by the Object-Oriented Graphics Rendering Engine [51] (MOGRE), which is licensed under the MIT license. For more information see [52,53]. SkyHelios is written in C# programming language, targeting the .NET Framework 4.6.1. and is therefore only available for computers running Microsoft Windows.

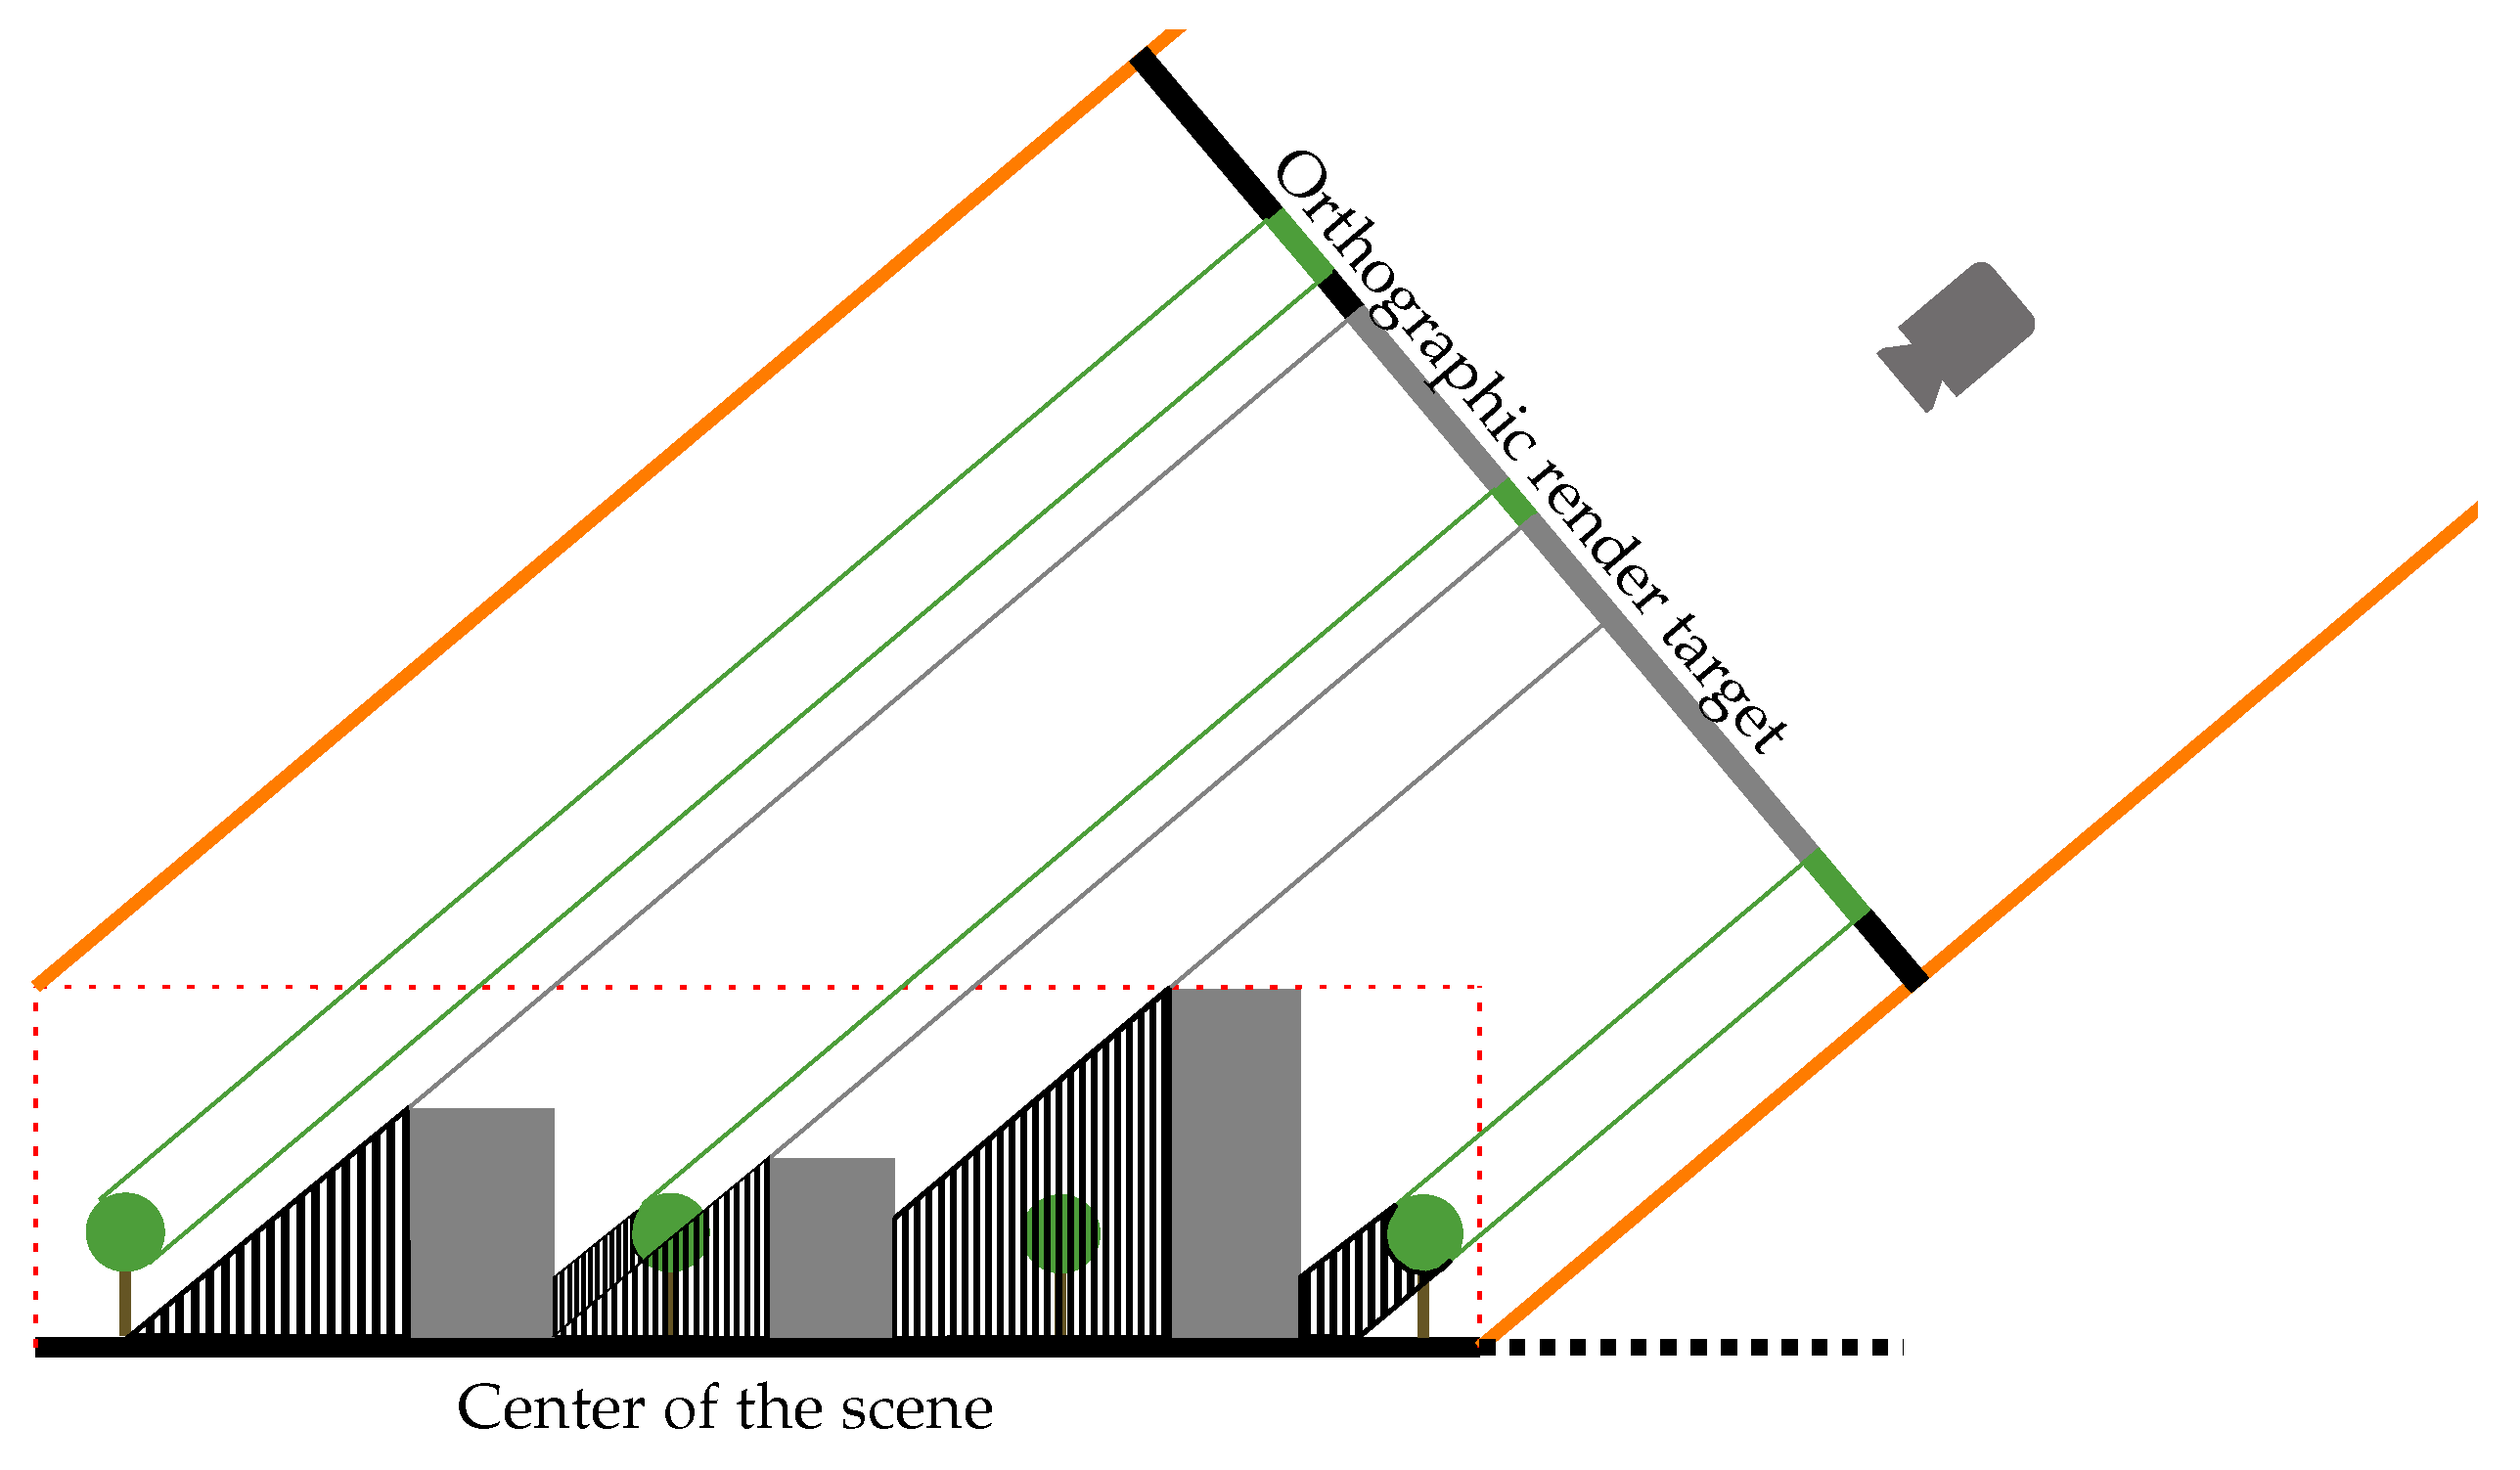
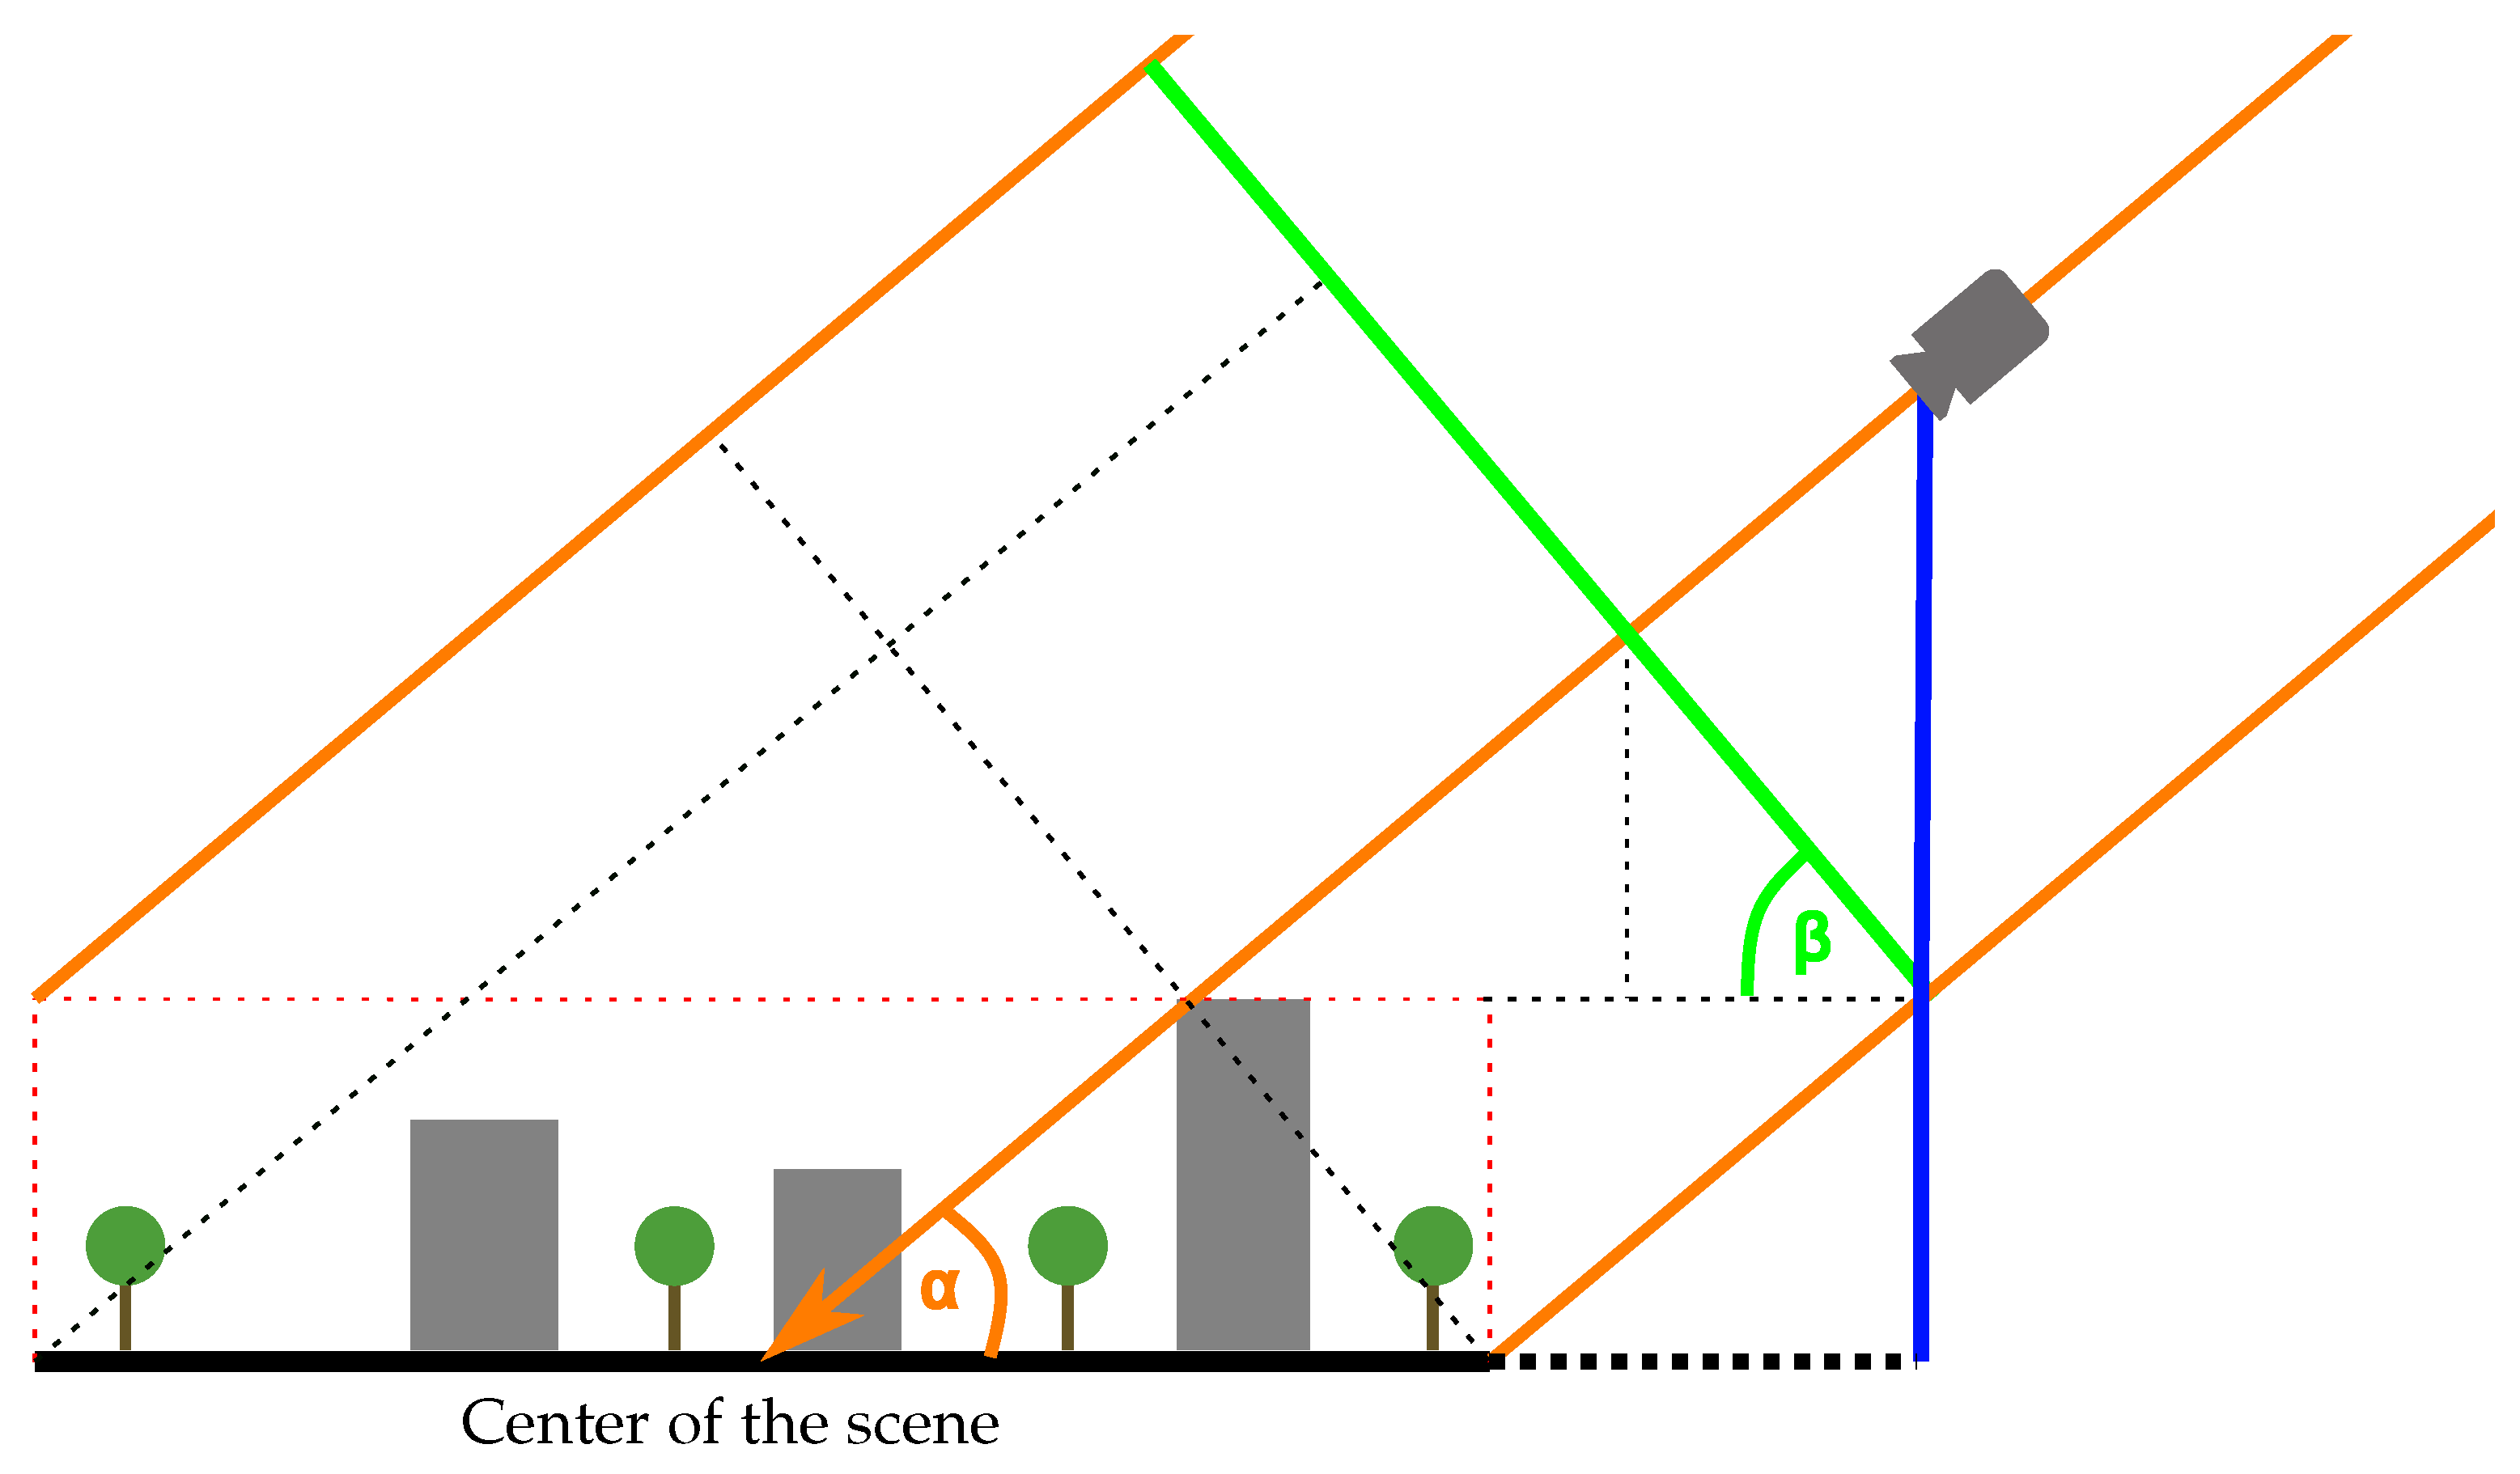
2.3. Geometrical Assessment of Sunlit and Shaded Area

The idea of Lambert’s cosine law (Equation (1)) was adapted for the use in 3D scenes of the microscale model SkyHelios. The sunlit area of an urban tree is calculated based on a rendered image from the point of view of the sun (POV). The rendered image is hereby taken by an orthographic camera [52,53].
An orthographic camera is capable to render projected images with the qualities of an equal area projection, so that rendered areas are independent of their distances to the camera. Additionally, all parallel light beams are focused at the camera lens at infinite distance (Figure 2). The view of the orthographic camera is recorded on a plane, called render target, in 3D space. An orthographic projection is contrary to the classical perspective projection, there all light beams are focused at the camera lens on the focal point at a specific distance (compare to focal length). The perspective projection does not preserve the equal area property, compared to the orthographic projection. Apart from three-dimensional modeling in computer graphics, orthographic imagery is well known in remote sensing [54] as well as for orthographic projections in classical geography [55].
The orthographic camera as well as the corresponding render target are setup with the required properties as specified in Table 1. The position of the camera, and width and height of the render target are determined by the position of the sun, dimensions of the scene, as well as orientation of the scene towards the sun. The height of the camera as well as the properties for the render target can be geometrically assessed by the properties of the scene, especially by its bounding box. The bounding box of a scene is the enclosing cuboid, defined by the minimal and maximal vector of that scene. The required properties can be geometrically calculated according to Figure 3.
The render target is positioned along the line given by the position of the sun and the center of the scene. The size of the render target is calculated, so that the complete scene is covered by a single rendered picture. Afterwards, the spatial resolution of the render target is, based on its size, multiplied by a scaling factor in order to increase the accuracy of the rendered picture. The size of the render target is given in real-world dimensions.

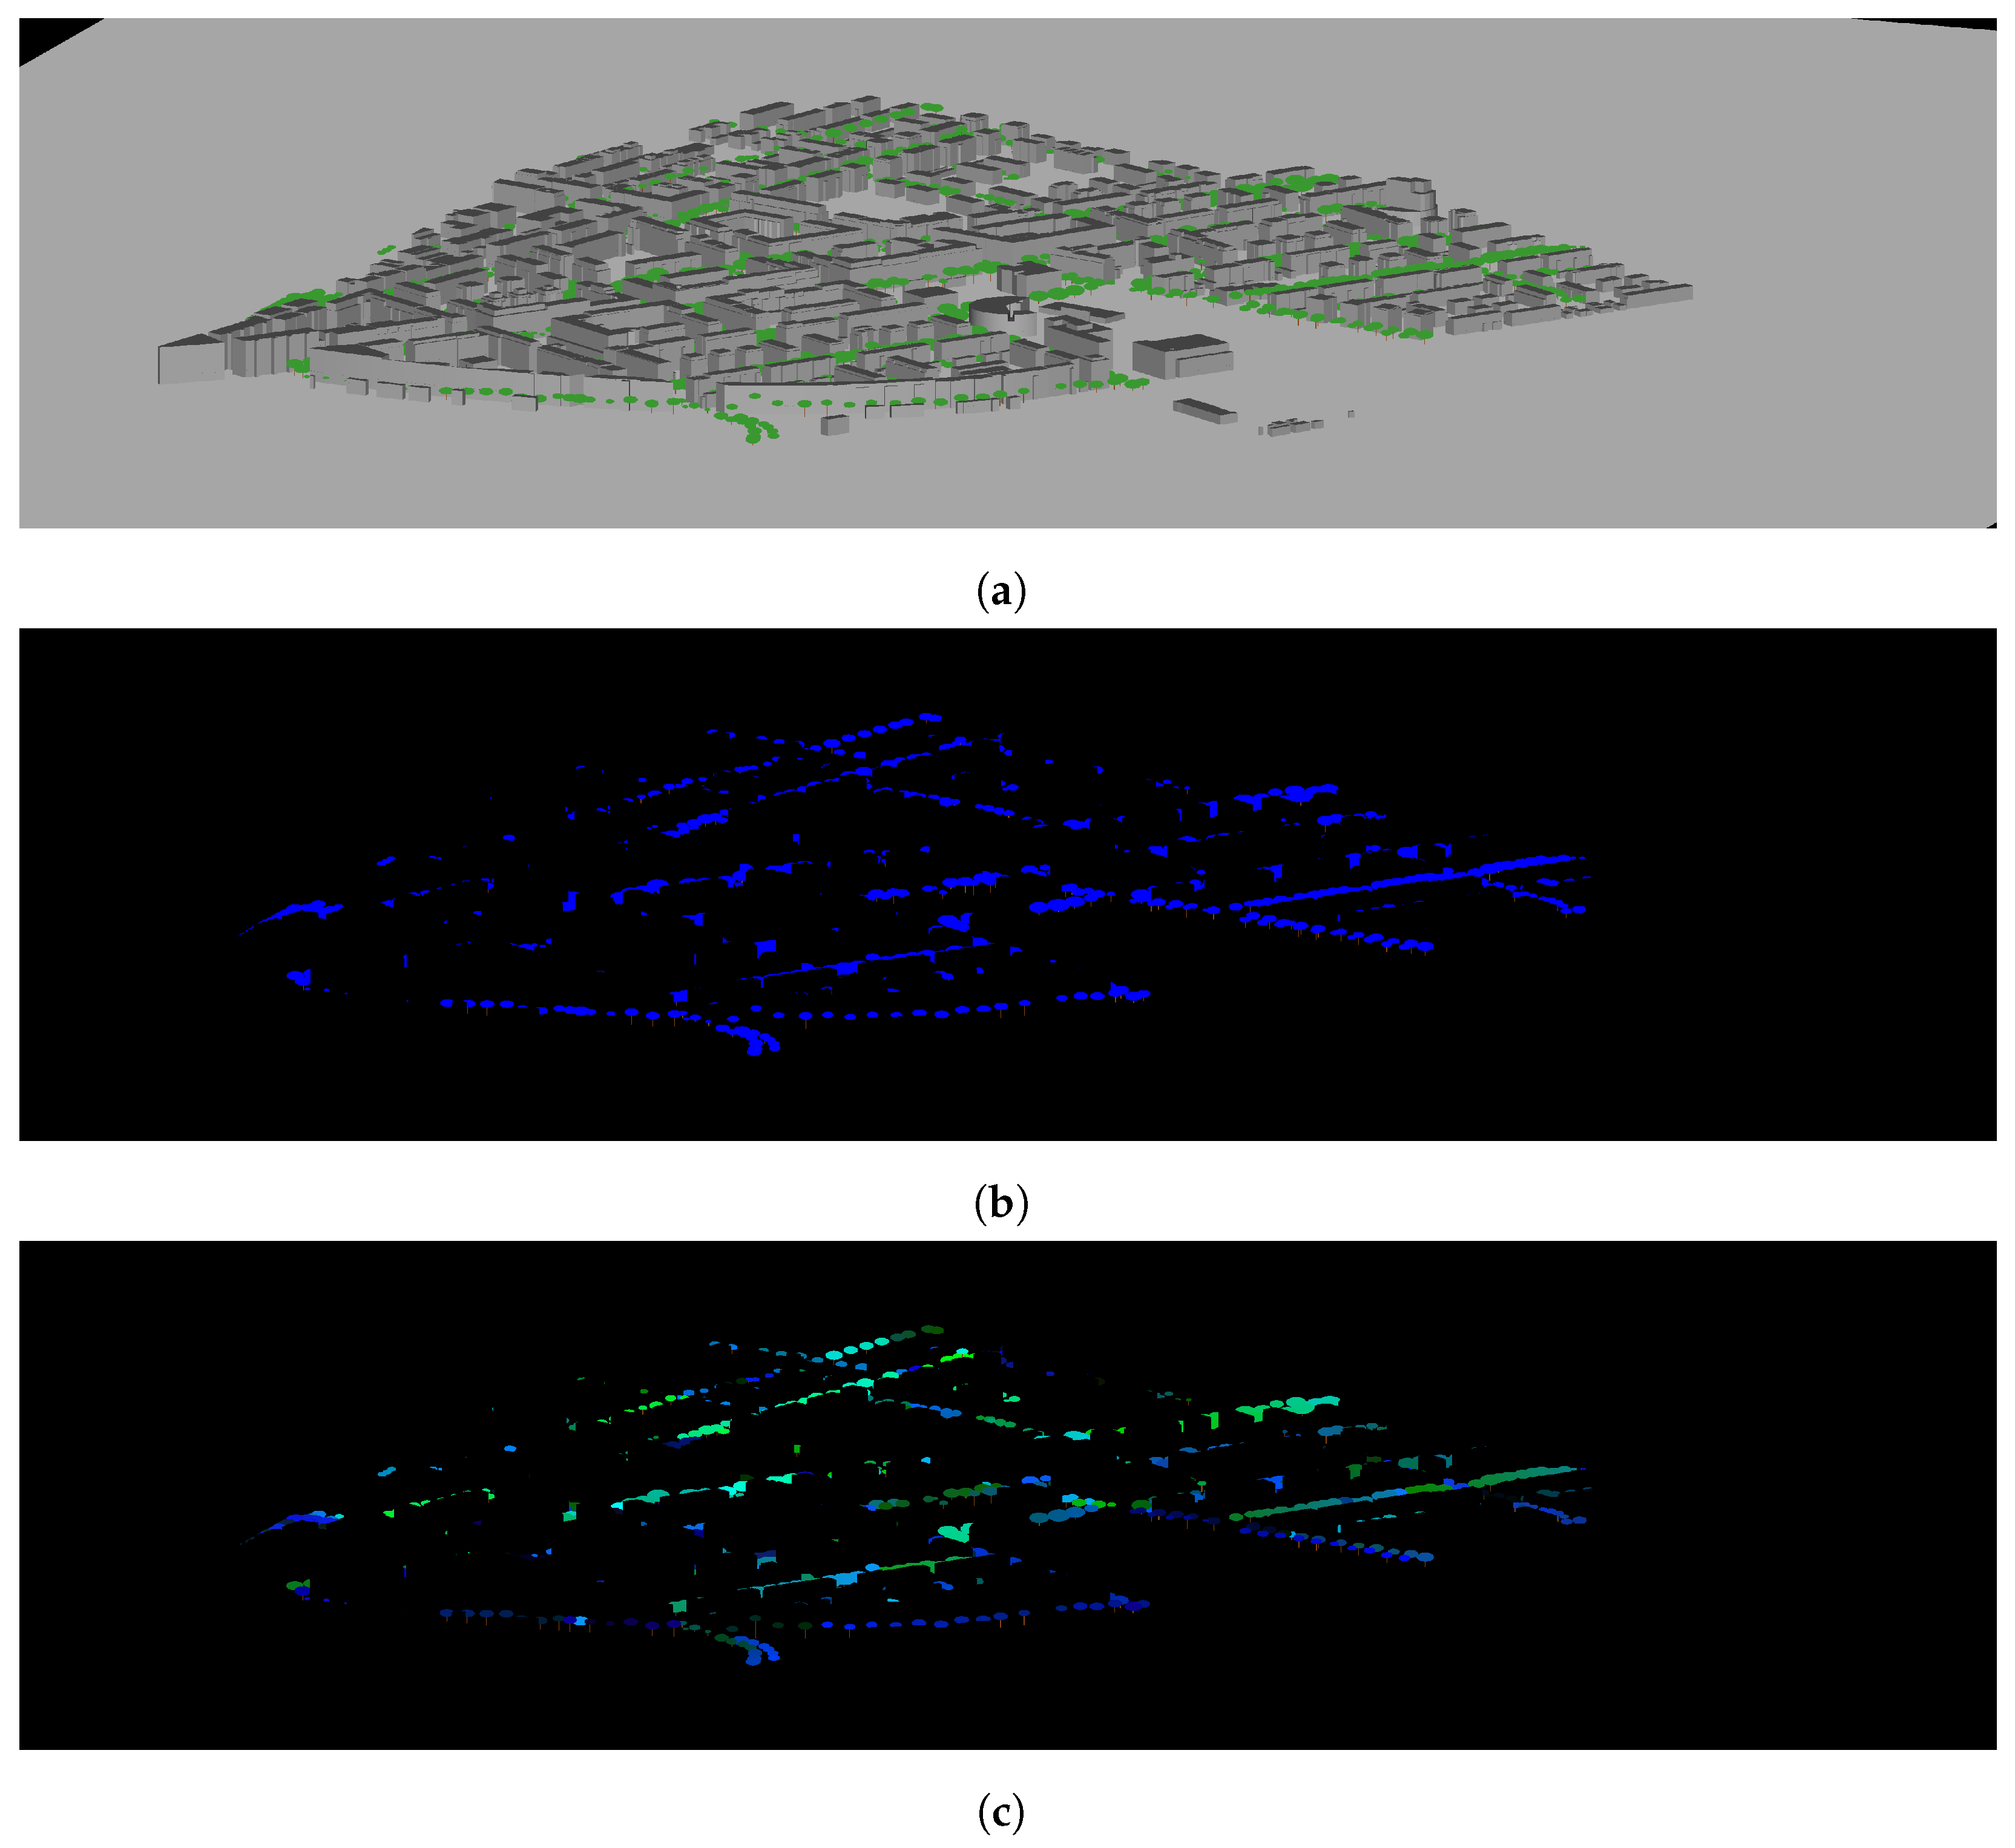
2.4. Object-Based Analysis of the Rendered Orthographic View

In order to get object-based information from the rendered view, the scene has to be modified to distinguish between different objects in the scene (buildings, tree crowns, tree trunks, etc.) for further analysis. All elements (buildings, tree trunks, and the ground surface) in the scene, except crowns of urban trees, are rendered in solid black. These elements with color RGB (0,0,0) in the RGB color space are ignored in further analysis. Tree crowns are colored, based on unique identifiers (id), which get also encoded in the RGB color space (Figure 4). The encoding is implemented in the following form:
r e d = ( i d / ( 255 · 255 ) ) mod 255 g r e e n = ( i d / 255 ) mod 255 b l u e = i d mod 255
The steps of scene modification are illustrated in Figure 4 for the study area (Section 2.6) at 05:00 UTC. The orthographic view of the scene based on POV of the sun shows all buildings and trees in the scene in orthographic projection (Figure 4a). Parts of the trees are obscured by buildings and other trees and therefore not visible in this rendered image. It is not possible to distinguish between single trees and map the unobscured area to each corresponding tree. When the whole scene beside tree crowns is rendered in black, buildings and unobscured areas of trees can be separated (Figure 4b). In order to map the unobscured, sunlit areas to single trees, each tree is encoded in accordance to its unique identifier (Figure 4c). Each tree has an unique color in the orthographic rendered image and can be distinguished in further analysis.
The rendered view is analyzed on a pixel basis. Pixels with specific pixel values (e.g., color values) are counted and mapped to the original unique identifiers of the urban trees. The size of the pixels are hereby given in real world dimensions. The number of pixels with a specific color corresponds to the sunlit, unobstructed area of a single tree crown. The unobstructed area of the tree crown is the part of the tree which receives direct shortwave radiation.

2.5. Orthogonal Area View Factor

The sunlit unobstructed area of each single urban tree crown is related to the complete, projected area of the tree crown. The projected area is hereby calculated as the area of a circle. This method is named orthogonal Area View Factor (AVF). The AVF is the fraction of projected visible surface of an object in a complex environment ( A visible , projected , m 2 ) to the projected surface of an object in unobstructed, free space ( A complete , projected , m 2 ). The AVF is dependent on solar azimuth angle ( ψ , °), solar altitude angle ( β , °), and surrounding urban morphology:
A V F ( β , ψ ) = A visible , projected ( β , ψ ) A complete , projected ( β , ψ )
In contrast to SVF, AVF is object based and knowledge about the projected surface of the object (e.g., projected crown area) is required.

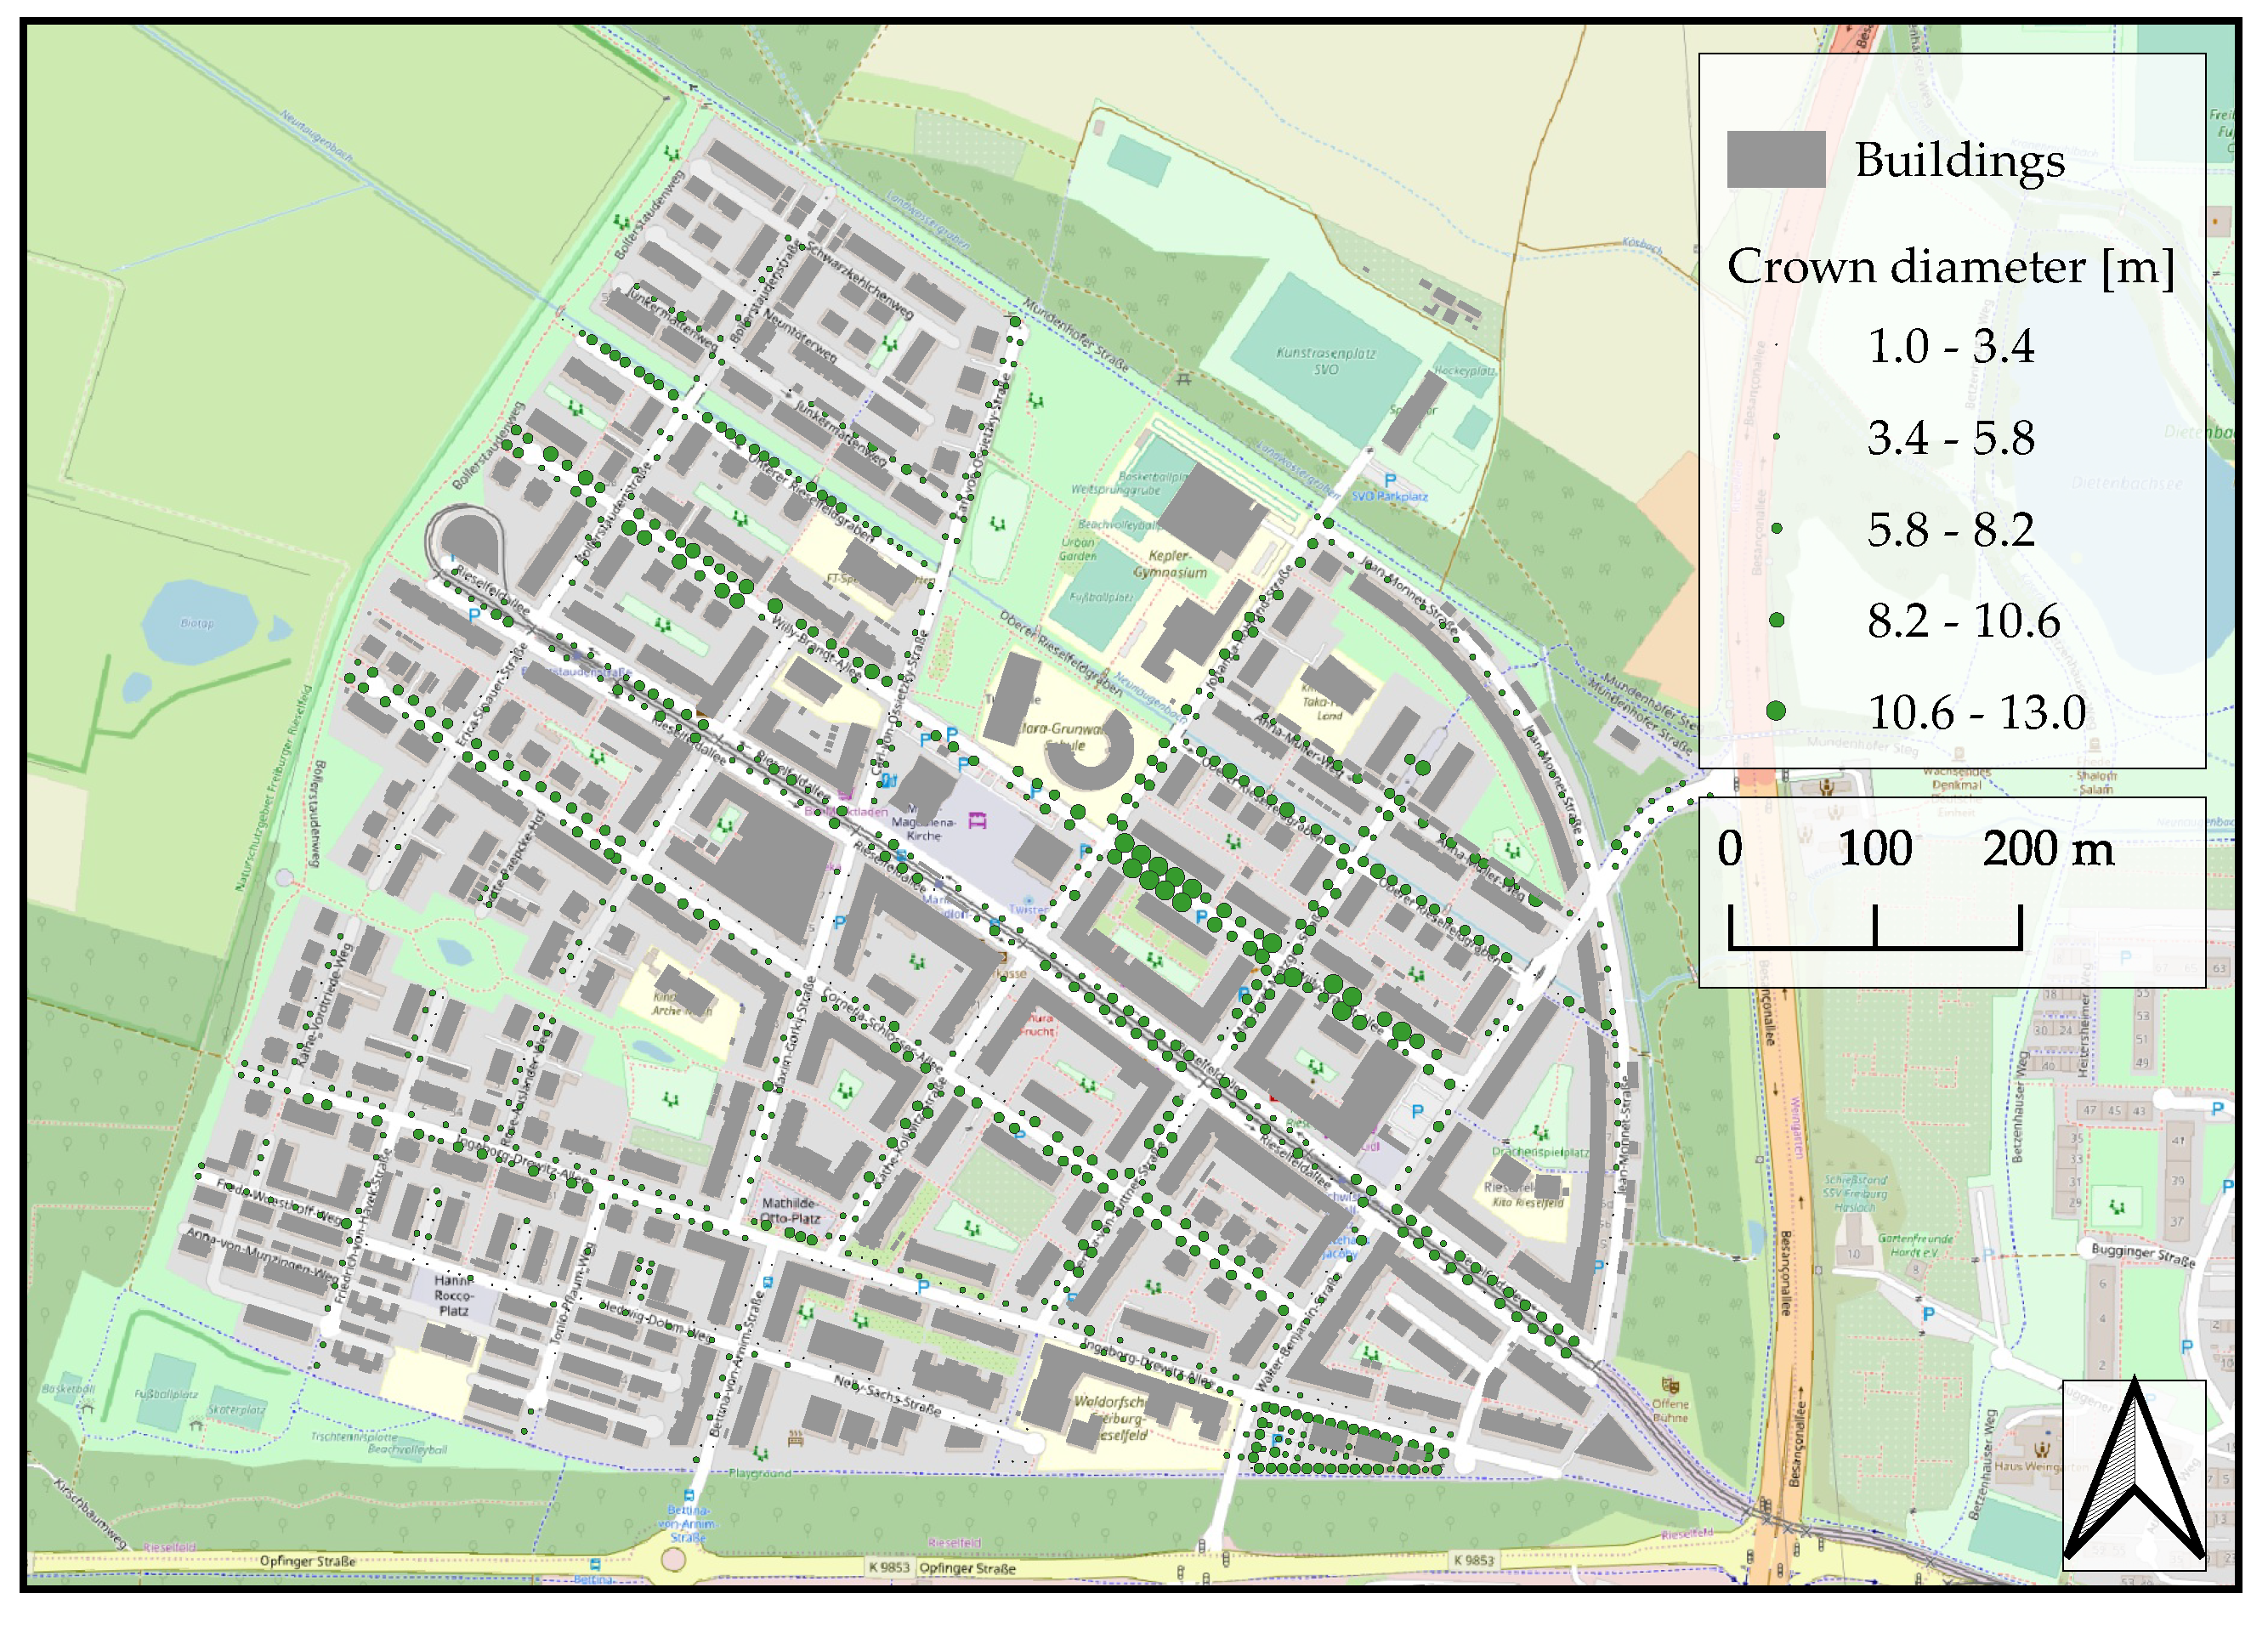
2.6. Dataset: Rieselfeld in Freiburg, Germany

The implemented module is tested for a study area in Freiburg, Germany. The urban district Rieselfeld is located at the western fringe of the city (located at 47.9991 N, 7.7921 E; see Figure 5). A detailed three-dimensional city model with level of detail one and two (LOD1 and LOD2), as well as an urban tree cadastre was provided:
  • The city model is provided in the 3D CityGML Format specified after [56]. Therefore, the data for the buildings cover footprint and heights of all buildings in the study area.
  • The urban tree cadastre is providing urban tree data as point layers in the proprietary ESRI Shapefile format. The cadastre contains information about tree species, tree height, crown diameter, trunk height and trunk radius. It is projected to the metric coordinate system WGS 84/UTM zone 32N (EPSG:32632).
The district is built-up by 20,963 features with an average feature height of 8.7 m covering floors, roofs and walls. There are 1103 urban trees with an average tree height of 8.6 m (varying between 3.0–19.0 m) distributed throughout the area. The whole area has a spatial extent of 1014.9 m × 916.2 m.

3. Results

Urban trees in Rieselfeld get shaded by buildings and by other trees. The sunlit areas are calculated based on the assumption for clear sky condition, without consideration of diffuse radiation. The only source of direct shortwave radiation in this study is the sun. Reflections of shortwave radiation are neglected. The shading is dependent on the sunpath, and therefore on the time of the day but also on the day of the year (DOY). At first, the mean AVF between a typical spring and summer day are compared (Section 3.1) and the mean AVF is linked to the solar altitude angle (Section 3.2). Subsequently, the spatial, seasonal and daily dependencies of AVF are analyzed throughout the study area (Section 3.3). Finally, the spatial results for AVF are compared with SVF (Section 3.4) at the top of each tree crown.

3.1. Spatially Averaged Analysis of the Mean Area View Factor

An averaged overview of AVF of all urban trees in the scene is given by Figure 6 on a hourly basis for the 14th of March (spring) and June (summer). The timeseries for AVF follow a standard bell-shaped curve with its maximum during midday at 11:00 UTC in accordance to maximum solar altitude angle. Throughout the day (from 04:00 to 19:00 UTC) urban trees are more sunlit in summer than in spring. The lighting in summer starts earlier and lasts longer compared to spring. The gradients during dawn and dusk are greater in spring than in summer. The area of sun-exposed surfaces in summer is of greater magnitude compared to spring (Table 2).
The standard deviation for each hour varies during the day, with highest values during dawn and dusk in spring.
A detailed insight for the temporal and spatial variation of AVF throughout the district is given in Section 3.3.

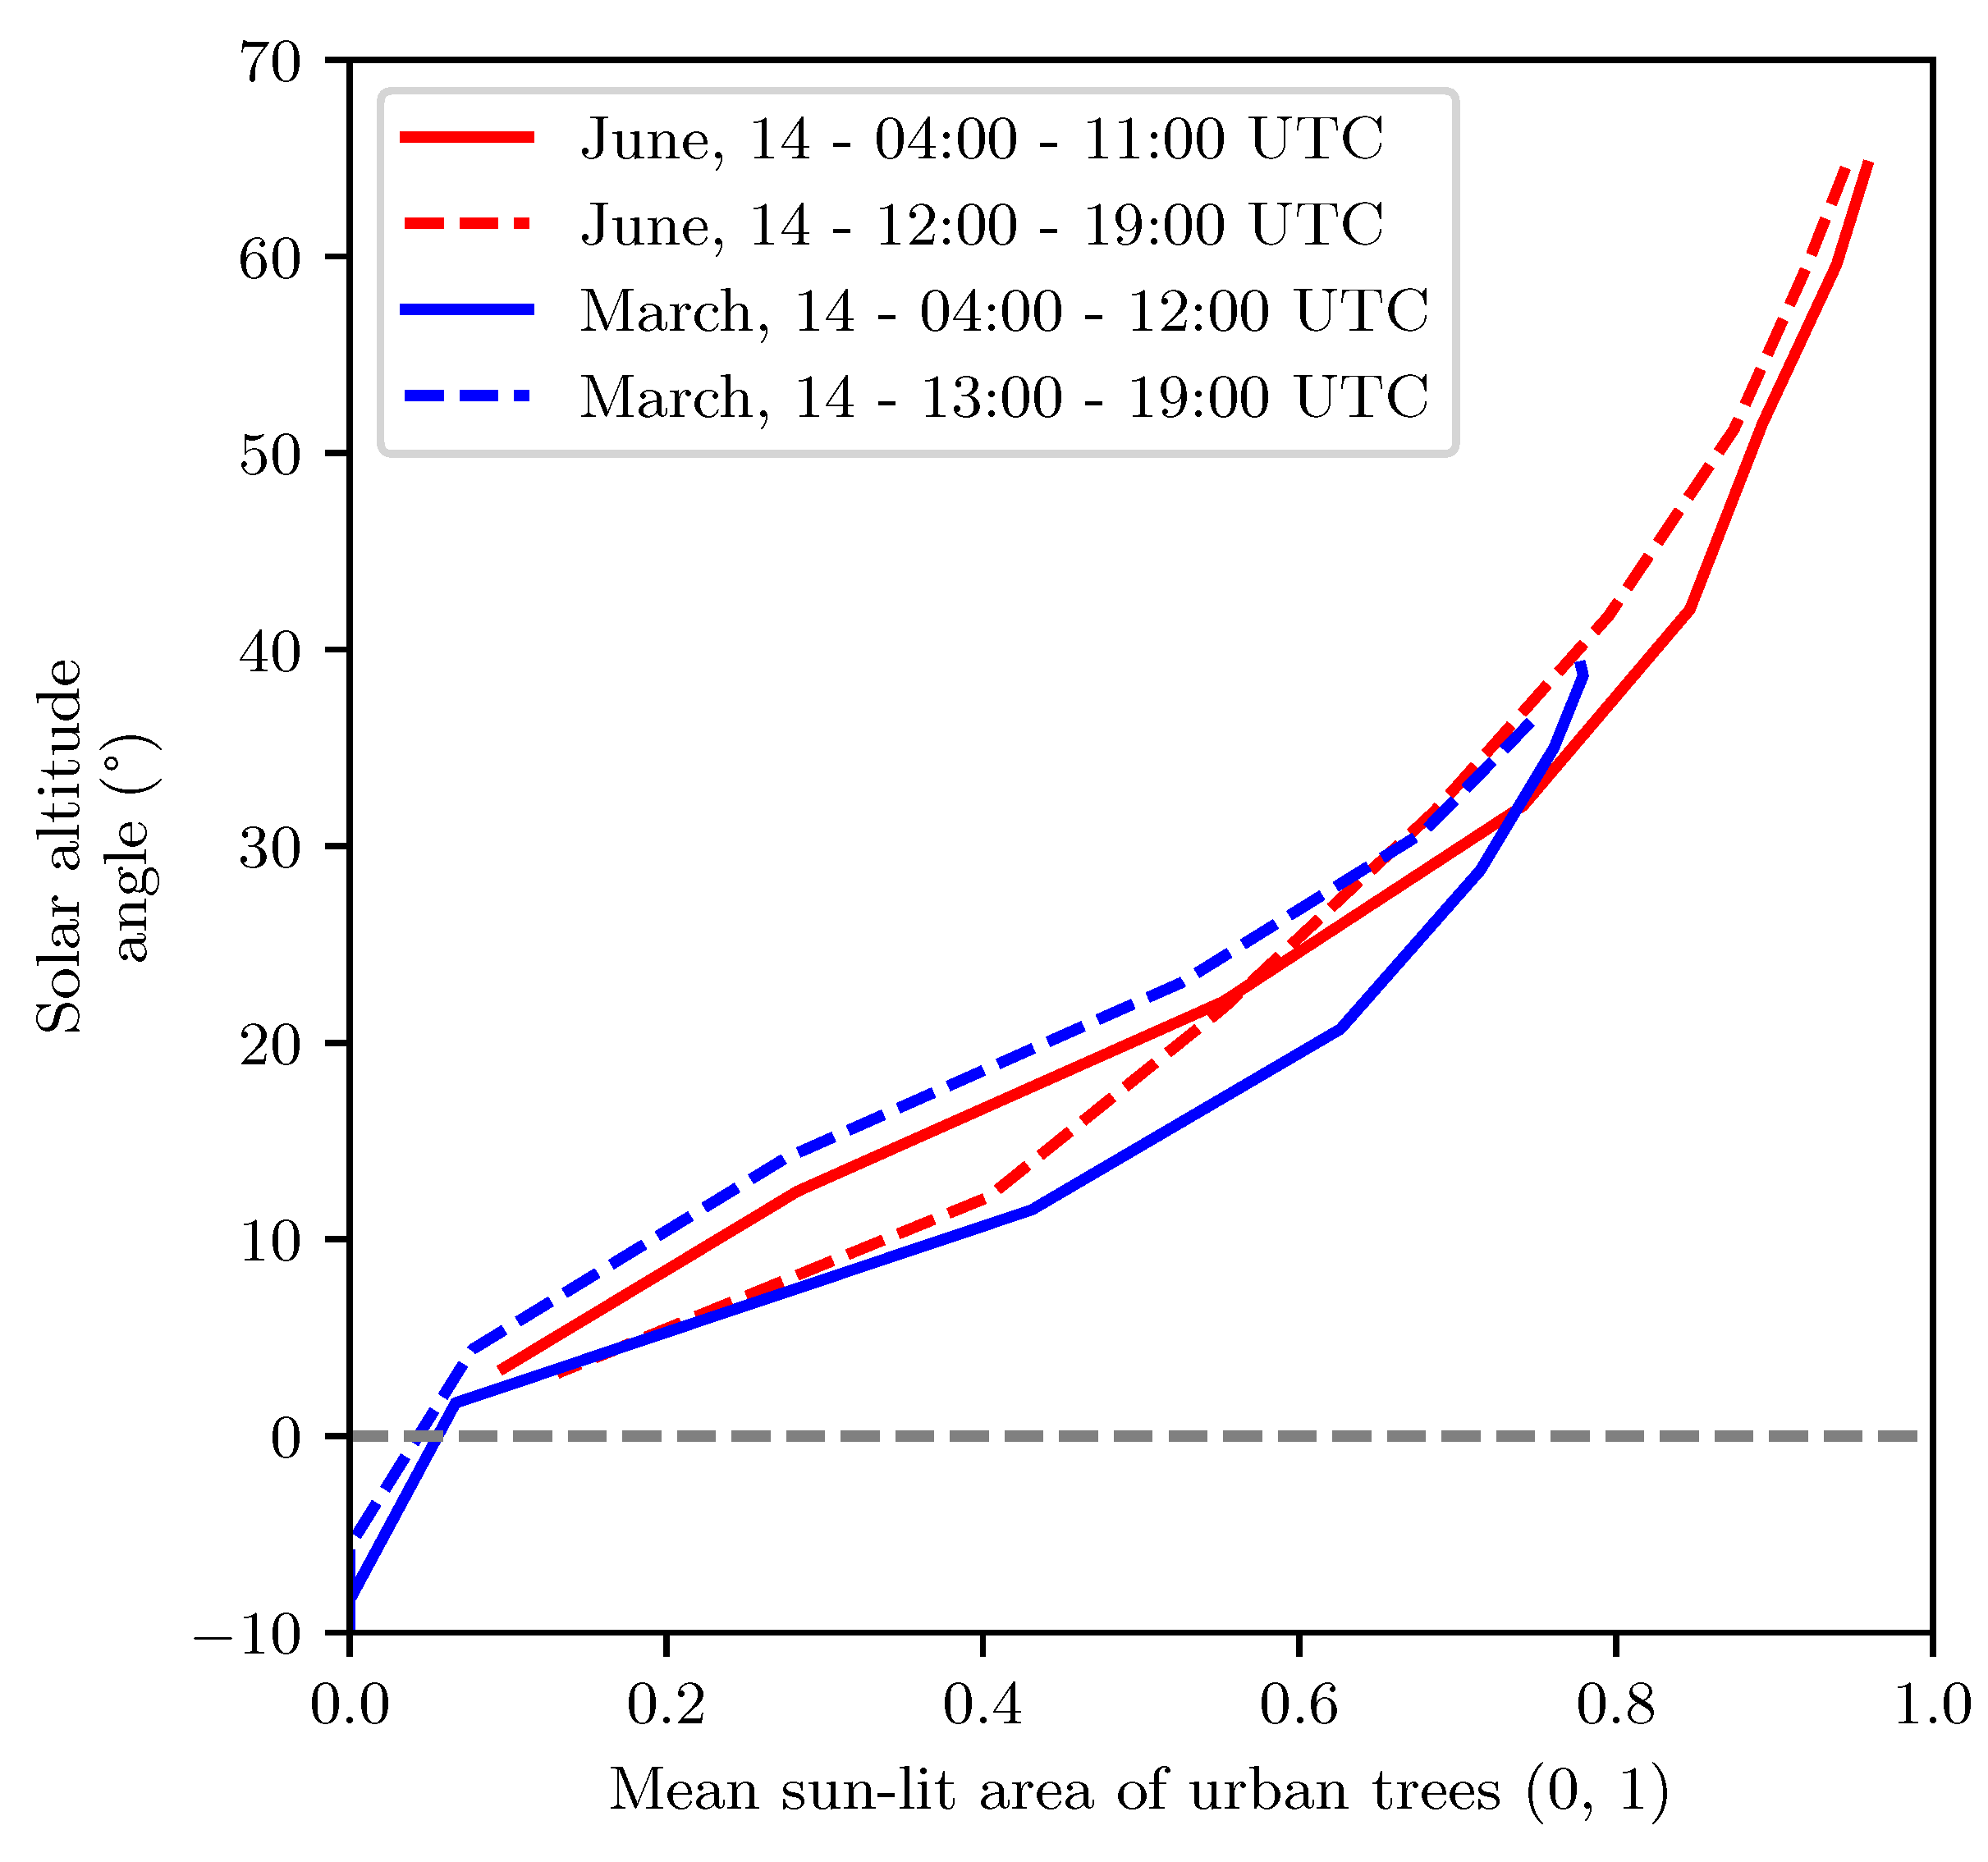
3.2. Relationship between the Mean Area View Factor and the Solar Altitude Angle

The solar altitude angle for the rising and setting phase of the sunpath was related to the averaged results of the sunlit area to assert the models results under clear sky conditions (Figure 7). The relationship shows strong correlation according to the Pearson’s correlation coefficient. There was positive correlation observed between the solar altitude angle and the sun-lit area in spring (14 March) and summer (14 June): correlation coefficient of rspring = 0.964 with significance level of pspring = 4.56 × 10⁻⁹ in spring and correlation coefficient of rsummer = 0.959, with significance level of psummer = 1.89 × 10⁻⁹ in summer.
The maximum of the ratio of sunlit to max. sunlit area in summer is of greater magnitude compared to spring. The lighting of the scene is independent of the air temperature and relative humidity, such that there is no difference in the two scenarios for lighting.
The sunpath for each date of the study area was calculated with SkyHelios and is given by Figure 8 in a fish-eye image of the upper hemisphere at the center of the study area. The SVF is obviously the same, but the sunpath between 14th of March and June are differing, due to different solar altitude and azimuth angles.

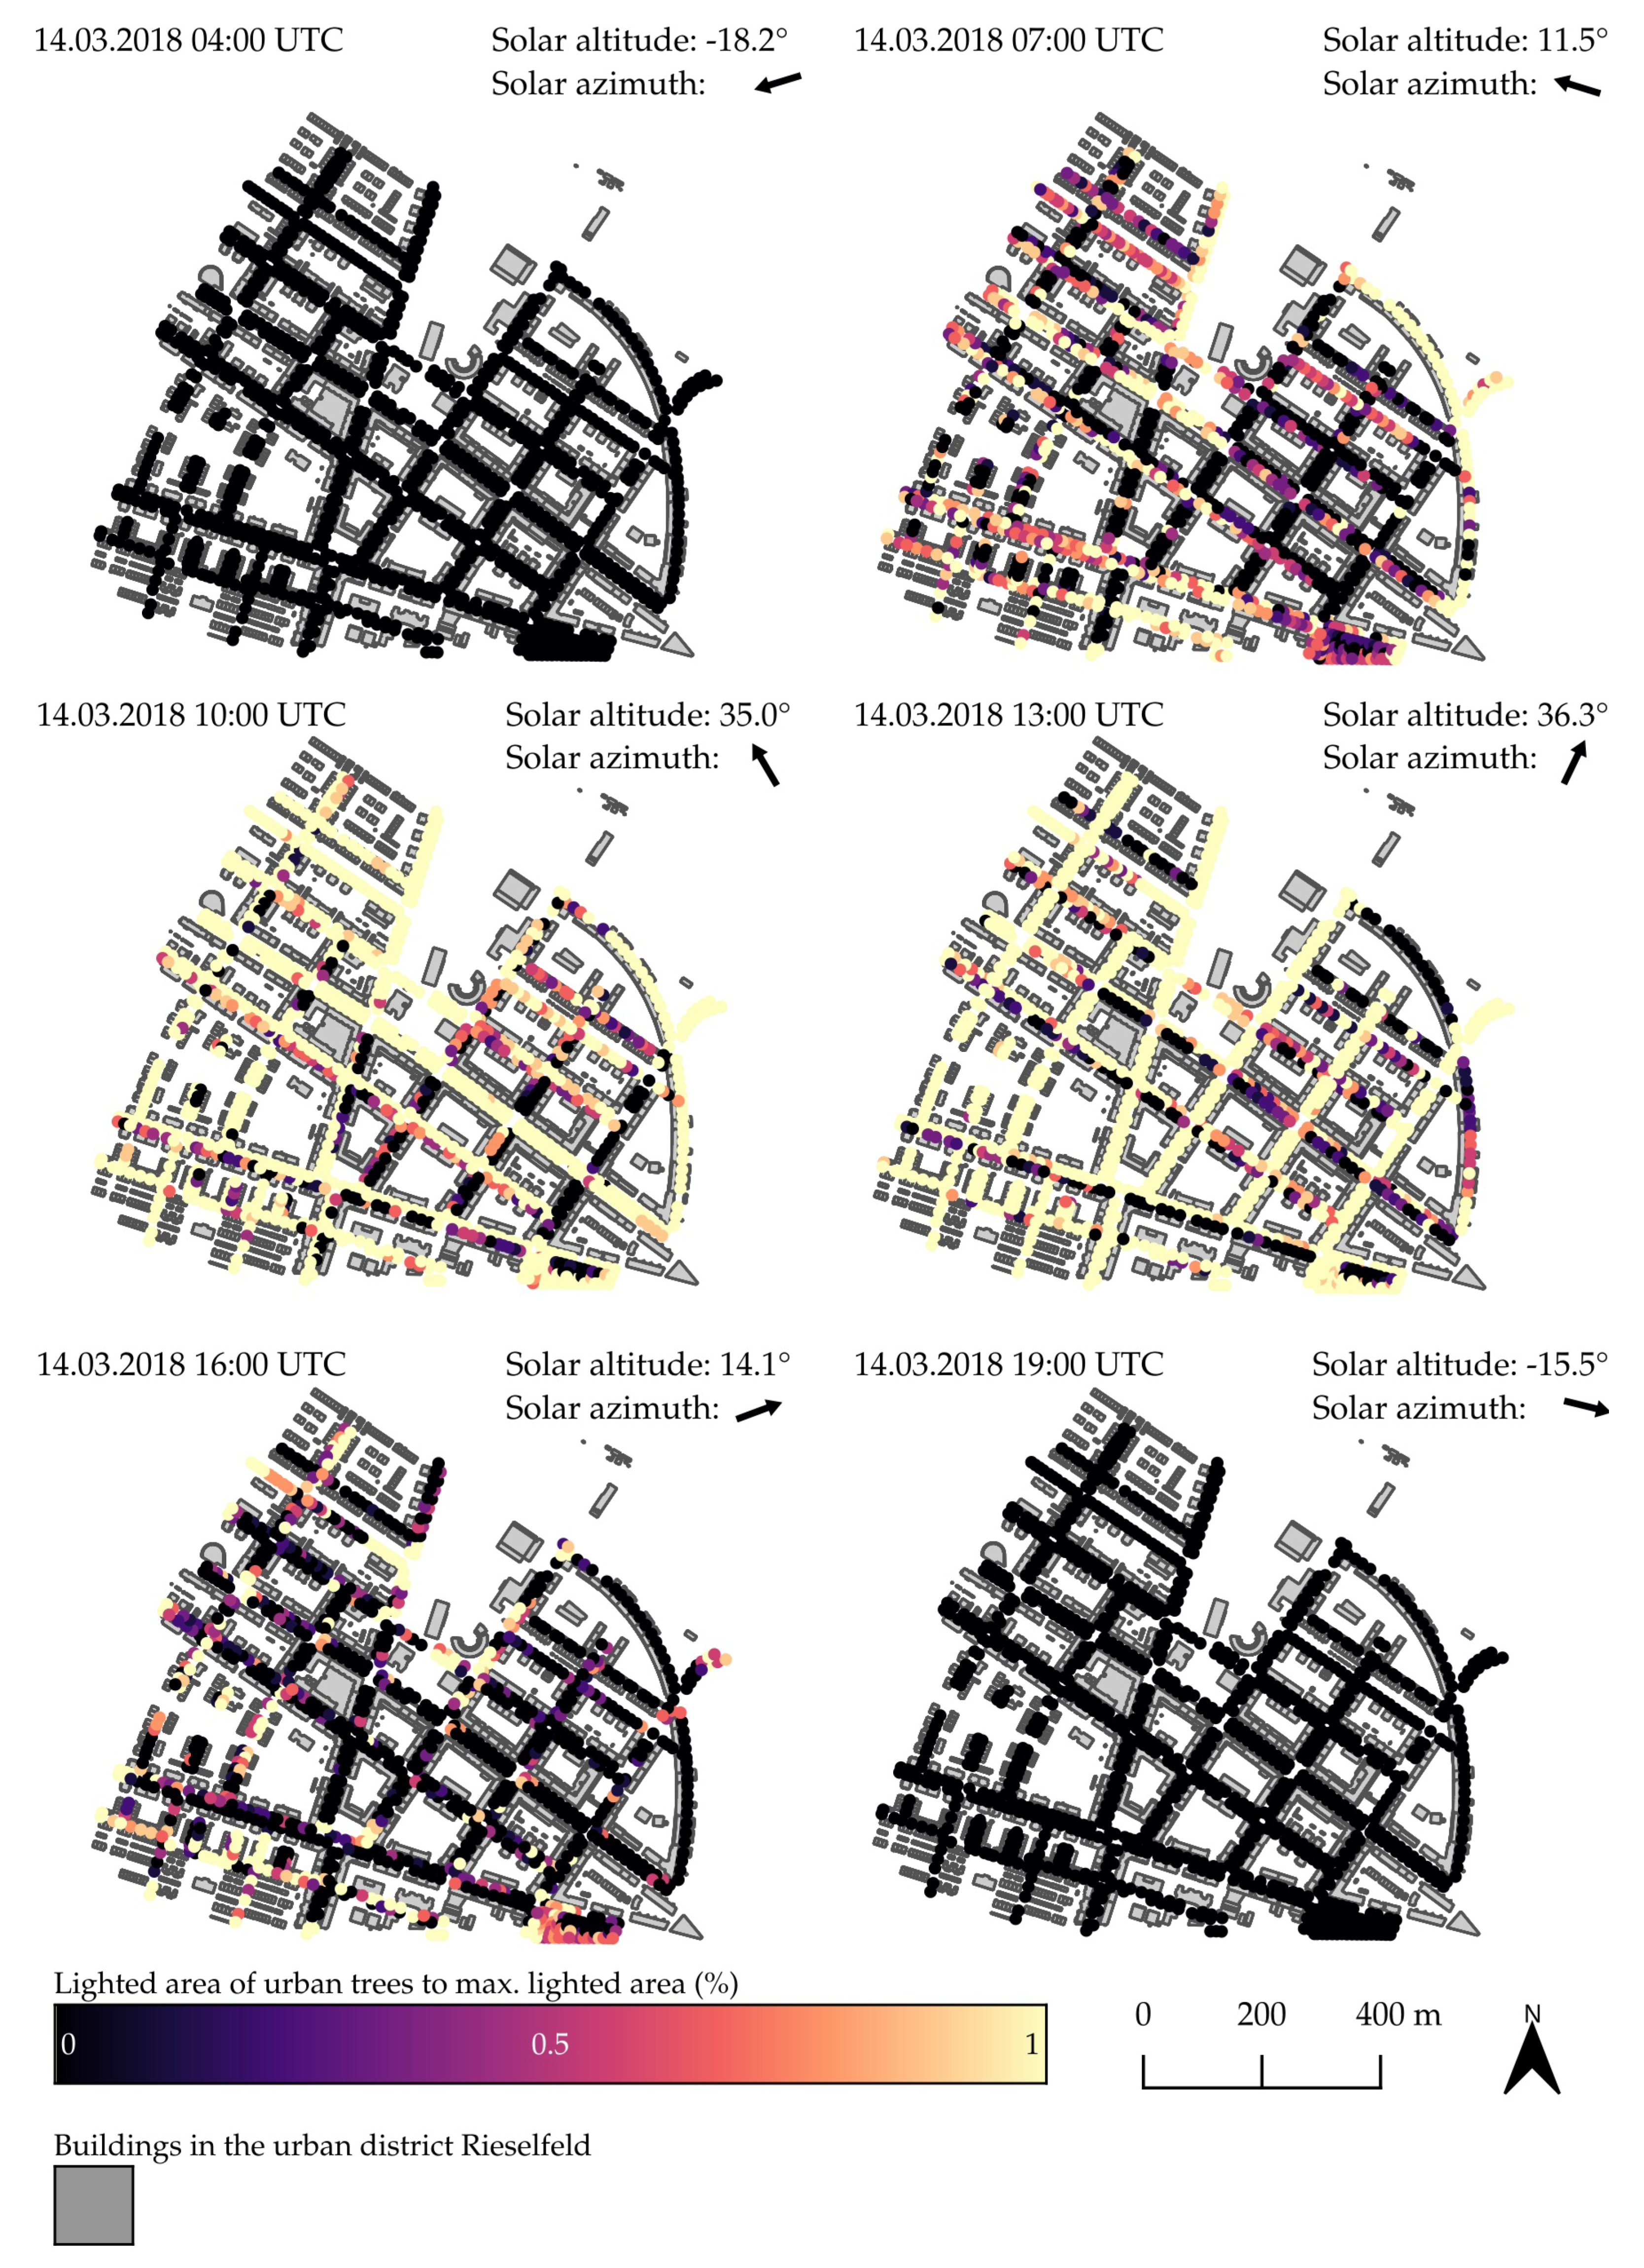
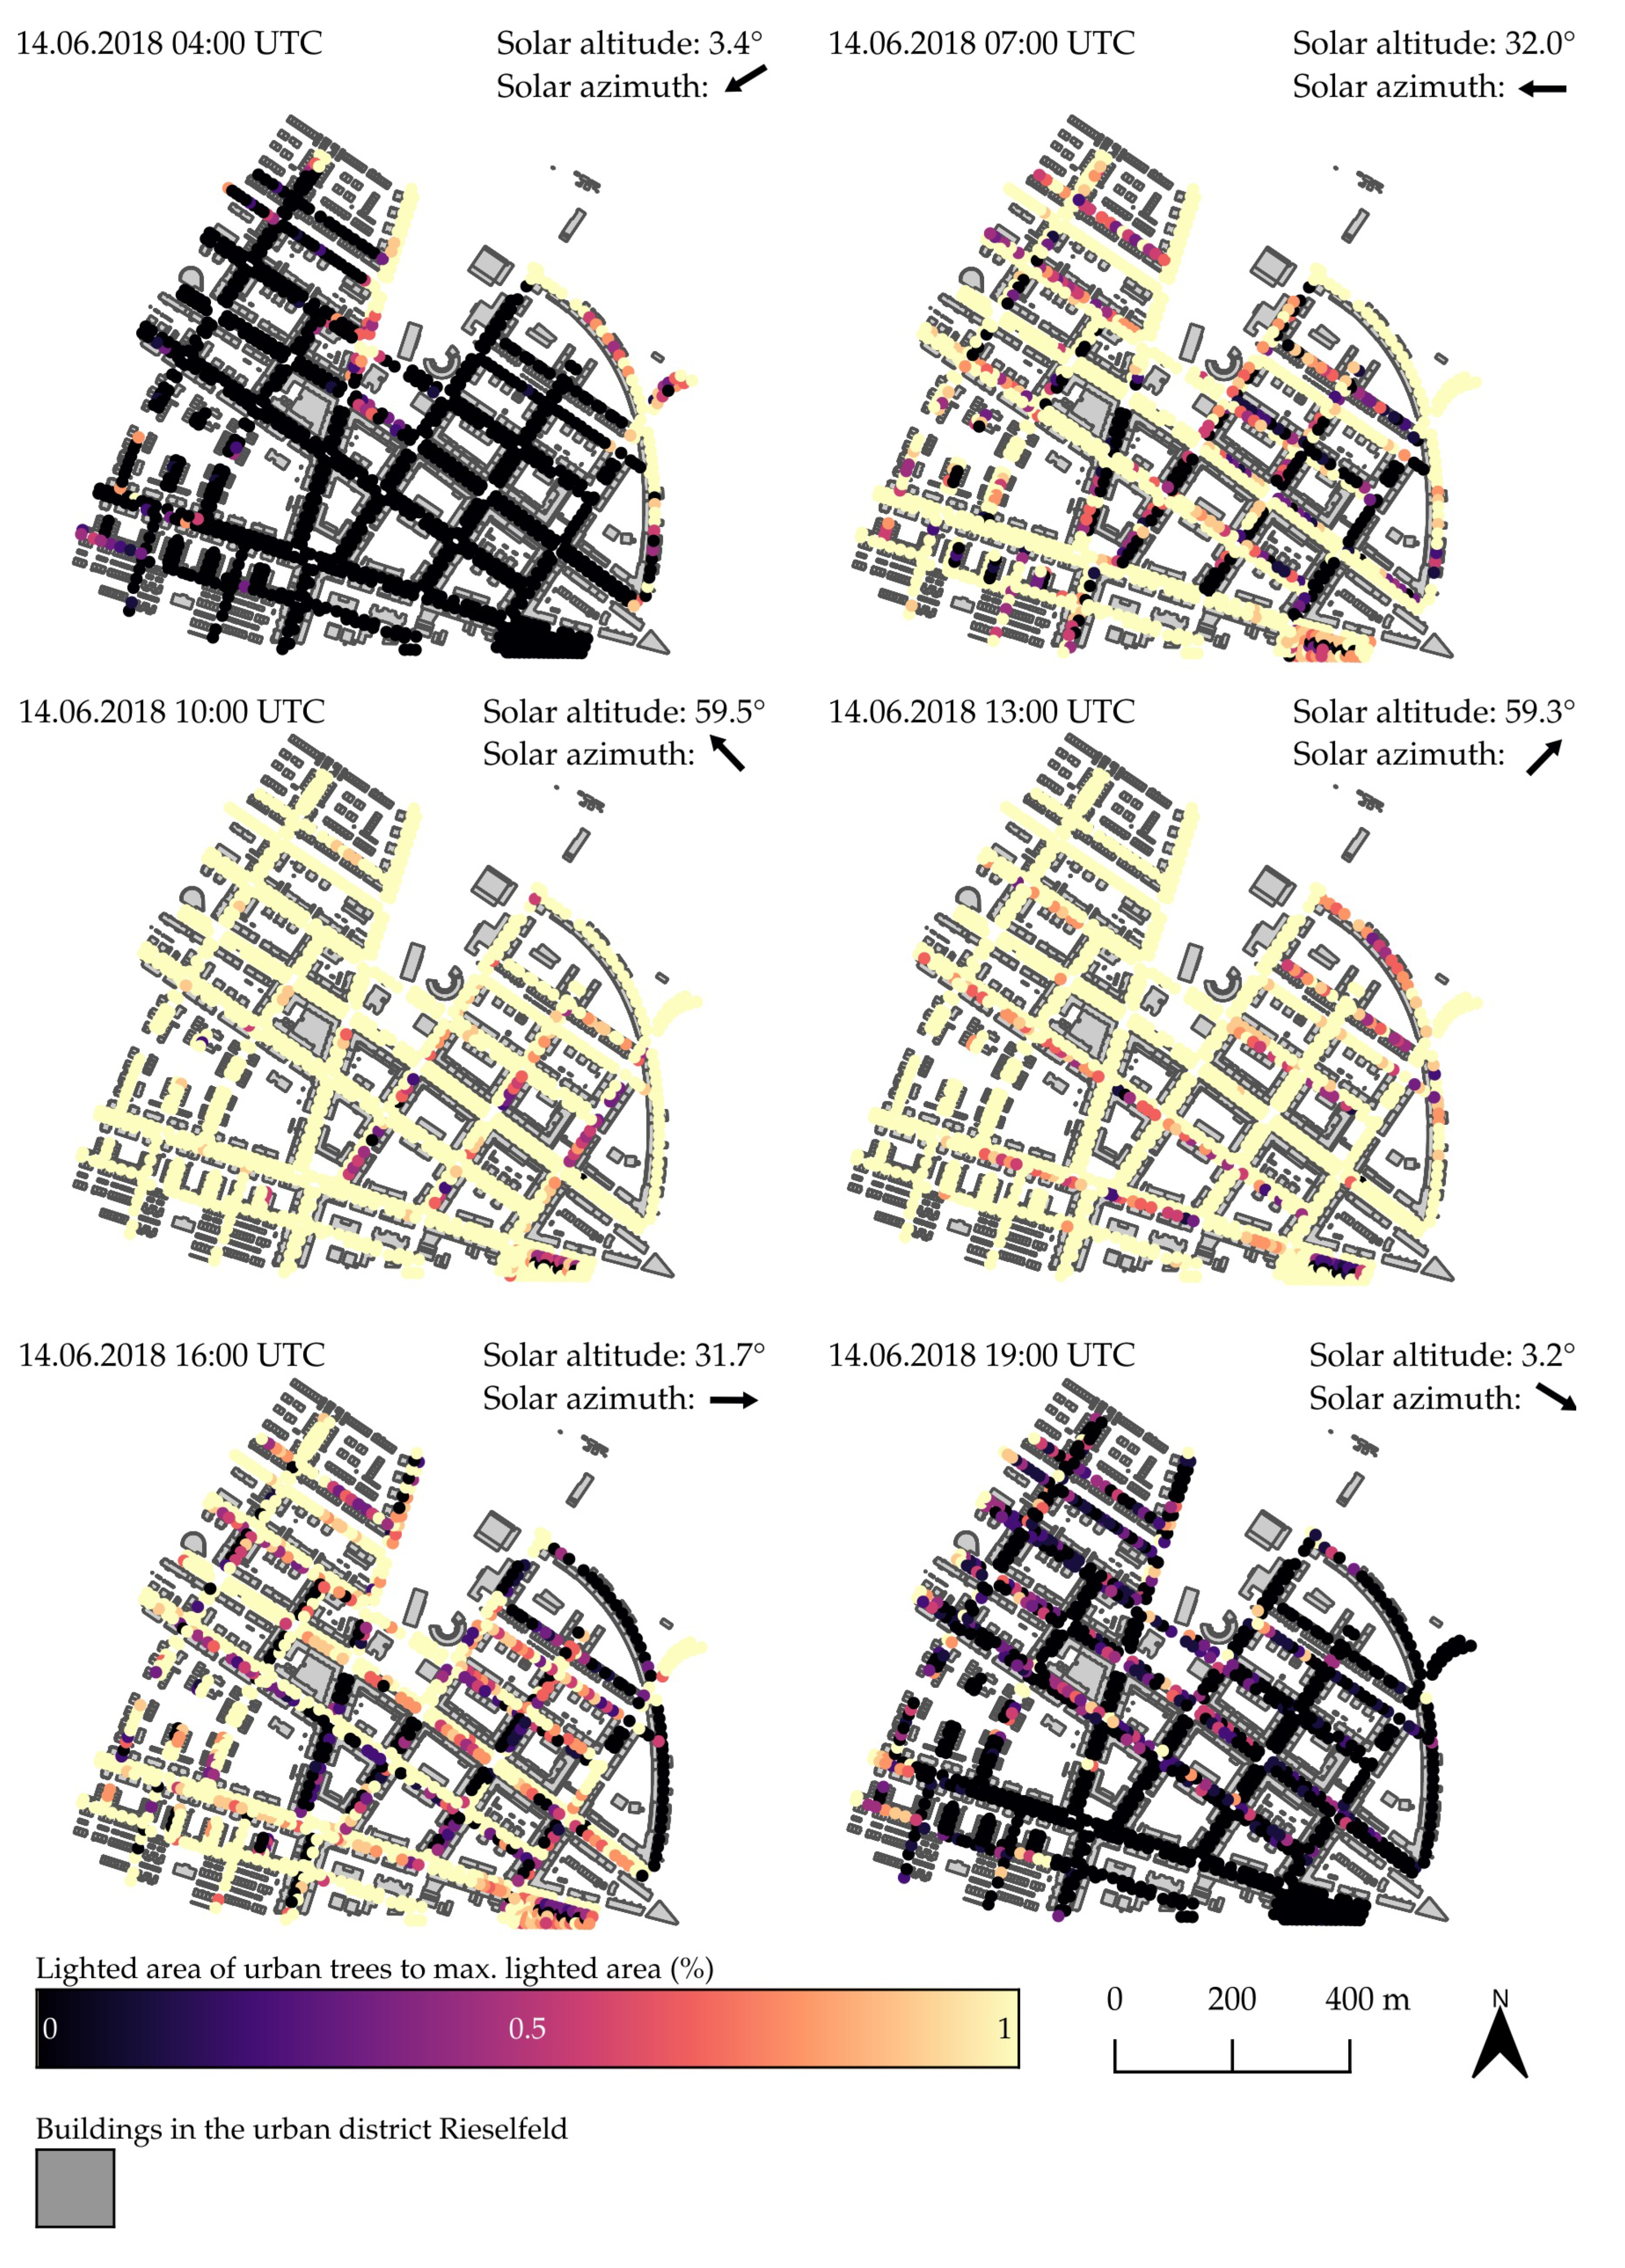
3.3. Seasonally, Daily and Spatially Analysis of Area View Factors

The spatial variation of the sunlit area in Rieselfeld is given by Figure 9 and Figure 10 for spring and summer, respectively. The figures show the ratio of sunlit area to max. sun-lit area (AVF) of urban trees for times between 04:00 and 19:00 UTC for the 14th of March and the 14th of June. Solar altitude and solar azimuth are given for each time step.
The maximum in June is of greater magnitude compared to March. The lighting of the areas occurs earlier and lasts longer in June, compared to March. It can be observed, that the lighting of the scene starts in the east of the district with the outermost trees. During the day, when the solar altitude angle reaches its maximum value, most trees of the scene are fully sunlit in summer but not with the same magnitude compared to spring. Different effects are observable in the scene:
  • Trees in open spaces are more sunlit compared to others, which are in streets with a great H/W-ratio.
  • The location of the trees within a street canyon has a great effect on lighting. Trees at the sun exposed side of the canyon are more sunlit, compared to trees on the shaded side.
  • Street canyons with high density of planted trees lead to more shaded trees.
By comparison of Figure 9 and Figure 10 it is also observable, that the variation of the sun-lit area during dawn and dusk is greater in spring compared to summer.

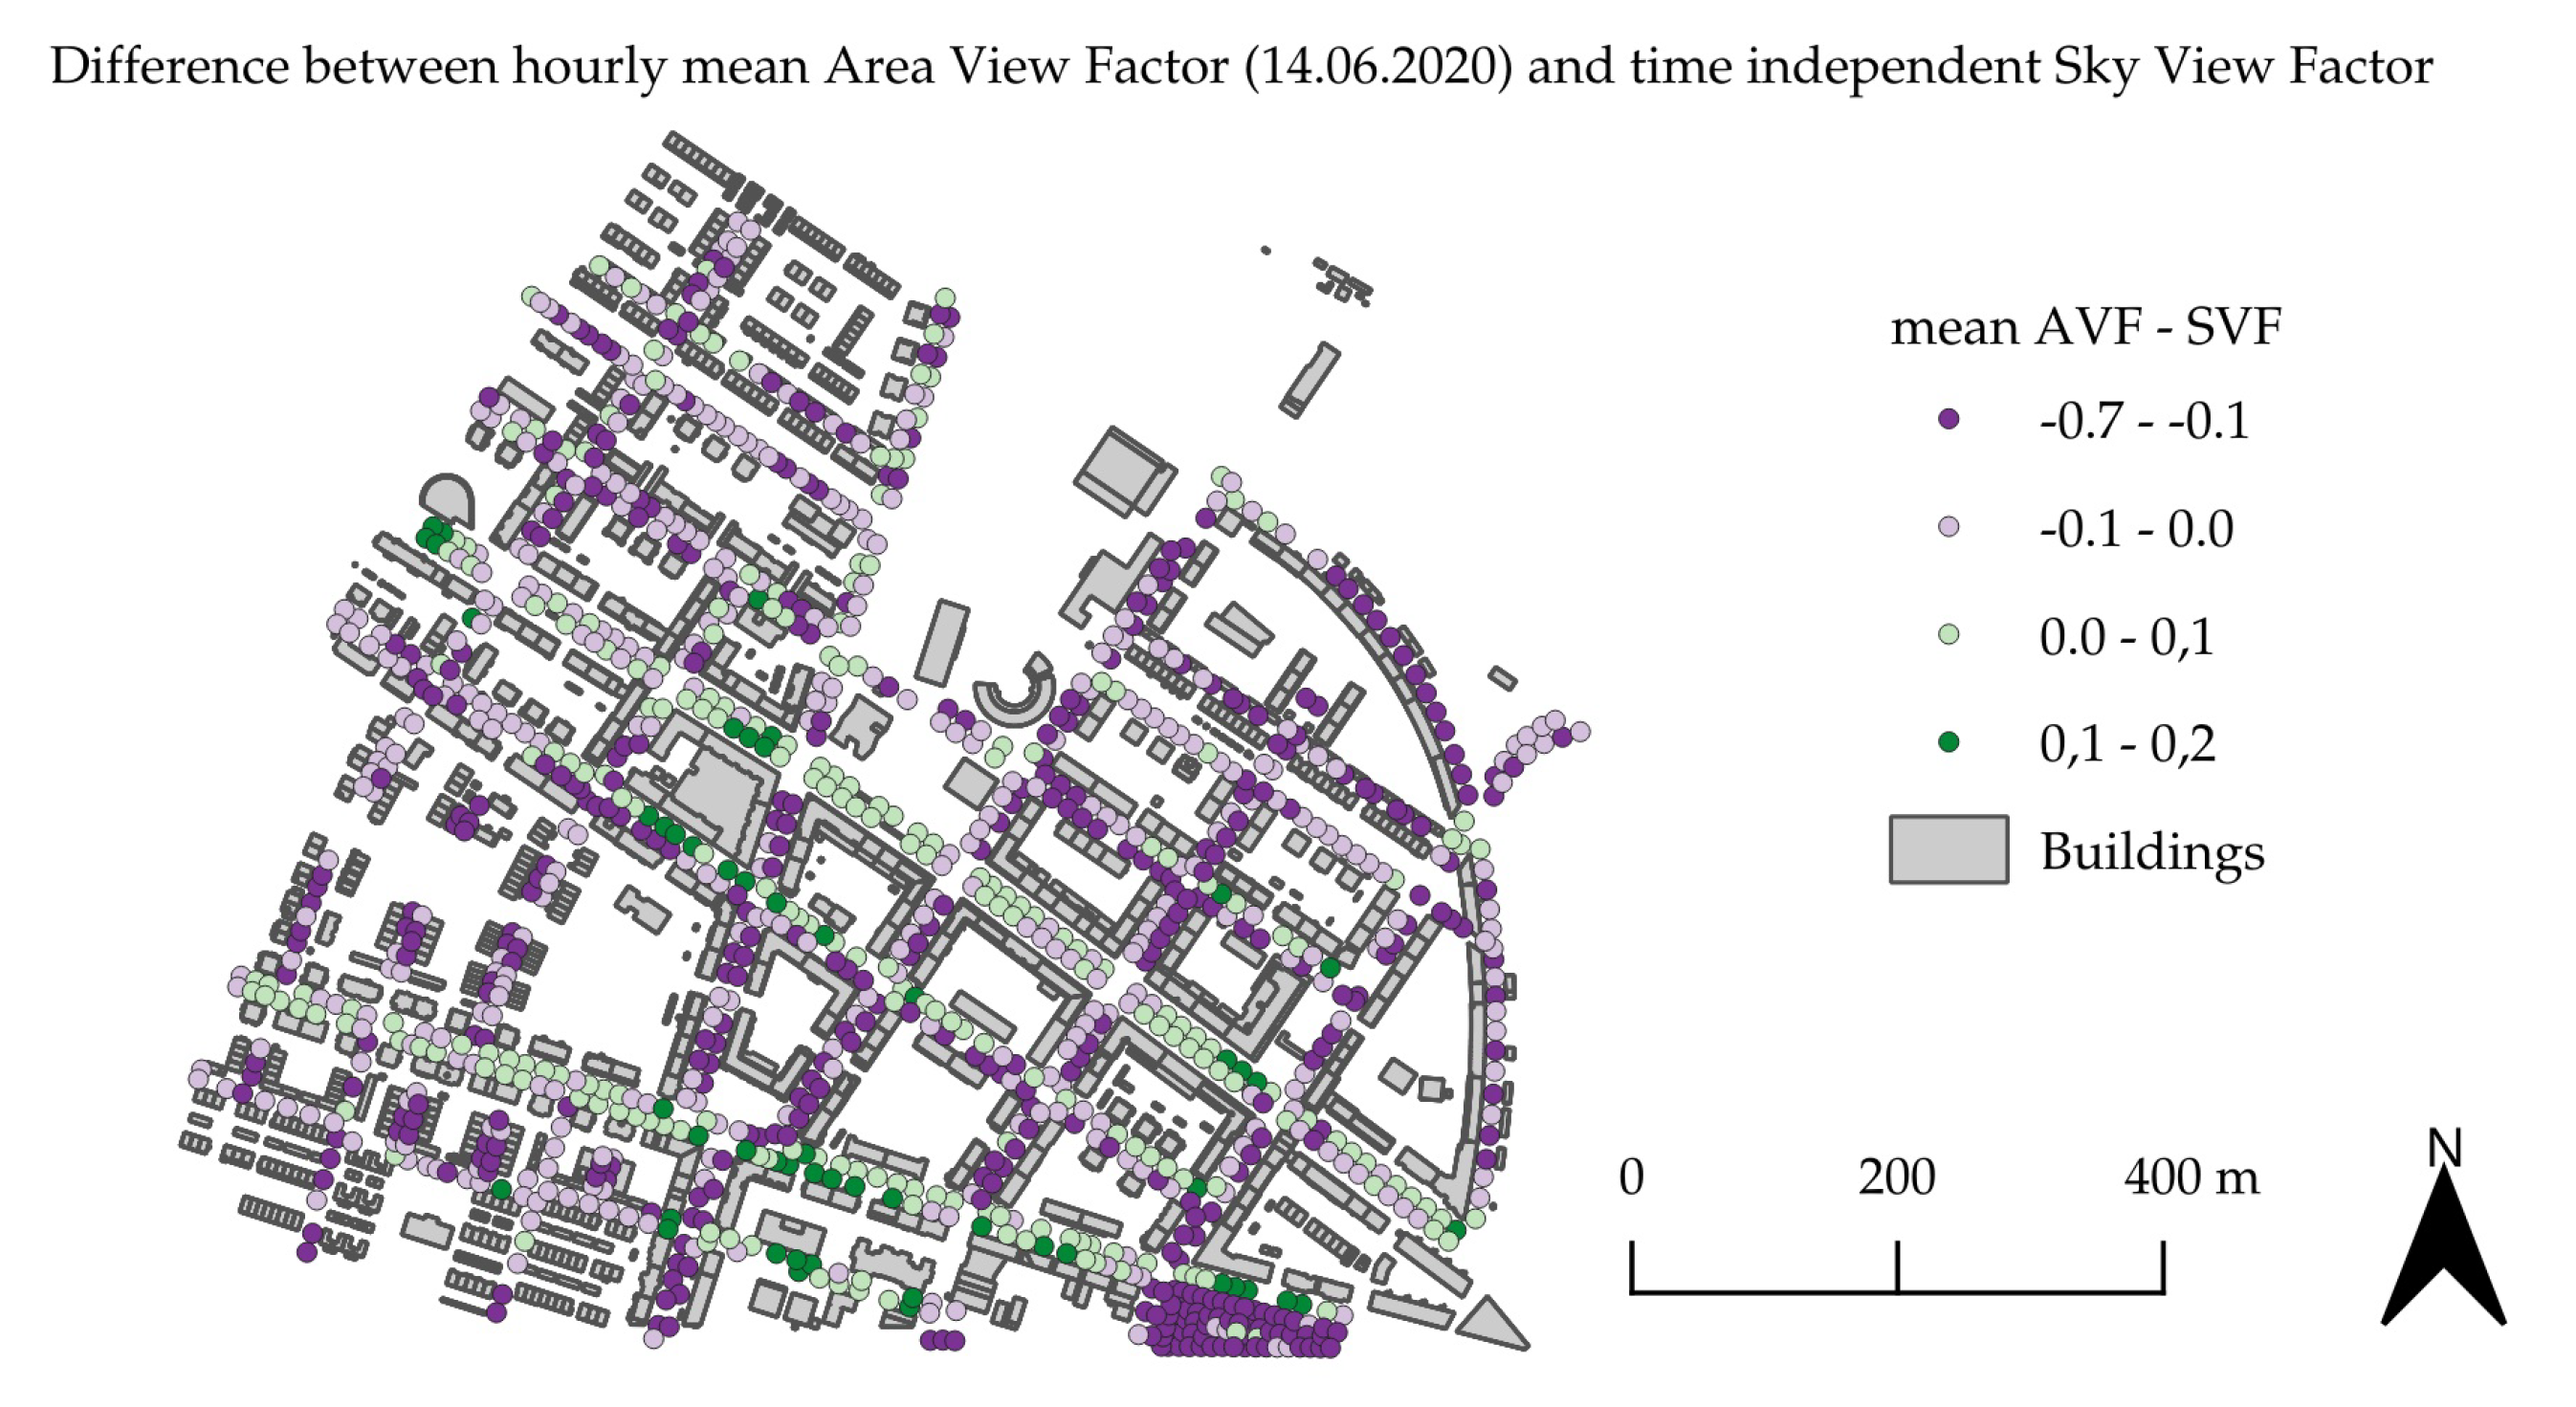
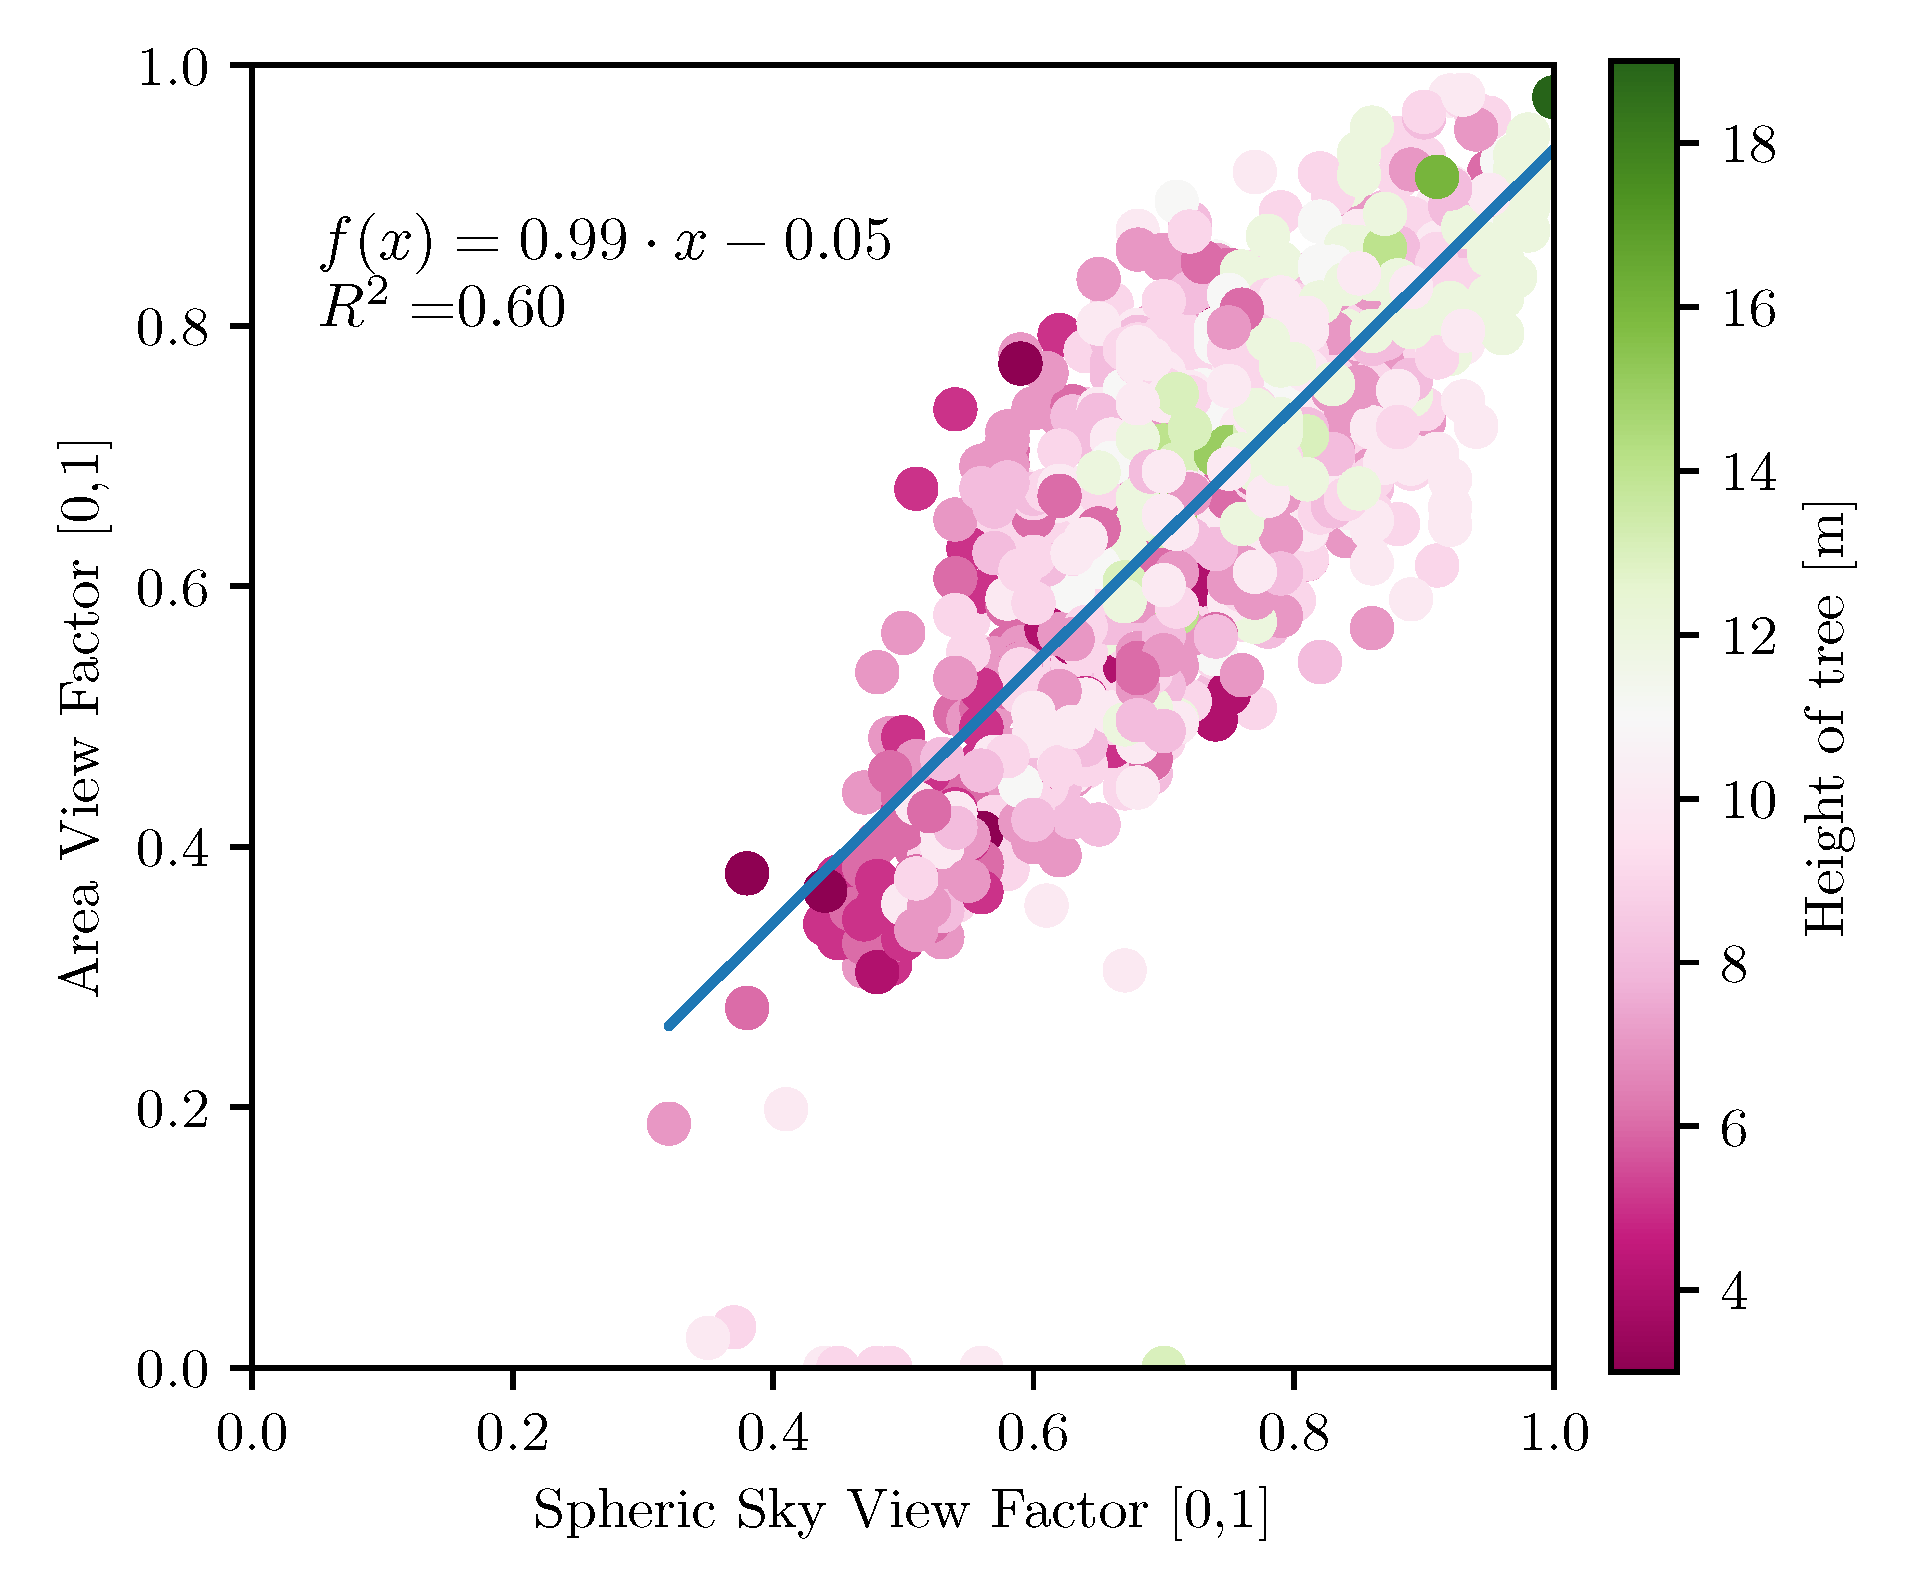
3.4. Comparison of the Mean Area View Factor to the Sky View Factor

Daily mean Area View Factor can be utilized to analyze differences within a street in terms of lighting. While the Sky View Factor in the cross section of a typical east-west (E-W) oriented street is mirror-symmetrical, AVF is lower for trees on the side facing away from the sun than on the side facing the sun (Figure 11). This is observable by trees on the south side of a street which are shown in purple ( A V F < S V F ) and trees on the north side of the same street in green ( S V F A V F ). Trees in a north–south (N–S)-oriented street generally have smaller mean AVF, as the highest irradiation into such a street occurs only in a narrow time interval, namely, exactly when the orientation of the street corresponds to the azimuth angle of the sun. In open areas with small H/W-ratio in relation to the building in the immediate vicinity, the deviation between SVF and AVF is very small. If the horizon is not obscured, then the projected area of a tree crown is completely sun-lit, so that AVF and SVF are both equal to 1.
In direct comparison, AVF and SVF are linked. It can be observed that SVF is larger at the top of the crown of tall trees than at the top of small trees; the same holds for AVF (Figure 12). The taller the trees, the smaller the influence of the urban structures in the neighborhood around the tree.

4. Discussion

The results for sunlit areas based on the calculation of AVFs are clearly dependent on the day of the year and time of the day by design (Section 3.1). The fluctuations of the standard deviation throughout the day suggest a dependency of AVF on solar elevation. The relationship of AVF to the solar altitude angle (Section 3.2) is not linear and differs between dawn (rising sun) and dusk (setting sun). This can be explained by the fact that the orthographic view is constructed and placed in accordance to the solar altitude angle and aligned with the solar azimuth angle. The spatial distribution of AVF as described in Section 3.3 show typical pattern for different street orientations, H/W-ratios, SVF factors, and areas with dense vegetation. Five different patterns can be distinguished and are further discussed for streets in a city of mid-latitude:
(1)
Urban trees are shading each other in dense arrangements. The effectiveness of urban trees to provide adequate cooling can be restricted due to self-shading by the trees [57]. Self-shading can be caused by intersecting canopies of individual trees or adverse arrangement of tall to small trees.
(2)
Urban trees on the north-side of an east-west oriented street are more sun-lit compared to trees on the south-side of the same street. This result comply with the results by [58], that microclimatic modifications of the urban atmosphere by trees are dependent on the location of the trees within streets (“side of street”) and the time of the day. This dependency can be explained by the linkage of solar exposure and urban morphology. It is in good agreement with the studies based on modeled results by [59,60], which show different thermal sensation within street canyons due to varying mean radiant temperature in E–W- and N–S-oriented street canyons. It can be assumed that this only applies to cities of mid-latitude, and not for cities on the southern hemisphere, there orientations are swapped.
(3)
Urban trees in streets with great H/W-ratio are more sun-lit compared to trees in streets with low H/W-ratio.
(4)
Urban trees in streets, which are aligned orthogonal to the azimuth angle of the sun are more shaded, compared to urban trees in streets, which are oriented in parallel to the azimuth angle. It is obvious, that an observed street is fully sunlit if it is aligned to the solar azimuth angle. But this only holds for single points in time. Therefore, street trees in an E–W-oriented street are more sun-lit during the complete course of the day than those in a N–S-oriented street.
(5)
Urban trees in open spaces absorb more radiation compared to trees in narrow street canyons. Obscuration of urban trees by the urban morphology has its greatest magnitude for low solar altitude angle (i.e., in the morning and in the evening as well as in spring and autumn) and becomes less dependent for high solar altitude angles (during midday as well as in summer) due to the dependency of solar irradiance on horizon heightening and solar altitude angle. These findings are comparable to the findings of an earlier work showing that the solar availability in the urban context is depending on solar altitude angles [61]. The comparison between solar altitude angle and mean sunlit area of urban trees shows strong correlation (Figure 7). Trees which are fully exposed to solar radiation provide stronger cooling effect based on transpiration, compared to trees in the shade of buildings [62]. This leads to the optimal cooling potential of urban trees, under the assumption of unlimited water availability. Therefore, trees in open spaces with high solar exposure should be prioritized for mitigation of heat stress [57].
This, in general, is in good agreement, that the spatial configuration of green structures has a huge impact to the availability of sunlight and to its cooling effect [63,64,65].
SVF is particularly suitable for the quantification of emitted long-wave radiation of surrounding surfaces, because the upper hemisphere encompasses all surfaces in the neighborhood towards POV. Short-wave radiation is also accessible by SVF, but heterogeneous shading of surfaces is difficult to assess by SVF since the information of SVF is limited to single points in space. On the other hand, AVF is suitable for the short-wave radiation towards a complete surface, including heterogeneous shading, because the complete surface is evaluated as an integral entity. The relationship between SVF and mean AVF was analyzed in detail (Section 3.4) and shows the dependency between SVF and AVF.
This new method combines approaches from remote sensing and computer graphics and applies them to three dimensional modeling. As the sunlit area is computed directly on the graphics card, modern graphics engines are mighty and cheap tools for correct modeling of the distribution of solar irradiance in complex urban environments. Although, modern graphics engines are mainly designed for the calculation of dynamic lighting of complex scenes with complex shading in computer graphics, they are also useful for scientific purposes. In order to perform the calculations on the graphics card, a three-dimensional city model [50] is needed to represent the three-dimensional scene using the graphics engine.
However, the proposed method also has some limitations due to negligence of diffuse soft shading, reflections of radiation by building facades and inbound diffuse shortwave radiation. These shortcomings could be improved by a more sophisticated sky model based on an anisotropic sky vault instead of the proposed solar irradiance with sun rays in parallel. Furthermore, ray tracing could be utilized to account for multiple reflections [5] with the disadvantage of costly calculations. However, just the last generations of graphics cards also allows for the real-time calculation of ray tracing in complex three-dimensional sceneries based on hardware acceleration [66]. As with any numerical spatial analysis, the boundary areas of the study area also pose a challenge here; this is because the spatial influence of structures outside the study area cannot be accounted for in an numeric analysis using either Sky View Factor or Area View Factor [67,68].
The spatial temporal distribution of solar radiation intensity is important for urban planers and landscape architects in order to select optimal species (in terms of resilience to drought stress, photosynthetic productivity, and cooling potential) to improve human thermal comfort in urban areas [1]. Most approaches mapping solar irradiance in the complex urban environment are motivated from an energetic and building perspective: photovoltaic power plants, passive heating of buildings and the availability of sunlight [5,21,69,70]. Little attention is payed to the aspects of the urban green infrastructure. This new method might be also useful for assessment of the photovoltaic potential on roofs and building facades in the urban area which is affected by the surrounding urban morphology.
Due to their schematic structure (e.g., 2D/3D Tile Approach), classical UCMs are suitable for scientific questions related to individual, typified street canyons, but not for questions related to specific urban neighborhoods [30,33,34]. In contrast to these classical UCMs, the newly developed method can be used to calculate the short-wave irradiance in a “real” urban morphology based on spatial geodata provided by local authorities. Thus, SkyHelios is not only suitable for scientific questions, but also for urban planning and design. To apply UCMs in urban planning, it is necessary to focus on the requirements of the users in the local authorities [71]. This means that the models should use standardized data (e.g., CityGML [56]) that have already been collected frequently in the municipalities in accordance to the FAIR principles [72] and choose the appropriate model which meets the requirements of the specific question and the available resources. In general, the advantages of different model types should be combined to get the benefits from all types that are necessary to assess the thermal impacts of urban structures.

5. Conclusions

The estimation of the fraction receiving direct radiation of urban trees, as calculated with the methodology proposed in this framework, seems like a reasonable approach in order to split total leaf area into shaded and sun-lit leaf area. The spatial, geometrical assessment of sun-lit and shaded areas of urban entities based on aligned orthographic views with respect to the position of the sun, is an additional method for modeling the urban radiation regime. AVF is the complement to the local Sky View Factor, as the POV for AVF is aligned according to the position of the sun. In contrast to SVF, AVF is suitable to assess the variability of heterogeneous sunlit surfaces under seasonal and daily conditions. In contrast, SVF is independent of time and its information is limited to single points in space.
Our proposed method is the first stage in our model pipeline to assess the transpirational cooling potential of trees in the urban environment. Based on this first stage, further work has to be done by determining species specific photosynthetic productivity and transpiration rates, quantifying the transpirative cooling effect and finally estimating the linkage of the urban trees to the urban atmosphere.

Author Contributions

Conceptualization, M.G. and A.M.; methodology, M.G. and A.M.; software, M.G. and D.F.; validation, M.G.; formal analysis, M.G.; investigation, M.G.; resources, M.G.; data curation, M.G.; writing—original draft preparation, M.G.; writing—review and editing, M.G., D.F., A.C., and A.M.; visualization, M.G.; supervision, A.M. and A.C.; project administration, A.M.; funding acquisition, A.M. All authors have read and agreed to the published version of the manuscript.

Funding

This research received no external funding.

Institutional Review Board Statement

Not applicable.

Informed Consent Statement

Not applicable.

Data Availability Statement

Not applicable.

Acknowledgments

The authors want to thank the surveyor’s office of the city of Freiburg.

Conflicts of Interest

The authors declare no conflict of interest.

Abbreviations

The following abbreviations are used in this manuscript:
3DThree-dimensional
AOIArea of Interest
AVFArea View Factor
DOYDay of Year
E-WEast-West
FOVField of View
GPUGraphics Processing Unit
LODLevel of Detail
N-SNorth-South
MOGREManaged Object-Oriented Graphics Rendering Engine
OGCOpen Geospatial Consortium
PARPhotosynthetically Active Radiation
PETPhysiologically Equivalent Temperature
POIPoint of Interest
POVPoint of View
PTPerceived Temperature
SVFSky View Factor
UTCIUniversal Thermal Climate Index

References

  1. Yu, B.; Liu, H.; Wu, J.; Lin, W.M. Investigating Impacts of Urban Morphology on Spatio-Temporal Variations of Solar Radiation with Airborne LIDAR Data and a Solar Flux Model: A Case Study of Downtown Houston. Int. J. Remote Sens. 2009, 30, 4359–4385. [Google Scholar] [CrossRef]
  2. Moser, A.; Roetzer, T.; Pauleit, S.; Pretzsch, H. City trees: Growth, functions and services—Risks and research prospects. Allg. Forst Und Jagdztg. 2017, 188, 94–111. [Google Scholar] [CrossRef]
  3. Gebert, L.L.; Coutts, A.M.; Tapper, N.J. The Influence of Urban Canyon Microclimate and Contrasting Photoperiod on the Physiological Response of Street Trees and the Potential Benefits of Water Sensitive Urban Design. Urban For. Urban Green. 2018. [Google Scholar] [CrossRef]
  4. Ferrini, F.; van den Bosch, C.; Fini, A. (Eds.) Routledge Handbook of Urban Forestry; Routledge/Taylor & Francis: London, UK; New York, NY, USA, 2017. [Google Scholar]
  5. Compagnon, R. Solar and Daylight Availability in the Urban Fabric. Energy Build. 2004, 36, 321–328. [Google Scholar] [CrossRef]
  6. Kjelgren, R.K.; Clark, J.R. Microclimates and Tree Growth in Three Urban Spaces. J. Environ. Hortic. 1992, 10, 139–145. [Google Scholar] [CrossRef]
  7. Dobbs, C.; Escobedo, F.J.; Zipperer, W.C. A Framework for Developing Urban Forest Ecosystem Services and Goods Indicators. Landsc. Urban Plan. 2011, 99, 196–206. [Google Scholar] [CrossRef]
  8. Monteith, J.L.; Unsworth, M.H. Principles of Environmental Physics: Plants, Animals, and the Atmosphere, 4th ed.; Elsevier/Acad. Press: Amsterdam, The Netherlands, 2013. [Google Scholar]
  9. Jones, H.G. Plants and Microclimate: A Quantitative Approach to Environmental Plant Physiology, 3rd ed.; Cambridge University Press: Cambridge, UK, 2013. [Google Scholar] [CrossRef] [Green Version]
  10. Ziter, C.D.; Pedersen, E.J.; Kucharik, C.J.; Turner, M.G. Scale-Dependent Interactions between Tree Canopy Cover and Impervious Surfaces Reduce Daytime Urban Heat during Summer. Proc. Natl. Acad. Sci. USA 2019, 116, 7575–7580. [Google Scholar] [CrossRef] [Green Version]
  11. Rahman, M.A.; Moser, A.; Rötzer, T.; Pauleit, S. Comparing the Transpirational and Shading Effects of Two Contrasting Urban Tree Species. Urban Ecosyst. 2019. [Google Scholar] [CrossRef]
  12. Konarska, J.; Uddling, J.; Holmer, B.; Lutz, M.; Lindberg, F.; Pleijel, H.; Thorsson, S. Transpiration of Urban Trees and Its Cooling Effect in a High Latitude City. Int. J. Biometeorol. 2016, 60, 159–172. [Google Scholar] [CrossRef]
  13. Armson, D.; Rahman, M.A.; Ennos, A.R. A Comparison of the Shading Effectiveness of Five Different Street Tree Species in Manchester, UK. Arboric. Urban For. 2013, 39, 157–164. [Google Scholar]
  14. Gómez-Muñoz, V.; Porta-Gándara, M.; Fernández, J. Effect of Tree Shades in Urban Planning in Hot-Arid Climatic Regions. Landsc. Urban Plan. 2010, 94, 149–157. [Google Scholar] [CrossRef]
  15. Bowler, D.E.; Buyung-Ali, L.; Knight, T.M.; Pullin, A.S. Urban Greening to Cool Towns and Cities: A Systematic Review of the Empirical Evidence. Landsc. Urban Plan. 2010, 97, 147–155. [Google Scholar] [CrossRef]
  16. Matzarakis, A.; Amelung, B. Physiological Equivalent Temperature as Indicator for Impacts of Climate Change on Thermal Comfort of Humans. In Seasonal Forecasts, Climatic Change and Human Health; Thomson, M.C., Garcia-Herrera, R., Beniston, M., Eds.; Springer: Dordrecht, The Netherlands, 2008; pp. 161–172. [Google Scholar] [CrossRef]
  17. Hami, A.; Abdi, B.; Zarehaghi, D.; Maulan, S.B. Assessing the Thermal Comfort Effects of Green Spaces: A Systematic Review of Methods, Parameters, and Plants’ Attributes. Sustain. Cities Soc. 2019, 49, 101634. [Google Scholar] [CrossRef]
  18. Akbari, H.; Pomerantz, M.; Taha, H. Cool Surfaces and Shade Trees to Reduce Energy Use and Improve Air Quality in Urban Areas. Sol. Energy 2001, 70, 295–310. [Google Scholar] [CrossRef]
  19. Akbari, H. Shade Trees Reduce Building Energy Use and CO2 Emissions from Power Plants. Environ. Pollut. (Barking Essex 1987) 2002, 116 (Suppl. 1), S119–S126. [Google Scholar] [CrossRef]
  20. Jamei, E.; Rajagopalan, P.; Seyedmahmoudian, M.; Jamei, Y. Review on the Impact of Urban Geometry and Pedestrian Level Greening on Outdoor Thermal Comfort. Renew. Sustain. Energy Rev. 2016, 54, 1002–1017. [Google Scholar] [CrossRef]
  21. Chatzipoulka, C.; Compagnon, R.; Nikolopoulou, M. Urban Geometry and Solar Availability on Façades and Ground of Real Urban Forms: Using London as a Case Study. Sol. Energy 2016, 138, 53–66. [Google Scholar] [CrossRef] [Green Version]
  22. Hämmerle, M.; Gál, T.; Unger, J.; Matzarakis, A. Different Aspects in the Quantification of the Sky View Factor in Complex Environments. Acta Climatol. Chorol. 2014, 47, 53–62. [Google Scholar]
  23. Hämmerle, M.; Gál, T.; Unger, J.; Matzarakis, A. Comparison of Models Calculating the Sky View Factor Used for Urban Climate Investigations. Theor. Appl. Climatol. 2011, 105, 521–527. [Google Scholar] [CrossRef]
  24. Matuschek, O.; Matzarakis, A. Estimation of Sky View Factor in Complex Environment as a Tool for Applied Climatological Studies. Berichte Des Meteorol. Inst. Der Albert-Ludwigs-Univ. Freibg. 2010, 20, 534–539. [Google Scholar]
  25. Matzarakis, A.; Matuschek, O. Sky View Factor as a Parameter in Applied Climatology Rapid Estimation by the SkyHelios Model. Meteorol. Z. 2011, 39–45. [Google Scholar] [CrossRef]
  26. Middel, A.; Lukasczyk, J.; Maciejewski, R. Sky View Factors from Synthetic Fisheye Photos for Thermal Comfort Routing—A Case Study in Phoenix, Arizona. Urban Plan. 2017, 2, 19. [Google Scholar] [CrossRef]
  27. Middel, A.; Lukasczyk, J.; Maciejewski, R.; Demuzere, M.; Roth, M. Sky View Factor Footprints for Urban Climate Modeling. Urban Clim. 2018, 25, 120–134. [Google Scholar] [CrossRef]
  28. Kastendeuch, P.P. A Method to Estimate Sky View Factors from Digital Elevation Models. Int. J. Climatol. 2013, 33, 1574–1578. [Google Scholar] [CrossRef]
  29. Bernard, J.; Bocher, E.; Petit, G.; Palominos, S. Sky View Factor Calculation in Urban Context: Computational Performance and Accuracy Analysis of Two Open and Free GIS Tools. Climate 2018, 6, 60. [Google Scholar] [CrossRef] [Green Version]
  30. Krayenhoff, E.S.; Christen, A.; Martilli, A.; Oke, T.R. A Multi-Layer Radiation Model for Urban Neighbourhoods with Trees. Bound. Layer Meteorol. 2014, 151, 139–178. [Google Scholar] [CrossRef]
  31. Oke, T.R.; Mills, G.; Christen, A.; Voogt, J.A. Urban Climates; Cambridge University Press: Cambridge, UK, 2017. [Google Scholar] [CrossRef] [Green Version]
  32. Masson, V. A Physically-Based Scheme for THE Urban Energy Budget In Atmospheric Models. Bound. Layer Meteorol. 2000, 94, 357–397. [Google Scholar] [CrossRef]
  33. Wang, C.; Wang, Z.H.; Ryu, Y.H. A Single-Layer Urban Canopy Model with Transmissive Radiation Exchange between Trees and Street Canyons. Build. Environ. 2021, 191, 107593. [Google Scholar] [CrossRef]
  34. Krayenhoff, E.S.; Jiang, T.; Christen, A.; Martilli, A.; Oke, T.R.; Bailey, B.N.; Nazarian, N.; Voogt, J.A.; Giometto, M.G.; Stastny, A.; et al. A Multi-Layer Urban Canopy Meteorological Model with Trees (BEP-Tree): Street Tree Impacts on Pedestrian-Level Climate. Urban Clim. 2020, 32, 100590. [Google Scholar] [CrossRef]
  35. Bruse, M.; Fleer, H. Simulating Surface–Plant–Air Interactions inside Urban Environments with a Three Dimensional Numerical Model. Environ. Model. Softw. 1998, 13, 373–384. [Google Scholar] [CrossRef]
  36. Bruse, M. Trees & Vegetation in ENVI-met. 2018. Available online: https://www.envi-met.com/trees-and-vegetation/ (accessed on 1 July 2021).
  37. Raasch, S.; Schröter, M. PALM—A Large-Eddy Simulation Model Performing on Massively Parallel Computers. Meteorol. Z. 2001, 10, 363–372. [Google Scholar] [CrossRef]
  38. Resler, J.; Krč, P.; Belda, M.; Juruš, P.; Benešová, N.; Lopata, J.; Vlček, O.; Damašková, D.; Eben, K.; Derbek, P.; et al. PALM-USM v1.0: A New Urban Surface Model Integrated into the PALM Large-Eddy Simulation Model. Geosci. Model Dev. 2017, 10, 3635–3659. [Google Scholar] [CrossRef] [Green Version]
  39. Maronga, B.; Gryschka, M.; Heinze, R.; Hoffmann, F.; Kanani-Sühring, F.; Keck, M.; Ketelsen, K.; Letzel, M.O.; Sühring, M.; Raasch, S. The Parallelized Large-Eddy Simulation Model (PALM) Version 4.0 for Atmospheric and Oceanic Flows: Model Formulation, Recent Developments, and Future Perspectives. Geosci. Model Dev. 2015, 8, 2515–2551. [Google Scholar] [CrossRef] [Green Version]
  40. Giometto, M.G.; Christen, A.; Egli, P.E.; Schmid, M.F.; Tooke, R.T.; Coops, N.C.; Parlange, M.B. Effects of Trees on Mean Wind, Turbulence and Momentum Exchange within and above a Real Urban Environment. Adv. Water Resour. 2017, 106, 154–168. [Google Scholar] [CrossRef]
  41. Matzarakis, A.; Gangwisch, M.; Fröhlich, D. RayMan and SkyHelios Model. In Urban Microclimate Modelling for Comfort and Energy Studies; Palme, M., Salvati, A., Eds.; Springer International Publishing: Cham, Switzerland, 2021; pp. 339–361. [Google Scholar] [CrossRef]
  42. Fröhlich, D.; Matzarakis, A. Spatial Estimation of Thermal Indices in Urban Areas—Basics of the SkyHelios Model. Atmosphere 2018, 9, 209. [Google Scholar] [CrossRef] [Green Version]
  43. Wang, Y.P.; Leuning, R. A Two-Leaf Model for Canopy Conductance, Photosynthesis and Partitioning of Available Energy I: Model Description and Comparison with a Multi-Layered Model. Agric. For. Meteorol. 1998, 91, 89–111. [Google Scholar] [CrossRef]
  44. Höppe, P. The Physiological Equivalent Temperature—A Universal Index for the Biometeorological Assessment of the Thermal Environment. Int. J. Biometeorol. 1999, 43, 71–75. [Google Scholar] [CrossRef]
  45. Matzarakis, A.; Mayer, H.; Iziomon, M.G. Applications of a Universal Thermal Index: Physiological Equivalent Temperature. Int. J. Biometeorol. 1999, 43, 76–84. [Google Scholar] [CrossRef] [PubMed]
  46. Jendritzky, G.; de Dear, R.; Havenith, G. UTCI–Why Another Thermal Index? Int. J. Biometeorol. 2012, 56, 421–428. [Google Scholar] [CrossRef] [PubMed] [Green Version]
  47. Staiger, H.; Laschewski, G.; Grätz, A. The Perceived Temperature—A Versatile Index for the Assessment of the Human Thermal Environment. Part A: Scientific Basics. Int. J. Biometeorol. 2012, 56, 165–176. [Google Scholar] [CrossRef] [PubMed]
  48. Ketterer, C.; Gangwisch, M.; Fröhlich, D.; Matzarakis, A. Comparison of Selected Approaches for Urban Roughness Determination Based on Voronoi Cells. Int. J. Biometeorol. 2017, 61, 189–198. [Google Scholar] [CrossRef] [PubMed]
  49. GDAL/OGR Contributors. GDAL/OGR Geospatial Data Abstraction Software Library. 2019. Available online: http://gdal.org (accessed on 1 July 2021).
  50. Biljecki, F.; Stoter, J.; Ledoux, H.; Zlatanova, S.; Çöltekin, A. Applications of 3D City Models: State of the Art Review. ISPRS Int. J. Geo-Inf. 2015, 4, 2842–2889. [Google Scholar] [CrossRef] [Green Version]
  51. Ogre Development Team. OGRE—Open Source 3D Graphics Engine. 2020. Available online: https://www.ogre3d.org/ (accessed on 1 July 2021).
  52. Kerger, F. OGRE 3D 1.7: Beginners Guide; Create Real-Time 3D Applications Using OGRE 3D from Scratch; Learn by Doing: Less Theory, More Results; Packt Publisher: Birmingham, UK, 2010. [Google Scholar]
  53. Junker, G. Pro OGRE 3D Programming: Leverage the Power of Modern Real-Time Hardware-Accelerated 3D Graphics with the Best-in-Class 3D Graphics Library; The Expert’s Voice in Open Source; Apress: Berkeley, CA, USA, 2006. [Google Scholar]
  54. Lillesand, T.M.; Kiefer, R.W. Remote Sensing and Image Interpretation, 2nd ed.; Wiley: New York, NY, USA, 1987. [Google Scholar]
  55. Gebhardt, H.; Glaser, R.; Radtke, U.; Reuber, P.; Zeese, R. Geographie: Physische Geographie und Humangeographie, 2. Auflage, Unveränderter Nachdruck, 2016 ed.; Springer Spektrum: Berlin/Heidelberg, Germany, 2016. [Google Scholar]
  56. Gröger, G.; Kolbe, T.; Nagel, C.; Häfele, K.H. OGC City Geography Markup Language(CityGML) Encoding Standard; Open Geospatial Consortium: Wayland, MA, USA, 2012. [Google Scholar]
  57. Norton, B.A.; Coutts, A.M.; Livesley, S.J.; Harris, R.J.; Hunter, A.M.; Williams, N.S. Planning for Cooler Cities: A Framework to Prioritise Green Infrastructure to Mitigate High Temperatures in Urban Landscapes. Landsc. Urban Plan. 2015, 134, 127–138. [Google Scholar] [CrossRef]
  58. Sanusi, R.; Johnstone, D.; May, P.; Livesley, S.J. Street Orientation and Side of the Street Greatly Influence the Microclimatic Benefits Street Trees Can Provide in Summer. J. Environ. Qual. 2016, 45, 167. [Google Scholar] [CrossRef] [Green Version]
  59. Ali-Toudert, F.; Mayer, H. Effects of Asymmetry, Galleries, Overhanging Façades and Vegetation on Thermal Comfort in Urban Street Canyons. Sol. Energy 2007, 81, 742–754. [Google Scholar] [CrossRef]
  60. Coutts, A.M.; White, E.C.; Tapper, N.J.; Beringer, J.; Livesley, S.J. Temperature and Human Thermal Comfort Effects of Street Trees across Three Contrasting Street Canyon Environments. Theor. Appl. Climatol. 2016, 124, 55–68. [Google Scholar] [CrossRef]
  61. Chatzipoulka, C.; Nikolopoulou, M.; Watkins, R. The Impact of Urban Geometry on the Radiant Environment in Outdoor Spaces. In Proceedings of the 9th International Conference on Urban Climate, Toulouse, France, 20–24 July 2015. [Google Scholar]
  62. Wu, Z.; Chen, L. Optimizing the Spatial Arrangement of Trees in Residential Neighborhoods for Better Cooling Effects: Integrating Modeling with in-Situ Measurements. Landsc. Urban Plan. 2017, 167, 463–472. [Google Scholar] [CrossRef]
  63. Sodoudi, S.; Zhang, H.; Chi, X.; Müller, F.; Li, H. The Influence of Spatial Configuration of Green Areas on Microclimate and Thermal Comfort. Urban For. Urban Green. 2018, 34, 85–96. [Google Scholar] [CrossRef]
  64. Stojakovic, V.; Bajsanski, I.; Savic, S.; Milosevic, D.; Tepavcevic, B. The Influence of Changing Location of Trees in Urban Green Spaces on Insolation Mitigation. Urban For. Urban Green. 2020, 53, 126721. [Google Scholar] [CrossRef]
  65. Alonzo, M.; Baker, M.E.; Gao, Y.; Shandas, V. Spatial Configuration and Time of Day Impacts the Magnitude of Urban Tree Canopy Cooling. Environ. Res. Lett. 2021. [Google Scholar] [CrossRef]
  66. Burgess, J. RTX on—The NVIDIA Turing GPU. IEEE Micro 2020, 40, 36–44. [Google Scholar] [CrossRef]
  67. Stewart Fotheringham, A.; Rogerson, P.A. GIS and Spatial Analytical Problems. Int. J. Geogr. Inf. Syst. 1993, 7, 3–19. [Google Scholar] [CrossRef]
  68. Griffith, D.A. The boundary value problem in spatial statistical analysis. J. Reg. Sci. 1983, 23, 377–387. [Google Scholar] [CrossRef] [PubMed]
  69. Mardaljevic, J.; Rylatt, M. Irradiation Mapping of Complex Urban Environments: An Image-Based Approach. Energy Build. 2003, 35, 27–35. [Google Scholar] [CrossRef]
  70. Hofierka, J.; Kaňuk, J. Assessment of Photovoltaic Potential in Urban Areas Using Open-Source Solar Radiation Tools. Renew. Energy 2009, 34, 2206–2214. [Google Scholar] [CrossRef]
  71. Van Oijstaeijen, W.; Van Passel, S.; Cools, J. Urban Green Infrastructure: A Review on Valuation Toolkits from an Urban Planning Perspective. J. Environ. Manag. 2020, 267, 110603. [Google Scholar] [CrossRef]
  72. Wilkinson, M.D.; Dumontier, M.; Aalbersberg, I.J.J.; Appleton, G.; Axton, M.; Baak, A.; Blomberg, N.; Boiten, J.W.; da Silva Santos, L.B.; Bourne, P.E.; et al. The FAIR Guiding Principles for Scientific Data Management and Stewardship. Sci. Data 2016, 3, 160018. [Google Scholar] [CrossRef] [Green Version]
Figure 1. Sun rays are incident in parallel for given solar altitude angle ( β , °), depending on daytime and day of year. The flux density of these parallel beams (orange) to an orthogonal surface is I 0 ( W   m 2 ). The flux density on a surface I 0 is in relation to by the Lambert’s cosine law Equation (1) (modified after the work in [9], p. 15).
Atmosphere 12 00968 g001
Figure 2. Orthographic render target based on orthographic camera showing the directly sun-lit, projected area of urban obstacles. Urban trees are shown in green and buildings in gray. The obscured, shaded areas are marked by the black pattern. The scene is drawn according to a 40° solar altitude angle of the sun ( β , °).
Atmosphere 12 00968 g002
Figure 3. Calculation of orthographic camera properties: height of the render target (green), camera height (blue), based on the scene bounding box (red dashed) and sun altitude angle ( β , °). The scene is drawn according a 40° height angle of the sun.
Atmosphere 12 00968 g003
Figure 4. Orthographic, rendered picture showing the sunlit, projected tree surfaces in the study area Rieselfeld in Freiburg, Germany at 05:00 UTC, Solar altitude: 12.5°, Solar azimuth: 68.9°. (a) shows the original, unmodified scene, as seen in the 3D view of SkyHelios. (b) shows all sunlit trees in the scene in blue, while all other entities (e.g., buildings and ground surface) in the scene are rendered in black. (c) encodes unique tree identifiers with RGB-colors, while all other entities are still rendered in black.
Atmosphere 12 00968 g004
Figure 5. Study area showing the urban district Rieselfeld in Freiburg, Germany with urban trees and building shapes. (Basemap: © OpenStreetMap contributors, CC BY-SA, Trees and Buildings: © City of Freiburg i. Br., surveyor’s office).
Atmosphere 12 00968 g005
Figure 6. Spatial average of the sunlit area of all urban trees in Rieselfeld for 14th of March (green) and 14th of June (orange) on a hourly basis under clear sky conditions. The maximum in June is of greater magnitude than in March. The trees receive sunlight earlier in the morning and longer in the evening during summer.
Atmosphere 12 00968 g006
Figure 7. Relationship between sunlit area of urban trees and the solar altitude angle under clear sky conditions. Solar altitude angle and sunlit area of urban trees show strong correlation. The figure shows the relationship for a the 14th of March and the 14th of June, divided into rising sun (solid) and setting sun (dashed). The sun lit area is the mean sunlit area on hourly basis, based on all urban trees in the urban district Rieselfeld in Freiburg, Germany.
Atmosphere 12 00968 g007
Figure 8. Comparison of sunpath for 14th of March and June for the center of the urban district Rieselfeld in Freiburg, Germany. The sunrise in March is later compared to June, while the sunset occurs earlier in March. The maximal solar altitude angle in June is greater compared to March.
Atmosphere 12 00968 g008
Figure 9. Ratio between sunlit area and max. sunlit area of urban trees for the 14th of March under clear-sky conditions. It is observable that the lighting of the study area starts according to the solar azimuth angle at the east side and ends at the west side of the district. It is also conspicuous, that the lighting of the trees is dependent on the orientation of the streets and buildings for small solar altitude angles, but less dependent for greater solar altitude angles.
Atmosphere 12 00968 g009
Figure 10. Ratio between sunlit area and max. sunlit area of urban trees for the 14th of June under clear-sky conditions. It is observable that the effect of the solar altitude angle is decreased compared to March because the solar altitude angle is of greater magnitude. It is also conspicuous, that the lighting of the trees starts earlier and lasts longer, compared to March.
Atmosphere 12 00968 g010
Figure 11. Differences between Sky View Factor based on top of each tree crown and virtually remote sensed Area View Factor in the urban district Rieselfeld in Freiburg, Germany. Trees are depicted in green and purple for A V F S V F and A V F < S V F , respectively.
Atmosphere 12 00968 g011
Figure 12. Direct comparison between Sky View Factor based on top of each tree and virtually remote sensed Area View Factor.
Atmosphere 12 00968 g012
Table 1. Comparison between the geometrical and technical properties of a perspective camera projection and an orthographic camera projection.
(a) Required Properties for the Perspective Camera Projection.
PropertyDescription
Position of camera(x,y,z) position of the camera in the mogre scene
Direction of camera(x,y,z) direction of the camera
Field of View (FOV)Visible scope based on aperture angle of the camera
(b) Required Properties for the Orthographic Camera Projection with the Equal Area Projection Property.
PropertyDescription
Position of render target(x,y,z) position of the render target in the mogre scene
Width of render targethorizontal dimension of the render target
Height of render targetvertical dimension of the render target
Normal of render target(x,y,z) direction, corresponding to the direction of the camera
Table 2. Statistics of the averaged area view factor of urban trees for 14 June and 14 March (from 04:00 to 19:00 UTC) in Freiburg-Rieselfeld, Germany.
14th of March14th of June
mean AVF0.400.66
min AVF0.000.09
max AVF0.770.95
sd AVF0.320.28
Publisher’s Note: MDPI stays neutral with regard to jurisdictional claims in published maps and institutional affiliations.

