Article

Atmospheric Impacts of COVID-19 on NOx and VOC Levels over China Based on TROPOMI and IASI Satellite Data and Modeling

by
Trissevgeni Stavrakou
1,*,
Jean-François Müller
1,
Maite Bauwens
1,
Thierno Doumbia
2,
Nellie Elguindi
2,
Sabine Darras
2,
Claire Granier
3,4,
Isabelle De Smedt
1,
Christophe Lerot
1,
Michel Van Roozendael
1,
Bruno Franco
5,
Lieven Clarisse
5,
Cathy Clerbaux
5,6,
Pierre-François Coheur
5,
Yiming Liu
7,
Tao Wang
8,
Xiaoqin Shi
9,
Benjamin Gaubert
10,
Simone Tilmes
10 and
Guy Brasseur
8,9,10
1
Royal Belgian Institute for Space Aeronomy (BIRA-IASB), 1180 Brussels, Belgium
2
Observatoire Midi-Pyrénées, 31400 Toulouse, France
3
Laboratoire d’Aérologie, CNRS, Université de Toulouse, 31013 Toulouse, France
4
NOAA/Chemical Sciences Laboratory/CIRES, University of Colorado, Boulder, CO 80221, USA
5
Université libre de Bruxelles (ULB), Spectroscopy, Quantum Chemistry and Atmospheric Remote Sensing (SQUARES), Brussels 1050, Belgium
6
LATMOS/IPSL, Sorbonne Université, UVSQ, CNRS, 75006 Paris, France
7
School of Atmosphere Science, Sun Yat-sen University, Zhuhai 510275, China
8
Department of Civil and Environmental Engineering, The Hong Kong Polytechnic University, Hong Kong 999077, China
9
Max Planck Institute for Meteorology, 20146 Hamburg, Germany
10
National Center for Atmospheric Research, Boulder, CO 80301, USA
*
Author to whom correspondence should be addressed.
Atmosphere 2021, 12(8), 946; https://doi.org/10.3390/atmos12080946
Submission received: 15 June 2021 / Revised: 12 July 2021 / Accepted: 21 July 2021 / Published: 23 July 2021

Abstract

:
China was the first country to undergo large-scale lockdowns in response to the pandemic in early 2020 and a progressive return to normalization after April 2020. Spaceborne observations of atmospheric nitrogen dioxide (NO2) and oxygenated volatile organic compounds (OVOCs), including formaldehyde (HCHO), glyoxal (CHOCHO), and peroxyacetyl nitrate (PAN), reveal important changes over China in 2020, relative to 2019, in response to the pandemic-induced shutdown and the subsequent drop in pollutant emissions. In February, at the peak of the shutdown, the observed declines in OVOC levels were generally weaker (less than 20%) compared to the observed NO2 reductions (−40%). In May 2020, the observations reveal moderate decreases in NO2 (−15%) and PAN (−21%), small changes in CHOCHO (−3%) and HCHO (6%). Model simulations using the regional model MAGRITTEv1.1 with anthropogenic emissions accounting for the reductions due to the pandemic explain to a large extent the observed changes in lockdown-affected regions. The model results suggest that meteorological variability accounts for a minor but non-negligible part (~−5%) of the observed changes for NO2, whereas it is negligible for CHOCHO but plays a more substantial role for HCHO and PAN, especially in May. The interannual variability of biogenic and biomass burning emissions also contribute to the observed variations, explaining e.g., the important column increases of NO2 and OVOCs in February 2020, relative to 2019. These changes are well captured by the model simulations.

1. Introduction

The impact of the COVID-19 disruptions on the atmospheric composition is studied by a rapidly growing number of publications, dominated by air quality studies over China [1,2], as this country was the first to undergo large-scale stringent lockdowns starting at the end of January 2020 and because their effects are expected to be very strong due to the high pollution levels. The reduction of social exchanges and economic activities led to sharp changes in air pollution, reported by in situ and satellite observations [3,4,5,6,7,8,9,10,11], and to an estimated reduction of 20–30% in primary pollutant emissions in February in eastern China based on activity data [12]. These widespread disturbances caused cascading changes in secondary pollutants through chemical interactions and feedbacks [13,14]. To disentangle the effects of long-term emission trends, meteorology and chemistry on the observed changes due to the COVID-19 lockdown in China, model studies usually target February and March 2020, when the Chinese economy was most affected, with a particular focus on observations of nitrogen dioxide (NO2), ozone, and particulate matter [7,10,13,15,16,17]. However, spaceborne observations of other secondary pollutants such as volatile organic compounds (VOCs), are important to complement the analysis regarding the response of the atmospheric system to the pandemic-induced disruptions.
Here we use satellite column densities of four trace gases, NO2, formaldehyde (HCHO), glyoxal (CHOCHO), and peroxyacetyl nitrate (PAN) in February and May 2019 and 2020 and analyze their distributions against simulations of the regional chemistry/transport model MAGRITTEv1.1 (Model of Atmospheric Composition at Global and Regional scales using Inversion Techniques for Trace gas Emissions, see Section 2.2). The vertical distribution of these compounds presents a pronounced maximum in the boundary layer [18,19] and their relatively short chemical lifetimes make them useful proxies for the emissions of NOx and VOCs [20,21,22]. The first three compounds are measured by the Tropospheric Monitoring Instrument (TROPOMI, [23]) on board the Sentinel-5 Precursor platform, while PAN is retrieved from the observations of the Infrared Atmospheric Sounding Interferometer (IASI, [24]), carried on the Metop platforms. In addition to February 2020, discussed in many previous studies, we focused also on May 2020, to determine to what extent the lift of the shutdown was accompanied by a return to normality in terms of air composition.
HCHO and CHOCHO are short-lived intermediates in the oxidation of biogenic, pyrogenic, and anthropogenic non-methane VOCs (NMVOCs), and therefore their distributions depend strongly on the NMVOC emissions. Spaceborne HCHO has been frequently used to constrain the emissions of NMVOCs [25,26,27]. During the pandemic, TROPOMI HCHO data showed declining columns in the North China Plain, relative to the same period in 2019 [28]. PAN is formed via oxidation of NMVOCs in the presence of nitrogen oxides (NOx = NO + NO2) and constitutes the main atmospheric reservoir for NOx radicals [19]. Spaceborne CHOCHO and PAN columns during the pandemic are presented and analyzed here for the first time. We conducted simulations over China using the MAGRITTEv1.1 regional model [29] for February and May 2019 and 2020, using state-of-the-art emission datasets, which account for the declining primary pollutant emissions due to the pandemic. The resulting columns are evaluated against the aforementioned satellite data, and are further investigated with the aid of sensitivity scenarios.

2. Materials and Methods

2.1. Satellite Observations from TROPOMI and IASI

The satellite data used are briefly presented here and are thoroughly described in Appendix A, Appendix B, and Appendix C. For all products, we use monthly averages gridded at the model resolution (0.5° × 0.5°).
The NO2 columns are obtained from TROPOMI [23], which has an overpass local time of ~1:40 p.m. and provides a quasi-global daily coverage at a resolution of 5.5 × 3.5 km2. We use L2 data with a quality value higher than 0.75 [30]. Since validation studies have shown underestimations of high columns and overestimation of low columns, we apply a bias correction, i.e., the TROPOMI columns (Ω) are adjusted using Ω′ = (2.12 × Ω −2.12 × 10¹⁵) where Ω and the adjusted column (Ω′) are expressed in molec.cm−2, based on the linear regression of TROPOMI against ground-based column observations [31].
The TROPOMI HCHO retrieval is described in [32]. To improve the accuracy of the data, we use a modified version of the operational product [33]. In this version, the background correction in the remote Pacific Ocean is updated every day. To avoid possible issues originating from auxiliary data, we use tropospheric columns not corrected for clouds, in combination with a strict cloud fraction filtering (less than 20%) in addition to the usual quality assurance criterion (values higher than 0.5 are retained). The column averaging kernel and the a priori profiles are provided for every observation. In remote regions, the precision of an individual column is estimated at ~5 × 10¹⁵ molec.cm−2, but for monthly averaged data at 0.5° × 0.5° it is estimated to be lower than 1.0 × 10¹⁵ molec.cm−2. The systematic uncertainty of the monthly tropospheric column varies between 20% and 50% of the column. The detection limit is estimated as three times the retrieved random component of the uncertainty, multiplied by 2 to account for the underestimation of random errors suggested by comparison with ground-based data [34]. Upon spatiotemporal averaging, the detection limit scales as 1 / n , with n the number of observations per pixel and per month.
The TROPOMI CHOCHO retrieval is described in [35]. The product includes vertical tropospheric columns derived in the visible spectral range using a stringent cloud fraction filtering (less than 20%), random and systematic errors, and column averaging kernels. The low CHOCHO optical depth implies large random errors (6–10 × 1014 molec.cm−2 for dark scenes), which are significantly reduced through spatiotemporal averaging. Systematic errors are estimated at 1–3 × 10¹⁴ molec.cm−2, corresponding to ca. 30–70% of a typical column in emission regions. Detection limits are calculated as for HCHO, based on the retrieved random uncertainty of the retrieval, but without the factor 2 upscaling.
The PAN total columns are obtained from hyperspectral radiance measurements recorded by the IASI nadir-viewing satellite [24]. IASI operates continuously since 2007 and achieves global coverage twice daily, at 9:30 and 21:30 local time. The retrieval relies on an artificial neural network framework specifically developed for weak infrared absorbers such as ammonia [36,37] and VOCs [38,39,40]. The typical uncertainty on the individual PAN column usually ranges between 1 × 10¹⁵ and 3 × 10¹⁵ molec.cm−2, and can reach 4 × 10¹⁵ molec.cm−2 for scenes affected by residual clouds or weak thermal contrast [38]. Single-cell measurements are considered robust when the hyperspectral radiance index (HRI) is higher than 3, which for PAN over Eastern China in February and May corresponds to a median value of 8.9 × 10¹⁵ molec.cm−2. As for HCHO and CHOCHO, this value is lowered upon spatiotemporal averaging.

2.2. Simulations with the MAGRITTEv1.1 Chemical Transport Model

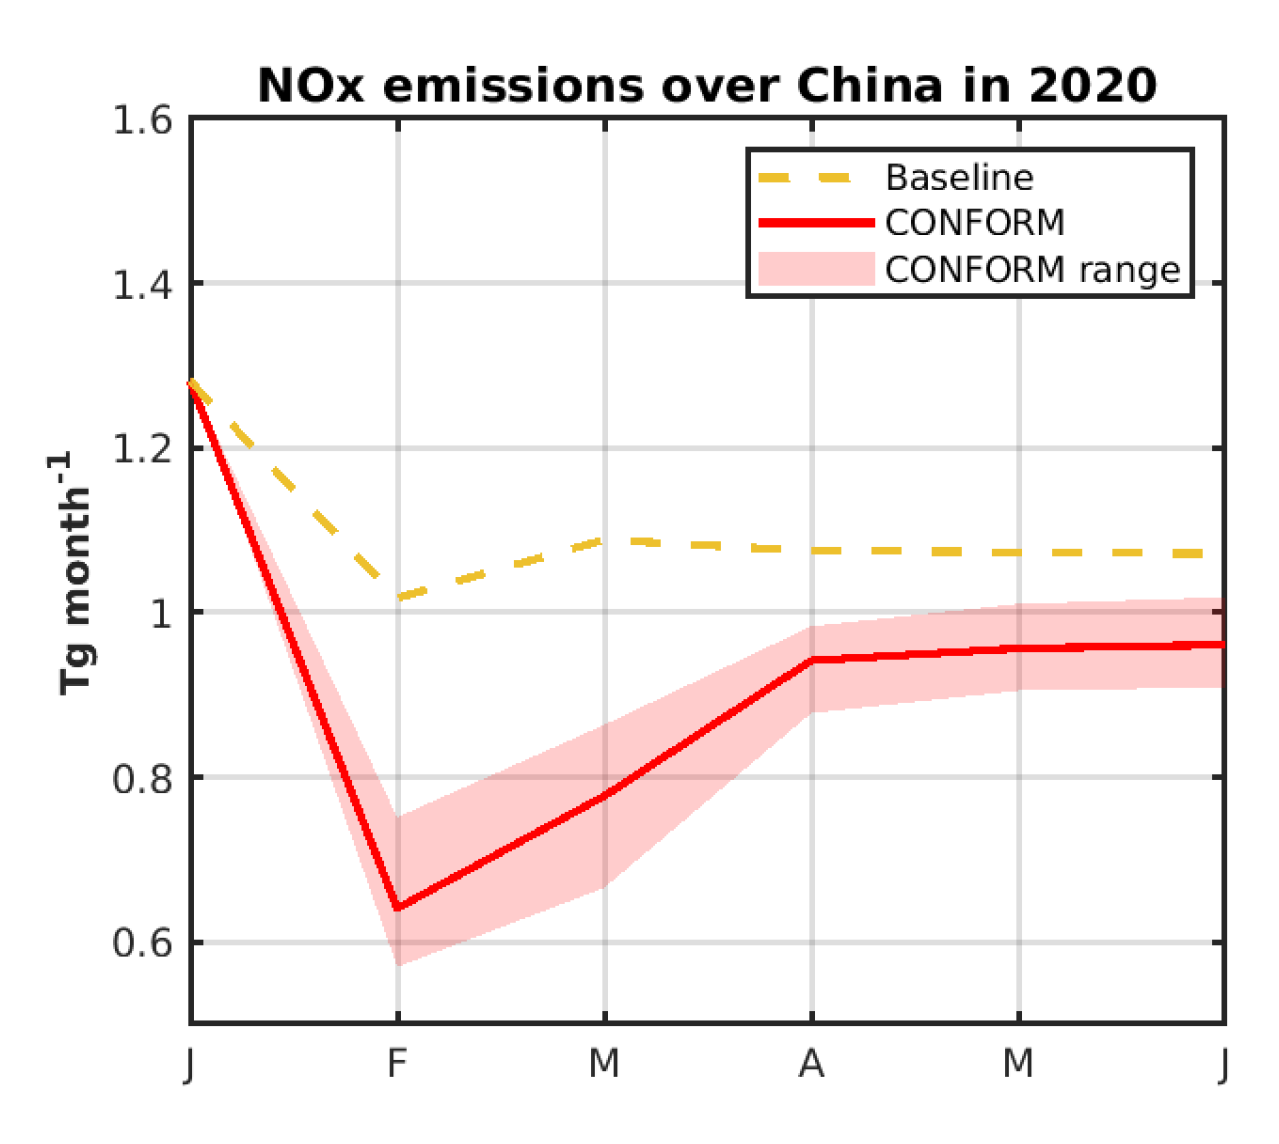
MAGRITTEv1.1 [29] is run at 0.5° × 0.5° over China and surrounding areas (73–150° E, 17–54° N) for February and May 2019 and 2020. Meteorological fields are from the ERA5 reanalysis [41]. Biomass burning fluxes are from the GFED4s database ([42], https://www.geo.vu.nl/~gwerf/GFED/GFED4, accessed on 21 July 2021), and biogenic emissions from the MEGAN-MOHYCAN model [43,44]. Baseline anthropogenic emissions are provided by the CAMS-GLOB-ANT_v4.2-R1.1 inventory [45,46], which provides emissions from 2000 to 2020. This inventory uses the MEIC v1.3 (http://meicmodel.org, accessed on 21 July 2021) emissions over China between 2008 and 2016. The emissions are extended to 2020 by linear extrapolation based on the emission trends proposed by [47], which account for recent emission decreases. The anthropogenic emissions during the pandemic are obtained from the CONFORM (COVID adjustmeNt Factor fOR eMissions) global dataset, which accounts for the slowdown of human activities through adjustment factors based on activity data, which are applied for all economic sectors and geographical regions [12]. For China, on average, the adjustment factors for the main sectors, i.e., road transport, power generation, industry, and residential are estimated at 0.4, 0.6, 0.65, and 1.1, respectively, in February 2020, and at 1.0, 0.9, 0.8, and 1.0 in May 2020 [12]. The factor for air traffic emissions is estimated at 0.44 in February 2020 and 0.67 in May 2020. Figure 1 illustrates the emission ratio (E2020/E2019) for anthropogenic NOx and VOC fluxes in February and May, as well as the difference in biomass burning VOC and isoprene fluxes between 2020 and 2019. Besides the average adjustment factors, the CONFORM dataset provides low and high estimates of those factors accounting for uncertainties due to lack of data or limited information for some activity sectors (Figure 2).
The simulated monthly averaged columns at the satellite overpass time (13:30 local time for TROPOMI) are calculated by accounting for the averaging kernels and sampling times of valid data. The performed simulations are described in Table 1.

3. Results

3.1. February 2019 and 2020: Simulated and Observed Changes

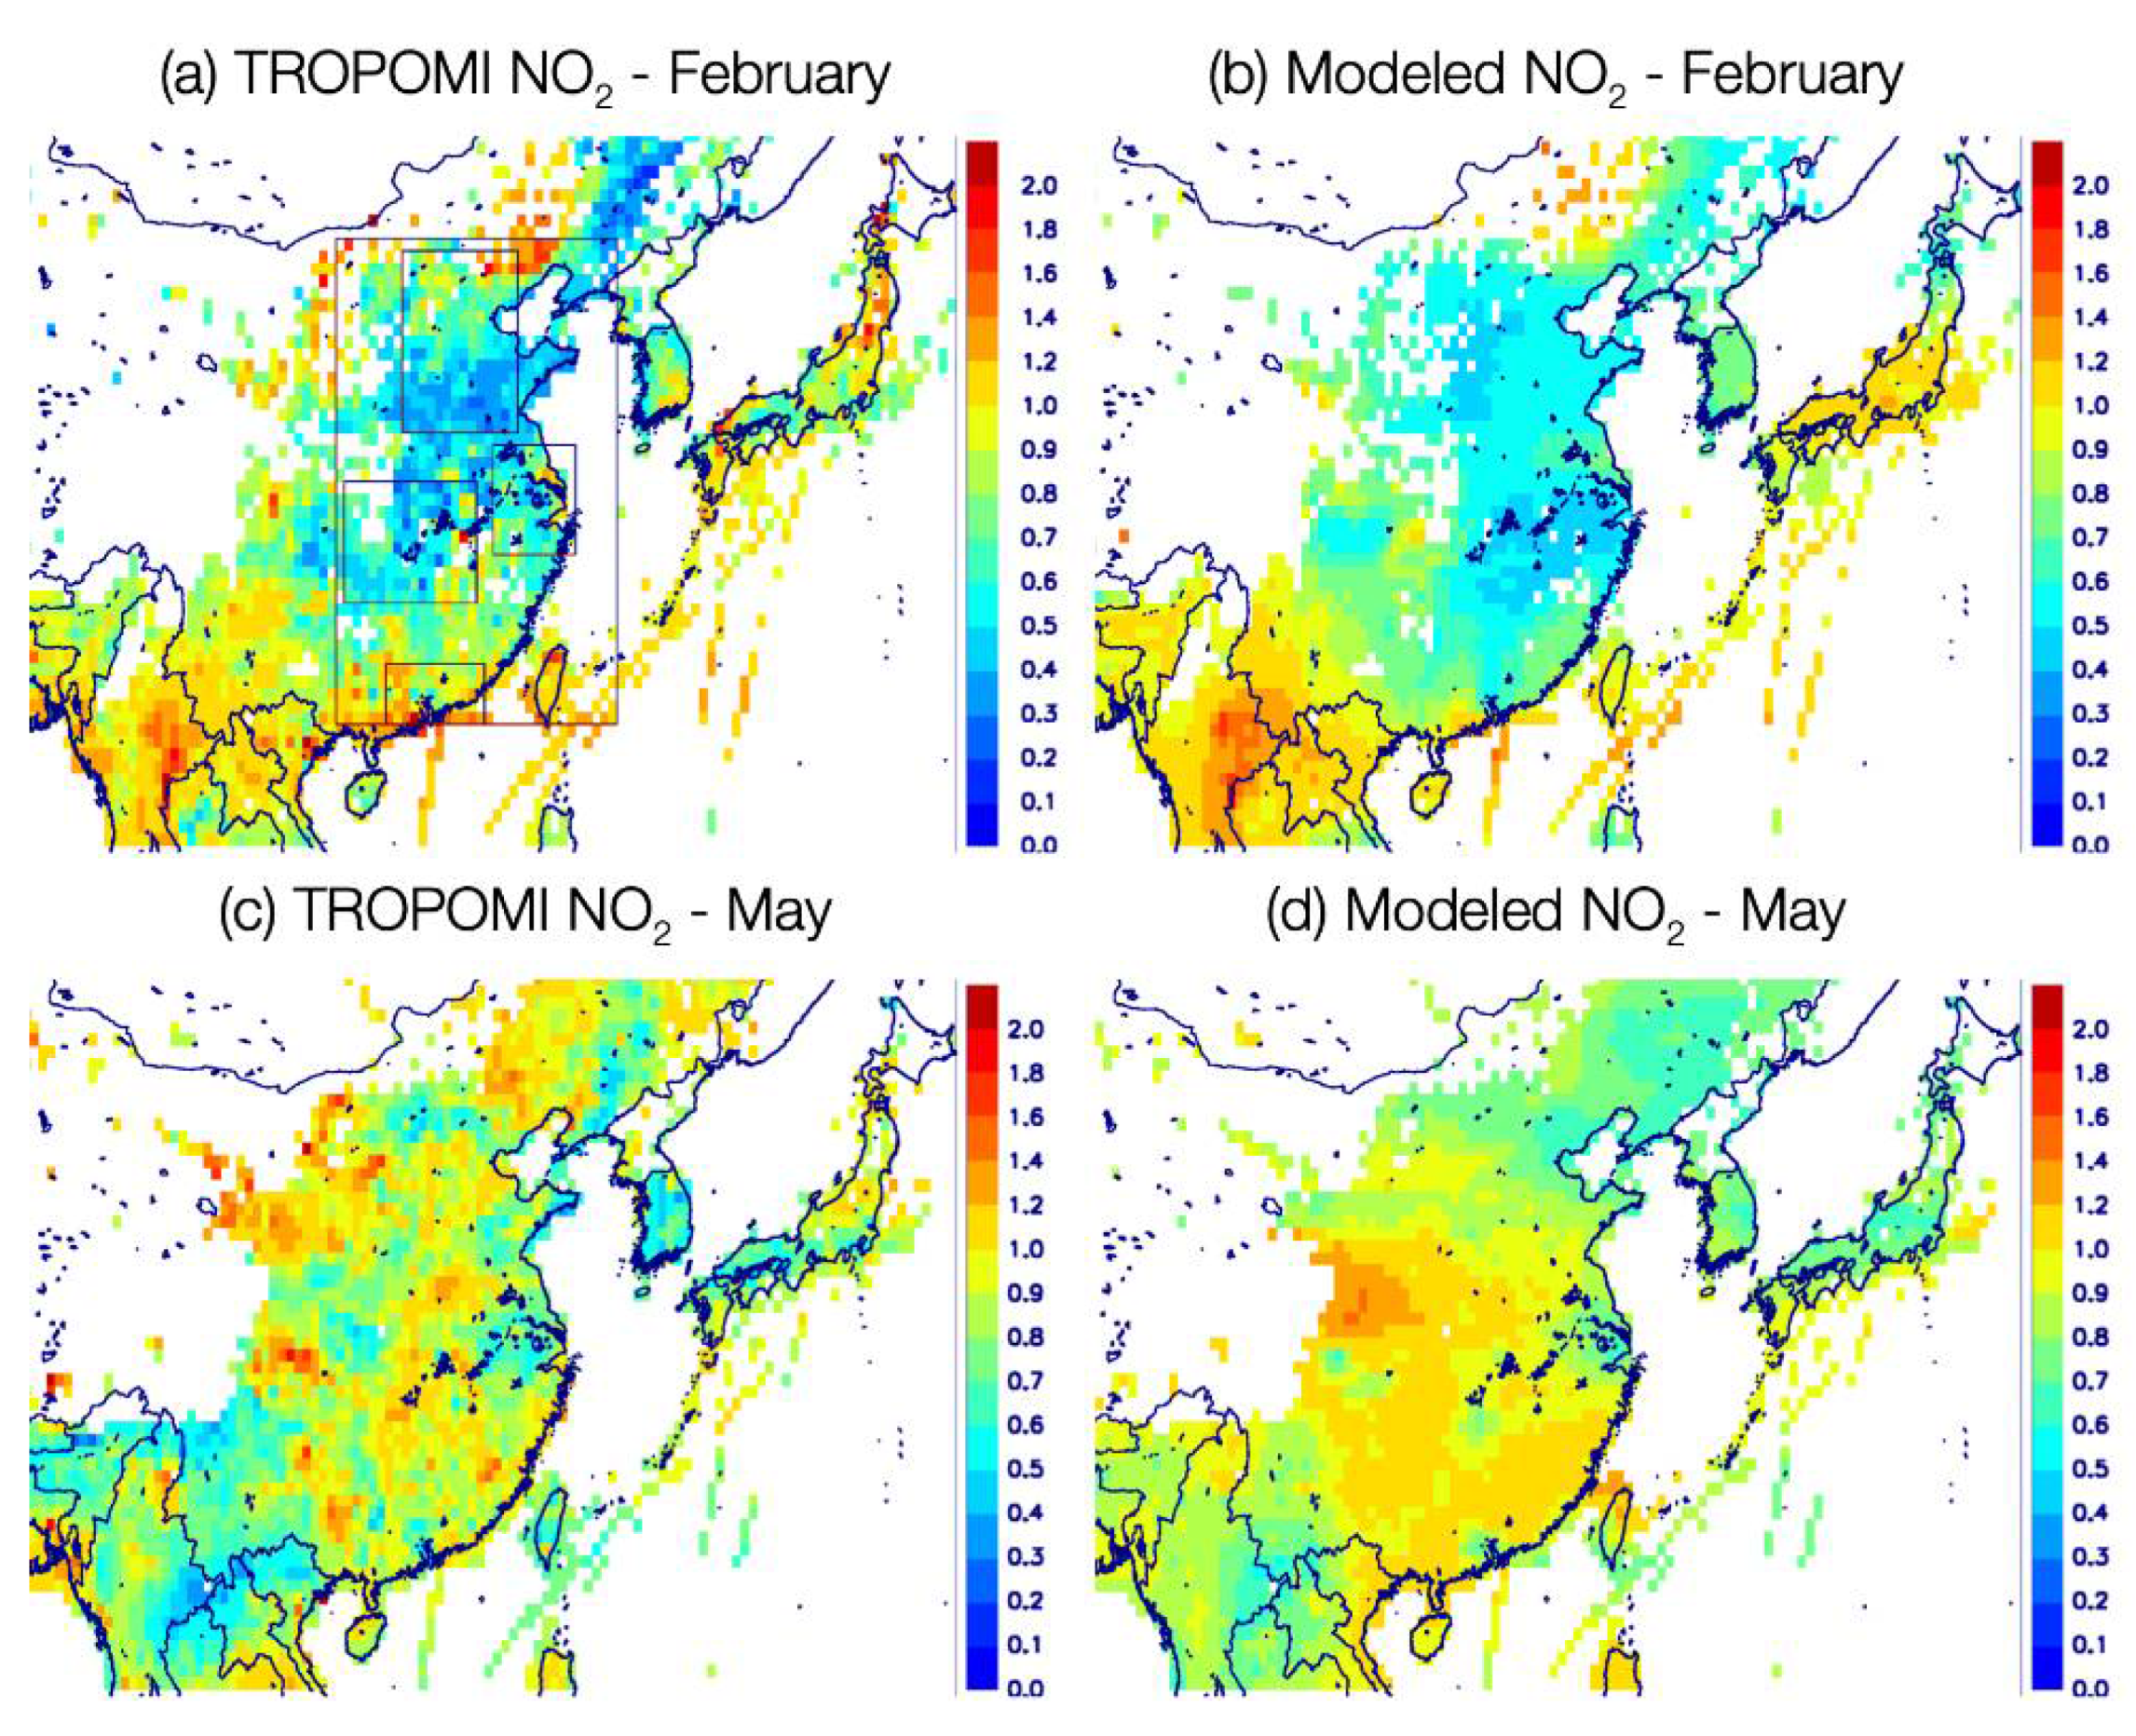
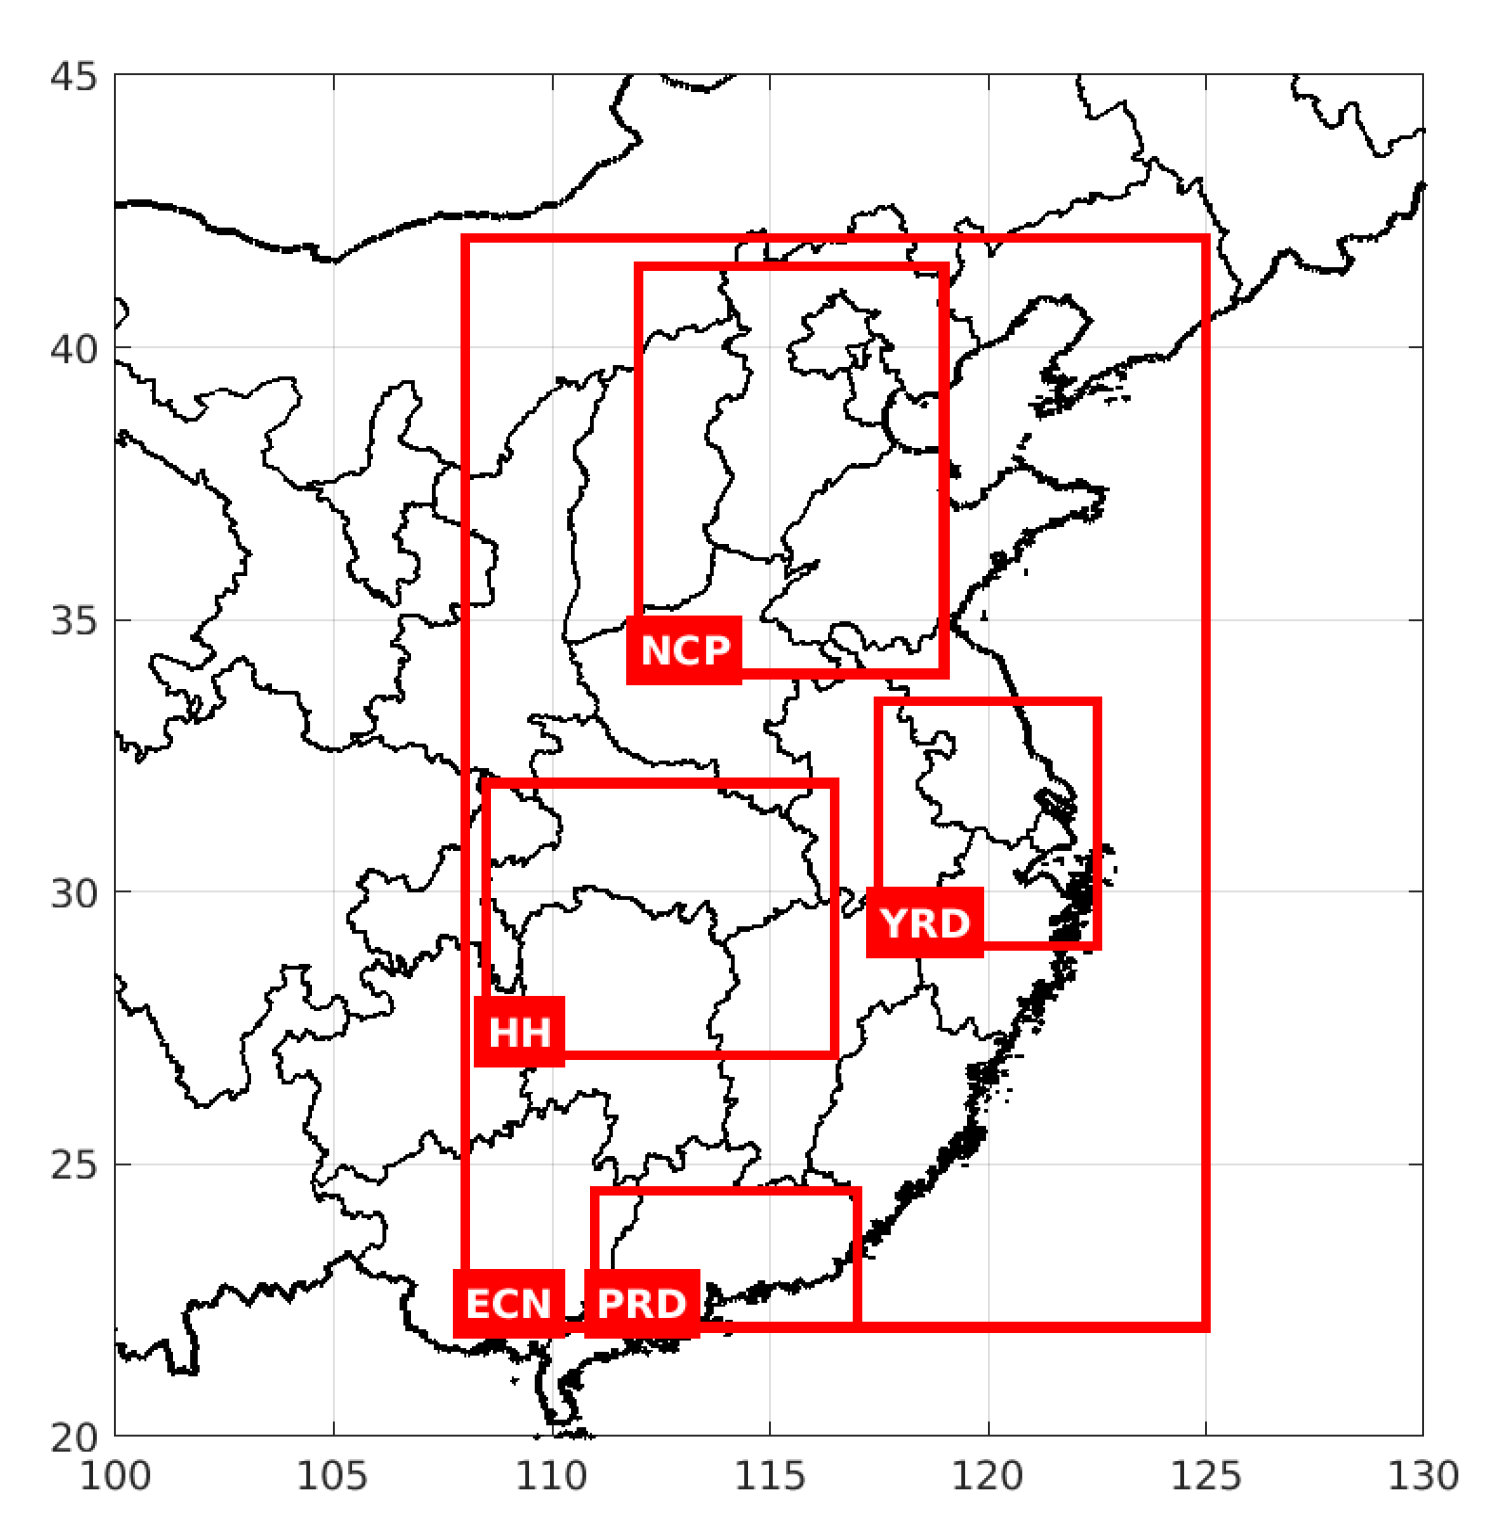
Figure 3a,b illustrates the ratio of NO2 columns in February 2020 to those of February 2019, observed by TROPOMI and simulated by MAGRITTEv1.1 (run R1) using the adjustment factors from the CONFORM dataset. The modeled and observed ratios show a good degree of consistency, both in terms of spatial patterns and percentage changes. Over eastern China, defined as 22–42° N and 108–125° E (Figure 4), the column decrease estimated in the R1 experiment (−42%) is in excellent agreement with the observed decrease (−40%), whereas the simulations R1H and R1L, using high and low CONFORM factors (Figure 2) result in underestimated (−35%) or overestimated (−50%) changes, respectively (Table 2). These declines respond approximately linearly to the anthropogenic NOx flux decreases of the CONFORM dataset in the R1 simulation (−41%), as well as in the R1H (−33%) and R1L (−51%) simulations. The strongest column reductions are observed in the densely populated North China Plain (NCP, -46%, Figure 4) and in the Hubei-Hunan region (HH, −44%, Figure 4). The latter region encompasses the Hubei province where some of the most severe lockdowns were enforced, and Wuhan, the city where the pandemic was first detected. The R1 experiment predicts very similar strong decreases over these regions (−47% and −45%, respectively), although their spatial patterns show less variability than TROPOMI (Figure 3). Over the Yangtze River Delta (YRD), the modeled change is slightly stronger than observed (−44% in R1 vs. −38% in TROPOMI).
The baseline R2 scenario predicts a column decrease of −8.4%, stronger than the NOx emission decline (−2% in 2020 with respect to 2019) of the CAMS-GLOB-ANT_v4.2-R1.1 dataset. The R3 (same anthropogenic NOx flux for 2019 and 2020) and R5 (same emissions in 2019 and 2020) simulations lead to small NO2 column changes (−3% and −5%, respectively).
We further compared the NO2 percentage changes between 2019 and 2020 estimated in the standard simulation (R1) and observed by in situ NO2 data obtained at environmental monitoring stations from the China National Environmental Monitoring Center ([48,49] Figure A1). Table 3 summarizes this evaluation of surface NO2 changes and also presents comparisons between TROPOMI and model-simulated NO2 columns at the locations of the in situ stations. For meaningful comparisons, we consider only in situ data within a two-hour time-window around the TROPOMI overpass time (12 a.m.–2 p.m. local time). The relative decreases in the observed and modeled surface NO2 concentrations are in good agreement both in February and in May over all regions considered in Figure 4 (less than 10% difference on average). Similarly, the changes in the observed and modeled columns at the locations of the stations show good consistency. With regards to February and May 2019, the in situ data suggest a change of −36% in February and −8% in May 2020 in eastern China (1035 stations), which is well reproduced by the model (−40% in February and −8% in May). Over the same region, the satellite data at the locations of the in situ stations exhibit a change of −45% in February and −19% in May 2020, in excellent agreement with the changes calculated by the model (R1 simulation, Table 3). Similar results are found for the smaller regions of Figure 4, although with more pronounced differences related to the smaller number of measurement sites.
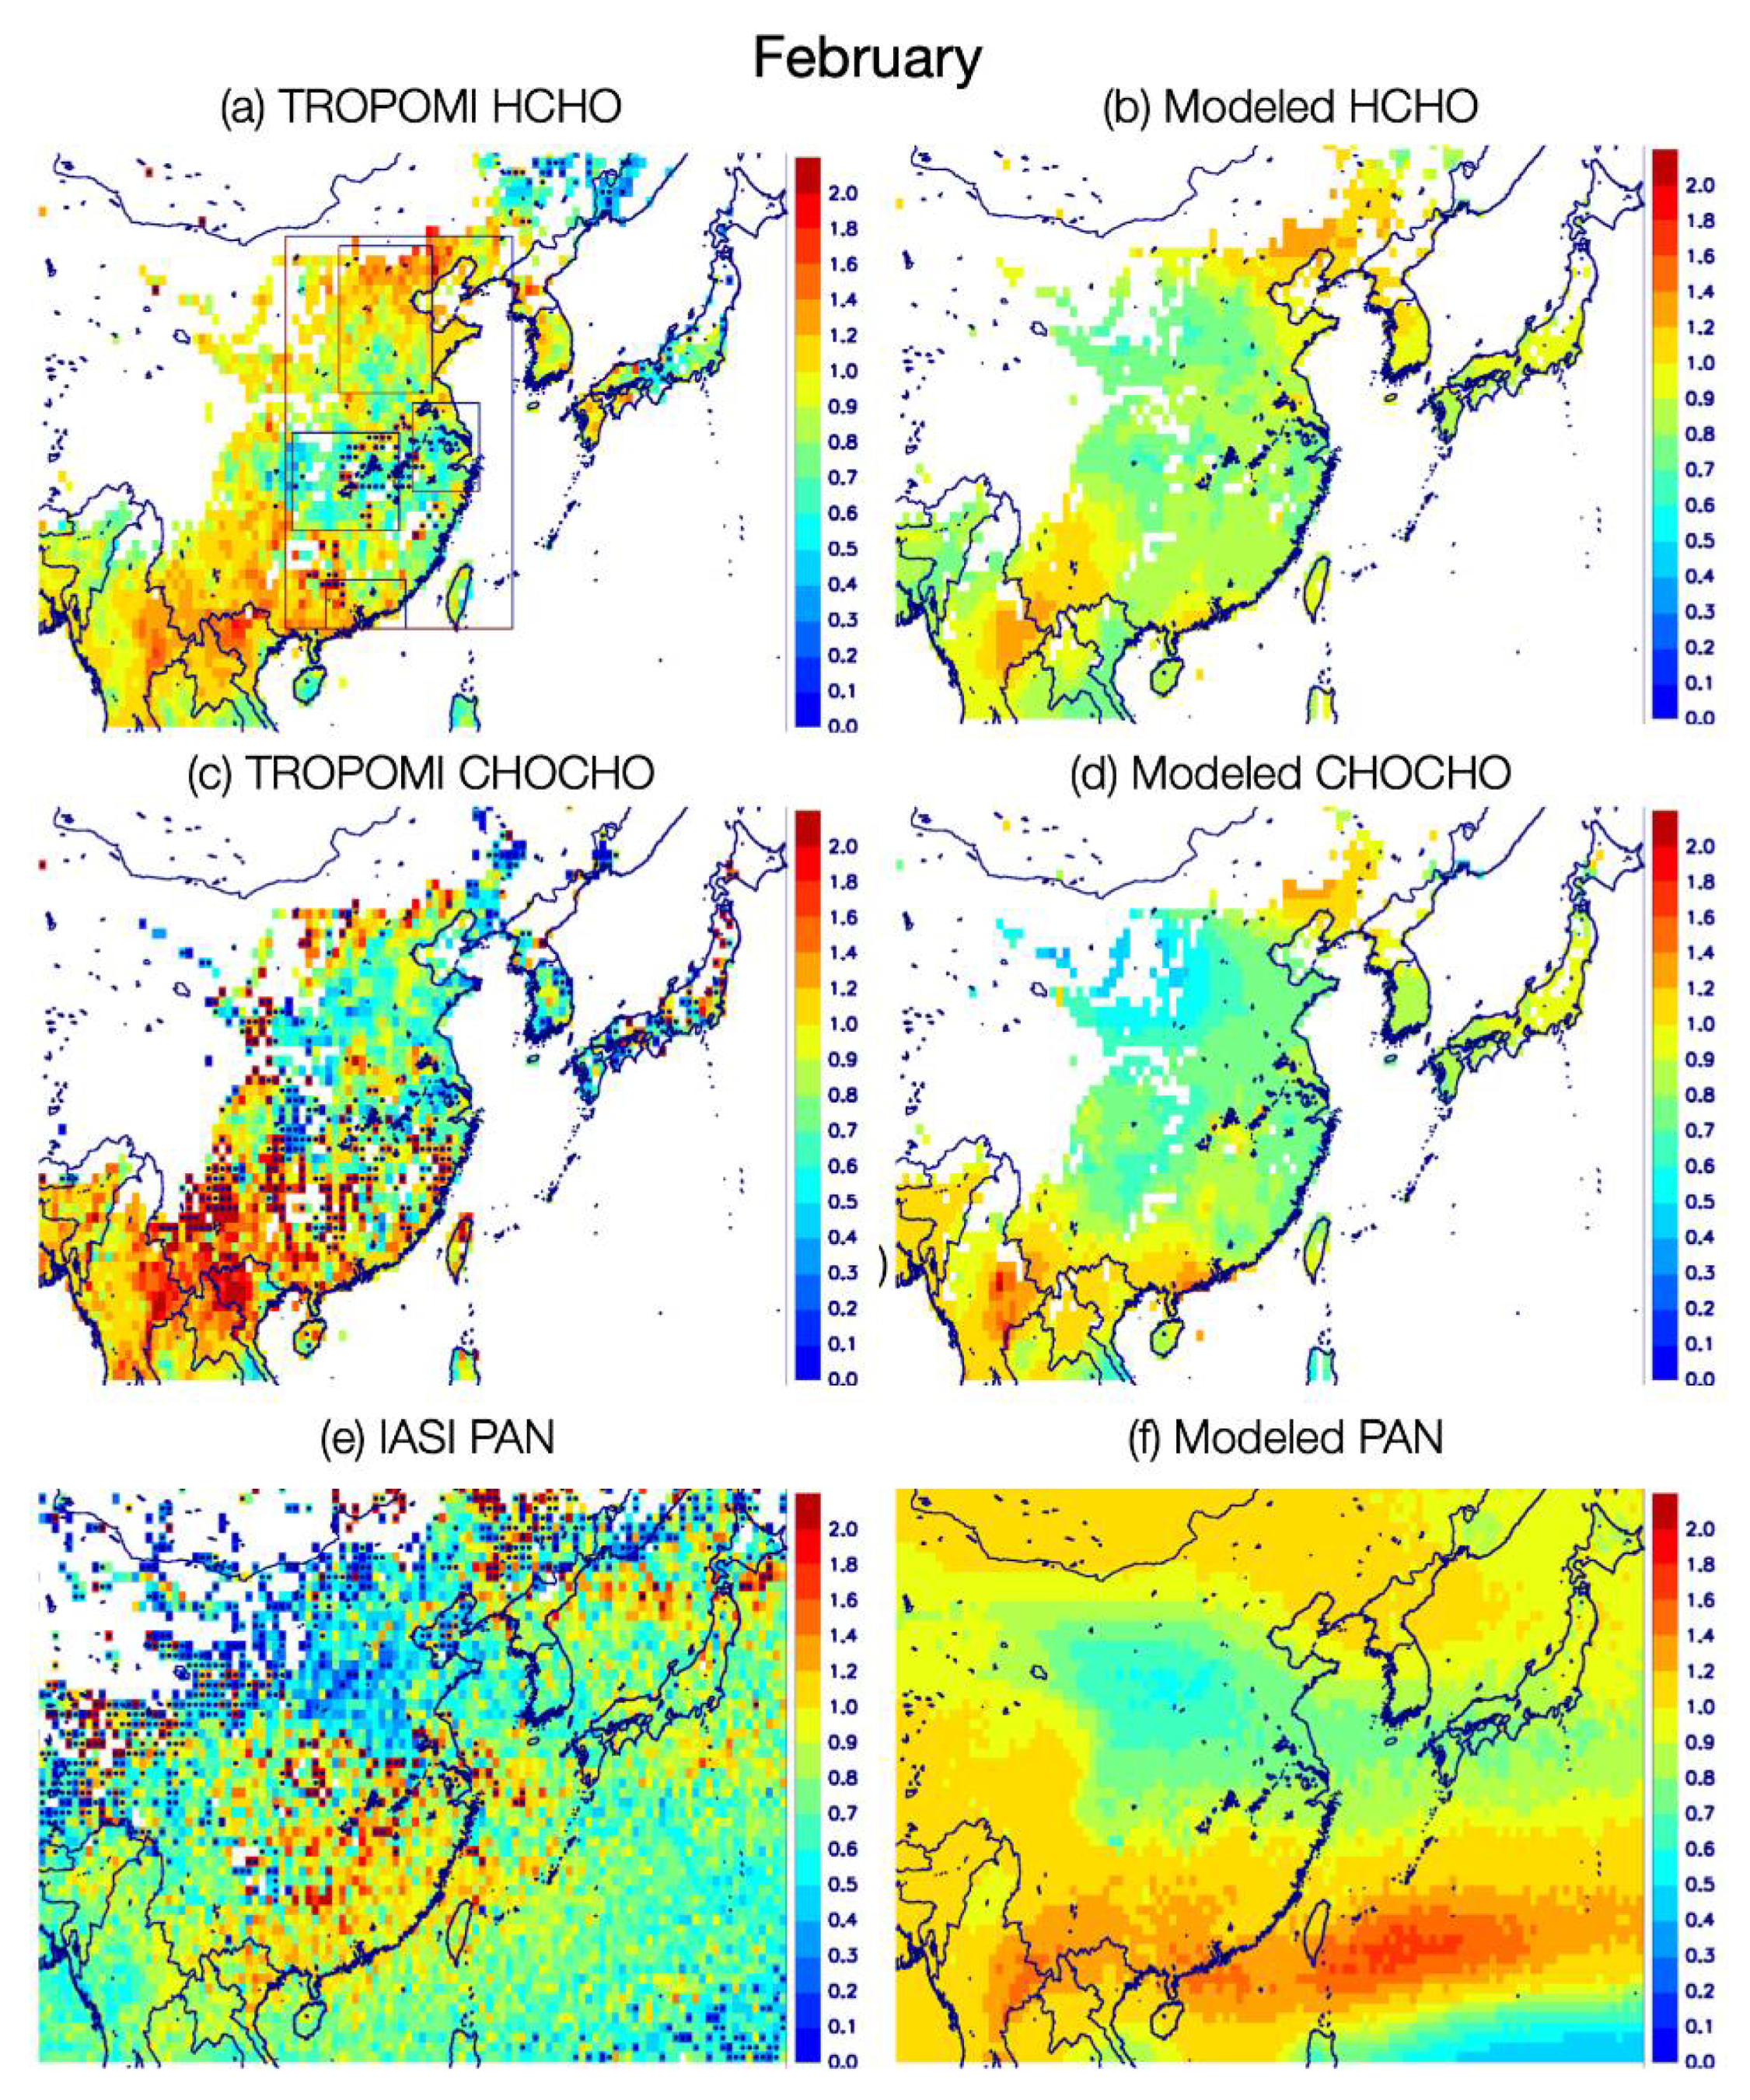
In contrast to NOx, which have strong direct emissions, HCHO, CHOCHO, and PAN are predominantly secondary in origin. In Northern China, their wintertime columns are lower than in summer, due to reduced photochemical activity and biogenic NMVOC emissions [19,21,22,38]. The low winter columns explain the noisier and more uncertain columns in winter. Despite these limitations, a good agreement between observed and model distributions of the 2020-to-2019 column ratios is found in February (Figure 5). As for NO2, however, the spatial variability of the changes is much lower in the model than in the observations (Figure 5). Very high and very low values of the satellite-based ratio are often related to columns being near or below the detection limit of the retrievals, especially for glyoxal (in south/central China) and PAN (in western and northeastern China).
The observed HCHO and CHOCHO ratio distributions are relatively similar, with lower-than-1 values in central-eastern China (between ~28° and 38° N), and values higher than 1 in the southern part (<25° N) as well as in northern China (between 40° and 43° N). This pattern is reproduced by the model, with HCHO and CHOCHO column decreases reaching respectively 14% and 21% on average in eastern China (17% and 24% in the YRD region). These declines are largely due to the drop in anthropogenic VOC emissions between 2020 and 2019. The stronger column reduction for CHOCHO than for HCHO is explained by the larger contribution of anthropogenic sources to the CHOCHO budget [50]. The HCHO column changes simulated here are consistent with those reported by another model study focusing on the North China Plain and a different period (between 1–23 January 2020 and 24 January–15 February 2020). In both studies, the spatial patterns are more homogeneous in the models than in the observations (Figure 5 and [13]).
Due to secondary formation, both HCHO and CHOCHO are observed away from the emission source, a well pattern represented in the model (Figure 5). The higher biomass burning emission in 2020 over Myanmar (18–23° N, 96–102° E, Figure 1c) led to modelled HCHO and CHOCHO columns enhancements by 6% and 18%, respectively, in qualitative agreement with the observed enhancements (15% for HCHO and 34% for CHOCHO) but suggesting an underestimation of fire activity. The data also suggest an underestimation of biomass burning emissions over northern Vietnam, as well as an underestimation of CHOCHO formation in agricultural fires, which are a commonplace practice in this region for clearing the fields after harvesting [51]. In eastern China, the use of the CONFORM emissions in R1 leads to a decrease of 8% and to 21% in the HCHO and CHOCHO column ratio, respectively, in comparison with the R2 experiment using baseline emissions for 2020. The stronger impact of emission reduction on CHOCHO than on HCHO is due to the larger contribution of anthropogenic VOCs to the abundance of CHOCHO (20–25% at global scale, [22,52] compared to HCHO (7%, [21]). Similarly, the observations show a pronounced north–south gradient in the PAN column ratios, which is qualitatively well represented in the model (Figure 5), although the observed changes are larger (Table 2). In consistency with the model, the largest decrease is found in the NCP, in response to the anthropogenic emission decreases. The higher column ratios in southern China might be due to a combination of higher biomass burning over Myanmar and higher isoprene emission fluxes over Southeastern China in 2020 (Figure 1d). Isoprene is a major precursor of PAN, responsible for ~37% of its formation on the global scale [19]. While the enhanced fires in Myanmar result in higher modeled PAN columns in February 2020 in this region, this enhancement is overestimated by the model over South China, and the impact of fires is not visible over the source region according to IASI, suggesting that fire events might actually play little role in the PAN formation [19].

3.2. May 2019 and 2020: Simulated and Observed Changes

After the sharp decline in economic activity during the first three months of 2020, China’s economy recovered in the following months, reaching almost normal levels by mid-May, as suggested by numerous indicators, like traffic density, energy consumption and business reopening [12,53]). By the beginning of May 2020, the resumption levels were estimated at ~90%, marking a swift normalization of economic activity, even though some sectors restarted somewhat later, e.g., the services sector [53]. According to the average CONFORM estimate for May 2020, the anthropogenic NOx and VOC fluxes over China were respectively about 15% and 13.5% lower than in May 2019 (Figure 1), while the high (low) CONFORM estimate suggests decreases of 7% (18%) for NOx and 5% (20%) for VOCs.
The observed NO2 column changes and the R1 simulation are in good overall agreement in May (−15% vs. −12% on average, Table 2) even though the observed spatial distribution of the changes is more heterogeneous (Figure 3c,d). Whereas moderate reductions are found in Hubei-Hunan (−7% and −4% according to TROPOMI and MAGRITTE), much higher differences are seen in YRD (−19% and −23%) and NCP (−18% and −14%). Those inter-regional differences are mostly due to meteorological variability, the spatial distribution of the changes being very similar in the R1 and in the R5 simulation (not shown). For example, the 2020/2019 ratio of average columns in the R5 run is positive in Hubei-Hunan (+6%) and negative in both NCP and YRD (−8%). On average for eastern China, the change in NO2 column due to the COVID-19 restrictions is estimated at about −8% in May (difference between R1 and R2 changes).
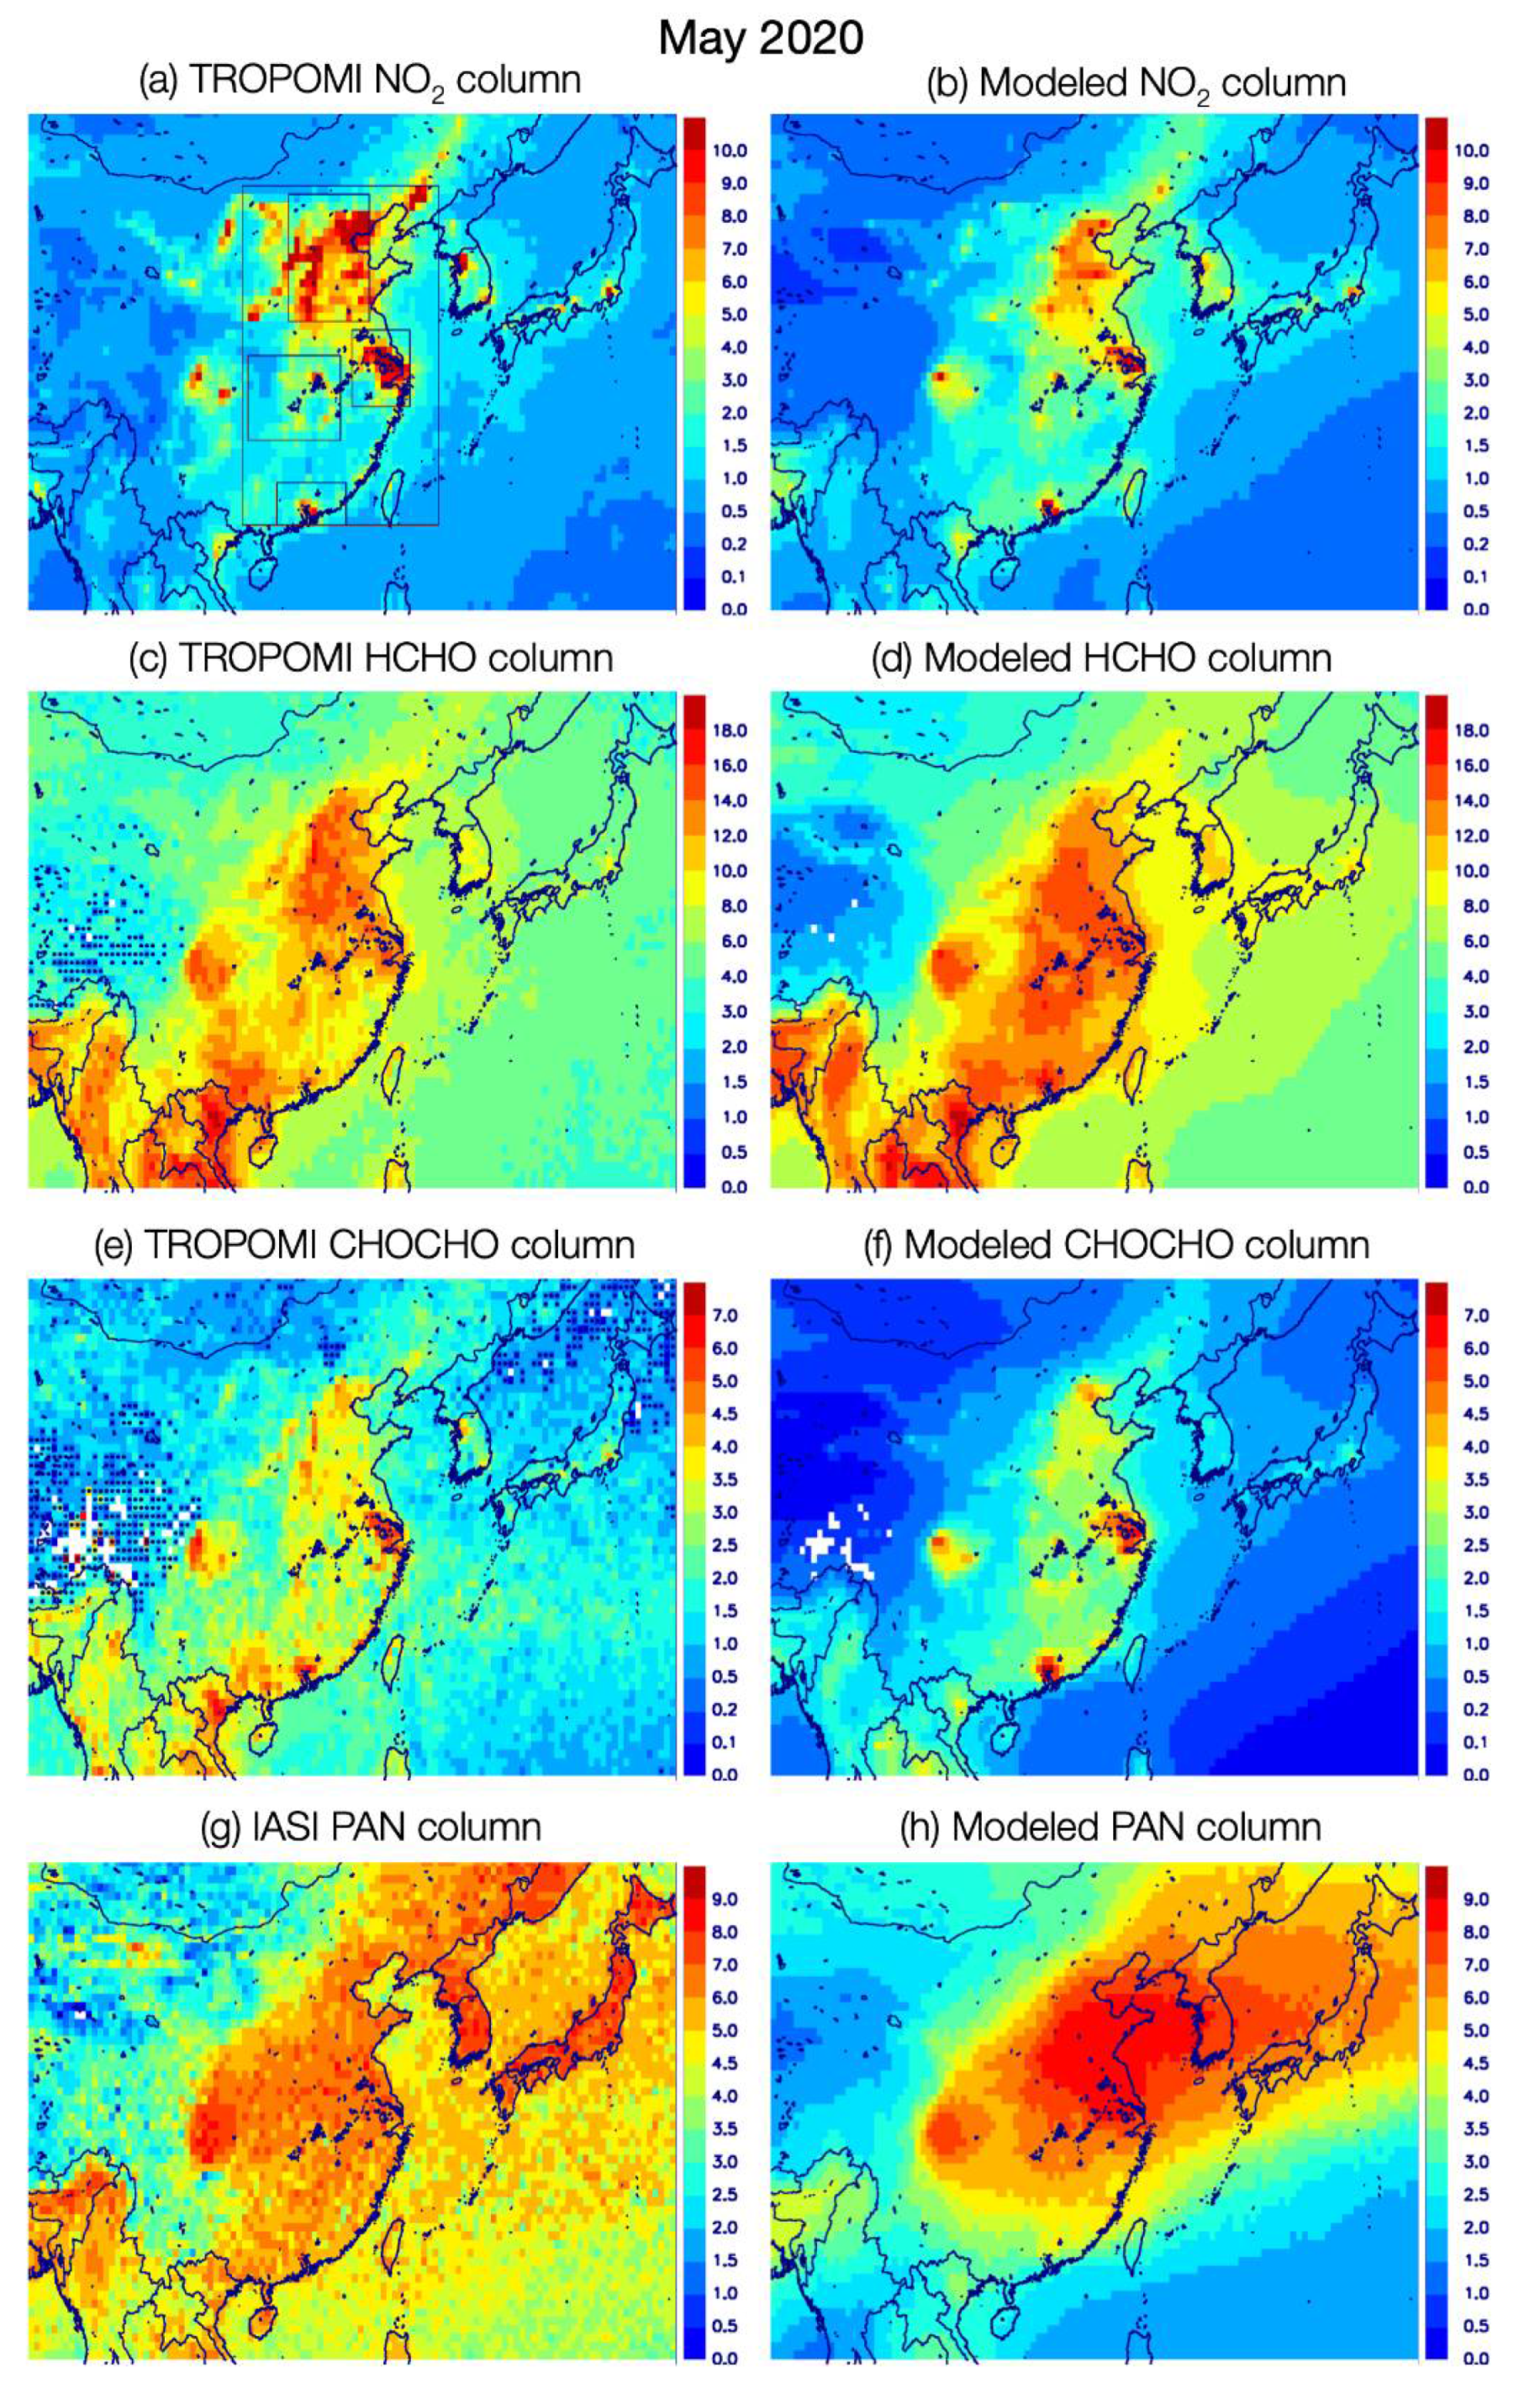
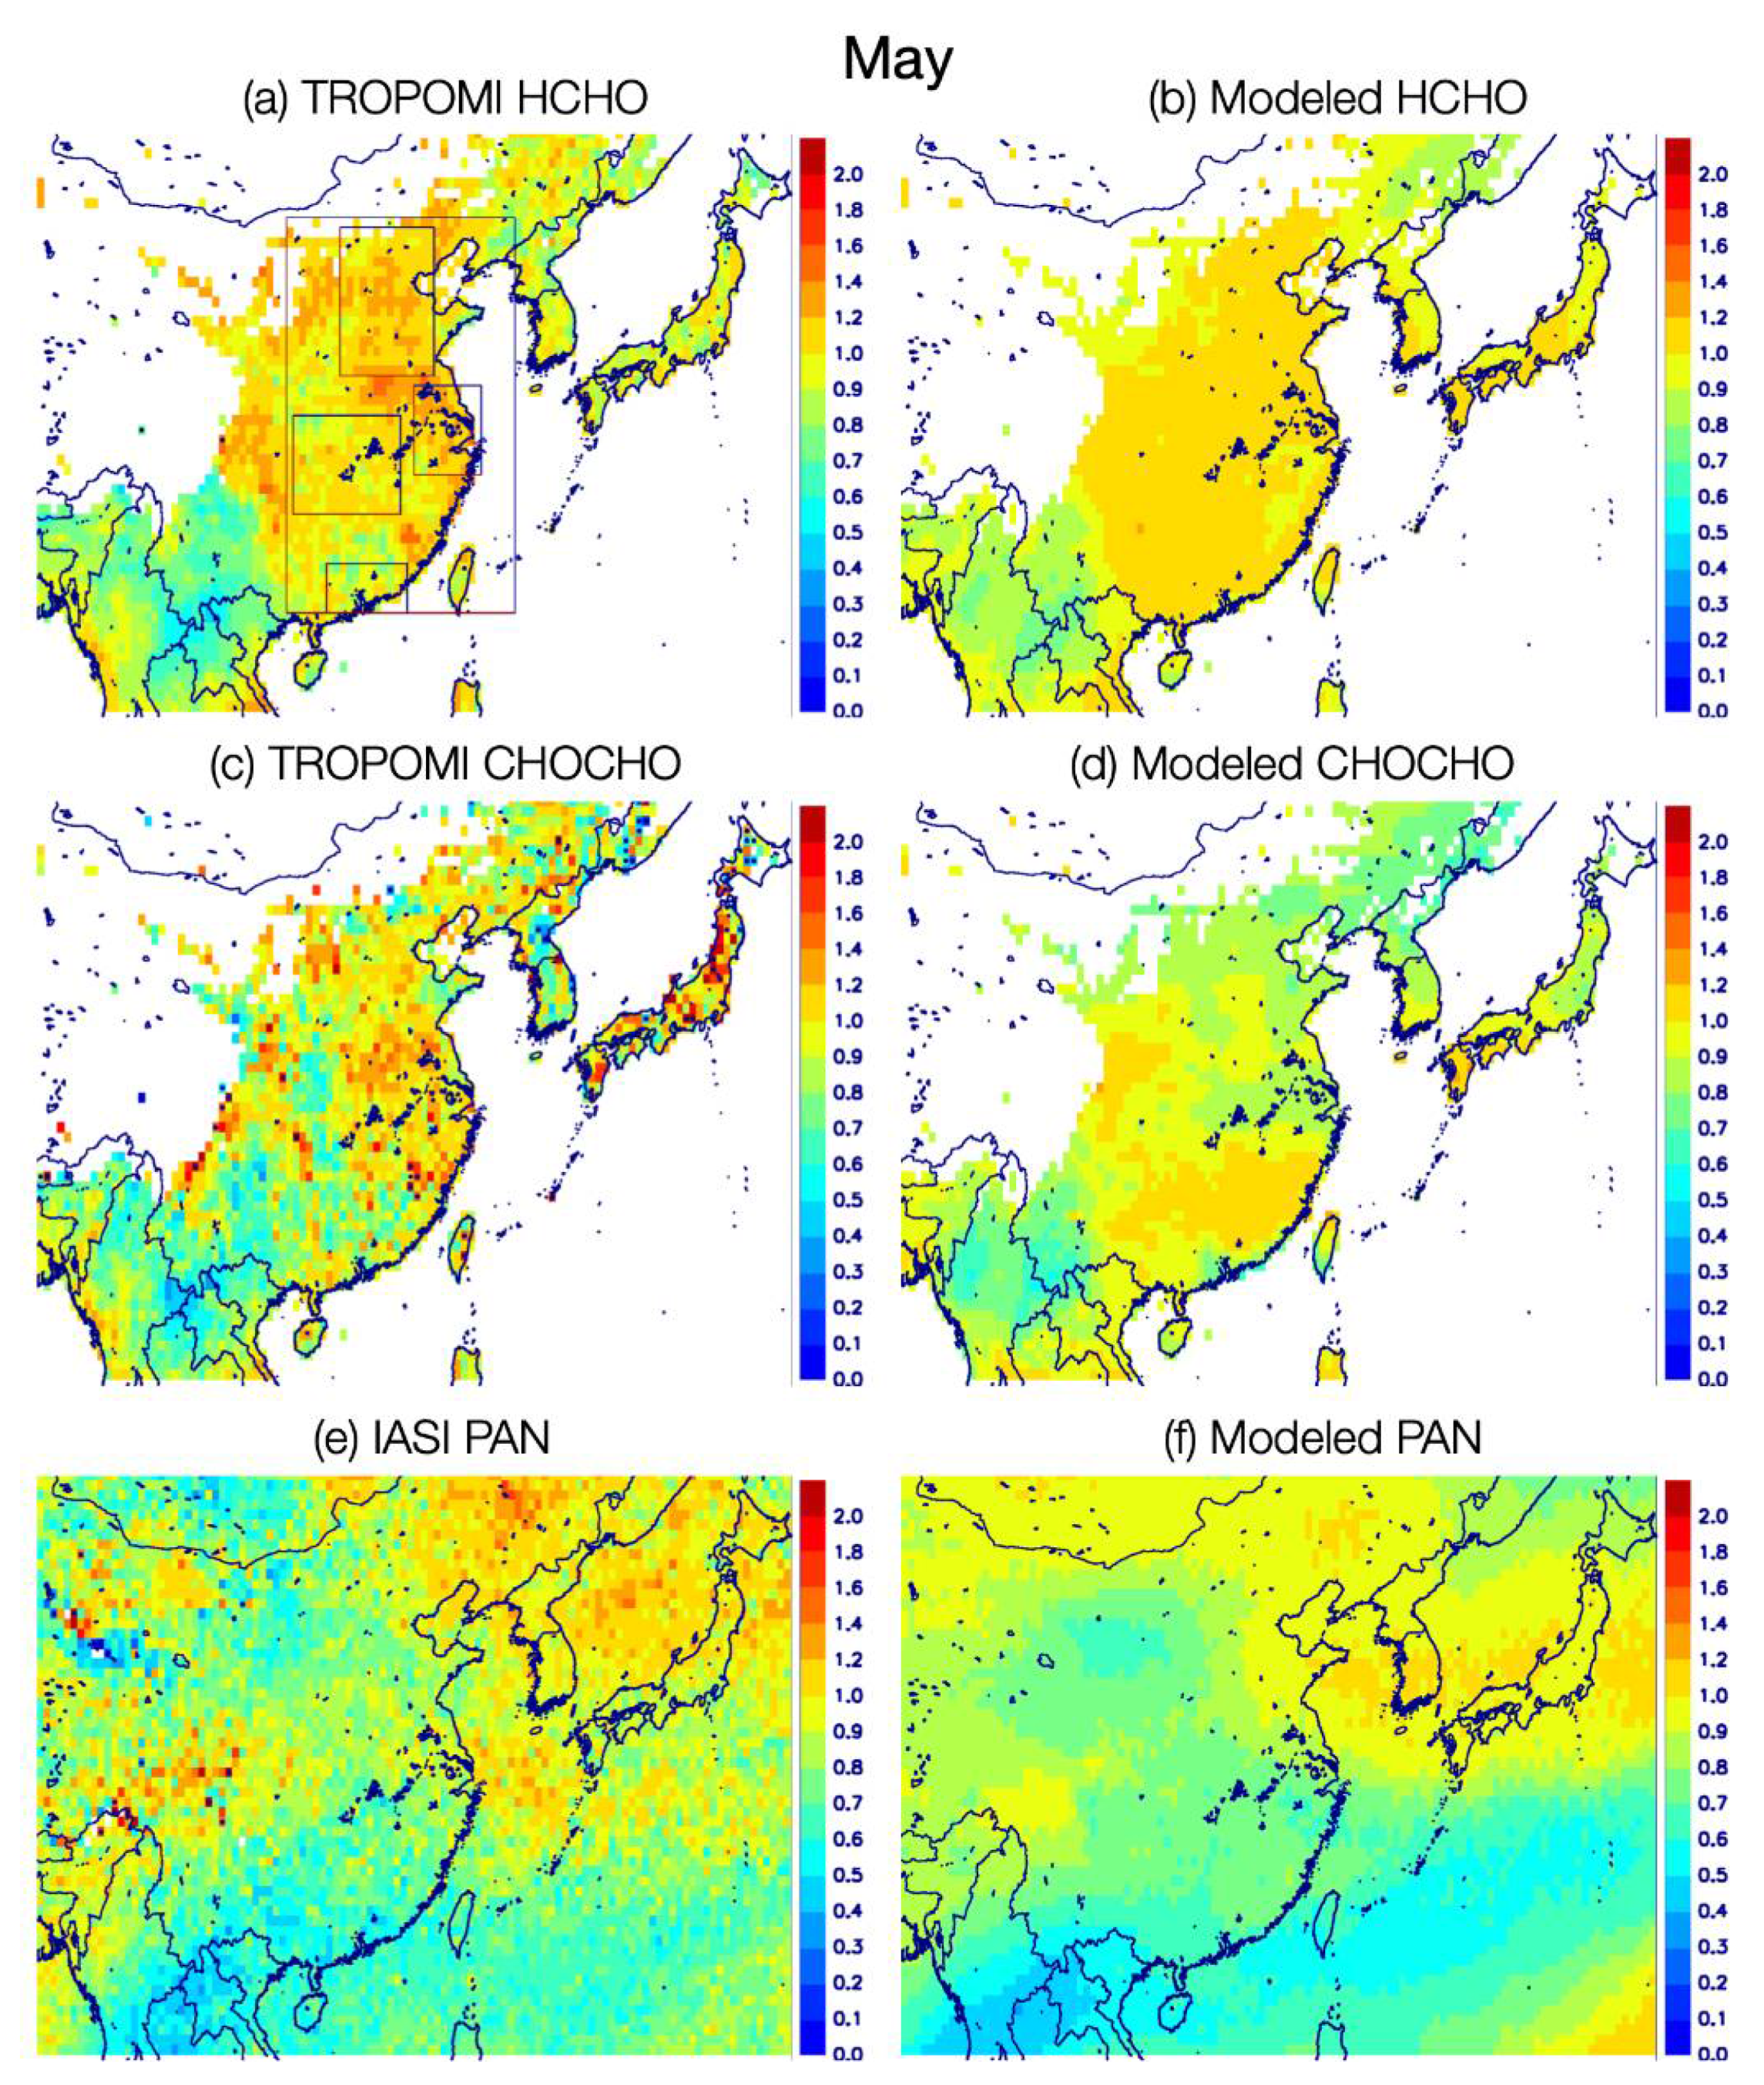
The observed distributions of HCHO, CHOCHO, and PAN columns in May 2020 and the corresponding model results are shown in Figure 6, and the ratios of the 2020 columns to those of 2019 are depicted in Figure 7. The comparisons for HCHO columns (Figure 6c,d) show a good agreement in terms of spatial distribution, but also a model overprediction by 20–40% over emission regions. This is in line with the low bias of about 30% of TROPOMI HCHO columns against ground-based FTIR measurements for high HCHO levels (>8 × 10¹⁵ molec.cm−2) [34]. Accounting for this data bias would have improved the agreement with the model, but would have had little influence on the difference between the two years.
The observed and modeled HCHO column ratios are slightly higher than unity (Figure 7a,b), except over Yunnan and northern Myanmar, where the low pyrogenic and biogenic VOC emissions in 2020 lead to significant HCHO reductions. Over eastern China, the increase is estimated at 5% on average by R1, in excellent match with the observation (6%, Table 2) although TROPOMI displays a higher variability of column ratios. The observed spatial heterogeneity is not well represented in the model in May, a feature that has been found also in February and also reported in [13]. The column increase derived in spite of the lower 2020 anthropogenic VOC emissions can be attributed to meteorology, as shown by the R5 simulation results displaying a 4% increase in the columns. The estimated change in the R2 scenario using baseline emissions is 8%, suggesting that the impact of the emissions decline due to the pandemic is about −3% for this month. Besides those increases, HCHO decreases are observed in Yunnan and in northern Indochina (18–28° N, 92–104° E), in good agreement with model results (Figure 7a,b). In this region, anthropogenic VOC fluxes are low and HCHO is chiefly formed from biogenic VOC oxidation and fire events. Therefore, the observed column differences stem mostly from differences in these source categories. The emission inventories used in MAGRITTEv1.1 indicate lower biogenic and fire fluxes in May 2020 than in May 2019 in this region, by 15% and 38%, respectively. The negative change calculated by the model (−15%) is weaker than in the observations (−24%), suggesting underestimated differences in biogenic and/or fire fluxes between the two years. This conclusion is comforted by comparison between observed and modeled ratios for CHOCHO over the same region (Figure 7c,d).
The TROPOMI CHOCHO observations in May 2020 are fairly well reproduced by the R1 results over eastern China (Figure 6e,f). Hotspots are found over densely populated megacities and industrial hubs, like the Yangtze River Delta, the Chengdu-Chongqing urban cluster, and the Pearl River Delta, primarily due to anthropogenic VOC precursors, in particular aromatic compounds used in solvents and other industrial processes [54]. Over eastern China, the model does not match the spatial patterns of the observed column ratios (Figure 7c,d). The simulated CHOCHO decreases in central and northern China, due to anthropogenic emission reductions, and the column increases in southern China, due to higher isoprene flux in 2020 (Figure 1d), are not seen in the satellite data (Figure 7c,d). An overestimation of isoprene fluxes in 2020 relative to 2019 in the model was also suggested by HCHO in that area (Figure 7a,b).
IASI detects high PAN levels of about 6–8 × 10¹⁵ molec.cm−2 over eastern China in May 2020, in good consistency with the model results over land (Figure 6g,h). Note that because of the weak, broadband spectral signatures of PAN and of the lower thermal contrast over sea, oceanic retrievals are more uncertain. The PAN distribution suggests a large anthropogenic contribution, consistent with the strong anthropogenic signals in the distribution of NO2 and HCHO. The model succeeds in reproducing the observed high PAN levels in Northern China and in the Chengdu-Chongqing area, where human activities are dominant. The observed enhancements over Assam (India) and Myanmar are due to biogenic emissions (over Myanmar) and anthropogenic emissions (over India) (Figure 6g). As shown in Figure 7e,f, the observed and modeled PAN ratios are in fair agreement in both distribution and magnitude. The relative change over eastern China according to IASI (−21%) and the model (−19%) are very similar. According to model results, about half of the PAN decrease is due to meteorological variability (Table 2, runs R1 and R5), whereas the anthropogenic NOx and VOC reductions led to PAN column declines of about 3% and 5%, respectively (runs R3 and R4 in comparison with R1).
Finally, sensitivity simulations suggest that the reduction in anthropogenic VOC fluxes in 2020 relative to 2019 leads to column reductions of 5% or less for HCHO (difference between R4 and R1 estimates, Table 2), between 12% (May) and 23% (February) for CHOCHO and 5–8% for PAN. The larger changes for CHOCHO are expected because of the strong contribution of anthropogenic VOC oxidation to the CHOCHO budget over China [50,55]. The NOx level decline due to the pandemic also contributes to the reduction in the columns of HCHO (by 1–3%) and PAN (3–4%), whereas their impact on CHOCHO appears negligible (Table 2, columns R1 and R3).

4. Discussion

When using the CONFORM database, and in agreement with the observations, the simulated combined effect of meteorology and emission reductions is strongest for NO2 between February 2020 and 2019 (−40% on average over Eastern China), especially in the NCP. The magnitude of this change compares well with recent modelling studies, e.g., the investigation of surface pollutants changes using the CAM-Chem model by [14] and the regression model study based on OMI observations by [7]. Meteorology explains a small part of this change (−5%, run R5), due to warmer and moister conditions in 2020 [6] leading to a shorter chemical NOx lifetime. The major contribution to the NO2 reduction originates from the pandemic-induced emission decreases (−34%, difference between R2 and R1 in Table 2). The reduction of VOC emissions is found to have a small offsetting effect (+1.2%, difference between R4 and R1 in Table 2) due to the decreased sink through organic nitrate and peroxyacetyl nitrate formation [13]. Similar results are found in May, with the effect of the reduced emissions explaining about 70% of the column decrease.
In the case of HCHO, the effects of the lockdowns are much smaller than for NO2, and are estimated at −8% in February and at −3% in May (Table 2, difference between R2 and R1). Meteorology has a significant impact, −6% in February. [28] also reported meteorological impacts (−6% in the NCP) being of the same order as those of emissions, although these conclusions are not strictly comparable to ours since their study was based on January–April averages. In the Beijing area, HCHO columns were higher in February 2020 than in 2019, which is well simulated by R1 (Figure 5). The authors of [28] attribute this increase to enhanced OH levels as a result of NOx emission decreases. Although boundary layer OH levels were indeed higher in 2020 (>50% compared to 2019) in the R1 run, this effect explains only a small part of the HCHO enhancement in February, as shown by the very similar distribution of the column ratios calculated in the R5 simulation adopting identical emissions in 2019 and 2020 (not shown).
The impact of the emission decreases is more significant for CHOCHO than for HCHO columns. Based on the R1 and R2 simulations, we estimate the column decrease over eastern China at 21% and 6% for February and May, respectively. The model overestimates the column decrease between the two years, which might indicate an overestimation of the anthropogenic contribution to the CHOCHO budget, or issues in the chemical mechanism for glyoxal formation adopted in the model for aromatic compounds.
Finally, based on the sensitivity simulations (Table 2), the lockdowns in 2020 have led to PAN column decreases of −12% and −8% in February and May, respectively, while these changes become smaller when anthropogenic VOC fluxes are kept fixed for both years (−8% in February and −5% in May), and are even smaller when the anthropogenic NOx emissions are fixed (−3%). This underscores the importance of anthropogenic VOCs in the PAN budget according to the model in this region, and is to a large degree corroborated by the changes in satellite observations between the two years.

5. Conclusions

Spaceborne data of NO2 and oxygenated VOCs complemented by MAGRITTEv1.1 simulation were used to investigate atmospheric composition changes in China during the stringent lockdown of February 2020 and during the recovery phase in May 2020. The lockdown-related emission reductions from the CONFORM dataset were implemented in these simulations. Relative to 2019, the model succeeds in reproducing the observed NO2 column changes of −40% in February and −15% in May over eastern China, and goes a long way towards explaining the observed changes of oxygenated VOCs including HCHO, CHOCHO, and PAN. For those species, the observed changes are generally weaker than for NO2. Besides the response to changes in anthropogenic fluxes, the oxidized VOCs are also affected by biomass burning and biogenic sources. The observed column ratios between 2020 and 2019 reflect primarily the differences in these sources between the two years. In an average sense, these differences are well captured by the model. The observations show a larger variability of column changes, likely due in part to model issues (e.g., due to errors in meteorological fields, in emissions, etc.) but also to noise and biases in the observations.

Author Contributions

Conceptualization, T.S. and J.-F.M.; methodology, T.S.; software, J.-F.M.; satellite data provision, I.D.S., C.L., M.V.R., B.F., L.C., P.-F.C. and C.C.; provision of emission inventory, T.D., N.E., S.D., and C.G.; investigation, T.S., J.-F.M., Y.L., T.W., M.B., X.S., B.G., S.T. and G.B.; writing—original draft preparation, T.S.; writing—review and editing, all co-authors; visualization, T.S. and M.B.; All authors have read and agreed to the published version of the manuscript.

Funding

This research has been funded by the TROVA-E2 (2019–2023) project of the European Space Agency funded by the Belgian Science Policy Office (BELSPO), and the GLYRETRO (2019–2021) and ICOVAC (2020–2021) projects funded by the European Space Agency (ESA). BIRA-IASB acknowledges national funding from BELSPO and ESA through the ProDEx TRACE-S5P project. This work includes modified Copernicus Sentinel-5 Precursor satellite data post-processed by BIRA-IASB. TROPOMI HCHO developments are carried out in the frame of the Copernicus Sentinel-5 Precursor Mission Performance Centre (S5p MPC), contracted by ESA/ESRIN (Contract No. 4000117151/16/I-LG) and supported by BELSPO, BIRA-IASB, and the German Aerospace Centre (DLR). IASI is a joint mission of Eumetsat and the Centre National d’Etudes Spatiales (CNES, France). Development of the IASI PAN product has been supported by the project OCTAVE of the Belgian Research Action through Interdisciplinary Networks (BRAIN-be; 2017–2021; Research project BR/175/A2/OCTAVE) and by the IASI.Flow Prodex arrangement (ESA-BELSPO). L. Clarisse is a research associate supported by the F.R.S.-FNRS. The CAMS-GLOB-ANT dataset has been developed with the support of the CAMS (Copernicus Atmosphere Monitoring Service), operated by the European Centre for Medium-Range Weather Forecasts on behalf of the European Commission as part of the Copernicus Programme. T. Wang and Y. Liu acknowledge support by the Hong Kong Research Grants Council (T24-504/17-N and A-555PolyU502/16). The work has been partly supported by the National Center for Atmospheric Research (NCAR), which is a major facility sponsored by the National Science Foundation under cooperative agreement n° 1852977.

Institutional Review Board Statement

Not applicable.

Informed Consent Statement

Not applicable.

Data Availability Statement

This work uses TROPOMI NO2 modified Copernicus Sentinel data for 2019-2020. TROPOMI NO2 data version 1.2.2 and 1.3.0 are available at the Copernicus Open Access Hub https://s5phub.copernicus.eu (accessed in 15 May 2021). TROPOMI HCHO data are available at the same web portal. Access to TROPOMI CHOCHO data is granted via https://glyretro.aeronomie.be (accessed on 21 July 2021). The IASI PAN data used in this study are publicly available on Zenodo (https://doi.org/10.5281/zenodo.4743090, accessed on 21 July 2021). The CONFORM dataset is available at https://doi.org/10.25326/88 (accessed on 21 July 2021).

Conflicts of Interest

The authors declare no conflict of interest.

Appendix A

The TROPOMI HCHO retrieval algorithm is based on a 3-step DOAS (Differential Optical Absorption Spectroscopy) method: (1) the fit of the HCHO slant columns in the measured Earth radiance spectra, (2) radiative transfer calculation of air mass factors (AMFs), and (3) a background correction of the columns based on the observations in a reference sector, the Pacific Ocean [32]. The fit of the slant columns (Ns) is performed in the UV spectral window between 328.5 and 359 nm. The HCHO cross-section is taken from [56]. All cross-sections have been pre-convolved for every row separately with an instrumental slit function adjusted just after launch. The DOAS reference spectrum is updated daily with an average of Earth radiances selected in the Equatorial Pacific region on the previous days. The result of the fit is a differential slant column. The conversion from slant (Ns) to tropospheric columns (Nv) is performed using a look-up table of vertically resolved air mass factors (M) calculated at 340 nm with the radiative transfer model VLIDORT v2.6 [57]. Entries for each ground pixel are the observation geometry, the surface elevation and reflectivity and a priori tropospheric profiles. The surface albedo is taken from the monthly OMI albedo climatology at the spatial resolution of 1° [58]. Global a priori vertical profiles at 1° × 1° are provided by the TM5-MP daily forecast [59]. Cloud properties are taken from the TROPOMI operational product [60]. As baseline, a cloud correction based on the independent pixel approximation [61] is applied for cloud fractions larger than 0.1. To correct for any remaining global offset and stripes, a background correction is performed based on the HCHO slant columns in the Pacific Ocean (Ns,0) from the four previous days (operational product) or from the current day (modified product used in this study). Finally, the background vertical column of HCHO, due to the methane oxidation, is obtained from TM5-MP in the reference region (Nv,0CTM). The tropospheric HCHO vertical column is expressed as follows: Nv = (Ns − Ns,0)/M + (M0/M) Nv,0CTM, where M0 is the air mass factor in the reference sector. To derive the clear sky tropospheric columns, we apply a simple transformation using the cloud-corrected AMFs and the clear-sky AMFs (no cloud correction applied): Nv_clear = (M/Mclear) Nv. Differences between TROPOMI HCHO Nv and Nv_clear are small, especially since we applied a strict cloud filtering. This transformation allows one to avoid possible biases coming from the use of different cloud products (between TROPOMI HCHO or with other satellite datasets) or changes in the cloud product version. We used data with quality assurance values higher than 0.5 to filter out most observations presenting a solar zenith angle larger than 70°, a cloud radiance fraction at 340 nm larger than 0.6 or an air mass factor smaller than 0.1 or other errors. In this study, we further restricted data to measurements with a cloud fraction lower than 20%.
For each observation: the tropospheric column uncertainty comprises a random and systematic component. In remote regions, the random uncertainty of an individual observation is estimated at 5 × 10¹⁵ molec.cm−2. It is significantly improved upon data averaging, e.g., it is estimated at 1.3 × 10¹⁵ molec.cm−2 at a spatial resolution of 20 km on a daily basis [34]. Additional noise originating from AMF variability and from natural variability (in space, from day to day, and from seasonal and interannual changes) needs to be considered when studying continental emissions. Over polluted sites, the random uncertainty is estimated at 8 × 10¹⁵ molec.cm−2 for individual pixels, while at 20 km resolution, it is improved to 4.8 × 10¹⁵ molec.cm−2 on a daily basis and to 1.5 × 10¹⁵ molec.cm−2 for monthly averaged columns [33].

Appendix B

Like for HCHO, the CHOCHO retrieval algorithm relies on a three-step DOAS approach described in the previous section. The interval 435–460 nm is used for retrieving the slant columns. In addition to the CHOCHO, the fit includes absorption by NO2 (at 220 K and 294 K), O3, O2-O2, water vapor, and liquid water, as well as spectral signatures from inelastic scattering and residual stray light. The fit also accounts for perturbations of the instrumental slit function due to heterogeneity of the scene brightness. Additional parameters allow ensuring an optimal alignment between the measured Earthshine radiance and the DOAS reference spectrum. Every TROPOMI detector row, corresponding to the position of a pixel within the swath of the instrument, has a slightly different spectral resolution to which cross-sections are pre-convolved. To minimize the presence of row-dependent biases, the DOAS reference spectra (also one per row) is taken as the mean of a set of Earthshine spectra recorded on the same day in a remote region (here the Equatorial Pacific Ocean, 15° S–15° N, 180°–240° E), where the CHOCHO abundances are expected to be low.
The CHOCHO air mass factors are computed as for HCHO by combining box-air mass factors appropriately extracted from a precomputed look-up table at 448 nm with a priori CHOCHO vertical profiles. The latter are provided by the MAGRITTEv1.1 global CTM at 1° × 1°. Over oceans, instead of using the CTM profiles, we use a fixed a priori profile measured by an air-borne MAX-DOAS instrument during the TORERO campaign over the Pacific [62]. For CHOCHO, no cloud correction is applied, but instead a simple and stringent cloud filtering with cloud fractions lower than 20%. Measurements over pixels covered by snow or ice are rejected.
A background correction is also required for CHOCHO, since its weak absorption leads to systematic biases due to spectral interferences with signatures from other species or from calibration limitations. This scheme consists in adding (row-dependent) offsets to the CHOCHO slant columns so that the mean value of the vertical columns retrieved in the Pacific matches a reference value. Contrary to HCHO, this reference value cannot be provided by a model as model predictions differ significantly from the few CHOCHO measurements reported in oceanic regions (e.g., [63,64]). Instead, we simply used 1 × 10¹⁴ molec.cm−2 as the reference value.
Random and systematic errors are estimated and provided for every satellite observation. The random component is dominated by the instrumental noise propagating in the retrieval. For clear sky scenes, it is generally in the range of 6–10 × 1014 molec.cm−2. For individual observations, the random error dominates the error budget and generally hides the possible real CHOCHO signal. Spatiotemporal averaging is used to minimize this random error component. Total systematic errors are estimated by considering the different error sources in the different algorithmic steps (e.g., input albedo data, a priori profiles, background correction scheme, reference sector value, etc.), which sum up to a total systematic error in the range of 1–3 × 10¹⁴ molec.cm−2, corresponding to about 30–70% for emission regimes [35].

Appendix C

Thanks to the continuous coverage across the thermal infrared spectrum offered by IASI (645–2760 cm−1) combined with a fairly high spectral resolution (0.5 cm−1, apodized) and a low radiometric noise, the detection of a large suite of atmospheric trace gases has been made possible [65]. For an increasing number of them, (quasi-)global distributions of their atmospheric abundance are being derived from IASI spectra using fast retrieval methods. In particular, the general framework Artificial Neural Network for IASI (ANNI) has recently allowed the retrieval of global column measurements of ammonia [36,37], and of several VOCs [38,39,40].
The first step of the ANNI retrieval consists in calculating a Hyperspectral Range Index (HRI), which quantifies for each individual IASI observation the magnitude of the spectral absorption of a target gas within a specific spectral band. Because it exploits many channels sensitive to the target compound within that range, the HRI is well suited for the detection of weak, broadband absorbers such as PAN. An artificial feedforward neural network (NN) is then used to convert this index into the gas total column abundance. Along with a series of variables characterizing the state of the surface and atmosphere, the HRI value feeds a NN trained specifically to mimic the interconnections between all these variables and the gas total column ([38,66] and references therein).
The PAN product used in this study has been retrieved with the version 3 of the ANNI framework [38], using surface and atmospheric variables from the European Centre for Medium-range Weather Forecasts (ECMWF) ERA5 reanalysis [41]. The use of the ERA5 dataset ensures consistency in input fields throughout the IASI operational time period. The HRI uses the PAN absorptions in the 760–880 cm−1 spectral range, around its ν16 NO2 stretch band centered at 794 cm−1. ANNI is made of two computational layers with eight nodes showed excellent training performance and was adopted to produce PAN total columns [38]. Filtering prior to the retrieval excluded observational scenes with a cloud cover exceeding 10%, whereas retrieved columns associated with unsatisfactory sensitivity or poor retrieval performance were discarded from the final dataset. An uncertainty associated with each retrieved column was also generated by the NN. The typical uncertainty on the individual PAN column usually ranges between 1 × 10¹⁵ and 3 × 10¹⁵ molec.cm−2, and can reach 4 × 10¹⁵ molec.cm−2 for observation scenes affected by residual clouds or weak thermal contrast. Thanks to the high spatial sampling and daily occurrence of the IASI measurements, these uncertainties are reduced substantially upon spatial and/or temporal averaging.
IASI PAN total columns have been retrieved since October 2007 and March 2013 to the present from the IASI/Metop-A and -B observations, respectively, and daily (quasi-)global PAN distributions are available over this time period. Analysis of the retrieved product revealed a good agreement between the measurements from the a.m. and p.m. satellite overpasses, which can therefore be used together.

Appendix D

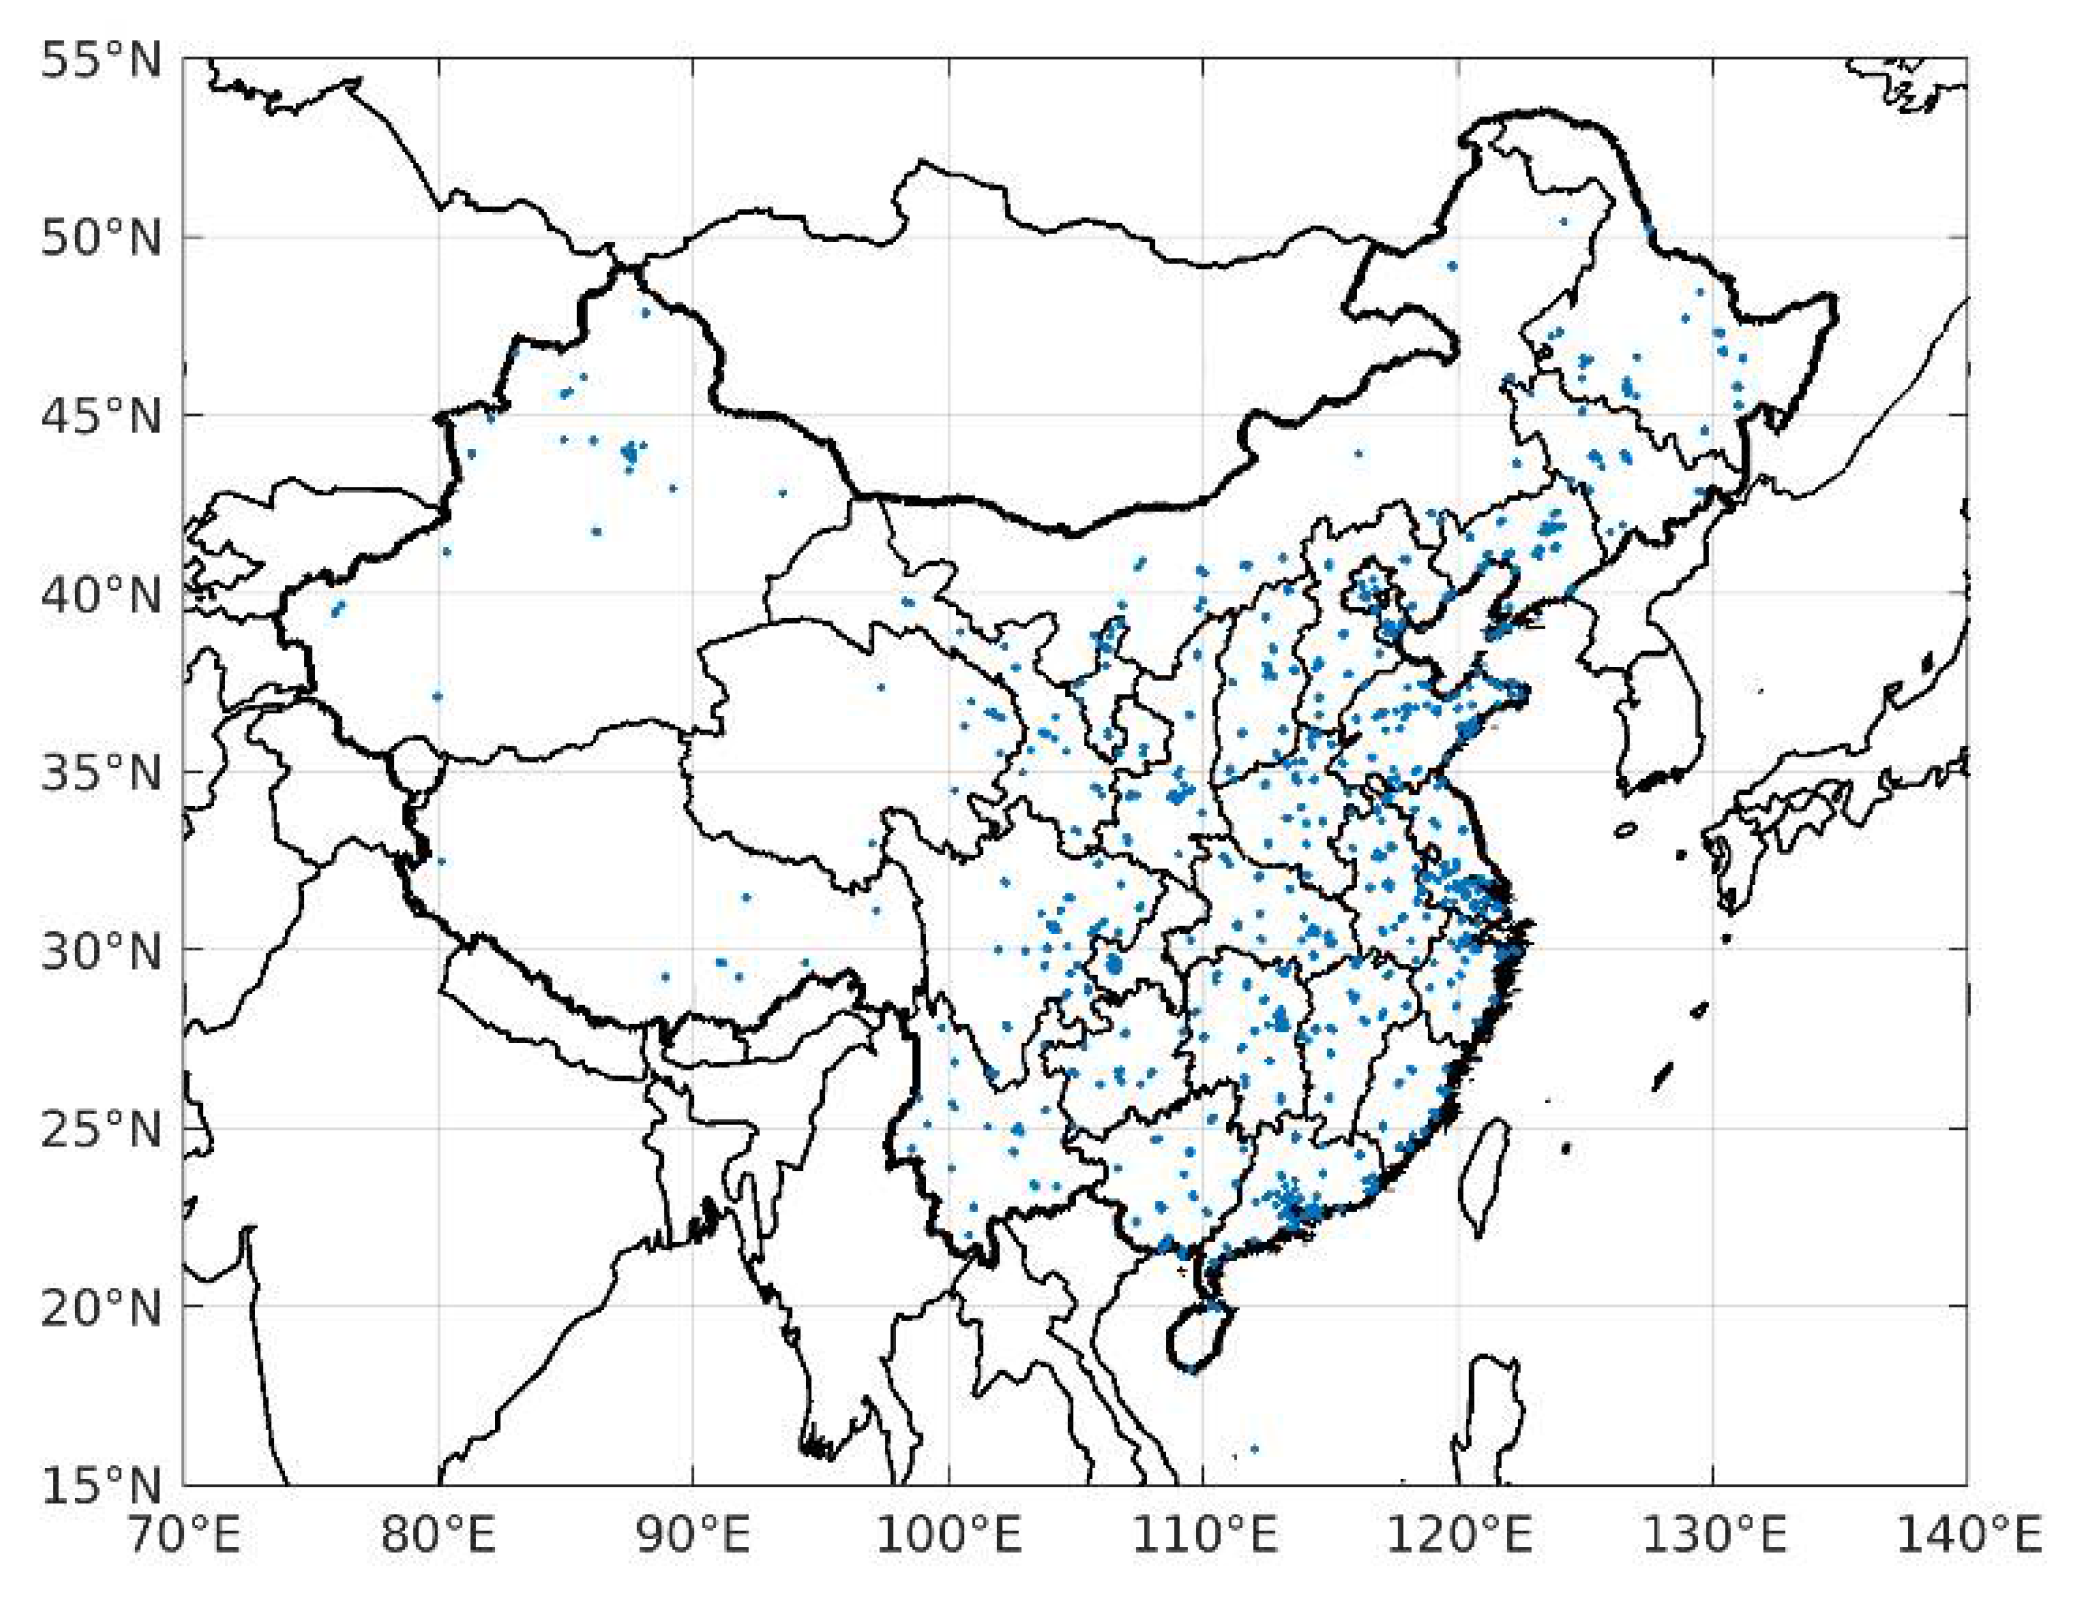
Figure A1. Location of 1643 environmental monitoring stations of the China National Environmental Monitoring Center operated by the Ministry of Ecology and Environmental Protection of China. The data is available at http://106.37.208.233:20035 (accessed on 21 July 2021) [48]. Data quality control has been applied to the measurements following [49]. To allow meaningful comparisons between the in situ NO2 data and the TROPOMI columns, we considered only in situ data within a two-hour time-window around the TROPOMI overpass time (12–2 p.m. local time).
Atmosphere 12 00946 g0a1

References

  1. Gkatzelis, G.I.; Gilman, J.B.; Brown, S.S.; Eskes, H.; Gomes, A.R.; Lange, A.C.; McDonald, B.C.; Peischl, J.; Petzold, A.; Thompson, C.R.; et al. The global impacts of COVID-19 lockdowns on urban air pollution. Elem. Sci. Anthr. 2021, 9, 00176. [Google Scholar] [CrossRef]
  2. Zhang, R.; Zhang, Y.; Lin, H.; Feng, X.; Fu, T.-M.; Wang, Y. NOx Emission Reduction and Recovery during COVID-19 in East China. Atmosphere 2020, 11, 433. [Google Scholar] [CrossRef] [Green Version]
  3. Shi, X.; Brasseur, G.P. The Response in Air Quality to the Reduction of Chinese Economic Activities During the COVID-19 Outbreak. Geophys. Res. Lett. 2020, 47, e2020GL088070. [Google Scholar] [CrossRef]
  4. Liu, T.; Wang, X.; Hu, J.; Wang, Q.; An, J.; Gong, K.; Sun, J.; Li, L.; Qin, M.; Li, J.; et al. Driving Forces of Changes in Air Quality during the COVID-19 Lockdown Period in the Yangtze River Delta Region, China. Environ. Sci. Technol. Lett. 2020, 7, 779–786. [Google Scholar] [CrossRef]
  5. Bao, R.; Zhang, A. Does lockdown reduce air pollution? Evidence from 44 cities in northern China. Sci. Total Environ. 2020, 731, 139052. [Google Scholar] [CrossRef] [PubMed]
  6. Bauwens, M.; Compernolle, S.; Stavrakou, T.; Müller, J.; Van Gent, J.; Eskes, H.; Levelt, P.F.; Van Der A, R.; Veefkind, J.P.; Vlietinck, J.; et al. Impact of Coronavirus Outbreak on NO 2 Pollution Assessed Using TROPOMI and OMI Observations. Geophys. Res. Lett. 2020, 47, e2020GL087978. [Google Scholar] [CrossRef] [PubMed]
  7. Diamond, M.S.; Wood, R. Limited Regional Aerosol and Cloud Microphysical Changes Despite Unprecedented Decline in Nitrogen Oxide Pollution During the February 2020 COVID-19 Shutdown in China. Geophys. Res. Lett. 2020, 47, e2020GL088913. [Google Scholar] [CrossRef]
  8. Huang, G.; Sun, K. Non-negligible impacts of clean air regulations on the reduction of tropospheric NO2 over East China during the COVID-19 pandemic observed by OMI and TROPOMI. Sci. Total Environ. 2020, 745, 141023. [Google Scholar] [CrossRef]
  9. Miyazaki, K.; Bowman, K.; Sekiya, T.; Jiang, Z.; Chen, X.; Eskes, H.; Ru, M.; Zhang, Y.; Shindell, D. Air Quality Response in China Linked to the 2019 Novel Coronavirus (COVID-19) Lockdown. Geophys. Res. Lett. 2020, 47, e2020GL089252. [Google Scholar] [CrossRef]
  10. Ding, J.; Van Der A, R.J.; Eskes, H.J.; Mijling, B.; Stavrakou, T.; Van Geffen, J.H.G.M.; Veefkind, J.P. NOx Emissions Reduction and Rebound in China Due to the COVID-19 Crisis. Geophys. Res. Lett. 2020, 47, e2020GL089912. [Google Scholar] [CrossRef]
  11. Zhang, Q.; Pan, Y.; He, Y.; Walters, W.W.; Ni, Q.; Liu, X.; Xu, G.; Shao, J.; Jiang, C. Substantial nitrogen oxides emission reduction from China due to COVID-19 and its impact on surface ozone and aerosol pollution. Sci. Total Environ. 2021, 753, 142238. [Google Scholar] [CrossRef]
  12. Doumbia, T.; Granier, C.; Elguindi, N.; Bouarar, I.; Darras, S.; Brasseur, G.; Gaubert, B.; Liu, Y.; Shi, X.; Stavrakou, T.; et al. Changes in global air pollutant emissions during the COVID-19 pandemic: A dataset for atmospheric chemistry modeling. Earth Syst. Sci. Data Discuss. 2021, preprint. [Google Scholar] [CrossRef]
  13. Li, K.; Jacob, D.J.; Liao, H.; Qiu, Y.; Shen, L.; Zhai, S.; Bates, K.H.; Sulprizio, M.P.; Song, S.; Lu, X.; et al. Ozone pollution in the North China Plain spreading into the late-winter haze season. Proc. Natl. Acad. Sci. USA 2021, 118, e2015797118. [Google Scholar] [CrossRef] [PubMed]
  14. Gaubert, B.; Bouarar, I.; Doumbia, T.; Liu, Y.; Stavrakou, T.; Deroubaix, A.; Darras, S.; Elguindi, N.; Granier, C.; Lacey, F.; et al. Global Changes in Secondary Atmospheric Pollutants during the 2020 COVID-19 Pandemic. J. Geophys. Res. Atmos. 2021, 126, e2020JD034213. [Google Scholar] [CrossRef] [PubMed]
  15. Griffith, S.M.; Huang, W.-S.; Lin, C.-C.; Chen, Y.-C.; Chang, K.-E.; Lin, T.-H.; Wang, S.-H.; Lin, N.-H. Long-range air pollution transport in East Asia during the first week of the COVID-19 lockdown in China. Sci. Total Environ. 2020, 741, 140214. [Google Scholar] [CrossRef]
  16. Le, T.; Wang, Y.; Liu, L.; Yang, J.; Yung, Y.L.; Li, G.; Seinfeld, J.H. Unexpected air pollution with marked emission reductions during the COVID-19 outbreak in China. Science 2020, 369, 702–706. [Google Scholar] [CrossRef]
  17. Zhao, Y.; Zhang, K.; Xu, X.; Shen, H.; Zhu, X.; Zhang, Y.; Hu, Y.; Shen, G. Substantial Changes in Nitrogen Dioxide and Ozone after Excluding Meteorological Impacts during the COVID-19 Outbreak in Mainland China. Environ. Sci. Technol. Lett. 2020, 7, 402–408. [Google Scholar] [CrossRef]
  18. Miller, C.C.; Jacob, D.J.; Marais, E.A.; Yu, K.; Travis, K.R.; Kim, P.S.; Fisher, J.A.; Zhu, L.; Wolfe, G.M.; Hanisco, T.F.; et al. Glyoxal yield from isoprene oxidation and relation to formaldehyde: Chemical mechanism, constraints from SENEX aircraft observations, and interpretation of OMI satellite data. Atmos. Chem. Phys. 2017, 17, 8725–8738. [Google Scholar] [CrossRef] [Green Version]
  19. Fischer, E.V.; Jacob, D.J.; Yantosca, R.M.; Sulprizio, M.P.; Millet, D.B.; Mao, J.; Paulot, F.; Singh, H.B.; Roiger, A.; Ries, L.; et al. Atmospheric peroxyacetyl nitrate (PAN): A global budget and source attribution. Atmos. Chem. Phys. 2014, 14, 2679–2698. [Google Scholar] [CrossRef] [Green Version]
  20. Stavrakou, T.; Müller, J.-F.; Boersma, K.F.; Van Der A, R.R.; Kurokawa, J.; Ohara, T.; Zhang, Q. Key chemical NOx sink uncertainties and how they influence top-down emissions of nitrogen oxides. Atmos. Chem. Phys. 2013, 13, 9057–9082. [Google Scholar] [CrossRef] [Green Version]
  21. Stavrakou, T.; Müller, J.-F.; De Smedt, I.; Van Roozendael, M.; van der Werf, G.; Giglio, L.; Guenther, A. Evaluating the performance of pyrogenic and biogenic emission inventories against one decade of space-based formaldehyde columns. Atmos. Chem. Phys. 2009, 9, 1037–1060. [Google Scholar] [CrossRef] [Green Version]
  22. Stavrakou, T.; Müller, J.-F.; De Smedt, I.; Van Roozendael, M.; Kanakidou, M.; Vrekoussis, M.; Wittrock, F.; Richter, A.; Burrows, J.P. The continental source of glyoxal estimated by the synergistic use of spaceborne measurements and inverse modelling. Atmos. Chem. Phys. 2009, 9, 8431–8446. [Google Scholar] [CrossRef] [Green Version]
  23. Veefkind, J.P.; Aben, I.; McMullan, K.; Föorster, H.; de Vries, J.; Otter, G.; Claas, J.; Eskes, H.; De Haan, J.F.; Kleipool, Q.; et al. TROPOMI on the ESA Sentinel-5 Precursor: A GMES mission for global observations of the atmospheric com-position for climate, air quality and ozone layer applications. Remote Sens. Environ. 2012, 120, 70–83. [Google Scholar] [CrossRef]
  24. Clerbaux, C.; Boynard, A.; Clarisse, L.; George, M.; Hadji-Lazaro, J.; Herbin, H.; Hurtmans, D.J.; Pommier, M.; Razavi, A.; Turquety, S.; et al. Monitoring of atmospheric composition using the thermal infrared IASI/MetOp sounder. Atmos. Chem. Phys. 2009, 9, 6041–6054. [Google Scholar] [CrossRef] [Green Version]
  25. Palmer, P.I.; Abbot, D.S.; Fu, T.-M.; Jacob, D.J.; Chance, K.; Kurosu, T.P.; Guenther, A.; Wiedinmyer, C.; Stanton, J.C.; Pilling, M.J.; et al. Quantifying the seasonal and interannual variability of North American isoprene emissions using satellite observations of the formaldehyde column. J. Geophys. Res. Atmos. 2006, 111. [Google Scholar] [CrossRef] [Green Version]
  26. Marais, E.A.; Jacob, D.J.; Kurosu, T.P.; Chance, K.; Murphy, J.G.; Reeves, C.; Mills, G.; Casadio, S.; Millet, D.B.; Barkley, M.P.; et al. Isoprene emissions in Africa inferred from OMI observations of formaldehyde columns. Atmos. Chem. Phys. 2012, 12, 6219–6235. [Google Scholar] [CrossRef] [Green Version]
  27. Bauwens, M.; Stavrakou, T.; Müller, J.-F.; De Smedt, I.; Van Roozendael, M.; van der Werf, G.; Wiedinmyer, C.; Kaiser, J.W.; Sindelarova, K.; Guenther, A. Nine years of global hydrocarbon emissions based on source inversion of OMI formaldehyde observations. Atmos. Chem. Phys. 2016, 16, 10133–10158. [Google Scholar] [CrossRef] [Green Version]
  28. Sun, W.; Zhu, L.; De Smedt, I.; Bai, B.; Pu, D.; Chen, Y.; Shu, L.; Wang, D.; Fu, T.-M.; Wang, X.; et al. Global Significant Changes in Formaldehyde (HCHO) Columns Observed From Space at the Early Stage of the COVID-19 Pandemic. Geophys. Res. Lett. 2021, 48, 2e020GL091265. [Google Scholar] [CrossRef] [PubMed]
  29. Müller, J.-F.; Stavrakou, T.; Peeters, J. Chemistry and deposition in the Model of Atmospheric composition at Global and Regional scales using Inversion Techniques for Trace gas Emissions (MAGRITTE v1.1)—Part A. Chemical mechanism. Geosci. Model Dev. 2019, 12, 2307–2356. [Google Scholar] [CrossRef] [Green Version]
  30. Van Geffen, J.; Boersma, K.F.; Eskes, H.; Sneep, M.; ter Linden, M.; Zara, M.; Veefkind, J.P. S5P/TROPOMI NO2 slant column retrieval: Method, stability, uncertainties, and comparisons against OMI. Atmos. Meas. Tech. 2020, 13, 315–1335. [Google Scholar] [CrossRef] [Green Version]
  31. Verhoelst, T.; Compernolle, S.; Pinardi, G.; Lambert, J.-C.; Eskes, H.J.; Eichmann, K.-U.; Fjæraa, A.M.; Granville, J.; Niemeijer, S.; Cede, A.; et al. Ground-based validation of the Copernicus Sentinel-5P TROPOMI NO2 measurements with the NDACC ZSL-DOAS, MAX-DOAS and Pandonia global networks. Atmos. Meas. Tech. 2021, 14, 481–510. [Google Scholar] [CrossRef]
  32. De Smedt, I.; Theys, N.; Yu, H.; Danckaert, T.; Lerot, C.; Compernolle, S.; Van Roozendael, M.; Richter, A.; Hilboll, A.; Peters, E.; et al. Algorithm theoretical baseline for formaldehyde retrievals from S5P TROPOMI and from the QA4ECV project. Atmos. Meas. Tech. 2018, 11, 2395–2426. [Google Scholar] [CrossRef] [Green Version]
  33. De Smedt, I.; Pinardi, G.; Vigouroux, C.; Compernolle, S.; Bais, A.; Benavent, N.; Boersma, F.; Chan, K.L.; Donner, S.; Eichmann, K.U.; et al. Comparative assessment of TROPOMI and OMI formaldehyde observations against MAX-DOAS network column measurements. Atmos. Chem. Phys. Discuss. 2021, preprint. [Google Scholar] [CrossRef]
  34. Vigouroux, C.; Langerock, B.; Aquino, C.A.B.; Blumenstock, T.; Cheng, Z.; De Mazière, M.; De Smedt, I.; Grutter, M.; Hannigan, J.W.; Jones, N.; et al. TROPOMI–Sentinel-5 Precursor formaldehyde validation using an extensive network of ground-based Fourier-transform infrared stations. Atmos. Meas. Tech. 2020, 13, 3751–3767. [Google Scholar] [CrossRef]
  35. Lerot, C.; Hendrick, F.; Van Roozendael, M.; Alvarado, L.M.A.; Richter, A.; De Smedt, I.; Theys, N.; Vlietinck, J.; Yu, H.; Van Gent, J.; et al. Glyoxal tropospheric column retrievals from TROPOMI, multi-satellite intercomparison and ground-based validation. Atmos. Meas. Tech. Discuss. 2021, preprint. [Google Scholar] [CrossRef]
  36. Whitburn, S.; Van Damme, M.; Clarisse, L.; Bauduin, S.; Heald, C.L.; Hadji-Lazaro, J.; Hurtmans, D.; Zondlo, M.; Clerbaux, C.; Coheur, P.-F. A flexible and robust neural network IASI-NH3retrieval algorithm. J. Geophys. Res. Atmos. 2016, 121, 6581–6599. [Google Scholar] [CrossRef]
  37. Van Damme, M.; Whitburn, S.; Clarisse, L.; Clerbaux, C.; Hurtmans, D.; Coheur, P.-F. Version 2 of the IASI NH3 neural network retrieval algorithm: Near-real-time and reanalysed datasets. Atmos. Meas. Tech. 2017, 10, 4905–4914. [Google Scholar] [CrossRef] [Green Version]
  38. Franco, B.; Clarisse, L.; Stavrakou, T.; Müller, J.-F.; Van Damme, M.; Whitburn, S.; Hadji-Lazaro, J.; Hurtmans, D.; Taraborrelli, D.; Clerbaux, C.; et al. A general framework for global re-trievals of trace gases from IASI: Application to methanol, formic acid, and PAN. J. Geophys. Res. 2018, 123, 13963–13984. [Google Scholar] [CrossRef] [Green Version]
  39. Franco, B.; Clarisse, L.; Stavrakou, T.; Müller, J.; Pozzer, A.; Hadji-Lazaro, J.; Hurtmans, D.; Clerbaux, C.; Coheur, P. Acetone Atmospheric Distribution Retrieved from Space. Geophys. Res. Lett. 2019, 46, 2884–2893. [Google Scholar] [CrossRef] [Green Version]
  40. Franco, B.; Clarisse, L.; Stavrakou, T.; Müller, J.-F.; Taraborrelli, D.; Hadji-Lazaro, J.; Hannigan, J.W.; Hase, F.; Hurtmans, D.; Jones, N.; et al. Spaceborne measurements of for-mic and acetic acids: A global view of the regional sources. Geophys. Res. Lett. 2020, 47, e2019GL086239. [Google Scholar] [CrossRef]
  41. Hersbach, H.; Bell, B.; Berrisford, P.; Hirahara, S.; Horanyi, A.; Muñoz-Sabater, J.; Nicolas, J.; Peubey, C.; Radu, R.; Schepers, D.; et al. The ERA5 global reanalysis. Q. J. R. Meteorol. Soc. 2020, 146, 1999–2049. [Google Scholar] [CrossRef]
  42. Van Der Werf, G.R.; Randerson, J.T.; Giglio, L.; Van Leeuwen, T.T.; Chen, Y.; Rogers, B.M.; Mu, M.; Van Marle, M.J.E.; Morton, D.C.; Collatz, G.J.; et al. Global fire emissions estimates during 1997–2016. Earth Syst. Sci. Data 2017, 9, 697–720. [Google Scholar] [CrossRef] [Green Version]
  43. Stavrakou, T.; Müller, J.; Bauwens, M.; De Smedt, I.; Van Roozendael, M.; Guenther, A. Impact of Short-Term Climate Variability on Volatile Organic Compounds Emissions Assessed Using OMI Satellite Formaldehyde Observations. Geophys. Res. Lett. 2018, 45, 8681–8689. [Google Scholar] [CrossRef]
  44. Opacka, B.; Müller, J.-F.; Stavrakou, T.; Bauwens, M.; Sindelarova, K.; Markova, J.; Guenther, A.B. Global and regional impacts of land cover changes on isoprene emissions derived from spaceborne data and the MEGAN model. Atmos. Chem. Phys. 2021, 21, 8413–8436. [Google Scholar] [CrossRef]
  45. Granier, C.; Darras, S.; van der Gon, H.D.; Jana, D.; Elguindi, N.; Bo, G.; Gauss, M.; Jalkanen, J.-P.; Kuenen, J.; Liousse, C.; et al. The Copernicus Atmosphere Monitoring Service Global and Regional Emissions; Research Report; Copernicus Atmosphere Monitoring Service: Reading, UK, 2019. [Google Scholar]
  46. Elguindi, N.; Granier, C.; Stavrakou, T.; Darras, S.; Bauwens, M.; Cao, H.; Chen, C.; van der Gon, H.A.C.D.; Dubovik, O.; Fu, T.M.; et al. Intercomparison of magnitudes and trends in anthropogenic surface emissions from bottom-up inventories, top-down estimates and emission scenarios. Earth’s Future 2020, 8, e2020EF001520. [Google Scholar] [CrossRef]
  47. Zheng, B.; Tong, D.; Li, M.; Liu, F.; Hong, C.; Geng, G.; Li, H.; Li, X.; Peng, L.; Qi, J.; et al. Trends in China’s anthropogenic emissions since 2010 as the consequence of clean air actions. Atmos. Chem. Phys. 2018, 18, 14095–14111. [Google Scholar] [CrossRef] [Green Version]
  48. Liu, Y.; Wang, T.; Stavrakou, T.; Elguindi, N.; Doumbia, T.; Granier, C.; Bouarar, I.; Gaubert, B.; Brasseur, G.P. Diverse response of surface ozone to COVID-19 lockdown in China. Sci. Total Environ. 2021, 789, 147739. [Google Scholar] [CrossRef]
  49. Lu, X.; Hong, J.; Zhang, L.; Cooper, O.R.; Schultz, M.G.; Xu, X.; Wang, T.; Gao, M.; Zhao, Y.; Zhang, Y. Severe Surface Ozone Pollution in China: A Global Perspective. Environ. Sci. Technol. Lett. 2018, 5, 487–494. [Google Scholar] [CrossRef]
  50. Li, J.; Zhang, M.; Tang, G.; Wu, F.; Alvarado, L.; Vrekoussis, M.; Richter, A.; Burrows, J.P. Investigating missing sources of glyoxal over China using a regional air quality model (RAMS-CMAQ). J. Environ. Sci. 2018, 71, 108–118. [Google Scholar] [CrossRef] [PubMed]
  51. Biswas, S.; Vadrevu, K.P.; Lwin, Z.M.; Lasko, K.; Justice, C.O. Factors Controlling Vegetation Fires in Protected and Non-Protected Areas of Myanmar. PLoS ONE 2015, 10, e0124346. [Google Scholar] [CrossRef] [PubMed]
  52. Silva, S.J.; Heald, C.L.; Li, M. Space-Based Constraints on Terrestrial Glyoxal Production. J. Geophys. Res. Atmos. 2018, 123, 13583–13594. [Google Scholar] [CrossRef]
  53. Al-Haschimi, A.; Aposolou, A.; Ricci, M. China’s path to normalisation in the aftermath of the COVID-19 pandemic. Econ. Bull. Artic. 2020, 6. Available online: https://EconPapers.repec.org/RePEc:ecb:ecbart:2020:0006:1 (accessed on 21 July 2021).
  54. Miller, C.C.; Jacob, D.J.; Abad, G.G.; Chance, K. Hotspot of glyoxal over the Pearl River delta seen from the OMI satellite instrument: Implications for emissions of aromatic hydrocarbons. Atmos. Chem. Phys. 2016, 16, 4631–4639. [Google Scholar] [CrossRef] [Green Version]
  55. Liu, Z.; Wang, Y.; Vrekoussis, M.; Richter, A.; Wittrock, F.; Burrows, J.P.; Shao, M.; Chang, C.-C.; Liu, S.-C.; Wang, H.; et al. Exploring the missing source of glyoxal (CHOCHO) over China. Geophys. Res. Lett. 2012, 39. [Google Scholar] [CrossRef] [Green Version]
  56. Meller, R.; Moortgat, G.K. Temperature dependence of the absorption cross sections of formaldehyde between 223 and 323 K in the wavelength range 225-375 nm. J. Geophys. Res. 2000, 105, 7089–7101. [Google Scholar] [CrossRef]
  57. Spurr, R.J.D. LIDORT and VLIDORT: Linearized pseudo-spherical scalar and vector discrete ordinate radiative transfer models for use in remote sensing retrieval problems. In Light Scattering Reviews; Kokhanovsky, A., Ed.; Springer: Berlin/Heidelberg, Germany, 2008; pp. 229–271. [Google Scholar]
  58. Kleipool, Q.L.; Dobber, M.R.; De Haan, J.F.; Levelt, P.F. Earth surface reflectance climatology from 3 years of OMI data. J. Geophys. Res. 2008, 113, D18308. [Google Scholar] [CrossRef]
  59. Williams, J.E.; Boersma, K.F.; Le Sager, P.; Verstraeten, W.W. The high-resolution version of TM5-MP for optimized satellite retrievals: Description and validation. Geosci. Model. Dev. 2017, 10, 721–750. [Google Scholar] [CrossRef] [Green Version]
  60. Loyola, D.G.; García, S.G.; Lutz, R.; Argyrouli, A.; Romahn, F.; Spurr, R.J.D.; Pedergnana, M.; Doicu, A.; García, V.M.; Schüssler, O. The operational cloud retrieval algorithms from TROPOMI on board Sentinel-5 Precursor. Atmos. Meas. Tech. 2018, 11, 409–427. [Google Scholar] [CrossRef] [Green Version]
  61. Boersma, K.F.; Eskes, H.J.; Brinksma, E.J. Error analysis for tropospheric NO2retrieval from space. J. Geophys. Res. 2004, 109. [Google Scholar] [CrossRef]
  62. Volkamer, R.; Baidar, S.; Campos, T.L.; Coburn, S.; DiGangi, J.P.; Dix, B.; Eloranta, E.W.; Koenig, T.K.; Morley, B.; Ortega, I.; et al. Aircraft measurements of BrO, IO, glyoxal, NO2, H2O, O2–O2 and aerosol extinction profiles in the tropics: Comparison with aircraft-/ship-based in situ and lidar measurements. Atmos. Meas. Tech. 2015, 8, 2121–2148. [Google Scholar] [CrossRef] [Green Version]
  63. Sinreich, R.; Coburn, S.; Dix, B.; Volkamer, R. Ship-based detection of glyoxal over the remote tropical Pacific Ocean. Atmos. Chem. Phys. 2010, 10, 11359–11371. [Google Scholar] [CrossRef] [Green Version]
  64. Behrens, L.K.; Hilboll, A.; Richter, A.; Peters, E.; Alvarado, L.M.A.; Hedegaard, A.B.K.; Wittrock, F.; Burrows, J.P.; Vrekoussis, M. Detection of outflow of formaldehyde and glyoxal from the African continent to the Atlantic Ocean with a MAX-DOAS instrument. Atmos. Chem. Phys. 2019, 19, 10257–10278. [Google Scholar] [CrossRef] [Green Version]
  65. De Longueville, H.; Clarisse, L.; Whitburn, S.; Franco, B.; Bauduin, S.; Clerbaux, C.; Camy-Peyret, C.; Coheur, P.-F. Iden-tification of short and long-lived atmospheric trace gases from IASI space observations. Geophys. Res. Lett. 2021, 48, e2020GL091742. [Google Scholar] [CrossRef]
  66. Clarisse, L.; Clerbaux, C.; Franco, B.; Hadji-Lazaro, J.; Whitburn, S.; Kopp, A.K.; Hurtmans, D.; Coheur, P.-F. A Decadal Data Set of Global Atmospheric Dust Retrieved from IASI Satellite Measurements. J. Geophys. Res. Atmos. 2019, 124, 1618–1647. [Google Scholar] [CrossRef] [Green Version]
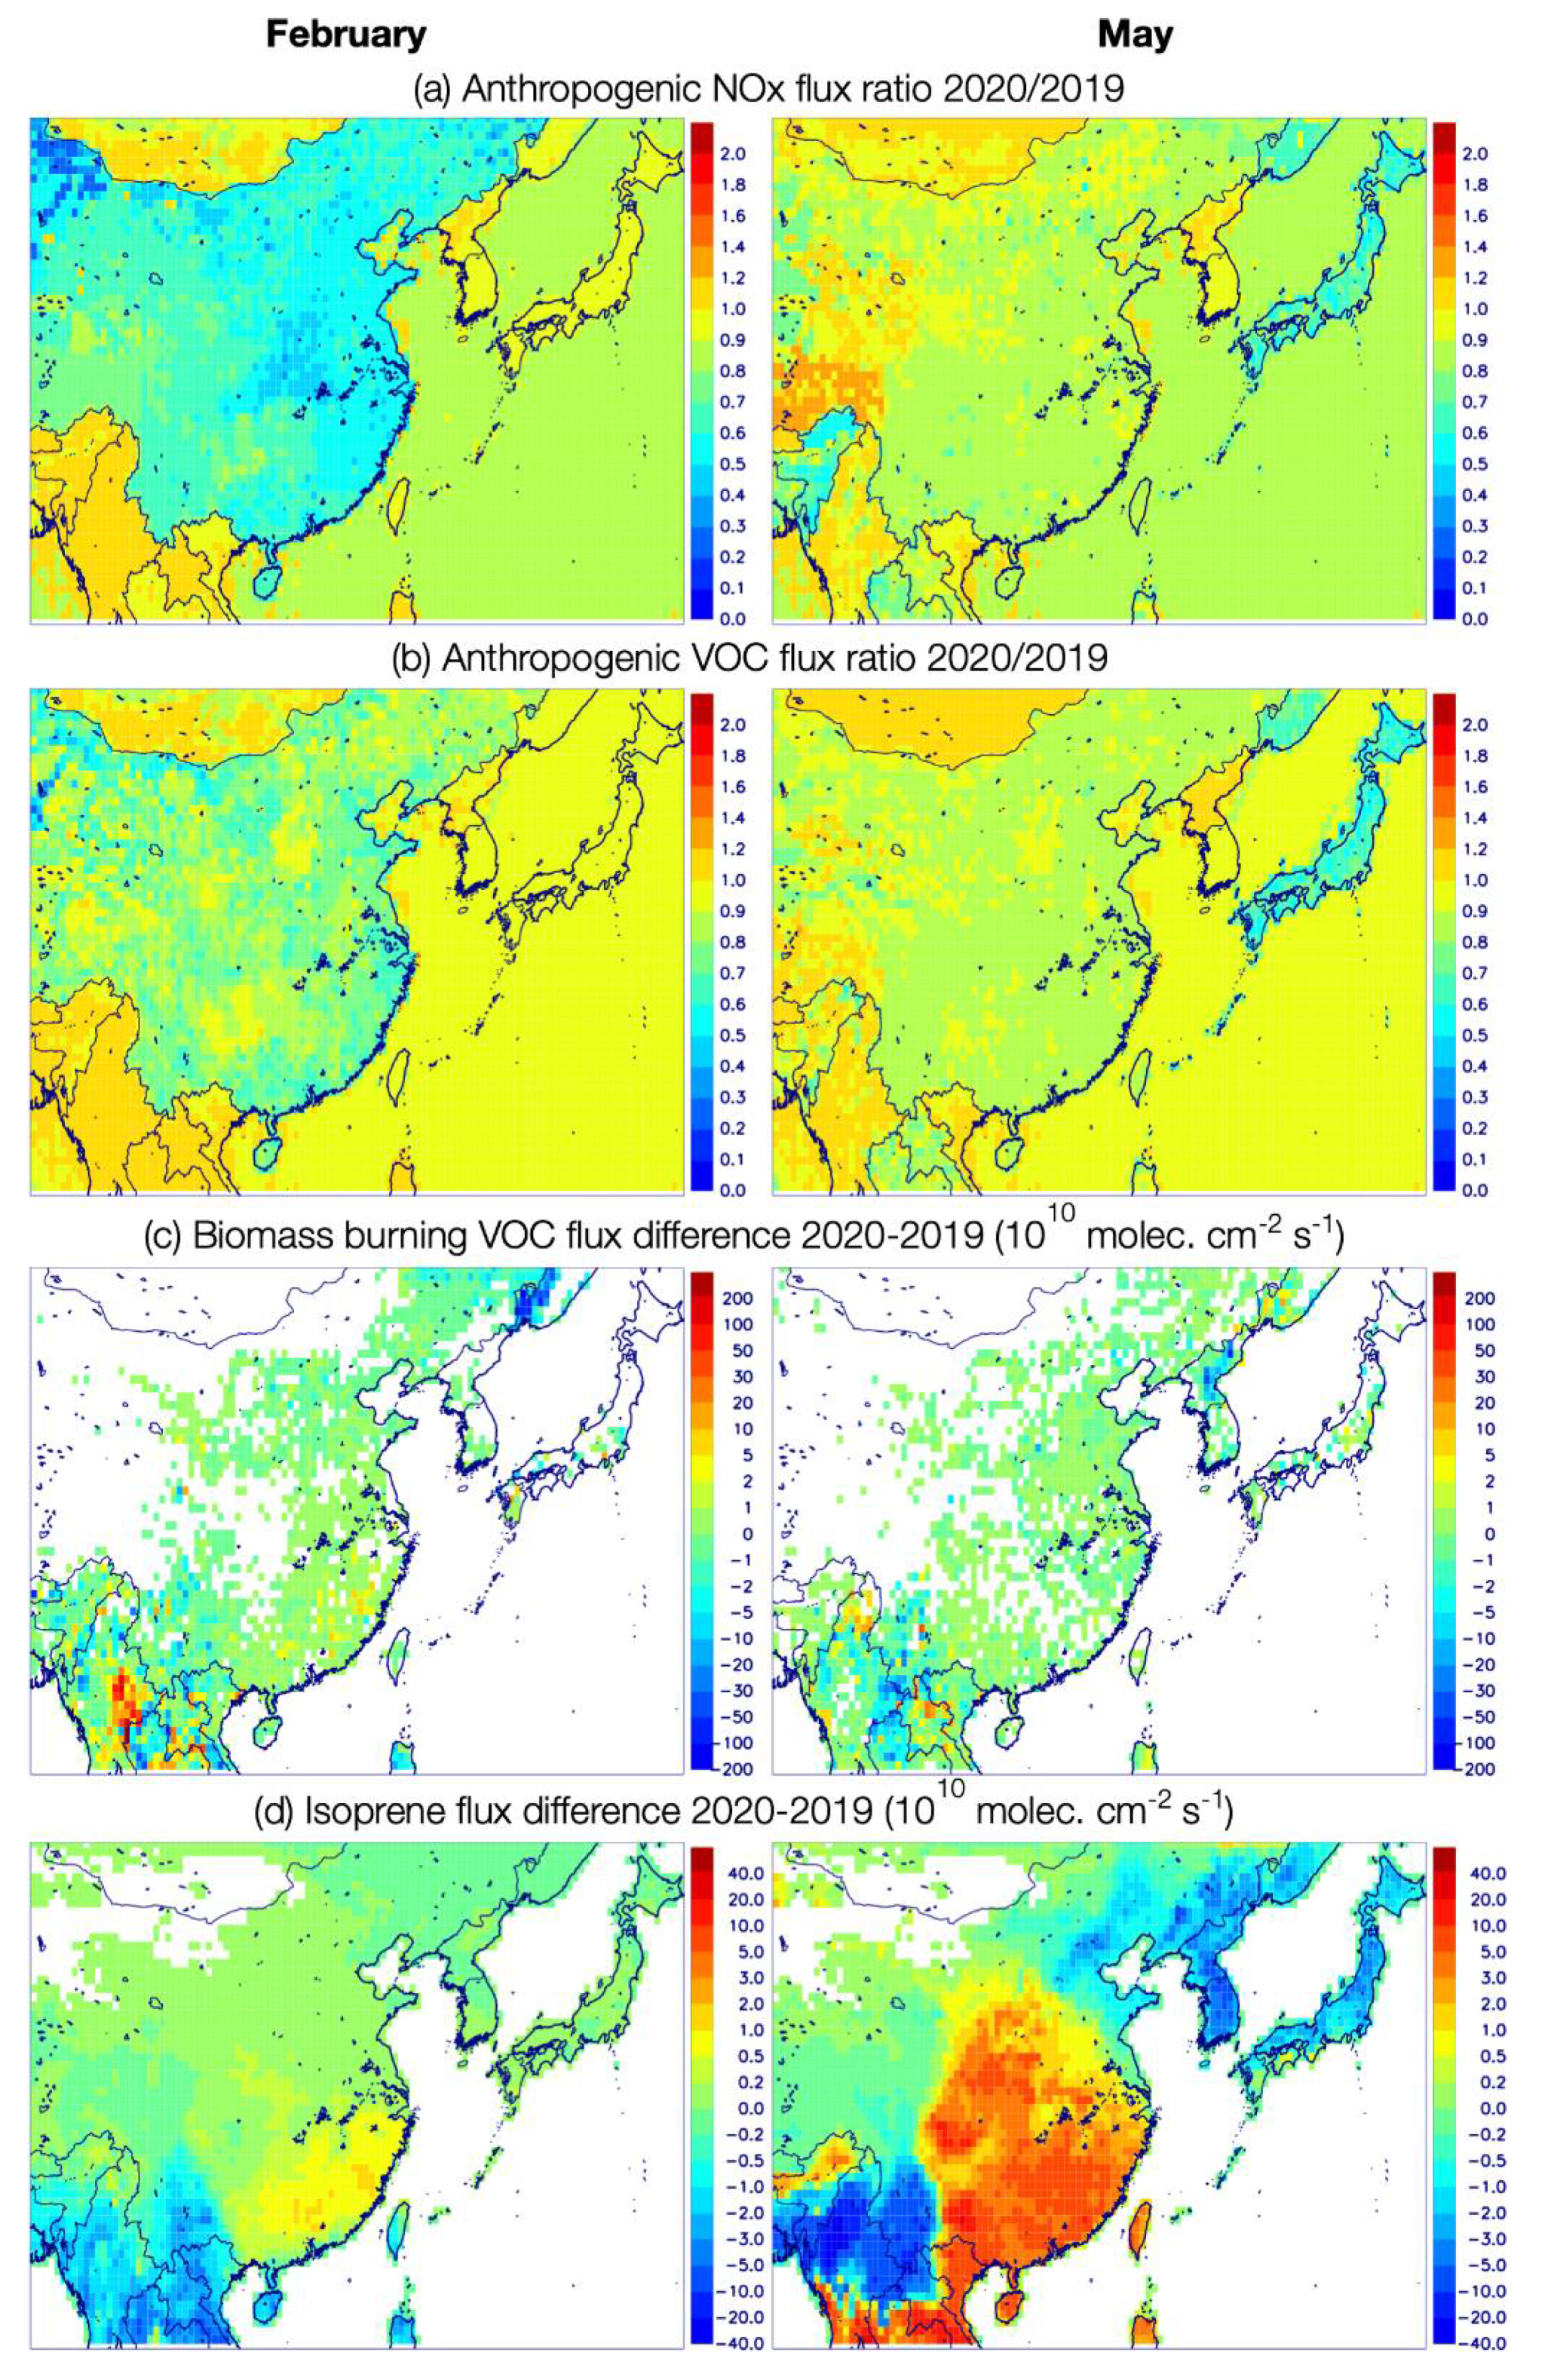
Figure 1. (a) Ratio of anthropogenic NOx fluxes, February 2020 divided by February 2019 (left) and May 2020 by May 2019 (right). (b) Idem for anthropogenic VOC fluxes. The anthropogenic fluxes for 2020 are those of the CONFORM dataset [11]. (c) Absolute flux difference 2020–2019 for biomass burning VOCs in February (left) and May (right). (d) Idem for isoprene biogenic fluxes.
Atmosphere 12 00946 g001
Figure 2. NOx emission estimates over China according to the baseline inventory CAMS-GLOB-ANT_v4.2-R1.1 (dashed), and the CONFORM emissions which account for the slowdown of economic activities due to the crisis (red). The pink shading represents the uncertainty ranges of the CONFORM emissions.
Atmosphere 12 00946 g002
Figure 3. (a,b) NO2 column ratio, February 2020 divided by February 2019, according to TROPOMI (left) and to the R1 simulation (right). (c,d) Idem for May. Invalid data and areas with very low total NOx emissions (less than 2 × 10¹⁰ molec.cm−2 s−1) are left blank. The boxes of panel (a) indicate the analysis regions (also shown in Figure 4).
Atmosphere 12 00946 g003
Figure 4. Regions used in this study. ECN = eastern China (22–42° N, 108–125° E); NCP = North China Plain (34–41.5° N, 112–119° E); YRD = Yangtze River Delta (29–33.5° N, 117.5–122.5° E); HH = Hubei–Hunan (27–32° N, 108.5–116.5° E); PRD = Pearl River Delta (22–24.5° N, 111–117° E).
Atmosphere 12 00946 g004
Figure 5. (a,b) HCHO column ratio, February 2020 divided by February 2019, according to satellite data (left) and to MAGRITTEv1.1 (right). (c,d) Idem for CHOCHO. (e,f) Idem for PAN. Invalid data and areas with very low VOC emissions (less than 5 × 10¹⁰ molec.cm−2s−1) are left blank in panels a–d. The stippling in panels a, c, and e indicates data below the estimated detection limit. The boxes of panel (a) indicate the analysis regions (also shown in Figure 4).
Atmosphere 12 00946 g005
Figure 6. Observed and modeled columns for May 2020. (a,b) NO2; (c,d) HCHO; (e,f) CHOCHO; (g,h) PAN. Units are 1015 molec.cm−2, except for CHOCHO (1014 molec.cm−2). The stippling in panels c, e, and g indicates data below the estimated detection limit. The boxes of panel (a) indicate the analysis regions (also shown on Figure 4).
Atmosphere 12 00946 g006
Figure 7. (a,b) HCHO column ratio, May 2020 divided by May 2019, according to satellite data (left) and to the MAGRITTEv1.1 model (right). (c,d) Idem for CHOCHO. (e,f) Idem for PAN. Invalid data and areas with very low VOC emissions (less than 5 × 10¹⁰ molec.cm−2s−1) are left blank in panels a–d. The stippling in panels a, c, and e indicates data below the estimated detection limit. The boxes of panel (a) indicate the analysis regions (also shown on Figure 4).
Atmosphere 12 00946 g007
Table 1. Description of the model simulations. All simulations use the same emissions for 2019 but differ regarding their 2020 emissions.
Short NameDescription
R1Use average estimates of CONFORM adjustment factors for anthropogenic 2020 emissions [12]
R1HUse high estimates of CONFORM adjustment factors. The resulting anthropogenic fluxes for 2020 are higher than in R1.
R1LUse low estimates of CONFORM adjustment factors. The resulting anthropogenic fluxes for 2020 are lower than in R1.
R2Use 2020 baseline anthropogenic emissions from CAMS-GLOB-ANT_v4.2-R1.1. These emissions do not account for pandemic-induced disruptions.
R3Use the same (2019) anthropogenic NOx fluxes in 2019 and 2020
R4Use the same (2019) anthropogenic VOC fluxes in 2019 and 2020
R5Use the same (2019) anthropogenic and natural (biomass burning, biogenic) fluxes in 2019 and 2020
Table 2. Percentage changes of monthly columns between 2020 and the same month in 2019 ((2020-2019)/2019), based on observed and modelled columns from simulations R1 (CONFORM emissions), R1H and R1L (high and low CONFORM emissions), R2 (baseline emissions), R3 (fixed anthropogenic NOx flux), R4 (fixed anthropogenic VOC flux), and R5 (fixed anthropogenic and natural fluxes). All values are calculated for the eastern China region shown in Figure 4 delimited by 22–42° N, 108–125° E.
NO2 Changes
TROPOMI R1 R1H R1L R2 R3R4R5
February−39.7−41.9−35.2−49.5−8.4−2.6−43.1−5.2
May−15.4−12.3−5.7−14.4−4.4−2.3−12.7−3.2
HCHO Changes
TROPOMI R1 R1H R1L R2 R3R4R5
February−8.6−13.7−11.3−16.3−5.7−10.8−8.3−6.3
May6.04.56.83.17.85.76.94.2
CHOCHO Changes
TROPOMI R1R1HR1LR2 R3R4R5
February−13.2−20.7−14.7−27.00.2−21.92.40.5
May−3.2−8.4−0.9−14.9−2.1−9.43.6−1.3
PAN Changes
IASIR1R1HR1LR2 R3R4R5
February−17.9−11.5−7.6−15.00.6−7.9−3.40.6
May−21.2−19.5−13.2−23.0−11.5−16.5−14.2−9.9
Table 3. Percentage changes between 2019 and 2020 in: (i) NO2 surface concentrations modeled by the standard simulation (R1) and observed at network in situ measurement stations (Figure A1), and (ii) NO2 columns modeled by R1 and observed by TROPOMI at the locations of the in situ observations. All values are calculated for the regions shown in Figure 4. The number of measurement stations is indicated for each region between brackets.
Region (Number of In Situ Sites)In Situ vs. R1TROPOMI Columns vs. R1 (At In Situ Stations)
FebruaryMayFebruaryMay
In SituR1In SituR1SatR1SatR1
Eastern China (1035)−36−40−8−8−45−46−19−18
North China Plain (230)−36−45−5−2−46−48−17−19
Yangtze River Delta (154)−41−39−22−45−47−29−25
Pearl River Delta (94)−31−23−24−20−8−33−24−15
Hubei-Hunan (150)−39−46−18−8−48−49−11−11
Publisher’s Note: MDPI stays neutral with regard to jurisdictional claims in published maps and institutional affiliations.