1. Introduction
Recently, due to the projected shortage of crude oil and the urgent need to reduce greenhouse gas (GHG) emissions, more efforts have been made and resources spent in order to develop a sustainable transportation system that can address the climate change challenge and reduce oil dependence [
1]. The transportation sector is one of the leading consumers of fossil fuels and one of the main contributors to GHG emissions. Around 17% of the total hydrocarbon fuel consumption and 23% of the total carbon dioxide (CO
2) emissions are related to vehicles [
2].
With the rapid urbanization, there is increasing movement of goods and people through transportation systems. Pavements, as an example, have been constructed over billions of kilometers around the world. Thus, there have been several studies working on the development of green technologies in order to develop sustainable pavements [
3]. Some of these studies have focused on the development of electromobility and linking it with technological developments and battery issues [
4]. Other studies have focused on the pavement itself in order to harvest renewable energy, while some others have investigated harvesting energy from roadway surface elements such as speed humps.
New renewable sources of energy have been investigated recently in order to reduce the fuel consumed by vehicles and the electric power required to operate the transportation facilities and light the roadway networks. The speed hump is one of these candidates. A speed hump can be defined simply as an elevated profile placed across the roadway, usually 3–5 inches high with various lengths. Usually, speed humps are constructed in places where the amount of pedestrian–vehicle interaction is relatively large in order to eliminate or reduce the potential for accidents. The reduction of a vehicle’s speed while passing over a speed hump not only could influence the ride comfort of the driver and passengers, but it could also lead to a huge loss in kinetic energy. Various attempts have been made to improve the driver’s and passengers’ comfort while passing over speed humps by optimizing the shape and height of the humps [
5].
Over the last three decades, several techniques have been developed in order to transform the kinetic energy of vehicles that move over speed humps to electric power that can be used to light roadways. These kinetic energy harvesting systems can be classified into three categories based on their working principles: (1) piezoelectric, (2) mechanical, and (3) electromagnetic. Piezoelectric systems are not the preferred choice due to their very low power density and voltage. On the other hand, electromagnetic energy harvesting systems have great potential for the supply of power to high-power facilities, but existing designs have only been applied in ambient oscillation energy harvesting, which has a low power input [
6]. Therefore, mechanical systems seem to be the most reliable and practical among the aforementioned methods.
The principle of mechanical systems (speed hump power generators) is fundamentally based on converting the kinetic and potential energies to electric energy. Kinetic and potential energies are produced from the vertical displacement when vehicles pass over the speed hump. Generally, speed humps are built from mechanical and electrical components such as roller shafts, meshed gears, and dynamos [
7].
In Palestine, the conventional energy resources are very limited and the local power-generating plants cover less than 20% of the unstable economic and political situation. Therefore, most of the required electricity is imported from Israel. Moreover, more than 95% of the sources of imported electricity are fossil fuels [
8]. As a result, large amounts of GHG emissions are produced in order to generate the required electrical power.
This study investigated the use of energy-harvesting speed humps (EHSHs) in Nablus city (the second largest Palestinian city) in order to produce the electrical power that could be used in roadway network lighting. A mechanical system developed by a team of students in laboratories at An-Najah National University was used in this study. The study determined the energy and the environmental implications of replacing conventional speed humps with the energy harvesting ones. More specifically, the reduction in the energy cost and the GHG emissions was determined considering the traffic volumes over all the speed humps. Moreover, a traffic volume prediction model was developed and the implications over the next 10 years were determined.
The rest of this article is organized as follows. The previous studies that have addressed the different energy harvesting methods from pavement and speed humps are evaluated in the Literature Review section. After that, the required data and the implemented methodology are presented. Next, the traffic volume and speed hump data and the economic and environmental implications are analyzed and discussed. Finally, significant conclusions are presented.
2. Literature Review
Over the past few years, several studies have investigated harvesting electric energy from pavement and other surface elements such as speed humps. In order to do that, different techniques have been developed and tested around the world. These techniques are mainly based on piezoelectric, mechanical, and electromagnetic principles.
One of these studies was conducted in China by Zhang et al. [
6]. The study presents a new energy-harvesting system installed at the entrance and exit of a road tunnel. Several components were used to build this system, including a power storage unit, a generator, the external part of the speed hump, and a suspension system. The results of the study indicate that a high voltage could be obtained from using this system, and thus it could be considered a practical source of renewable energy.
Another experimental study was conducted by Shaaban et al. [
9] based on the principle of thermoelectricity. A thermoelectric generator was installed within a flexible pavement system and a rigid pavement one in the laboratory. Next, the pavement was subjected to full-spectrum light. The study concluded that about 6200 microwatts could be generated from 1 m
2 of pavement and that this amount of electricity is enough to operate sensor arrays used to collect data about pavement conditions.
In China, a new piezoelectric system was developed by Zhao et al. [
10] in order to harvest the electrical energy from asphalt pavement. In this study, seven typical transducers were tested using finite element analysis. The results show that the expected amount of produced electricity was about 150 kW/h per lane per kilometer. Moreover, the generators could be used as sensors in order to monitor the traffic and pavement conditions.
A comprehensive study was conducted by Sun et al. [
3] in order to evaluate the green technologies used in sustainable pavements. The study addressed the electrical energy harvesting systems and the permeable pavement technology. Different energy-harvesting systems were evaluated and compared based on durability, ease of construction, and life-cycle cost. The study concluded that most of these technologies are promising for developing new sources of renewable energy. Moreover, further studies were recommended to be conducted in the future in order to improve technologies that are more efficient.
In the United States, a study was conducted by Gholikhani et al. [
11] in order to test innovative electrical energy harvesting systems. Cantilever and rotational mechanisms were evaluated in the laboratory using different traffic scenarios. The results show that the maximum expected power was 2.8 W. Moreover, the results show a promising capability for generating electric power under real conditions that could significantly affect sustainable transportation systems.
An experimental study was conducted by Ramadan et al. [
7] in order to examine different types of speed hump power generators. These generators are capable of using the kinetic energy of vehicles and transforming it into electrical power. The study concluded that a minimum electrical power of 0.56 kilowatts (kW) could be generated by each passing vehicle and, therefore, the generated electrical power could be used for lighting roadway networks and other transportation facilities.
Similarly, a study was conducted by Iyen et al. [
12] using an electro-mechanical harvesting system. The principle of this system is to convert the reciprocating motion into rotational motion that could produce electricity using a generator. The results of the study indicate that electrical power of up to 1.9 kW could be generated using this system. As a result of this experimental study, a prototype was developed and tested.
As a result, the majority of the studies tested piezoelectric models since they are easy to build and can produce a reasonable amount of energy. However, these models are not durable enough to be used under real traffic conditions; thus, the practical implementation of these models has never been tested. Moreover, the previous studies that tested mechanical speed hump systems were conducted in laboratories using different types of mechanical systems, and they focused on the amount of electricity that could be generated from a prototype without paying attention to the feasibility and the practical implementation of these systems under real traffic conditions. Therefore, this study focused on the practical implementation of EHSHs under real traffic conditions rather than testing these techniques in a laboratory in order to determine the feasibility of the implementation of these techniques in urban areas and quantify the environmental and economic implications. In order to do that, the locations and dimensions of speed humps in Nablus city were determined. Then, the traffic volume over these speed humps was determined. Finally, the economic and the environmental implications of using the introduced system were determined.
3. Data and Methodology
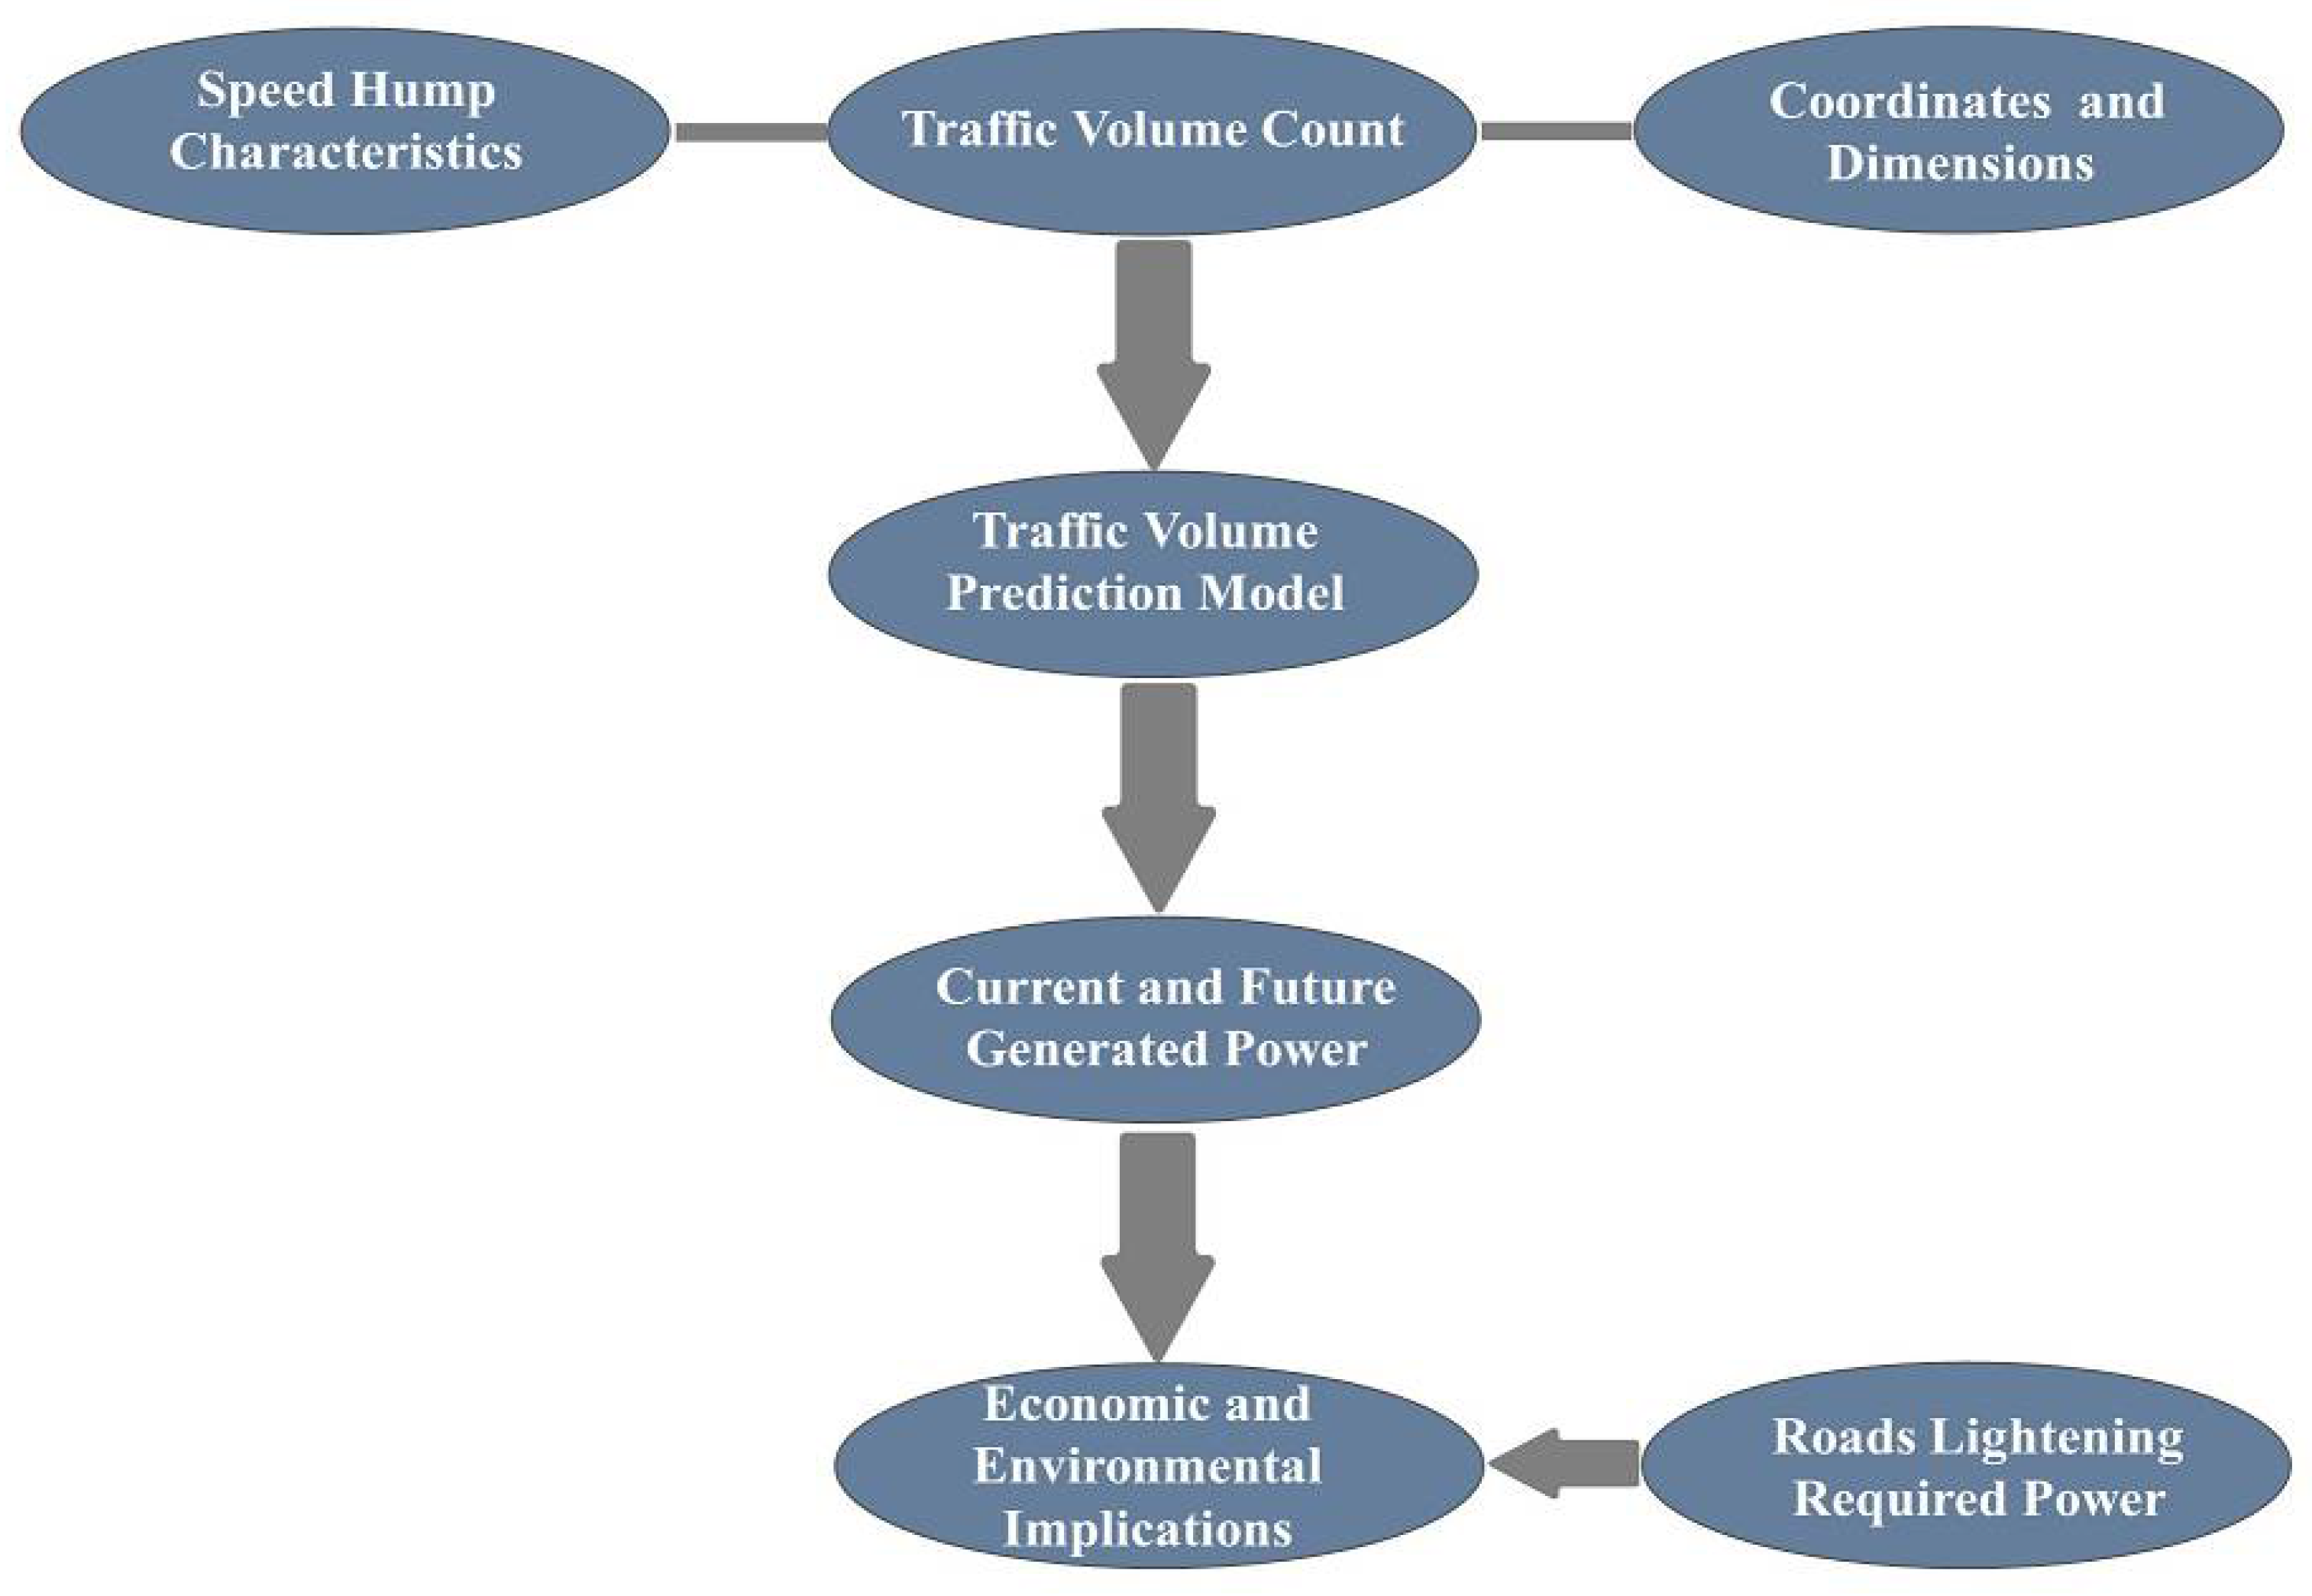
In this study, the required data were acquired from several sources. The used EHSH system was developed by a team of students in laboratories at An-Najah National University. The locations, dimensions, and coordinates of all speed humps in Nablus city were collected using field visits. The traffic volume over all speed humps was determined using manual traffic counts. Finally, the amount of electricity required to light the roadway network in Nablus city was determined based on the data acquired from the Northern Electricity Distribution Company (NEDCO). The implemented methodology is illustrated in
Figure 1.
3.1. Energy-Harvesting Speed Hump Characteristics
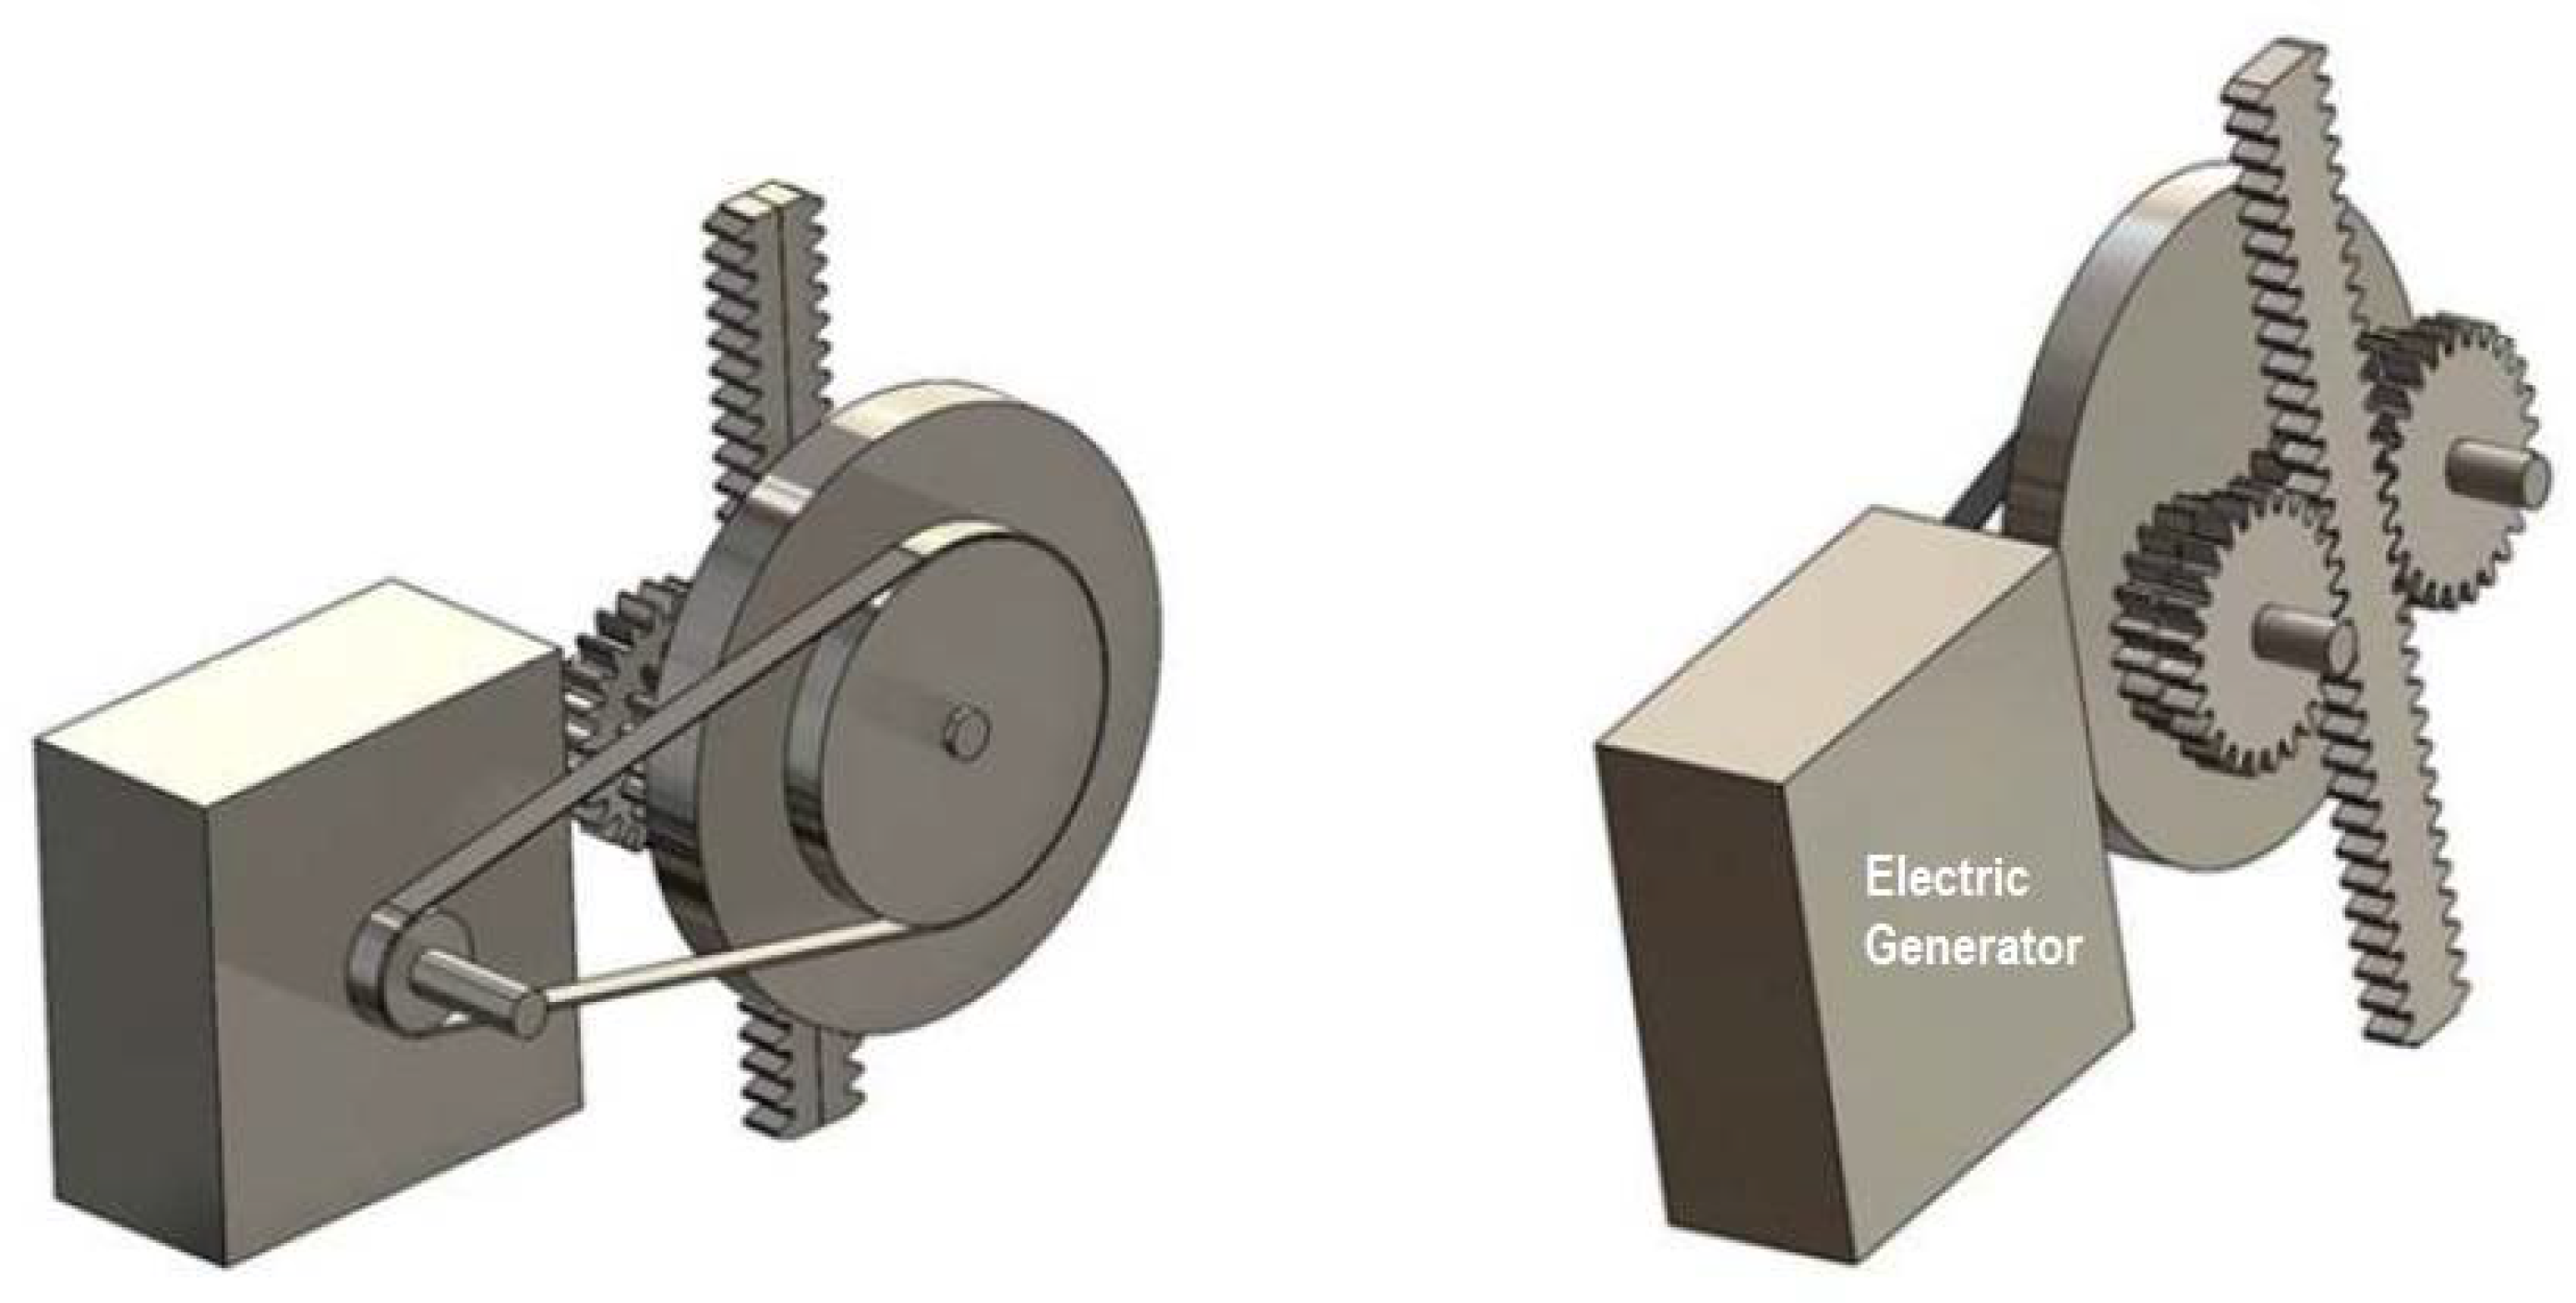
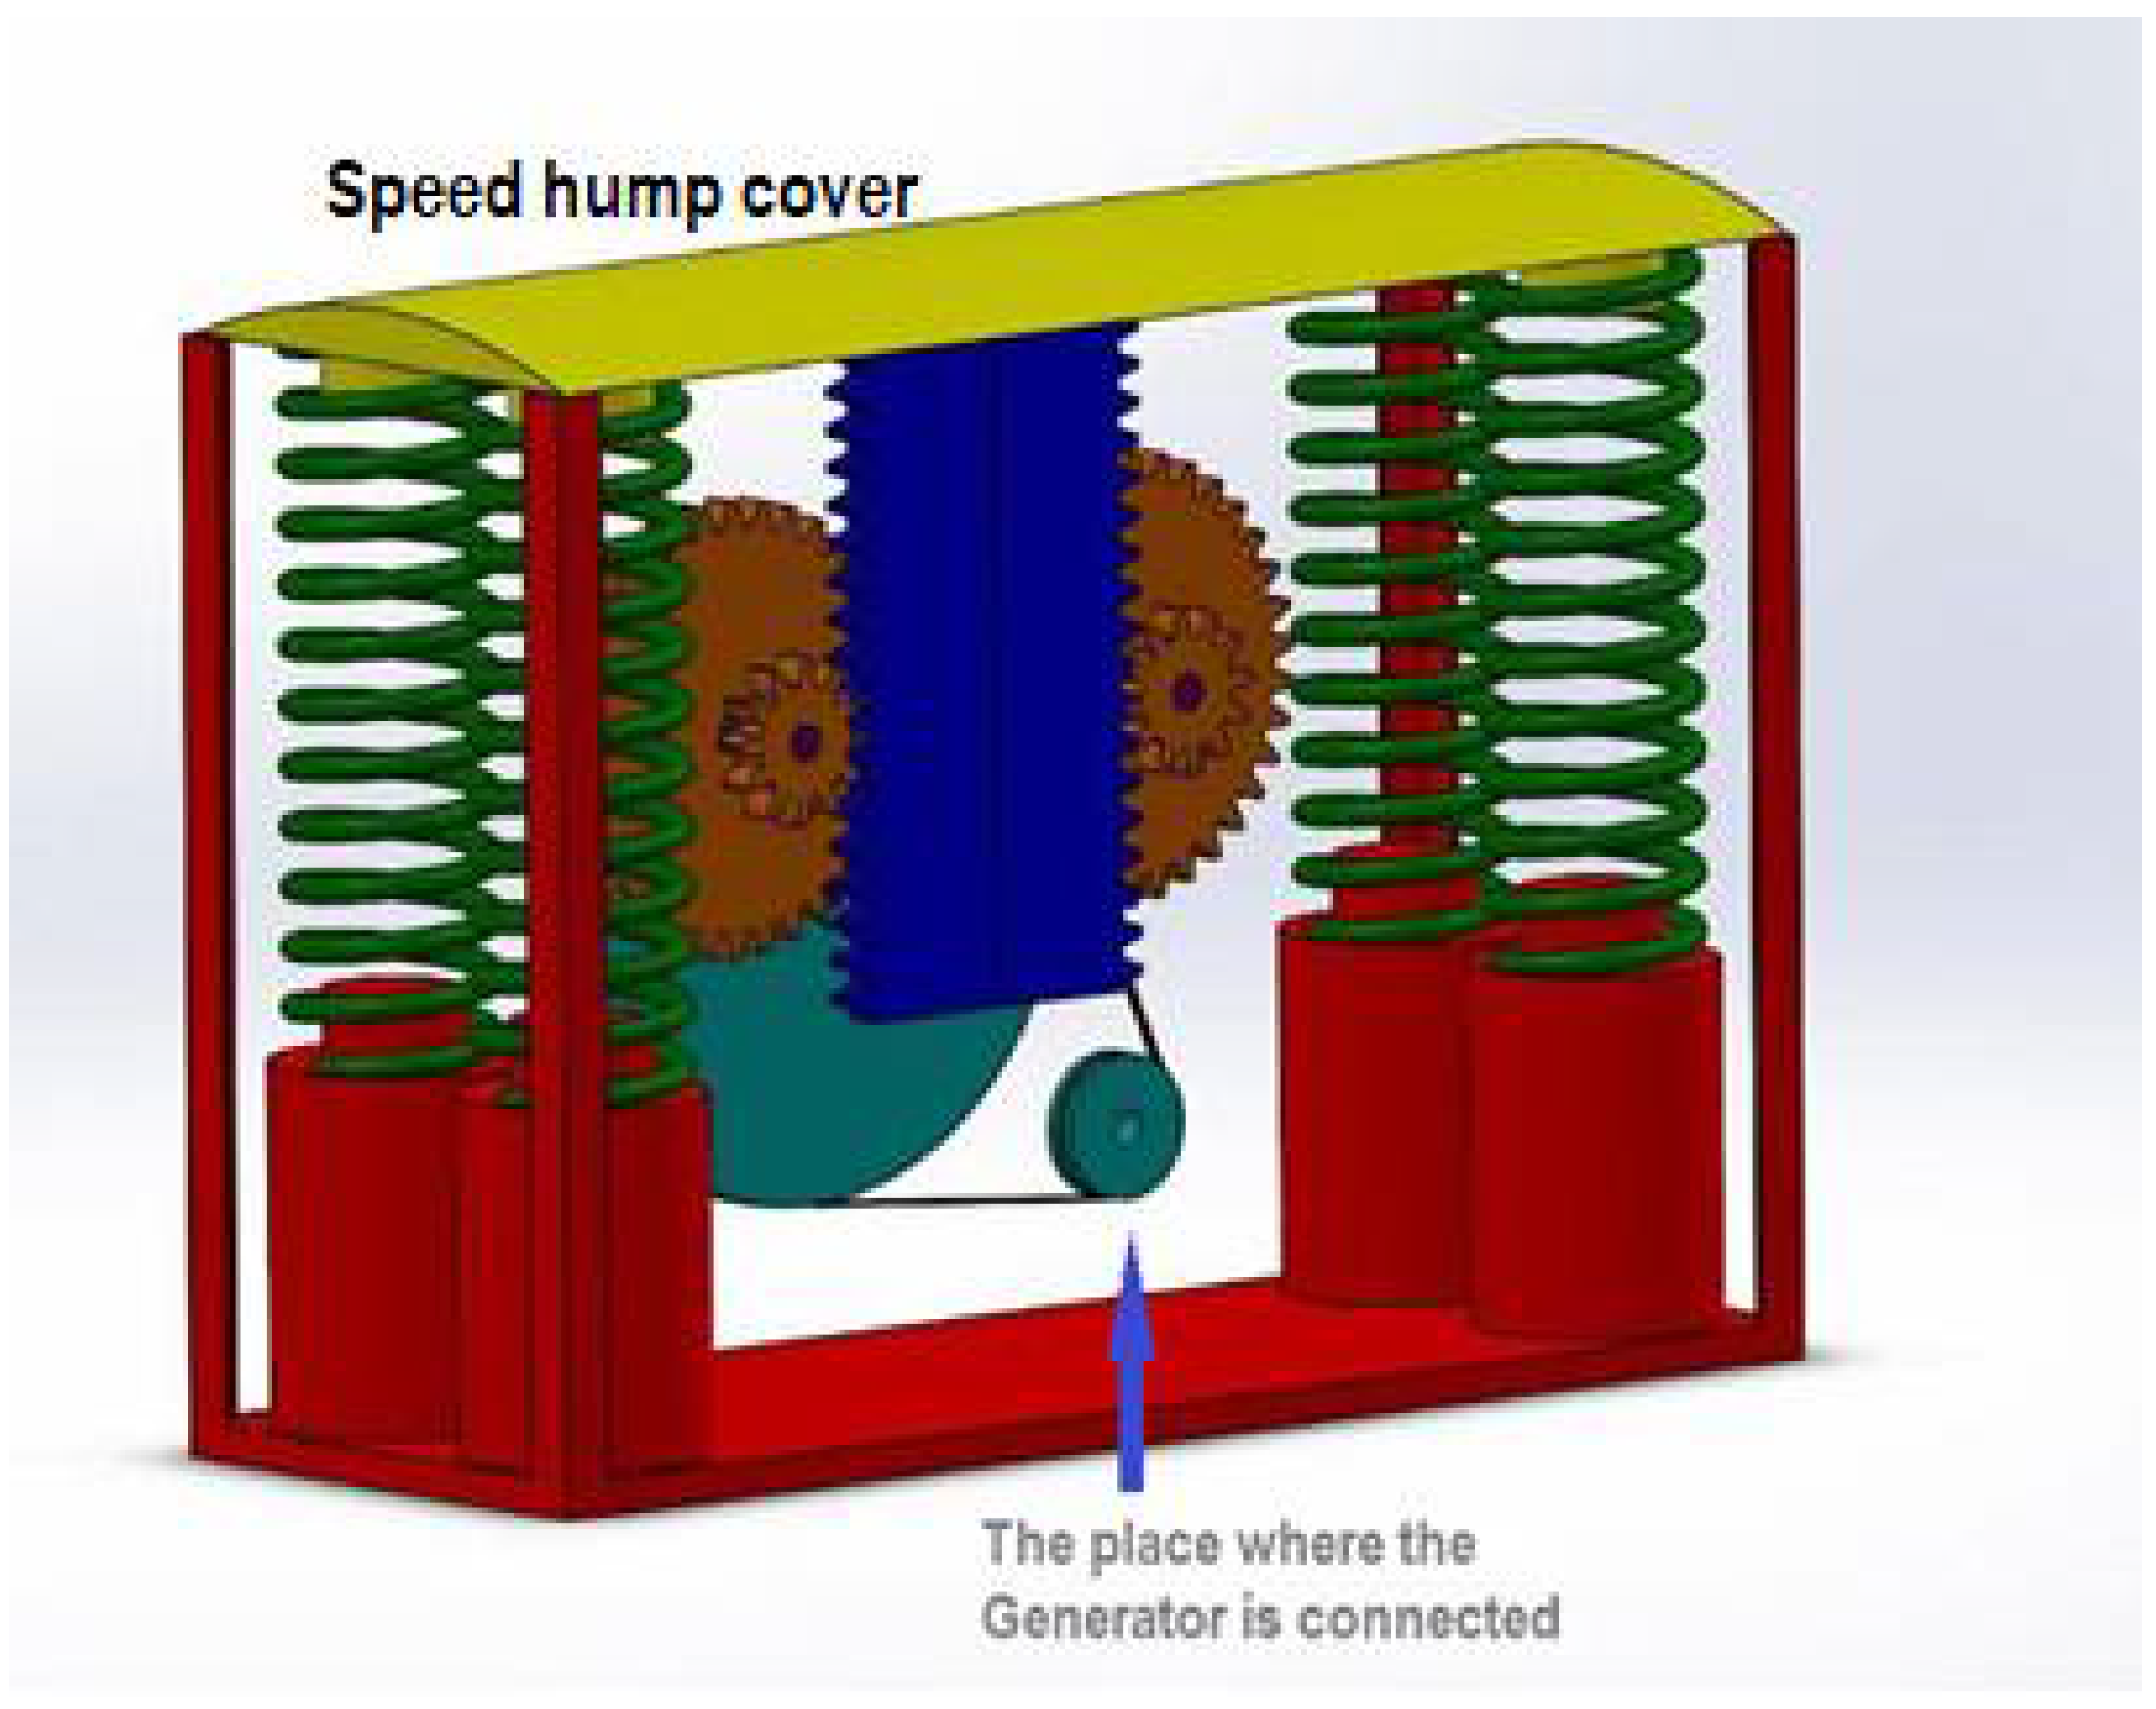
The mechanical speed hump system consists of springs, a rack, gears, a belt, and pulleys. The system is connected to an electrical system that converts the resultant mechanical energy into electrical energy using a generator as shown in
Figure 2. In addition, an inverter and a battery are connected to the generator in order to transform the direct current into an alternating current. After that, the energy is stored in the battery.
The speed hump cover is made from plastic and rubber with a 15-degree inclination angle. In order to let the speed hump return to its initial position after the passage of each vehicle’s axle, the speed hump was provided with a suspension system (four springs). Thus, the main mechanical system is composed of two sets. The first set includes two pinions and two face racks, and the second set includes a pinion and two gears. As a result, the movement of traffic over the speed hump cover will be transformed into mechanical energy that will finally rotate the electric generator to produce electrical energy as shown in
Figure 3.
Each lane has an independent system and each system contains two mechanical units in order to increase the electricity generation efficiency of the speed hump. The electricity generated by each vehicle (with two axles), including the total loss, is 0.0122 Watt-hours (Wh).
3.2. Speed Hump Dimensions and Coordinates
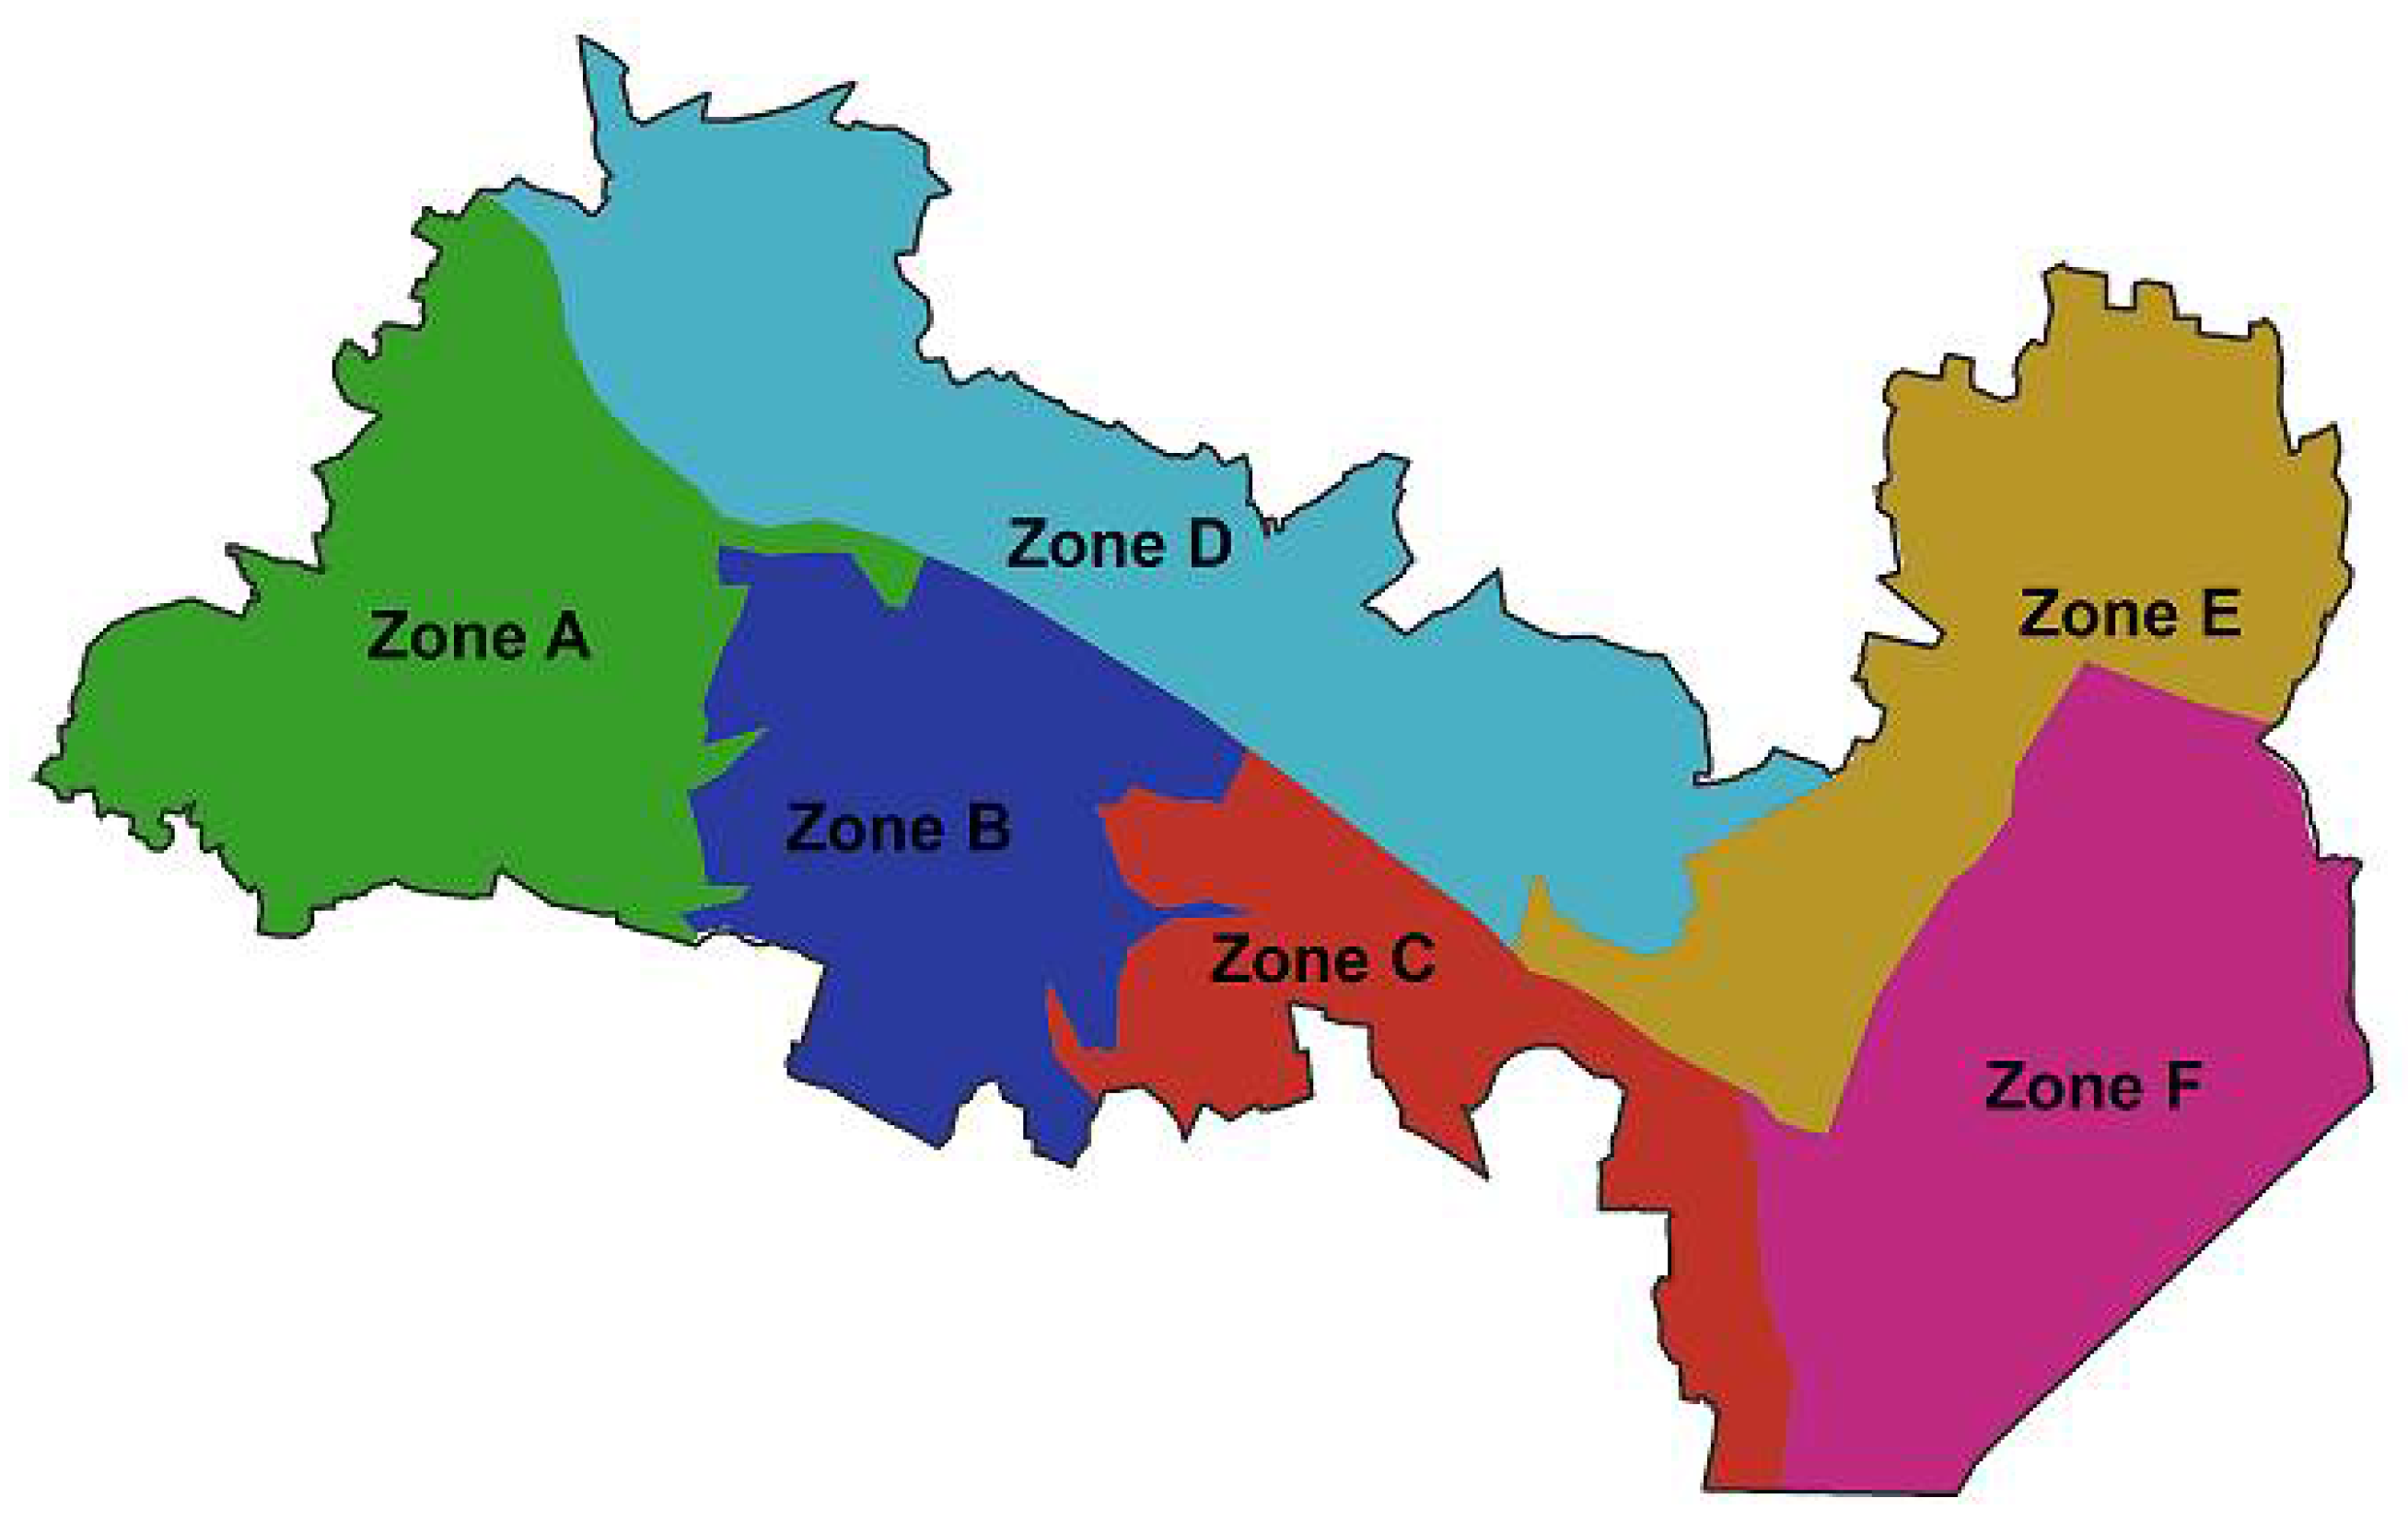
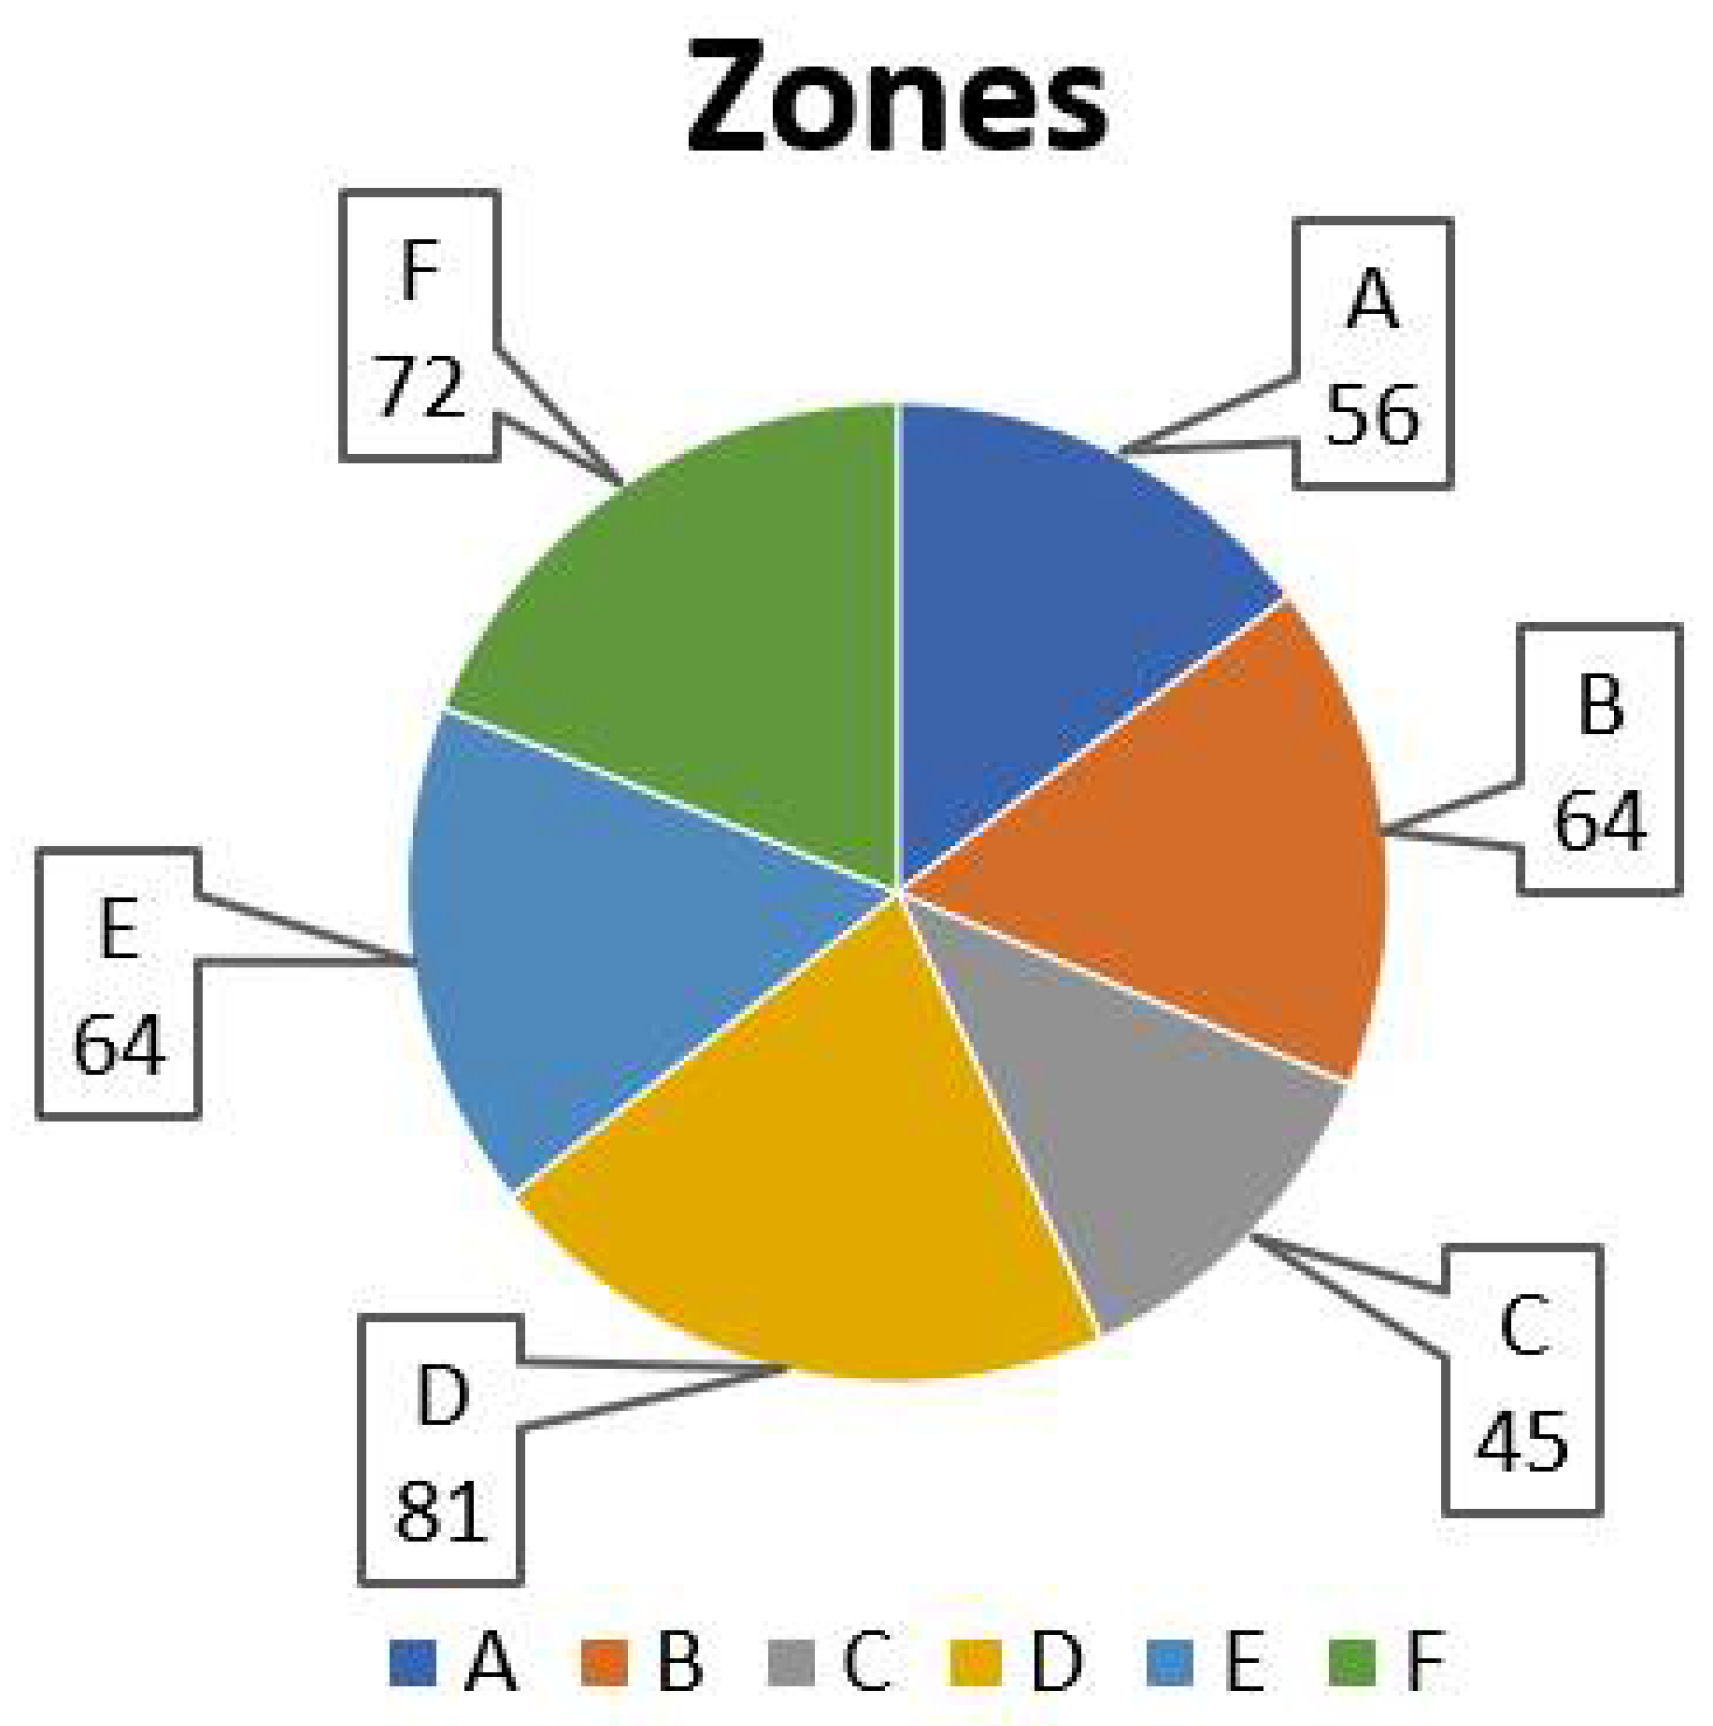
Initially, Nablus city was divided into six main zones based on the location (Rafidia Zone (A), Central Zone (B), Gerzim Zone (C), Ebal Zone (D), Eastern Zone (E), and Industrial Zone (F)) as shown in
Figure 4.
After that, the number of speed humps in each zone was counted using field visits, as shown in
Figure 5, and the dimensions were measured manually. Moreover, the coordinates of the speed humps were measured using handheld Global Positioning System devices. The coordinates were then transformed from the international system to the Palestinian system using the ArcGIS program.
Next, a special number was given to each speed hump according to the zone in which it was located, and all relevant data were recorded. Finally, the coordinates of each speed hump were projected onto an aerial photograph of Nablus city and a Geographic Information System (GIS) map was prepared in order to set up a plan for determining the traffic volume and to present the areas with a large expected amount of generated electricity.
3.3. Traffic Volume
Traffic volume measuring locations were chosen based on the locations of speed humps in order to determine the traffic volume over them as shown in
Figure 6. The locations varied between T-intersections, cross-intersections, and multi-leg intersections. The traffic count was performed during peak periods (7:00–9:00 a.m. and 12:00–3:00 p.m.) during weekdays from 15 February 2020 to 6 March 2020.
The vehicles were classified into five categories according to the American Association of State Highway and Transportation Officials (AASHTO): passenger car, minibus, bus, truck, and other. Then, the Average Daily Traffic (ADT) volume over each speed hump was determined, using the appropriate K-Factor, as recommended by AASHTO.
3.4. Traffic Volume Prediction Model
In order to determine the future traffic volume over the next 10 years, a prediction model was developed using data on the annual number of vehicles in Nablus city during the period 2002–2020 (18 years). Holt’s Exponential Smoothing Method was selected to be used in developing the prediction model, since its use over other methods, such as Auto Regressive Integrated Moving Average (ARIMA), is highly recommended when annual data for periods less than 25 years are used [
13]. Moreover, this method achieves the highest prediction accuracy when Statistical Package for the Social Sciences (SPSS) software is used to develop a best-fit prediction model.
Smoothing is a time series technique in which data over time are smoothed exponentially by assigning either exponentially increasing or decreasing weights to the data points. Generally, there are three types of exponential smoothing: Single, Holt’s Exponential Smoothing, and Winters’ Exponential Smoothing. Holt’s Exponential Smoothing is presented in Equation (1).
where β is the trend factor, (0 < β < 1), α is the smoothing factor, (0 < α < 1), F is an estimate of the x value at time t + m, b
t is the best estimated trend at time-specific year t, x
t is the sequence of data, s
t is the smoothed value for year t, and m is a value greater than zero.
3.5. Economic and Environmental Implications
Firstly, based on the traffic volume counts, the ADT was calculated over each speed hump. After that, the average amount of electricity generated daily by each speed hump was calculated based on the number of passing vehicles and the amount of electricity that can be generated by each vehicle (0.0122 Wh). Finally, the total amount of electricity generated by all speed humps was determined.
Secondly, based on the current electricity consumption required to light the roadway network, and considering the new plan by Nablus Municipality to completely replace the old conventional lamps with 70-Watt LED lamps, the total daily amount of the electricity required to light the roadways after replacing the lamps was calculated.
Thirdly, based on the current and the expected future amount of electricity generated by the speed humps, the current and future reductions in GHG emissions produced in order to generate the required amount of electricity for roadway network lighting were determined. Finally, the reduction in the energy cost required for roadway lighting was determined.
This study has faced several constraints; however, the majority of them were solved. The rest of the issues could not be solved due to the absence of required data, such as the device and maintenance costs. Therefore, this issue was addressed in terms of the environmental and energy cost aspects without engaging in a detailed economic study, which could be conducted in the future. Moreover, the core of this study is to figure out the expected energy and environmental implications of the new system.
4. Analysis and Discussion
In this study, the amount of electric power that can be generated by replacing the conventional speed humps in Nablus city by energy harvesting ones was determined and the economic and the environmental implications of this project were determined. The data were analyzed based on the speed humps’ dimensions and coordinates, the current and future traffic volume, the required electrical power for lighting the roadway network, and the GHG emissions produced by lighting the roadway network.
4.1. Speed Hump Dimensions and Coordinates
The length of each speed hump and the number of lanes were determined manually for each of the six zones. For zone A, the maximum speed hump length is 15 m and the minimum length is 5 m. For zone B, the maximum speed hump length is 15 m and the minimum length is 3 m. For zone C, the maximum length is 14 m and the minimum length is 4 m. For zone D, the maximum length is 16 m and the minimum length is 4 m. For zone E, the maximum length is 19 m and the minimum length is 3.6 m. Finally, for zone F, the maximum length is 14 m and the minimum length is 3 m.
It was noticed that there is no uniform width or height for speed humps in Nablus city, since there is no standard applied to speed humps in Palestine. Therefore, to construct the new speed hump system, a uniform standard (height and width) was applied.
Moreover, the coordinates of all the speed humps were determined for all the zones in order to set a plan for measuring the traffic volume. Next, a GIS map was prepared and the coordinates of the speed humps were located on the map.
Table 1 presents the lengths and the coordinates for zone A as an example.
4.2. Traffic Volume
In order to determine the Peak Hour Volume (
PHV) at each speed hump, traffic counts were performed during the morning peak period (7:00–9:00 a.m.) and the evening peak period (12:00–3:00 p.m.) during weekdays. The traffic volume was measured manually at 405 speed humps. Then, the
ADT at each speed hump was calculated using a
K-factor based on Equation (2)
The most appropriate
K-factor value was determined to be 10% based on AASHTO [
14], since it is recommended that a
K-factor between 8% and 12% be used for urban areas. Therefore, the average value was selected since all the speed humps are located in the urban area of Nablus city. The
ADT values at all speed humps in zone A as an example and the
ADT for each zone are presented in
Table 2 and
Table 3, respectively.
4.3. Traffic Volume Prediction Model
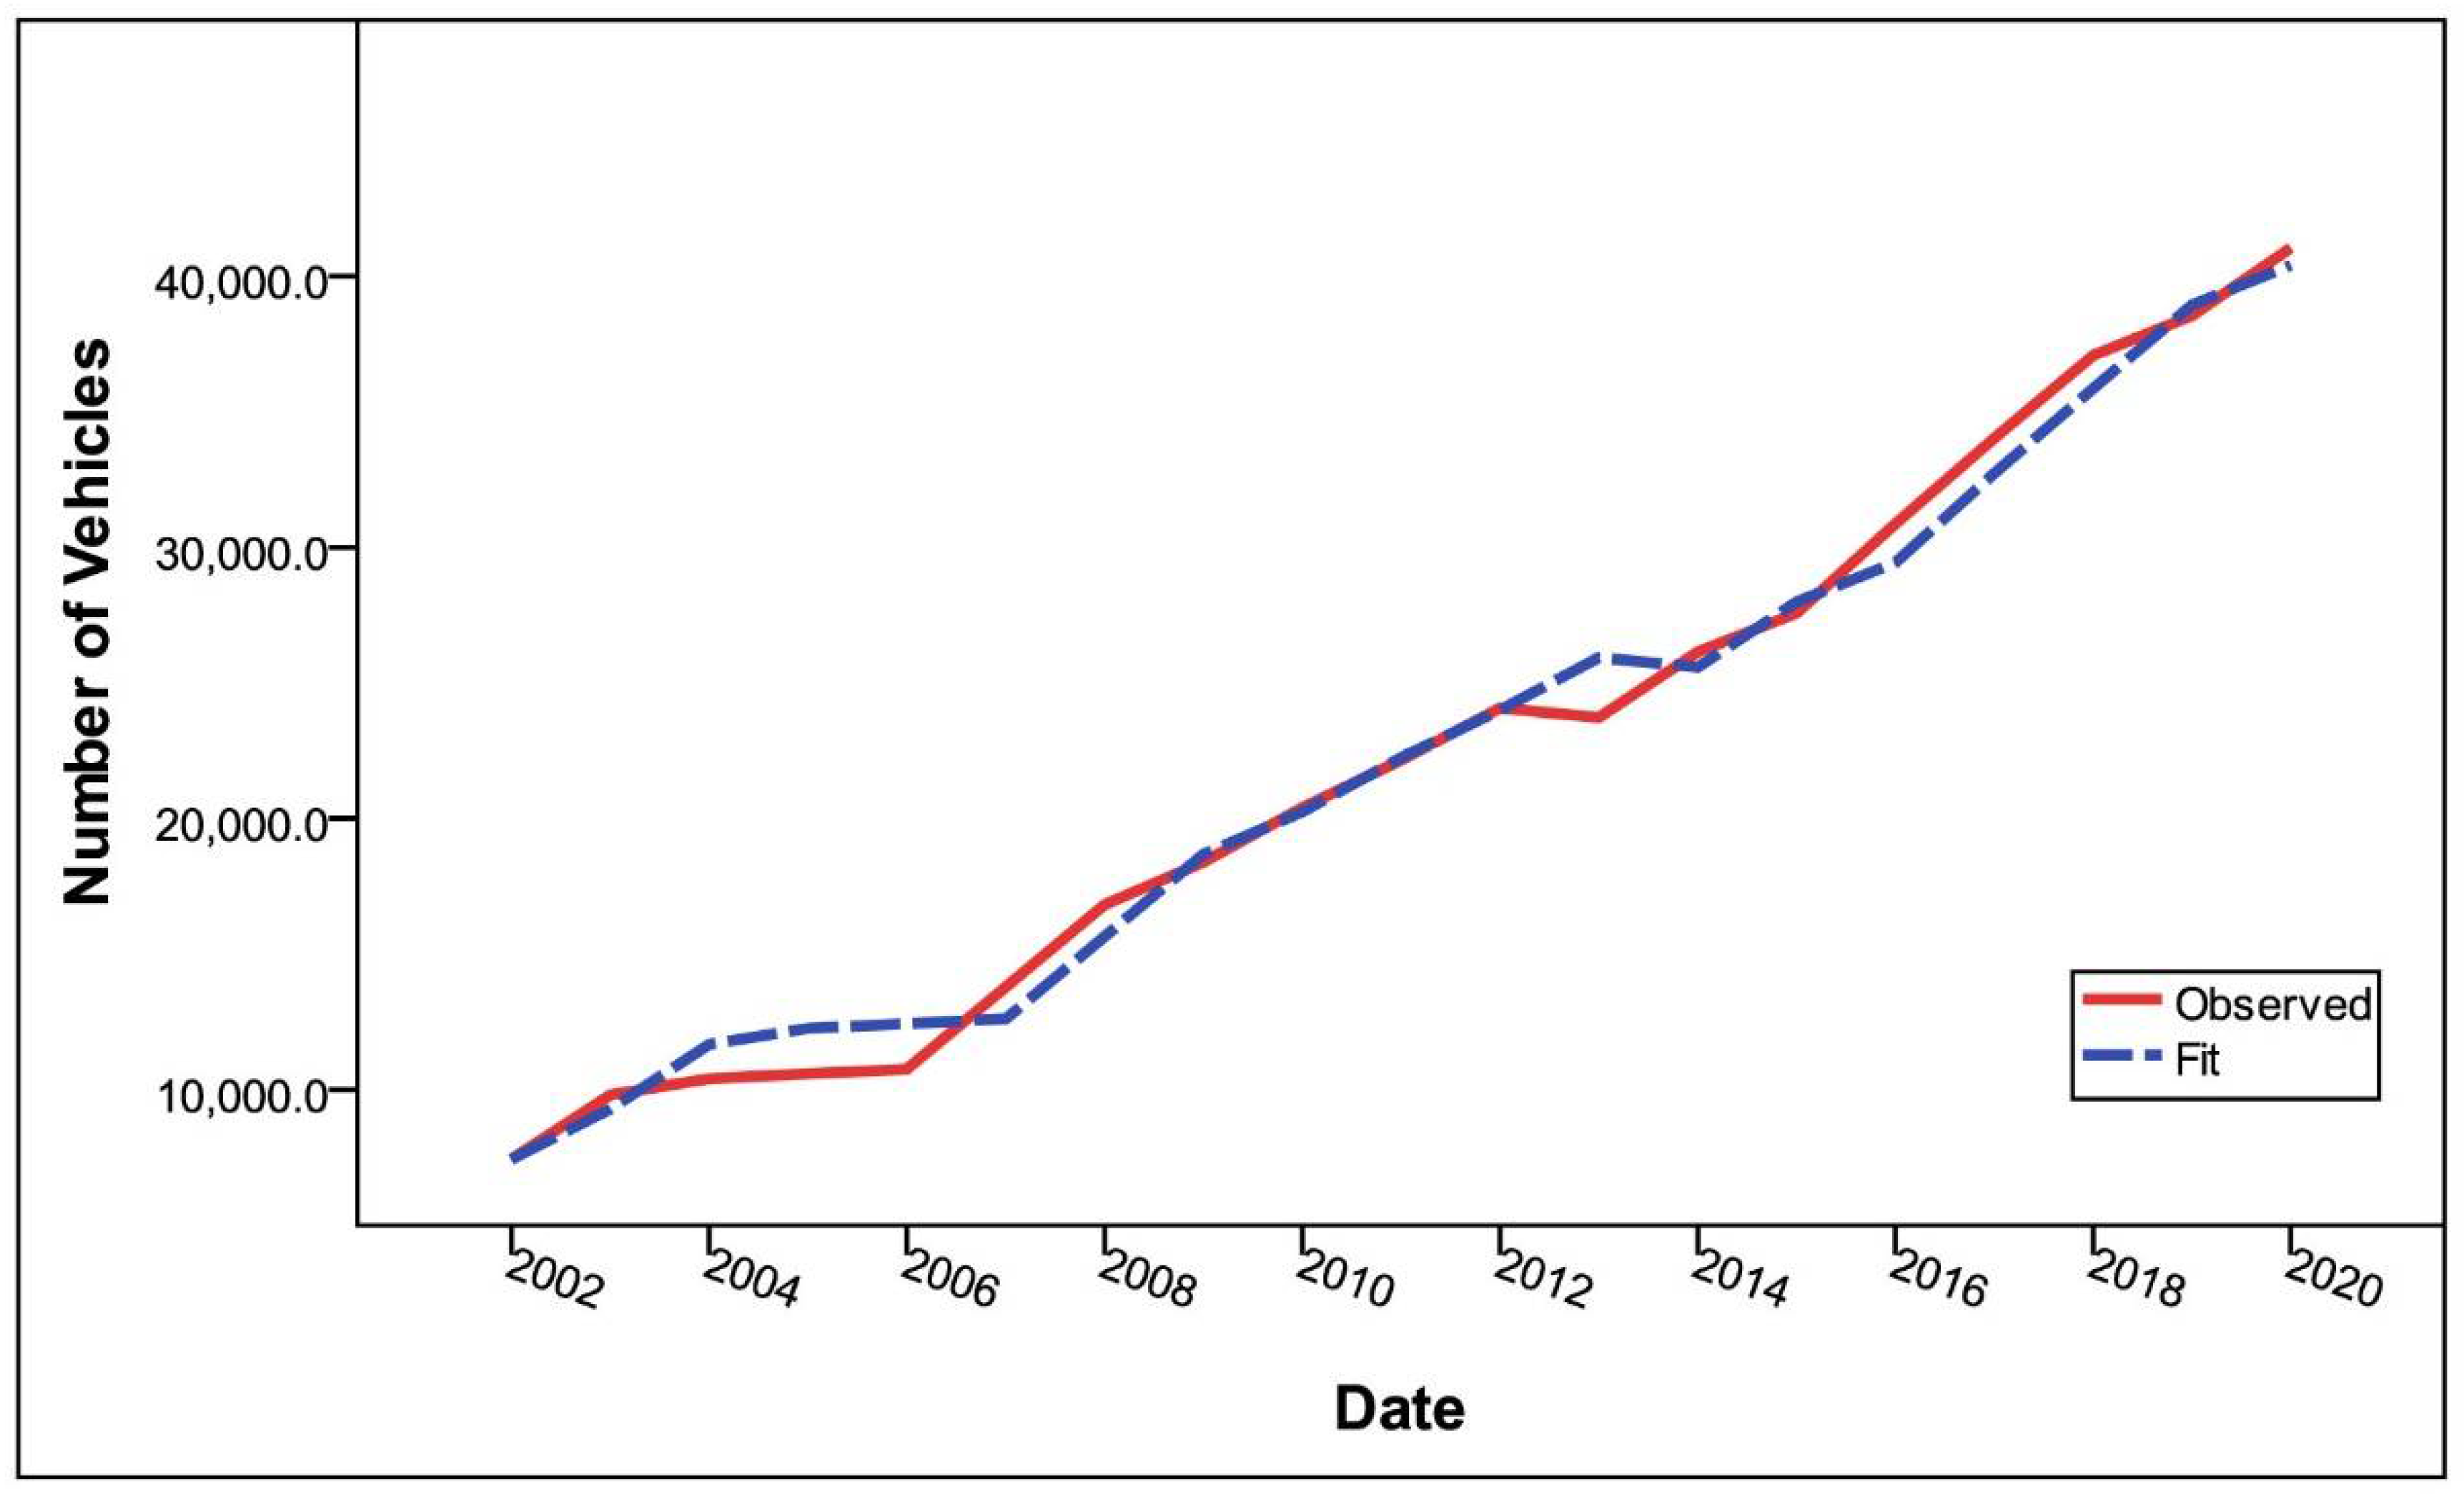
In order to determine the future economic and environmental implications of the EHSHs, the future traffic volume should be predicted. Therefore, Holt’s Exponential Smoothing Model was developed based on data on the number of vehicles in Nablus for the period 2002–2020 (data for 18 years), which were acquired from the Palestinian Central Bureau of Statistics [
15].
The prediction model with the best fit was developed using SPSS with high prediction accuracy as shown in
Figure 7. The R-Squared, Absolute Percentage Error (MAPE), and Mean Absolute Error (MAE) values for the prediction model are 0.989, 4.984, and 856.727, respectively, as shown in
Table 4. Thus, the predicted model can be used without reservations.
The prediction model results show that the expected number of vehicles in 2030 is 59,579 compared with 41,042 vehicles in 2020. In other words, there will be a significant increase in the number of vehicles (up to a 45.2% increase) compared with 2020. As a result, a significant increase in the power generated by speed humps is expected.
4.4. Environmental and Economic Implications
Firstly, the average daily amount of generated power was determined for each speed hump based on the average daily traffic on each one and the amount of power generated by each vehicle (0.0122). Since vehicles with more than two axles are very rare (and were neglected) in the studied area, it was assumed that all vehicles have two axles.
Table 5 presents the average amount of power generated each day by each speed hump in zone A as an example.
Among the six zones, Zone A has the maximum ADT and, therefore, it is expected to produce the maximum amount of electricity, while zone E produces the minimum amount of electricity. The expected average amount of power generated daily by zone A, B, C, D, E, and F is 4564.75, 4824.86, 2834.67, 5410.58, 2467.94, and 5119.132 Wh, respectively, and the expected total amount of electricity generated each day from all speed humps in Nablus city is 25,221.93 Wh as shown in
Table 6.
Secondly, the environmental implications of using the new speed hump systems were determined by calculating the reductions in GHG emissions that could be achieved by using the generated power in roadway network lightning. Based on the source of electricity in Palestine, the expected total amount of CH
4, N
2O, and CO
2 emissions produced in order to generate the electricity in power plants are 2965.78 gm of CO
2-eq/MWh [
8]. Therefore, the daily reduction in the required power (25,221.93 Wh) could achieve an annual reduction in the amount of GHG emissions of 27,302.98 gm of CO
2-eq.
Based on the results of the traffic volume prediction model, in 2030 the number of vehicles will increase by 45.2% compared with 2020. On the other hand, the number of speed humps will remain almost the same over the next 10 years as a significant increase in the length of the roadway network is not expected to occur due to unstable political and economic conditions and Israeli occupation restrictions. Therefore, the energy generated by speed humps in 2030 is expected to increase by 45.2%, so the daily reduction in the required power (36,613.67 Wh) could achieve an annual reduction in the amount of GHG emissions of 39,634.64 gm of CO2-eq.
Thirdly, the economic implications were determined by calculating the energy cost that could be saved by using the generated power for roadway lighting. Based on the current average electricity rate, which is 0.639 New Israeli Shekels (NIS) per kWh [
16] and the expected total amount of electricity generated each day from all the speed humps in Nablus city, which is 25,221.93 Wh, the expected annual reduction in energy costs due to the use of the generated power to light the roadway network is 5883 NIS.
Based on the increase in the electricity generated by speed humps in 2030 due to the increase in traffic volume (45.2% compared with 2020) and the result of the electricity rate prediction made by Hassouna and Al-Sahili [
8] using the single exponential smoothing model, which indicates that the expected electricity rate in 2030 will be 0.540 NIS/KWh, the expected annual reduction in energy costs due to the use of the generated power to light the roadway network is 7216 NIS.
5. Conclusions
Despite the fact that several EHSH models have been introduced over the past two decades, these models were prototypes that were tested in laboratories in order to determine the amount of energy that could be generated from these models without determining the feasibility of implementing these models under real traffic conditions. Therefore, this study focused on the practical implementation of EHSHs under real traffic conditions rather than testing these techniques in laboratories in order to determine the feasibility of implementing these techniques in urban areas and, furthermore, to quantify the environmental and economic implications. The current study has addressed this issue in terms of the environmental and energy cost aspects. Therefore, the capital, maintenance, and other types of costs were not included in this study. As a result, the following conclusions were drawn:
Replacing conventional speed humps with energy harvesting ones cannot be considered to be a significant source of energy. It contributes, together with other renewable sources of energy such as solar panels and wind turbines that are used on roadway networks, to decreasing the dependence on the fossil-fuel-based energy that is used in roadway lighting.
In some countries, such as Palestine, although the amount of electricity generated by EHSHs is insignificant, this source of energy is considered to be very valuable since it is a clean source of energy and it is locally produced, while most of the energy that Palestine requires is imported from outside.
The number of vehicles is expected to increase rapidly during the next 10 years (by up to 45.2% in 2030). Therefore, using EHSHs could be more beneficial and feasible in the coming years.
Based on the economic aspect, 5883 NIS could be saved in 2020 by using the generated electric power in roadway lighting. Moreover, the cost of the saved energy is expected to increase to 7216 NIS in 2030.
EHSHs are considered to be sustainable transportation tools since they reduce the GHG emissions that are produced by electric power plants in order to generate the required power for roadway network lighting. More specifically, in this study, the total amount of CH4, N2O, and CO2 emissions was found to be reduced by 27,302.98 gm of CO2-eq in 2020. Moreover, these reductions in GHG emissions are expected to increase to 39,634.64 gm of CO2-eq in 2030.
In order to increase the efficiency and the feasibility of EHSH systems, the conventional speed humps in zones with a high traffic volume only can be replaced by the energy harvesting ones. We recommend that zones with a low traffic volume be excluded, which are zones C and E in the case of Nablus city.
For traffic volume prediction in Palestine, Holt’s prediction model is recommended. This model may best fit the available data and traffic conditions in Palestine since the model parameters showed a high level of prediction accuracy.
It is recommended that EHSHs be used together with other sources of renewable energy, such as solar panels and wind turbines, in order to produce a significant amount of energy, since it is not feasible to use them as a primary source of renewable energy.
