Article

Concentrations, Size Distribution, and Community Structure Characteristics of Culturable Airborne Antibiotic-Resistant Bacteria in Xinxiang, Central China

1
Key Laboratory for Yellow River and Huai River Water Environment and Pollution Control, Ministry of Education, Henan Key Laboratory for Environmental Pollution Control, School of Environment, Henan Normal University, Xinxiang 453007, China
2
Henan Environmental Monitoring Center, Henan Key Laboratory of Environmental Monitoring Technology, Zhengzhou 450046, China
3
Research Center for Eco-Environmental Sciences, Chinese Academy of Sciences, Beijing 100085, China
*
Author to whom correspondence should be addressed.
Atmosphere 2021, 12(8), 1077; https://doi.org/10.3390/atmos12081077
Submission received: 26 July 2021 / Revised: 13 August 2021 / Accepted: 20 August 2021 / Published: 22 August 2021
(This article belongs to the Special Issue Atmospheric Pollution of Agriculture-Dominated Cities)

Abstract

:
Antimicrobial resistance is considered an important threat to global health and has recently attracted significant attention from the public. In this study, the concentrations and size distribution characteristics of culturable airborne total bacteria (TB) and four antibiotic-resistant bacteria (tetracycline-resistant bacteria (TRB), ciprofloxacin-resistant bacteria (CRB), erythromycin-resistant bacteria (ERB), and ampicillin-resistant bacteria (ARB)) were investigated for approximately one year to explore their variations under different seasons, diurnal periods, and air quality levels. The concentrations of TB and four antibiotic-resistant bacteria in winter and night were higher than during other seasons and diurnal periods. Their maximum concentrations were detected from air under moderate pollution or heavy pollution. PM2.5, PM10, SO2, and NO2 were positively related to TB and four antibiotic-resistant bacteria (p < 0.01), whereas O3 and wind speed were negatively related to them (p < 0.05). The particle size of TB and four antibiotic-resistant bacteria were mainly distributed in stage V (1.1–2.2 µm). Bacillus was the dominant genus of ARB (75.97%) and CRB (25.67%). Staphylococcus and Macrococcus were the dominant genera of TRB (46.05%) and ERB (47.67%), respectively. The opportunistic pathogens of Micrococcus, Sphingomonas, Enterococcus, Rhodococcus, and Stenotrophomonas were also identified. This study provides important references for understanding the threat of bioaerosols to human health.

1. Introduction

Bioaerosols exist extensively in human living and natural environments, predominantly including bacteria, fungi, archaea, viruses, pollen, and endotoxins [1,2,3]. As an important component of atmospheric particulate matter, bioaerosols play an important role in atmospheric chemistry and climate change [4,5,6,7]. Bacteria are the primary component in bioaerosols, accounting for 80% of the atmospheric microbial components [3]. Exposure to high concentrations of airborne bacteria, particularly pathogenic bacteria, can cause a series of diseases, such as respiratory, digestive system, and cardiovascular diseases [8,9]. As a result, the impact of bacteria in the atmosphere on human health is gradually being valued.
In recent years, the abuse of antibiotics has led to an increase in antibiotics in the environment, which has created a challenge to life-saving antibiotic therapy [10]. China is the largest global user of antibiotics, with an annual usage of approximately 92,700 tons, about 58% of which were eventually discharged into the environment [11]. Mao et al. [12] found that the abuse of antibiotics can promote the development of bacterial resistance in the environment. They reported that bacteria in Beijing’s atmosphere have a high proportion of antibiotic resistance to penicillin and cephalosporins. The infections by antibiotic-resistant bacteria significantly increase the difficulty of treatment processes. Li et al. [13] estimated that approximately 700,000 people die from antibiotic resistance each year, globally. If the current trend continues, this number will increase to 10 million people by 2050 [13]. The atmosphere is an important pathway for the transmission of antibiotic-resistant bacteria to the public. Therefore, exploring the distribution characteristics and influencing factors of antibiotic resistance in atmospheric microorganisms is of vital importance to people’s health.
Airborne bacteria often contain a variety of pathogenic bacteria and their presence poses a significant threat to human health. For example, airborne transmission of Acinetobacter baumannii in hospitals can lead to respiratory infections, bacteremia, and meningitis, among other diseases [14,15]. As an important human pathogen, Staphylococcus are widely present in wastewater treatment plant bioaerosols, which can cause bacteremia and skin infections in humans [16,17]. Several recent studies have reported that a large number of pathogenic bacteria have also been detected in the outdoor atmospheric environment [18,19,20]. Pathogenic bacteria with antibiotic resistance can lead to increased difficulty in treating bacterial infections and prolonged hospital stays, in addition to an increase in the cost of treatment [21]. Thus, research on the community structures of pathogenic bacteria with antibiotic resistant is of significance.
Four antibiotics with relatively high usage in China were selected for this study: tetracycline (tetracyclines), ciprofloxacin (quinolones), erythromycin (macrolides), and ampicillin (β-lactams) [11]. The concentrations and size distribution of culturable airborne total bacteria (TB), and four antibiotic-resistant bacteria (tetracycline-resistant bacteria (TRB), ciprofloxacin-resistant bacteria (CRB), erythromycin-resistant bacteria (ERB), and ampicillin-resistant bacteria (ARB)) were investigated for about one year to explore their variations under different seasons, diurnal periods, and air quality levels. The effects of meteorological factors on the airborne bacteria and four antibiotic-resistant bacteria were analyzed. The microbial community structures and pathogens of the four antibiotic-resistant bacteria were further identified. The exposure risk of humans to airborne bacteria during the sampling period was also calculated. The purpose of this study was to provide meaningful data on the distribution characteristics and influencing factors of bacteria and resistant bacteria in the atmosphere, and to assess the potential hazards of bioaerosols to human health.

2. Materials and Methods

2.1. Study Sites and Sample Collection

Bioaerosol samples in this study were collected from November 2017 to December 2018 in Xinxiang, China (113.9° E, 35.3° N) (Figure S1). The bioaerosol samples were obtained from a total of 41 days over four seasons (spring: 9 days; summer: 9 days; autumn: 10 days; winter: 13 days). The sampling site was on the roof of the School of Environment Building at Henan Normal University about 30 m above the ground. The site is surrounded by trees and residential and school buildings, with no large pollution source nearby. The samples were collected using a six-stage Andersen Sampler (Applied Technical Institute of Liaoyang, China) with an average flow rate of 28.3 L/min for 3 min. The specific parameters are shown in Table 1. The sampler was sterilized with 75% ethanol before sampling. At each sampling time, the experiment was repeated three times to ensure reliability. To explore diurnal variation, the samples were collected at 9:00, 14:00, and 19:00, respectively, at each sampling day.
The air quality index (AQI), PM2.5, PM10, SO2, NO2, CO, and meteorological factors, including relative humidity (RH), temperature (T), and wind speed (WS), were obtained from the Department of Ecology and Environment of Henan Province (http://1.192.88.18:18111/page/PublishingSystem/index.html (accessed on 22 December 2018)). These official data were obtained from multiple monitoring stations distributed in the urban district, and accurately reflected the meteorological and air quality data for Xinxiang and other cities of Henan Province. In Xinxiang, there are four environmental monitoring stations located in the urban center and the outskirts of the city. According to ambient air quality standards (GB 3095–2012) [22] and the Technical Regulation on Ambient Air Quality Index (HJ 633–2012) [23], the air quality levels in this study were categorized into five pollution levels: excellent (AQI < 50), good (51 < AQI < 100), slight pollution (101 < AQI < 150), moderate pollution (151 < AQI < 200), and heavy pollution (201 < AQI < 300).
The airborne total bacteria were cultured on Beef-Peptone media (3 g beef extract, 10 g peptone, 5 g NaCl, 16 g agar, 1 L distilled H2O, pH 7.2–7.6). Tetracycline (16 µg/L), ciprofloxacin (4 µg/L), erythromycin (32 µg/L), and ampicillin (32 µg/L) were added to four separate Beef-Peptone media to cultivate the corresponding antibiotic-resistant bacteria [24,25,26]. The culture media were prepared under aseptic conditions and cultured at 37 °C for 24 h, and the sterile media were selected for sampling. Blank culture media without collection used as the negative controls were also brought to the sampling site during the experiments. After sampling, the culture media and negative controls were incubated at 37 °C for 48 h and counted manually. The concentrations of the total bacteria and the four antibiotic-resistant bacteria were calculated using Equation (1):
C = N × 1000 t × Q  
where C is the concentration of bacteria or antibiotic-resistant bacteria (CFU/m3), N is the number of colonies at each stage, t is the sampling duration (min), and Q is the gas flow rate [27].
In addition, the positive-hole method was used to correct the number of CFUs [27]. After incubation, 1 mL 1 × phosphate buffer solution (PBS) was used to wash the culturable bacteria, and a sterile spatula was employed to transfer the bacteria on different media into a corresponding 10 mL sterile centrifuge tube. The bacterial solution was stored in a sealed environment at −20 °C for further analysis.

2.2. DNA Extraction, DNA Amplification, and Illumina Sequencing

DNA from culturable bacterial samples was extracted using an E.Z.N.A.® soil DNA Kit (Omega Bio-tek, Norcross, GA, USA) following the manufacturer’s instructions. The final DNA concentration and purity were determined by a Nano Drop ND-2000 (Nano Drop Technologies, Wilmington, DE, USA) spectrophotometer. The DNA quality was examined by 1% agarose gel electrophoresis, and the extracted DNA was then amplified by PCR. The forward primer 338F (5-ACTCCTACGGGAGGCAGCAG-3) and the reverse primer 806R (5-GGACTACHVGGGTWTCTAAT-3) were used to amplify the V3-V4 hypervariable region of the bacterial 16S rRNA gene. Thermal cycling consisted of initial denaturation at 95 °C for 3 min, followed by 27 cycles of denaturation at 95 °C for 30 s, 30 s for annealing at 55 °C, and extension at 72 °C for 45 s, with a final extension of 10 min at 72 °C. Finally, the PCR products were sequenced on an Illumina MiSeq platform at Majorbio Bio-Pharm Technology Co., Ltd. (Shanghai, China).

2.3. Health Risk Assessment

To assess the hazards of bacterial aerosols to human health, a non-carcinogenic risk assessment model of inhalation and dermal contact pathway was used in this work [28].
ADD inh = A C × I R × E F × E T B W × A T
ADD der = A C × S A × S L × A B S × E F × E T B W × A T
HQ = A D D R f D
HI = ΣHQi
where ADDinh is the daily mean inhalation dose of bioaerosol [CFU/(kg·d)]; ADDder is the daily mean dermal contact dose of bioaerosol [CFU/(kg·d)]; AC is the mean concentration of bioaerosols (CFU/m3); IR is the average daily inhalation rate (m3/d); EF is the exposure frequency (d/yr); ET denotes the exposure time (yr); SA is the exposure of the skin surface area (m2); SL represents the skin adherence factor [kg/(m3·d)]; ABS denotes the factor of dermal adsorption; BW represents the body weight (kg); AT is the average life expectancy (d); HQ is the hazard quotient for non-carcinogenic pollutants; RfD represents the reference dose (CFU/m3) of bacteria, and HI is the sum of the hazard index, which represents the sum of the hazard quotients of each pollutant from multiple exposure pathways. The detailed parameters are shown in Table S1.
When HQ or HI ≤ 1, the non-carcinogenic effect can be ignored. However, when HQ or HI > 1, non-carcinogenic effects should be taken seriously [29].

2.4. Statistical Analysis

Spearman’s correlation analysis was used in this study. Significant differences in data were analyzed using the t-test and one-way analysis of variance (ANOVA). A p-value of less than 0.05 or less than 0.01 represents a statistically significant difference at the 95% or 99% confidence level, respectively. These methods were performed using SPSS Statistics 24. Data visualization was conducted using Origin 2018 software.

3. Results and Discussion

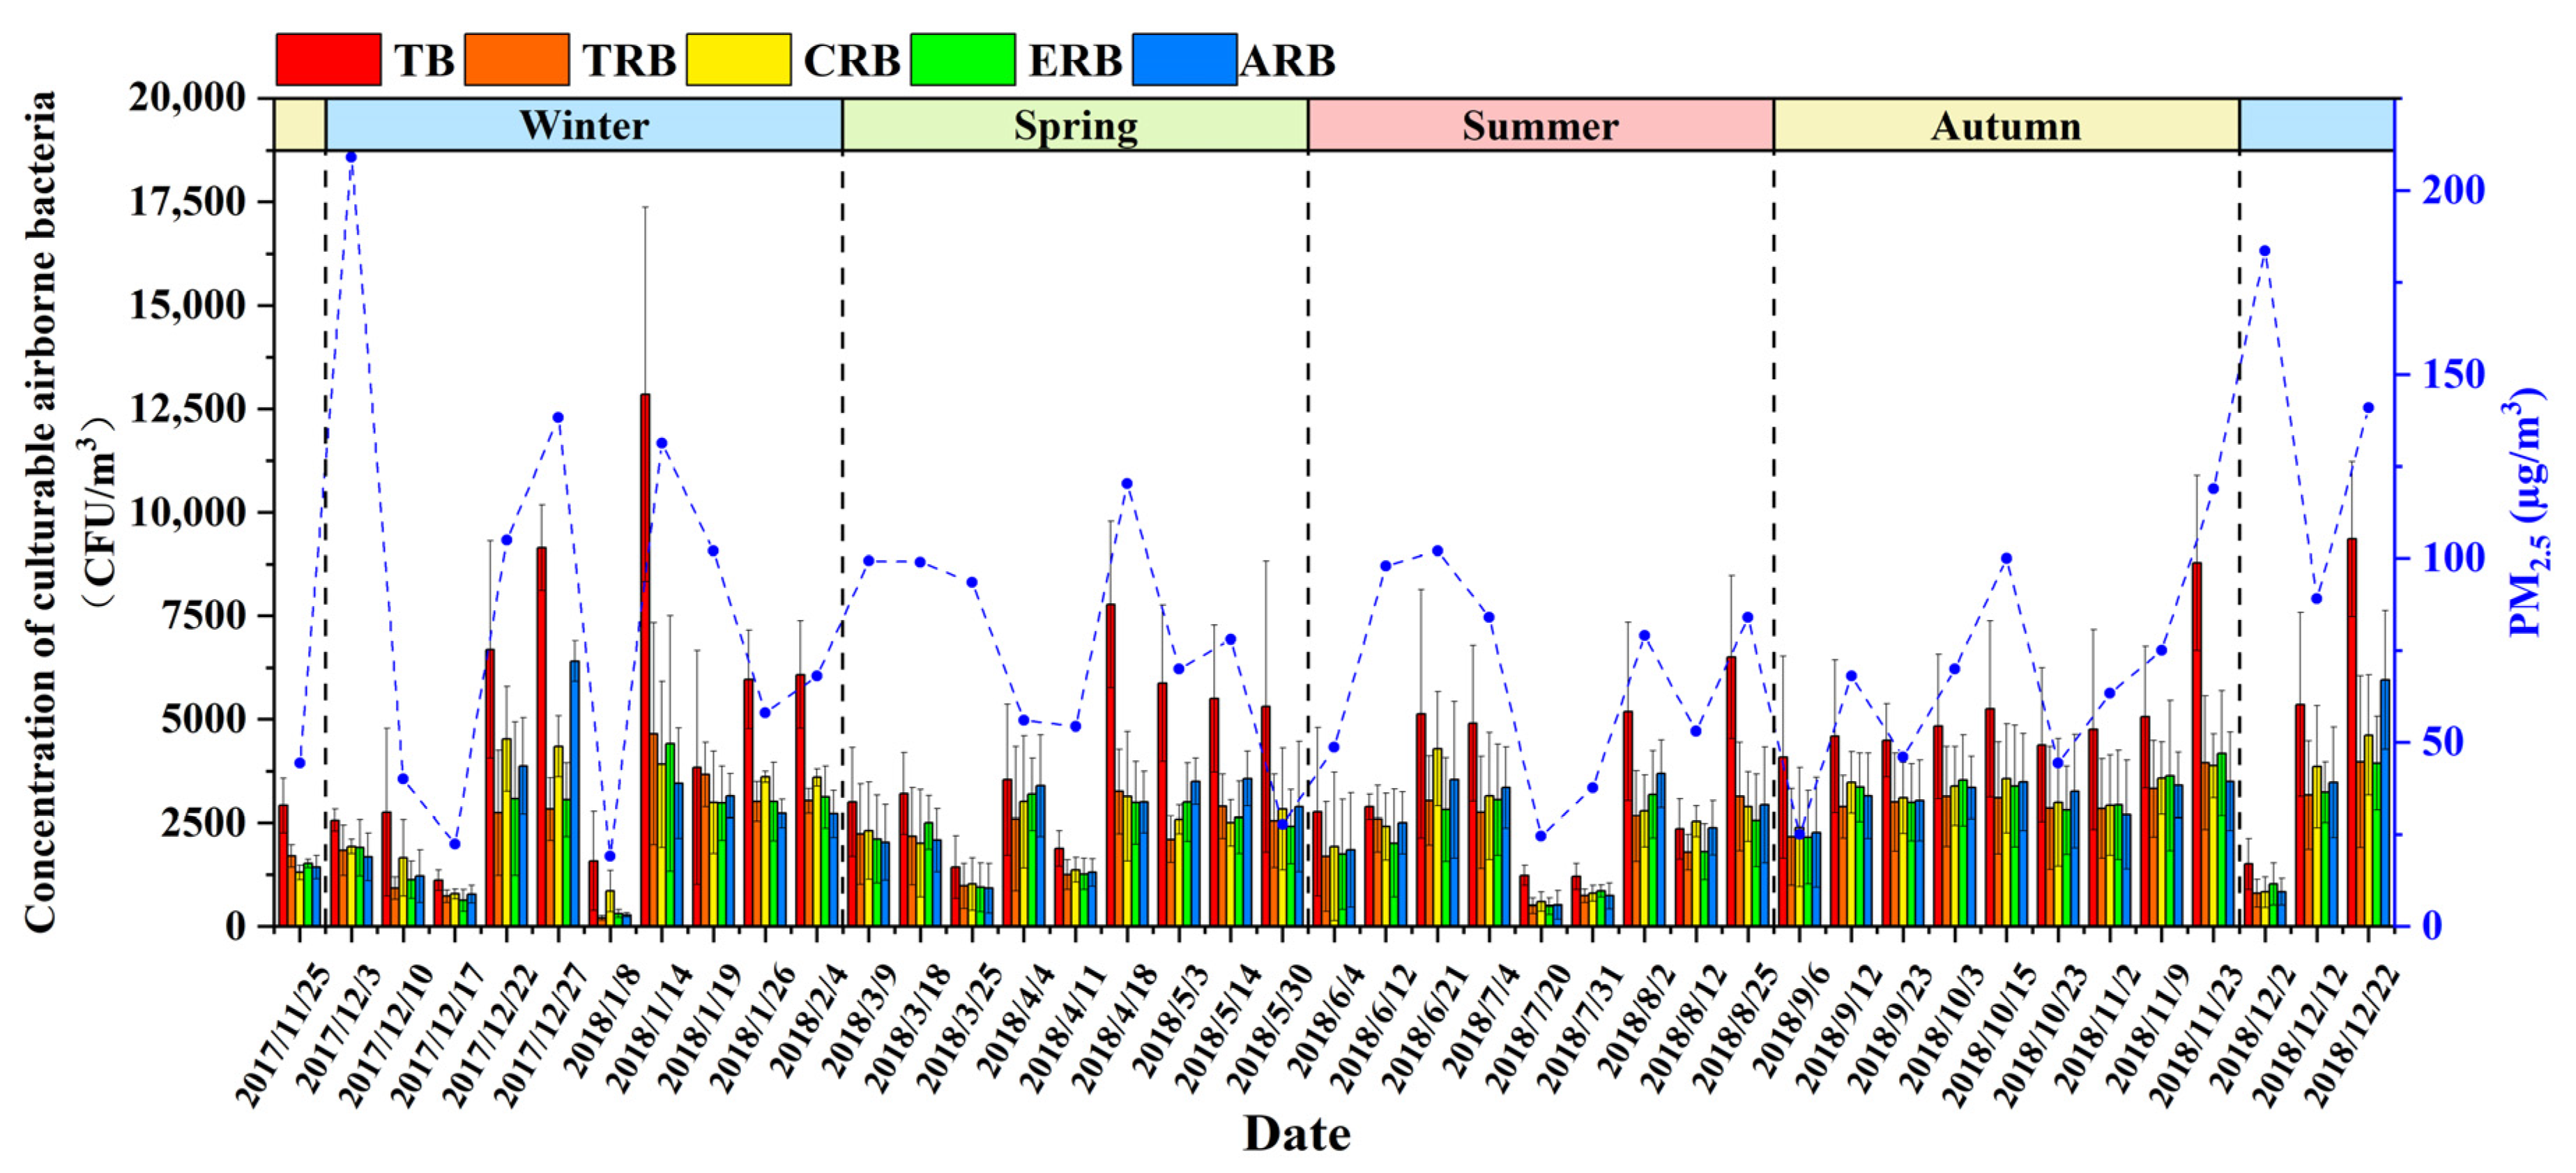
3.1. Concentrations of Airborne Bacteria and Antibiotic-Resistant Bacteria during Sampling Days

The daily average concentration of culturable airborne bacteria during the sampling period is shown in Figure 1. Samples were collected from November 2017 to December 2018, covering different seasons. The concentrations of TB, TRB, CRB, ERB, and ARB samples were in the range of 1.11 × 10³–1.29 × 10⁴ CFU/m3, 2.06 × 10²–4.65 × 10³ CFU/m3, 5.95 × 10²–4.62 × 10³ CFU/m3, 3.13 × 10²–4.41 × 10³ CFU/m3, and 2.76 × 10²–6.41 × 10³ CFU/m3, respectively. The highest concentrations of TB, TRB, and ERB were detected on 14 January 2018. The maximum concentrations of CRB and ARB were detected on 22 December 2018 and 27 December 2017, respectively. On these three days, the concentrations of PM2.5 were relatively high, with concentrations of 131 ± 13 µg/m3, 105 ± 30 µg/m3, and 138 ± 21 µg/m3, respectively. The maximum concentration of PM2.5 (i.e., 209 μg/m3) was detected on 3 December 2017, on which, however, the concentrations of bioaerosols were very low (TB: 2563 ± 268 CFU/m3, TRB: 1837 ± 612 CFU/m3, CRB: 1931 ± 173 CFU/m3, ERB: 2563 ± 268 CFU/m3, ARB: 1677 ± 581 CFU/m3). A reasonable explanation is that fine particles can adsorb more toxic chemical components that are harmful to the organisms in the air [30]. In addition, Lu et al. [31] thought that there was not enough surface area for microorganisms to attach to fine particles. A similar phenomenon was also found in Gao et al. [32] in Beijing.
Antibiotic-resistant bioaerosols are a part of the total airborne bacteria with a relatively stable ratio. The mean aerosol concentrations of culturable TRB, CRB, ERB, and ARB accounted for 49.7%, 55.8%, 49.5%, and 53.8% of the culturable bacterial aerosols, respectively. Mao et al. [12] found that over 70% of culturable bacteria were resistant to penicillin in Beijing’s atmospheric environment. Given such high rates of antibiotic resistance in culturable bacteria, aerosol, especially opportunistic pathogenic bacteria and pathogenic bacteria, can cause a range of human respiratory diseases [20,33].

3.2. Bioaerosols Concentration and Size Distribution at Different Air Quality Levels

The concentrations and size distribution of TB and the four culturable antibiotic-resistant bacteria are shown in Figure 2, and exhibited a unimodal distribution pattern under different AQI classes. Particles with sizes less than 4.7 µm are defined as respirable particles, whereas those less than 2.1 µm are defined as fine particles [34]. When the air quality deteriorated from excellent to heavy pollution, the concentrations of TB and the four antibiotic-resistant bacteria first increased and then decreased. The maximum concentrations of TB (6673 ± 6242 CFU/m3) and ERB (2821 ± 2737 CFU/m3) were detected when the air quality was moderately polluted. The maximum concentrations of TRB (2795 ± 1766 CFU/m3), CRB (3135 ± 1377 CFU/m3), and ARB (3030 ± 1677 CFU/m3) were detected when the air quality was classified as heavy pollution. The concentrations of TB and the four kinds of antibiotic-resistant bacteria under excellent air quality conditions were significantly lower than those under good, slight, and moderate pollution air quality (p < 0.05). The concentrations of TRB and ARB were significantly lower under good air quality than those under heavy pollution (p < 0.05).
Air quality conditions have a significant effect on the concentrations of microbial aerosols [35]. As a carrier for microorganisms, the concentration of particulate matter in the atmosphere is very low at an excellent level. When the air quality changed from excellent to heavy pollution, the concentrations of TB and four culturable antibiotic-resistant bacteria increased first, with the peak values appearing at slight or moderate pollution levels, and then decreased at heavy pollution. Xie et al. [35] also found that the bioaerosol concentration was the highest under moderately polluted air quality and, when the pollution increased, the bioaerosol concentration decreased. This was because, with the deepening of the haze, the concentrations of toxic substances attached to the particulate matter also increased, which led to an inhibition of the growth of microorganisms [31,36,37]. It is interesting to note that the concentrations of TRB and ARB under good air quality conditions were significantly lower than those under heavy pollution (p < 0.05). However, under heavy pollution, the concentration of ARB slightly increased compared to that under moderate pollution air quality levels. A reasonable speculation is that antibiotic-resistant bacteria, especially pathogenic bacteria, have a strong tolerance to toxic and harmful substances in the atmosphere [38]. With the increase in atmospheric pollution, the bacterial community structure in the atmospheric environment changes significantly. Under heavy pollution air quality, some bacteria that can resist the hostile environment gradually become the predominant genera and lead to an increase in bacterial aerosol concentration [37].
Figure 2 also indicates the differences in the size distribution of bioaerosols between the five air quality levels. Under excellent air quality, the highest concentrations of TB and the four antibiotic-resistant bacteria appeared in stage IV (2.1–3.3 µm), whereas under other air conditions, the highest concentrations occurred in stage V (1.1–2.2 µm). The relative abundance of respirable particles under different air quality conditions is shown in Figure S3. The highest relative abundances of TB (91.1%), TRB (89.7%), and ERB (92.3%) in respirable particles were found under moderate pollution air quality, and the highest relative abundances of CRB (87.5%) and ARB (90.2%) were observed under heavy pollution conditions. Figure S3 shows the relative abundance of fine particles under different air quality conditions. The maximums in TB (55.4%) and ERB (55.9%) of fine particles were found under moderate pollution air quality, and those in CRB (49.3%) and ARB (56.5%) were found under heavy pollution conditions. The highest value of TRB (56.0%) was found under slight pollution. Moreover, all TB and the four antibiotic-resistant bacteria had the minimum abundance of respirable and fine particulates under excellent air quality.
As a key factor affecting public health, the size of the particle determines the sedimentation location of airborne bacteria in the respiratory system. When the particle size is less than 5 µm, the bioaerosol can be deposited in the lower respiratory tract through respiration and induce asthma or allergies [39]. In this study, the proportion of respirable bioaerosol particles was more than 80%, and the percentage of fine particles was more than 45%, when AQI was higher than 50. In a previous study, the particle size distribution of bioaerosols exhibited a bimodal distribution pattern under haze conditions in Qingdao. The results show that one peak appeared at 1.1–2.1 µm, which is consistent with our results, whereas the other peak was at 4.7–7.0 µm [7]. Gong et al. [40] also found a similar phenomenon in Qingdao, where one peak was at 1.1–2.1 µm and the other peak was at >7 µm. In this study, the particle size distribution of the four antibiotic-resistant bacteria was similar to that of TB. Mao et al. [12] found that the peak concentration of cultivable bacterial aerosols in Beijing’s outdoor atmospheric environment under polluted weather conditions was at stage IV (2.1–3.3 µm). Under non-polluting weather conditions, the relative abundance of cultivable bacterial aerosol concentration in stage IV (2.1–3.3 µm) was also relatively high. Among the bioaerosols, penicillin-resistant bacteria accounted for 72.4% and 83.3% of cultured bacteria, under polluted and non-polluting air quality conditions, respectively. Li et al. [13] found that the relative abundance of quinolone, macrolide, and tetracycline antibiotic-resistant genes in PM2.5 at Xi’an in 2014 was significantly higher than that in the past decade (p = 0.041). Hu et al. [41] reported that the tetracycline-resistant genes in the atmospheric environment during haze have the highest relative abundance and the resistant gene abundance in fine particles is greater than that in non-smog weather. In brief, the results of this study indicate that the largest percentages of inhalable and fine particulate matter occurred in moderately or heavily polluted air quality levels. Therefore, we speculate that, under conditions of polluted air quality, especially moderately polluted conditions, a large number of pathogenic bacteria having an inhalable particle size will pose a greater threat to human health.

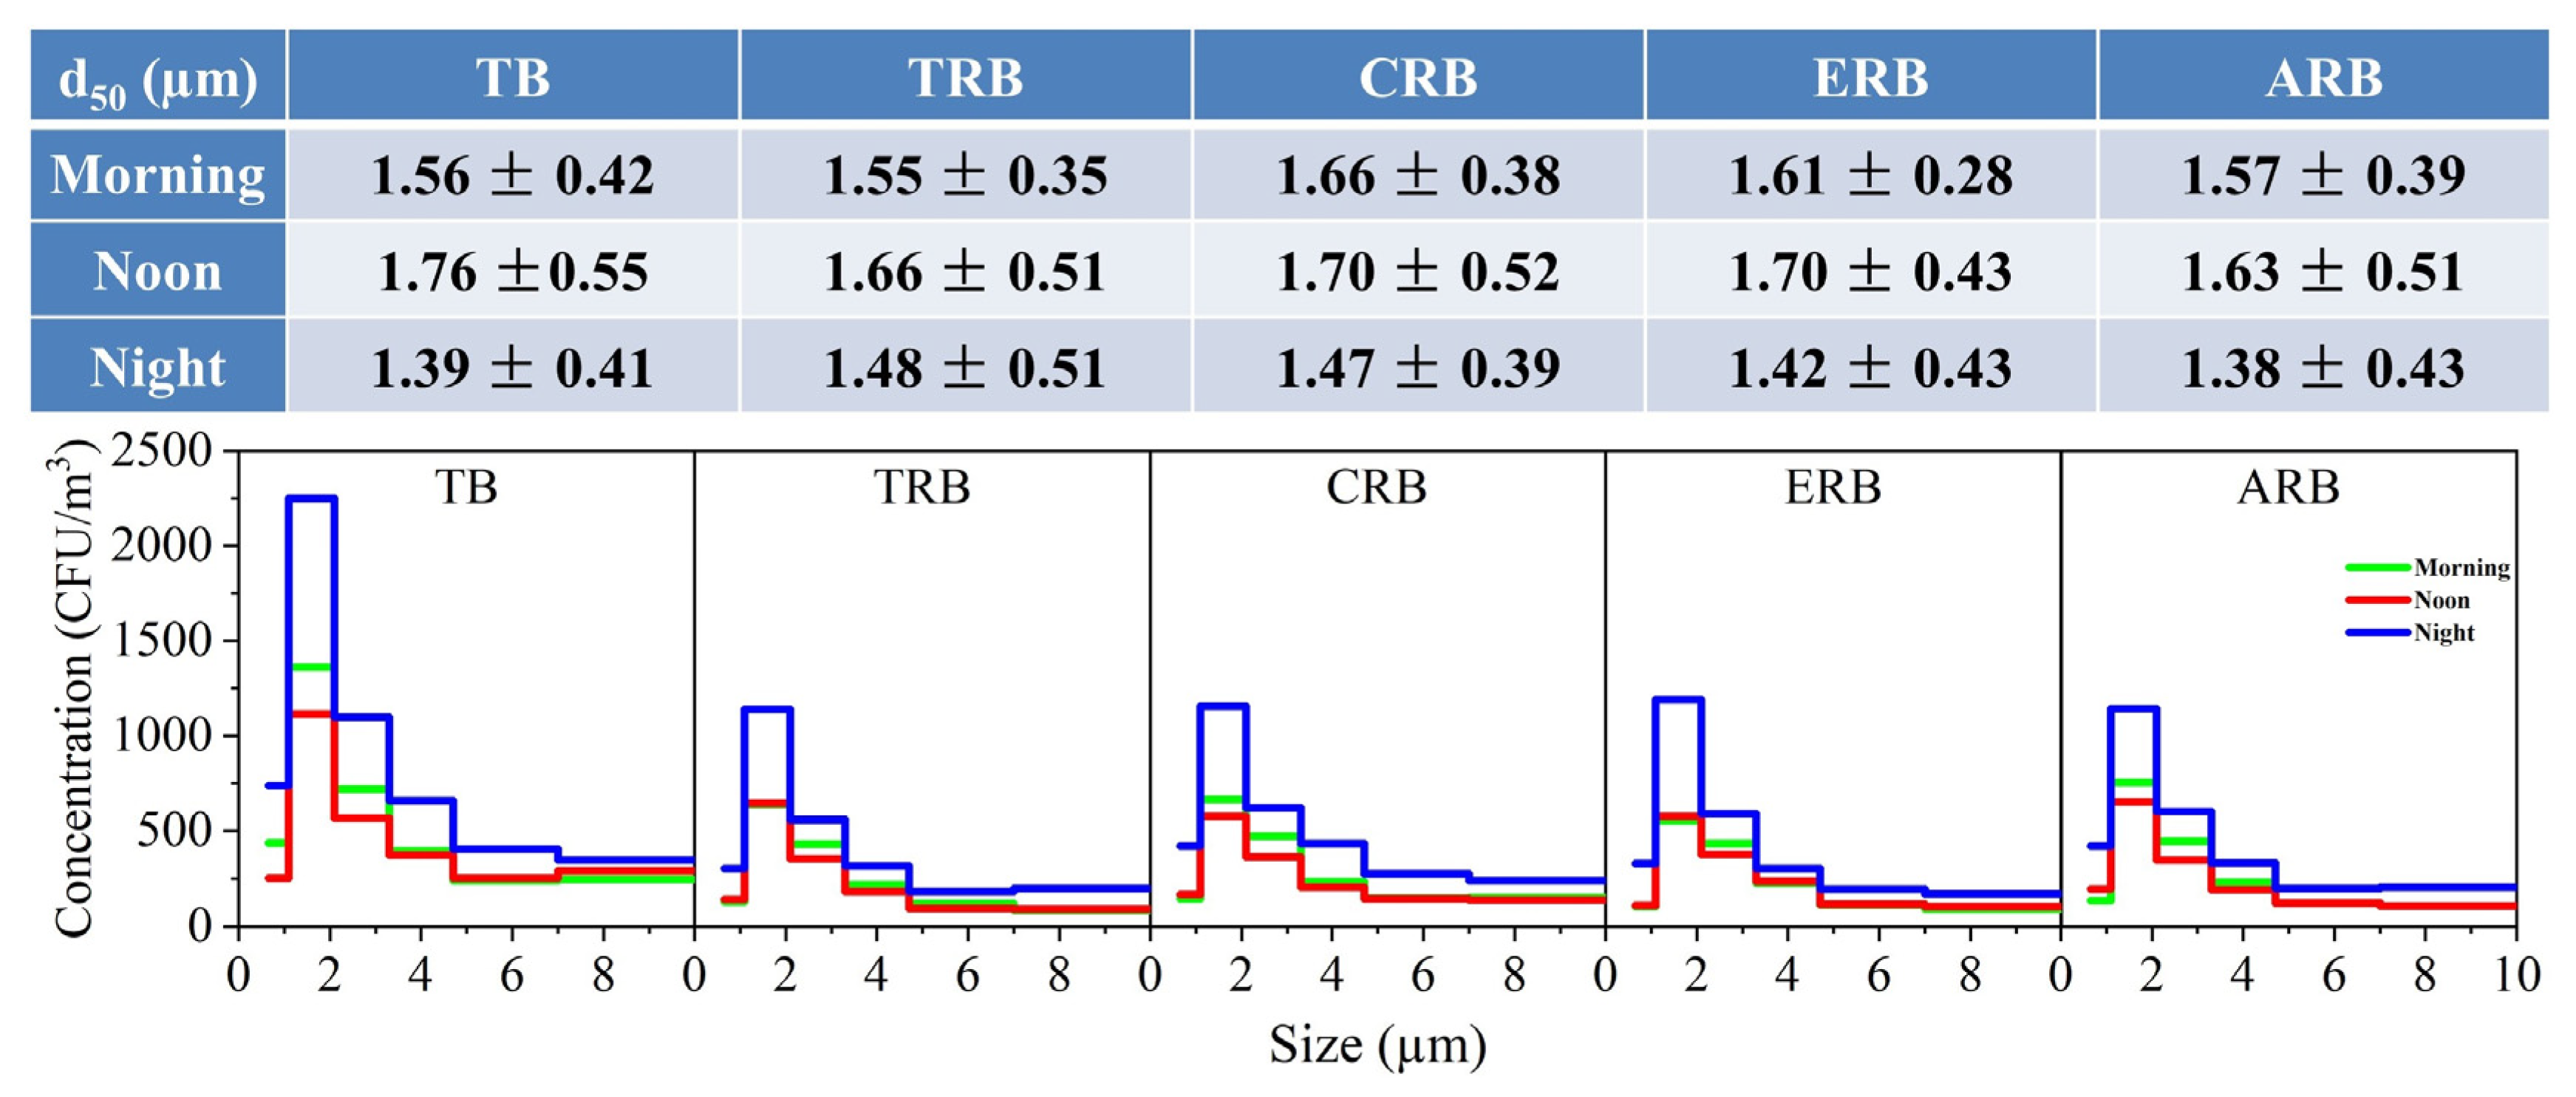
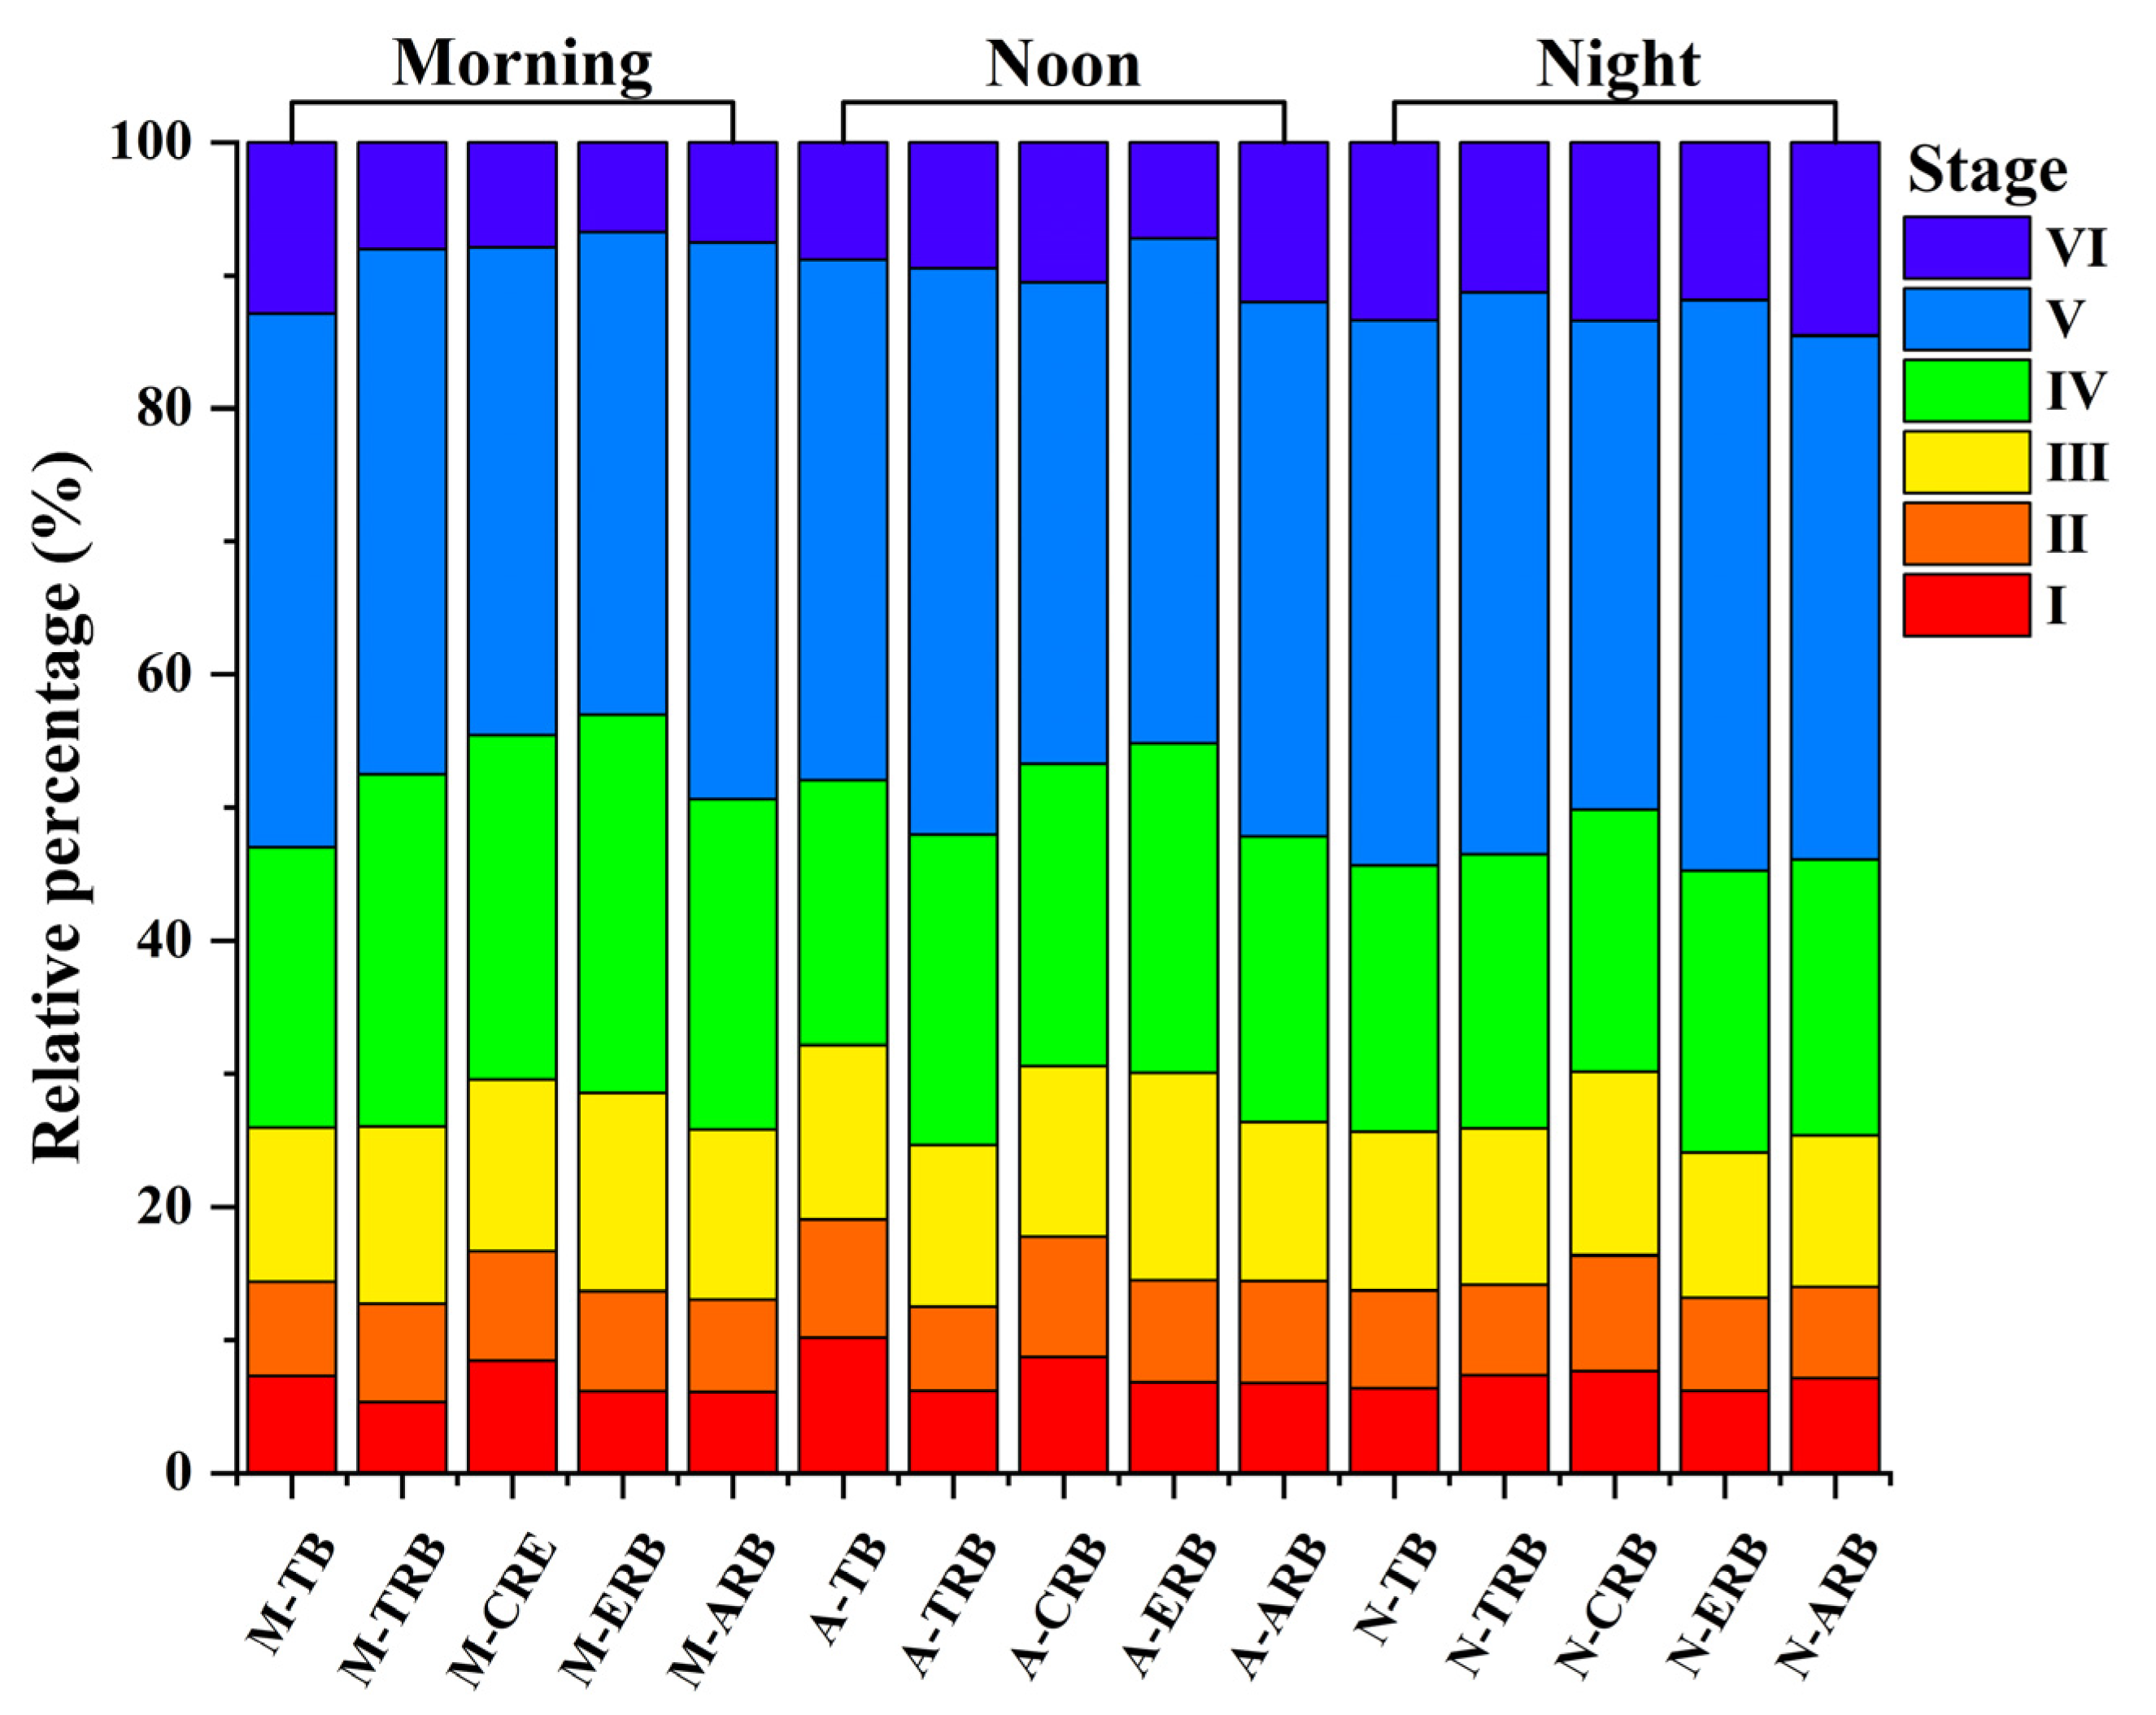
3.3. Effect of Time Factor on Bioaerosol Concentration and Particle Size Distribution

The temporal variation in the concentrations of airborne bacteria and the four antibiotic-resistant bacteria during the sampling period is shown in Figure 3. The differences in the concentrations were observed between the three diurnal periods at different size stages. The highest concentrations of cultivable bacteria and four antibiotic-resistant bacteria all appeared at night (TB: 5500 ± 4289 CFU/m3, TRB: 2701 ± 1750 CFU/m3, CRB: 3145 ± 1923 CFU/m3, ERB: 2774 ± 1954 CFU/m3, and ARB: 2904 ± 1771 CFU/m3), and were significantly higher than those at noon (p < 0.05). The lowest concentrations were observed at noon, with TB values of 2850 ± 2432 CFU/m3, TRB: 1514 ± 1406 CFU/m3, CRB: 1595 ± 1103 CFU/m3, ERB: 1520 ± 1114 CFU/m3, and ARB: 1622 ± 1444 CFU/m3.
Similar results have also been found in previous studies. Fang et al. [42] found that the lowest and highest concentrations of bacterial aerosols in the atmospheric environment of Hangzhou appeared at noon and night, respectively. Gao et al. [43] also found that the concentrations of bacterial aerosols in Beijing’s atmospheric environment at noon were lower than those in the morning and evening. The variation in solar radiation intensity during the daytime was considered the primary reason for this phenomenon, because strong solar radiation can cause the death of microorganisms and reduce the concentration of bioaerosols [44,45,46,47]. The solar radiation intensity at noon was greater than that in the morning and evening. Human activity is another potential reason for the changes in bioaerosol concentrations, and leads to an increase in bioaerosol concentrations during morning and evening rush hours [40,42,47].
The bacterial aerosols and the four antibiotic-resistant bacteria were mainly distributed in stage V (1.1–2.2 µm) (Figure 4). In addition, the proportion of fine particles of bacterial aerosol and the four antibiotic-resistant bacteria during the night period were higher than those in the morning and noon. According to the diameter of the effective cross-sectional particle at each level of the Anderson microbiological sampler and the cumulative percentage of each level, a logarithmic regression fitting process was carried out. The dynamics of d50 are shown in Figure 3, showing that the d50 values varied under different sampling periods. For the bacterial aerosols and the four antibiotic-resistant bacteria, the largest and smallest d50 values appeared at noon and at night, respectively. The size of the particulate matter determines the location of the deposition in the respiratory tract and poses varying degrees of threat to human health [48]. Previous studies revealed that particulate matter adversely affects human health, primarily at particle sizes less than 10 μm, because particles in this range can be inhaled into the human respiratory system through the nasal cavity, and even deposited in the respiratory system. In addition, the particles with a size less than 1 μm can puncture the alveoli and enter the body’s fluid circulation system [49,50]. Thus, according to these results, safeguard procedures for people are suggested when taking part in outdoor activities at night.

3.4. Meteorological Factors of Airborne Bacteria and Four Antibiotic-Resistant Bacteria

This study used Spearman’s correlation analysis to explore the relationship between bioaerosol concentrations and meteorological factors (Table 2). The results showed that the concentrations of culturable bacterial aerosol and the four antibiotic-resistant bacteria had a statistically extremely significant positive correlation with AQI, PM2.5, PM10, SO2, and NO2 (p < 0.01). In contrast, the concentration of O3 showed an extremely significant negative correlation with the concentrations of TB, TRB, CRB, and ARB (p < 0.01) and had a significantly negative correlation with the concentration of ERB (p < 0.05). WS also showed an extremely significant negative correlation with the concentration of TB (p < 0.01) and a significantly negative correlation with the four antibiotic-resistant bacteria (p < 0.05).
In this study, PM2.5 and PM10, as the parameters characterizing the concentration of atmospheric particulate matter, showed a positive correlation with the concentrations of bacterial aerosols. The increase in PM concentration leads to an increase in AQI and contributes more carriers for the attachment of microorganisms. A similar phenomenon was observed in Xi’an [31,35,47]. It is worth noting that the correlation coefficients between TB and the four antibiotic-resistant bacteria and PM10 were all greater than those of PM2.5. Previous studies have shown that, compared with fine particles, coarse particles have a larger specific surface area, which provides better adhesion of microorganisms. In addition, coarse particles can protect microorganisms and reduce damage from solar radiation, and provide the corresponding carbon sources and energy for bacteria in the atmosphere [20,31,46]. SO2 and NO2 in the atmosphere can be converted into sulfates and nitrates, which are nutrients for the microorganisms [7]. Similarly, a positive correlation between bioaerosol concentration and SO2 and NO2 has also been found in other studies [31,37,40,51]. The influence of RH on bacterial aerosols is complex [45]. Microbes like to live in environments with high humidity, so higher RH can increase the concentration of bioaerosols [47]. However, no significant correlation between RH and bioaerosol concentration was found in this study. A similar phenomenon was also observed in the atmospheric environments of the Seoul subway station and Qingdao [7,52]. Therefore, it is necessary to further explore the exact relationship between RH and bacterial aerosol concentrations. In a previous study, ozone was shown to penetrate and rupture the bacterial cell membrane, change the permeability of the cell, and eventually lead to cell death [53]. Moreover, the reaction of ozone with olefins and “open air factors” will lead to increased toxicity [54,55]. Therefore, it is generally believed that ozone has a bactericidal effect and is negatively correlated with the concentration of bacterial aerosols. A large number of studies have observed this corresponding phenomenon [7,31,38]. In this study, the negative correlation coefficient between TB and ozone was the most significant, indicating that antibiotic-resistant bacteria have strong environmental tolerance. Wind can dilute biological aerosols in the atmosphere and showed a negative correlation with the concentration of bacterial aerosols. Previous studies have found a similar phenomenon [31,43]. In this study, a negative correlation between bacterial aerosols and temperature was observed. A possible reason is that the increase in temperature may accelerate atmospheric convection and the chemical reaction rate of toxic substances, which ultimately leads to a negative correlation between temperature and bacterial concentration [40,56].

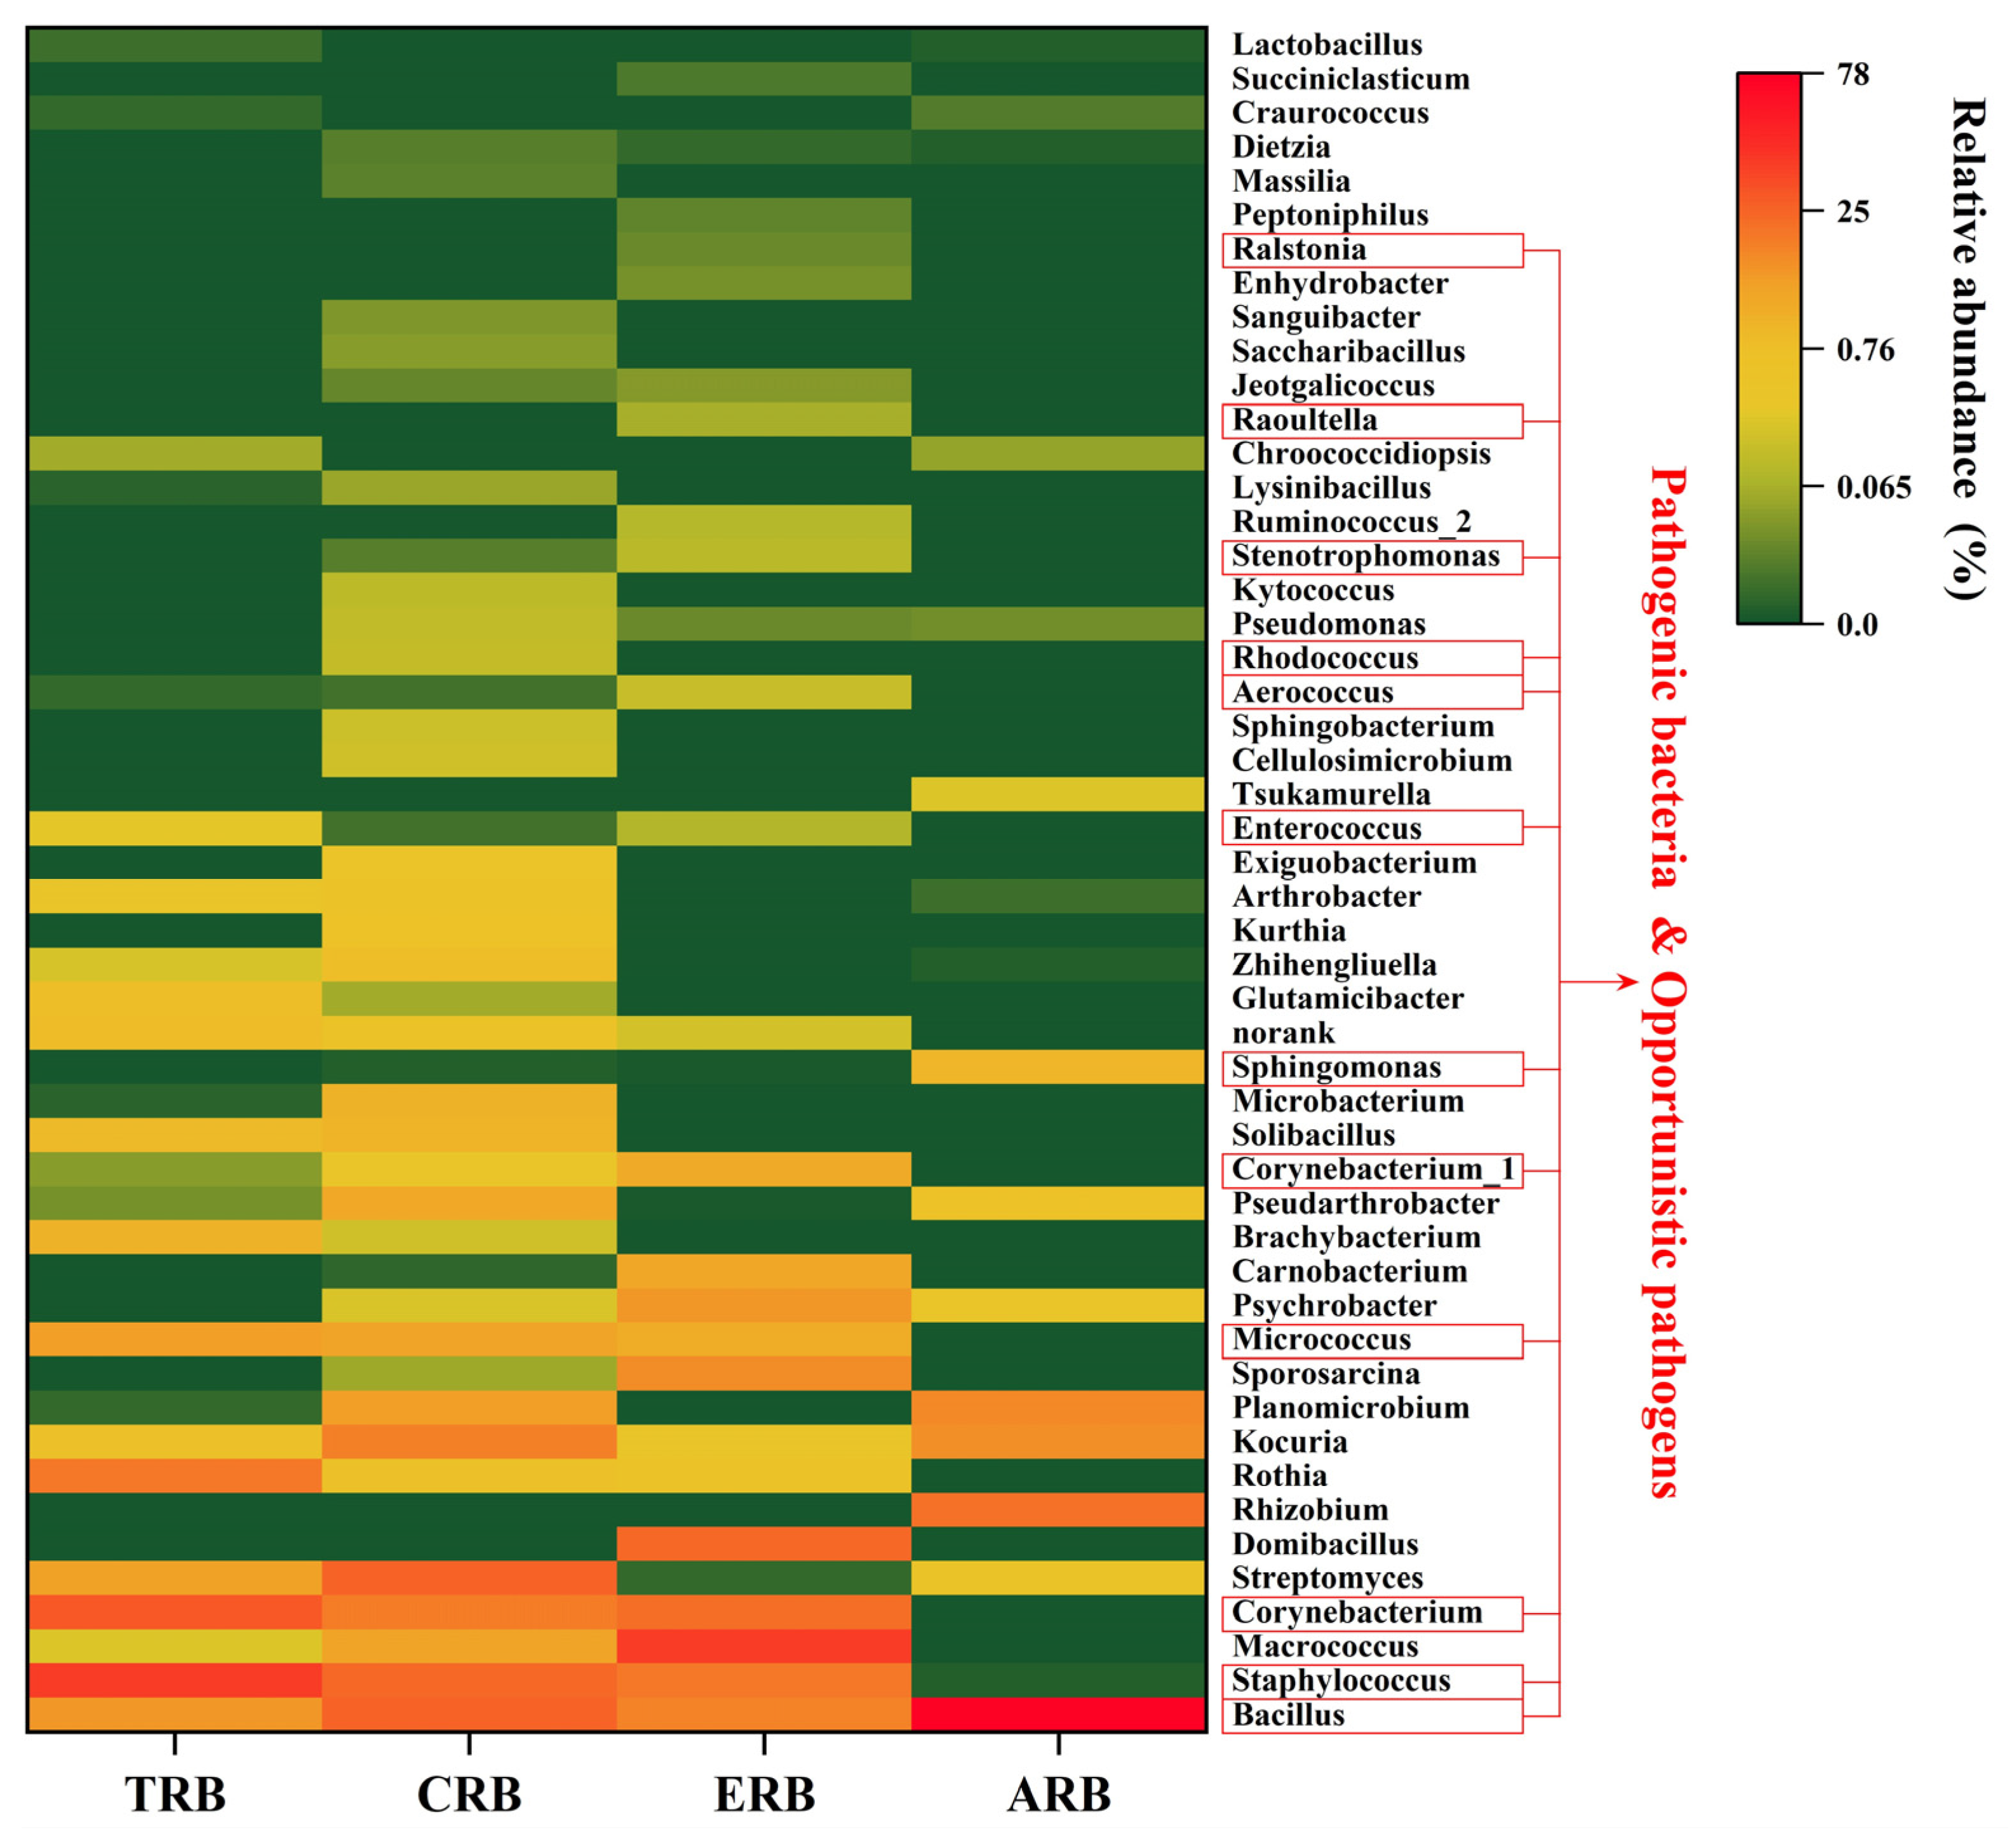
3.5. Community Structure of Four Antibiotic-Resistant Bacteria

After quality trimming, 175,228 effective sequences of the 16S rRNA genes were identified from the four antibiotic-resistant bacteria. Almost all of the trimmed sequence lengths ranged from 421 to 460 bp (99.78%) with a median length of 443 bp. The diversity and relative abundance of the top 50 bacterial genera of the four antibiotic-resistant bacteria are shown in Figure 5. The differences between the community structures of the four antibiotic-resistant bacteria can clearly be observed.
Bacillus was the dominant genus of ARB (75.97%) and accounted for a large proportion in CRB (25.67%). Staphylococcus, Streptomyces, and Macrococcus were the dominant genera of TRB (46.05%), CRB (27.29%), and ERB (47.67%), respectively. These results indicate that Bacillus spp. are not sensitive to ampicillin. Ampicillin is a β-lactam antibiotic that is widely used in China [11,57]. Researchers have observed the β-lactam-resistant gene blaTEM in the global PM. Moreover, Li et al. [58] also found Bacillus to be an ARB harboring the blaTEM gene in the airborne bacterial community around a municipal solid waste treatment system. It is worth noting that Staphylococcus was not only the dominant genera of TRB (46.05%), but also accounted for a large proportion in CRB (21.89%) and ERB (5.08%). Previous studies have also found that airborne Staphylococci were resistant to more than two types of antibiotics in a metro (mean, 2.64), park (mean, 2.03), and hospital (mean, 2.94) [59]. Similarly, several previous studies reported that Bacillus and Staphylococcus were the dominant genera in the air [20,31,38,60,61]. In some special environments, such as the atmosphere of hospitals, wastewater treatment plants, and municipal solid waste treatment systems, Bacillus or Staphylococcus were also found to be the dominant bacterial genera [39,58,62]. Notably, the genera Bacillus and Staphylococcus contain many kinds of pathogenic bacteria, such as Bacillus cereus, Bacillus anthracis, Staphylococcus saprophyticus, and Staphylococcus aureus. These pathogenic bacteria pose potential risks to human health. For example, Bacillus anthracis is the pathogen of anthrax, and Bacillus cereus can cause wound infections, pneumonia, septicemia, and meningitis [58,63]. Staphylococcus saprophyticus can cause urinary tract infections in humans [64]. Staphylococcus aureus can cause bacteremia and bacterial meningitis [65,66]. As a human pathogenic, the bacterium Corynebacterium also has a large relative abundance in TRB (33.68%), ERB (14.56%), and CRB (4.08%). Lu et al. [31] reported that Corynebacterium diphtheriae can cause diphtheria and skin infections. Nudel et al. [67] reported that, as an emerging pathogen, Corynebacterium striatum can cause infections in patients with immunodeficiency and chronic diseases, and contains aminoglycoside-, macrolide-, and tetracycline-resistant genes. Therefore, a large quantity of Bacillus, Staphylococcus and Corynebacterium in the atmosphere may pose a greater potential risk to human health.
This study also identified some opportunistic pathogens, such as Micrococcus, Sphingomonas, Enterococcus, Rhodococcus, and Stenotrophomonas. The composition of opportunistic pathogens varies in different regions and places. Fan et al. [18] found that Enterobacter, Lactococcus, and Pseudomonas dominate opportunistic pathogenic bacteria in the atmosphere of Xi’an. Opportunistic pathogenic bacteria, such as Xanthobacter, Dermatophilus, Ledionella, Enterobactor, and Colinsella were found in the aerosols of a wastewater treatment plant [68]. Although opportunistic pathogens are pathogenic only when there are specific conditions or multiple pathogens occur at the same time [69], they are also a potential threat to public health and should be paid attention to.
Overall, this study found that many pathogens and opportunistic pathogens in the atmospheric environment had multiple antibiotic resistances. Infection with antibiotic-resistant bacteria is difficult to treat [62]. Therefore, people should take corresponding protective measures under polluted air conditions, especially those with immunodeficiency or respiratory diseases [70].

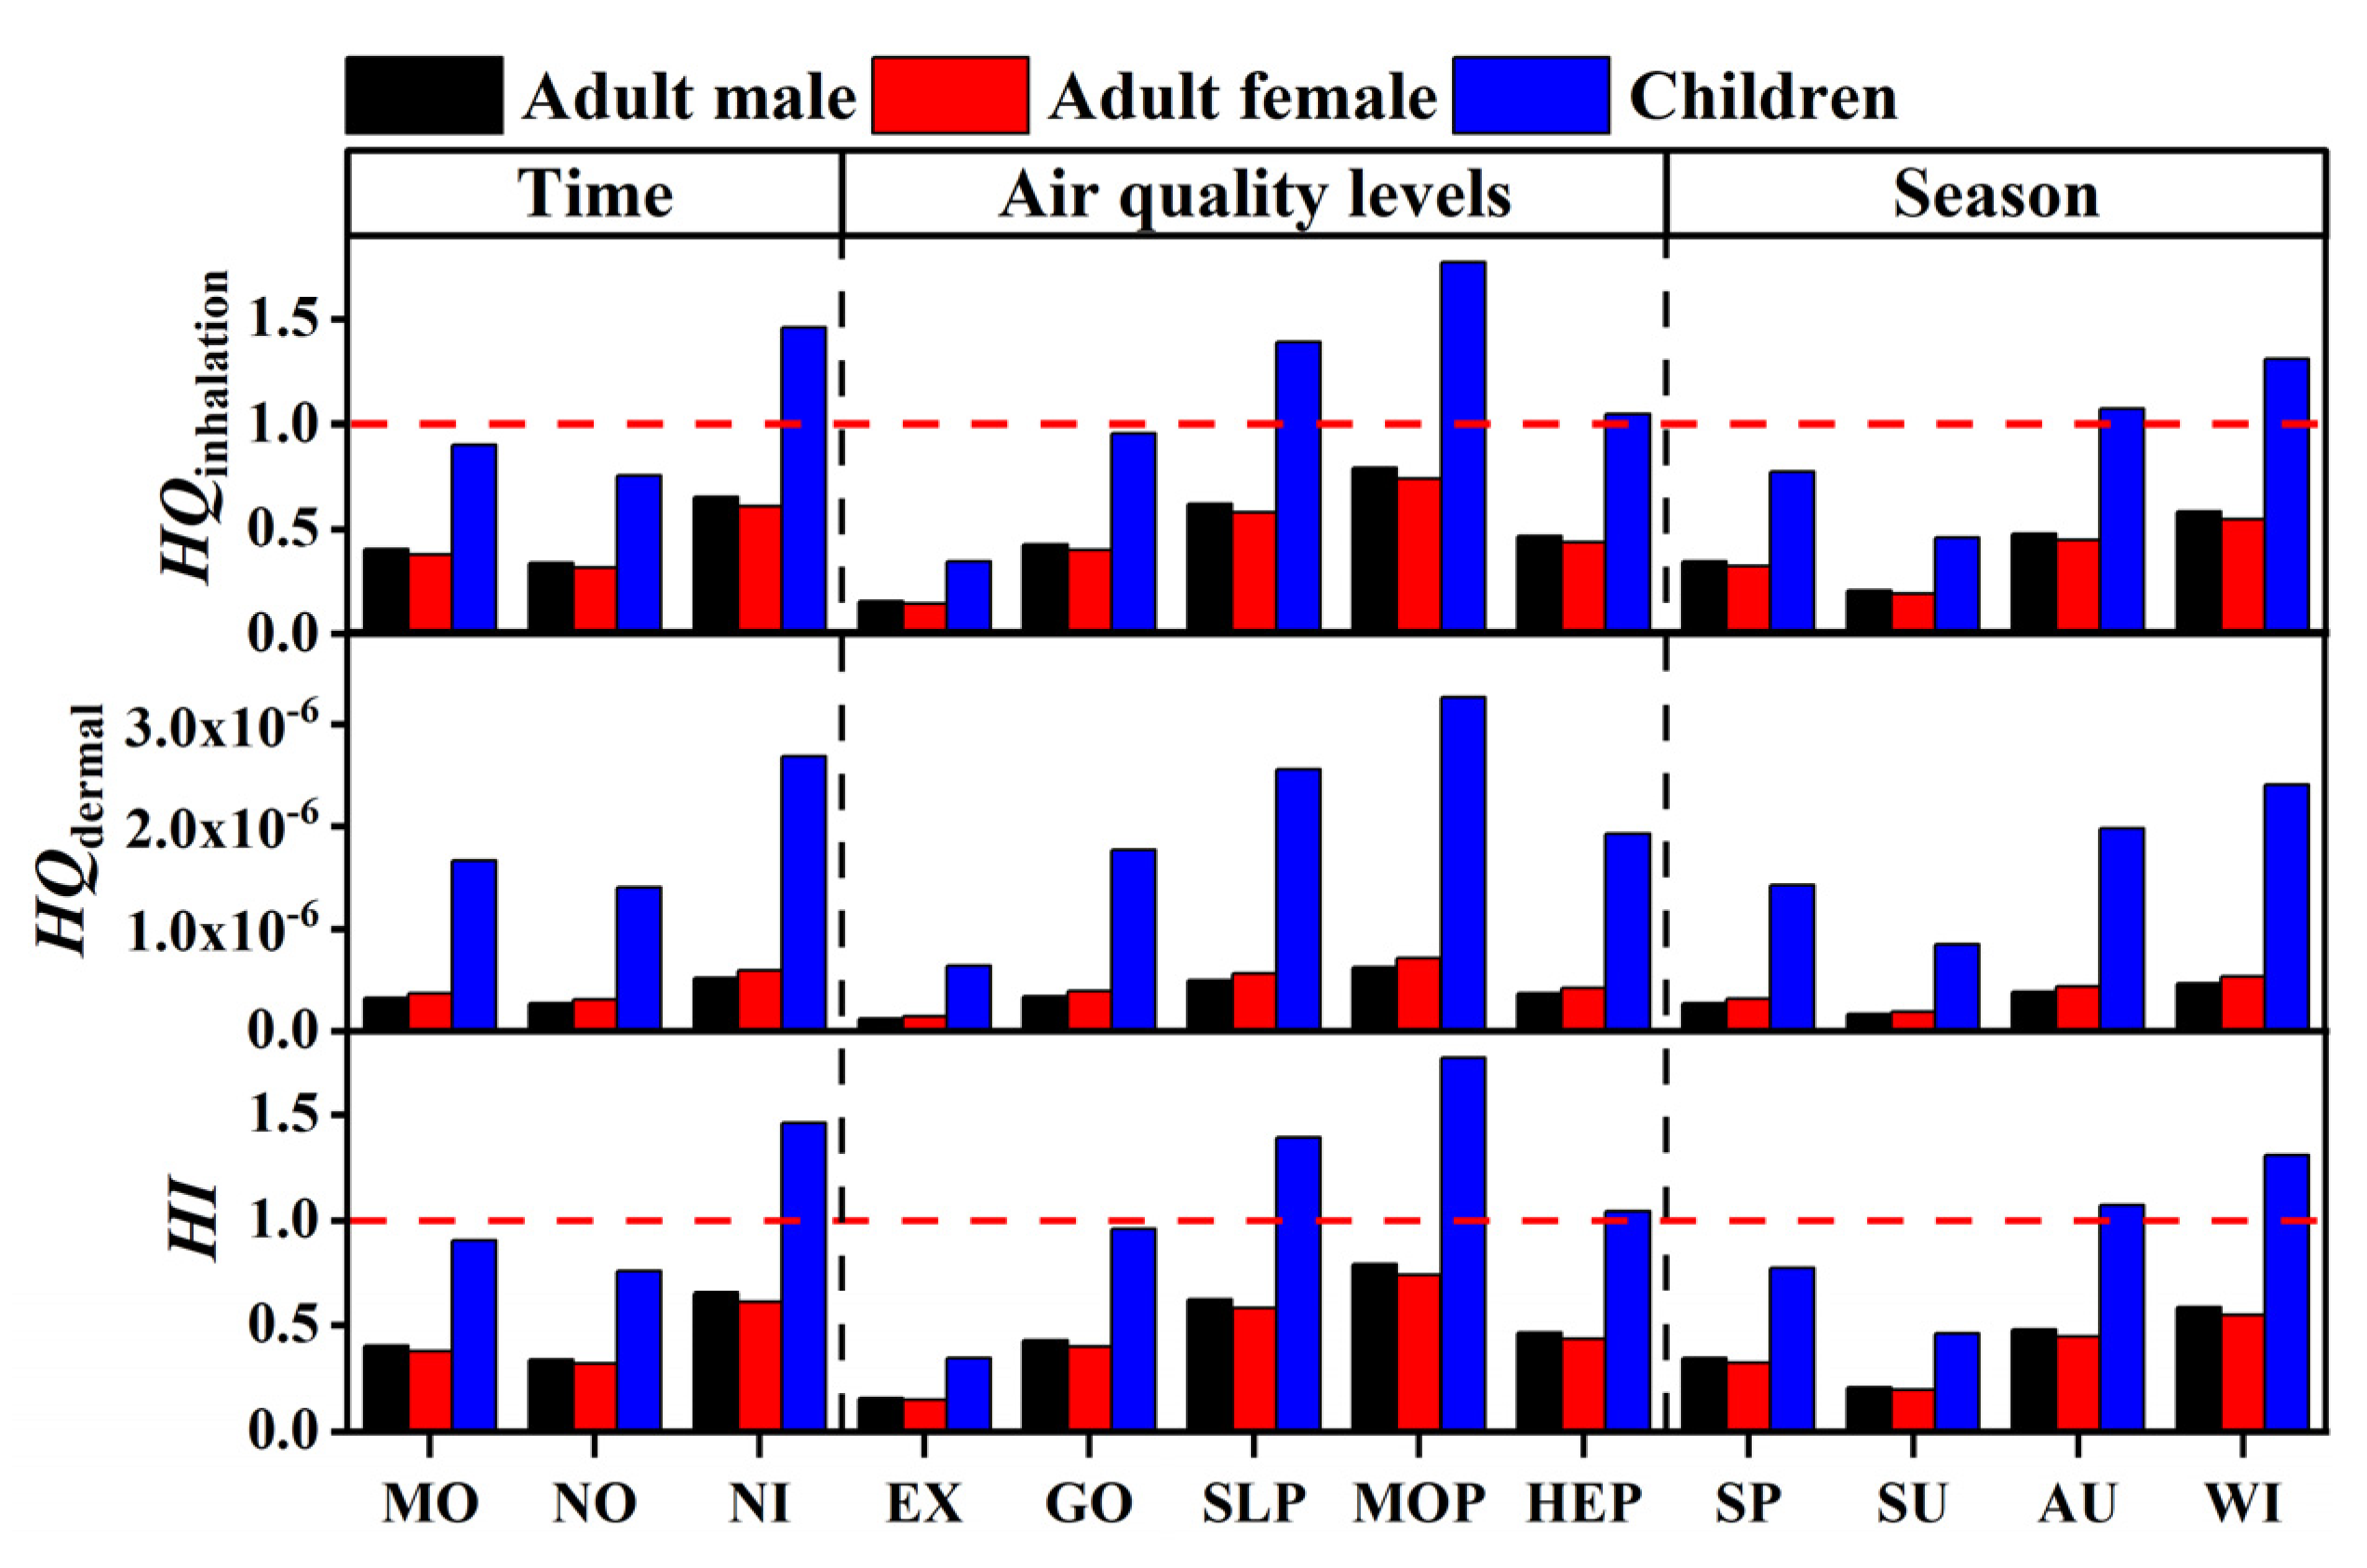
3.6. Human Health Risk Assessment

Exposure to high bacterial aerosol concentrations, especially those containing pathogenic bacteria or opportunistic pathogens, poses a serious health threat to humans. In this study, the risk indices of inhalation and skin contact under different sampling periods, air quality levels, and seasons were calculated (Figure 6).
The results show that the risk of skin contact is negligible compared to that of inhalation, suggesting that inhalation is the major exposure pathway for the intake of bioaerosols in the atmosphere. The HQ values for children were obviously higher than those for adults, which indicates that the health threats from microbial aerosols for children are more serious. The highest diurnal exposure risk was found at night, and the highest annual exposure risk was observed in winter. Under different air quality levels, the exposure risk increased with the AQI, and the highest was observed at moderate pollution air quality, then decreased at heavy pollution (Figure 6).
Based on this study, the health threats from bioaerosols in the atmosphere should be paid more attention, especially when the AQI is higher than 100. Inhalation of high concentrations of bacterial aerosols can potentially cause a series of respiratory diseases [71]. In addition, the abundance of pathogenic bacteria and resistant genes increased during haze weather conditions in winter [72]. In this study, although the exposure risk calculated for adults was < 1 (non-carcinogenic effect can be ignored), the results revealed the bacterial aerosols contain a large number of pathogenic bacteria with antibiotic resistance, and more than 60% of the bioaerosol particles were smaller than 4.7 μm (respirable particles). Even under relatively low concentrations, prolonged exposure to bioaerosols can also threaten human health [73]. Guo et al. [74] found that bacterial aerosols in the atmosphere during heavy haze events were closely related to the incidence of pneumonia. Hence, the necessary protective measures should be taken for the susceptible population, such as children, the elderly, and patients with respiratory diseases, when under polluted air quality conditions.

4. Conclusions

This study investigated the concentrations and particle size distribution of culturable airborne TB and the four antibiotic-resistant bacteria of TRB, CRB, ERB, and ARB under different seasons, diurnal periods, and air quality levels. The concentrations of airborne bacteria and antibiotic-resistant bacteria in winter and night were higher than those in other seasons and diurnal periods. They were closely related to AQI, and the maximum concentrations were observed when the AQI was higher than 150 (moderate pollution and heavy pollution). Meteorological factors of PM2.5, PM10, SO2, and NO2 were positively related to the concentration of TB and four antibiotic-resistant bacteria, whereas O3 and wind WS were negatively related. Bacillus was the dominant genus of ARB and accounted for a large proportion of CRB. Staphylococcus and Macrococcus were the dominant genera of TRB and ERB, respectively. Inhalation was the major exposure pathway for the intake of bioaerosols, and the risk of skin contact was negligible.

Supplementary Materials

The following are available online at https://www.mdpi.com/article/10.3390/atmos12081077/s1, Figure S1. The geographical location of sampling site. Figure S2. Size distribution of culturable bacteria and four antibiotic-resistant bacteria under different air quality levels. Figure S3. The relative percentage of respirable and fine particles under different weather conditions. Table S1. Parameters used in risk assessment.

Author Contributions

Conceptualization, X.Y.; methodology, Y.H.; software, J.M. and D.Q.; formal analysis, J.M. and L.G.; investigation, J.R., M.C., X.C., D.Q., M.L. and T.L.; data curation, J.M.; writing—original draft preparation, J.M.; writing—review and editing, X.Y.; supervision, C.C.; project administration, X.Y.; funding acquisition, X.Y. All authors have read and agreed to the published version of the manuscript.

Funding

This research was funded by the National Natural Science Foundation of China (No. 51408199), the Science Foundation of Henan Normal University (No. 2019QK09), the Training Plan of Young Backbone Teachers in Colleges and Universities of Henan Province (No. 2020GGJS066) and the Key Scientific Research Projects of Colleges and Universities in Henan Province (No. 21A610007).

Institutional Review Board Statement

Not applicable.

Informed Consent Statement

Not applicable.

Data Availability Statement

Not applicable.

Acknowledgments

We are grateful for financial support from the National Natural Science Foundation of China (No. 51408199), the Science Foundation of Henan Normal University (No. 2019QK09), the Training Plan of Young Backbone Teachers in Colleges and Universities of Henan Province (No. 2020GGJS066) and the Key Scientific Research Projects of Colleges and Universities in Henan Province (No. 21A610007).

Conflicts of Interest

The authors declare no conflict of interest.

References

  1. Stetzenbach, L.D.; Buttner, M.P.; Cruz, P. Detection and enumeration of airborne biocontaminants. Curr. Opin. Biotechnol. 2004, 15, 170–174. [Google Scholar] [CrossRef]
  2. Jaenicke, R. Abundance of cellular material and proteins in the atmosphere. Science 2005, 308, 73. [Google Scholar] [CrossRef]
  3. Zhai, Y.; Li, X.; Wang, T.; Wang, B.; Li, C.; Zeng, G. A review on airborne microorganisms in particulate matters: Composition, characteristics and influence factors. Environ. Int. 2018, 113, 74–90. [Google Scholar] [CrossRef]
  4. Douwes, J.; Thorne, P.; Pearce, N.; Heederik, D. Bioaerosol health effects and exposure assessment: Progress and prospects. Ann. Occup. Hyg. 2003, 47, 187–200. [Google Scholar] [CrossRef] [Green Version]
  5. Pratt, K.A.; Demott, P.J.; French, J.R.; Wang, Z.; Westphal, D.L.; Heymsfield, A.J.; Twohy, C.H.; Prenni, A.J.; Prather, K.A. In situ detection of biological particles in cloud ice-crystals. Nat. Geosci. 2009, 2, 397–400. [Google Scholar] [CrossRef]
  6. Vaïtilingom, M.; Deguillaume, L.; Vinatier, V.; Sancelme, M.; Amato, P.; Chaumerliac, N.; Delort, A.M. Potential impact of microbial activity on the oxidant capacity and organic carbon budget in clouds. Proc. Natl. Acad. Sci. USA 2013, 110, 559–564. [Google Scholar] [CrossRef] [Green Version]
  7. Dong, L.J.; Qi, J.H.; Shao, C.C.; Zhong, X.; Gao, D.M.; Cao, W.W.; Gao, J.W.; Bai, R.; Long, G.Y.; Chu, C.C. Concentration and size distribution of total airborne microbes in hazy and foggy weather. Sci. Total Environ. 2016, 541, 1011–1018. [Google Scholar] [CrossRef]
  8. Riggs, D.W.; Yeager, R.A.; Bhatnagar, A. Defining the human envirome: An omics approach for assessing the environmental risk of cardiovascular disease. Circ. Res. 2018, 122, 1259–1275. [Google Scholar] [CrossRef]
  9. Roy, R.; Jan, R.; Joshi, U.; Bhor, R.; Pai, K.; Satsangi, P.G. Characterization, pro-inflammatory response and cytotoxic profile of bioaerosols from urban and rural residential settings in Pune, India. Environ. Pollut. 2020, 264, 114698. [Google Scholar] [CrossRef]
  10. Zhu, Y.G.; Johnson, T.A.; Su, J.Q.; Qiao, M.; Guo, G.X.; Stedtfeld, R.D.; Hashsham, S.A.; Tiedje, J.M. Diverse and abundant antibiotic resistance genes in Chinese swine farms. Proc. Natl. Acad. Sci. USA 2013, 110, 3435–3440. [Google Scholar] [CrossRef] [Green Version]
  11. Zhang, Q.Q.; Ying, G.G.; Pan, C.G.; Liu, Y.S.; Zhao, J.L. Comprehensive evaluation of antibiotics emission and fate in the river basins of China: Source analysis, multimedia modeling, and linkage to bacterial resistance. Environ. Sci. Technol. 2015, 11, 6772–6782. [Google Scholar] [CrossRef]
  12. Mao, Y.; Ding, P.; Wang, Y.; Ding, C.; Wu, L.; Zheng, P.; Zhang, X.; Li, X.; Wang, L.; Sun, Z. Comparison of culturable antibiotic-resistant bacteria in polluted and non-polluted air in Beijing, China. Environ. Int. 2019, 131, 104936. [Google Scholar] [CrossRef] [PubMed]
  13. Li, J.; Cao, J.; Zhu, Y.G.; Chen, Q.L.; Shen, F.; Wu, Y.; Xu, S.; Fan, H.; Da, G.; Huang, R.J.; et al. Global Survey of Antibiotic Resistance Genes in Air. Environ. Sci. Technol. 2018, 52, 10975–10984. [Google Scholar] [CrossRef] [Green Version]
  14. Seifert, H.; Strate, A.; Schulze, A.; Pulverer, G. Bacteremia due to Acinetobacter Species Other than Acinetobacter baumannii. Infection 1994, 22, 379–385. [Google Scholar] [CrossRef] [PubMed]
  15. Gao, J.; Zhao, X.; Bao, Y.; Ma, R.; Zhou, Y. Antibiotic resistance and OXA-type carbapenemases-encoding genes in airborne Acinetobacter baumannii isolated from burn wards. Burns 2014, 40, 295–299. [Google Scholar] [CrossRef]
  16. Tong, S.Y.C.; Davis, J.S.; Eichenberger, E.; Holland, T.L.; Fowler, V.G. Staphylococcus aureus infections: Epidemiology, pathophysiology, clinical manifestations, and management. Clin. Microbiol. Rev 2015, 28, 603–661. [Google Scholar] [CrossRef] [Green Version]
  17. Talepour, N.; Hassanvand, M.S.; Abbasi-Montazeri, E.; Latifi, S.M.; Fard, N.J.H. Spatio-temporal variations of airborne bacteria from the municipal wastewater treatment plant: A case study in Ahvaz, Iran. J. Environ. Health Sci. Eng. 2020, 18, 423–432. [Google Scholar] [CrossRef]
  18. Fan, C.; Li, Y.; Liu, P.; Mu, F.; Xie, Z.; Lu, R.; Qi, Y.; Wang, B.; Jin, C. Characteristics of airborne opportunistic pathogenic bacteria during autumn and winter in Xi’an, China. Sci. Total Environ. 2019, 672, 834–845. [Google Scholar] [CrossRef]
  19. Hu, Z.; Liu, H.; Zhang, H.; Zhang, X.; Zhou, M.; Lou, L.; Zheng, P.; Xi, C.; Hu, B. Temporal discrepancy of airborne total bacteria and pathogenic bacteria between day and night. Environ. Res. 2020, 186, 109540. [Google Scholar] [CrossRef]
  20. Liang, Z.; Yu, Y.; Ye, Z.; Li, G.; Wang, W.; An, T. Pollution profiles of antibiotic resistance genes associated with airborne opportunistic pathogens from typical area, Pearl River Estuary and their exposure risk to human. Environ. Int. 2020, 143, 105934. [Google Scholar] [CrossRef]
  21. French, G.L. Clinical impact and relevance of antibiotic resistance. Adv. Drug Deliv. Rev. 2005, 57, 1514–1527. [Google Scholar] [CrossRef] [PubMed]
  22. China MEE. Ambient Air Quality Standards (GB 3095-2012); Ministry of Ecology and Environment of The People’s Republic of China: Beijing, China, 2012.
  23. China MEE. Technical Regulation on Ambient Air Quality Index (on Trial) (hj 633-2012); Ministry of Ecology and Environment of The People’s Republic of China: Beijing, China, 2012.
  24. Zhang, S.; Han, B.; Gu, J.; Wang, C.; Wang, P.; Ma, Y.; Cao, J.; He, Z. Fate of antibiotic resistant cultivable heterotrophic bacteria and antibiotic resistance genes in wastewater treatment processes. Chemosphere 2015, 135, 138–145. [Google Scholar] [CrossRef]
  25. Yang, Q.; Zhang, H.; Guo, Y.; Tian, T. Influence of chicken manure fertilization on antibiotic-resistant bacteria in soil and the endophytic bacteria of pakchoi. Int. J. Environ. Res. Public Health 2016, 13, 662. [Google Scholar] [CrossRef]
  26. Zhou, J.; Zhang, M.; Yang, W.; Fang, Y.; Wang, G.; Hou, F. A seventeen-year observation of the antimicrobial susceptibility of clinical Campylobacter jejuni and the molecular mechanisms of erythromycin-resistant isolates in Beijing, China. Int. J. Infect. Dis. 2016, 42, 28–33. [Google Scholar] [CrossRef] [Green Version]
  27. Andersen, A.A. New sampler for the collection, sizing, and enumeration of viable airborne particles. J. Bacteriol. 1958, 76, 471–484. [Google Scholar] [CrossRef] [PubMed] [Green Version]
  28. Li, Y.; Zhang, H.; Qiu, X.; Zhang, Y.; Wang, H. Dispersion and risk assessment of bacterial aerosols emitted from rotating-brush aerator during summer in a wastewater treatment plant of Xi’an, China. Aerosol Air Qual. Res. 2013, 13, 1807–1814. [Google Scholar] [CrossRef]
  29. Chen, H.; Carter, K.E. Modeling potential occupational inhalation exposures and associated risks of toxic organics from chemical storage tanks used in hydraulic fracturing using AERMOD. Environ. Pollut. 2017, 224, 300–309. [Google Scholar] [CrossRef]
  30. Eeftens, M.; Tsai, M.Y.; Ampe, C.; Anwander, B.; Beelen, R.; Bellander, T. Spatial variation of PM2.5, PM10, PM2.5 absorbance and PM coarse concentrations between and within 20 European study areas and the relationship with NO2—Results of the ESCAPE project. Atmos. Environ. 2012, 62, 303–317. [Google Scholar] [CrossRef] [Green Version]
  31. Lu, R.; Li, Y.; Li, W.; Xie, Z.; Fan, C.; Liu, P.; Deng, S. Bacterial community structure in atmospheric particulate matters of different sizes during the haze days in Xi’an, China. Sci. Total Environ. 2018, 637, 244–252. [Google Scholar] [CrossRef] [PubMed]
  32. Gao, M.; Jia, R.; Qiu, T.; Han, M.; Song, Y.; Wang, X. Seasonal size distribution of airborne culturable bacteria and fungi and preliminary estimation of their deposition in human lungs during non-haze and haze days. Atmos. Environ. 2015, 118, 203–210. [Google Scholar] [CrossRef]
  33. Pal, C.; Bengtsson-Palme, J.; Kristiansson, E.; Larsson, D.G.J. The structure and diversity of human, animal and environmental resistomes. Microbiome 2016, 4, 54. [Google Scholar] [CrossRef] [PubMed] [Green Version]
  34. Li, Y.; Fu, H.; Wang, W.; Liu, J.; Meng, Q.; Wang, W. Characteristics of bacterial and fungal aerosols during the autumn haze days in Xi’an, China. Atmos. Environ. 2015, 122, 439–447. [Google Scholar] [CrossRef]
  35. Xie, Z.; Li, Y.; Lu, R.; Li, W.; Fan, C.; Liu, P.; Wang, J.; Wang, W. Characteristics of total airborne microbes at various air quality levels. J. Aerosol Sci. 2018, 116, 57–65. [Google Scholar] [CrossRef]
  36. Cao, C.; Jiang, W.; Wang, B.; Fang, J.; Lang, J.; Tian, G.; Jiang, J.; Zhu, T.F. Inhalable microorganisms in Beijing’s PM2.5 and PM10 pollutants during a severe smog event. Environ. Sci. Technol. 2014, 48, 1499–1507. [Google Scholar] [CrossRef]
  37. Wei, M.; Liu, H.; Chen, J.; Xu, C.; Li, J.; Xu, P.; Sun, Z. Effects of aerosol pollution on PM2.5-associated bacteria in typical inland and coastal cities of northern China during the winter heating season. Environ. Pollut. 2020, 262, 114188. [Google Scholar] [CrossRef]
  38. Liu, H.; Zhang, X.; Zhang, H.; Yao, X.; Zhou, M.; Wang, J.; He, Z.; Zhang, H.; Lou, L.; Mao, W.; et al. Effect of air pollution on the total bacteria and pathogenic bacteria in different sizes of particulate matter. Environ. Pollut. 2018, 233, 483–493. [Google Scholar] [CrossRef]
  39. Yang, T.; Han, Y.P.; Li, L.; Liu, J.X. Microbial Properties of Different Size Aerosols at Human Average Respiratory Height During Fog-haze Days. Environ. Sci. 2019, 40, 1680–1687. [Google Scholar] [CrossRef]
  40. Gong, J.; Qi, J.; Beibei, E.; Yin, Y.; Gao, D. Concentration, viability and size distribution of bacteria in atmospheric bioaerosols under different types of pollution. Environ. Pollut. 2020, 257, 113485. [Google Scholar] [CrossRef]
  41. Hu, J.; Zhao, F.; Zhang, X.X.; Li, K.; Li, C.; Ye, L.; Li, M. Metagenomic profiling of ARGs in airborne particulate matters during a severe smog event. Sci. Total Environ. 2018, 615, 1332–1340. [Google Scholar] [CrossRef]
  42. Fang, Z.; Yao, W.; Lou, X.; Hao, C.; Gong, C.; Ouyang, Z. Profile and characteristics of culturable airborne bacteria in Hangzhou, southeast of China. Aerosol Air Qual. Res. 2016, 16, 1690–1700. [Google Scholar] [CrossRef] [Green Version]
  43. Gao, M.; Qiu, T.; Jia, R.; Han, M.; Song, Y.; Wang, X. Concentration and size distribution of viable bioaerosols during non-haze and haze days in Beijing. Environ. Sci. Pollut. Res. 2015, 22, 4359–4368. [Google Scholar] [CrossRef] [PubMed]
  44. Ulevičius, V.; Pečiulyte, D.; Mordas, G.; Lugauskas, A. Field study on changes in viability of airborne fungal propagules exposed to solar radiation. J. Aerosol Sci. 2000, 31, 961–962. [Google Scholar] [CrossRef]
  45. Tang, J.W. The effect of environmental parameters on the survival of airborne infectious agents. J. R. Soc. Interface. 2009, 6, S737–S746. [Google Scholar] [CrossRef] [Green Version]
  46. Hwang, G.B.; Jung, J.H.; Jeong, T.G.; Lee, B.U. Effect of hybrid UV-thermal energy stimuli on inactivation of S. epidermidis and B. subtilis bacterial bioaerosols. Sci. Total Environ. 2010, 408, 5903–5909. [Google Scholar] [CrossRef]
  47. Li, Y.; Lu, R.; Li, W.; Xie, Z.; Song, Y. Concentrations and size distributions of viable bioaerosols under various weather conditions in a typical semi-arid city of Northwest China. J. Aerosol Sci. 2017, 106, 83–92. [Google Scholar] [CrossRef]
  48. Thomas, R.J.; Webber, D.; Sellors, W.; Collinge, A.; Frost, A.; Stagg, A.J.; Bailey, S.C.; Jayasekera, P.N.; Taylor, R.R.; Eley, S.; et al. Characterization and deposition of respirable large- and small-particle bioaerosols. Appl. Environ. Microbiol. 2008, 74, 6437–6443. [Google Scholar] [CrossRef] [PubMed] [Green Version]
  49. Kim, K.H.; Kabir, E.; Kabir, S. A review on the human health impact of airborne particulate matter. Environ. Int. 2015, 74, 136–143. [Google Scholar] [CrossRef] [PubMed]
  50. Sagona, J.A.; Secondo, L.E.; Mainelis, G. Comparison of Two Models to Estimate Deposition of Fungi and Bacteria in the Human Respiratory Tract. Atmosphere 2020, 11, 561. [Google Scholar] [CrossRef]
  51. Yan, X.; Qiu, D.; Zheng, S.; Yang, J.; Sun, H.; Wei, Y.; Han, J.; Sun, J.; Su, X. Distribution characteristics and noncarcinogenic risk assessment of culturable airborne bacteria and fungi during winter in Xinxiang, China. Environ. Sci. Pollut. Res. 2019, 26, 36698–36709. [Google Scholar] [CrossRef]
  52. Hwang, S.H.; Park, J.B. Comparison of culturable airborne bacteria and related environmental factors at underground subway stations between 2006 and 2013. Atmos. Environ. 2014, 84, 289–293. [Google Scholar] [CrossRef]
  53. Sun, D.; Zhang, A.; Lu, P.; Fang, Z.; Jiang, A.; Li, H.; Lu, Y. Study on the sterilization effects of bacteria by the treatment of ozone. J. Biol. 1999, 16, 19–20. [Google Scholar] [CrossRef]
  54. Cox, C.S.; Hood, A.M.; Baxter, J. Method for Comparing Concentrations of the Open-Air Factor. Appl. Microbiol. 1973, 26, 640–642. [Google Scholar] [CrossRef] [PubMed]
  55. Cox, C.S. Stability of airborne microbes and allergens. In Bioaerosols Handbook; Cox, C.S., Wathes, C.M., Eds.; Lewis Publishers: New York, NY, USA, 1995; pp. 77–99. [Google Scholar]
  56. Alghamdi, M.A.; Shamy, M.; Redal, M.A.; Khoder, M.; Awad, A.H.; Elserougy, S. Microorganisms associated particulate matter: A preliminary study. Sci. Total Environ. 2014, 479, 109–116. [Google Scholar] [CrossRef] [PubMed]
  57. Zhao, Y.; Wang, Q.; Chen, Z.; Mao, D.; Luo, Y. Significant higher airborne antibiotic resistance genes and the associated inhalation risk in the indoor than the outdoor. Environ. Pollut. 2021, 268, 115620. [Google Scholar] [CrossRef]
  58. Li, X.; Chen, H.; Yao, M. Microbial emission levels and diversities from different land use types. Environ. Int. 2020, 143, 105988. [Google Scholar] [CrossRef]
  59. Zhou, F.; Wang, Y. Characteristics of antibiotic resistance of airborne Staphylococcus isolated from metro stations. Int. J. Environ. Res. Public Health 2013, 10, 2412–2426. [Google Scholar] [CrossRef]
  60. Li, H.; Zhou, X.Y.; Yang, X.R.; Zhu, Y.G.; Hong, Y.W.; Su, J.Q. Spatial and seasonal variation of the airborne microbiome in a rapidly developing city of China. Sci. Total Environ. 2019, 665, 61–68. [Google Scholar] [CrossRef]
  61. Ruiz-Gil, T.; Acuña, J.J.; Fujiyoshi, S.; Tanaka, D.; Noda, J.; Maruyama, F.; Jorquera, M.A. Airborne bacterial communities of outdoor environments and their associated influencing factors. Environ. Int. 2020, 145, 106156. [Google Scholar] [CrossRef]
  62. Gao, X.L.; Shao, M.F.; Wang, Q.; Wang, L.T.; Fang, W.Y.; Ouyang, F.; Li, J. Airborne microbial communities in the atmospheric environment of urban hospitals in China. J. Hazard. Mater. 2018, 349, 10–17. [Google Scholar] [CrossRef]
  63. Ji, L.; Zhang, Q.; Fu, X.; Zheng, L.; Dong, J.; Wang, J.; Guo, S. Feedback of airborne bacterial consortia to haze pollution with different PM2.5 levels in typical mountainous terrain of Jinan, China. Sci. Total Environ. 2019, 695, 133912. [Google Scholar] [CrossRef]
  64. de Paiva-Santos, W.; de Sousa, V.S.; Giambiagi-deMarval, M. Occurrence of virulence-associated genes among Staphylococcus saprophyticus isolated from different sources. Microb. Pathog. 2018, 119, 9–11. [Google Scholar] [CrossRef]
  65. Landrum, M.L.; Neumann, C.; Cook, C.; Chukwuma, U.; Ellis, M.W.; Hospenthal, D.R.; Murray, C.K. Epidemiology of Staphylococcus aureus blood and skin and soft tissue infections in the US Military Health System, 2005–2010. JAMA J. Am. Med. Assoc. 2012, 308, 50–59. [Google Scholar] [CrossRef] [Green Version]
  66. Rohlwink, U.K.; Figaji, A.; Wilkinson, K.A.; Horswell, S.; Sesay, A.K.; Deffur, A.; Enslin, N.; Solomons, R.; Van Toorn, R.; Eley, B.; et al. Tuberculous meningitis in children is characterized by compartmentalized immune responses and neural excitotoxicity. Nat. Commun. 2019, 10, 3767. [Google Scholar] [CrossRef]
  67. Nudel, K.; Zhao, X.; Basu, S.; Dong, X.; Hoffmann, M.; Feldgarden, M.; Allard, M.; Klompas, M.; Bry, L. Genomics of Corynebacterium striatum, an emerging multidrug-resistant pathogen of immunocompromised patients. Clin. Microbiol. Infect. 2018, 24, 1016.e7–1016.e13. [Google Scholar] [CrossRef] [Green Version]
  68. Yang, T.; Han, Y.; Liu, J.; Li, L. Aerosols from a wastewater treatment plant using oxidation ditch process: Characteristics, source apportionment, and exposure risks. Environ. Pollut. 2019, 250, 627–638. [Google Scholar] [CrossRef] [PubMed]
  69. Han, Y.; Yang, K.; Yang, T.; Zhang, M.; Li, L. Bioaerosols emission and exposure risk of a wastewater treatment plant with A2O treatment process. Ecotoxicol. Environ. Saf. 2019, 169, 161–168. [Google Scholar] [CrossRef]
  70. Gladding, T.L.; Rolph, C.A.; Gwyther, C.L.; Kinnersley, R.; Walsh, K.; Tyrrel, S. Concentration and composition of bioaerosol emissions from intensive farms: Pig and poultry livestock. J. Environ. Manag. 2020, 272, 111052. [Google Scholar] [CrossRef] [PubMed]
  71. Stewart, J.D.; Shakya, K.M.; Bilinski, T.; Wilson, J.W.; Ravi, S.; Choi, C.S. Variation of near surface atmosphere microbial communities at an urban and a suburban site in Philadelphia, PA, USA. Sci. Total Environ. 2020, 724, 138353. [Google Scholar] [CrossRef] [PubMed]
  72. Sun, X.; Li, D.; Li, B.; Sun, S.; Yabo, S.D.; Geng, J.; Ma, L.; Qi, H. Exploring the disparity of inhalable bacterial communities and antibiotic resistance genes between hazy days and non-hazy days in a cold megacity in Northeast China. J. Hazard. Mater. 2020, 398, 122984. [Google Scholar] [CrossRef]
  73. Farokhi, A.; Heederik, D.; Smit, L.A.M. Respiratory health effects of exposure to low levels of airborne endotoxin—A systematic review. Environ. Health. 2018, 17, 14. [Google Scholar] [CrossRef] [PubMed] [Green Version]
  74. Guo, J.; Xiong, Y.; Shi, C.; Liu, C.; Li, H.; Qian, H.; Sun, Z.; Qin, C. Characteristics of airborne bacterial communities in indoor and outdoor environments during continuous haze events in Beijing: Implications for health care. Environ. Int. 2020, 139, 105721. [Google Scholar] [CrossRef] [PubMed]
Figure 1. Variation of airborne bacteria, antibiotic-resistant bacteria, and PM2.5 during sampling days.
Atmosphere 12 01077 g001
Figure 2. Size distribution of culturable bacteria and four antibiotic-resistant bacteria under different air quality levels.
Atmosphere 12 01077 g002
Figure 3. Diurnal variation in size distribution and median diameter of culturable bacteria and four antibiotic-resistant bacteria (the diameter corresponding to a cumulative percentage of 50% is the median diameter (d50)).
Atmosphere 12 01077 g003
Figure 4. Diurnal variation in particle size distribution of the culturable bacteria and the four antibiotic-resistant bacteria.
Atmosphere 12 01077 g004
Figure 5. The diversity and relative abundance of the top 50 bacterial genera of four antibiotic-resistant bacteria.
Atmosphere 12 01077 g005
Figure 6. HQ and HI of airborne bacteria under different diurnal periods, air quality levels, and seasons. (MO: morning; NO: noon; NI: night; EX: excellent; GO: good; SLP: slight pollution; MOP: moderate pollution; HEP: heavy pollution; SP: spring; SU: summer; AU: autumn; WI: winter).
Atmosphere 12 01077 g006
Table 1. Range of bioaerosol particles captured.
StageAerodynamic Diameter
>7.0 μm
4.7–7.0 μm
3.3–4.7 μm
2.1–3.3 μm
1.1–2.1 μm
0.65–1.1 μm
Table 2. Spearman correlation coefficients between culturable bacteria and the four antibiotic-resistant bacteria concentrations and main influencing factors.
AQIPM2.5PM10SO2NO2O3T (°C)RH (%)WS (m/s)
TB0.335 **0.347 **0.382 **0.352 **0.634 **−0.392 **0.319 *0.086−0.477 **
TRB0.372 **0.389 **0.434 **0.406 **0.677 **−0.336 **−0.1840.070−0.430 *
CRB0.334 **0.347 **0.373 **0.373 **0.663 **−0.379 **0.294 *0.035−0.374 *
ERB0.376 **0.394 **0.419 **0.366 **0.648 **−0.307 *−0.1470.069−0.404 *
ARB0.384 **0.396 **0.428 **0.418 **0.677 **−0.367 **−0.2340.086−0.392 *
** p < 0.01(2-tailed). * p < 0.05(2-tailed).
Publisher’s Note: MDPI stays neutral with regard to jurisdictional claims in published maps and institutional affiliations.

