Article

Dynamics of Microbial Biomass, Nitrogen Mineralization and Crop Uptake in Response to Placement of Maize Residue Returned to Chinese Mollisols over the Maize Growing Season

1
Key Laboratory of Mollisols Agroecology, Northeast Institute of Geography and Agroecology, Chinese Academy of Sciences, Changchun 130102, China
2
University of Chinese Academy of Sciences, Beijing 100049, China
3
Ottawa Research and Development Centre, Agriculture and Agri-Food Canada, Ottawa, ON K1Y 4X2, Canada
4
College of Environmental Science and Engineering, Zhongkai University of Agriculture and Engineering, Guangzhou 510225, China
*
Author to whom correspondence should be addressed.
Atmosphere 2021, 12(9), 1166; https://doi.org/10.3390/atmos12091166
Submission received: 2 August 2021 / Revised: 28 August 2021 / Accepted: 8 September 2021 / Published: 10 September 2021
(This article belongs to the Special Issue Atmospheric Pollution of Agriculture-Dominated Cities)

Abstract

:
Returning residue to soils is not only an effective nutrient management method, but also can reduce the air pollution caused by residue burning, which has become an important factor in global warming. However, it is not clear whether returning residue to the soil can affect the nitrogen mineralization and the nitrogen cycle process, and the environmental impact caused by the nitrogen loss in gaseous forms. Therefore, a pot experiment was conducted to study the effects of residue placement on the nitrogen turnover process, including microbial biomass N (MBN) and C (MBC), inorganic N, crop N uptake, and the contribution of residue-derived N to maize at different maize growth stages. Three treatments were assessed: no residue addition (T0), residue addition to the soil surface (T1), and residue incorporation into the 0–10 cm soil layer (T2). Soil samples were taken at the 0–5 and 5–10 cm layers for all residue treatments. Residue retention (T1 and T2) significantly affected the MBC and MBN contents and decreased MBC/MBN ratio at different maize growth stages. MBC/MBN markedly increased at the R1 stage compared to other growth stages. The differences in total inorganic nitrogen (TIN) were attributed to the balance in net N immobilization and net mineralization in the different maize growth stages. In addition, T2 significantly increased the residue-derived N source for maize by 11.3% compared to T0 in the R3 growth stage. Overall, relative to T1, T2 is a better agriculture management measure to promote N transformation and supply, and enhance residue-derived N release and uptake in maize.

1. Introduction

Returning crop residues to soils is a nutrient-conserving strategy within soil fertility management and can enhance crop production [1,2]. Residues returned can not only reduce environmental pollution, but also affect greenhouse gas emissions by increasing soil carbon (C) sequestration potential [3], which reduces soil CO2 emissions and the contribution to global climate change [3,4]. Furthermore, the addition of maize (Zea mays L.) residues to soils can also provide various micronutrients and macronutrients such as nitrogen (N) for plants [5], and could maintain the ecosystem. The maize residue comprises about 80 kg N ha−1, so it could supply an N source for soil N pools, promote crop N uptake [6,7] and affect N cycle in croplands in the agroecosystem [8]. Therefore, returning crop residue to the soils may promote nutrient availability and increase nutrient release for plant growth compared to the mineral fertilizer application [9,10]. Crop residue retention could play a crucial role in affecting the N availability to plants. Added legume residues, having a low C/N ratio, may result in N mineralization, while the addition of cereal residue (like maize) having high C/N ratio could result in N immobilization in the process of residue decomposition [11,12]. How crop residues are returned to soils, such as incorporation into the soil or left on the soil surface, will affect soil nutrient input and change the soil microenvironment. Different methods of residue addition can also modify soil properties, including water content, temperature and oxygen content, and thus could regulate the decomposition of returned residue and influence soil health. The position in the soil profile of returned residue had a significant effect on the residue decomposition rate [13]. Some studies have demonstrated that decomposition of residue remaining on the soil surface was slower than residue incorporated into the soil [14,15]. Moreover, incorporation of residue into the soils promotes a strong diversification of microbial biomass and activity, which in turn affects soil N mineralization [15].
Nitrogen is an essential nutrient for plant and microbial growth, so N transformation between organic and inorganic forms is a key process to maintain productivity and relevant ecological functions and services in the terrestrial ecosystem [16]. Due to insufficient available N in most arable soils, a large quantity of mineral fertilizers is applied to soils for crop production. The proportion of mineral fertilizers utilized in China is estimated to be one quarter of total mineral fertilizers used worldwide [17,18]. Excessive input of mineral fertilizers to arable soils has resulted in serious environmental consequences [19].
The net N mineralization and net N immobilization are two important decomposition processes acting on residue after it is returned to the soils, and are partly manifested in the dynamics of inorganic N and microbial biomass nitrogen (MBN) contents. The microbial biomass is a living part of soil organic matter, and it could be a sensitive indicator of soil health [20]. Microbes decompose the crop residue returned to the soil, while at the same time, release N to inorganic mineral forms. Inorganic nitrogen is the main form of plant available N. It has been verified that the characteristics of residue returned, particularly the lignin content and C:N ratio, could change soil inorganic N content. Furthermore, the variation in N concentration in the soil may influence uptake of N by plants and the potential N loss [21]. Therefore, the location of returned residue in the soil profile could affect N turnover. In the process of biological decomposition, microbes need to take in nutrients from soil for their growth. If the residue N does not meet the N demand of microbial growth, soil inorganic N will be absorbed by microbes as their N source in the early decomposition stage; this is regarded as biological immobilization [22,23]. Additionally, the N immobilized by microbes could be released back into the soil when the microbes die. The processes of microbial immobilization and mineralization are affected by organic amendments [24].
Many studies have focused on the effects of residue decomposition on the soil N after a certain period of time, but there is little information on the dynamics of soil N over the whole maize growing season. It was deemed necessary to clarify the dynamics of microbial transformations from organic to inorganic N and subsequent N processes resulting from different positions of returned residue in the soil profile.
Residue addition, either on the soil surface, or incorporated into the soil profile, stimulates growth of microbes to decompose residue, which releases more available N for plant growth. We hypothesized that residue incorporation into the soil is the best way to increase the microbial biomass, promote more N utilization by microbes, supply more residue-derived N available for crop use, and enhance total N uptake in maize. Therefore, we set up a pot experiment with returned residue placed at different positions in the soil to test these hypotheses. The objectives of the present study were (1) to assess the changes in microbial activities and microbial biomass in 0–5 and 5–10 cm layers at different maize growth stages; (2) to determine the dynamics of soil net N mineralization or immobilization at different maize growth stages; (3) to determine the distribution of N (organic and mineral) derived from maize residue, and (4) to quantify the potential N supply from maize residue available for plant growth, and subsequent plant N uptake. This study was conducted in an extreme condition where no mineral fertilizers were applied to the soil to isolate residue N, to determine how much N was released from the residue and how much N was provided for the growth of maize.

2. Materials and Methods

2.1. Soils and Maize Residue Preparation

This study was conducted as a pot experiment. Soils were collected from the long-term experiment station affiliated with Northeast Institute of Geography and Agroecology, Chinese Academy of Sciences, in Changchun city, Jilin Province, China (44°59’ N, 125°23’ E) in November, 2018. The field site had continuous maize crop under conventional tillage management for the past seven years. This site has a temperate continental monsoon climate. The mean annual temperature is 6.4 °C, and the mean annual precipitation is 614 mm. The soil is a clay loam (Typic Hapludoll, USDA Soil Taxonomy) with an average of 36.0% clay, 24.5% silt, and 39.5% sand. Subsamples were taken from the soil samples and were sieved through a 2 mm mesh to determine SOC, TN, pH, SWC, NO3, NH4+ and MBN. Soil properties were determined using standard procedures. SWC was determined gravimetrically from 10 g soil which was oven dried at 105 °C to constant weight. Soil pH was measured using an acidity meter (pHS-3B, Leici, Shanghai, China) in 1:2.5 soil: water solution (w/v). The total C and total N were determined using the FlashEA 1112 Elemental Analyzer (Thermo Finnigan, Milan, Italy). Because the soil was free of carbonates, the SOC was assumed to be equal to the total C. Methods for determination of the NO3, NH4+ and MBN are given in Section 2.3. Initial soil properties are shown in Table 1. The remaining soil samples were air-dried after large stones and visible maize residues materials were removed, and then sieved to pass an 8 mm sieve for homogenization. The plastic buckets with a 34 L volume (32 cm dia.; 42 cm high) were filled with these soils for the pot experiment. The soils were gently pressed by hand after each 20 cm layer in order to prevent voids.
The maize residue (a mixture including leaf, leaf sheath, stem and tassel) used in this study was collected at harvest in August 2017, from a continuous maize field nearby the place of soil sampling. The maize residue was oven-dried at 60 °C, cut into smaller pieces (3–5 cm), and then stored in bags for subsequent use in the pot experiment. The residues were sampled and ground with a ball mill and C and N contents were measured using the FlashEA 1112 Elemental Analyzer (Thermo Finnigan, Milan, Italy). The TN (total nitrogen) and C contents of maize residue were 19.80 and 437.6 g kg−1, respectively.

2.2. Experiment Design

The pot experiment was started in a laboratory with artificial lights in December, 2018, and consisted of four replicates; each pot was an experimental unit. Before residue addition, pots were pre-cultured for one week in the lab at 25 °C and 0–40 cm soil samples were taken for initial soil property measurements. Selected soil properties are given in Table 1. After the pre-incubation, the maize residue was applied into the soil. There were three treatments, consisting of no residue addition as a control (T0), residue added on the soil surface (T1), and residue incorporated into 0–10 cm soil (T2), were set to assess the impacts caused by the position of residue placement. The amount of residue added in each pot was calculated according to 1.1 kg m−2, which is equivalent to 11 Mg ha−1, the actual amount of returned residues in the field. For the surface treatment (T1), the residue was spread uniformly on the soil surface of the pot. For the incorporation treatment (T2), residue was spread on the surface and then uniformly mixed into the 0–10 cm soil layer with a hand trowel. No residue was added in the control treatment (T0). Soil moisture was adjusted to 40% of the field water holding capacity by weighing each bucket every week and adjusting the mass by adding water when necessary.
In each pot, four maize seeds (cultivar Xiongyu 587) were sown at a depth of 3 cm on 30 December 2018. New LED plant growth lights were used to supplement light. The size of LED lamp was 600 × 73 × 130 mm and the model number was G96 * 3W (Institute of Semiconductors, Chinese Academy of Sciences (CAS), Beijing, China), and included a red light with a wavelength of 625 nm, a blue light with wavelength of 450 nm, and a green light with a wavelength of 525 nm. The lights were used every day from 9:00 a.m. to 9:00 p.m. considering the limitation of outdoor light. After all seeds had completely germinated, and the plants emerged, the three weakest plants were removed leaving only one plant per pot.

2.3. Soil Collection and Analysis

Soil samples were collected from the buckets down to a depth of 10 cm using a hand core auger (2.54 cm internal diameter) at four growth stages of maize, including VE (emergence), V5 (jointing), R1 (tasseling), and R3 (milk) stages. VE stage occurs when the coleoptile tip breaks through the soil surface; V5 stage occurs when the fifth leaf collar is visible; R1 stage occurs when silks are visible outside the husks; and R3 stage occurs when kernels begin to display final coloring and inner kernel contents are milky white. Five soil core samples were collected from each bucket, separated into two sections corresponding to 0–5 and 5–10 cm depths and mixed into one composite sample for each depth. Fresh soil samples were passed through a 2 mm sieve and stored at 4 °C for subsequent measurement of MBC and MBN, NH4+, and NO3 contents.
The MBN and MBC were measured using chloroform fumigation extraction; one subsample was used as a non-fumigated reference and the other was fumigated [25,26]. Briefly, fresh soil samples of 10 g were placed on a watch glass and were fumigated by ethanol-free chloroform in a vacuum desiccator for 24 h at 25 °C in the dark. Then, the 10 g of fumigated and non-fumigated soils were extracted with 0.5 M 30 mL K2SO4 (the ratio was 1:3, soil: extraction liquid), shaken at 150 rpm for 30 min and filtered through a folded Whatman paper filter. Organic carbon and total N in the K2SO4 extracts were determined with a total organic carbon (TOC) analyzer (TOC-L CPH, Shimadzu, Japan). The MBC and MBN were estimated as the difference in the extracted carbon or nitrogen between fumigated and non-fumigated soil, divided by a correction coefficient [25,27]. The concentrations of NH4+ and NO3 were measured using a Flow Injection Analyzer (FIA) (Skalar, Holland). Briefly, 5 g fresh soil was extracted in 50 mL 2 M KCl, then the suspension was shaken in 160 rpm at 25 °C for 1 h, and filtered by the folded paper. Then, the extracted NH4+-N and NO3-N were determined by FIA. The N mineralization and immobilization were respectively defined as increasing or decreasing the inorganic N relative to the control (the soil without residue addition) [28]. At the end of pot experiment, all the maize residues remaining on the soil surface were collected manually using tweezers. Soil from the top 10 cm of each pot in the incorporated treatment (T2) was excavated and spread out on a table to expose the residue to facilitate collection. The process was cross checked by three persons to ensure as much as possible complete collection of straw residues. The plants were cut at soil level, shoot length was measured, roots were extracted from each pot, soil was washed off the roots, and shoots and roots were oven-dried at 60 °C to obtain dry weight. The dry shoot and root were then ground and passed through a 0.053 mm sieve. TN contents were measured using the FlashEA 1112 Elemental Analyzer (Thermo Finnigan, Milan, Italy).

2.4. Data Analysis

In this paper, growth stage will refer to a point on the maize physiological growth curve. Growth period will refer to the time interval between two growth stages and will be named by the growth stage at the beginning and end of the growth period. The changes of MBN content (∆MBN) in the different growth periods were calculated as Equation (1):
M B N = M B N L S M B N P S
where MBN LS is the MBN content at the later growth stage; MBN PS is the MBN content at the previous growth stage.
The net mineralization at each growth stage and depth was calculated as the content of TIN under T1 or T2 minus the TIN content under T0 at the same depth. If the value is positive, it infers net mineralization, and if negative, it is net immobilization.
Plant N uptake (PNU) was calculated as Equation (2).
P N U = i D B M i × T N i  
where i refers to plant part, stem, leaf or root; D B M i is the dry weight of plant stem, leaf, or root in the R3 stage; T N i is the N content of plant stem, leaf or root in the R3 stage.
The residue-derived plant N uptake ( P N U   r e s i d u e ) was calculated as Equation (3).
P N U r e s i d u e = P N U T j P N U T 0
where T j is the treatment of different placement of residue (T1 or T2); T0 is the control with no residue return.
The residue-derived N release N R was calculated as:
N R = T N r e s i d u e i n i t i a l T N r e s i d u e e n d
where T N r e s i d u e i n i t i a l is the initial content of total N in the residue added; T N r e s i d u e e n d is the final total nitrogen of residue at the end of experiment.
In our study, some of the data were derived from differences, i.e., subtracting T0 from T1 or T2. This method has an inherent short coming; subtraction decreases the mean, but increases the variance, i.e., variance of A minus B equals sum of variance of A and variance of B. This has the effect of always increasing the coefficient of variation (standard deviation divided by the mean).
The statistical analysis of all data was performed using SPSS 17.0 software. One-way analysis of variance (ANOVA) and t-test were used to test the effect induced by different positions of residue addition in soils on the contents of the MBC and MBN, ∆MBN, inorganic N (NH4+ and NO3), residue-derived N uptake, and total residue-derived N release. Regression analysis was used to explore the relationships between N uptake in plant and shoot length, and between N uptake and total residue-derived N release. The significance of the difference among treatments was at the p < 0.05 level and treatment means were separated by the protected least significant difference (LSD) with a Tukey adjustment, calculated at p = 0.05. All the graphs were drawn using Sigmaplot 12.5.

3. Results

3.1. Soil Microbial Biomass

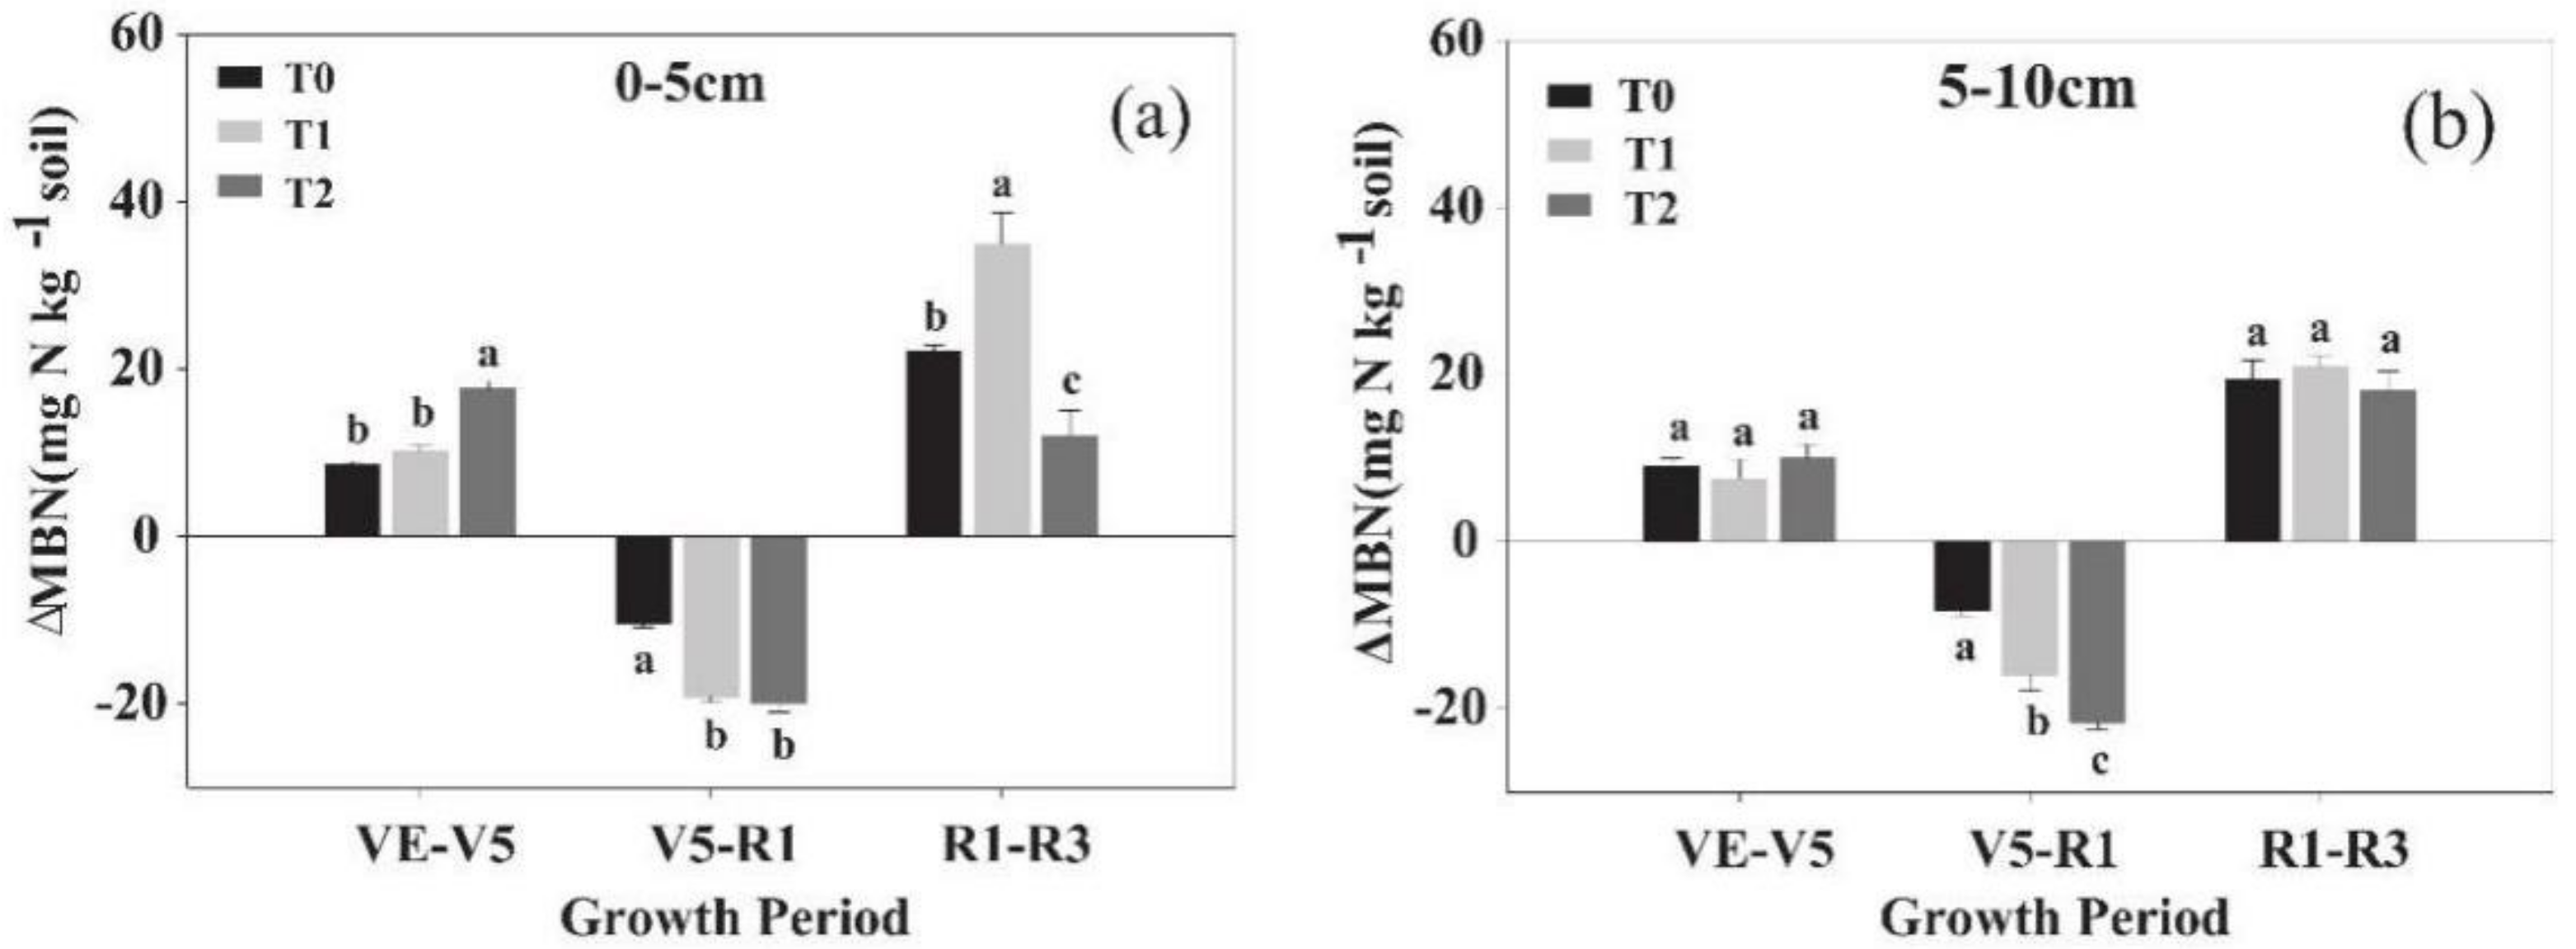
In the 0–5 cm layer, residue addition (T1 and T2) had a significant (p < 0.05) positive effect on MBC and MBN contents except for the R3 stage (Figure 1a,b). However, the MBC/MBN ratio significantly decreased in T1 and T2 compared to the control (p < 0.05, Figure 1c). The MBN contents in T2 soils were 30.9%, 50.6% and 153% higher than in T1 at VE, V5, and R1 stages, respectively. In addition, the MBN content was lower while the MBC/MBN was higher at the R1 stage than at the other three stages (Figure 1b,c). Additionally, the MBN fluctuated over the growing stages under different treatments. In the first period (from VE to V5 stage), the highest positive value of ∆MBN was found in T2, and the lowest value was found in T0 (Figure 2). In the second period (from V5 to R1 stage), negative values occurred in all treatments, and the lower negative values of ∆MBN occurred in T1 and T2 compared to T0. The third period (from R1 to R3 stage) had positive values again, and T1 had the greatest positive value of ∆MBN of all three treatments (Figure 2a). The lowest MBN contents of T0, T1 and T2 occurred in the R1 stage and were 3.29, 4.98, and 12.61 mg kg−1, respectively; the highest contents under T0 and T1 were 22.74 and 38.13 mg kg−1 respectively in the R3 stage, while the highest content under T2 was 25.69 mg kg−1 in the V5 stage.
In the 5–10 cm layer, the MBC content had no significant differences among the three treatments in the four growth stages except for the V5 stage (Figure 1d), but T1 and T2 had higher MBN contents than T0 in VE, V5, and R1 stages, except for T1 in R1. There were no significant differences in MBN between T1 and T2 in maize growth stages except for the R1 stage at which T1 had lower MBN content than T2 (Figure 1e). The MBC/MBN ratios of T1 and T2 were markedly lower than T0 in the VE stage, and the MBC/MBN ratio of T2 was lower than T1 in the R1 stage (Figure 1f). In the 5–10 cm layer, the value of ∆MBN did not show significant differences among three treatments in either the first or third growth periods, but in the second growth period significant differences were found among three treatments and T2 had the lowest negative value (Figure 2b).

3.2. Inorganic N Dynamics

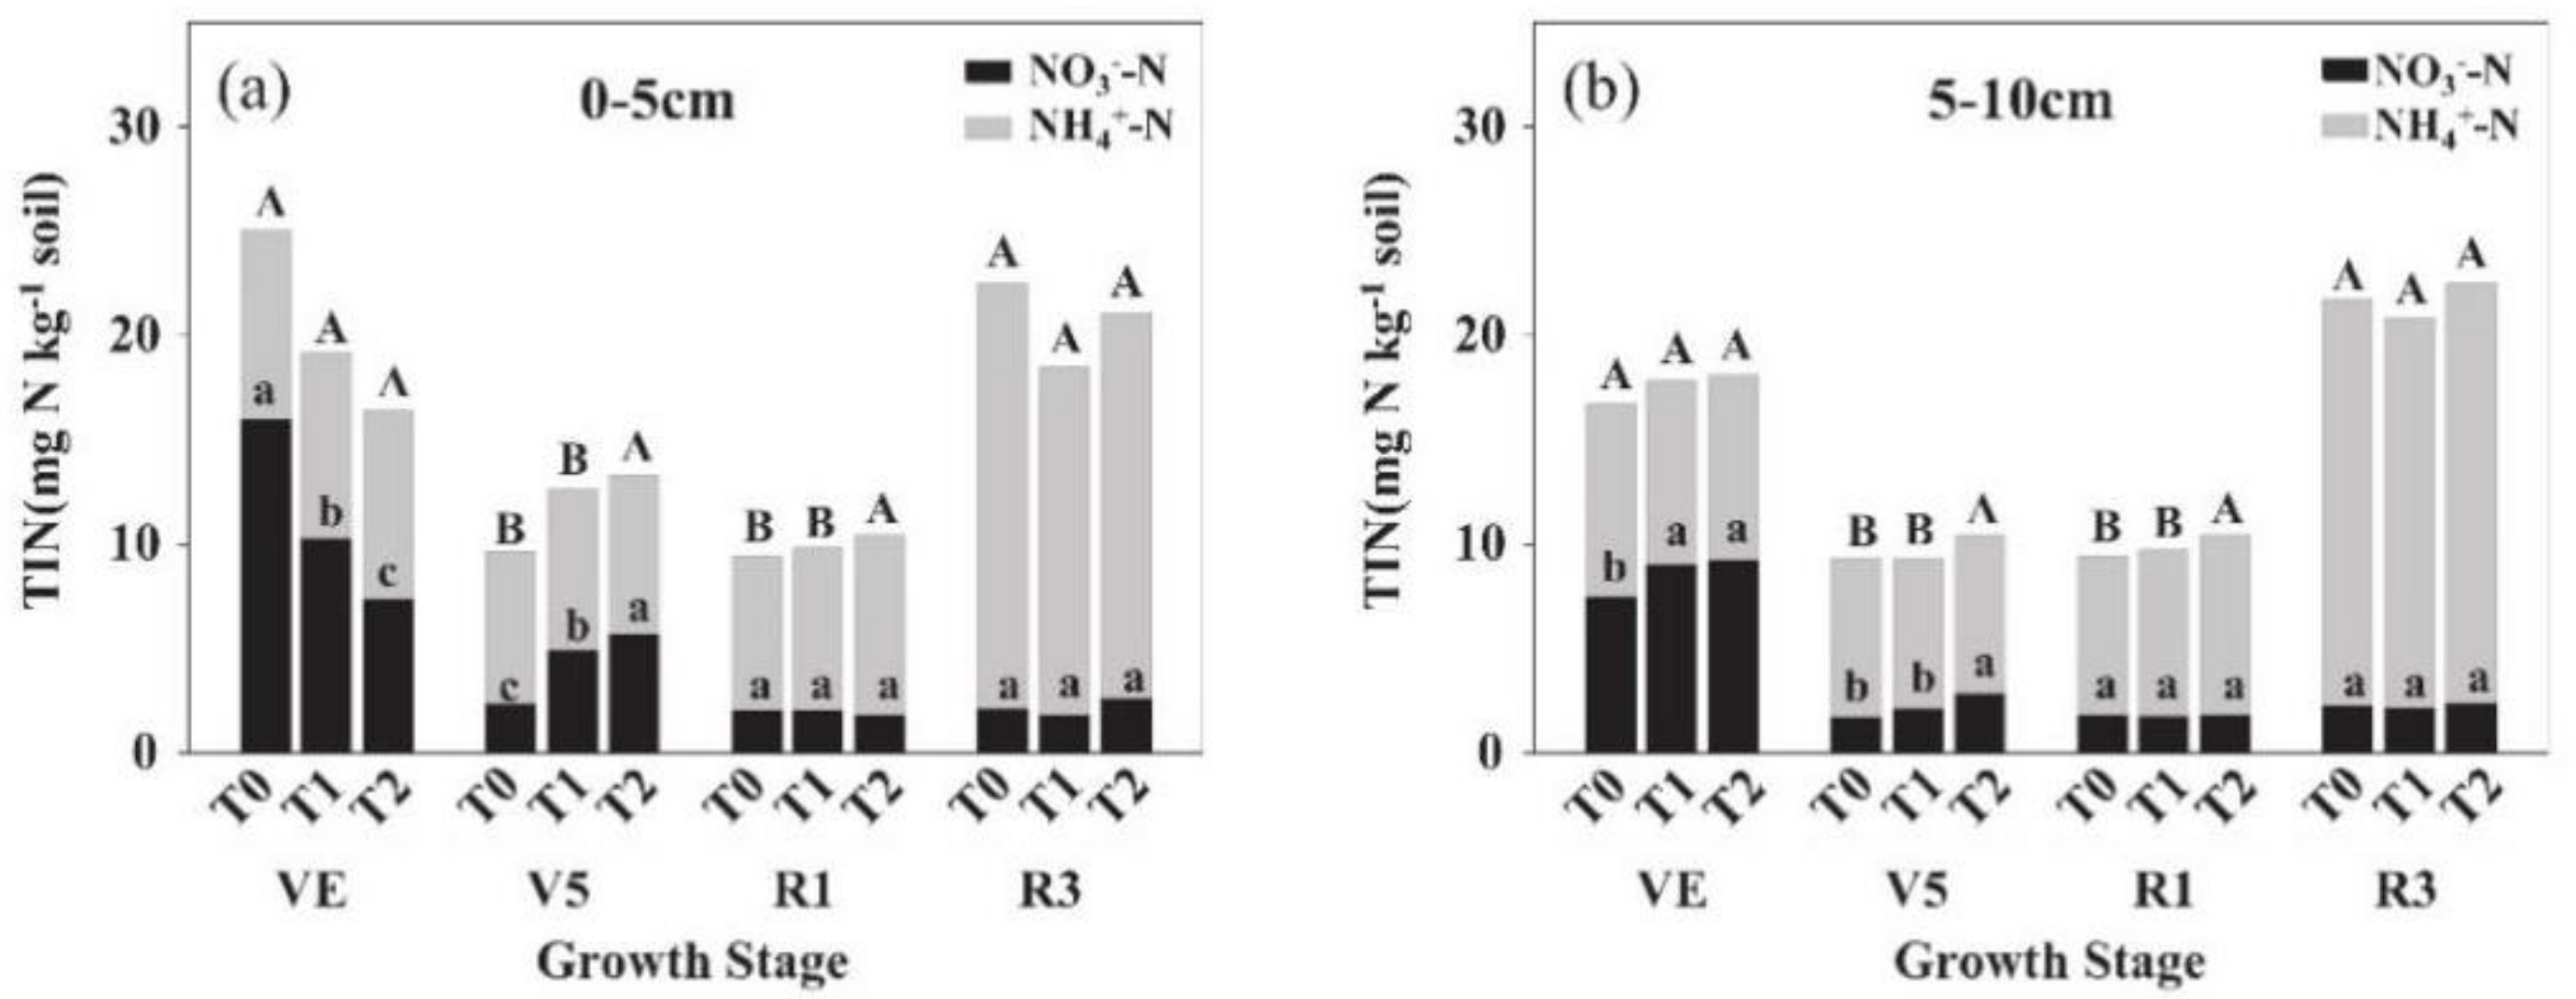
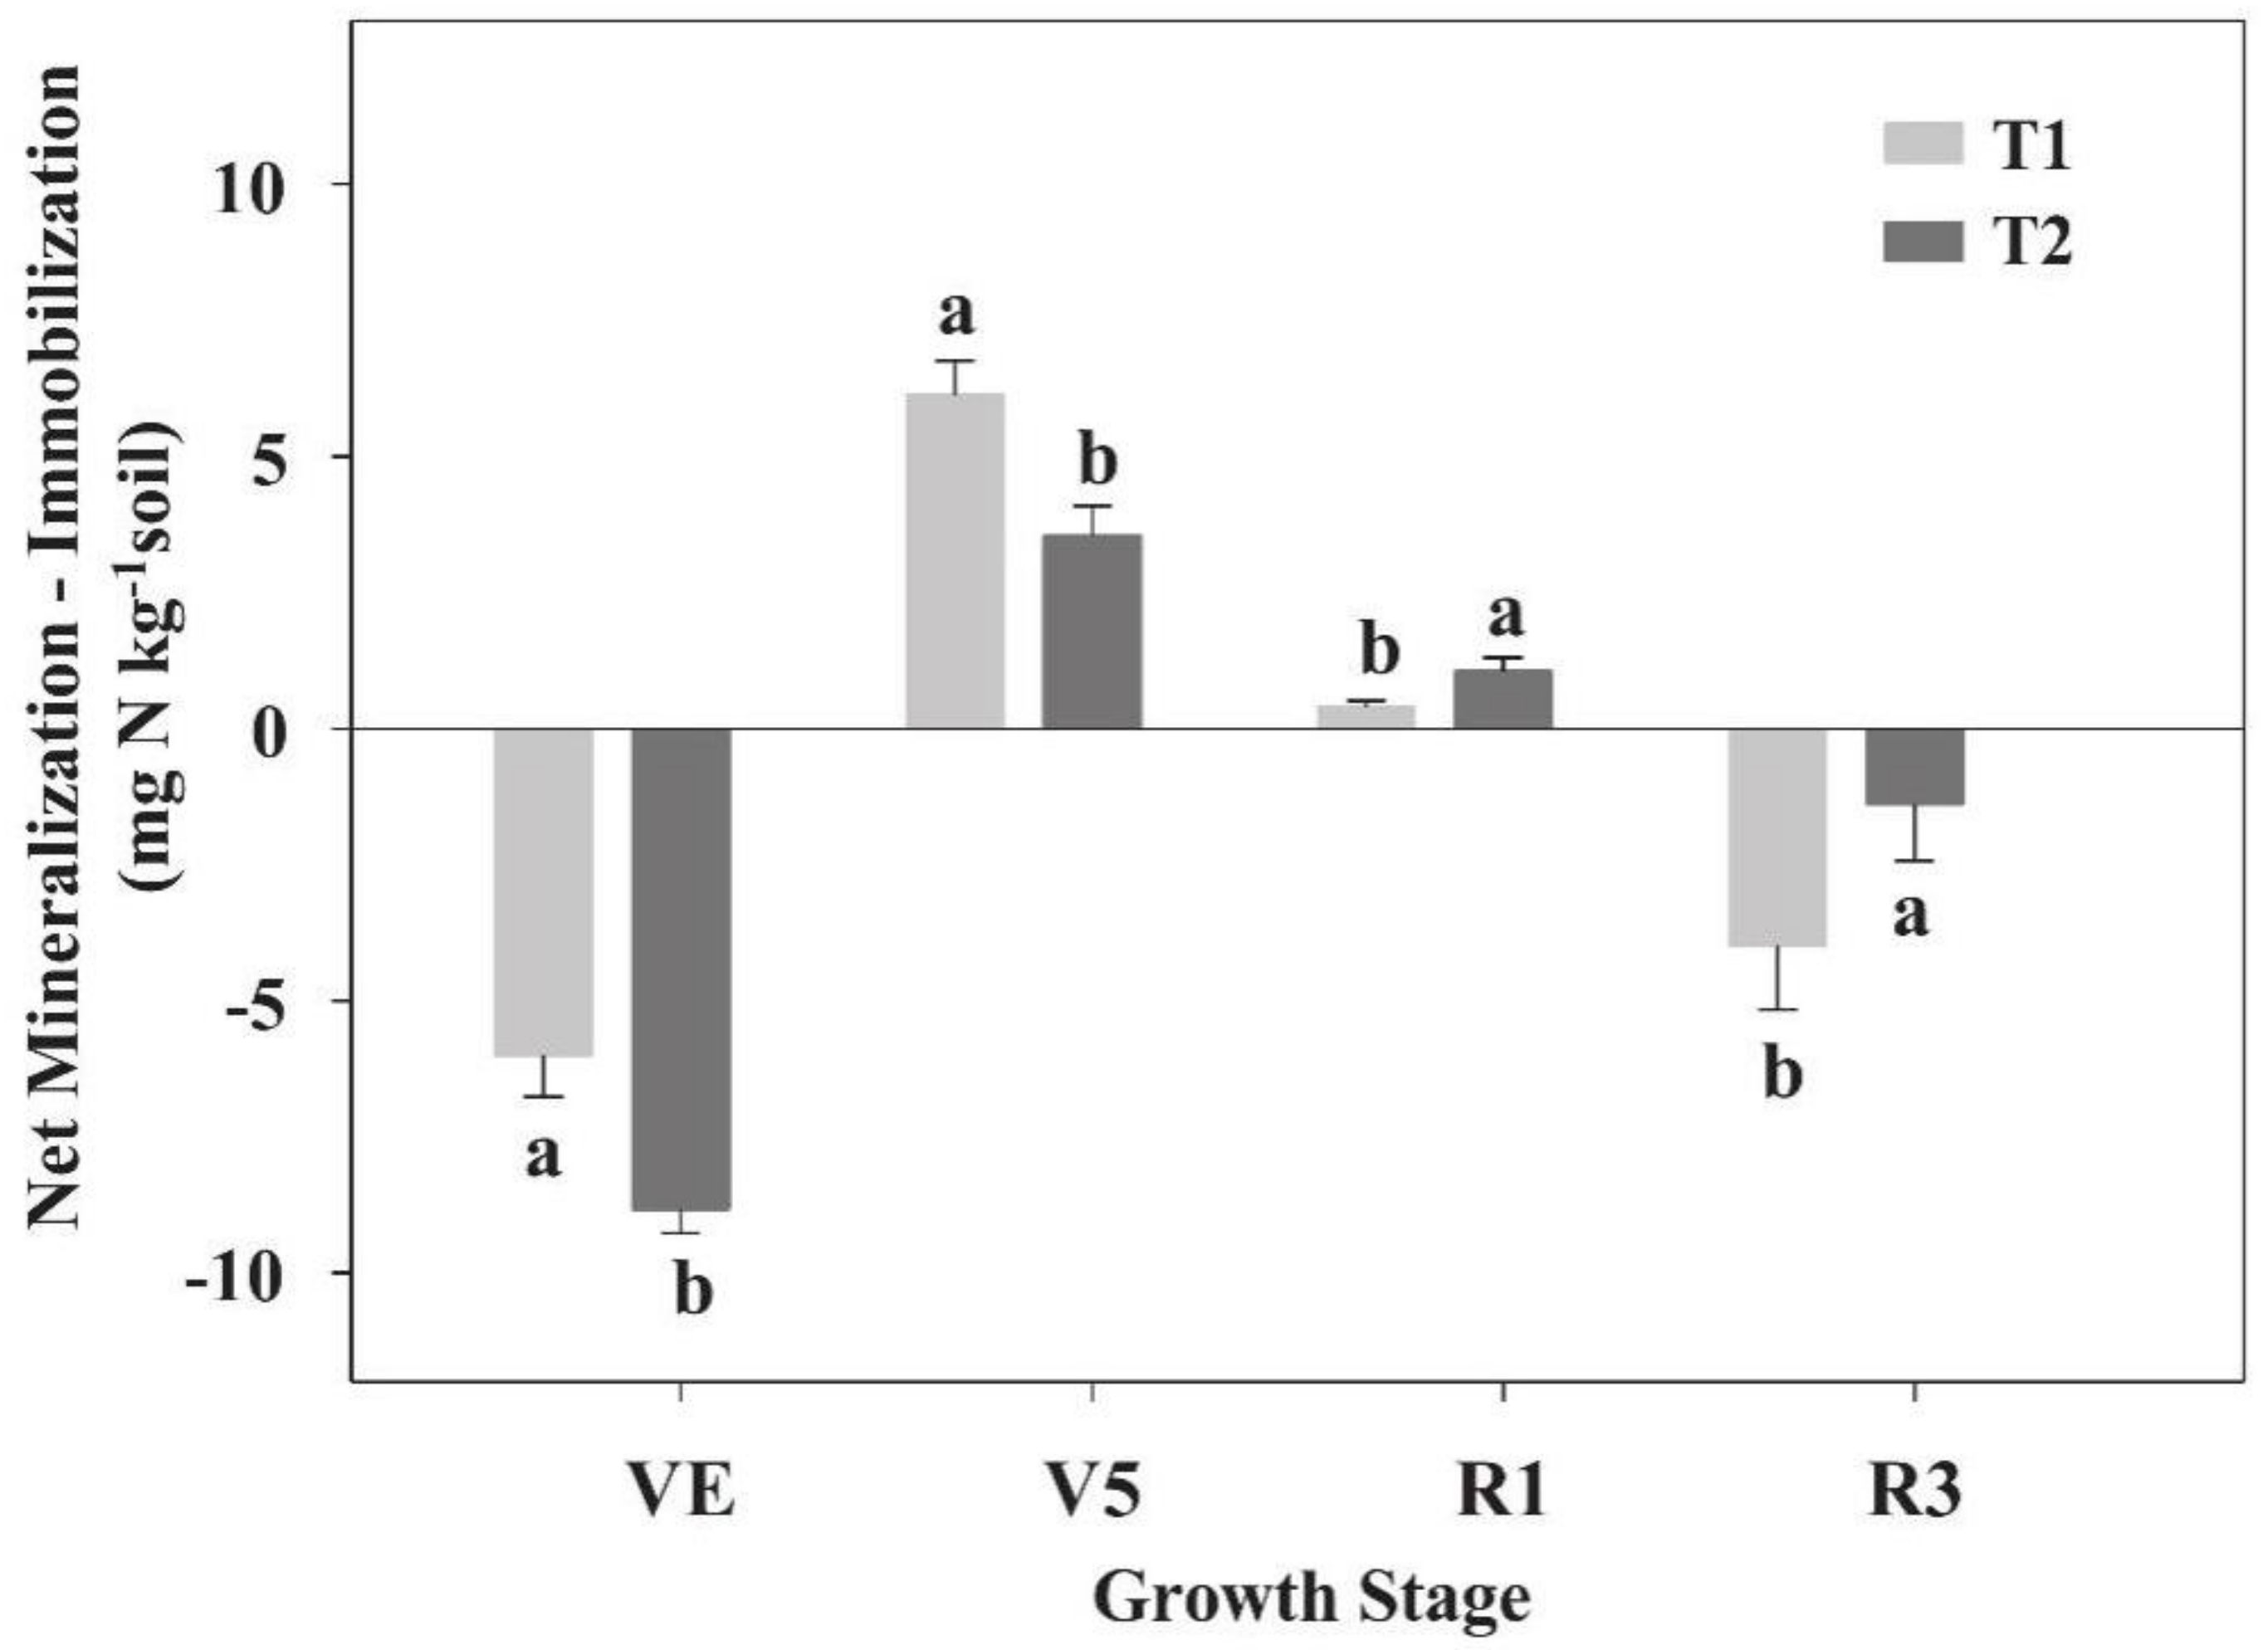
At the VE stage, T1 and T2 decreased NO3 content by 35.36% and 53.74%, and decreased TIN contents by 30.63% and 53.15% compared to T0, respectively (Figure 3a). Net N immobilization occurred under both T1 and T2, and T2 had a lower value (p < 0.05) than T1 at the VE stage. The TIN contents significantly differed and were higher in T1 and T2 soils than T0 at the V5 stage. Net N mineralization was found in these two treatments, and T1 had a higher net N mineralization (p < 0.05) than T2 in the V5 stage. In R1 and R3 stages, all three treatments had no significant differences in the contents of NO3 and TIN. Nevertheless, T1 had a higher net immobilization than T2 (Figure 4).
Compared to the 0–5 cm layer, there were smaller changes of the NO3 and TIN in the 5–10 cm layer. The content of NO3 at the VE stage was lower in T0 than in T1 and T2, but there were no significant differences in TIN contents among all treatments. At the V5 stage, the T2 remarkably increased NO3 content relative to T0 and T1 (p < 0.05). In R1 and R3 stages, there were no significant differences in NO3 content among the three treatments. T1 and T2 both had marked effects on TIN content in the R1 stage, and the highest NO3 content was found in T2. At the other stages, there was negligible change of TIN content in all treatments (Figure 3b).

3.3. The Relationship between N Uptake and Maize Growth

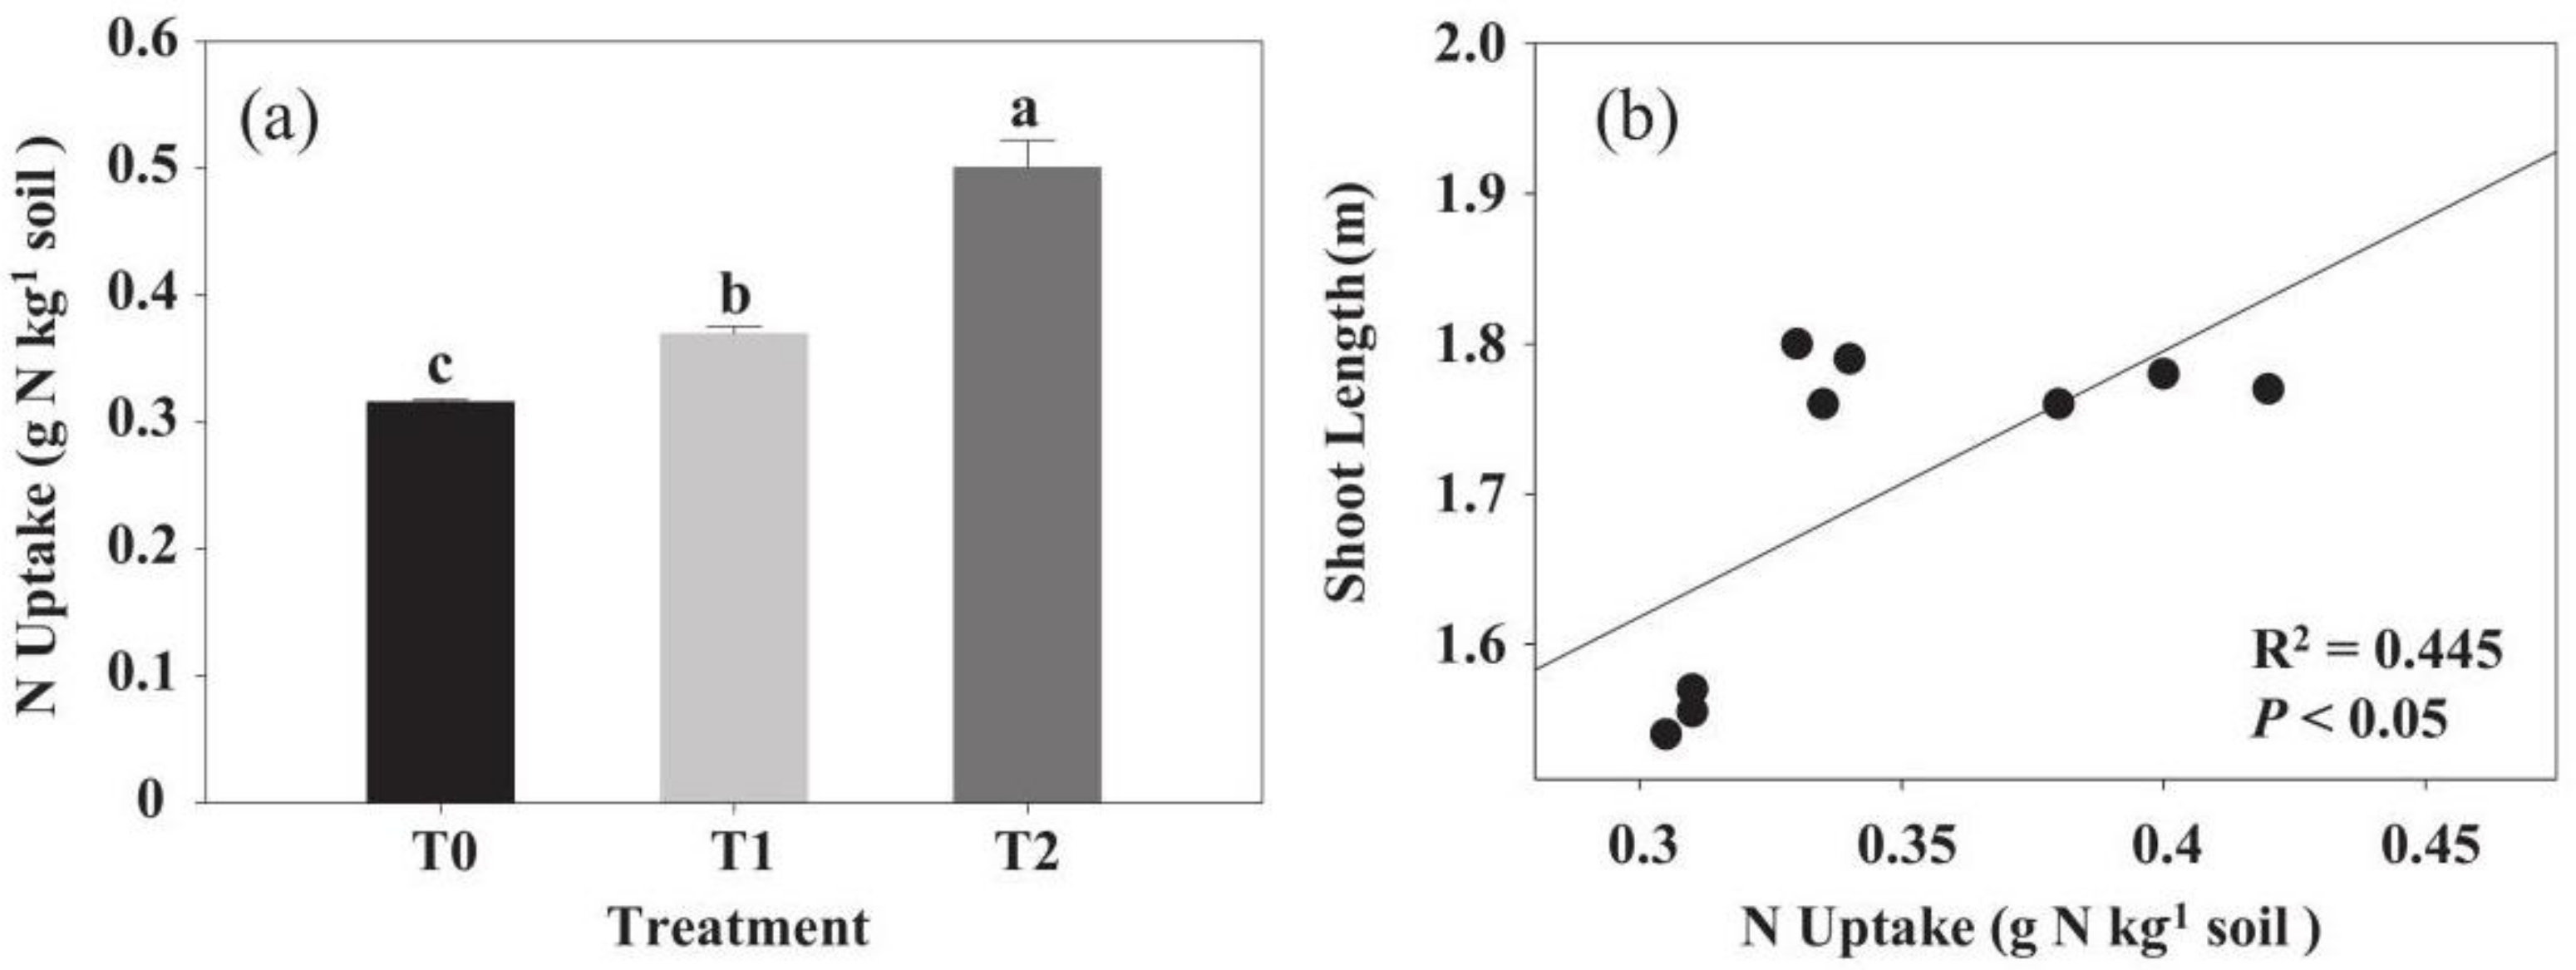
There were significant differences in total N uptake of maize among the three treatments. The total N uptake of maize was 0.32, 0.37 and 0.50 mg kg−1 in T0, T1 and T2, respectively. T1 and T2 exhibited 15.6% and 56.3% higher N uptake (p < 0.05) respectively, than T0 (Figure 5a). Moreover, the regression analysis indicated that the shoot length was significantly and positively correlated with N uptake (Figure 5b).

3.4. The Distribution of Residue-Derived N

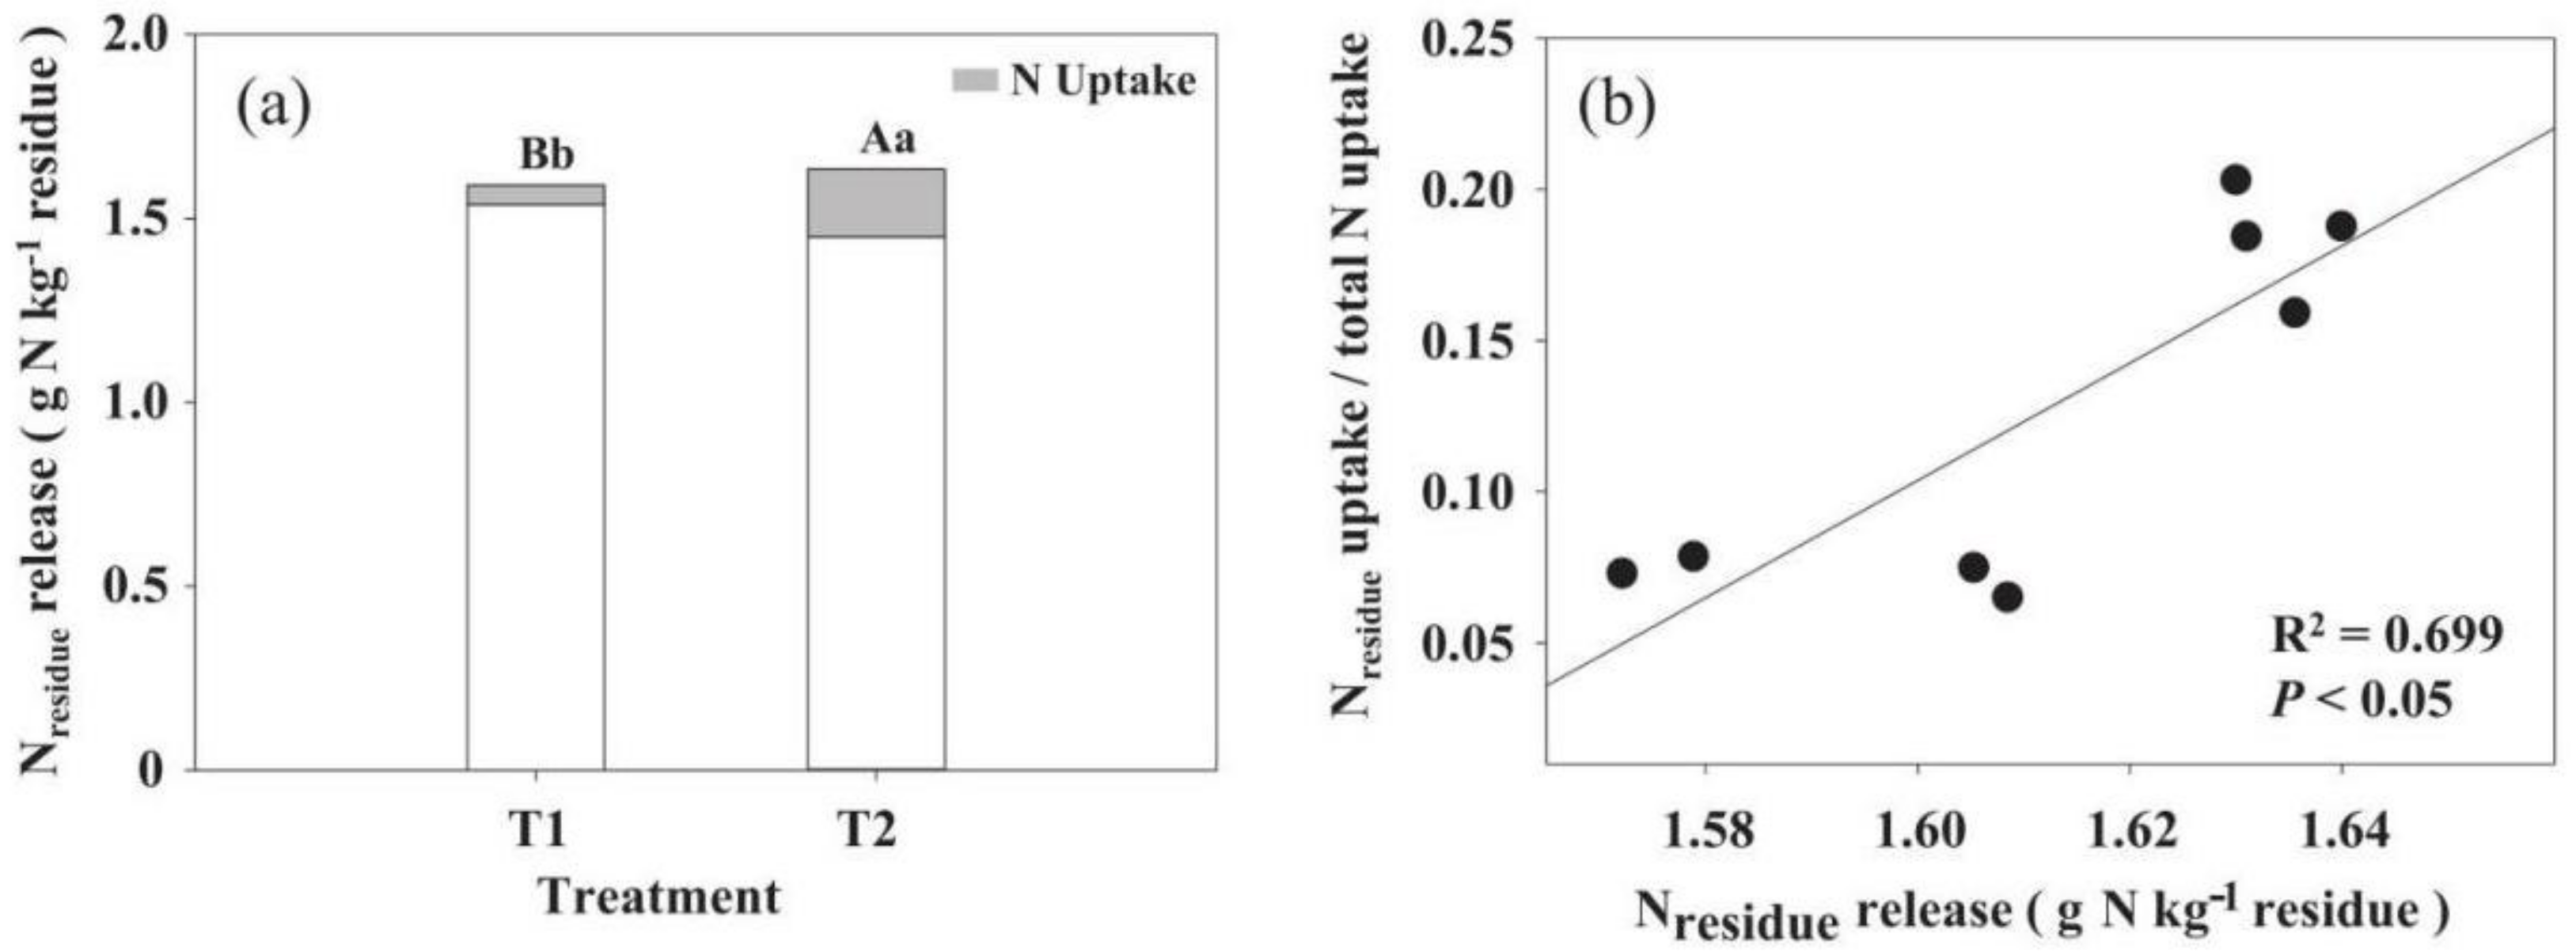
At the end of experiment and in the T1 and T2 treatments, the total residue-derived N release was 1.59 and 1.63 g kg−1 residue, respectively; the residue-derived N uptake was 0.05 and 0.18 g kg−1 residue, respectively (Figure 6a). The amount of N uptake varied greatly with different positions of residue addition; that is, 3.40–11.3% of the total residue-derived N release was taken up by plants. In the T2 treatment, the total N release was 2.70% higher than in T1 (Figure 6a). Moreover, a significant positive relationship was found between the proportion of residue-derived N uptake in the total N uptake by plants and residue-derived N release (Figure 6b).

4. Discussion

4.1. Microbial Biomass

Residue retention is an essential factor in stimulating soil microbial biomass and microbial activity. Our results are in agreement with some previous studies which showed that residue addition increases microbial biomass in north central China [29,30], northeast China [31,32,33], and central Mexico [34]. In addition, the MBC/MBN ratio reflected the balance between microbial C and N utilization [35]. The present result showed that maize residue retention markedly decreased the MBC/MBN, indicating microbe N utilization increased more than microbe C utilization [35]. However, maize residue incorporation could stimulate more microbial biomass and microbial activity. The reason for the above results was that incorporation of residue into the 0–10 cm soil layer provided a more suitable environment including moisture and contact with the soil for nutrients for microorganisms to live; there was close contact between microbes, soils and residues necessary to promote rapid decomposition of residues. Moreover, the results showed that the lowest MBN content and the highest MBC/MBN ratio occurred at the R1 stage. This was likely because in the grain-forming stage, a large amount of available N was needed to meet crop growth demands, thus the microbial N contributed to crop N uptake [36]. Then, the MBC and MBN contents increased again in all treatments, indicating that the number and activity of microbes also increased again in this period. At the same time, residue on the soil surface had a higher MBC content. We attributed this to accelerating residue decomposition on the soil surface with increasing incubation time. Taken together, these findings indicate that decomposition of incorporated residue proceeded more rapidly than that of the surface residue.
The MBN content was lower in the 5–10 cm layer than in the 0–5 cm layer, which was similar to the results of [8]. This was because higher moisture contents and greater distance (isolation) from the atmosphere led to anoxia in the soil, which restricted microbial activity in the deeper soils [37]. The placement of residue had no significant impact on the MBN content in the deeper soil layer. We attribute this result to there being fewer microbes in deeper soil, so there was not a strong response to residue addition at this depth. This is probably because soil conditions such as oxygen concentrations change with depth and the suitability of the environment for microbial activity declines with increasing soil depth [38]. However, further analyses are required to clarify the underlying mechanism of this result.

4.2. N Dynamics Dominated by Microbes in the Growing Period

In the present study, residue addition decreased both TIN and NO3 contents in the 0–5 cm soil layers at the initial growth stage, while the MBC and MBN contents increased. This is because soil microbes use inorganic N from soil to decompose crop residues by microbial immobilization, and thereby increase the competition for TIN between plant and microbes [39,40]. The incorporated residues treatment (T2) had stronger ability for net N immobilization than residues left on the soil surface treatment (T1). It has been demonstrated that the increased microbial immobilization of N may decrease the risk of mineral N losses, especially at earlier growing stages when plant N demand is low [21,41]. Over the growing season, increasing N mineralization occurred in both residue retention treatments, which was similar to the result of [42]. They found that in the first week, soil inorganic N content initially decreased due to immobilization by microbes, and then with increased time, the amount of N mineralization significantly increased with increased release of N accompanying the process of residue decomposition. Similar findings were obtained by [43]. By the time of the R3 stage, NH4+ content had increased markedly in all treatments, which reflected that the living soil microbes could not reuse N in biomass of dead microbes until the N had been mineralized by other microbes to NH4+. Other studies also reported that N assimilated in microbial biomass during early crop growth might be released through mineralization in the late growth stages [44].

4.3. Maize N Uptake and Growth

The crop residues, as an available N source, contributed to the crop growth and enhanced soil quality and N cycle activities [7,45]. In the present study, compared to T0, residue additions (T1 and T2) significantly increased N uptake, indicating that returning maize residue is a viable way to provide more available N for uptake by crops. This result was in agreement with a previous finding that the crop could absorb more available N from soil under residue return [46]. However, Soon and Lupwayi [47] got a contradictory result that crop N uptake was decreased when crop residue was returned on the soil surface compared to no residue returned to the soil; they did not have an incorporated residue treatment. T2 had greater maize N uptake than T1 in the present study (Figure 5a), indicating that T2 achieved more effective utilization of the residue N. The reason for this result was that the environment for the microbes to decompose the residue was more suitable for incorporated residue than surface residue. Hu et al. [7] also validated that a lower N uptake occurred in the residue returned on the surface than incorporated into the soil. In contrast, some studies showed that in sandy soils, residue on the surface had a higher crop N uptake than residue incorporated into soils [44]. Our regression results showed a positive relationship between the shoot length and N uptake of plants. Freeman et al. [48] found a similar result in the later growth stages of maize, and Peng et al. [49] also showed that the shoot length of maize was synchronized with shoot development.

4.4. The Distribution of Residue-Derived N in the Soil

N source (residue-derived or soil organic or inorganic N) is a crucial indicator which can be used to quantify the N utilization efficiency. Organic resource input is an important N source for maintaining crop productivity [50]. In this present study, it was shown that, of the total N taken up by the crop, 3.4 and 11.3% was derived from residue in the T1 and T2 treatments, respectively. It was shown that residue incorporation into the soil could stimulate microbial activity and the rate of microbial biomass turnover, and this led to a faster release of N and an increase in the inorganic N supply. These values were in agreement with a previous study that demonstrated that plant residue supplied less than 20% of the N source for crop [7]. Some studies also demonstrated that maize residue provided less than 10% of N sources for crop growth [50,51]. In fact, soil N derived from residue or fertilizer from previous years would be the sole source of crop N for T0 where neither residue nor chemical N fertilizer was added. Therefore, returning residues into the soil is a better way for sustaining soil fertility. In addition, it was shown that a large portion of crop residue N from the previous crop year appeared to not be readily available to the current crop (Figure 6a). Instead, residue decomposed gradually and ended up in the soil replenishing the soil N pool, likely as organic N in soil organic matter, and perhaps some as soil mineral N that was not taken up by the plants; under certain conditions, mineral N in the soil is vulnerable to loss by leaching or denitrification [52]. In addition, the significant positive relationship (Figure 6b) showed that the residue-derived N release affected the amount of residue-derived N taken up by crops. The difference between T1 and T2 in N uptake was attributed to the difference in the N supply between the two residue placements. This implied that T2 could give a greater chance for crops to absorb the N provided by the residue because of more residue-derived N released during the growing season.
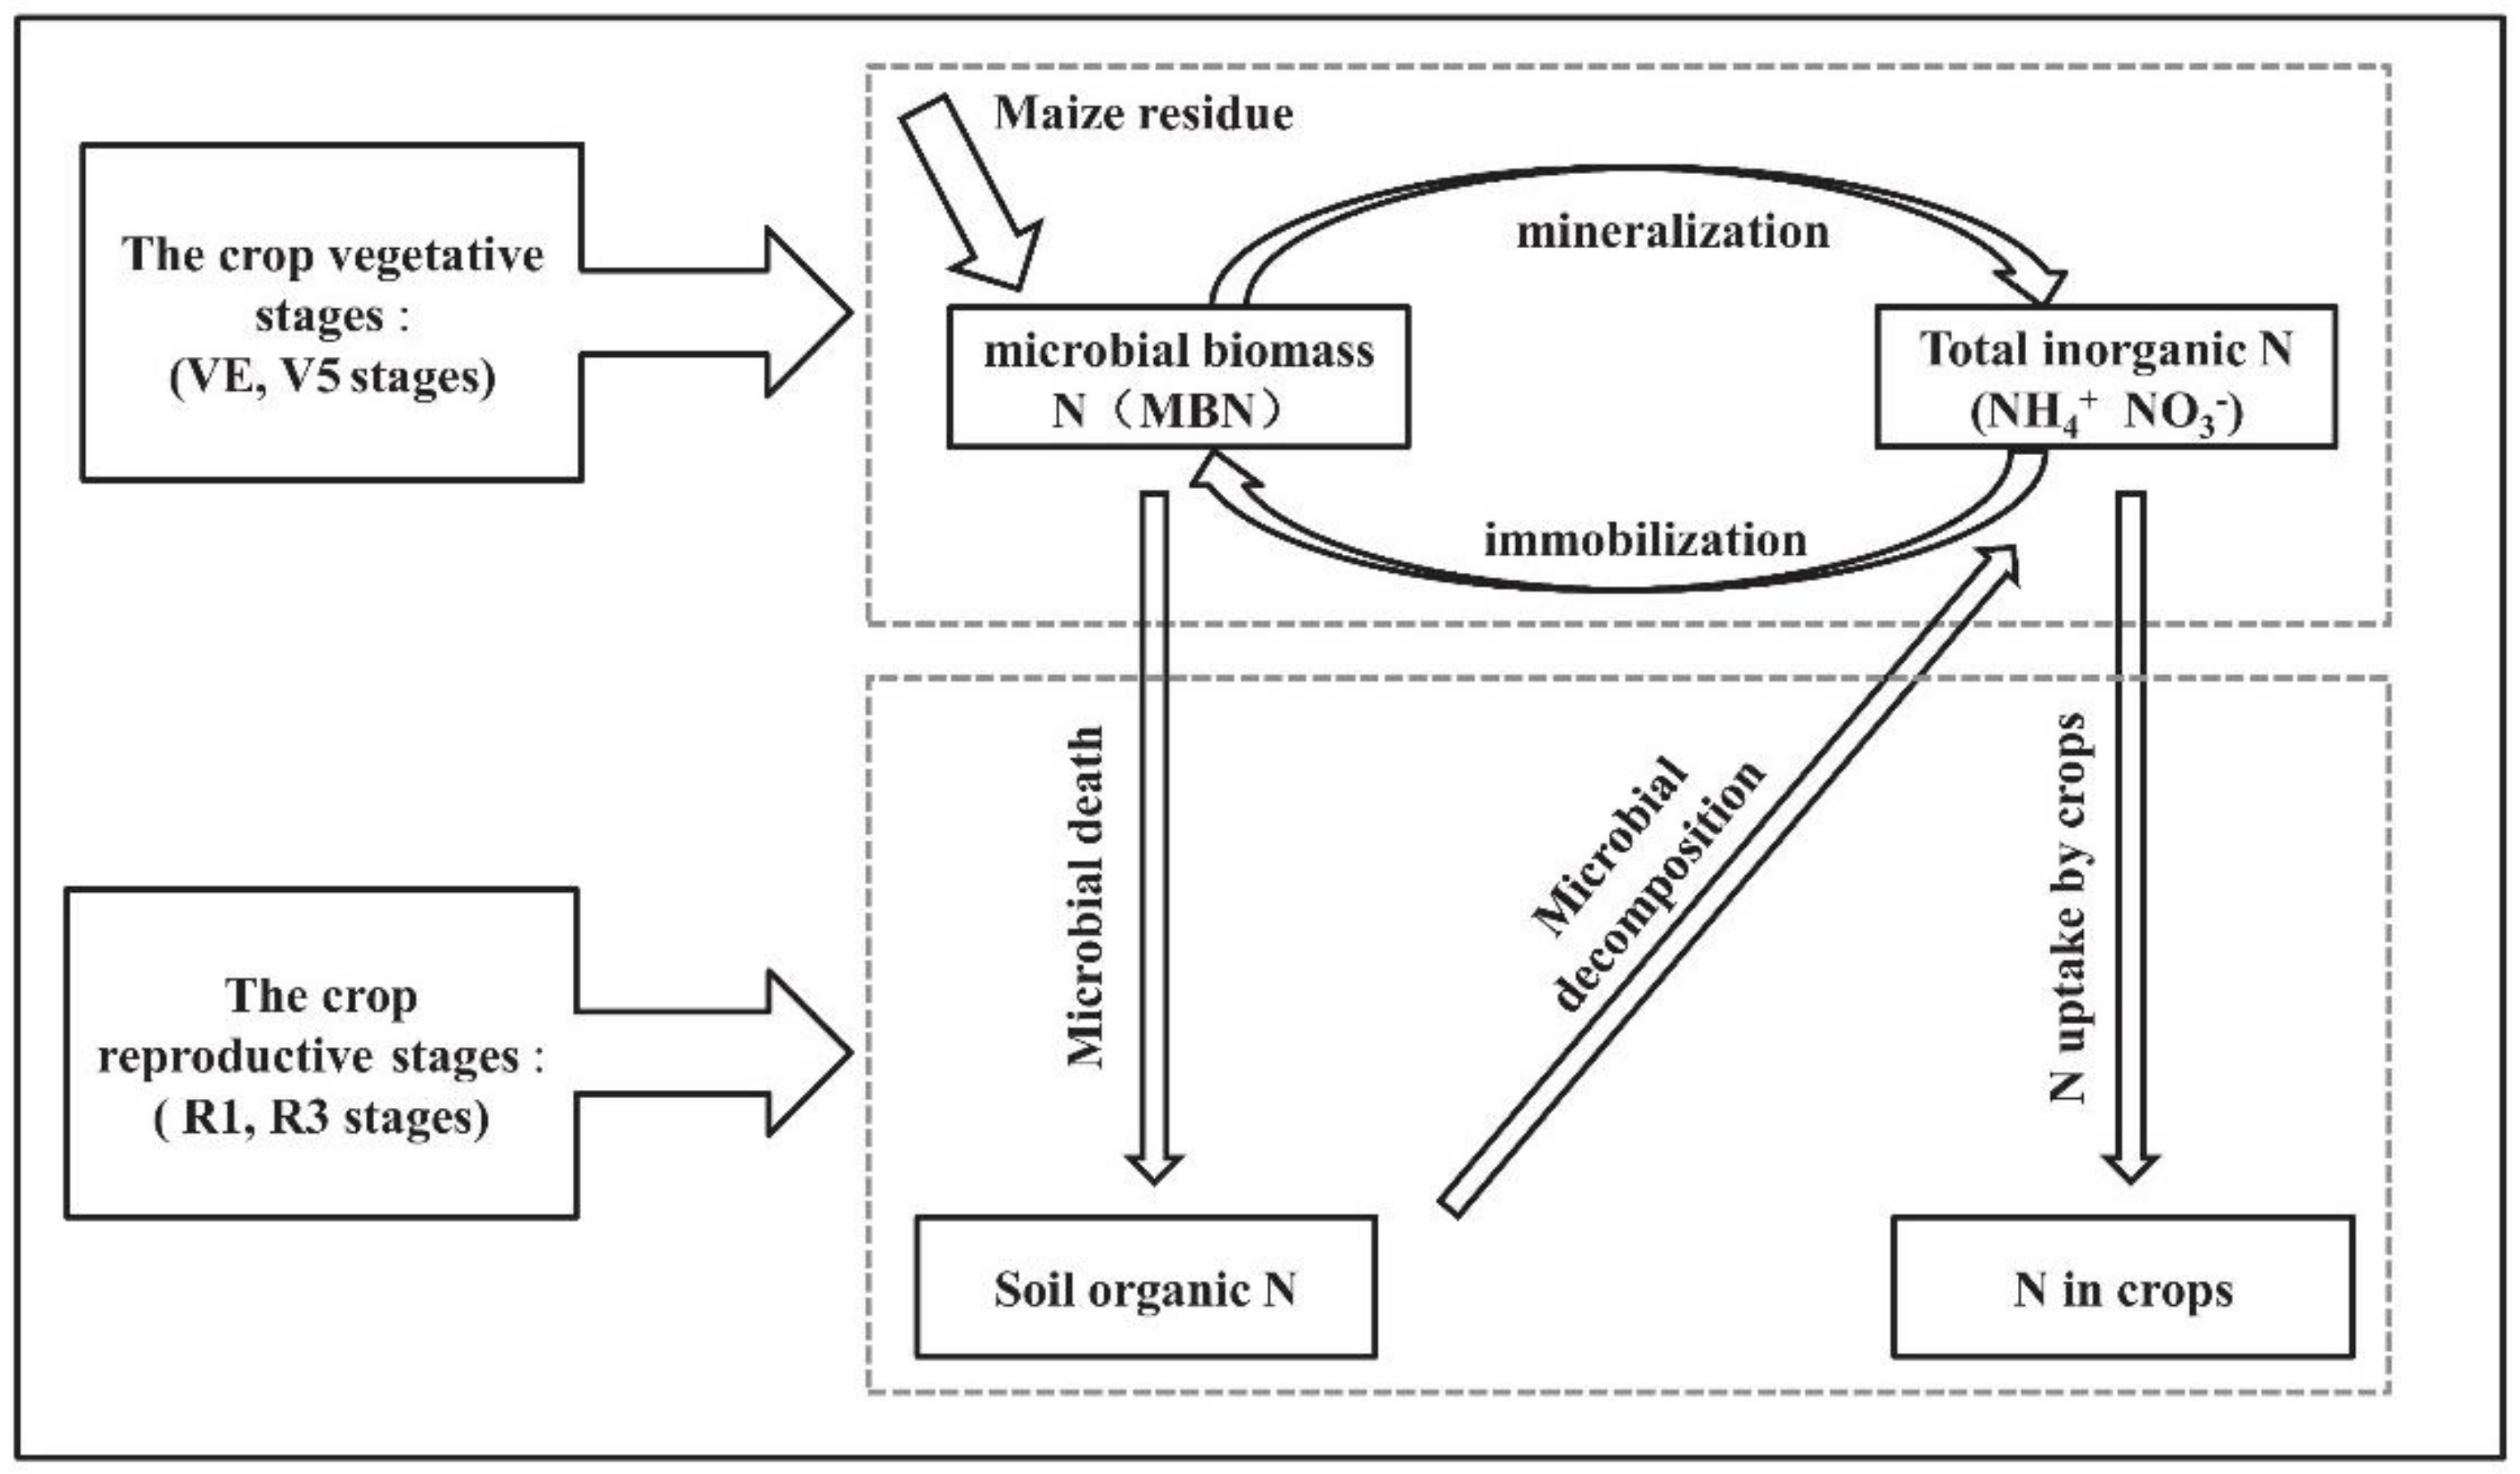
Overall, the present study quantified the mechanism of nitrogen utilization by microbes and crops in different maize growth stages under maize residue retention on the surface and incorporated into the soil (Figure 7). Maize growth can be divided into two stages: the vegetative stage and the reproductive stage. At the vegetative stage, including VE and V5 stages, and because in this study returned residue was the only source of N without fertilizer applied and then microorganisms used N sources to decompose residues. The dead microbes became a new source of organic N in soil, which was mineralized by living microorganisms into inorganic N for re-utilization, which stimulated the second growth of microorganisms [44]. This may explain why residues returned to the soil first lowered mineral N early in the growing season, and then later increased it.
Our research focused on plant and microbial responses to different placement of residue. However, residue incorporation requires some form of tillage and soil disturbance which has negative aspects such as disruption of soil aggregation and fungal hyphae; indeed, many studies have shown the adverse aspects of conventional tillage. Perhaps a compromise could be achieved between no tillage and conventional tillage, where a light shallow tillage could be used to incorporate residue without causing all of the negative effects of mouldboard ploughing to a depth of approximately 20 cm. A very shallow incorporation would get some soil mixed with the residue to help the microbes grow, while minimizing the negative effects of conventional tillage.

5. Conclusions

When there was no mineral fertilizer application, the maize residue incorporation into the soils (T2) markedly increased soil microbial biomass compared to soil without residue addition (T0) and residue addition on the soil surface (T1) at different growth stages. Moreover, our results confirmed that residue addition promoted the inorganic N turnover through changing net mineralization and immobilization in soils, enhanced N availability and increased crop uptake of inorganic N. In particular, our findings demonstrate that residue incorporation into the soil (T2) significantly increased net N immobilization accompanied by an initial decrease in net N mineralization in the maize early growth stage, which could reduce potential N loss, thus increasing N use efficiency in soil, and T2 could supply more inorganic N for crop growth. Further studies are needed to identify and quantify the fate of the large portion of residue N not taken up by the crop. Meanwhile, using 15N isotope tracers, the complex residue N turnover in the soil–crop system will be assessed.

Author Contributions

Y.G. and A.L. developed the idea of this study and participated in its design. Y.G. was a major contributor in writing the manuscript. A.L. and N.M. provided critical review and substantially revised the manuscript. Y.Z., S.Z., X.C., H.Z. and R.F. provided useful advice. All authors have read and agreed to the published version of the manuscript.

Funding

This research was supported by the Science and Technology Project for Black Soil Granary (XDA28080200), the National Natural Science Foundation of China (41771206, 41877095), the Strategic Priority Research Program of the Chinese Academy of Sciences (XDA2307050103), the Key Research Program of Frontier Sciences, CAS (QYZDB-SSW-DQC035), and Innovation Leadership and Team Program in Sciences and Technologies for Young and Middle-aged Scientists of Jilin Province (20200301022RQ).

Institutional Review Board Statement

Not applicable.

Informed Consent Statement

Not applicable.

Data Availability Statement

Not applicable.

Acknowledgments

The authors would like to thank Siyi Liu for his valuable comments and suggestions on the manuscript.

Conflicts of Interest

The authors declare that they have no competing interest.

References

  1. Zhang, X.; Xin, X.; Yang, W.; Zhu, A.; Ding, S. Short-term decomposition turnover and retention of residue-derived carbon are influenced by the fertility level in a sandy loam soil. Geoderma 2019, 349, 68–78. [Google Scholar] [CrossRef]
  2. Liang, A.Z.; McLaughlin, N.B.; Ma, B.L.; Gregorich, E.G.; Morrison, M.J.; Burtt, S.D.; Evenson, L. Changes in mouldboard plough draught and tractor fuel consumption on continuous corn after 18 years of organic and inorganic N amendments. Energy 2013, 52, 89–95. [Google Scholar] [CrossRef]
  3. Chen, J.M. Carbon neutrality: Towards a sustainable future. Innovation 2021, 2, 100127. [Google Scholar]
  4. Zhang, J.; Zhang, J.; Shen, G.; Wang, R.; Gao, L.; Li, Z.; Dai, Y.; Meng, G.; Xiang, B.; Zhang, Z. Effects of different types of straw and stalk returning on carbon and nitrogen mineralization in tobacco soil. Tob. Sci. Technol. 2016, 49, 1–6. [Google Scholar]
  5. Li, Z.; Zhao, B.; Olk, D.C.; Jia, Z.; Mao, J.; Cai, Y.; Zhang, J. Contributions of residue-C and -N to plant growth and soil organic matter pools under planted and unplanted conditions. Soil Biol. Biochem. 2018, 120, 91–104. [Google Scholar] [CrossRef]
  6. Burgess, M.S.; Mehuys, G.R.; Madramootoo, C.A. Nitrogen dynamics of decomposing corn residue components under three tillage systems. SSSA J. 2002, 66, 1350–1358. [Google Scholar] [CrossRef] [Green Version]
  7. Hu, G.; Liu, X.; He, H.; Zhang, W.; Xie, H.; Wu, Y. Multi-seasonal nitrogen recoveries from crop residue in soil and crop in a temperate agro-ecosystem. PLoS ONE 2015, 10, e0133437. [Google Scholar] [CrossRef] [PubMed] [Green Version]
  8. Li, C.H.; Yan, K.; Tang, L.S.; Jia, Z.J.; Li, Y. Change in deep soil microbial communities due to long-term fertilization. Soil Biol. Biochem. 2014, 75, 264–272. [Google Scholar] [CrossRef]
  9. Cayuela, M.L.; Sinicco, T.; Mondini, C. Mineralization dynamics and biochemical properties during initial decomposition of plant and animal residues in soil. Appl. Soil Ecol. 2009, 41, 118–127. [Google Scholar] [CrossRef]
  10. Blanco-Canqui, H.; Lal, R.; Trigiano, R.N.; Gray, D.J. Crop residue removal impacts on soil productivity and environmental quality. Crit. Rev. Plant Sci. 2009, 28, 139–163. [Google Scholar] [CrossRef]
  11. Govaerts, B.; Sayre, K.D.; Ceballos-Ramirez, J.M.; Luna-Guido, M.L.; Limon-Ortega, A.; Deckers, L.; Dendooven, L. Conventionally tilled and permanent raised beds with different crop residue management: Effects on soil C and N dynamics. Plant Soil 2006, 280, 143–155. [Google Scholar] [CrossRef]
  12. Aulakh, M.A.; Doran, J.W.; Walters, D.T.; Mosier, A.R.; Francis, D.D. Crop residue type and placement effects on denitrification and mineralization. SSSA J. 1991, 55, 1020–1025. [Google Scholar] [CrossRef] [Green Version]
  13. Jat, R.L.; Jha, P.; Dotaniya, M.L.; Lakaria, B.L.; Rashmi, I.; Meena, B.P.; Meena, A.L. Carbon and nitrogen mineralization in Vertisol as mediated by type and placement method of residue. Environ. Monit. Assess. 2018, 190, 439. [Google Scholar] [CrossRef]
  14. Curtin, D.; Selles, F.; Wang, H.; Campbell, C.A.; Biederbeck, V.O. Carbon dioxide emissions and transformation of soil carbon and nitrogen during wheat straw decomposition. SSSA J. 1998, 62, 1035–1041. [Google Scholar] [CrossRef]
  15. Coppens, F.; Garnier, P.; Merckx, R.; Recous, S. Soil moisture carbon and nitrogen dynamics following incorporation versus surface application of labelled residues in soil columns. Eur. J. Soil Sci. 2006, 57, 894–905. [Google Scholar] [CrossRef]
  16. Urakawa, R.; Shibata, H.; Kuroiwa, M.; Inagaki, Y.; Tateno, R.; Hishi, T.; Suwa, Y. Effects of freeze–thaw cycles resulting from winter climate change on soil nitrogen cycling in ten temperate forest ecosystems throughout the Japanese archipelago. Soil Biol. Biochem. 2014, 74, 82–94. [Google Scholar] [CrossRef]
  17. Li, X.X.; Hu, C.S.; Delgado, J.A.; Zhang, Y.M.; Ouyang, Z.Y. Increased nitrogen use efficiencies as a key mitigation alternative to reduce nitrate leaching in north China plain. Agric. Water Manag. 2007, 89, 137–147. [Google Scholar] [CrossRef]
  18. Zhu, D.W.; Huang, Y.; Jin, Z.Q.; Zhang, W.; Jiang, J. Nitrogen management evaluated by models combined with GIS—A case study of Jiangsu croplands China in 2000. Agric. Sci. China 2008, 7, 999–1009. (In Chinese) [Google Scholar] [CrossRef]
  19. Bowles, T.M.; Atallah, S.S.; Campbell, E.E.; Gaudin, A.C.M.; Wieder, W.R.; Grandy, A.S. Addressing agricultural nitrogen losses in a changing climate. Nat. Sustain. 2018, 1, 399–408. [Google Scholar] [CrossRef]
  20. Naresh, R.K.; Timsina, J.; Bhaskar, V.; Gupta, R.K.; Singh, A.K.; Dhaliwa, S.S.; Rathore, R.S.; Kumar, V.; Singh, P.; Singh, S.P. Effects of tillage residue and nutrient management on soil organic carbon dynamics and its fractions soil aggregate stability and soil carbon sequestration: A review. EC Nutr. 2017, 12, 53–80. [Google Scholar]
  21. Sugihara, S.; Funakawa, S.; Kilasara, M.; Kosaki, T. Effect of land management on soil microbial N supply to crop N uptake in a dry tropical cropland in Tanzania. Agric. Ecosyst. Environ. 2012, 146, 209–219. [Google Scholar] [CrossRef] [Green Version]
  22. Bird, J.A.; Horwath, W.R.; Eagle, A.J. Immobilization of fertilizer nitrogen in rice. SSSA J. 2001, 65, 1143–1152. [Google Scholar] [CrossRef]
  23. Sakala, W.D.; Cadisch, G.; Giller, K.E. Interactions between residues of maize and pigeon pea and mineral N fertilizers during decomposition and N mineralization. Soil Biol. Biochem. 2000, 32, 679–688. [Google Scholar] [CrossRef]
  24. Pan, F.; Yu, W.; Ma, Q.; Zhou, H.; Jiang, C.; Xu, Y. Do organic amendments improve the synchronism between soil N supply and wheat demand? Appl. Soil Ecol. 2018, 125, 184–191. [Google Scholar] [CrossRef]
  25. Brookes, P.C.; Kragt, J.F.; Powlson, D.S.; Jenkinson, D.S. Chloroform fumigation and the release of soil nitrogen: The effects of fumigation time and temperature. Soil Biol. Biochem. 1985, 17, 831–835. [Google Scholar] [CrossRef]
  26. Vance, E.D.; Brookes, P.C.; Jenkinson, D.S. An extraction method for measuring soil microbial biomass C. Soil Biol. Biochem. 1987, 19, 703–707. [Google Scholar] [CrossRef]
  27. Joergensen, R.G.; Mueller, T. The fumigation-extraction method to estimate soil microbial biomass: Calibration of the ken value. Soil Biol. Biochem. 1996, 28, 33–37. [Google Scholar] [CrossRef]
  28. Chen, Y.; Tang, X.; Yang, S.; Wu, C.; Wang, J. Contributions of different N sources to crop N nutrition in a Chinese rice field. Pedosphere 2010, 20, 198–208. [Google Scholar] [CrossRef]
  29. Zhao, S.; Li, K.; Zhou, W.; Qiu, S.; Huang, S.; He, P. Changes in soil microbial community enzyme activities and organic matter fractions under long–term straw return in north–central China. Agric. Ecosyst. Environ. 2016, 216, 82–88. [Google Scholar] [CrossRef]
  30. Heijboer, A.; ten Berge, H.F.; de Ruiter, P.C.; Jørgensen, H.B.; Kowalchuk, G.A.; Bloem, J. Plant biomass soil microbial community structure and nitrogen cycling under different organic amendment regimes: A 15N tracer–based approach. Appl. Soil Ecol. 2016, 107, 251–260. [Google Scholar] [CrossRef]
  31. Lou, Y.; Liang, W.; Xu, M.; He, X.; Wang, Y.; Zhao, K. Straw coverage alleviates seasonal variability of the topsoil microbial biomass and activity. Catena 2011, 86, 117–120. [Google Scholar] [CrossRef]
  32. Sun, B.J.; Jia, S.X.; Zhang, S.X.; McLaughlin, N.B.; Zhang, X.; Liang, A.Z.; Liu, S.Y. Tillage seasonal and depths effects on soil microbial properties in black soil of Northeast China. Soil Till. Res. 2016, 155, 421–428. [Google Scholar] [CrossRef]
  33. Liang, A.Z.; Zhang, Y.; Zhang, X.P.; Yang, X.M.; McLaughlin, N.B.; Chen, X.W.; Tang, J. Investigations of relationships among aggregate pore structure microbial biomass and soil organic carbon in a Mollisol using combined non-destructive measurements and phospholipid fatty acid analysis. Soil Till. Res. 2019, 185, 94–101. [Google Scholar] [CrossRef]
  34. Fontaine, S.; Barot, S.; Barré, P.; Bdioui, N.; Mary, B.; Rumpel, C. Stability of organic carbon in deep soil layers controlled by fresh carbon supply. Nature 2007, 450, 277–280. [Google Scholar] [CrossRef] [PubMed]
  35. Mooshammer, M.; Wanek, W.; Hammerle, I.; Fuchslueger, L.; Hofhansl, F.; Knoltsch, A.; Schnecker, J.; Takriti, M.; Watzka, M.; Wild, B.; et al. Adjustment of microbial nitrogen use efficiency to carbon:nitrogen imbalances regulates soil nitrogen cycling. Nat. Commun. 2014, 5, 3694. [Google Scholar] [CrossRef] [PubMed]
  36. Li, H.; Zhang, Y.Y.; Yang, S.; Wang, Z.R.; Feng, X.; Liu, H.Y.; Jiang, Y. Variations in soil bacterial taxonomic profiles and putative functions in response to straw incorporation combined with N fertilization during the maize growing season. Agric. Ecosyst. Environ. 2019, 283, 106578. [Google Scholar] [CrossRef]
  37. Rumpel, C.; Kogel-Knabner, I. Deep soil organic matter-a key but poorly understood component of terrestrial C cycle. Plant Soil 2011, 338, 143–158. [Google Scholar] [CrossRef]
  38. Jobbagy, E.G.; Jackson, R.B. The vertical distribution of soil organic carbon and its relation to climate and vegetation. Ecol. Appl. 2000, 10, 423–436. [Google Scholar] [CrossRef]
  39. Recous, S.; Robin, D.; Darwis, D.; Mary, B. Soil inorganic N availability: Effect on maize residue decomposition. Soil Biol. Biochem. 1995, 27, 1529–1538. [Google Scholar] [CrossRef]
  40. Corbeels, M.; Hofman, G.; Cleemput, O.V. Nitrogen cycling associated with the decomposition of sunflower stalks and wheat straw in a Vertisol. Plant Soil 2000, 218, 71–82. [Google Scholar] [CrossRef]
  41. Said-Pullicino, D.; Cucu, M.A.; Sodano, M.; Birk, J.J.; Glaser, B.; Celi, L. Nitrogen immobilization in paddy soils as affected by redox conditions and rice straw incorporation. Geoderma 2014, 228–229, 44–53. [Google Scholar] [CrossRef] [Green Version]
  42. Palm, C.A.; Gachengo, C.; Delve, R.; Cadisch, G.; Giller, K.E. Organic inputs for soil fertility management in tropical agroecosystems: Application of an organic resource database. Agric. Ecosyst. Environ. 2001, 83, 27–42. [Google Scholar] [CrossRef]
  43. Geisseler, D.; Horwath, W.R.; Joergensen, R.G.; Ludwig, B. Pathways of nitrogen utilization by soil microorganisms—A review. Soil Biol. Biochem. 2010, 42, 2058–2067. [Google Scholar] [CrossRef]
  44. Kuzyakov, Y.; Xu, X. Tansley Review: Competition between roots and microorganisms for N: Mechanisms and ecological relevance. New Phytol. 2013, 198, 656–669. [Google Scholar] [CrossRef]
  45. Liu, C.; Lu, M.; Cui, J.; Li, B.; Fang, C. Effects of straw carbon input on carbon dynamics in agricultural soils: A meta-analysis. GCB. Bioenergy 2014, 20, 1366–1381. [Google Scholar] [CrossRef]
  46. Wang, M.; Pendall, E.; Fang, C.; Li, B.; Nie, M. A global perspective on agroecosystem nitrogen cycles after returning crop residue. Agric. Ecosyst. Environ. 2018, 266, 49–54. [Google Scholar] [CrossRef]
  47. Soon, Y.K.; Lupwayi, N.Z. Straw management in a cold semi-arid region: Impact on soil quality and crop productivity. Field Crops Res. 2012, 139, 39–46. [Google Scholar] [CrossRef]
  48. Freeman, K.W.; Girma, K.; Arnall, D.B.; Mullen, R.W.; Martin, K.L.; Teal, R.K. By-plant prediction of corn forage biomass and nitrogen uptake at various growth stages using remote sensing and plant height. Agron. J. 2007, 99, 530–536. [Google Scholar] [CrossRef] [Green Version]
  49. Peng, Y.; Niu, J.; Peng, Z.; Zhang, F.; Li, C. Shoot growth potential drives N uptake in maize plants and correlates with root growth in the soil. Field Crop. Res. 2010, 115, 85–93. [Google Scholar] [CrossRef]
  50. Ding, W.; Li, S.; He, P.; Huang, S. Contribution and fate of maize residue-15N and urea-15N as affected by N fertilization regime. PLoS ONE 2019, 14, e0210176. [Google Scholar] [CrossRef]
  51. Shan, H.X.; Lu, C.A.; Zhang, J.T.; Wang, J.Z.; Xu, M.G. Effect of maize straw applied with N fertilizer on nitrogen adsorption of winter wheat under different soil fertility. J. Plant Nutr. Fert. 2012, 18, 35–41. (In Chinese) [Google Scholar]
  52. Cotrufo, W.F.; Wallenstein, M.D.; Boot, C.M.; Paul, E. The Microbial Efficiency-Matrix Stabilization framework integrates plant litter decomposition with soil organic matter stabilization: Do labile plant inputs form stable soil organic matter? Glob. Chang. Biol. 2013, 19, 988–995. [Google Scholar] [CrossRef] [Green Version]
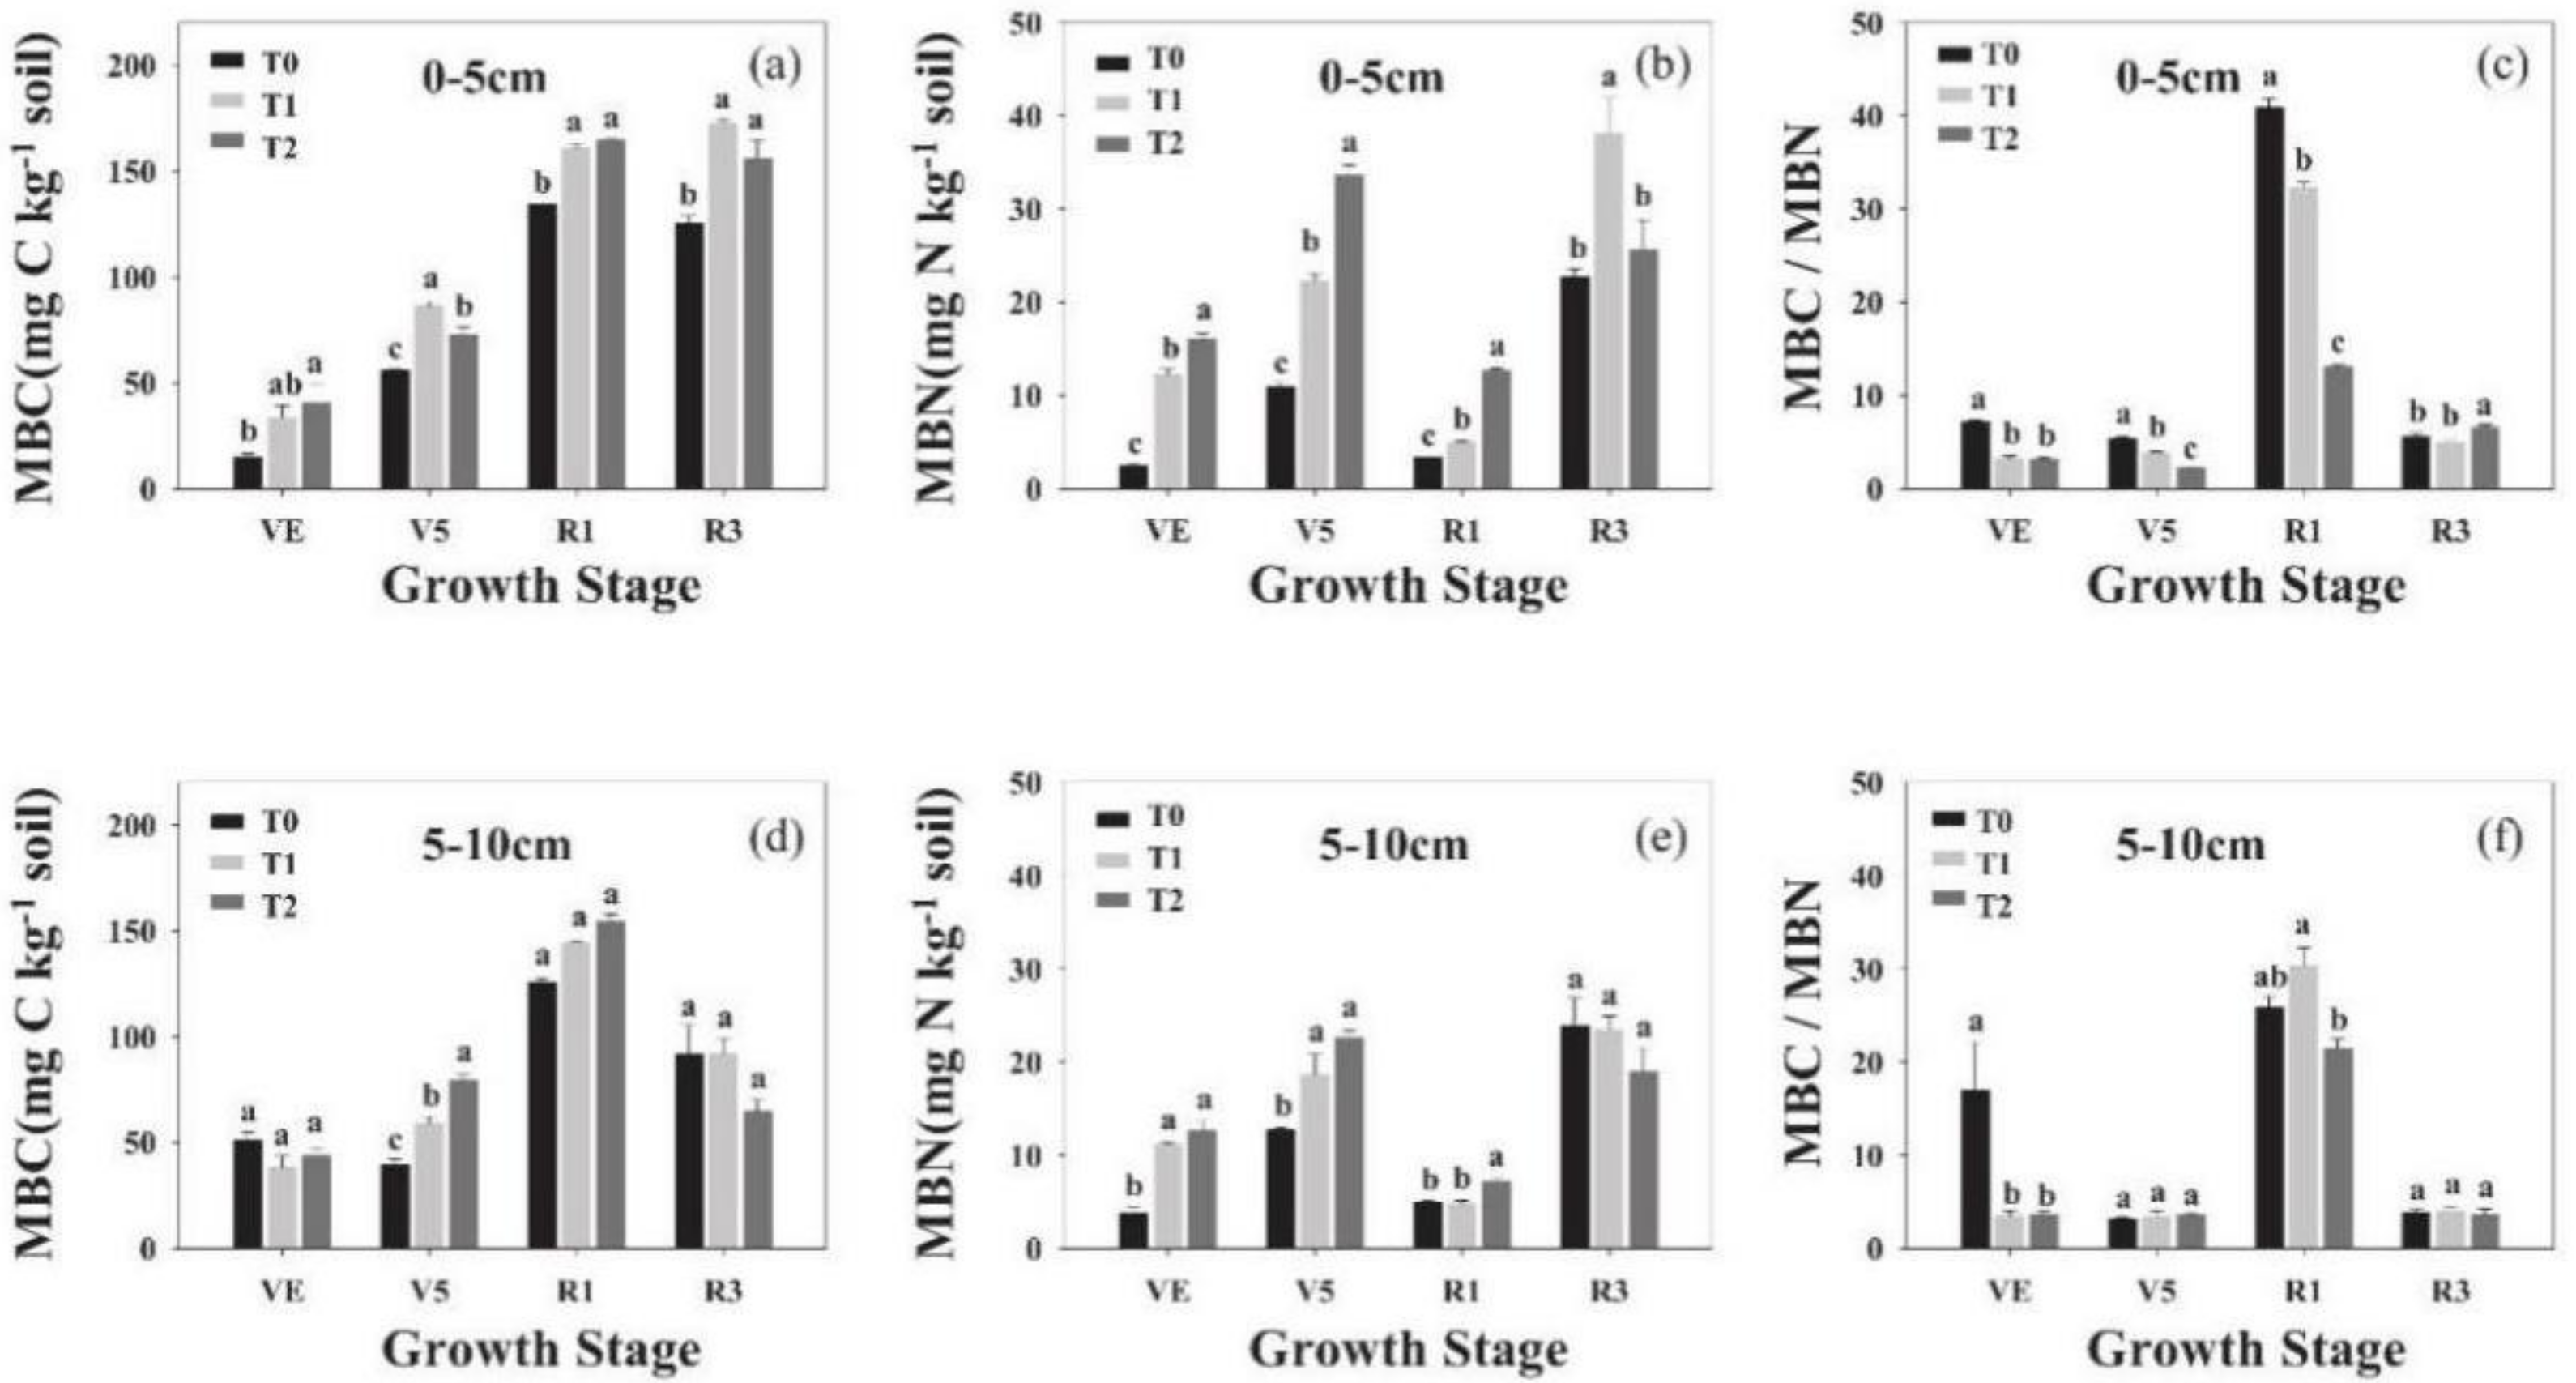
Figure 1. Soil microbial biomass carbon (MBC), soil microbial biomass nitrogen (MBN) and MBC/MBN ratio under three different residue placement treatments (T0, no residue; T1, surface; and T2, incorporated) in 0–5 cm soil layer (ac) and 5–10 cm soil layer (df) at four growth stages during maize-growing season in the pot experiment. Mean value ± standard error (n = 4) is shown. Different letters above the bars indicate statistically significant differences at p < 0.05.
Atmosphere 12 01166 g001
Figure 2. ∆MBN in the three growth periods (VE−V5, V5−R1, R1−R3) under three different residue placement treatments (T0, none; T1, surface; and T2, incorporated) in 0–5 cm (a) and 5–10 cm (b) soil layers during maize-growing season in the pot experiment. Mean value ± standard error (n = 4) is shown. Different letters above the bars indicate statistically significant differences at p < 0.05.
Atmosphere 12 01166 g002
Figure 3. Total inorganic nitrogen (TIN) under three different residue placement treatments (T0, none; T1, surface; T2, incorporated) in 0–5 cm (a) and 5–10 cm (b) soil layers at four growth stages during maize-growing season in the pot experiment. Mean value (n = 4) is shown. Different upper−case letters at the same growth stage indicate statistically significant differences in TIN content at p < 0.05 among treatments, and different lower-case letters at the same growth stage indicate statistically significant differences in NO3 content at p < 0.05 among treatments.
Atmosphere 12 01166 g003
Figure 4. Net nitrogen mineralization−immobilization (negative values indicate net immobilization while positive values indicate net mineralization) under T1 (surface residue) and T2 (incorporated residue) treatments at four maize growth stages in the pot experiment. Mean value ± standard error (n = 4) is shown. Different lower-case letters at the same growth stage indicate statistically significant differences at p < 0.05.
Atmosphere 12 01166 g004
Figure 5. (a) Total N uptake under three different residue placement treatments (T0, none; T1, surface; T2, incorporated) and (b) the regression of shoot length and N uptake at the R3 stage in the pot experiment. Mean value ± standard error (n = 4) is shown. Different lower-case letters indicate statistically significant differences at p < 0.05.
Atmosphere 12 01166 g005
Figure 6. (a) Maize residue-derived N release; therein, the grey part is residue-derived N uptake by the plants. (b) The relationships between Nresidue uptake/total N uptake and N release derived from maize residue at the end of stage in the pot experiment. Mean value (n = 4) is shown. Different upper-case letters indicate statistically significant differences at p < 0.05 in the residue-derived N release. Different lower-case letters indicate statistically significant differences at p < 0.05 in the residue-derived N uptake.
Atmosphere 12 01166 g006
Figure 7. A conceptual model of nitrogen utilization by microbes and crops at different stages of maize growth when maize residues are returned to the soil.
Atmosphere 12 01166 g007
Table 1. Selected initial properties of soil used in the pot experiment.
SOCTNpHSWCNO3NH4+MBN
g kg−1g kg−1--%mg N kg−1mg N kg−1mg N kg−1
Value11.64 (0.06)1.10 (0.02)7.01 (0.03)22.30 (0.87)13.10 (0.27)9.22 (0.09)40.86 (2.00)
Abbreviation: SOC, soil organic carbon; TN, total nitrogen; SWC, soil water content; NO3, nitrate; NH4+, ammonia; MBN, microbial biomass nitrogen. The standard errors of the measurements (n = 4) are given in parenthesis.
Publisher’s Note: MDPI stays neutral with regard to jurisdictional claims in published maps and institutional affiliations.