Article

Influence of Population Income and Climate on Air Pollution in Cities Due to Buildings: The Case of Spain

by
Fco. Javier Zarco-Soto
,
Irene M. Zarco-Soto
and
Pedro J. Zarco-Periñán
*
Departamento de Ingeniería Eléctrica, Escuela Superior de Ingeniería, Universidad de Sevilla, Camino de los Descubrimientos, s/n, 41092 Sevilla, Spain
*
Author to whom correspondence should be addressed.
Atmosphere 2021, 12(8), 1051; https://doi.org/10.3390/atmos12081051
Submission received: 23 July 2021 / Revised: 13 August 2021 / Accepted: 14 August 2021 / Published: 16 August 2021
(This article belongs to the Special Issue Impacts of Air Pollution in Spain)

Abstract

:
Half of the world’s population lives in cities. In addition, more than 40% of greenhouse gas emissions are produced in buildings in the residential and tertiary sectors. Therefore, cities, and in particular their buildings, have a great influence on these emissions. In fact, they are reflected in several of the United Nations’ Sustainable Development Goals. Any measure taken to reach these goals has a significant impact from the point of view of reducing greenhouse gases. An understanding of these goals is the basis of greenhouse gas mitigation. This work analyzed the CO2 emissions from the buildings in cities as a function of the economic income of their inhabitants. For this, databases published by official sources were used. The origins of the CO2 are usually emitted by buildings were analyzed—electrical and thermal, in the form of natural gas. Another variable that influences these emissions is climate. To study only the income variable, the influence of climate has been eliminated. Also, to facilitate analysis, an index has been introduced. As an example of application of the proposed methodology, Spanish cities with more than 50,000 inhabitants were studied. The analysis was carried out by household and by inhabitant. The results showed the following: the higher the income of the citizens, the higher the total and thermal emissions; thermal consumption is elastic, while electrical consumption is inelastic; emissions of electrical origin are almost constant; emissions from electrical energy are greater than those from thermal energy; as income increases, the ratio between emissions of electrical and thermal origin decreases.

1. Introduction

More than half of the world’s population lives in cities, and in some areas that number is even higher. This is the case of North America or Europe. In fact, the population in Europe’s cities is projected to rise to 84% by 2050 [1]. Furthermore, more than 40% of greenhouse gas (GHG) emissions correspond to buildings in the residential and tertiary sectors [2]. Hence, the importance that governments give to buildings and any measure taken on them will have an important multiplying effect. That importance is reflected in the United Nations’ Sustainable Development Goal 11. Among the objectives of this goal are the adoption of policies that mitigate climate change and reduce the environmental impact of cities. Other goals, such as 7 and 12, also refer to the use of renewable energy and sustainable and responsible consumption [3].
On a more local level, in 2008, the European Union launched the Covenant of Mayors. Later, in 2015, it changed its name to Climate and Energy. Currently, mayors of 8000 cities from 53 countries around the world participate in it. Its objectives include increasing the resilience of cities to climate change, reducing CO2 emissions, and ensuring access to sustainable and affordable energy for all [4]. Among the main GHGs, CO2 represents 80% of total emissions, making it the most worrying [5].
The importance that knowledge of emissions has acquired is reflected in the increase in studies carried out in this area. The three main areas they have focused on are: locomotion, both in the emissions produced by vehicles [6,7] and those avoided by introducing the electric vehicle [8]; industry [9]; and houses [10]. Policy guidelines have even been given for reducing emissions [11].
CO2 emissions in buildings come from energy consumption. In them, the usual energy consumption is electrical and thermal (in the form of natural gas in developed countries) [12]. Therefore, by analyzing energy consumption, CO2 emissions can be calculated. The works that studied these emissions have analyzed the relationship between different variables. One of the variables that most studies use is gross domestic product (GDP). This is one of the variables that most influences emissions [13]. The relationship between GDP, energy and emissions has been studied for some countries [14,15], reaching the conclusion that there is a bidirectional relationship between them. In addition to GDP, population is another variable that is usually analyzed due to its influence, although it is normally studied with energy consumption, the latter being the one that it most influences [16].
Considering that it is people who live in the houses, it is more appropriate to analyze their income instead of GDP. Thus, other works have studied, in certain countries, the influence that income has on emissions in general [17,18,19] or on household emissions in certain countries—Ireland [20], France and the USA [21], China [22,23], or a panel of 170 countries [24]—concluding that the higher the income, the higher the emissions. But, in any case, the existing studies have not descended to the city level. Only in [25] has a comparison of emissions been made in 10 cities based on technical and geophysical factors.
Additionally, another variable that studies agree has a marked influence is climate. It is a factor that influences energy consumption and, therefore, emissions [26,27]. Therefore, to analyze only the influence of income, it is necessary to eliminate it.
Therefore, there is a growing interest in knowing the CO2 emissions that are produced. In addition, cities are where the highest emissions are produced, and within them a very important source of production is their buildings, both in the residential and tertiary sectors. However, the work carried out has not gone down to that level of detail. They have limited themselves to analyzing the influence that different variables have on emissions or, those who have studied a specific geographic environment, have reached the country level. Therefore, the objective of this work was to present a methodology to study the emissions that occur in city buildings based on the income of their inhabitants. Furthermore, to avoid the influence that climate can have on this analysis, this influence has been eliminated. Finally, and as an application of the proposed methodology, the particular case of Spanish cities with more than 50,000 inhabitants has been analyzed. In this way, utilities will have knowledge of the cities in which, depending on the income of their inhabitants, it would be necessary to invest in renewable energy infrastructures to reduce emissions; and governments will enact laws that favor energy savings and emission reductions. Finally, all the information used in the study was obtained from databases of public organizations.
The rest of the article is organized as follows: Section 2 describes the proposed methodology that will be applied to the study area; Section 3 shows the practical application to the case of Spain; Section 4 shows the results and proceeds with its discussions; finally, Section 5 presents the conclusions.

2. Materials and Methods

The methodology used was based on those that create synthetic populations [28] and other classical ones that continue to be used [29,30,31].
In developing the methodology, the following considerations were taken into account: only data published by official organizations or companies will be used; in the buildings of a city, thermal energy (in the form of natural gas) and electricity are basically consumed; as waste, CO2 emissions are emitted that can be calculated from these consumptions; the buildings considered are those corresponding to the residential and tertiary sectors; these emissions will be distributed at the inhabitant and household level in each city to obtain the results; the net income of the population will be considered and will be distributed among all the inhabitants; the influence of climate will be eliminated to consider only that corresponding to income.

2.1. Study Area

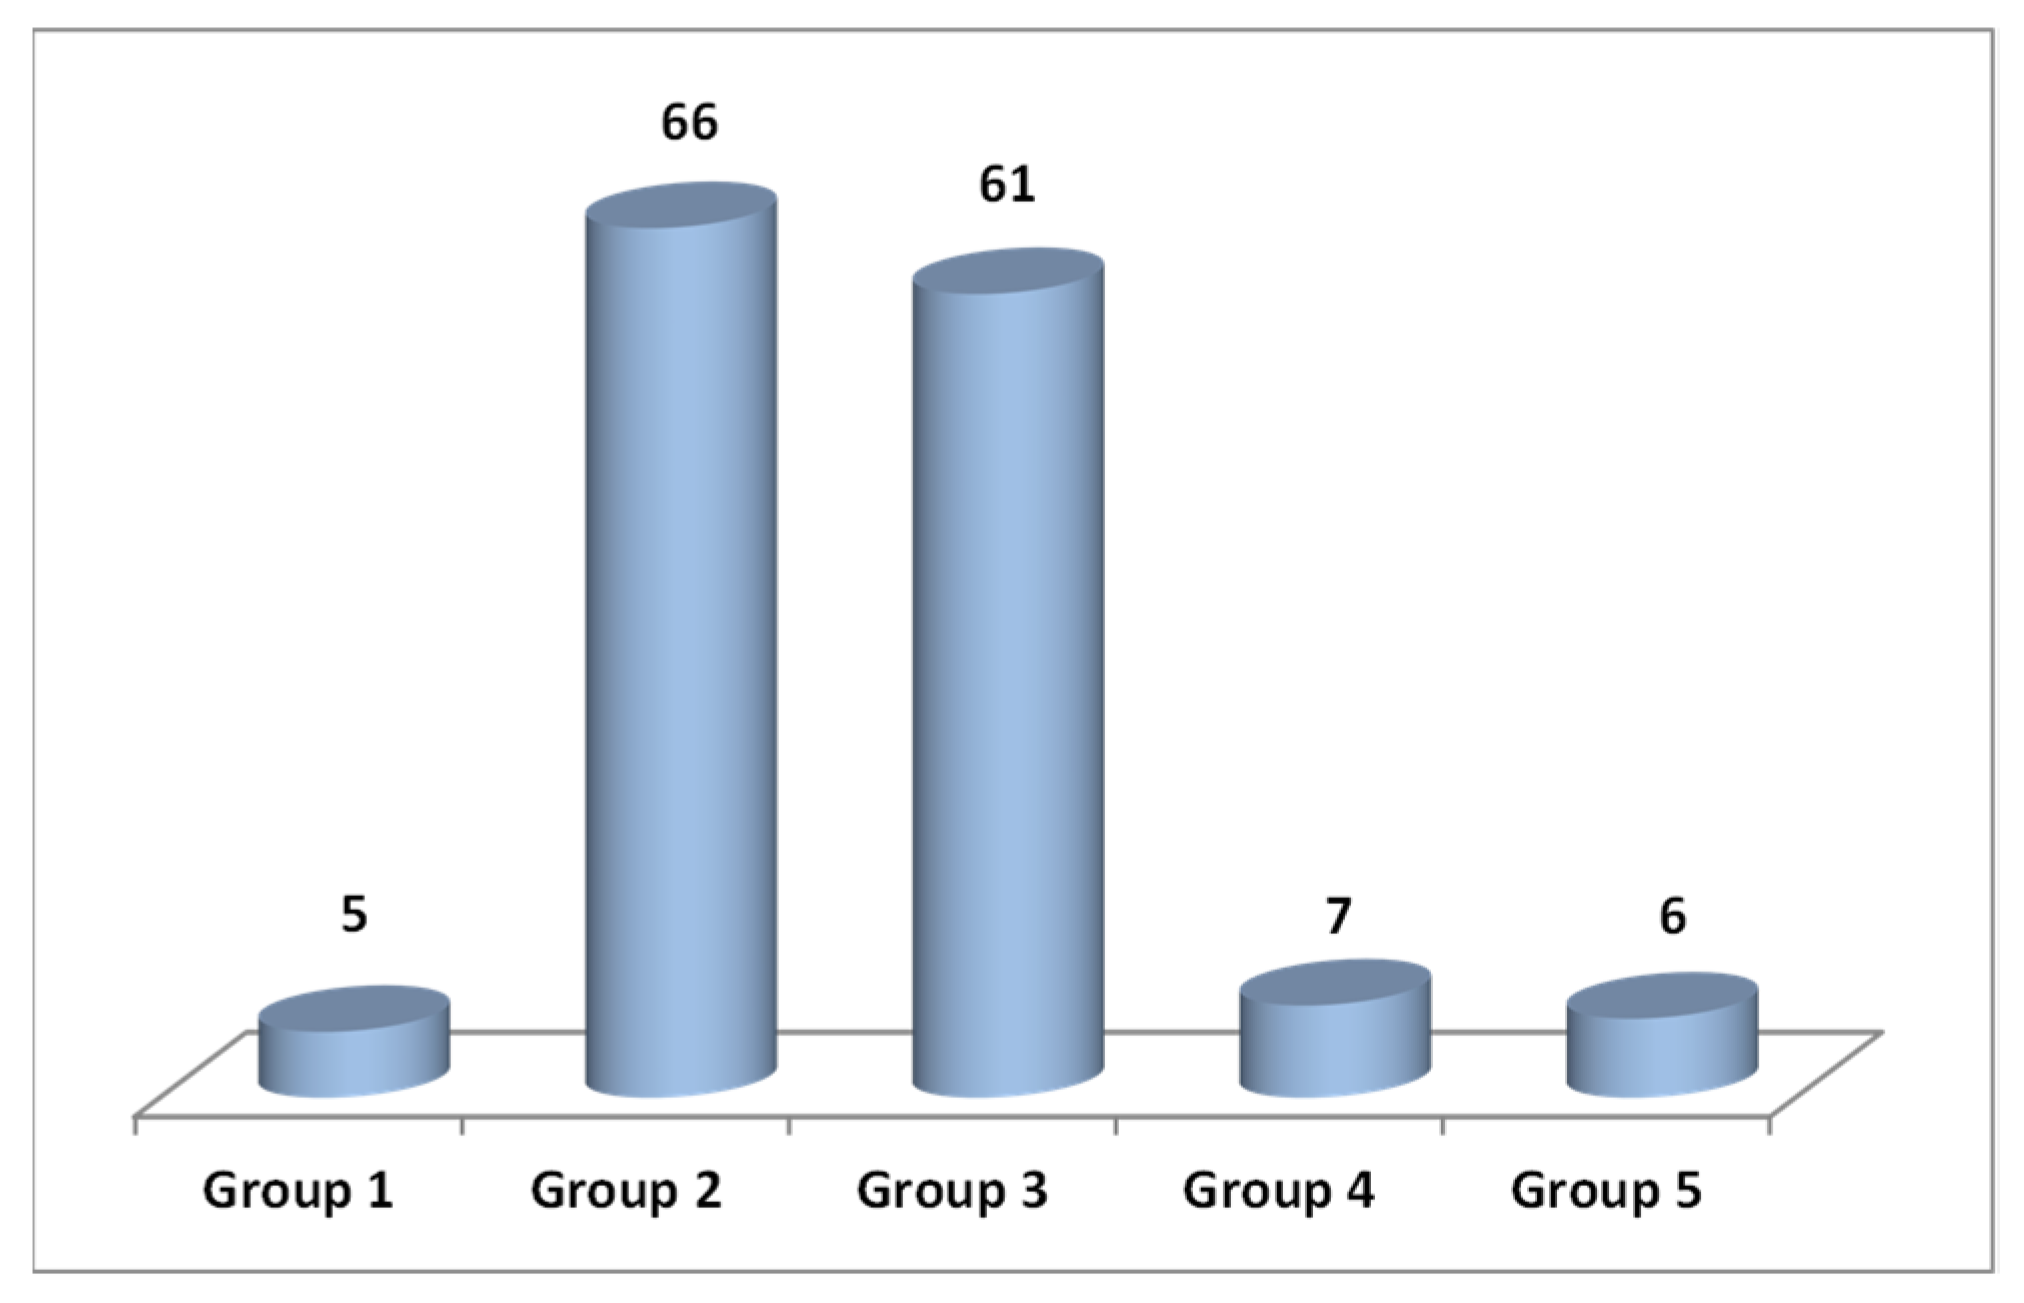
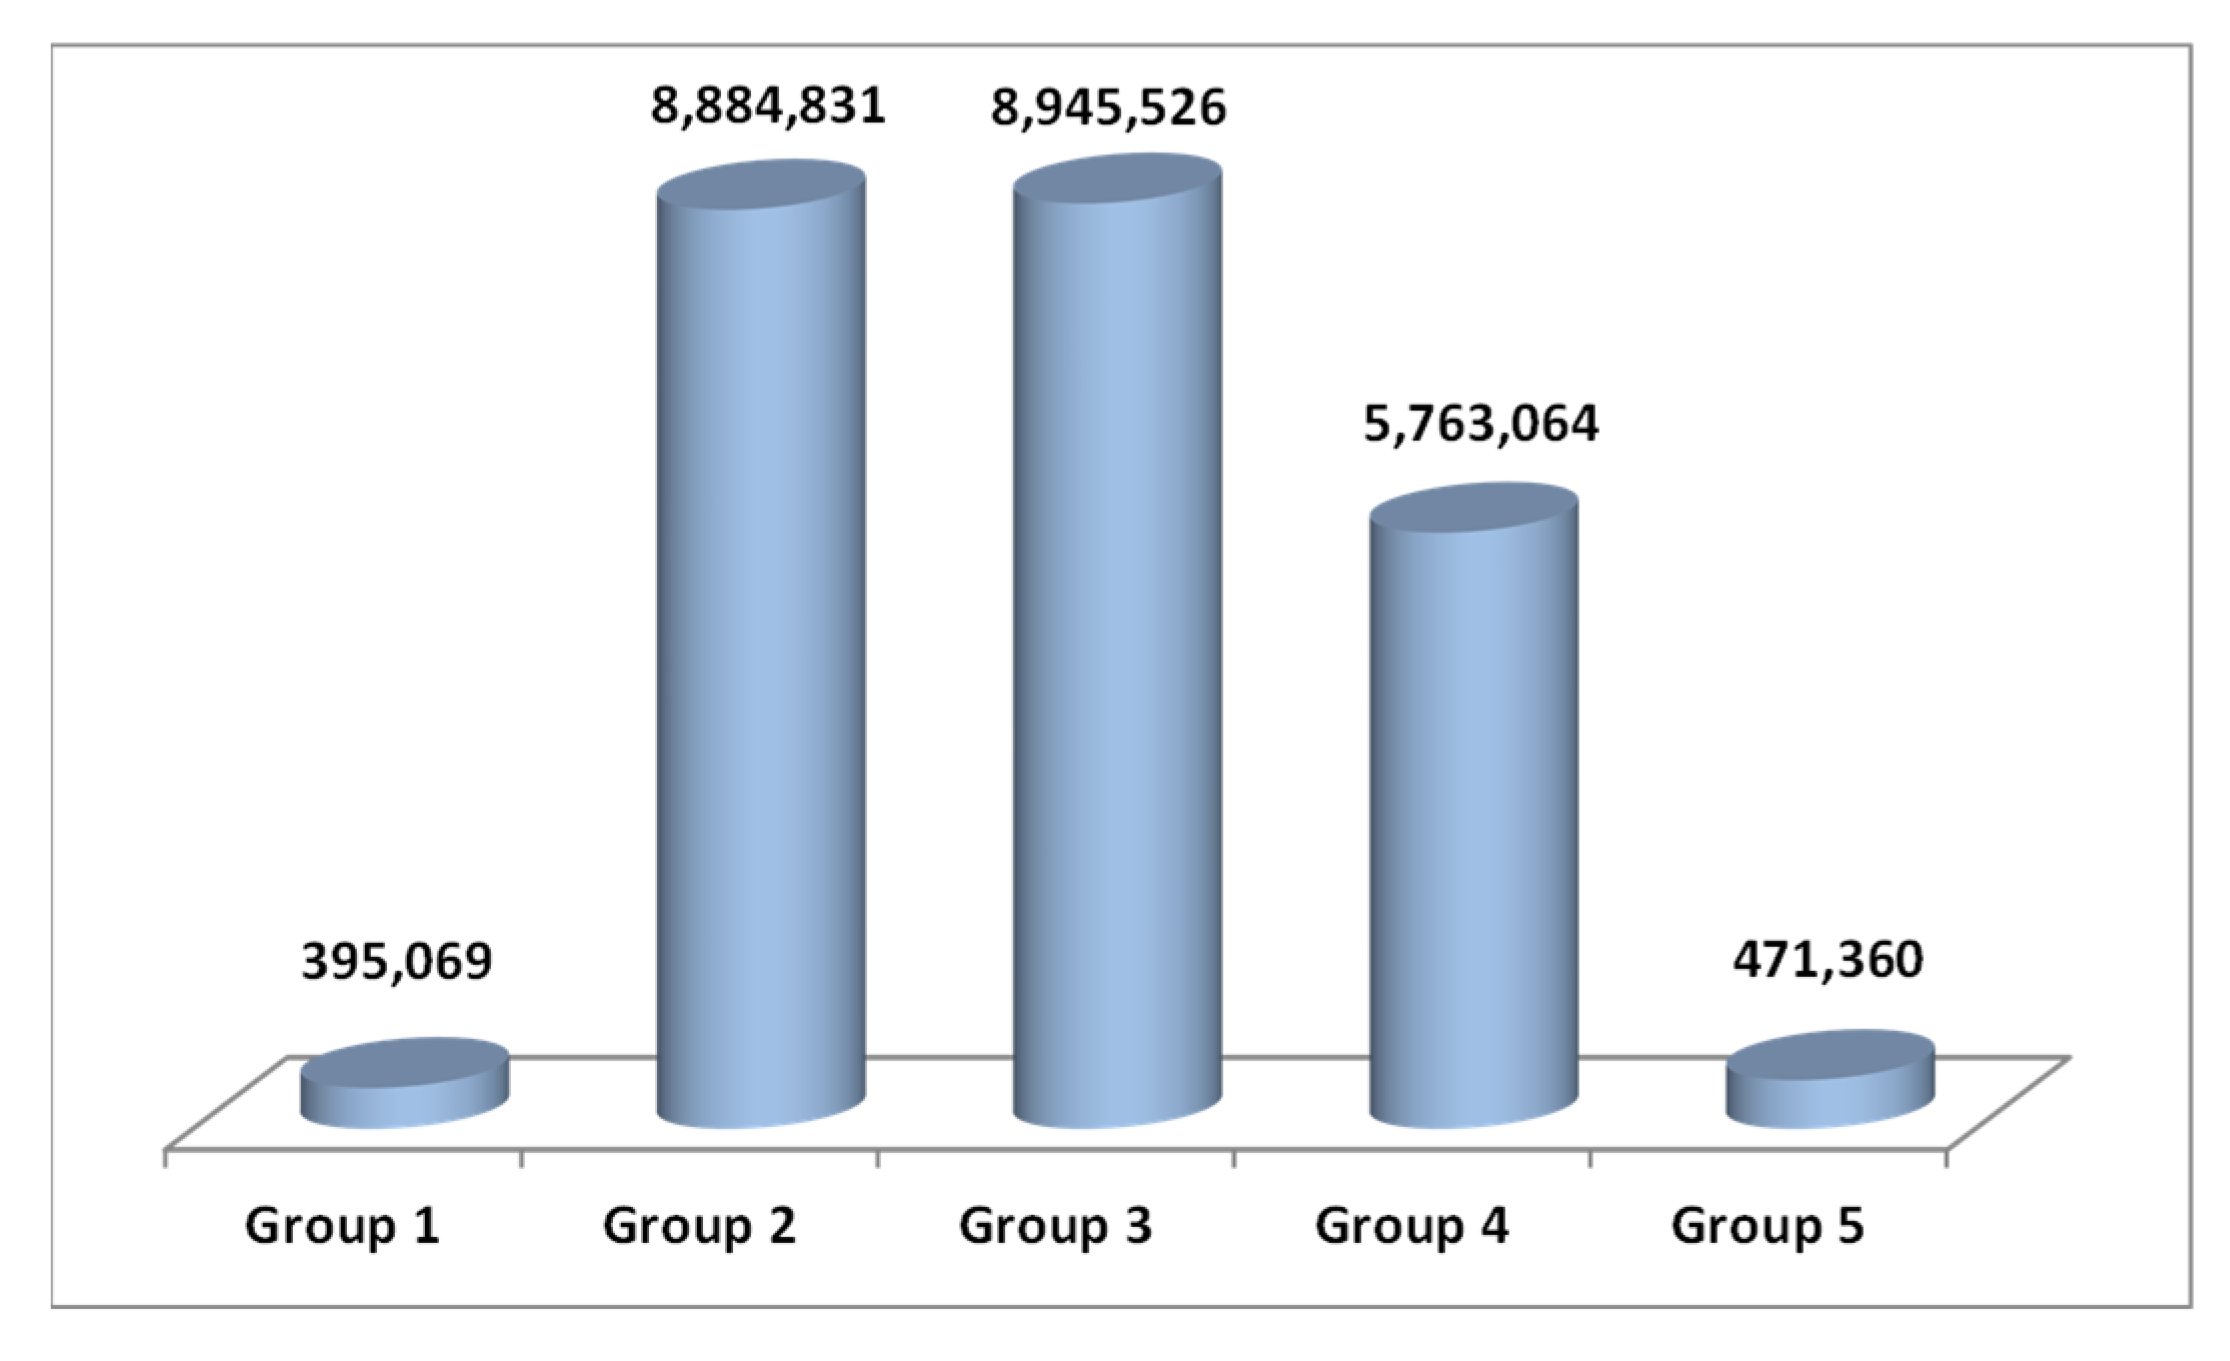
Within this methodological framework, the study area can be as large or small as desired. Within it, the cities that meet the established criteria will be selected. One criterion of interest is the number of inhabitants. According to the number of inhabitants of the city, the buildings of the tertiary sector will vary. Thus, the larger the population, the greater the number of services for those citizens and buildings where they work. Hence, the emissions produced in these buildings are also distributed among the inhabitants.
The income assigned to each city will be that corresponding to the average income of its inhabitants. A recurring parameter in all countries is the national minimum wage (NMW). The International Labor Organization defines it as “the minimum amount of remuneration that an employer is required to pay wage earners for the work performed during a given period, which cannot be reduced by collective agreement or an individual contract” [32]. This period can be set for an hour, as in the United Kingdom; for a week, as in Malta; for a month or an hour, as in France; or for a year, a month, a day, or an hour, as in Spain. By establishing certain multiples of the NMW, the cities in the study area will be grouped with that criterion.

2.2. Thermal and Electric Energy Consumption

Based on the thermal and electrical energies consumed in each city, its emissions will be known. As the emissions depend on the type of energy consumed, it is necessary to calculate these consumptions separately. The published information appears grouped, so prior work is necessary to disaggregate the data.
Natural gas consumption points with a pressure equal to or less than 4 bar are considered for thermal consumption. They are those corresponding to homes, public administrations, and stores.
The electricity consumption data used are those corresponding to the activities of the sectors considered. These activities are broken down according to the classification of the Statistical Classification of Economic Activities in the European Community, commonly referred to as NACE (for the French term “nomenclature statistique des activités économiques dans la Communauté européenne”) [33]. The items used are: 36 to 39, 53, 60, 61, 72, 84 to 88 (exc. 85.5 and 85.6), 91, 99, 45 to 47, 58.2, 59, 62 to 71, 73 to 75, 77 to 82, 85.5, 85.6, 90, and 92 to 98.
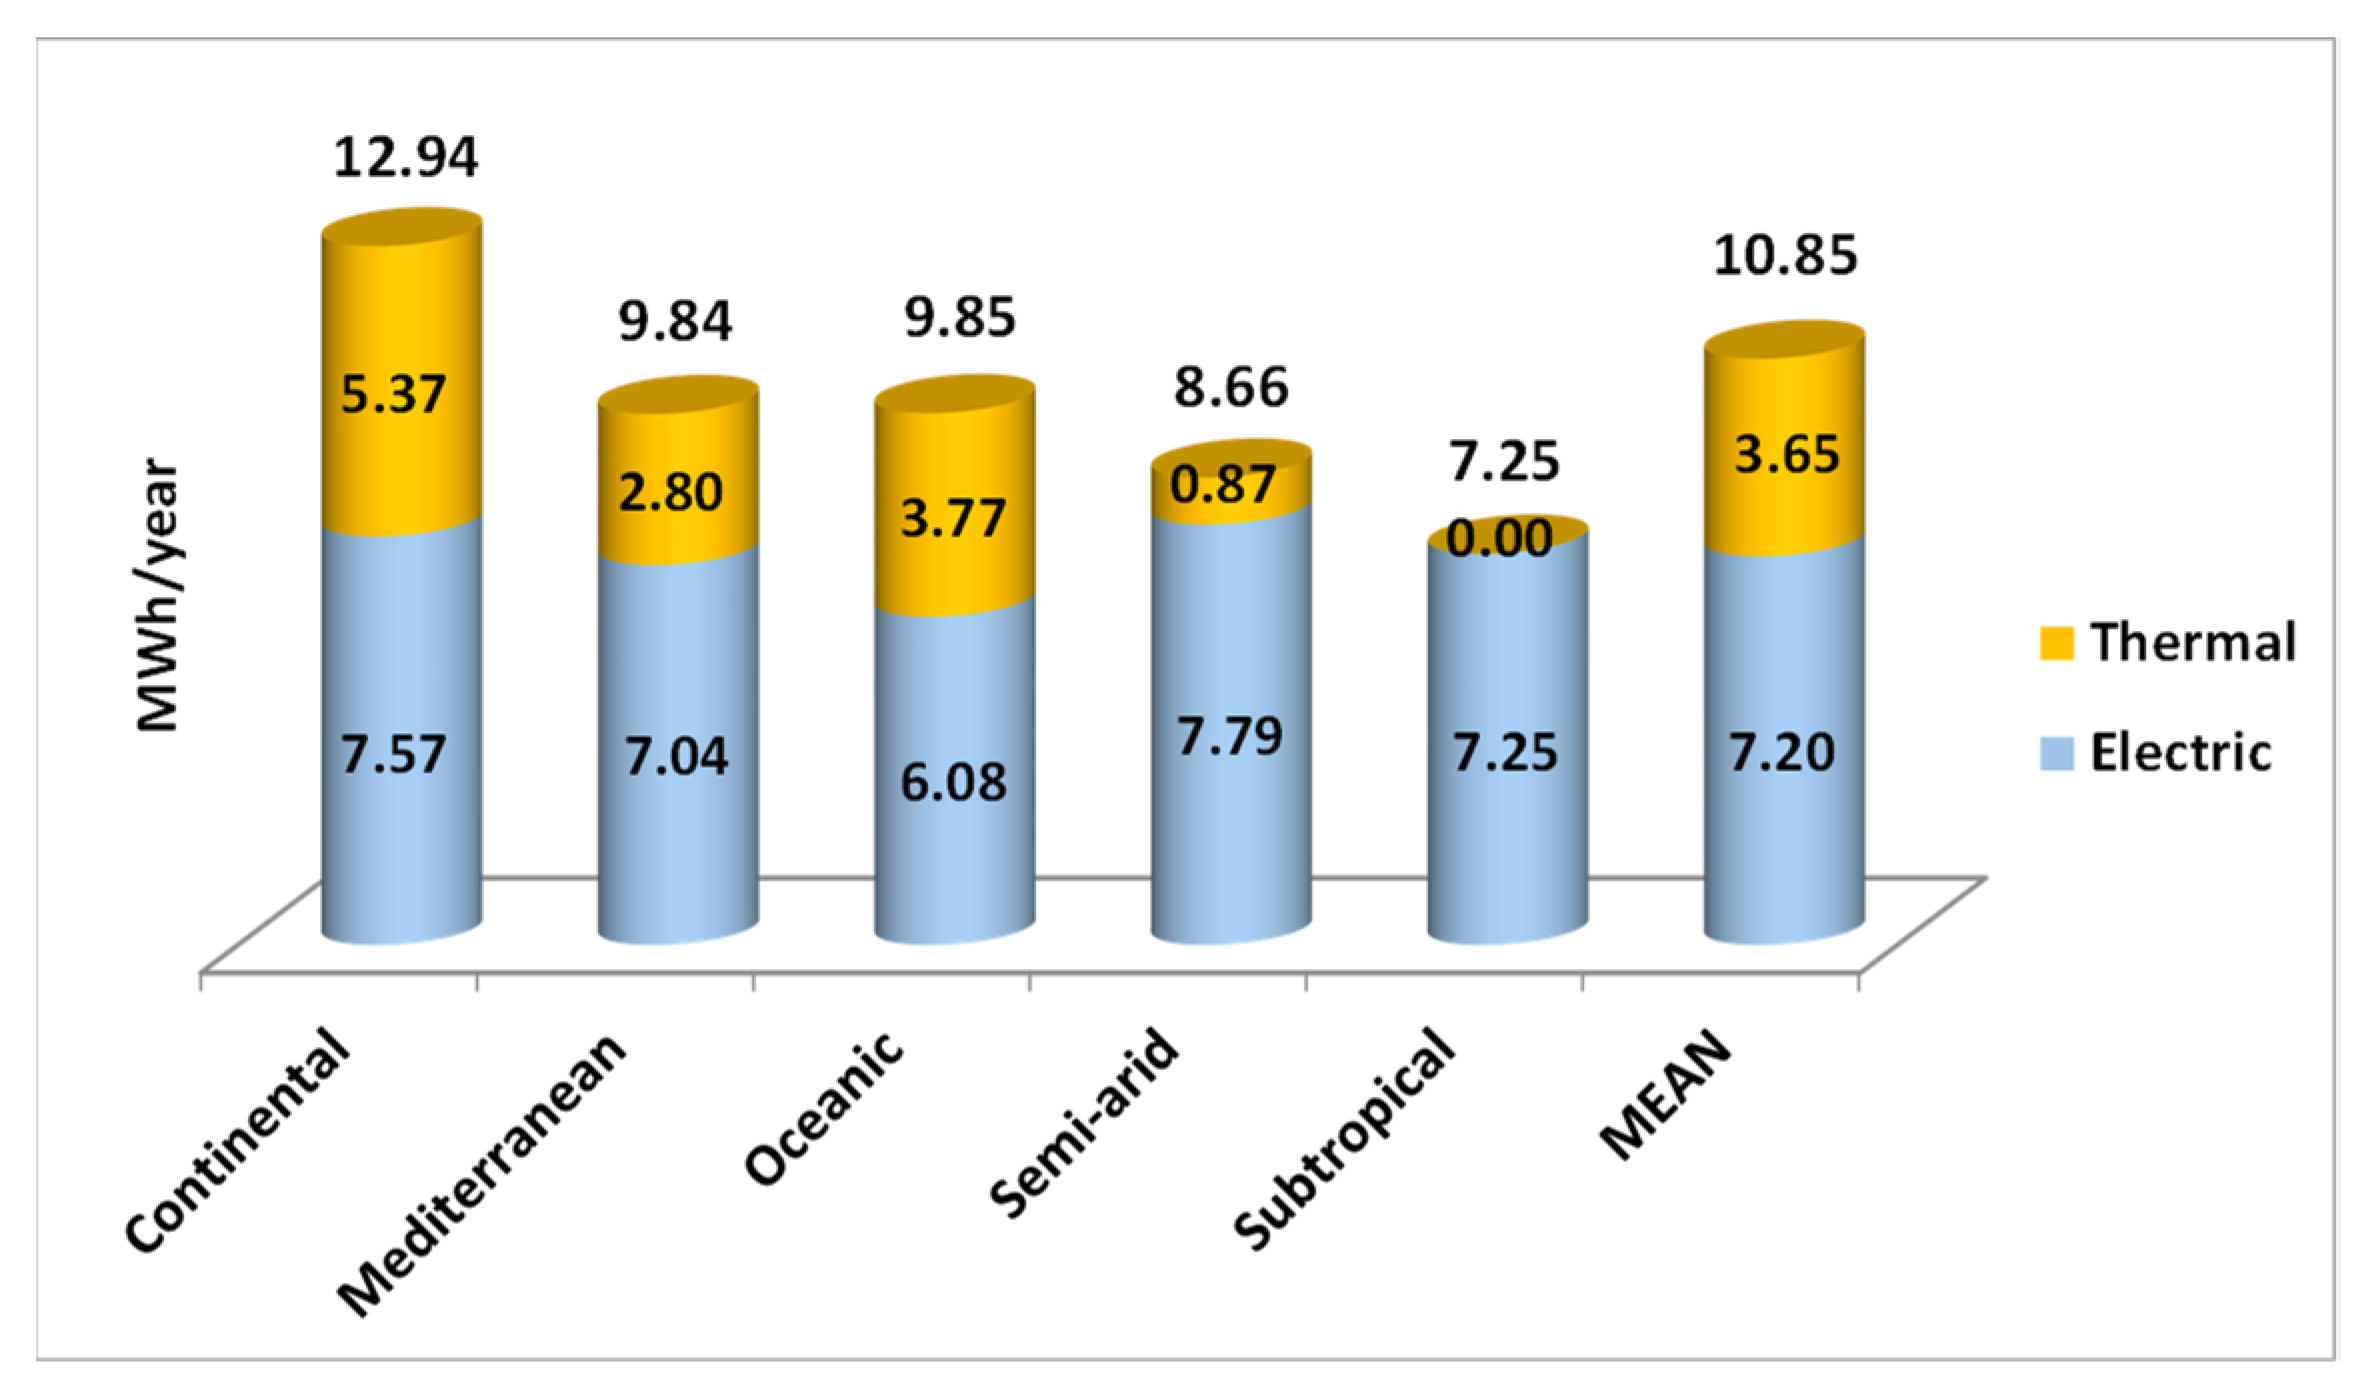
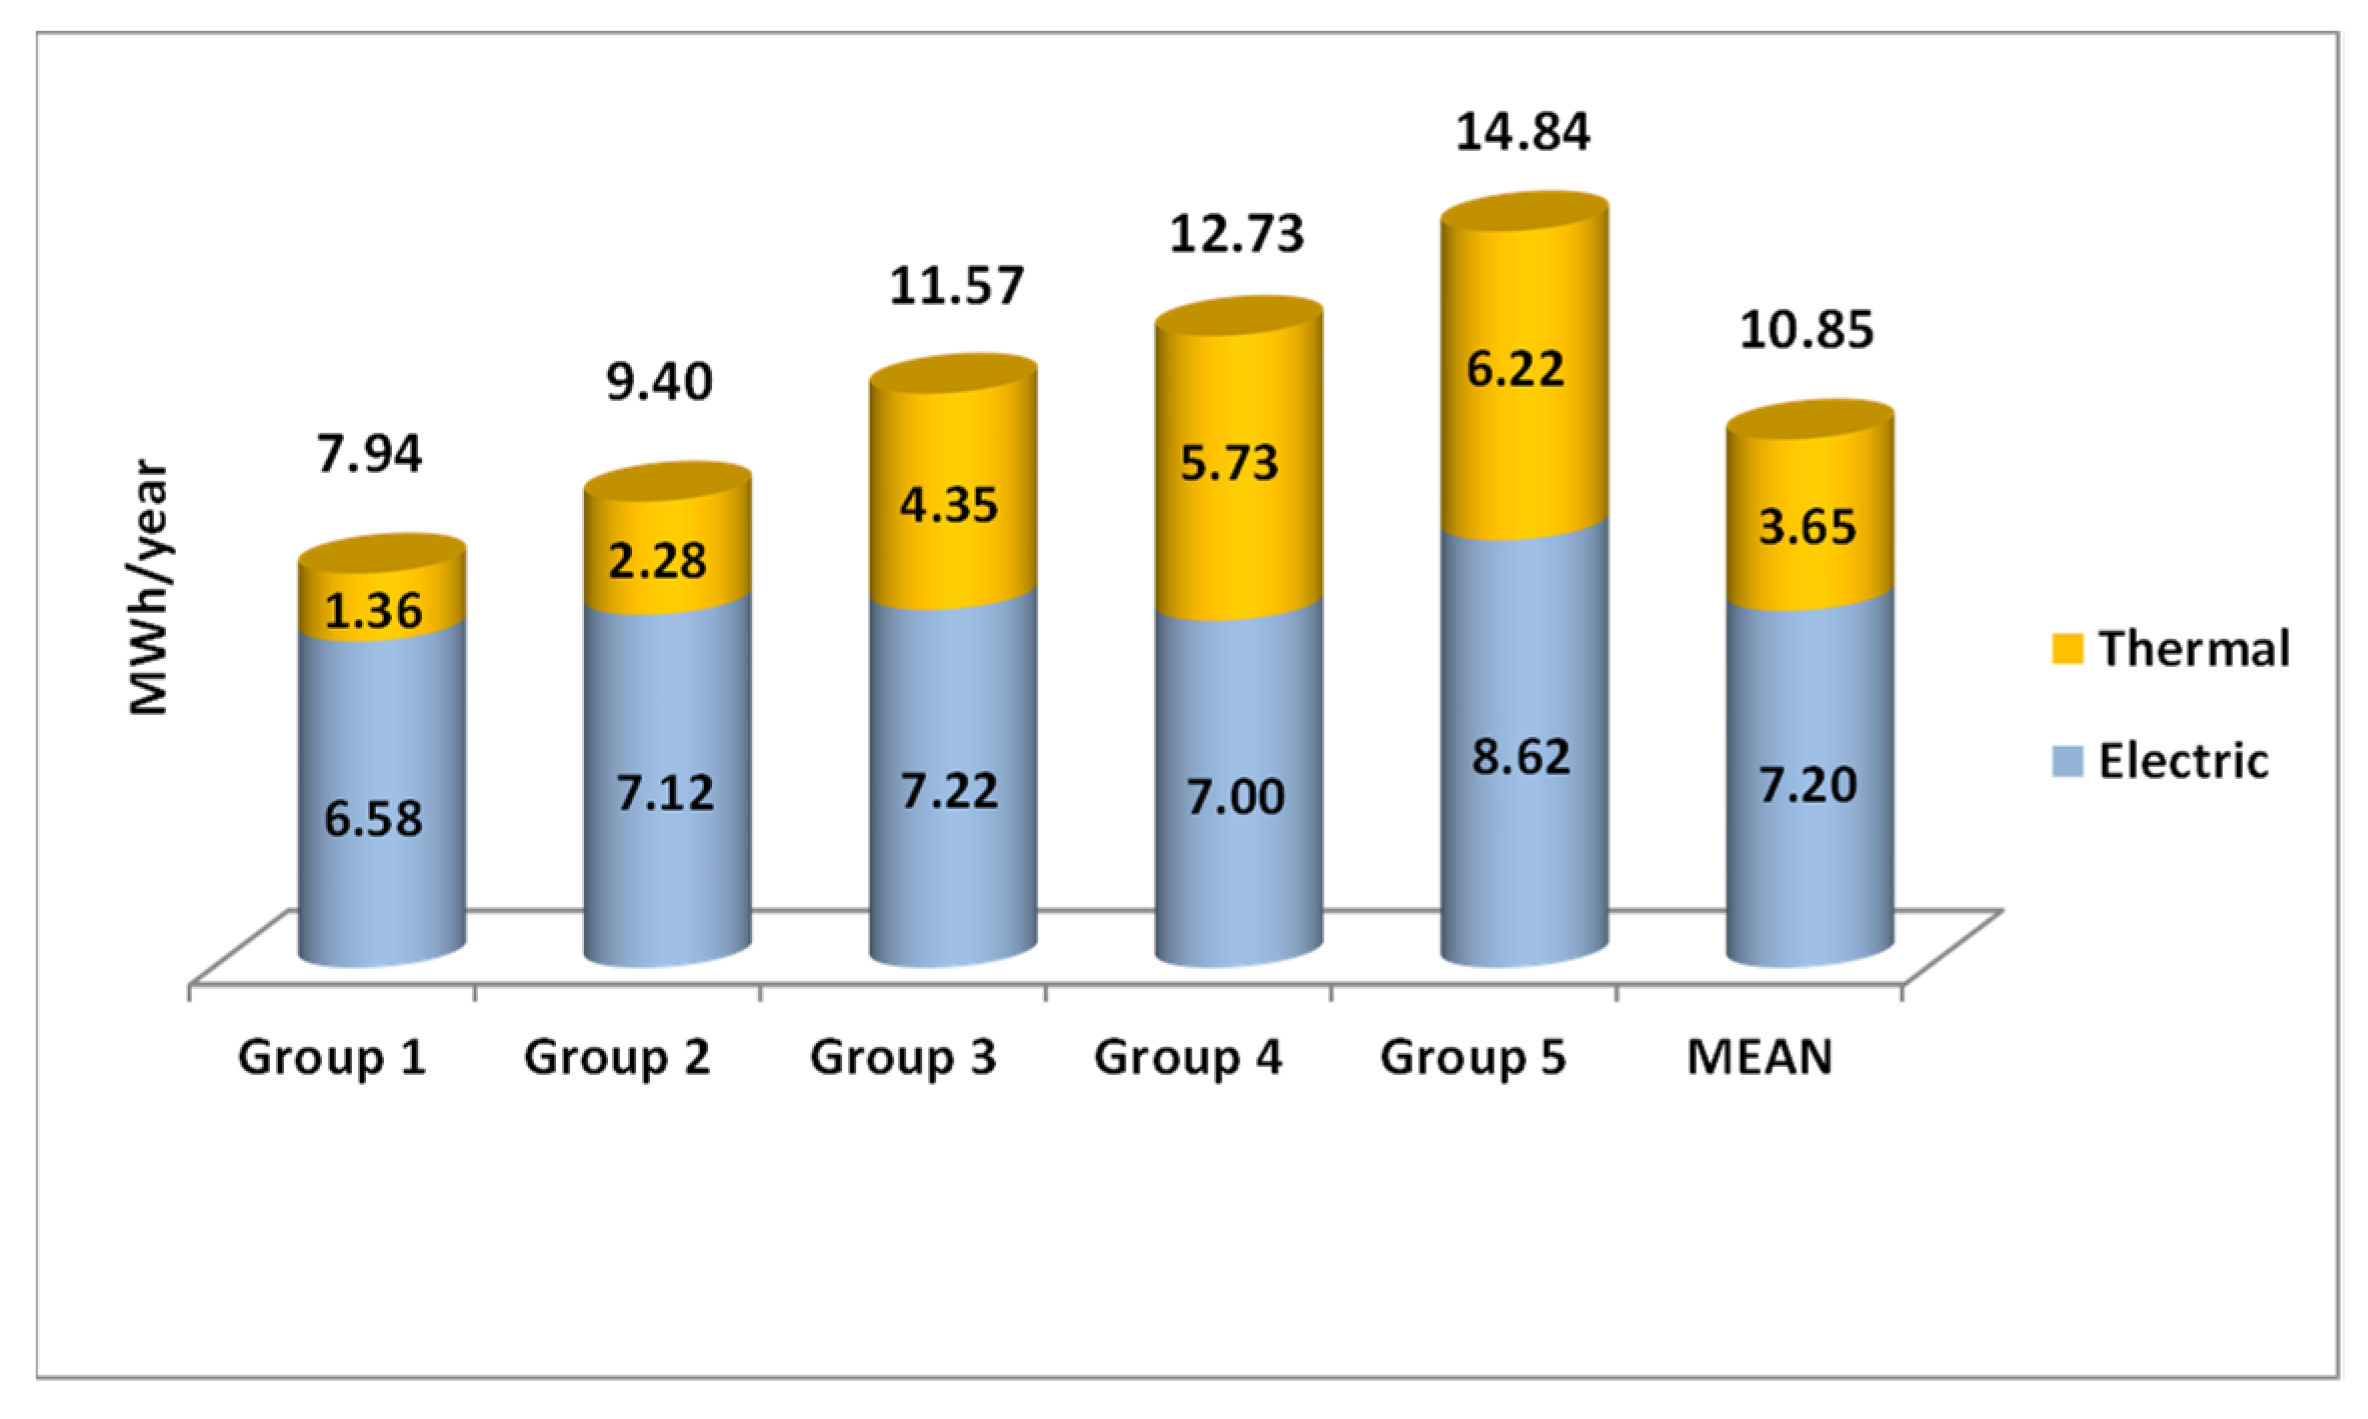
2.3. CO2 Emissions

CO2 emissions are different depending on the type of energy consumed, be it thermal or electrical. In addition, that corresponding to electrical energy will be defined by the generation mix.
The main statistical data of CO2 emissions for each group of cities are presented:
Number   of   cities :   n i = j 1
Mean :   E ¯ i = j E i j n i
Standard   deviation :   s i = i j ( E i j E ¯ i ) 2 ( n i 1 )
Median :   M e d i a n i = [ n i + 1 2 ] t h   term   if   the   total   number   of   the   elements   is   an   odd   number ,   otherwise   M e d i a n i = ( n i 2 ) t h   term   + ( n i 2 + 1 ) t h   term 2
Maximum :   E i   m a x = max ( E i j )
Minimum :   E i   m i n = min ( E i j )
where ni is the number of cities that belong to group i; E ¯ i is the mean CO2 emissions in group i; Eij is the CO2 emissions of city j, which is located in group i; si is the standard deviation of the CO2 emissions in the cities of group i; the CO2 emissions will be thermal, electric, or total depending on the case study; and cities’ consumptions should be listed in ascending order to calculate the median.
Furthermore, to more easily analyze the influence of income on emissions, an index similar to the one used in [34] has been introduced. The emissions variation index (EVI) has been defined as follows:
E V I i = E ¯ i / E ¯
where E V I i is the index of the emissions of the group of cities belonging to group i, E ¯ i is the mean value of the emissions of the cities of group i, and E ¯ is the mean of the emissions of all the cities of all the groups. In this way, the groups with the highest emissions can be easily identified.

3. Practical Application

This section presents the practical application of the proposed methodology to the case of Spain. The data used for the study were those corresponding to 2016.

3.1. Study Area

Spanish cities with more than 50,000 inhabitants were considered as study areas. There were a total of 145, with 24.5 million people live in them, which represents more than 50% of the inhabitants of Spain [35]. The grouping of cities was based on the annual NMW net, which in Spain is €7429.97 [36]. The five groups identified in Table 1 have been established. Group 1 corresponded to cities with an average net income of their inhabitants less than the NMW; in Group 2 were the cities with values between 1 and 1.5 times the NMW; in Group 3 were those that are between 1.5 and 2 times NMW; those of Group 4 were those between 2 and 2.5 times the NMW; and the inhabitants of Group 5 had an average net income higher than 2.5 times the NMW.
The classification of cities according to this grouping is presented in Table 2. The cities are presented in alphabetical order within each group.

3.2. Thermal and Electric Energy Consumption

The origins of the data used in the study were as follows: Spanish National Statistics Institute [37], National Commission on Markets and Competition [38] (they are both dependent on the Ministry of Economic Affairs and Digital Transformation); and the Secretary of State for Energy [39], which depends on the Ministry for Ecological Transition and Demographic Challenge.
Per capita data on energy consumption were obtained for each of the established income groups. Furthermore, the influence of climate needed to be removed so that the influence of income only could be appreciated.

3.3. CO2 Emissions

In 2010, the European Union established the requirements for energy performance of buildings through Directive 2010/31/UE of the European Parliament and the Council of 19 May 2010. To apply this regulation, the Spanish government set CO2 emission factors. For electricity points of consumption, considering all types of generators and sources, this was 0.291 tCO2/MWh; for natural gas, this was 0.252 tCO2/MWh [40].

4. Results and Discussion

4.1. Study Area

The geographical area considered in the study was the whole of Spain. In particular, cities with more than 50,000 inhabitants, with a total of 145 cities meeting this criteria. The scope was the buildings of the residential and tertiary sectors. The cities have been classified based on the criteria of the net income of their inhabitants. According to the criteria established in Table 1, five groups were created. Table 2 shows the cities that were included in each of the groups. The energy consumptions considered were those usually used in buildings—electrical and thermal (in the form of natural gas).
Figure 1 shows the number of cities in each of the groups. There was a very marked difference between Groups 2 and 3 and the rest. Group 2 was the one with the highest number of cities, although it was closely followed by Group 3. These two groups were the ones with incomes between one and two times the NMW. The number of cities in the rest of the groups were almost identical, with Group 1 being the one with the fewest cities.
In regards to the number of inhabitants in each group, Groups 2 and 3 had almost identical numbers. Next, there was Group 3, despite being made up of only seven cities. This group was the one with an income between 1.5 and 2 times the NMW. Finally, there were Groups 5 and 1 respectively, although with similar populations (Figure 2).

4.2. Thermal and Electric Energy Consumption

4.2.1. Climate Effect

Climate is a variable that greatly affects energy consumption. This influence has been examined for Spanish cities with more than 50,000 inhabitants [34]. In the present study, to analyze the influence of income without being affected by climate, this influence was eliminated. To do this, each of the 145 cities needed to be located on the climate map of Spain. In this way, the climate of each one was identified. Once identified, and based on the energy consumption by climate in Figure 3, the influence of the climate could be eliminated and the consumption evaluated according to income. For this, a correction factor needed to be applied to the consumption of each city [30]:
K c i = E ¯ c / E ¯ c i
where E ¯ c i   is the mean energy consumed in the climate zone i; E ¯ c   is the mean energy consumed in all cities studied; and K c i is the correction factor. This factor will be different for each climate. Consumption in cities with the same climate will be affected by the same correction factor.

4.2.2. Energy Consumption per Household

Figure 4 shows the consumption of thermal and electrical origins per household for each group, in MWh/year, once the influence of the climate was eliminated. In addition, it presents the average consumption of all groups. Total consumption increased as income increased. Groups 1 and 2, with incomes below 1.5 NMW, were the only ones that did not exceed the mean value. While Group 5 exceeded the average consumption by more than 35%, Group 1 did not even reach 75% of that mean.

4.2.3. Energy Consumption per Inhabitant

Figure 5 presents the consumption of thermal and electrical origins per inhabitant of each group, once the influence of the climate was eliminated. Total consumption increased as income increased, although there was a decrease of 1% between Groups 4 and 5. Behaviors were similar to those presented by household, with Groups 1 and 2 being the only ones that were below the mean. In this case, the extreme values were somewhat less pronounced. Thus, the group with the lowest consumption was 25% below the mean, while the group with the highest was 20% above.

4.3. CO2 Emissions

CO2 emissions can be calculated from energy consumption. For this, the emission factors indicated in Section 3.3 were used—0.291 tCO2/MWh for electricity and 0.252 tCO2/MWh for natural gas.

4.3.1. CO2 Emissions per Household

The main statistical parameters of total, thermal, and electrical emissions per household are presented in Table 3, Table 4 and Table 5, respectively. The values are expressed in tCO2/year. Figure 6 shows the total emissions of thermal and electrical origins in tCO2/year. Likewise, Figure 7 presents the variation of the index defined in Equation (7).
Total emissions increased as NMW increased. Except for cities with income below 1.5 NMW, the others produced emissions above the mean. The cities with the most emissions, those with incomes above 2.5 NMW, produced emissions 35% above the mean. At the other extreme were cities with incomes below 1 NMW. In them, the emissions were 25% lower than the mean.
Something similar happened with thermal emissions, although in a more marked way. Thus, the higher the income, the higher the emissions. In this case, the group with the highest emissions was 70% higher than the mean, and the one with the least was 60% lower. In other words, there was more than a 100% increase in emissions between the extremes. Therefore, thermal emissions show a markedly elastic behavior. In addition, the fact is repeated that only the groups of cities with incomes below 1.5 NMW were below the mean. In the case of thermal emissions, it should be noted that the minimum value in Groups 1 and 2 was 0. Furthermore, it must be remembered that in the case of developed countries, the main consumption of thermal origin is due to its use as heating. Cities located in a subtropical climate zone do not use this type of energy. As all the cities located in this climatic area belong to these groups, the consumptions were 0 and therefore so were their emissions. That is why the minimum value of both groups was 0.
In regards to emissions of electrical origin, the situation was completely different. The cities with incomes between 1 and 2.5 NMW (cities of Groups 2, 3, and 4), barely had a variation of 3%. However, those with the highest incomes produced emissions 20% higher than the mean, and those with the lowest, 8%. Therefore, emissions of electricity origin varied little according to income, except in cities where these were extreme, presenting an inelastic character.
Another important fact that emerged was that electrical emissions were higher than thermal ones. In addition, the proportion of these emissions of electrical origin decreased as income increased. Thus, they varied between 85% in cities with lower incomes, up to 61% in those with incomes above 2.5 NMW.
Therefore, the higher the income, the higher the total and thermal emissions; regarding emissions of electrical origin, these were very similar, except in cities with higher incomes, which were much higher; emissions of electrical origin were higher than those of thermal origin; and the proportion between electrical and thermal emissions in each of the groups decreased as income increased.

4.3.2. CO2 Emissions per Inhabitant

To make an analysis like this, carried out by household, the main statistical parameters of total emissions of thermal and electrical origin per household are presented in Table 6, Table 7 and Table 8, respectively. The values are expressed in tCO2/year. The total emissions, of thermal and electrical origin, in tCO2/year, are shown in Figure 8. Furthermore, the variation of the index defined in Equation (7) is presented in Figure 9.
The higher the NMW, the higher the total emissions, except for incomes greater than 2 NMW, in which case there was a decrease of less than 1%. As was the case in the analysis by household, only the group of cities with incomes below 1.5 NMW were below the total mean emissions. Furthermore, in this case, the extreme variations were lower than those found at the household level. Both the emissions of the group with the highest emissions and the one with the lowest emissions were within 20% of the mean value.
The behavior of emissions of thermal origin was like that described for total emissions. However, everything was more marked. Thus, between the two groups of cities with the highest income, the decrease reached 8% and the difference between the group of cities with the lowest and highest emissions reached almost 150% (this referred to average emissions). Furthermore, only city groups with incomes below 1.5 NMW had lower-than-average emissions. The minimum values of Groups 1 and 2 had a value of 0 in cities located in a subtropical climate zones, where they hardly use heating. In them, due to their little use, the heating has an electrical origin through a heat pump.
In regards to emissions of electrical origin, except for cities with incomes below the NMW, the oscillation between the rest of the groups was barely 5%. In the case of the group of cities with the lowest incomes, emissions were 7% lower than the mean.
As was the case with emissions per household, emissions of electrical origin were the highest in each group. Their percentage in each group ranged from 85% in the lowest income group to 61% in the highest income group. In other words, the higher the income, the lower the relative percentage of electricity emissions with respect to the total.
In summary: the higher the income, the higher the total and thermal emissions, showing an elastic character; electrical emissions were almost constant in all groups, evidencing an inelastic character; emissions of electrical origin were greater than those of thermal origin; and the proportion of emissions of electrical origin in each group decreased as income rose.

5. Conclusions

More than half of the world’s population lives in cities and more than 40% of GHG emissions correspond to buildings in the residential and tertiary sectors. Against this background, governments and local administrations have become aware of the importance of cities and, in particular, of their buildings. Hence, this is reflected in the Sustainable Development Goals and committees have been created that bring together responsible city administrations. Furthermore, CO2 represents 80% of total GHG emissions.
For this reason, this paper analyzed the influence that the level of net income of the inhabitants has on the CO2 emissions of the buildings of the cities. The two usual forms of origin of emissions in a building have been considered—electrical and thermal, in the form of natural gas. In addition, to consider only the influence of income, the influence that climate causes on emissions was eliminated. To achieve this, it was necessary to relate each city to the climate that corresponds to it according to its location.
A methodology to calculate the emissions has been presented. It has been analyzed by household and by inhabitant. The methodology has been based on the use of data provided by public organizations. To carry out this analysis, the cities have been grouped. As a practical application, the proposed method has been applied to the case of Spanish cities with more than 50,000 inhabitants. Additionally, an index has been introduced to facilitate analysis.
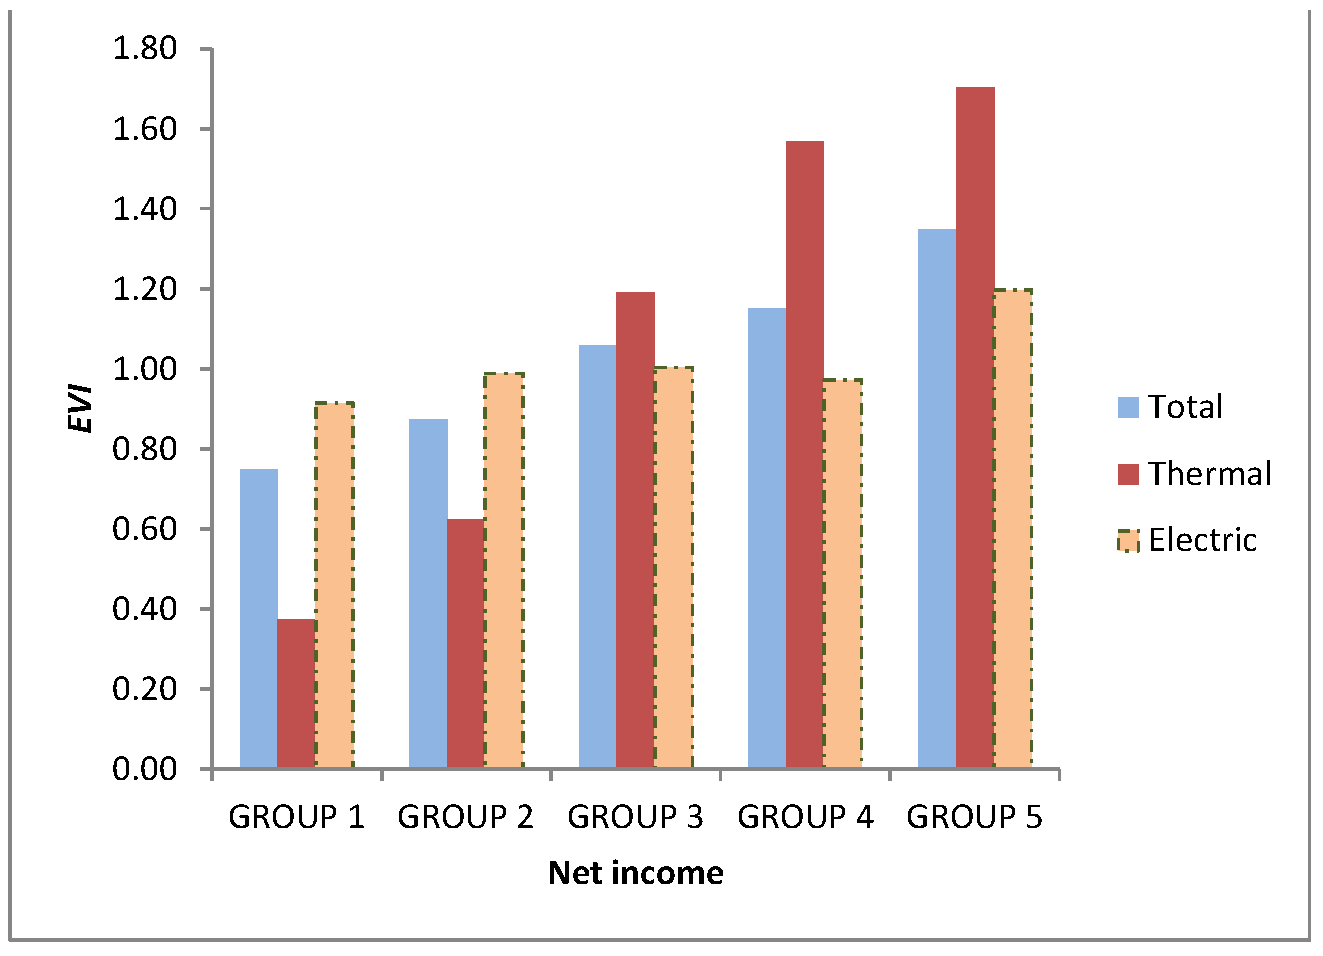
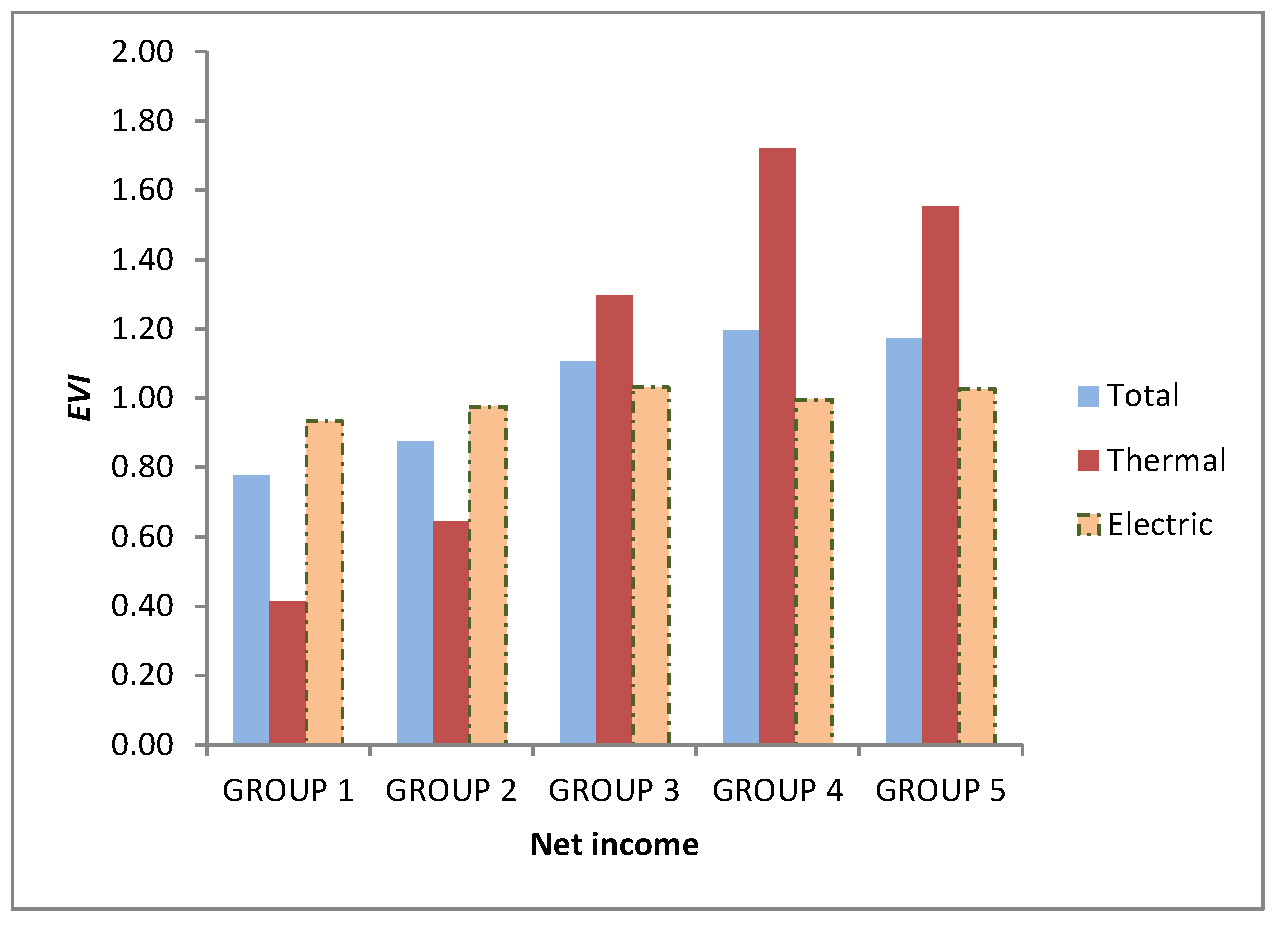
The results obtained showed the following conclusions: the higher the income, the higher the total and thermal emissions; electricity emissions barely vary and when they do, it is only in cities with the lowest and highest incomes; thermal consumption is elastic, while electrical consumption is inelastic; emissions of electrical origin are greater than those of thermal origin; and the proportion of emissions of electrical origin in each group decreases as income increases.
The results obtained will allow the authorities to take the appropriate measures to mitigate the impact of GHG emissions in each city and the utilities to plan their infrastructures to reduce emissions through renewable energy sources.

Author Contributions

Conceptualization, F.J.Z.-S., I.M.Z.-S. and P.J.Z.-P.; methodology, F.J.Z.-S. and I.M.Z.-S.; validation, F.J.Z.-S., I.M.Z.-S. and P.J.Z.-P.; formal analysis, I.M.Z.-S., F.J.Z.-S. and P.J.Z.-P.; investigation, F.J.Z.-S. and I.M.Z.-S.; data curation, F.J.Z.-S. and I.M.Z.-S.; writing—original draft preparation, F.J.Z.-S.; writing—review and editing, F.J.Z.-S., I.M.Z.-S. and P.J.Z.-P.; visualization, F.J.Z.-S. and I.M.Z.-S.; supervision, P.J.Z.-P.; project administration, P.J.Z.-P.; funding acquisition, P.J.Z.-P. All authors have read and agreed to the published version of the manuscript.

Funding

This research received no external funding.

Informed Consent Statement

Not applicable.

Data Availability Statement

Not applicable.

Acknowledgments

The authors would like to thank eCitySevilla project for providing facilities to conduct the research.

Conflicts of Interest

The authors declare no conflict of interest.

References

  1. Department of Economic and Social Affairs. United Nations. 2014 Demographic Yearbook, 64th ed.; United Nations: New York, NY, USA, 2015. [Google Scholar]
  2. International Energy Agency and the United Nations Environment Programme. 2018 Global Status Report: Towards a Zero-Emission, Efficient and Resilient Buildings and Construction Sector. Available online: https://wedocs.unep.org/handle/20.500.11822/27140 (accessed on 15 August 2020).
  3. Department of Economic and Social Affairs. Report of the Inter-Agency and Expert Group on Sustainable—Development Goals Indicators (E/CN.3/2016/2/Rev.1); United Nations: New York, NY, USA, 2016. [Google Scholar]
  4. Energy-Cities. Available online: https://energy-cities.eu/project/covenant-of-mayors-for-climate-energy/#:~:text=The%20Covenant%20of%20Mayors%20gathers,and%20affordable%20energy%20to%20all (accessed on 13 May 2020).
  5. European Parliament News. Available online: https://www.europarl.europa.eu/news/en/headlines/society/20180301STO98928/greenhouse-gas-emissions-bycountry-and-sector-infographic (accessed on 29 June 2020).
  6. Lan, L.; Ghasemifard, H.; Yuan, Y.; Hachinger, S.; Zhao, X.; Battacharjee, S.; Bi, X.; Bai, Y.; Menzel, A.; Chen, J. Assessment of urban CO2 measurement and source attribution in Munich based on TDLAS.WMS and trajectory analysis. Atmosphere 2020, 11, 58. [Google Scholar] [CrossRef] [Green Version]
  7. Bebkiewicz, K.; Chlopek, Z.; Lasocki, J.; Szczepanski, K.; Zimakowska-Laskowska, M. Analysis of emission of greenhouse gases from road transport in Poland between 1990 and 2017. Atmosphere 2020, 11, 387. [Google Scholar] [CrossRef] [Green Version]
  8. Moeletsi, M.E.; Tongwane, M.I. Project direct carbon dioxide emission reductions as a result of the adoption of electric vehicles in Gauteng province of South Africa. Atmosphere 2020, 11, 591. [Google Scholar] [CrossRef]
  9. Hashim, B.M.; Sultan, M.A.; Maliki, A.A.; Al-Ansari, N. Estimation of greenhouse gases emitted form energy industry (oil refining and electricity generation) in Iraq using IPCC methodology. Atmosphere 2020, 11, 622. [Google Scholar] [CrossRef]
  10. Liu, L.; Qu, J.; Maraseni, T.N.; Niu, Y.; Zeng, J.; Zhang, L.; Xu, L. Household CO2 emissions: Current status and future perspectives. Int. J. Environ. Res. Public Health 2020, 17, 7077. [Google Scholar] [CrossRef]
  11. Freebairn, J. A portfolio policy package to reduce greenhouse gas emissions. Atmosphere 2020, 11, 337. [Google Scholar] [CrossRef] [Green Version]
  12. Gaglia, A.G.; Balaras, C.A.; Mirasgedis, S.; Georgopoulou, E.; Sarafidis, Y.; Lalas, D.P. Empirical assessment of the Hellenic non-residential building stock, energy consumption, emissions and potential energy savings. Energy Convers. Manag. 2007, 48, 1160–1175. [Google Scholar] [CrossRef]
  13. Lin, B.; Ahmad, I. Analysis of energy related carbon dioxide emission and reduction potential in Pakistan. J. Clean. Prod. 2017, 143, 278–287. [Google Scholar] [CrossRef]
  14. Patiño, L.I.; Padilla, E.; Alcántara, V.; Raymond, J.L. The relationship of energy and CO2 emissions with GDP per capita in Colombia. Atmosphere 2020, 11, 778. [Google Scholar] [CrossRef]
  15. Lu, W. Greenhouse gas emissions, energy consumption and economic growth: A panel cointegration analysis for 16 Asian countries. Int. J. Environ. Res. Public Health 2017, 14, 1436. [Google Scholar] [CrossRef] [Green Version]
  16. Asumadu-Sarkodie, S.; Owusu, P.A. Carbon dioxide emissions, GDP, energy use, and population growth: A multivariate and causality analysis for Ghana, 1971–2013. Environ. Sci. Pollut. Res. 2016, 23, 13508–13520. [Google Scholar] [CrossRef] [PubMed]
  17. Alam, M.M.; Murad, M.W.; Noman, A.H.M.; Ozturk, I. Relationships among carbon emissions, economic growth, energy consumption and population growth: Testing Environmental Kuznets Curve hypothesis for Brazil, China, India and Indonesia. Ecol. Indic. 2016, 70, 466–479. [Google Scholar] [CrossRef]
  18. Sohag, K.; Mamun, M.A.; Uddin, G.S.; Ahmed, A.M. Sectoral output, energy use, and CO2 emission in middle-income countries. Environ. Sci. Pollut. Res. 2017, 24, 9754–9764. [Google Scholar] [CrossRef] [PubMed] [Green Version]
  19. Chen, J.; Wang, P.; Cui, L.; Huang, S.; Song, M. Decomposition and decoupling analysis of CO2 emissions in OECD. Appl. Energy 2018, 231, 937–950. [Google Scholar] [CrossRef]
  20. Lyons, S.; Pentecost, A.; Tol, R.S.J. Socioeconomic distribution of emissions and resource use in Ireland. J. Environ. Manag. 2012, 112, 186–198. [Google Scholar] [CrossRef] [Green Version]
  21. Chancel, L. Are younger generations higher carbon emitters than their elders? Inequalities, generations and CO2 emissions in France and in the USA. Ecol. Econ. 2014, 100, 195–207. [Google Scholar] [CrossRef]
  22. Qu, J.; Zeng, J.; Li, Y.; Wang, Q.; Maraseni, T.; Zhang, L.; Zhang, Z.; Clarque-Sather, A. Household carbon dioxide emissions from peasants and herdsmen in northwestern arid-alpine regions, China. Energy Policy 2013, 57, 133–140. [Google Scholar] [CrossRef]
  23. Golley, J.; Meng, X. Income inequality and carbon dioxide emissions: The case of Chinese urban households. Energy Econ. 2012, 34, 1864–1872. [Google Scholar] [CrossRef]
  24. Wang, S.; Guangdong, L.; Fang, C. Urbanization, economic growth, energy consumption, and CO2 emissions: Empirical evidence form countries with different income level. Renew. Sustain. Energy Rev. 2018, 81, 2144–2159. [Google Scholar] [CrossRef]
  25. Kennedy, C.; Steinberger, J.; Gasson, B.; Hansen, Y.; Hillman, T.; Havránek, M.; Pataki, D.; Phdunngsilp, A.; Ramaswami, A.; Mendez, G.V. Greenhouse gas emissions from global cities. Environ. Sci. Technol. 2009, 43, 7297–7302. [Google Scholar] [CrossRef]
  26. Günay, M.E. Forecasting annual gross electricity demand by artificial neural networks using predicted values of socio-economic indicators and climatic condition: Case of Turkey. Energy Policy 2016, 90, 92–101. [Google Scholar] [CrossRef]
  27. Bianco, V.; Scarpa, F.; Tagliafico, L.A. Analysis and future outlook of natural gas consumption in the Italian residential sector. Energy Convers. Manag. 2014, 87, 754–764. [Google Scholar] [CrossRef]
  28. Williams, S.P.; Thondhlana, G.; Kua, H.W. Electricity use behaviour in a high-income neighbourhood in Johannesburg, South Africa. Sustainability 2020, 12, 4571. [Google Scholar] [CrossRef]
  29. Jiang, L.; Xing, R.; Chen, X.; Xue, B. A survey-based investigation of greenhouse gas and pollutant emissions from household energy consumption in the Qinghai-Tibet Plateau of China. Energy Build. 2021, 235, 110753. [Google Scholar] [CrossRef]
  30. Zarco-Soto, I.M.; Zarco-Periñán, P.J.; Sánchez-Durán, R. Influence of cities population size on their energy consumption and CO2 emissions: The case of Spain. Environ. Sci. Pollut. Res. 2021, 28, 28146–28147. [Google Scholar] [CrossRef]
  31. Huo, T.; Ren, H.; Cai, W. Estimating urban residential building-related energy consumption and energy intensity in China based on improved building stock turnover model. Sci. Total Environ. 2019, 650, 427–437. [Google Scholar] [CrossRef]
  32. International Labour Office. Minimum Wage Systems. International Labour Conference. 103rd Session; International Labour Office: Geneva, Switzerland, 2014. [Google Scholar]
  33. Eurostat Methodologies and Working Papers. Statistical Classification of Economic Activities in the European Community; European Commission: Luxembourg, 2008. [Google Scholar]
  34. Zarco-Soto, I.M.; Zarco-Periñán, P.J.; Sánchez-Durán, R. Influence of climate on energy consumption and CO2 emissions: The case of Spain. Environ. Sci. Pollut. Res. 2020, 27, 15645–15662. [Google Scholar] [CrossRef]
  35. Instituto Nacional de Estadística, Cifras de Población, Ministerio de Asuntos Económicos y Transformación Digital. Available online: http://www.ine.es/dyngs/INEbase/es/operacion.htm?c=Estadistica_C&cid=1254736176951&menu=ultiDatos&idp=1254735572981 (accessed on 15 August 2020).
  36. Ministerio de Empleo y Seguridad Social. Real Decreto 1171/2015, de 29 de Diciembre, por el que se Fija el Salario Mínimo Interprofesional Para 2016; Boletín Oficial del Estado: Madrid, Spain, 2015. [Google Scholar]
  37. Instituto Nacional de Estadística, Demografía y Población, Ministerio de Asuntos Económicos y Transformación Digital. Available online: http://www.ine.es/ss/Satellite?L=es_ES&c=Page&cid=1254735910183&p=1254735910183&pagename=INE%2FINELayout (accessed on 12 October 2020).
  38. Comisión Nacional de los Mercados y la Competencia. Informe de Supervisión del Mercado de gas Natural en España; Ministerio de Economía, Industria y Competitividad: Madrid, Spain, 2017.
  39. Secretaría de Estado de la Energía. Estadísticas y Balances Energéticos; Ministerio para la Transición Ecológica: Madrid, Spain, 2018.
  40. Ministerio de Industria, Energía y Turismo & Ministerio de Fomento, Factores de emisión de CO2 y Coeficientes de Paso a Energía Primaria de Diferentes Fuentes de Energía Final Consumidas en el Sector de Edificios de España. Available online: https://energia.gob.es/desarrollo/EficienciaEnergetica/RITE/Reconocidos/Paginas/IndexDocumentosReconocidos.aspx (accessed on 13 May 2020).
Figure 1. Number of cities of each group.
Atmosphere 12 01051 g001
Figure 2. Population of each group.
Atmosphere 12 01051 g002
Figure 3. Thermal, electric, and total energy consumption per household of each Spanish climate zone.
Atmosphere 12 01051 g003
Figure 4. Thermal, electric, and total mean energy consumption per household by group.
Atmosphere 12 01051 g004
Figure 5. Thermal, electric, and total mean energy consumption per inhabitant by group.
Atmosphere 12 01051 g005
Figure 6. Thermal, electric, and total mean CO2 emissions per household by group.
Atmosphere 12 01051 g006
Figure 7. Variation of the EVI index for CO2 emissions per household by group.
Atmosphere 12 01051 g007
Figure 8. Thermal, electric, and total mean CO2 emissions per inhabitant by group.
Atmosphere 12 01051 g008
Figure 9. Variation of the EVI index for CO2 emissions per inhabitant by group.
Atmosphere 12 01051 g009
Table 1. Definition of groups.
GroupNet Income
Group 1Net income < 1 NMW<7429.97
Group 21 NMW ≤ Net income < 1.5 NMW 7429.97–11,144.95
Group 31.5 NMW ≤ Net income < 2 NMW11,144.95–14,859.94
Group 42 NMW ≤ Net income < 2.5 NMW14,859.94–18,574.92
Group 52.5 NMW ≤ Net income>18,574.92
Table 2. Classification of cities by net income.
GroupCities
Group 1Arona, Ejido (El), Mijas, Sanlúcar de Barrameda, Torrevieja
Group 2Albacete, Alcalá de Guadaíra, Alcoy/Alcoi, Algeciras, Alicante/Alacant, Almería, Aranjuez, Arganda del Rey, Arrecife, Badajoz, Benalmádena, Benidorm, Cartagena, Ceuta, Chiclana de la Frontera, Collado Villalba, Córdoba, Dos Hermanas, Elche/Elx, Elda, Estepona, Fuengirola, Fuenlabrada, Gandía, Huelva, Jaén, Jerez de la Frontera, Las Palmas, L’Hospitalet de Llobregat, Linares, Línea de la Concepción (La), Lorca, Málaga, Marbella, Mataró, Melilla, Mérida, Molina de Segura, Móstoles, Motril, Murcia, Orihuela, Parla, Paterna, Ponferrada, Puerto de Santa María, Roquetas de Mar, Sagunto/Sagunt, San Bartolomé de Tirajana, San Cristóbal de la Laguna, San Fernando, San Vicente del Raspeig, Santa Coloma de Gramenet, Santa Cruz de Tenerife, Santa Lucía de Tirajana, Sevilla, Talavera de la Reina, Telde, Torrejón de Ardoz, Torrelavega, Torremolinos, Torrent, Utrera, Valdemoro, Vélez-Málaga, Vila-Real
Group 3A Coruña, Alcalá de Henares, Alcorcón, Ávila, Avilés, Badalona, Barakaldo, Burgos, Cáceres, Cádiz, Castellón de la Plana, Cerdanyola del Vallès, Ciudad Real, Cornellà de Llobregat, Coslada, Cuenca, Ferrol, Getafe, Gijón, Girona, Granada, Granollers, Guadalajara, Huesca, Irún, Leganés, León, Lleida, Logroño, Lugo, Manresa, Mollet del Vallès, Ourense, Oviedo, Palencia, Palma de Mallorca, Pamplona/Iruña, Pinto, Pontevedra, Prat de Llobregat (El), Reus, Rivas-Vaciamadrid, Rubí, Sabadell, Salamanca, San Sebastián de los Reyes, Sant Boi de Llobregat, Santander, Santiago de Compostela, Segovia, Siero, Tarragona, Terrassa, Toledo, Valencia, Valladolid, Vigo, Viladecans, Vilanova i la Geltrú, Zamora, Zaragoza
Group 4Alcobendas, Barcelona, Bilbao, Castelldefels, Madrid, San Sebastián/Donostia, Vitoria/Gasteiz
Group 5Boadilla del Monte, Getxo, Majadahonda, Pozuelo de Alarcón, Rozas de Madrid (Las), Sant Cugat del Vallès
Table 3. Total emissions per household, in tCO2/year.
GroupMeanStd. Dev.MedianMaximumMinimum
Group 12.260.402.312.761.73
Group 22.640.712.404.041.69
Group 33.200.613.244.091.79
Group 43.480.363.494.013.06
Group 54.080.344.164.433.44
Table 4. Emissions of thermal origin per household, in tCO2/year.
GroupMeanStd. Dev.MedianMaximumMinimum
Group 10.340.350.220.900.00
Group 20.570.550.271.860.00
Group 31.100.511.111.880.15
Group 41.440.251.451.851.08
Group 51.570.271.542.041.22
Table 5. Emissions of electrical origin per household, in tCO2/year.
GroupMeanStd. Dev.MedianMaximumMinimum
Group 11.920.151.862.101.73
Group 22.070.242.012.831.69
Group 32.100.292.122.771.57
Group 42.040.252.042.461.66
Group 52.510.172.582.672.22
Table 6. Total emissions per inhabitant, in tCO2/year.
GroupMeanStd. Dev.MedianMaximumMinimum
Group 10.880.200.561.200.70
Group 20.990.250.901.480.50
Group 31.250.211.321.480.73
Group 41.350.101.341.481.19
Group 51.330.091.321.481.19
Table 7. Emissions of thermal origin per inhabitant, in tCO2/year.
GroupMeanStd. Dev.MedianMaximumMinimum
Group 10.140.150.080.390.00
Group 20.210.200.110.680.00
Group 30.430.190.440.680.06
Group 40.560.110.540.680.42
Group 50.510.090.490.680.42
Table 8. Emissions of electrical origin per inhabitant, in tCO2/year.
GroupMeanStd. Dev.MedianMaximumMinimum
Group 10.740.070.710.820.67
Group 20.780.090.821.070.50
Group 30.820.090.801.080.64
Group 40.790.040.800.830.72
Group 50.820.030.830.830.77
Publisher’s Note: MDPI stays neutral with regard to jurisdictional claims in published maps and institutional affiliations.

