Article

Immobilized Microalgae-Based Photobioreactor for CO2 Capture (IMC-CO2PBR): Efficiency Estimation, Technological Parameters, and Prototype Concept

by
Marcin Dębowski
1,*,
Mirosław Krzemieniewski
1,
Marcin Zieliński
1 and
Joanna Kazimierowicz
2
1
Department of Environmental Engineering, Faculty of Geoengineering, University of Warmia and Mazury in Olsztyn, 10-720 Olsztyn, Poland
2
Department of Water Supply and Sewage Systems, Faculty of Civil Engineering and Environmental Sciences, Bialystok University of Technology, 15-351 Bialystok, Poland
*
Author to whom correspondence should be addressed.
Atmosphere 2021, 12(8), 1031; https://doi.org/10.3390/atmos12081031
Submission received: 21 July 2021 / Revised: 5 August 2021 / Accepted: 10 August 2021 / Published: 12 August 2021
(This article belongs to the Special Issue Efficiency Evaluation in Atmospheric Environment)

Abstract

:
Microalgae-mediated CO2 sequestration has been a subject of numerous research works and has become one of the most promising strategies to mitigate carbon dioxide emissions. However, feeding flue and exhaust gas into algae-based systems has been shown to destroy chloroplasts, as well as disrupt photosynthesis and other metabolic processes in microalgae, which directly limits CO2 uptake. CO2 biosequestration in existing photobioreactors (PBRs) is also limited by the low biomass concentration in the growth medium. Therefore, there is a real need to seek alternative solutions that would be competitive in terms of performance and cost-effectiveness. The present paper reports the results of experiments aimed to develop an innovative trickle bed reactor that uses immobilized algae to capture CO2 from flue and exhaust gas (IMC-CO2PBR). In the experiment, ambient air enriched with technical-grade CO2 to a CO2 concentration of 25% v/v was used. The microalgae immobilization technology employed in the experiment produced biomass yields approximating 100 g DM/dm3. A relationship was found between CO2 removal rates and gas volume flux: almost 40% of CO2 was removed at a feed of 25 dm3 of gas per hour, whereas in the 200 dm3/h group, the removal efficiency amounted to 5.9%. The work includes a determination of basic process parameters, presentation of a developed functional model and optimized lighting system, proposals for components to be used in the system, and recommendations for an automation and control system for a full-scale implementation.

1. Introduction

Increased carbon dioxide (CO2) emissions into the atmosphere are a contributor to the environmental crisis, as CO2 is thought to be the main driver of global warming [1]. There have been promising studies on fixing CO2 in algae growth and cultivation systems, indicating that the technology may potentially be used to curb the emissions of carbon dioxide and other pollutants present in flue/exhaust gas [2,3,4]. Microalgae are photosynthesizing microorganisms capable of absorbing CO2 from the atmosphere and from emitted flue gas, converting it into biomass or other organic compounds [5,6]. Intensive microalgae cultivation has been shown to require a supply of 1.83 kg CO2 per 1.0 kg of additional dry mass [7,8]. As such, low carbon dioxide concentrations in the growth medium often act as a bottleneck to rapid biomass growth [9,10,11]. One of the considerable advantages of microalgae is that they grow faster and more efficiently than other photosynthesizing organisms, such as terrestrial plants [12,13]. Microalgae immobilization technology enables increased productivity, which reduces production costs [14]. Additionally, this solution protects microalgae against predators and toxic pollutants. Different polymeric media, such as alginate, chitosan, and carrageenan, are used for gel entrapment of microalgae immobilization [15]. Emparan et al. (2020) conducted research on the immobilization of Nannochloropsis sp. in sodium alginate beads. It was found that immobilization allowed a three times higher concentration of biomass to be obtained compared to the photobioreactor with suspended biomass [16]. Jimenez-Perez et al. (2004) showed a comparable growth of free and immobilized Nannochloris sp. cells [17]. In the studies by Srinuanpan et al. (2019), the immobilized cells of Scenedesmus sp. in alginate-gel beads obtained a biomass concentration of 1.78 g/dm3 [18]. Ruiz-Marin et al. (2010) also found that the immobilized Chlorella vulgaris and Scenedesmus obliquus showed vigorous growth without a long lag period compared with the free cells [19]. Soo et al. (2017) showed that the specific growth rate of immobilized Nannochloropsis sp. cells was significantly higher (0.063 h−1) than that of free cells (0.027 h−1) [20]. Additionally, in the studies by Aguilar-May et al. (2007), immobilized Synechococcus sp. cells showed a higher growth rate than the counterpart of the suspended free cells [21]. Soo et al. (2017) showed a higher viability of Nannochloropsis sp. [20], and Pane et al. (1998) Tetraselmis suecica [22] after immobilization in calcium alginate.
The practical applicability of microalgal CO2 biosequestration systems is determined, in a large part, by the performance and cost of the process [23]. The efficiency of algae technological systems is usually limited by the photobioreactor capacity, i.e., the possible concentration of microalgae biomass in the culture medium [24]. The composition of flue gas and other gases released into the atmosphere depends on the fuel type, boiler type, combustion technology, and the specifics of operation. For waste production gases, the nature of the manufacturing activity is also a factor [25,26,27]. CO2 levels in the flue gas fall within the wide range of 3 to 25% by volume, and may reach up to 60% in specific cases, such as in refinery flue gas [28]. Using non-pretreated gas as feedstock leads directly to lower costs of neutralization in microalgae-based systems. The process has been shown to be considerably less efficient at higher temperatures, high levels of sulfur and nitrogen oxides, or in the presence of gas and particulate matter [29,30]. Flue gas has been found to contain dozens of substances other than CO2, and their effect on microalgae cells has not been fully explored [31,32]. What has been shown is that low levels of nitrogen oxides in treated gases can be metabolized by microalgae, and thus do not downgrade system performance. Sulfur compounds, on the other hand, are toxic to microalgae [33,34]. According to Lam et al. (2012), the concentration of sulfur oxide fed into the photobioreactor should be kept below 60 ppm [35]. Feeding flue gas directly from the combustion chamber may also disrupt metabolism and cause lower performance due to chlorophyll degradation, as demonstrated for Chlorella sorokiniana [36].
Flue gas temperature is another important factor in increasing the performance of microalgae-based flue gas treatment systems. The temperature of coal flue gas usually lies in the range of 60 °C to 95 °C [35,37]. However, there are reports that the temperature can reach 250 to 450 °C in some cases [38]. The optimal flue gas temperature for Chlorella MTF-7 has been reported at 30 °C. Any increases significantly lower the biomass concentration in the system and CO2 biosequestration efficiency. Some studies that focused on the Chlorella sp. WT strain have shown reductions in biomass at temperatures as low as 40 °C [30].
Increased CO2 in the growth medium improves microalgal biomass growth and carbon dioxide sequestration [39,40,41]. CO2 diffusion from the atmosphere into the microalgal culture is slow due to the low CO2 content of air, the high surface tension of the growth medium, and the low interphase contact surface intrinsic to photobioreactor designs [41,42]. These factors minimize the mass transfer coefficient for carbon dioxide between the culture system and atmospheric air [25,43]. Using commercially sold pure CO2 is not cost-effective, and leftover gas can contribute to global warming [25,44]. Current prices for commercially distributed CO2 fall between EUR 35 and 45 per ton [31]. With the observed CO2 sequestration efficiency by microalgae ranging between 20 and 70%, this would translate to biomass production costs of EUR 0.06 to 0.54 per kg of dry algae [31]. Research to date has shown that increasing the CO2 concentration to as little as 0.25% is enough to boost biomass production [45,46]. Maintaining CO2 at those levels has been shown to directly stimulate carboxylase activity, thus promoting photosynthesis in the microalgal biomass [47,48].
The exact productivity gains from increasing CO2 availability in microalgae-based systems vary between specific microalgae species and strains [46]. The genera Spirulina sp. and Scenedesmus sp. grow the fastest at 6% CO2 in the system. Increasing CO2 levels to 12% was found to inhibit Scenedesmus sp. biomass growth, while having little effect on the growing patterns of Spirulina sp. [49]. In many cases, excessive CO2 can reduce photosynthetic efficiency and acidify the medium [35]. This pattern has been shown in a study that produced the fastest microalgal biomass growth (0.13/h) at 1.5% CO2. The growth rate fell sharply when CO2 was maintained at a higher level of 5.0% [46].
Other factors that directly determine CO2 uptake are the volume flux of the treated gas, type and method of culture illumination, microalgal cell concentrations in the photobioreactor, growth medium pH, method of stirring and maintaining interphase contact [50,51], process temperature, bioreactor type [52,53], provided nutrients [31], and CO2:O2 ratio [54]. A study by Lam et al. (2012) demonstrated that reducing the size of gas bubbles fed into the medium can improve CO2 biosequestration efficiency [35]. However, it should also be noted that intensive aeration can damage and destroy microalgal cells [30].
Molecular engineering serves as the backbone for the development of microalgae biomass-based technologies by providing a means to boost photosynthetic efficiency, which directly translates to faster biomass growth and pollutant fixation [55,56]. CO2-sequestrating microalgae also need to be adapted to better tolerate fluctuating temperatures and photoinhibition of biomass growth [57]. One issue that must be tackled by environmental engineering researchers and designers is to engineer integrated systems for microalgal biomass production and carbon dioxide fixation, ones that would be cost-effective to build and operate [58].
Feeding flue and exhaust gas into algae-based systems leads to multiple potential drawbacks in terms of maintaining the process and operating the reactor. Such gases not only destroy chloroplasts, but also disrupt photosynthesis and other metabolic processes in microalgae, which directly limits CO2 uptake. The efficiency of CO2 biosequestration in current photobioreactor (PBR) designs is limited by the relatively low biomass concentrations in the growth medium. Therefore, there is a real need to seek alternative solutions, ones that would be competitive in terms of performance and cost-effectiveness. The present paper reports the results of experiments aimed to develop an innovative reactor that uses immobilized algae to capture CO2 from flue and exhaust gas (IMC-CO2PBR). The work includes a determination of basic process parameters, a presentation of an optimized lighting set-up, proposals for components to be used for the system, and recommendations for an automation and control system for a full-scale implementation. A functional model was developed to visualize the unit and estimate the technological performance of the IMC-CO2PBR.

2. Materials and Methods

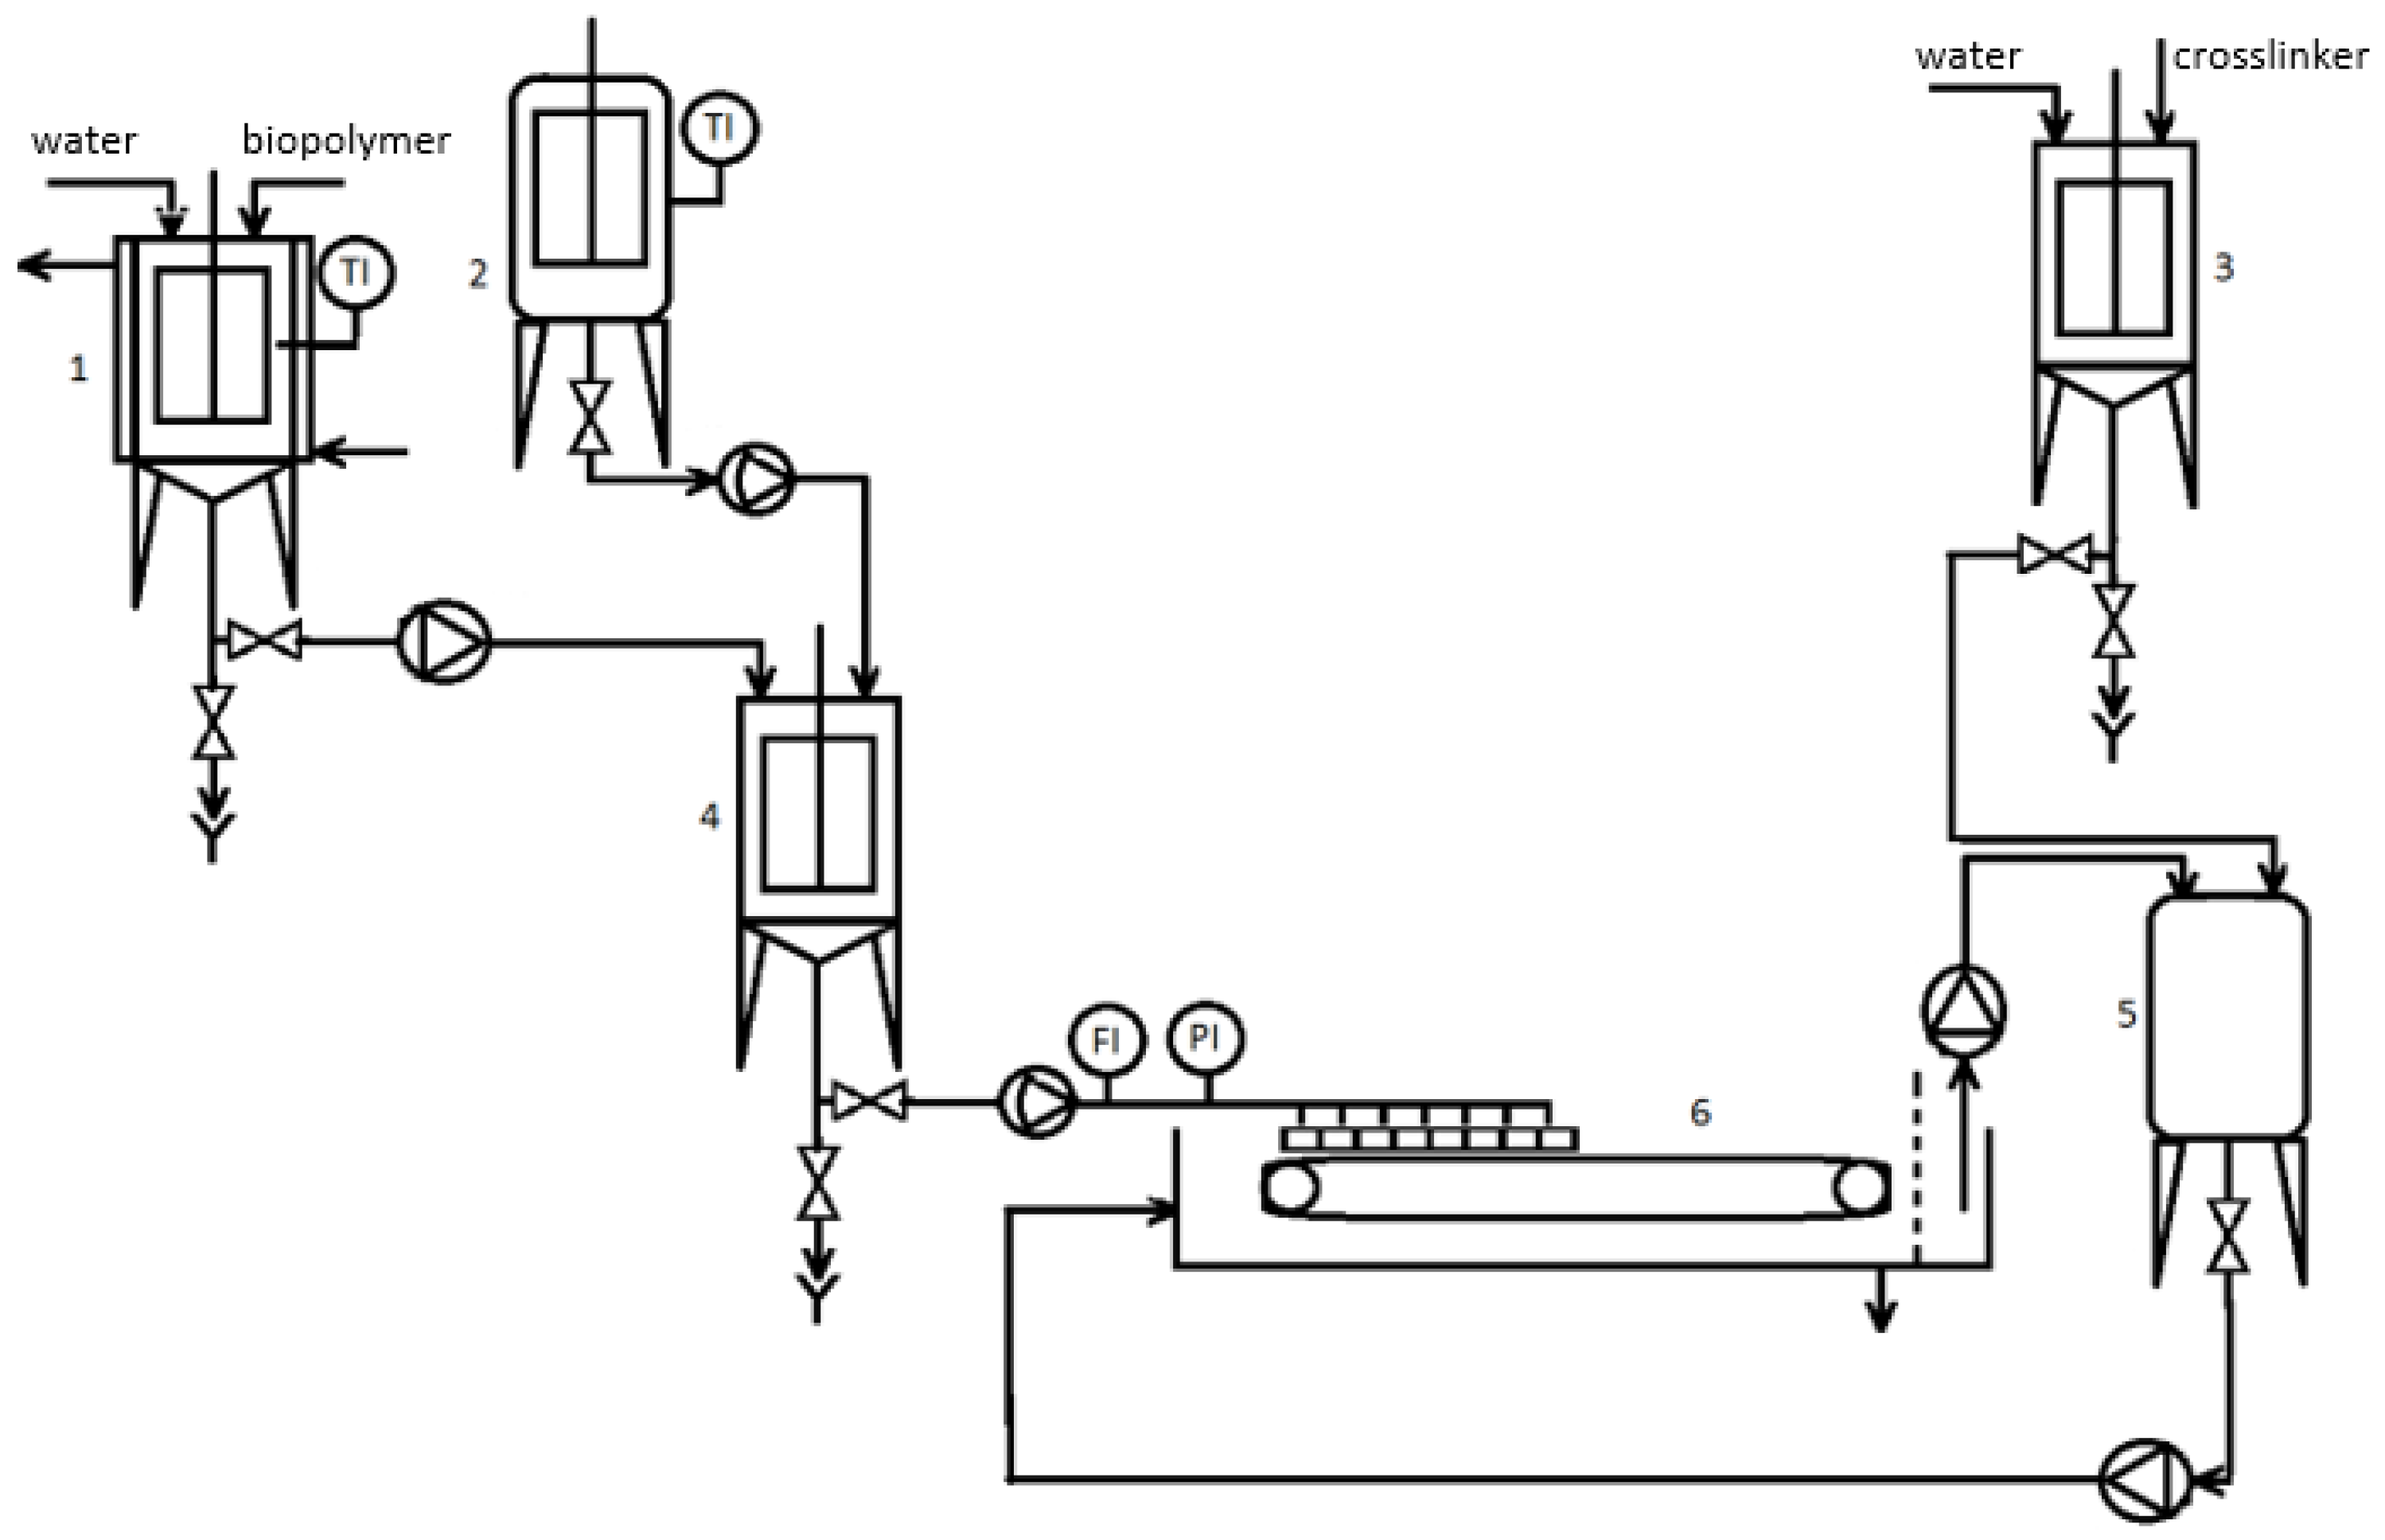
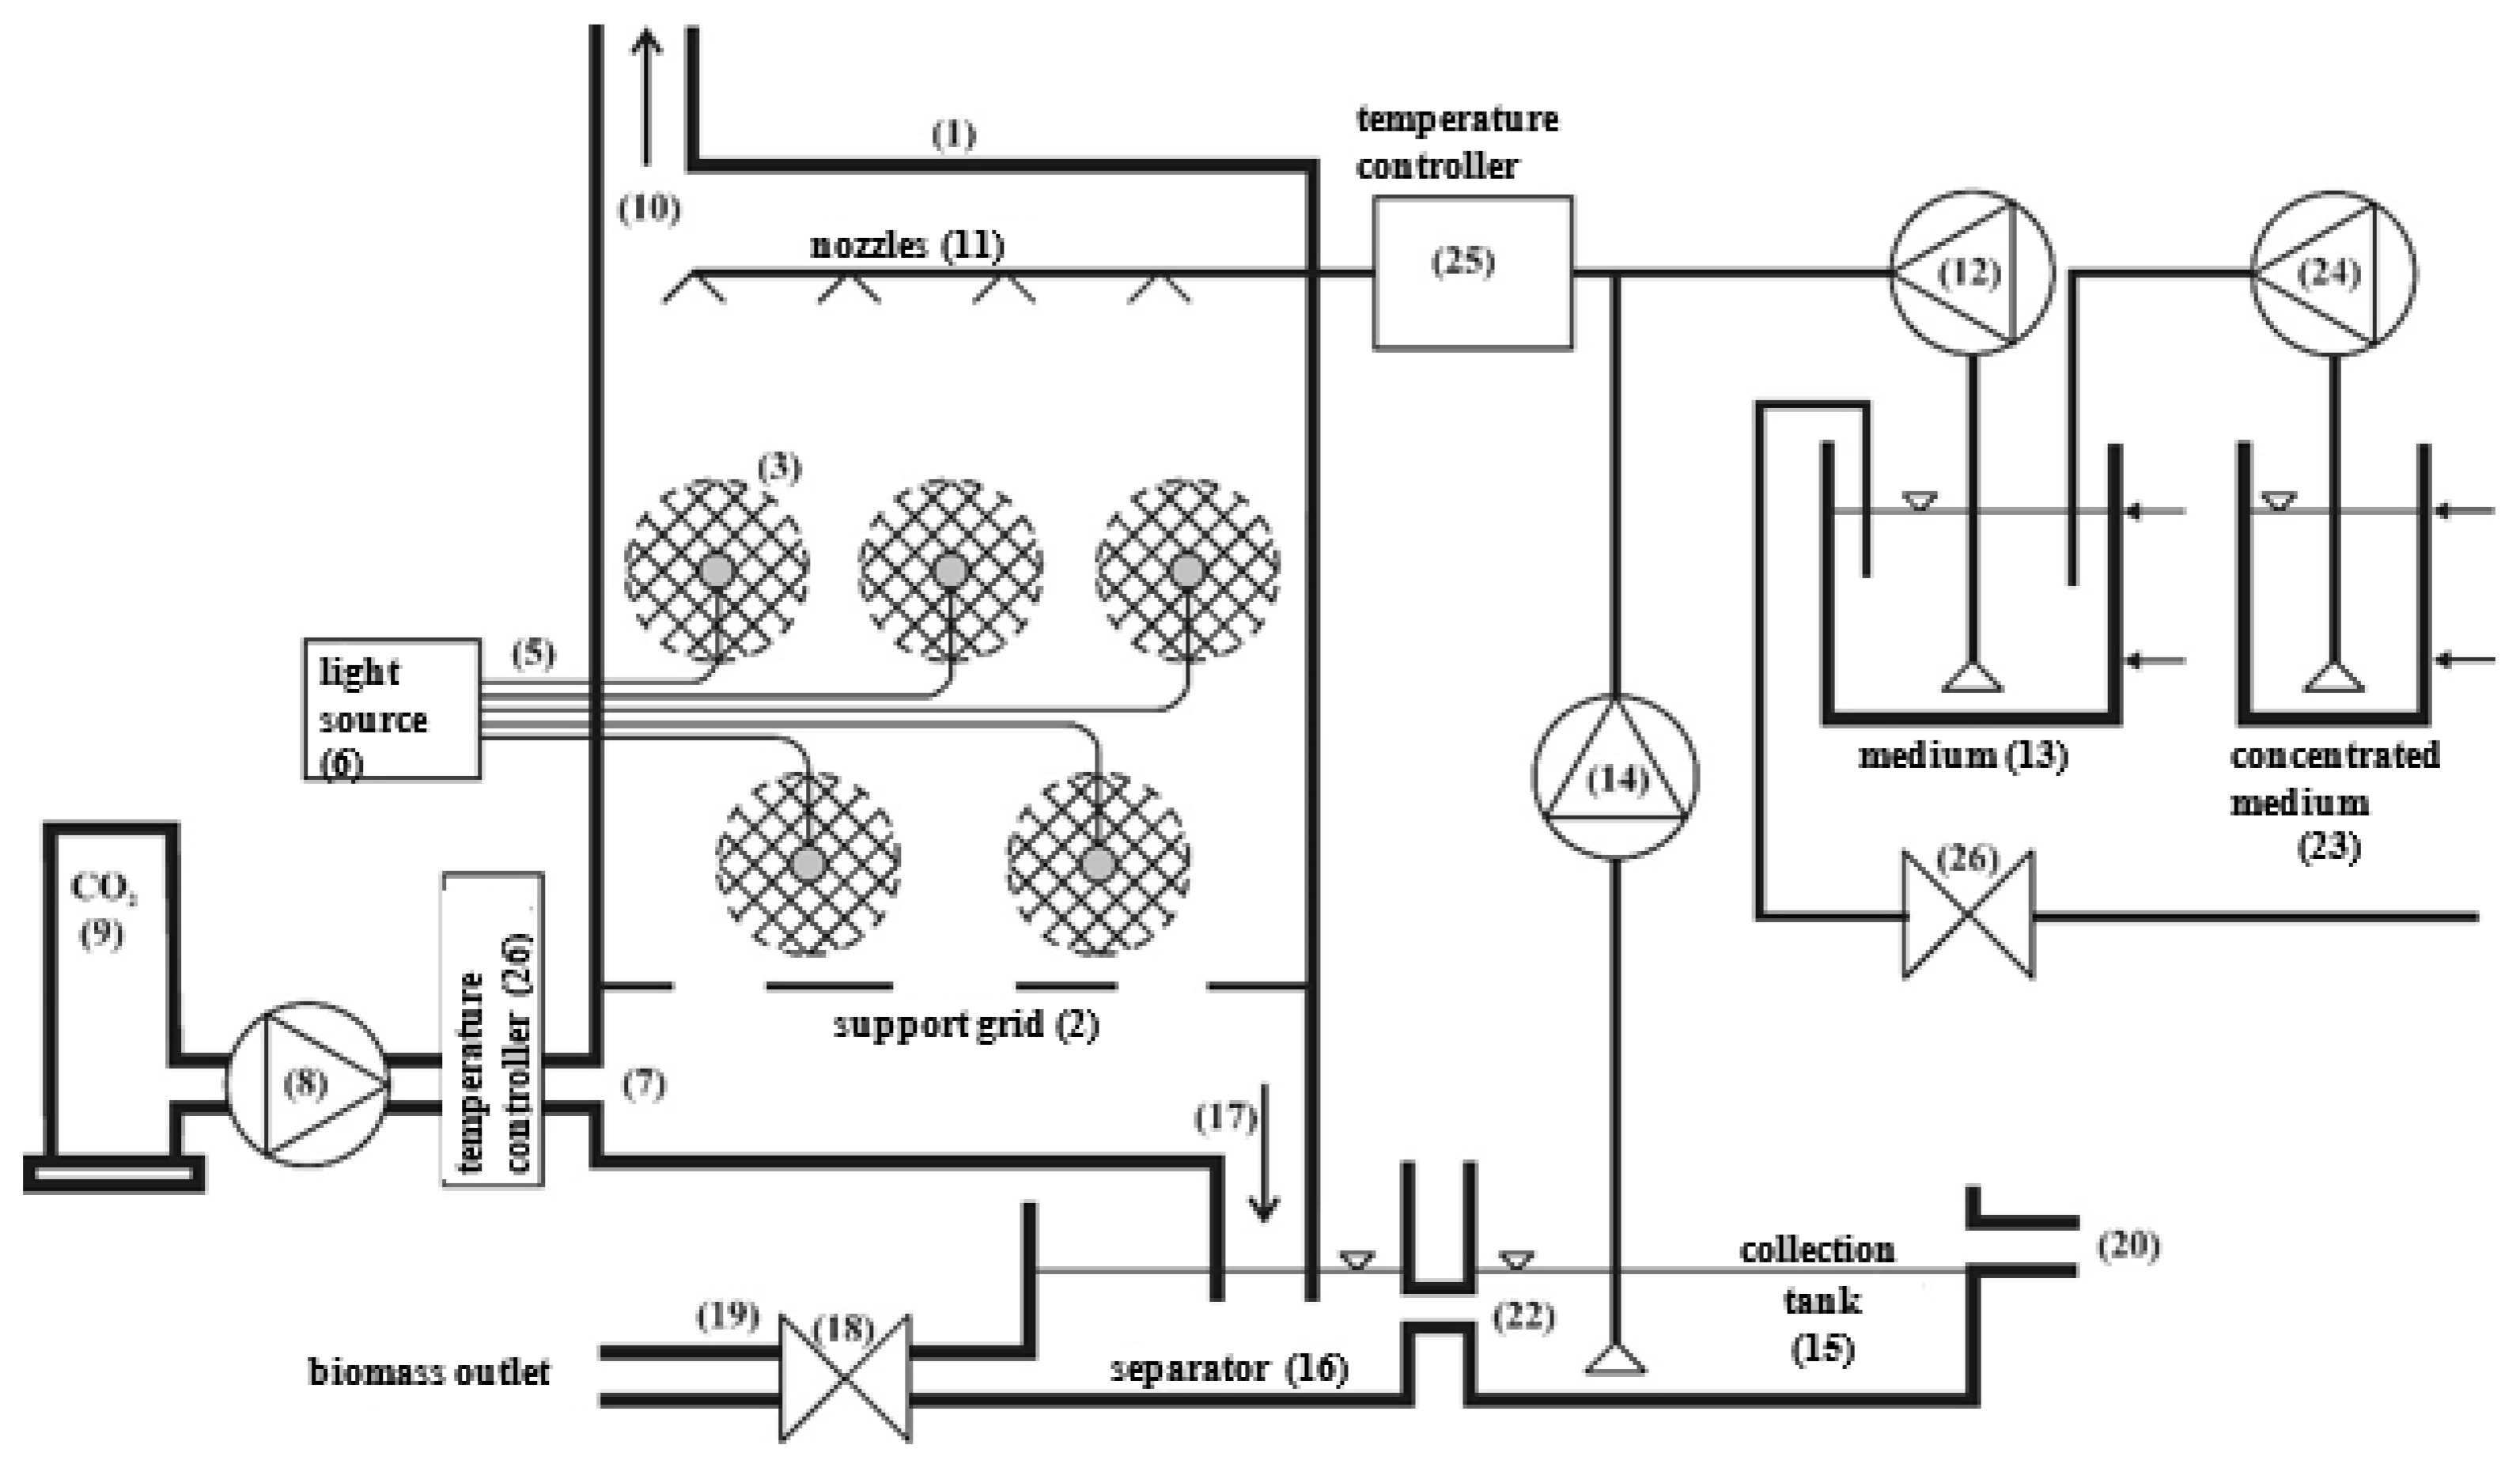
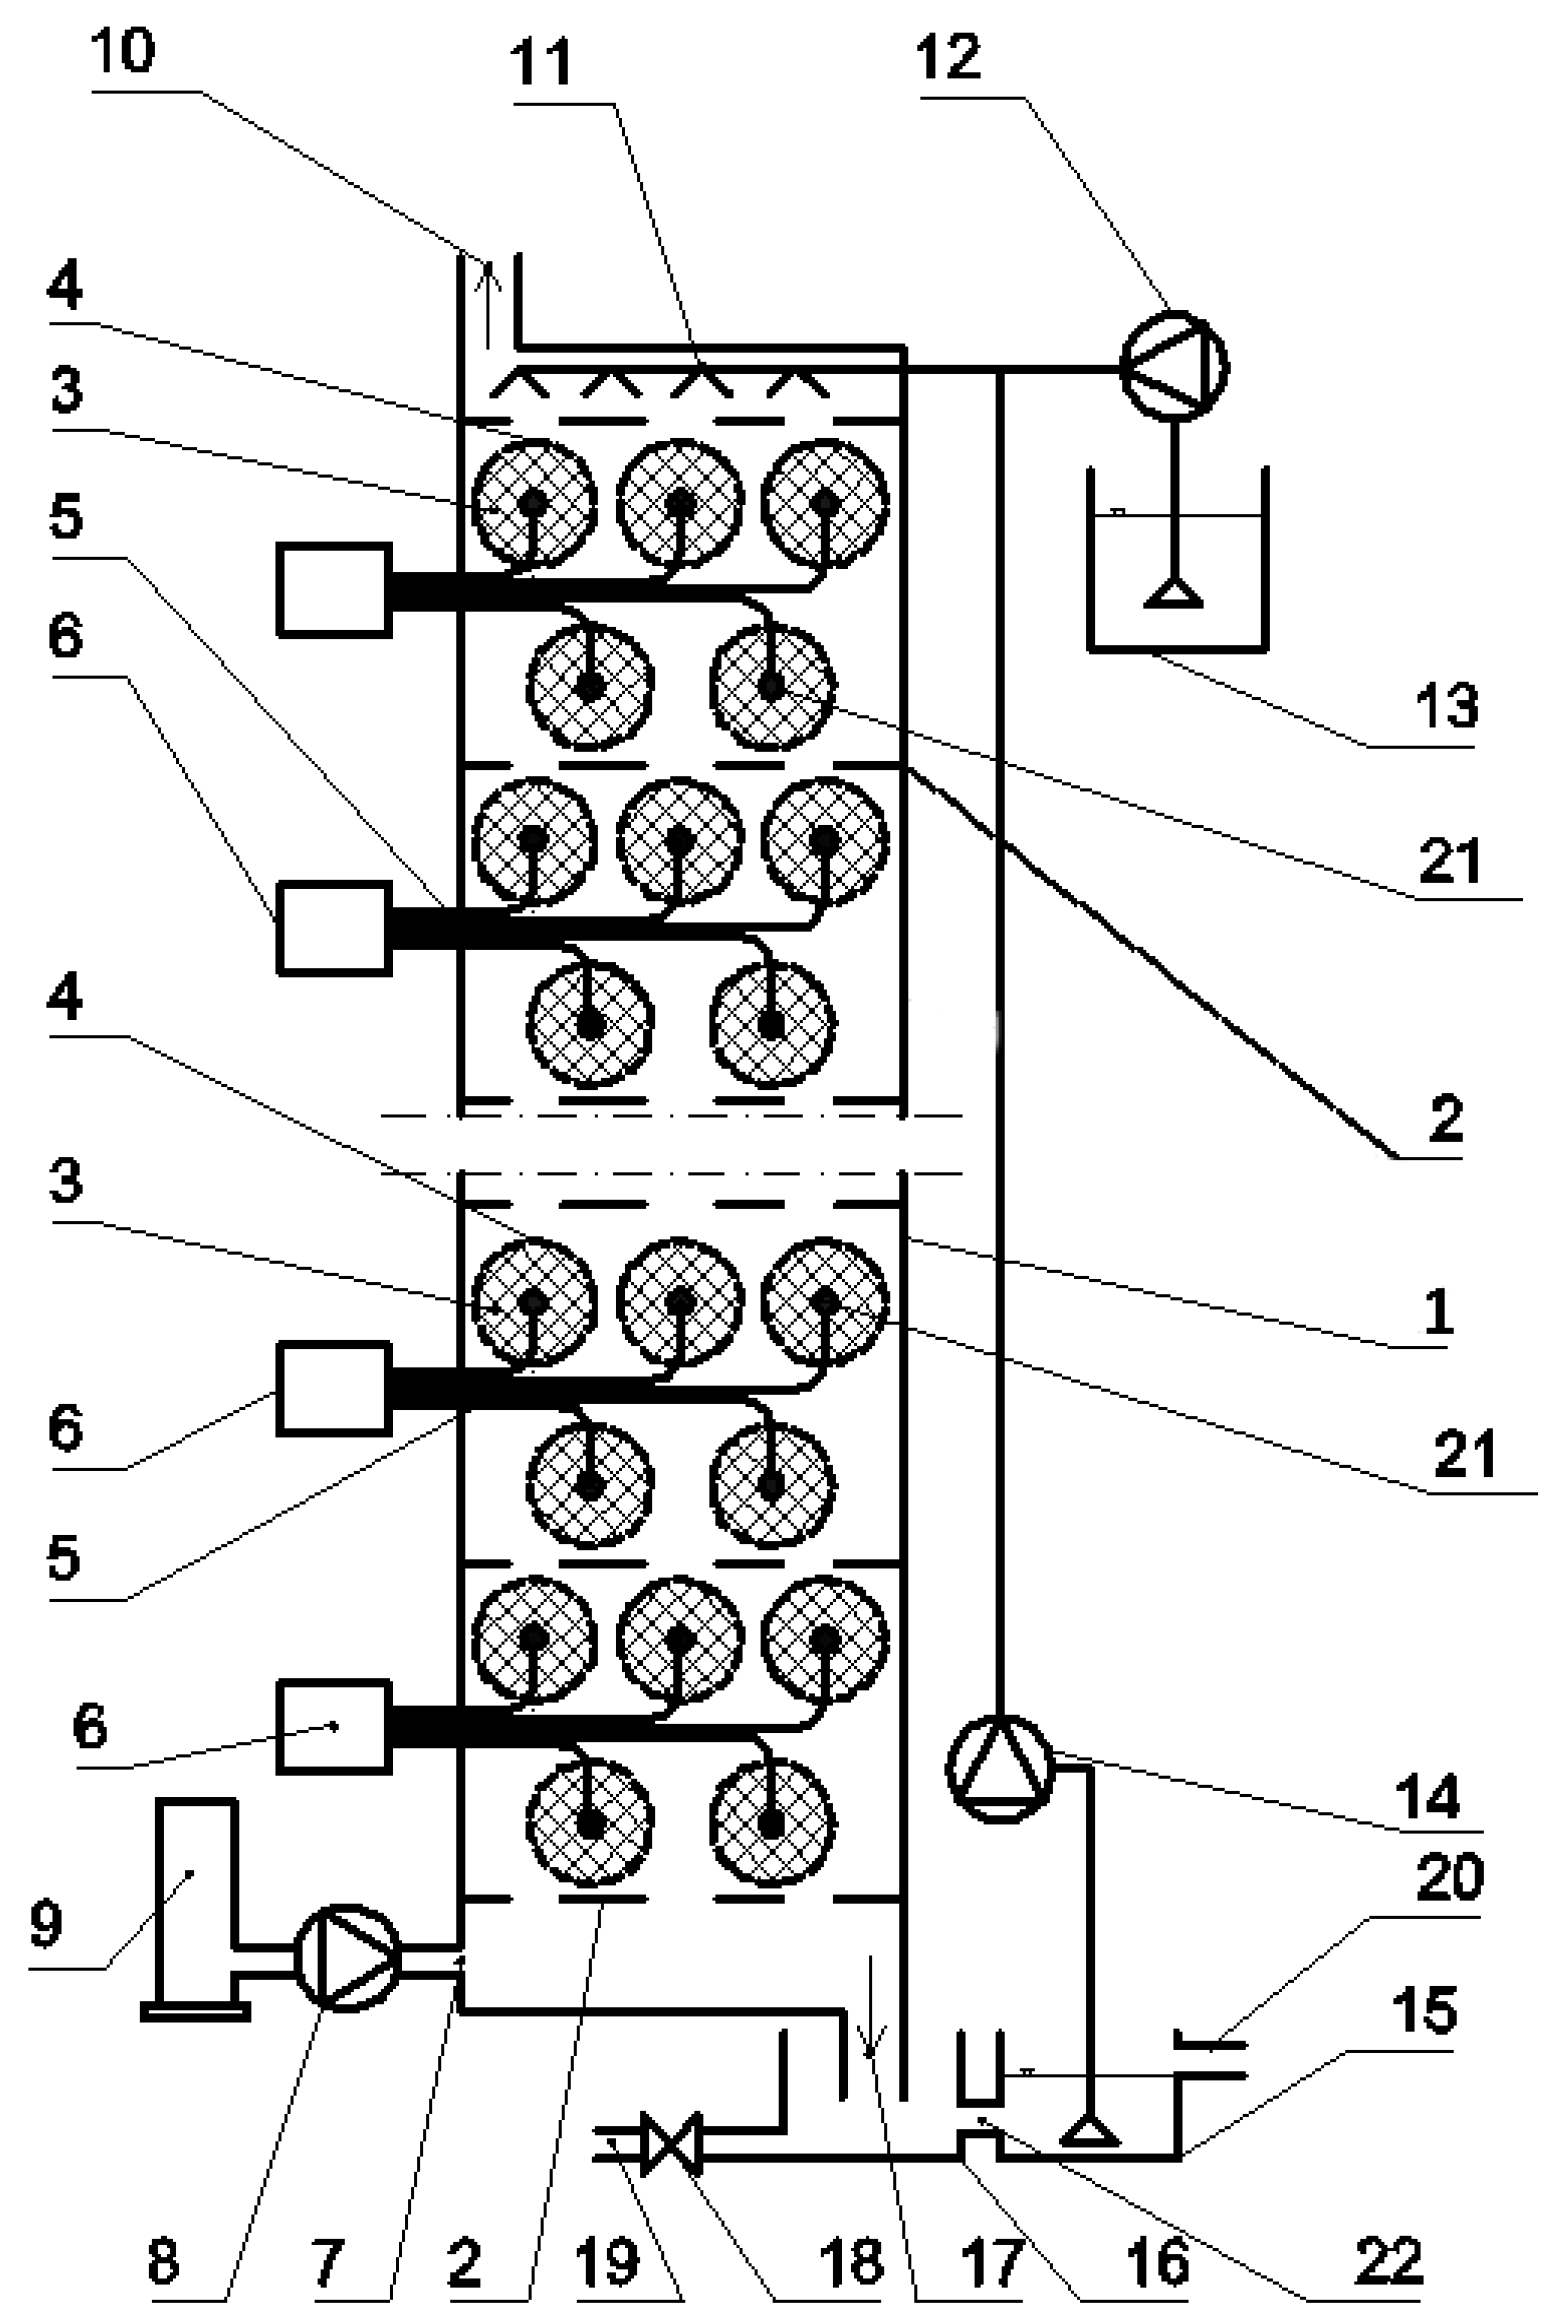
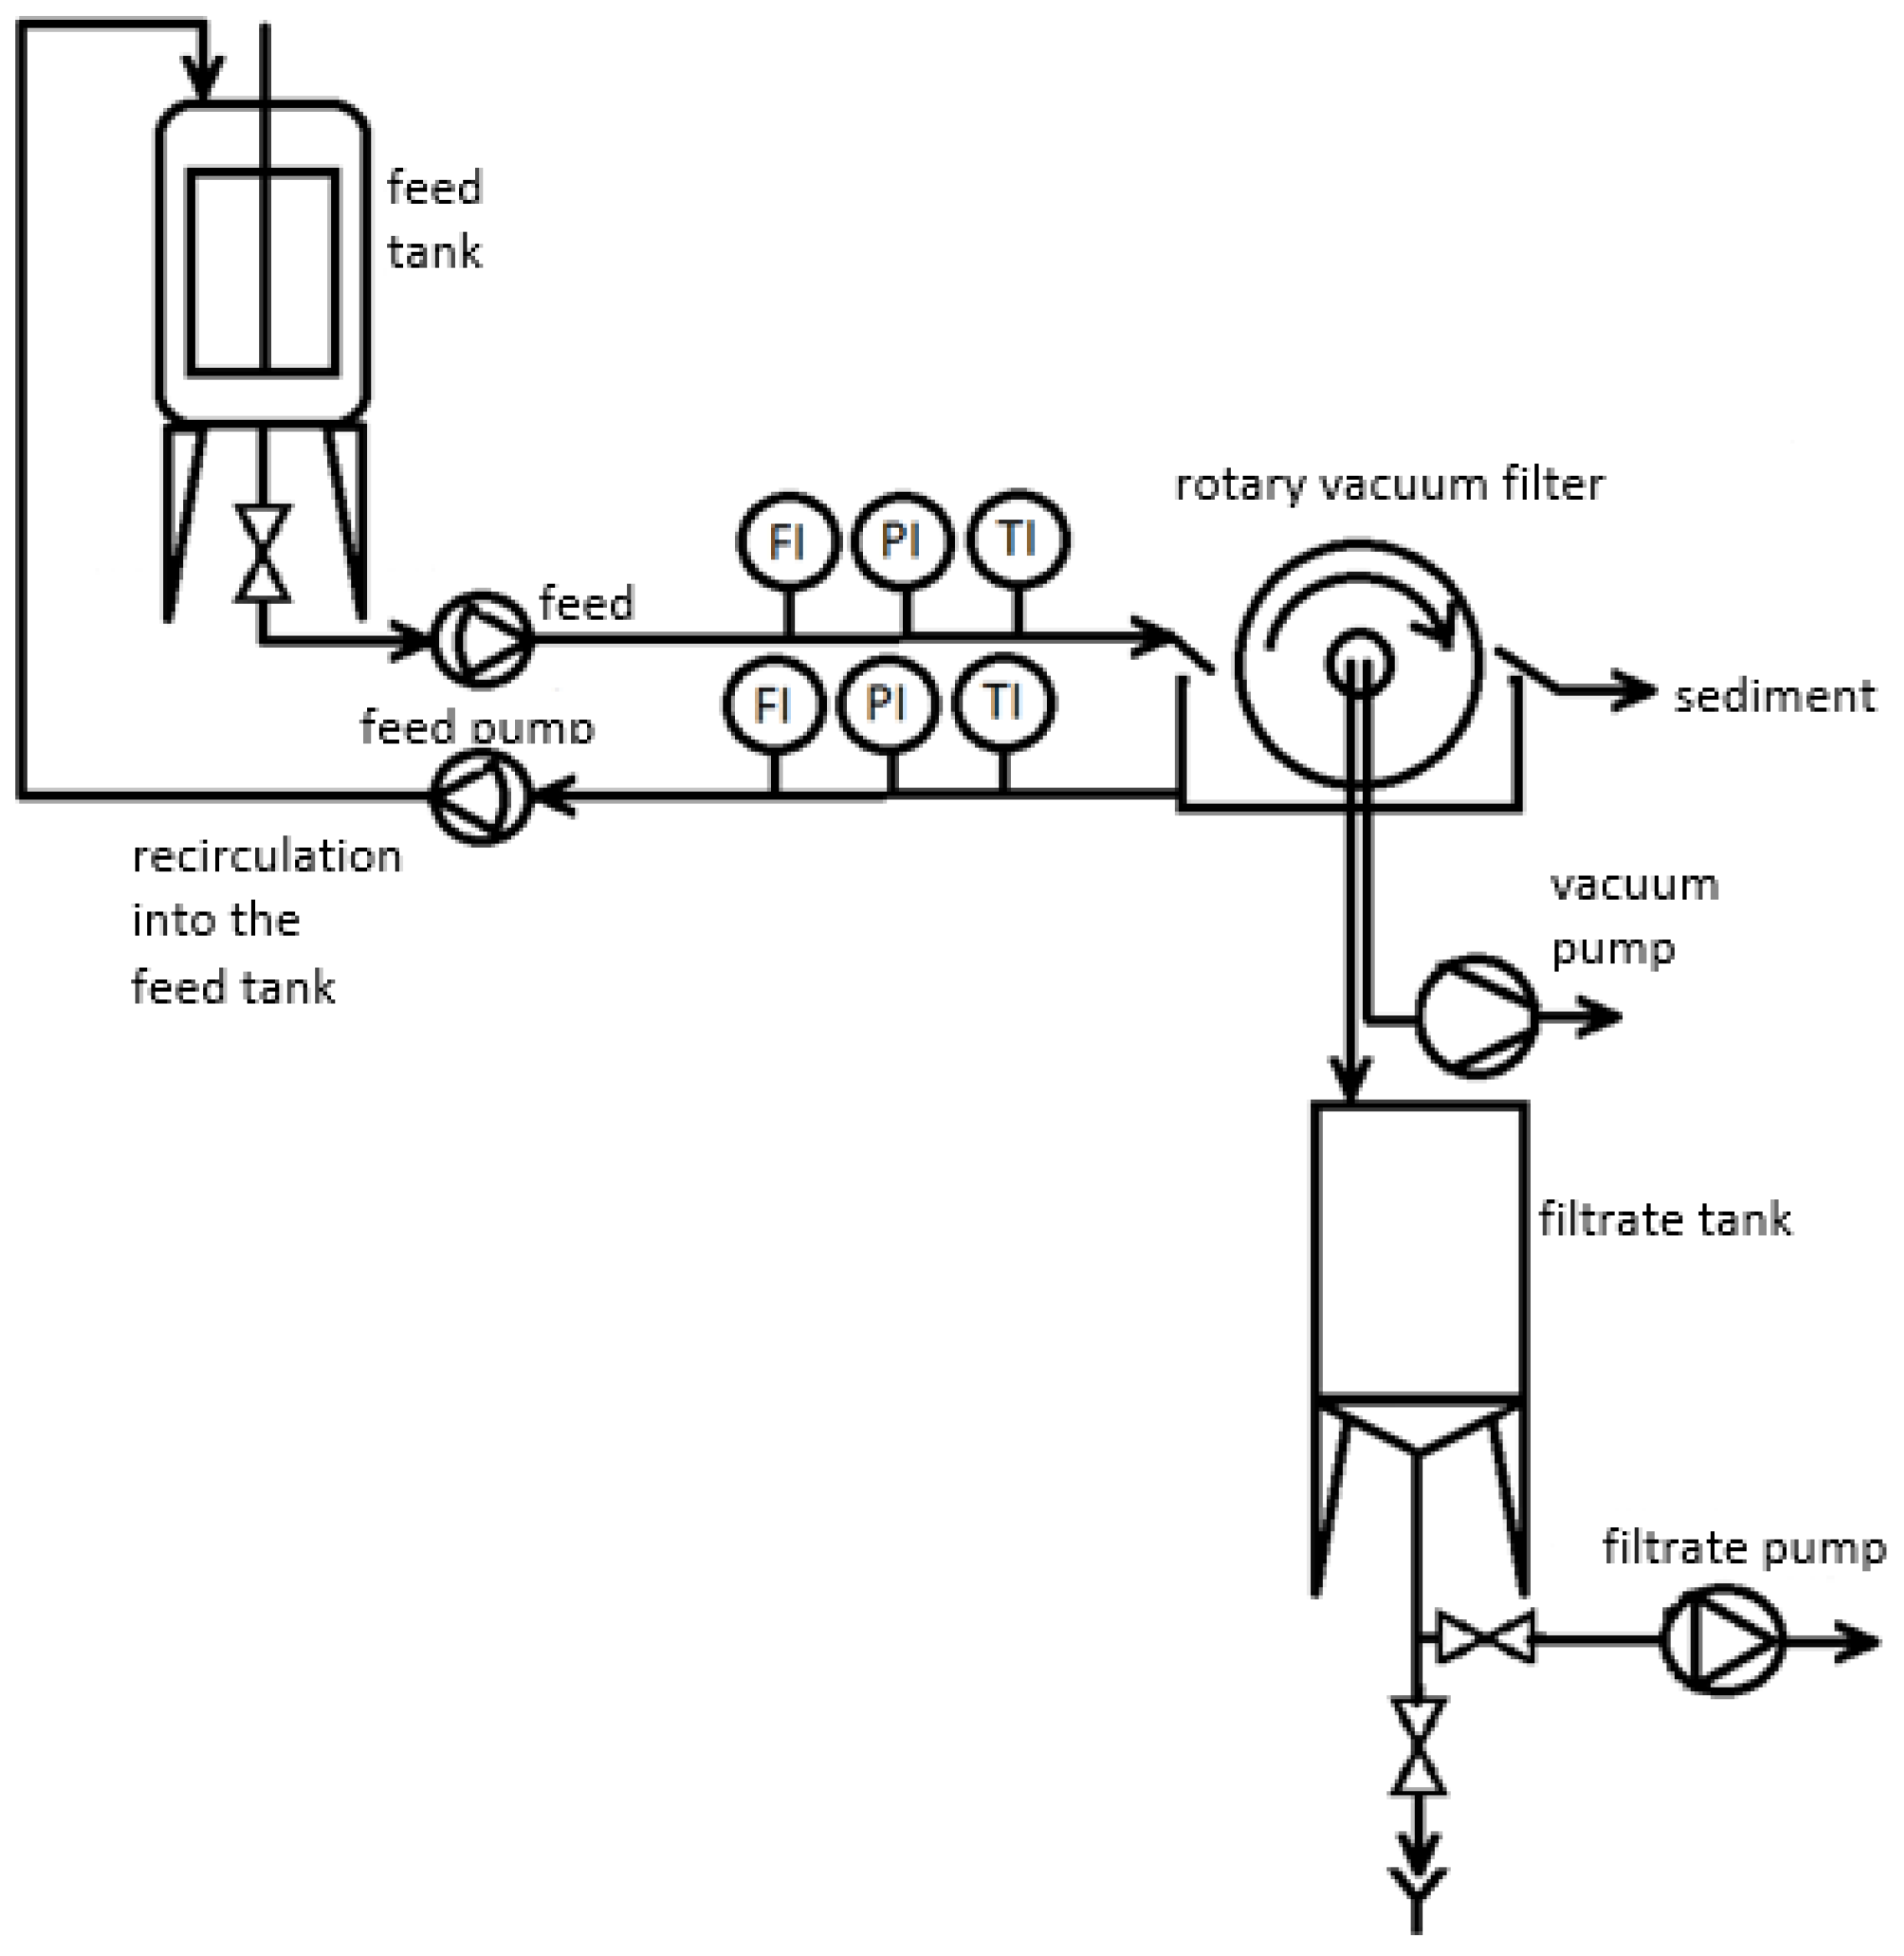
2.1. Experimental Set-Up

The IMC-CO2PBR model presented in the scheme (Figure 1) was built and operated in a laboratory scale.
The IMC-CO2PBR was housed in a colorless plexiglass cylinder (1) with an inside diameter of 50 mm, height of 1000 mm, and wall thickness of 2.0 mm. The outside of the IMC-CO2PBR was covered with aluminum foil that blocked off external light. The unit had an access port to view the capsules containing immobilized microalgal biomass. The IMC-CO2PBR was sited upon a support grid (2) with a 5.0 mm aperture size, located 50 mm above the base of the housing. The base of the housing was submerged 15 mm below the surface of the growth medium, in a 1.0 dm3 tank (16). Excess medium was discharged from the tank (16) via the line (22) into a 1.0 dm3 collection tank (15). The upper section of the IMC-CO2PBR housing included a gas outlet (10) 5.0 mm in diameter. The expunged gas was collected in a Tedlar bag and sent for analysis. The second line of the upper IMC-CO2PBR housing, fitted with a 2.0 mm mesh sieve (11), acted as an irrigator connected with the metering line for feeding the growth medium. At the lower section of the housing, under the grid (2) for supporting the capsules (3), was the inlet for the CO2 line (7) used to control the pump (8). The medium for growing the algae was prepared in a separate tank (13) and fed into the system using a peristaltic pump (12) with a capacity of 800 cm3/h. The medium was then circulated using another pump (14) with a capacity of 10 dm3/h. Nutrient take-up in the medium was continuously monitored, and the nutrients replenished. The medium was dosed into the system concurrently with the CO2-containing gas. The capsules were scrubbed with clean tap water every 24 h to remove the accumulated biomass.

2.2. Immobilized Microalgal Biomass

The capsules containing immobilized microalgal biomass (3) were layered within the PBR to a thickness of 800 mm. A single capsule was 10.0 mm in diameter. The capsules were filled with Chlorella vulgaris UTEX 2714, which we cultured in a 500 dm3 PBR. The capsules contained approximately 100 g DM/dm3 of concentrated Chlorella vulgaris biomass. Sodium chloride was added to the dissolved gel precursor to make the capsules porous, and afterward rinsed out of the final capsules after the cross-linking stage. Prior to inserting the capsule in the PBR, the biomass was concentrated in rotary drum filters with a 10 µm screen, then dewatered in a Z11 centrifuge (Cepa, Lahr, Germany). The dewatered microalgae had a plastic consistency and contained 70 ± 2% dry matter. The microalgal biomass was immobilized and encapsulated using sodium alginate, with the resulting capsules having a diameter of 10.0 mm. An optic-fiber cable (5) with a diffuser tip was inserted into each capsule. The cables were powered by a white-light source (6), HPS Philips MASTER GreenPower CG T 400 W lamps (Royal Philips Electronics N.V., Amsterdam, The Netherlands) (luminous flux: 58,500 lm, color temperature: 2000 K, average shelf life: 16,000 h). The capsules were piled up loosely.

2.3. Materials

The input gas consisted of ambient air enriched with technical-grade CO2 to a CO2 concentration of 25% v/v. The experiment was performed in five variants with varying levels of gas volume flux. The experimental design and basic parameters of the gas are presented in Table 1.
The synthetic medium used to grow Chlorella vulgaris had the following composition: 25.0 g/dm3 NaNO3, 2.5 g/dm3 CaCl2·2H2O, 7.5 g/dm3 MgSO4·7 H2O, 7.5 g/dm3 K2HPO4·3 H2O, 17.5 g/dm3 KH2PO4, 2.5 g/dm3 NaCl, 1.0 cm3/dm3 VB12, 1.0 cm3/dm3 VB1, 6.0 cm3/dm3; and the following microelements: 0.75 mg/dm3 Na2EDTA, 97.0 mg/dm3 FeCl3·6 H2O, 41.0 mg/dm3 MnCl2·4 H2O, 5.0 mg/dm3 ZnCl2, 2.0 mg/dm3 CoCl2·6 H2O, and 4.0 mg/dm3 NaMoO4·2 H2O.

2.4. Analytical and Statistical Methods

The gas was analyzed every 24 h using a gastight syringe (Hamilton Company, Reno, NV, USA) (20 mL injection volume) and a gas chromatograph (GC) (7890A, Agilent, Santa Clara, CA, United States) equipped with a thermal conductivity detector (TCD). The GC was fitted with the two Hayesep Q columns (80/100 mesh), two molecular sieve columns (60/80 mesh), and Porapak Q column (80/100) operating at a temperature of 70 °C. The temperature of the injection and detector ports were 150 and 250 °C, respectively. Helium and argon were used as the carrier gases at a flow of 15 mL/min. The presented efficiency of CO2 capture in IMC-CO2PBR results only from microalgae bio-sequestration. The results were corrected for CO2 removal in the control variant (capsules without Chlorella vulgaris immobilized biomass). The dry mass of microalgae was determined gravimetrically at 105 °C. Changes of the basic parameters in the medium were measured spectrophotometrically using a UV/VIS DR 5000 spectrophotometer (Hach Company, Loveland, CO, USA) (N-NH4 DIN 38406 E5-1, N-NO3 DIN 38405 D9-2, P-PO4 ISO 6878-1-1986, Ntot. EN ISO 11905-1, Ptot. DIN 38405 D11-4). The experiment was carried out for 60 days, with a single cycle time of 20 days.
Statistical analysis of the experimental results was conducted using STATISTICA 13.1 PL. The hypothesis on the normality of distribution of each analyzed variable was verified using the W Shapiro-Wilk test. One-way analysis of variance (ANOVA) was used to determine differences between variables. Homogeneity of variance in groups was determined using a Levene test. The Tukey (HSD) test was applied to determine the significance of differences between the analyzed variables. Results were considered significant at α = 0.05.

3. Results and Discussion

The Chlorella vulgaris immobilization technology used in the experiment produced high-volume biomass yields of approximately 100 g DM/dm3. This output was approximately 20–30 times higher than in the predominant closed photobioreactors or open systems, which have been reported to produce around 3 to 5 g DM/dm3 [59]. A good CO2 biosequestration performance is predicated, in part, to ensure high concentrations and growth rates of microalgal biomass [60]. The microalgae growth rates ranged from 21.4 g (variant 1) to 32.3 g DM/dm3·d (variant 4) (Table 2).
Research to date includes experiments that successfully harnessed Chlorella sp. microalgae to reduce gas pollution from combusting fuel [61]. Sung et al. (1999) experimented with Chlorella sp. algae (strain KR-1) to determine their tolerance to fluctuating CO2 levels in the flue gas fed into the medium, and showed that the biomass grew the fastest at 10% CO2 by volume. It was also found that increasing the headspace carbon dioxide in the photobioreactor to 50% did not inhibit the growth of the microalgal culture to any significant degree. Chlorella sp. KR-1 has been shown to be able to fix CO2 in full-scale installations with microalgae cultured for biomass [62].
The study indicated that CO2 removal in the IMC-CO2PBR was directly linked to the gas volume flux. When the IMC-CO2PBR was fed with 25 dm3 of gas per hour, CO2 removal reached almost 40%, whereas a volume flux of 200 dm3/h led to just 5.9% removal. Per-unit CO2 removal varied between 3.76 gCO2/g additional dry mass and 4.59 gCO2/g additional dry mass (Table 2). The highest per-unit CO2 biosequestration in the IMC-CO2PBR was noted for the 25 dm3/h gas volume flux. Table 3 presents the results of a comparative statistical analysis of CO2 removal per microalgae biomass concentration unit in IMC-CO2PBR.
Notably, the efficiency of CO2 fixation (as indicated by the gas volume flux) far exceeded the values commonly reported in the literature. Most studies report that each 1 g of grown microalgal biomass absorbs 1.8 to 2.1 g CO2 [63]. In contrast, daily CO2 removal in our IMC-CO2PBR ranged from 117.4 g CO2/day in variant 1 to 144.6 g CO2/day in variant 3. Increasing the flux of the gas fed to the IMC-CO2PBR beyond 100 dm3/h led to diminished CO2 biosequestration. A chromatographic assay of the gases discharged from the IMC-CO2PBR showed CO2 concentrations ranging from 15.0% at a volume flux of 25 dm3/h to 23.5% at 200 dm3/h (Table 2).
Alternative PBR-based solutions were explored, for example, by Cheng et al. (2006), who looked at the CO2 sequestration performance of Chlorella vulgaris in a photobioreactor with a hollow fiber membrane. The researchers found that the photosynthetic CO2 capture efficiency was directly linked to the CO2 concentration in the membrane-treated air fed into a continuous culture. Integrating a membrane module with a PBR for growing microalgae resulted in higher CO2 removal compared with a conventional system, i.e., 260 vs. 80 mg/dm3·h, respectively. One downside to this process, however, is the resultant fowling, which exacerbates pressure drops, limits conveyance, and increases the power consumed to transport the gas [50]. In turn, Keffer and Kleinheinz (2002) found that CO2 removal by Chlorella vulgaris grown in a bubble column photobioreactor peaked at 74% [64], whereas Chiu et al. (2009) achieved maximum CO2 removal efficiency by Chlorella sp. NCTU-2 culture (63%), with the biomass maintained at 5.15 g/dm3 and aerated at 0.125 vvm (volume gas per volume broth per min; 10% CO2 in the aeration gas) in a porous centric-tube photobioreactor [65].
A study by Stuart and Hessami (2005) demonstrated that a 4000 m3 open system operated in natural conditions can remove 22,000 Mg CO2/year. The major advantage of this system for CO2 removal was that it did not require extensive treatment of input flue gas, as the NOx present in the gas were taken up as nutrients by the growing microalgal biomass. In addition, the presented technology has low impact on environmental resources and produces microalgal biomass with a high commercial value [66].
Chiu et al. (2008) experimented with an integrated Chlorella sp. culture system, examining carbon dioxide removal in a closed system. The study included a taxonomic assay and characterization of the microalgal biomass concentration, intracellular lipids, and CO2 removal from feed gas. The authors found a direct link between CO2 levels in the flue gas, fixation rate, and removal efficiency. CO2 removal varied between 16.0% and 58.0% across the variants [9].
Jacob-Lopes et al. (2008) analyzed the kinetics of carbon dioxide removal from the aqueous phase of growth medium by Aphanothece microscopica Nageli blue-green algae. The algae sequestered CO2 from the gaseous phase mainly by forming carbonates and bicarbonates. It was found that blue-green algae transferred hydroxide ions to the outside of the cell by a reaction that pumped H+ ions into the interior of thylakoid membranes. This mechanism resulted in the production of a strongly alkaline environment that was highly conductive to CO2 fixation. In subsequent experiments, the same research group demonstrated that CO2 could be biosequestered by growing Aphanothece microscopica Nageli in refinery effluent [67]. This later study looked at how the photosynthetic activity of microalgae, stimulated by changing light/dark regimes, impacted CO2 removal and O2 production. A qualitative assay of the gas phase in the system showed the highest CO2 removal rate at 18.7 ± 0.5 mg/dm3·min, and the highest rate of O2 release into the solution at 16.0 ± 0.7 mg/dm3·min (achieved in the continuous illumination variant). Applying intermittent illumination strongly affected the process, due to the photosynthetic activity and the increased metabolic rate in heterotrophic algae. This variant of the system sequestered CO2 at 78.0% efficiency [67].
The positive effects of microalgae cell immobilization on CO2 fixation were observed by Srinuanpan et al. (2019) [18]. The maximum CO2 removal at 75–77% was achieved with the maximum CO2 removal rate of 4.63 kg CO2/d·m3 in the experiment in which Scenedesmus sp. immobilized in alginate-gel beads was used [18]. Additionally, in the studies by Cheirsilp et al. (2017), immobilizing Nannochloropsis sp. in alginate gel beads contributed to over a 99% reduction in CO2 emissions [68]. Increasing the CO2 feed rate from 0.4 vvm up to 0.8 vvm, the microalgae grew more efficiently, and higher biomass and lipid production was observed [68].
Microalgae tolerate a certain concentration of CO2 in the culture medium. Exceeding this level has a detrimental effect on population growth. The environmental stress caused by the higher concentration of CO2 leads to a reduction of the effectiveness of CO2 fixation. Second, the pH of the culture decreases due to the formation of large amounts of bicarbonate buffer [69]. A high CO2 concentration significantly inhibits the activity of carbonic anhydrase. A low pH value may additionally inhibit the activity of this enzyme, which plays an important catalytic role in the exchange of CO2 and HCO3− [70]. The flue gases also include NOx, SOx, and heavy metals. The effect of NOx and SOx on the growth of microalgae is still not fully understood due to various observations presented in the literature. Some researchers have found that NOx and SOx can act as nutrients for microalgae, while others have found they are toxic [71,72,73].
Experiments to date have also attempted to assess the feasibility of using microalgal biomass technologies to remove nitrogen oxides from flue gases of various composition and origin. NO accounts for approximately 95% of nitrogen in flue gas, with the remainder consisting of NO, N2O, N2O3, NO2, and NO3 [68]. One barrier to NO fixation by microalgal biomass is its low solubility in water: 0.032 g/dm3 at 1 atm and 25 °C [31]. Microalgae can only use nitrogen oxides for rapid biomass build-up if the NO is dissolved beforehand [30,31]. Nitrogen is used to synthesize nucleic acids and proteins [53]. Biological reduction of nitrogen oxides is a promising method [51]. It has been shown that nitrogen monoxide at concentrations of approximately 300 ppm can be biologically converted into nitrogen dioxide [53]. The extent of microalgal tolerance to high NOx in the system is determined by several factors, including biomass concentration, gas flow rate, reactor type, and the species of microalgae [50]. Using biomass-rich cultures for the system reduced the inhibitory effect of high NO on cellular protein synthesis [53]. The growth of a marine algae strain designated as NOA-113 was inhibited by 300 ppm NO with dry mass in the bioreactor at 1.0 g DM/dm3. However, the same NO concentration had no inhibitory effect on cultures with biomass concentrations of around 1.5 g DM/dm3 [60]. Chiu et al. (2011) demonstrated that Chlorella LEB-106 can remove NO with 70% efficiency, with pollutant levels being at 100 ppm NO and 60 ppm SO2 [30].
The presence of SO2 inhibits the growth of microalgae. Although some species of microalgae are able to grow in high concentrations of SO2, they have a longer lag phase than those grown in the absence of SO2. Most microalgae are almost impossible to grow when the SO2 concentration exceeds 100 ppm [70,71]. The effect of SOx and NOx on CO2 binding of microalgae depends on the density of algae cells, SOx and NOx concentration, gas flow rate, reactor type, and species [74]. The effect of Hg on microalgae growth was investigated as one of the most important trace heavy metals in the exhaust gas [70,75]. Some work suggests that Hg has no deleterious effect on the growth of microalgae, and some algae may convert Hg between forms representing a possible pathway to toxic remediation [76]. Others [70] believe that the growth rate of microalgae can be inhibited even if the Hg2+ concentration is extremely low. As the concentration of Hg2+ increased, the content of chlorophyll gradually decreased, directly reducing the photosynthesis efficiency. Mercury is especially harmful to microalgae in reactors with raw flue gases [77].
Temperature is an important factor influencing the growth rate of microalgae. High temperature inhibits their metabolism. It also causes low solubility of CO2 in water [70]. Temperatures higher than 35 °C are usually lethal to many species, although several species have been identified that can tolerate temperatures up to 60 °C [69,70]. However, the tolerance and adaptability of some species to high temperature can be improved with induced acclimation technology. Generally, the temperature of exhaust gases from a coal power plant is around 65–120 °C [69]. In many cases, additional heat is recovered from the exhaust gas leaving the gas turbine or boiler room through the use of heat recovery boilers. Hence, the temperature of the gas stream depends in part on the components installed in the power plant. The cooling system typically lowers the flue gas temperature to 20–30 °C, which is acceptable for most species of microalgae. In addition, selecting the appropriate strains of microalgae that can tolerate high temperatures is important to reduce the cost of cooling the exhaust gas. Temperature-resistant species have been identified [70,74].

4. Technical/Technological Concept of a Large-Scale IMC-CO2PBR

4.1. Concentration of Biomass

Prior to the immobilization and encapsulation process, the microalgae are concentrated to obtain a condensed but metabolically active mass. The concentrate must be kept aqueous or semi-aqueous for the immobilization and encapsulation process. At this stage of implementation, multiple methods for microalgae separation and concentration were tested and analyzed, including membrane-based processes, vacuum and drum filters, and vertical/horizontal/decanter centrifuges. After consideration of operational, technological, and economic factors, a rotary vacuum filter was determined to be the best choice (Figure 2).

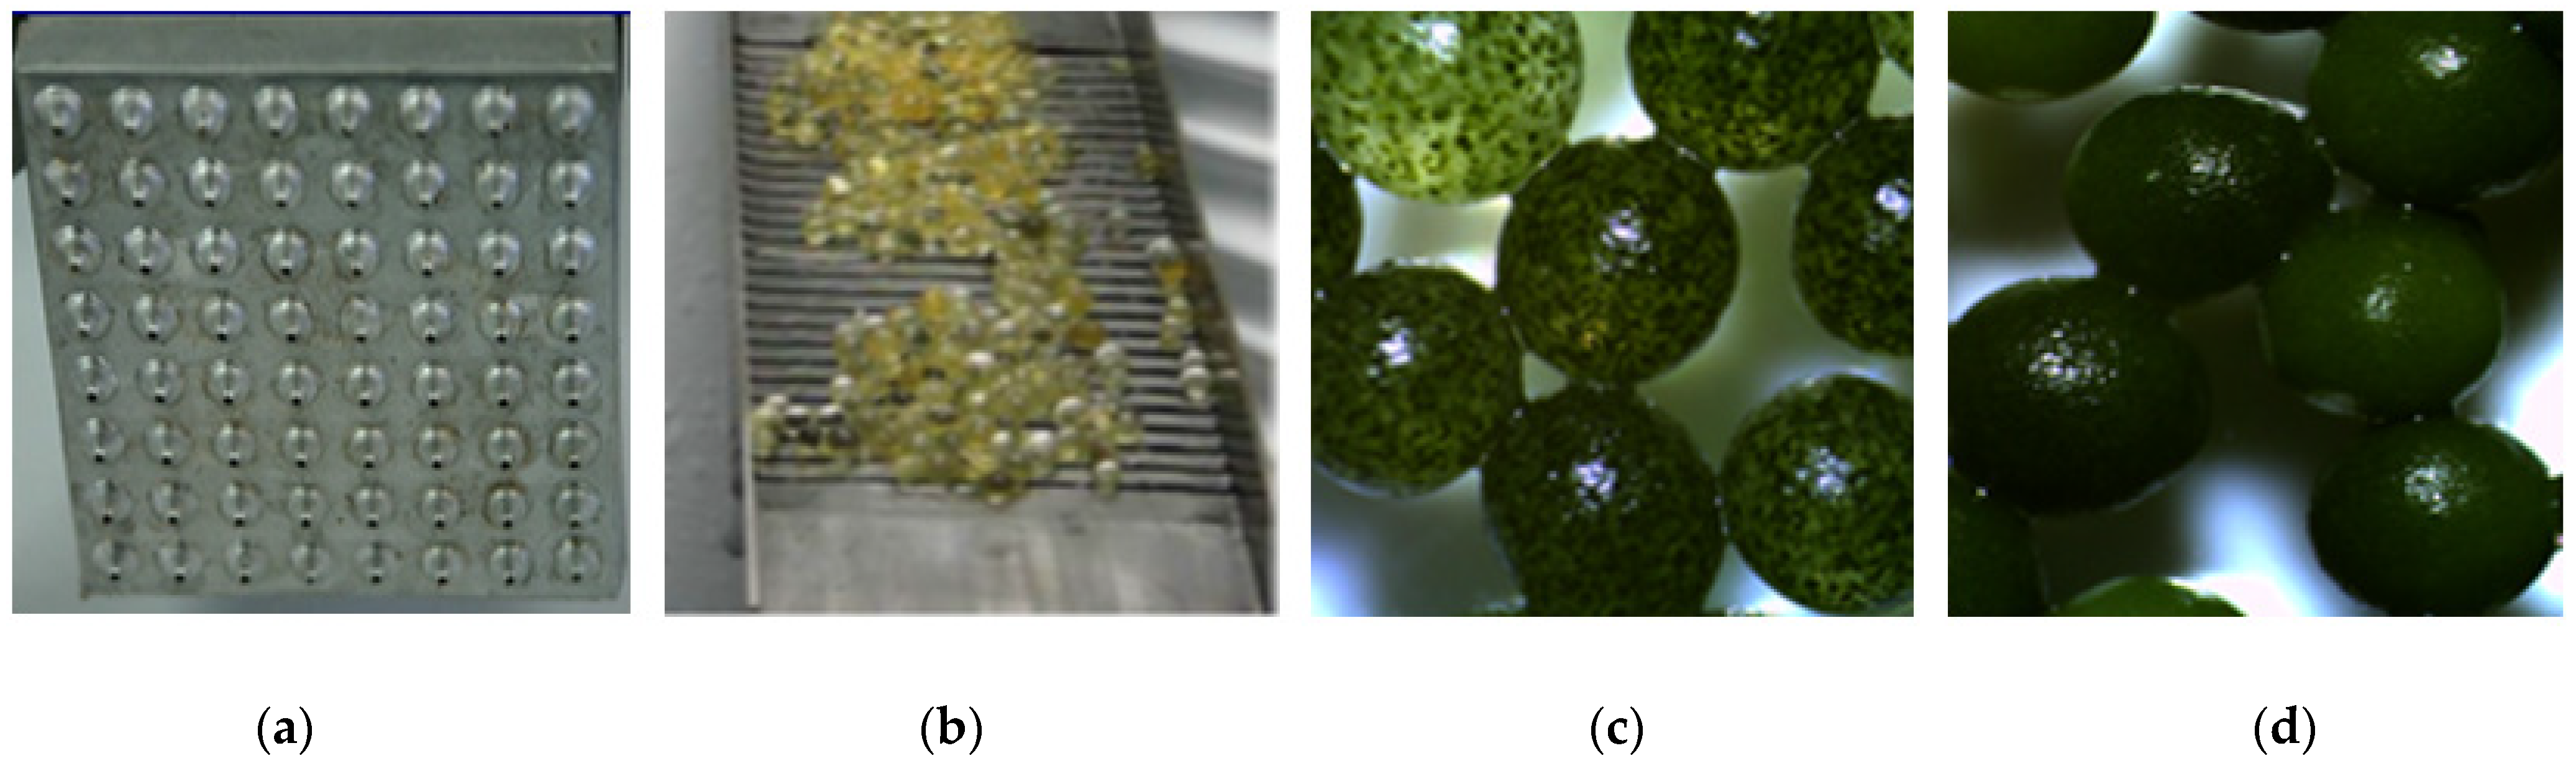
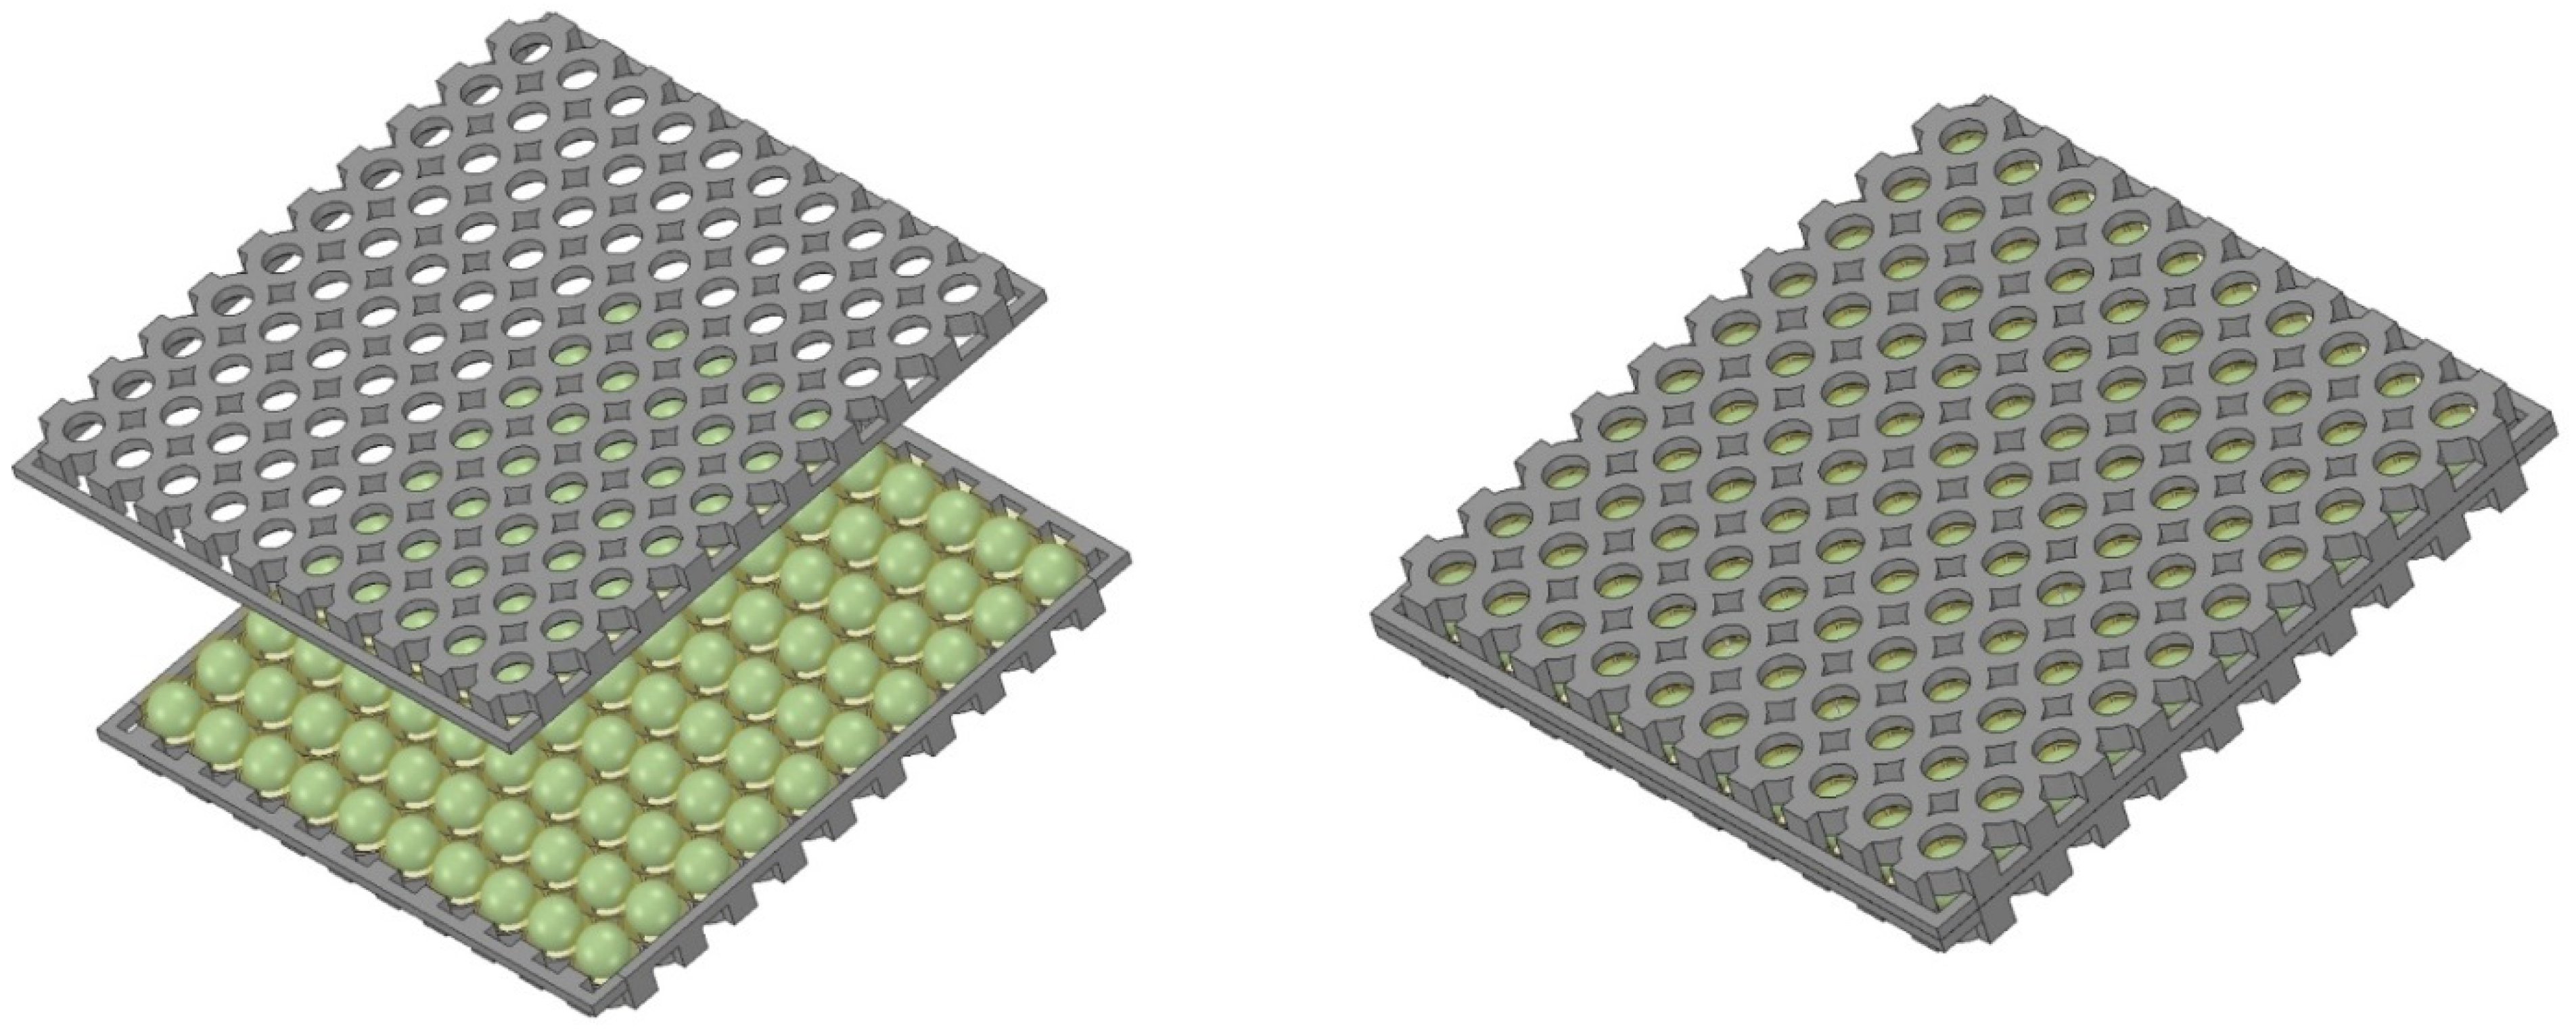
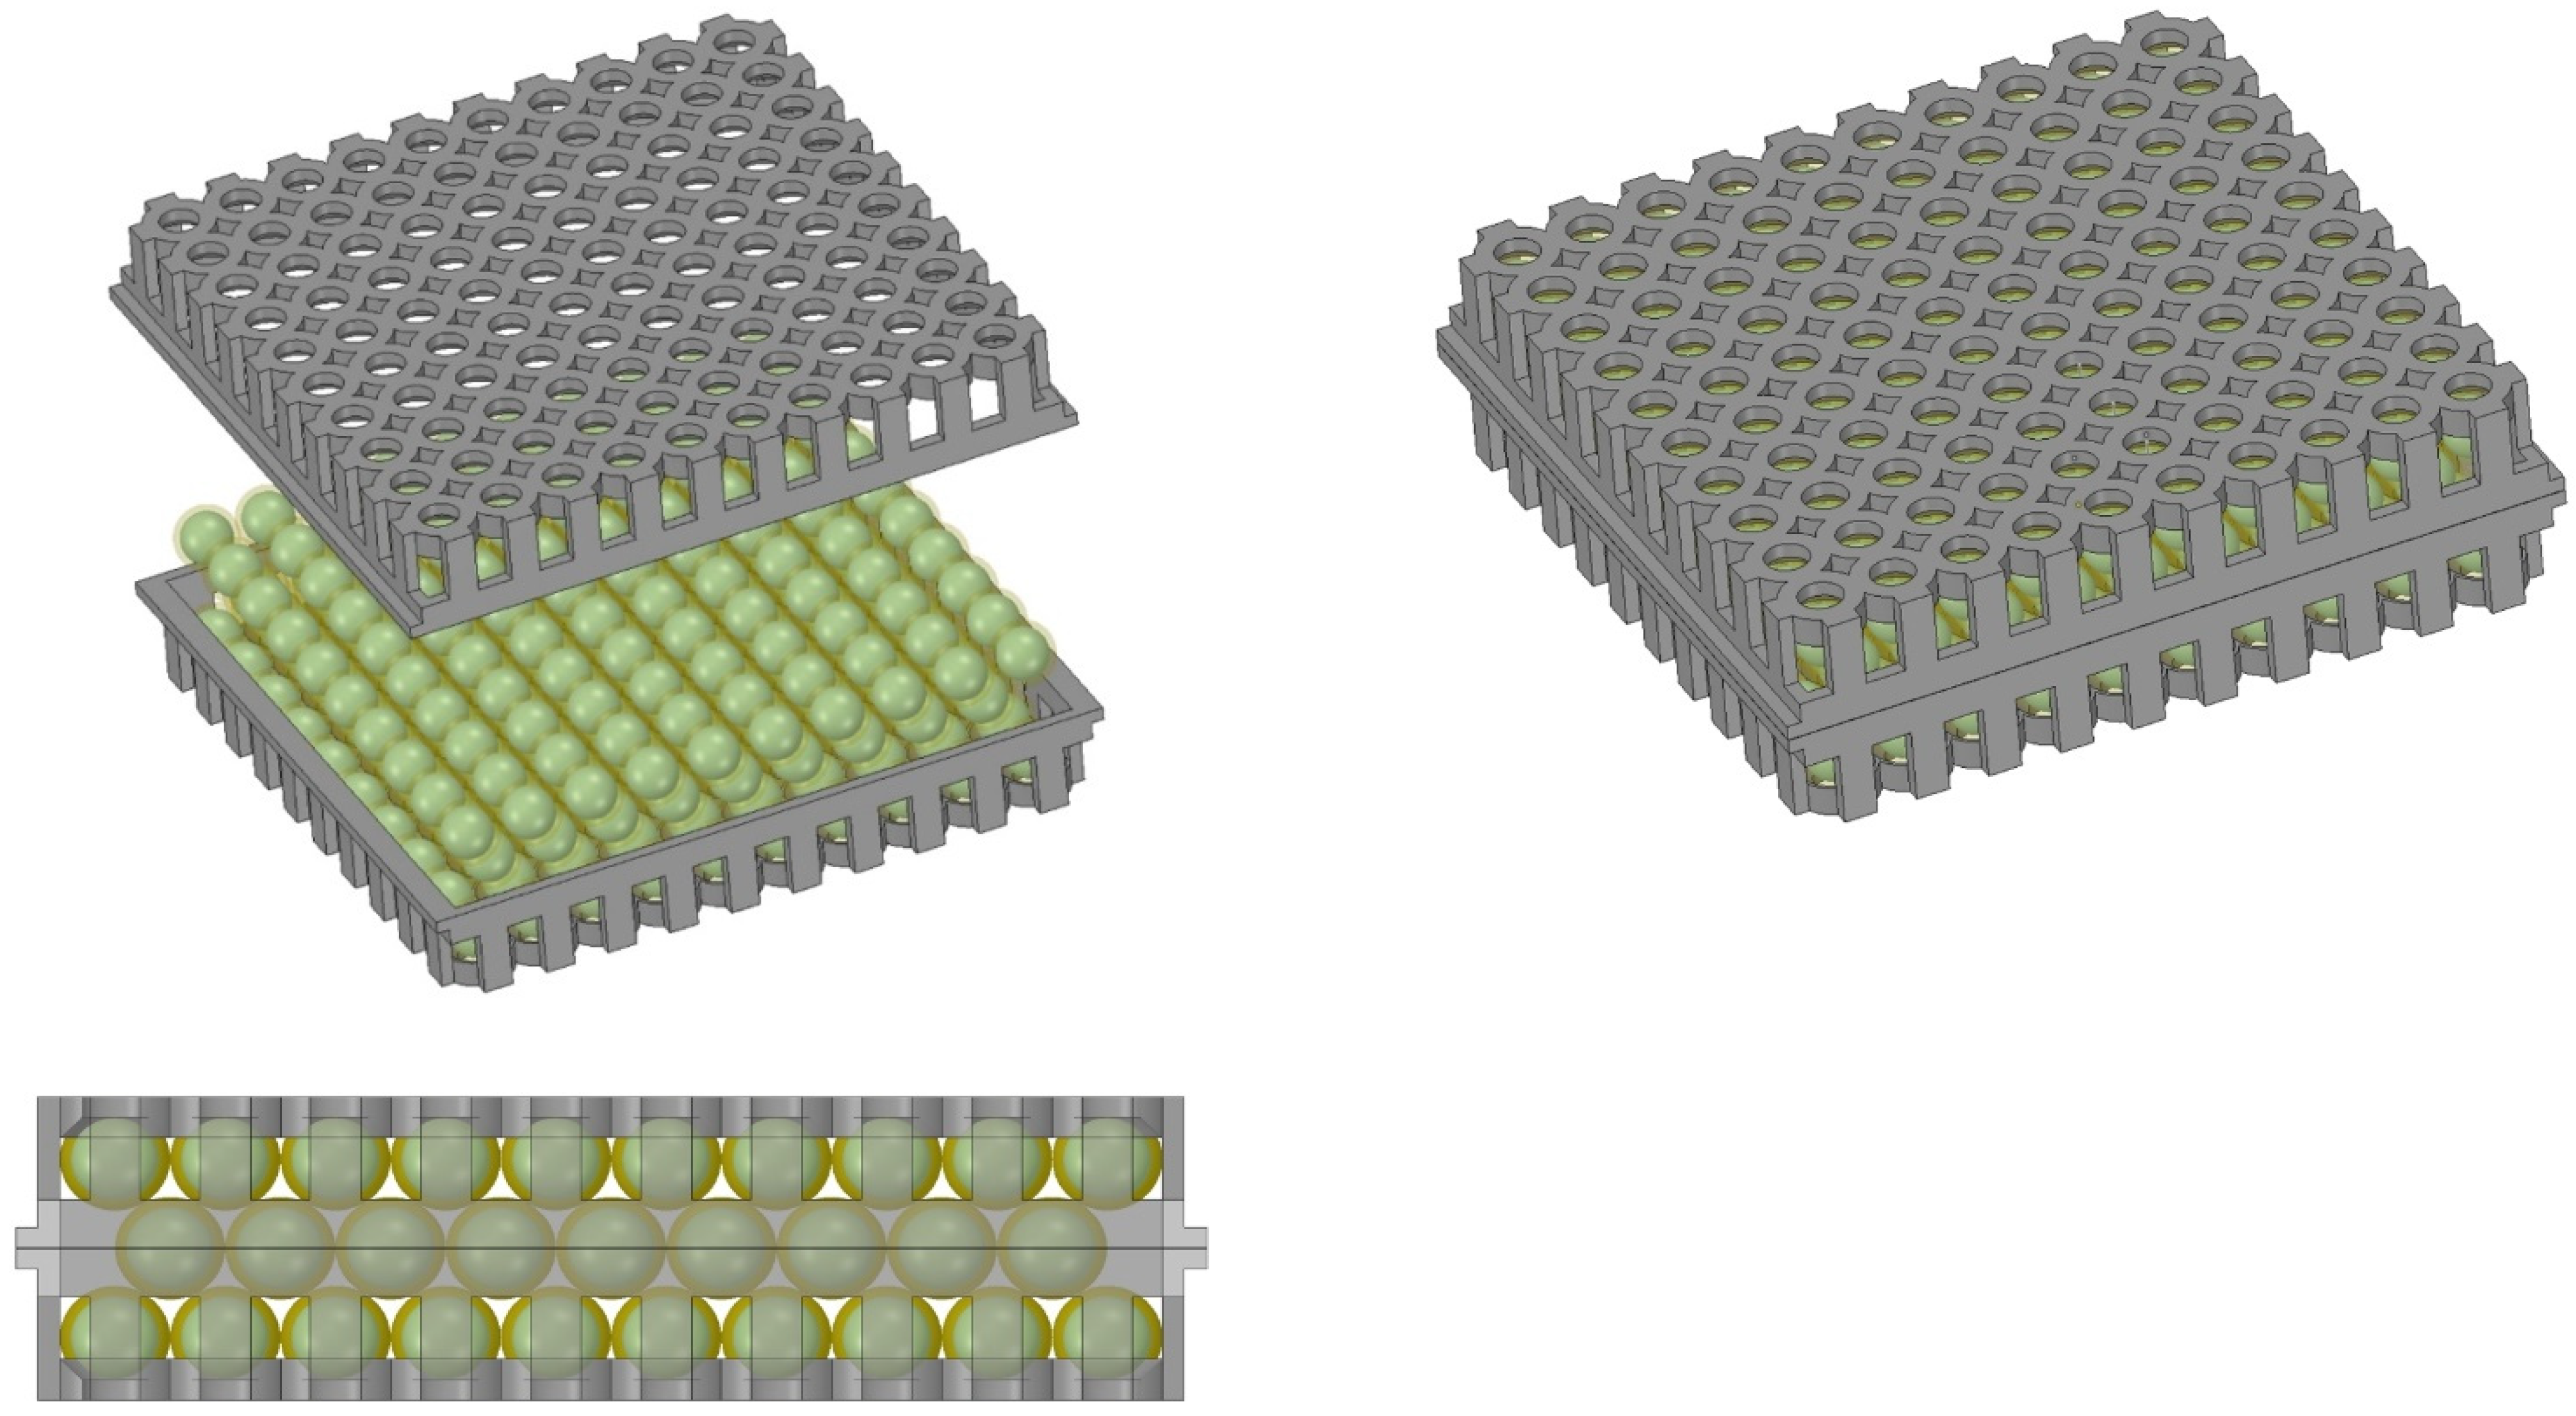
4.2. Immobilization of Biomass Using Hydrogel Encapsulation
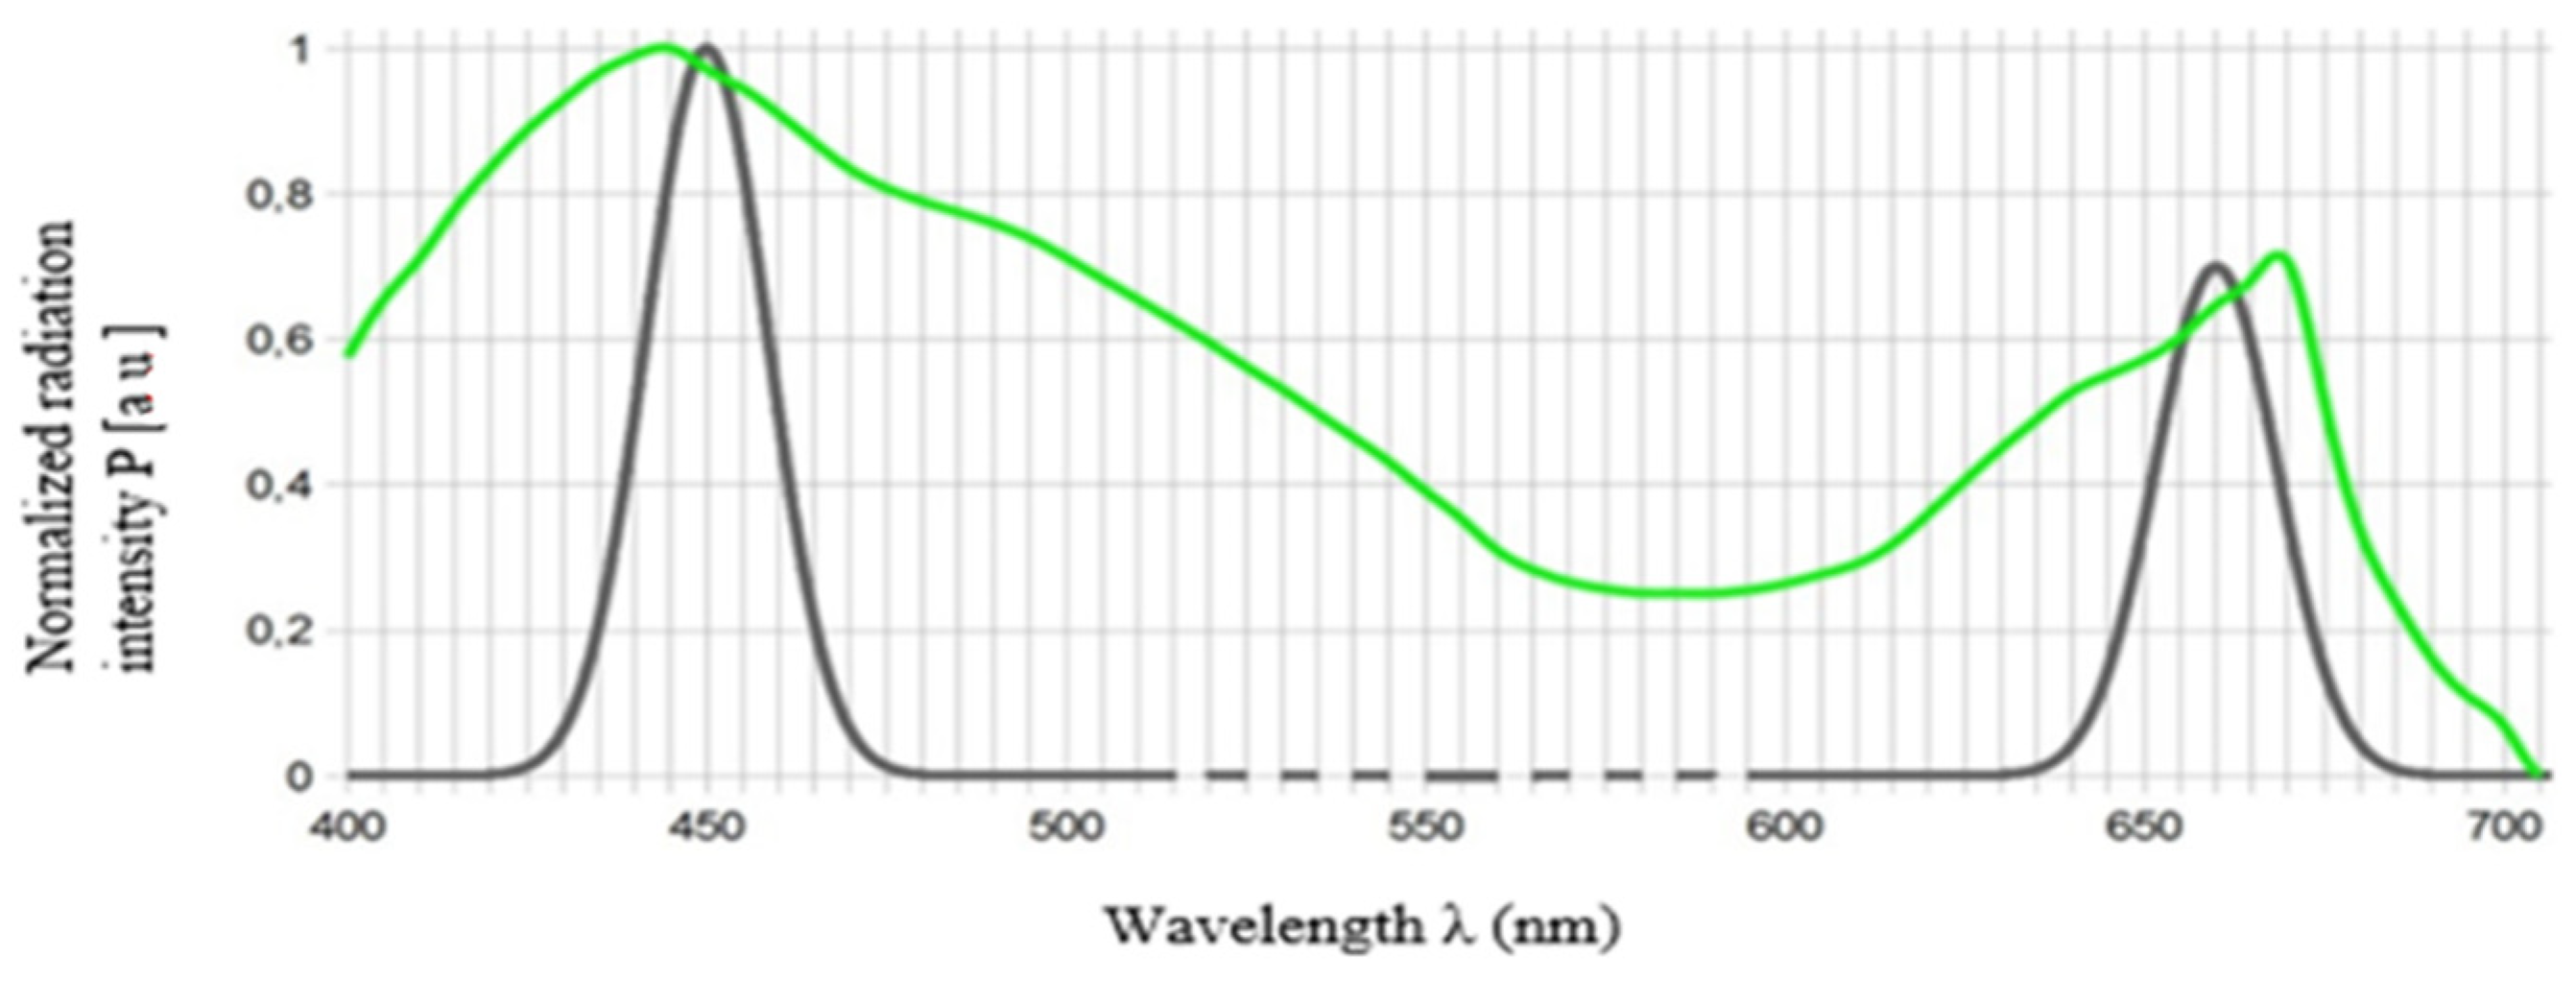
Microalgae can be immobilized via one of the two methods of encapsulation. One is to mix the concentrated microalgae with an aqueous solution of the precursor at a ratio that ensures a durable gel barrier. For sodium alginate, 20 g per 1 kg of H2O is considered to be the optimal concentration. The mixture is added dropwise into a cross-linking solution. The polymer gelates upon contact and forms a capsule whose shape and diameter conforms to the original droplet. The process creates a full hydrogel matrix or, if the hardening process is stopped early, a gel membrane around the core. The second encapsulating method that can be used to enclose microalgae is the process of reverse spherification. It involves mixing microalgae with a crosslinker, then adding the mixture dropwise into an aqueous solution of the gel precursor. Upon contact of the two solutions, the precursor gelates around the microorganism-containing droplet. Both methods produce porous capsule shells that entrap the microalgae. From a practical standpoint, producing membranes by adding drops of a crosslinker into a biopolymer gel precursor offers superior adaptability in terms of controlling the final capsule size and otherwise modifying the capsule. A scheme of an encapsulation unit that works according to this principle is presented in Figure 3.
The production process includes the following steps: preparation of the biopolymer solution in the tank (1), preparation of the crosslinker solution in the tank (3), and mixing the biopolymer solution together with microalgal biomass supplied from the tank (2) in the mixer (4). The resultant biopolymer-biomass mixture is then used to fill the matrices in the formation unit (6), which is where the gelation takes place. In the formation unit, the crosslinker is circulated in a system with the buffer tank (5). The capsules are periodically removed with sieves (Figure 4).
Microalgae immobilization is a function of multiple process parameters, including the CO2 concentration in the flue gas, type of illumination, medium pH, and hydraulic parameters. The substances used in this process must be non-toxic to the cells being immobilized, be capable of gelating under mild conditions (including at suitable temperature/pH and with non-toxic reagents), and possess adequate mechanical characteristics. The polymer usually used for entrapment is sodium alginate, a linear copolymer composed of two types of monomers: Q-D-mannuronate and V-L-guluronate (G), derived from brown seaweeds. Other chemicals that can be used to entrap active substances include kappa carrageenan, chitosan, agar, pectin, epoxy resins, and polyacrylamide. In the presence of divalent cations, alginate acid forms a porous gel, which can be used to obtain high concentrations of biomass in the carrier. Alginate gel provides excellent protection from environmental stresses for the microalgal cells. The porosity of the shell and its permeability to nutrients make alginate acid a strong contender as an encapsulation material. When utilizing sodium alginate gelation in the presence of calcium ions, larger-sized capsules can be obtained by pouring the biomass-sodium alginate mixture into pre-made molds of any required shape. The material placed in the molds should then be introduced into the crosslinking solution at the appropriate concentration.
The stability of the gel capsule is a function of its size, shape, the thickness of the gel membrane, and the size of the pores (which allow the microalgae immobilized within to directly interact with the environment). Spherical or elliptical microcapsules with a specific size of 10 to 20 mm should provide sufficient packing density in the structural bed of the column through which CO2 is passed. The porosity of the gel is determined by the concentration of the gel precursor and salts used to form the gel membranes. The porosity of the gel can also be increased by adding crystalline substances to the gel precursor at the dissolution stage, then rinsing them out of the final capsules after the cross-linking stage. These crystalline substances can be of mineral origin, such as sodium chloride or other easily soluble salts, or of natural origin, e.g., powder carbohydrates with a suitable particle size.

4.3. Light Source

Sunlight is the optimal light source for microalgae culture, but solar exposure is limited to daytime. The light requirements for microalgae are somewhat lower than for other plants. Chlorella vulgaris grows well at illumination levels as low as 50–100 W/m2, which corresponds to a PAR range of 232 to 465 µmol·m−2·s−1 (or 13,000–26,000 lux in photometric units). To reduce operational costs, we will assume an average illumination of 250 µmol·m−2·s−1 for this analysis.
The technology of daylighting has been greatly improved in recent years, and now incorporates newest optic-fiber systems. Therefore, we propose integrating this technology with IMC-CO2PBR. As most systems for extensive CO2 fixation are designed for continuous operation and because sunlight is only available during the day, we posit a hybrid system that incorporates LED diodes. LEDs are currently manufactured in the power range of 0.02 to 10 W and beyond. Figure 5 presents the illumination system suggested for the IMC-CO2PBR, which consists of LHCP7P (red) and LDCQ7P (blue) LEDs manufactured by OSRAM, with the overlaid light absorption curve plotted for the microalgae [78].

4.4. Size and Weight Analysis for the Photobioreactor Module

The IMC-CO2PBR is envisaged to be fully configurable for different operational conditions. Therefore, it is essential that the system is designed with modularity in mind. The design should accommodate technological and functional capabilities regarding module transport and storage. The size of the module was considered as a primary factor, as it determines its weight and dimensions. The capsules are intended to be 5 to 40 mm in diameter. The per-module weights for selected capsule loads (assuming 1.1 g/cm3 average algal density) are presented in Table 4.
We assumed a rectangular module with a single layer of capsules would be the easiest to analyze, with the dimensions given in Table 5 for different capsule loads and diameters.
The data suggest that a module containing 10,000 15-mm capsules is the best choice from a design and operation standpoint. At 20 kg, the module can be handled manually. Because the IMC-CO2PBR includes microalgae-containing capsules with optic-fiber cables inserted, the capsules should be firmly secured in place. Ultimately, we chose plastic bins with dedicated slots for capsules and guides for the fiber-optic cables. Modules can be built to be single layer (Figure 6) or three layer (Figure 7), among other options.
As given in Table 3 and Table 4, a single-layer module is 1500 × 1500 × 30mm and 20 kg. As these dimensions would make the module susceptible to mechanical strain, the three-layer module will be a preferable choice. Assuming a 59 × 59 capsule layout in layers 1 and 3, and 58 × 58 in layer 2, there will be 10,326 capsules in total. The module will be 900 × 900 × 70 mm, thus providing better rigidity and ease of transport. The design can also be adapted to support more layers if the operating assumptions so dictate.

4.5. Analysis of Solar Energy Requirements

For the analysis, the PAR photosynthetically active radiation) for microalgae was assumed to be 250 µmol·m−2·s−1. Using this assumption, illumination was determined for 1m2 of area filled with capsules of diameter d. The active surface of an illuminated capsule was defined as the axial cross-sectional area of a capsule set parallel to the 1 m2 surface. Assuming a single layer of capsules laid down on a square surface, we can calculate the active surface exposed to photons. The surface area of the square S=a2, active surface area of the capsules Sa=n·πd2/4 = (a2/d2), and πd2/4 = a2·π/4; hence, the area ratio Sa/S = π/4 is approximately 0.785 (S, area of a square panel in which capsules with micro algae are placed m2; Sa, active area of the capsule m2; a, side length of the square m; n, number of capsules pcs.; d, diameter of a single capsule m2).The algae will absorb 78.5% of the photon energy out of the total available radiation.
Assuming that the radiation quanta can be expressed as n = фN(λ) (mol)·NA, where фN(λ) is the photon flux in moles and NA is the Avogadro constant 6.022 × 10²³ mol−1, we can calculate the number of light quanta at the assumed illumination 250 µmol·m−2·s−1 expressed in PAR. We found that n = 1.51 × 10²⁰ light quanta per m2 per s. Out of these total photons, 78.5% will reach the capsule, which translates to an effective photon flux of 1.185 × 10²⁰ photons. Converting this value into 1 mm2, we find there are 1.185×10¹⁴ photons per 1 mm2 axial cross-sectional area of the capsule. To calculate the solar energy requirement, we used the approximate graphical integration method according to the definition of the definite integral, using the photon energy relation (Planck’s law). For sunlight, the photon energy per 1 mm2 amounts to 42 × 10–6 W·s/mm2. Drawing upon these assumptions, the solar energy requirement per one capsule for different capsule diameters, as well as the total energy requirement for selected capsule loads and diameters are given in Table 6.

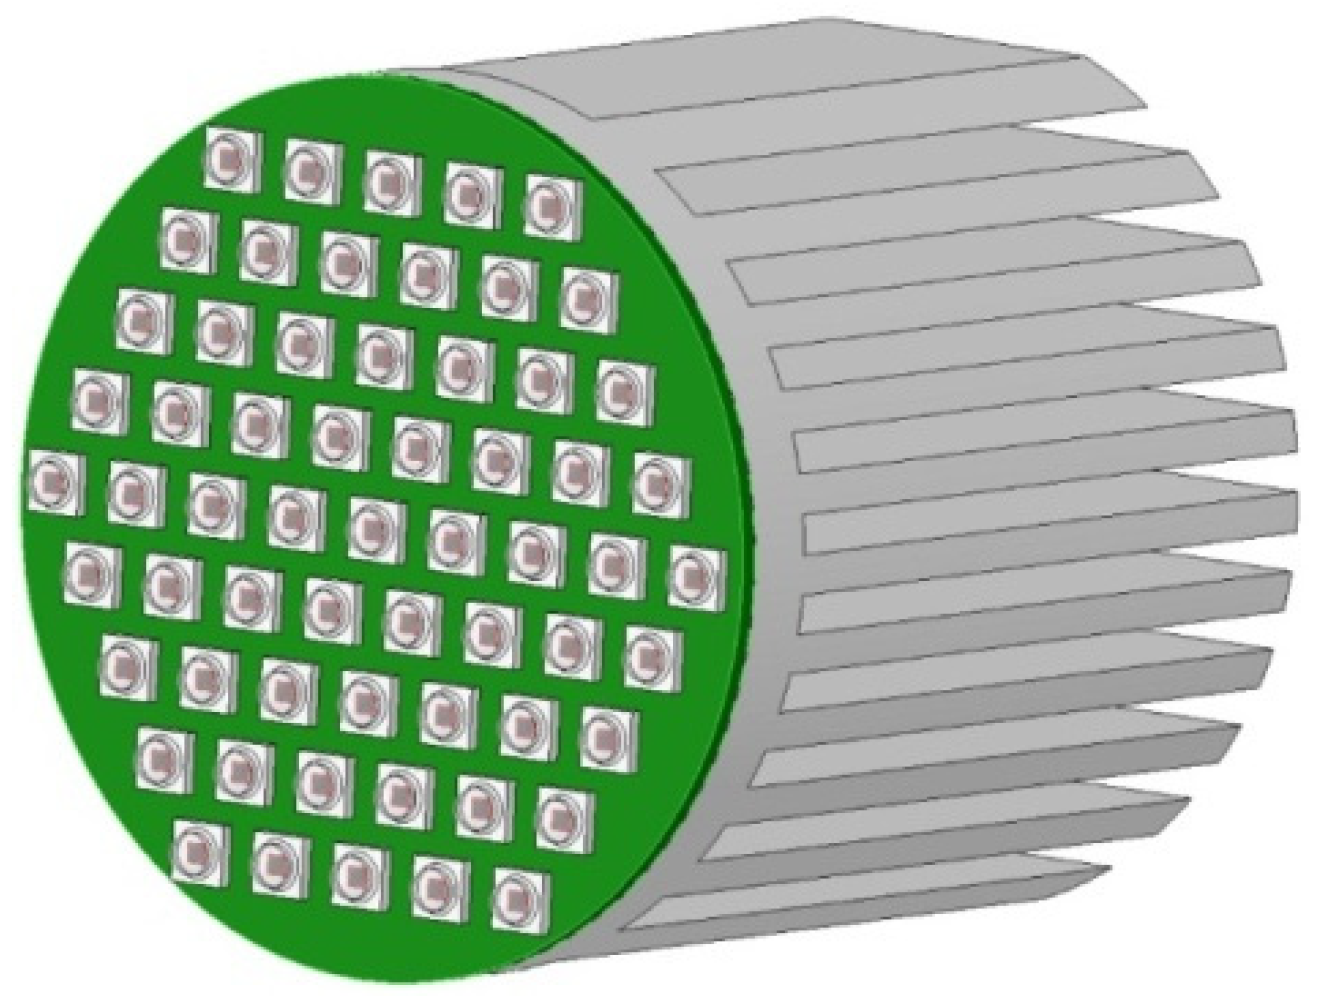
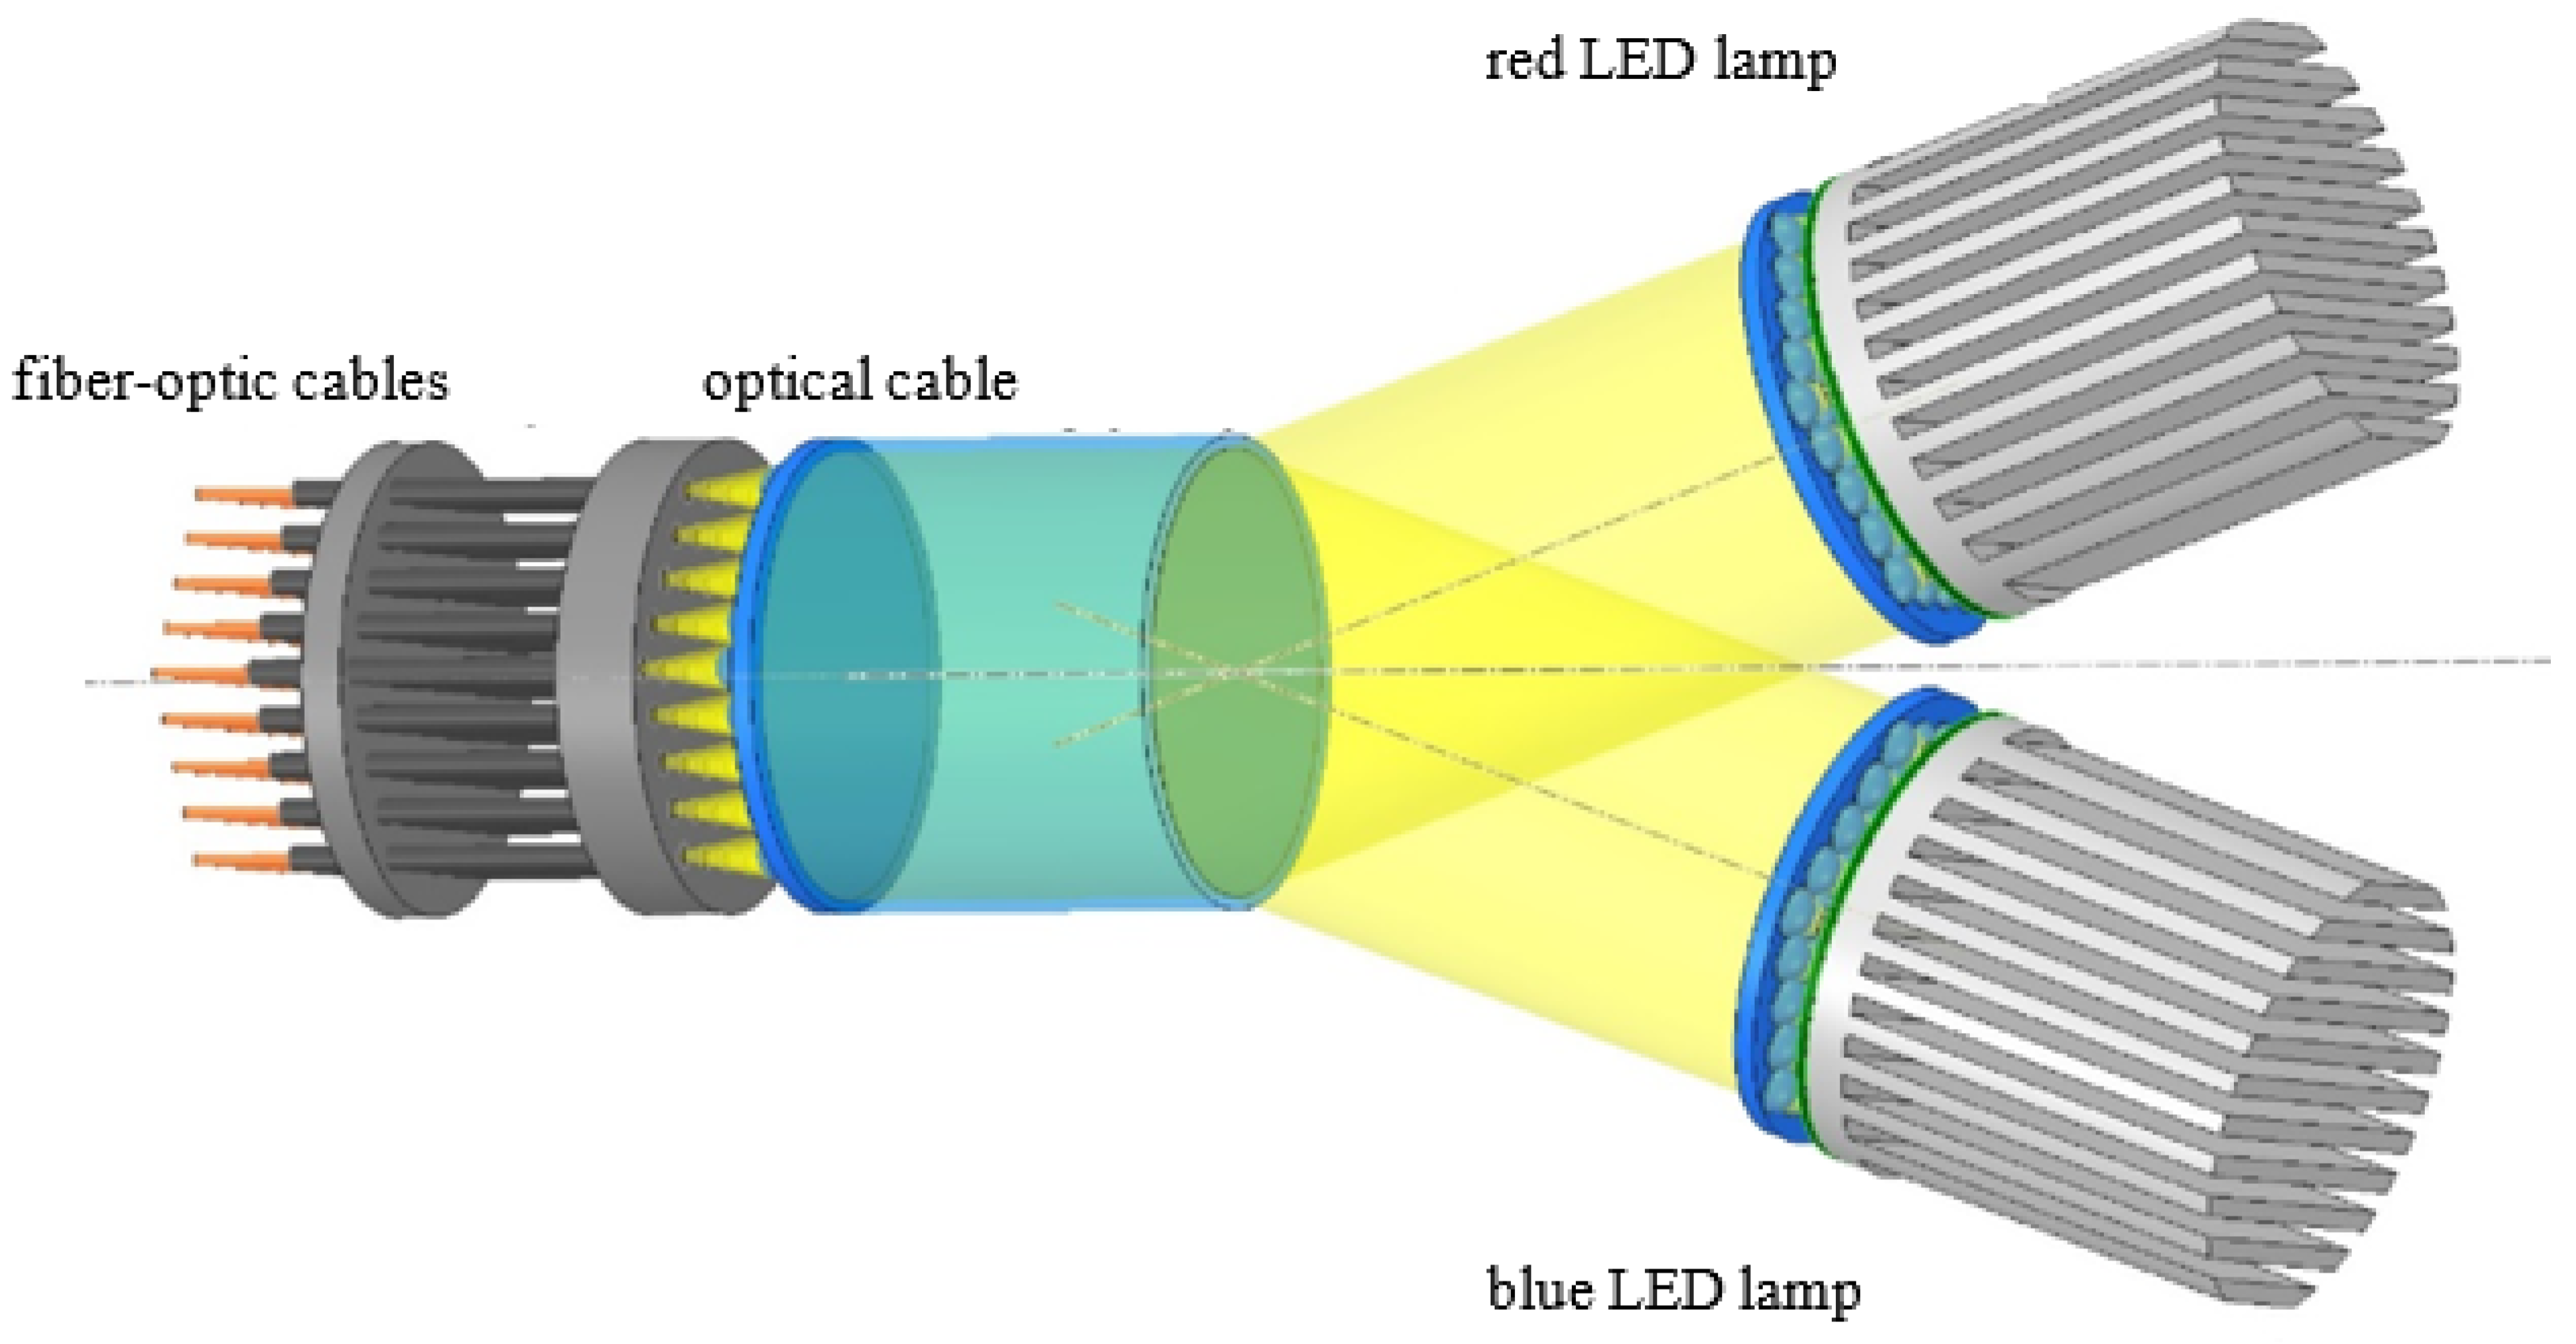
4.6. Red (660 nm) and Blue (450 nm) LED Light Requirements

The number of actually absorbed photons was calculated by transposing the Lorenzen, Morel absorption spectrum, and sunlight spectrum, then normalizing them against the maximum. Using graphical integration, as before, we found that 1 mm2 will absorb 0.6162 × 10¹⁴ photons from 1.185 × 10¹⁴ of sunlight. As such, we posit that the LED lamps should provide, at minimum, the same production rate of photons. Using the spectral characteristics of the LEDs (red LHCP7P and blue LDCQ7P LEDs manufactured by OSRAM) and assuming a red-to-blue light ratio as per the Lorenzen curve, Morel: 0.89, we found that the total energy requirement is approximately 22.7 × 10⁻⁶ W·s/mm2. Dividing this value between the two LED types, the photon flux levels for the blue light (450 nm) and red light (660 nm) are 3.26 × 10¹³/mm2 and 2.90 × 10¹³/mm2, respectively. Hence, the light requirements are 14.1 × 10⁻⁶ W·s/mm2 for blue light and 8.9 × 10⁻⁶ W·s/mm2 for red light. The red and blue light requirement per one capsule for different capsule diameters, as well as the total red/blue light energy requirements for selected capsule loads and diameters are given in Table 7 and Table 8.

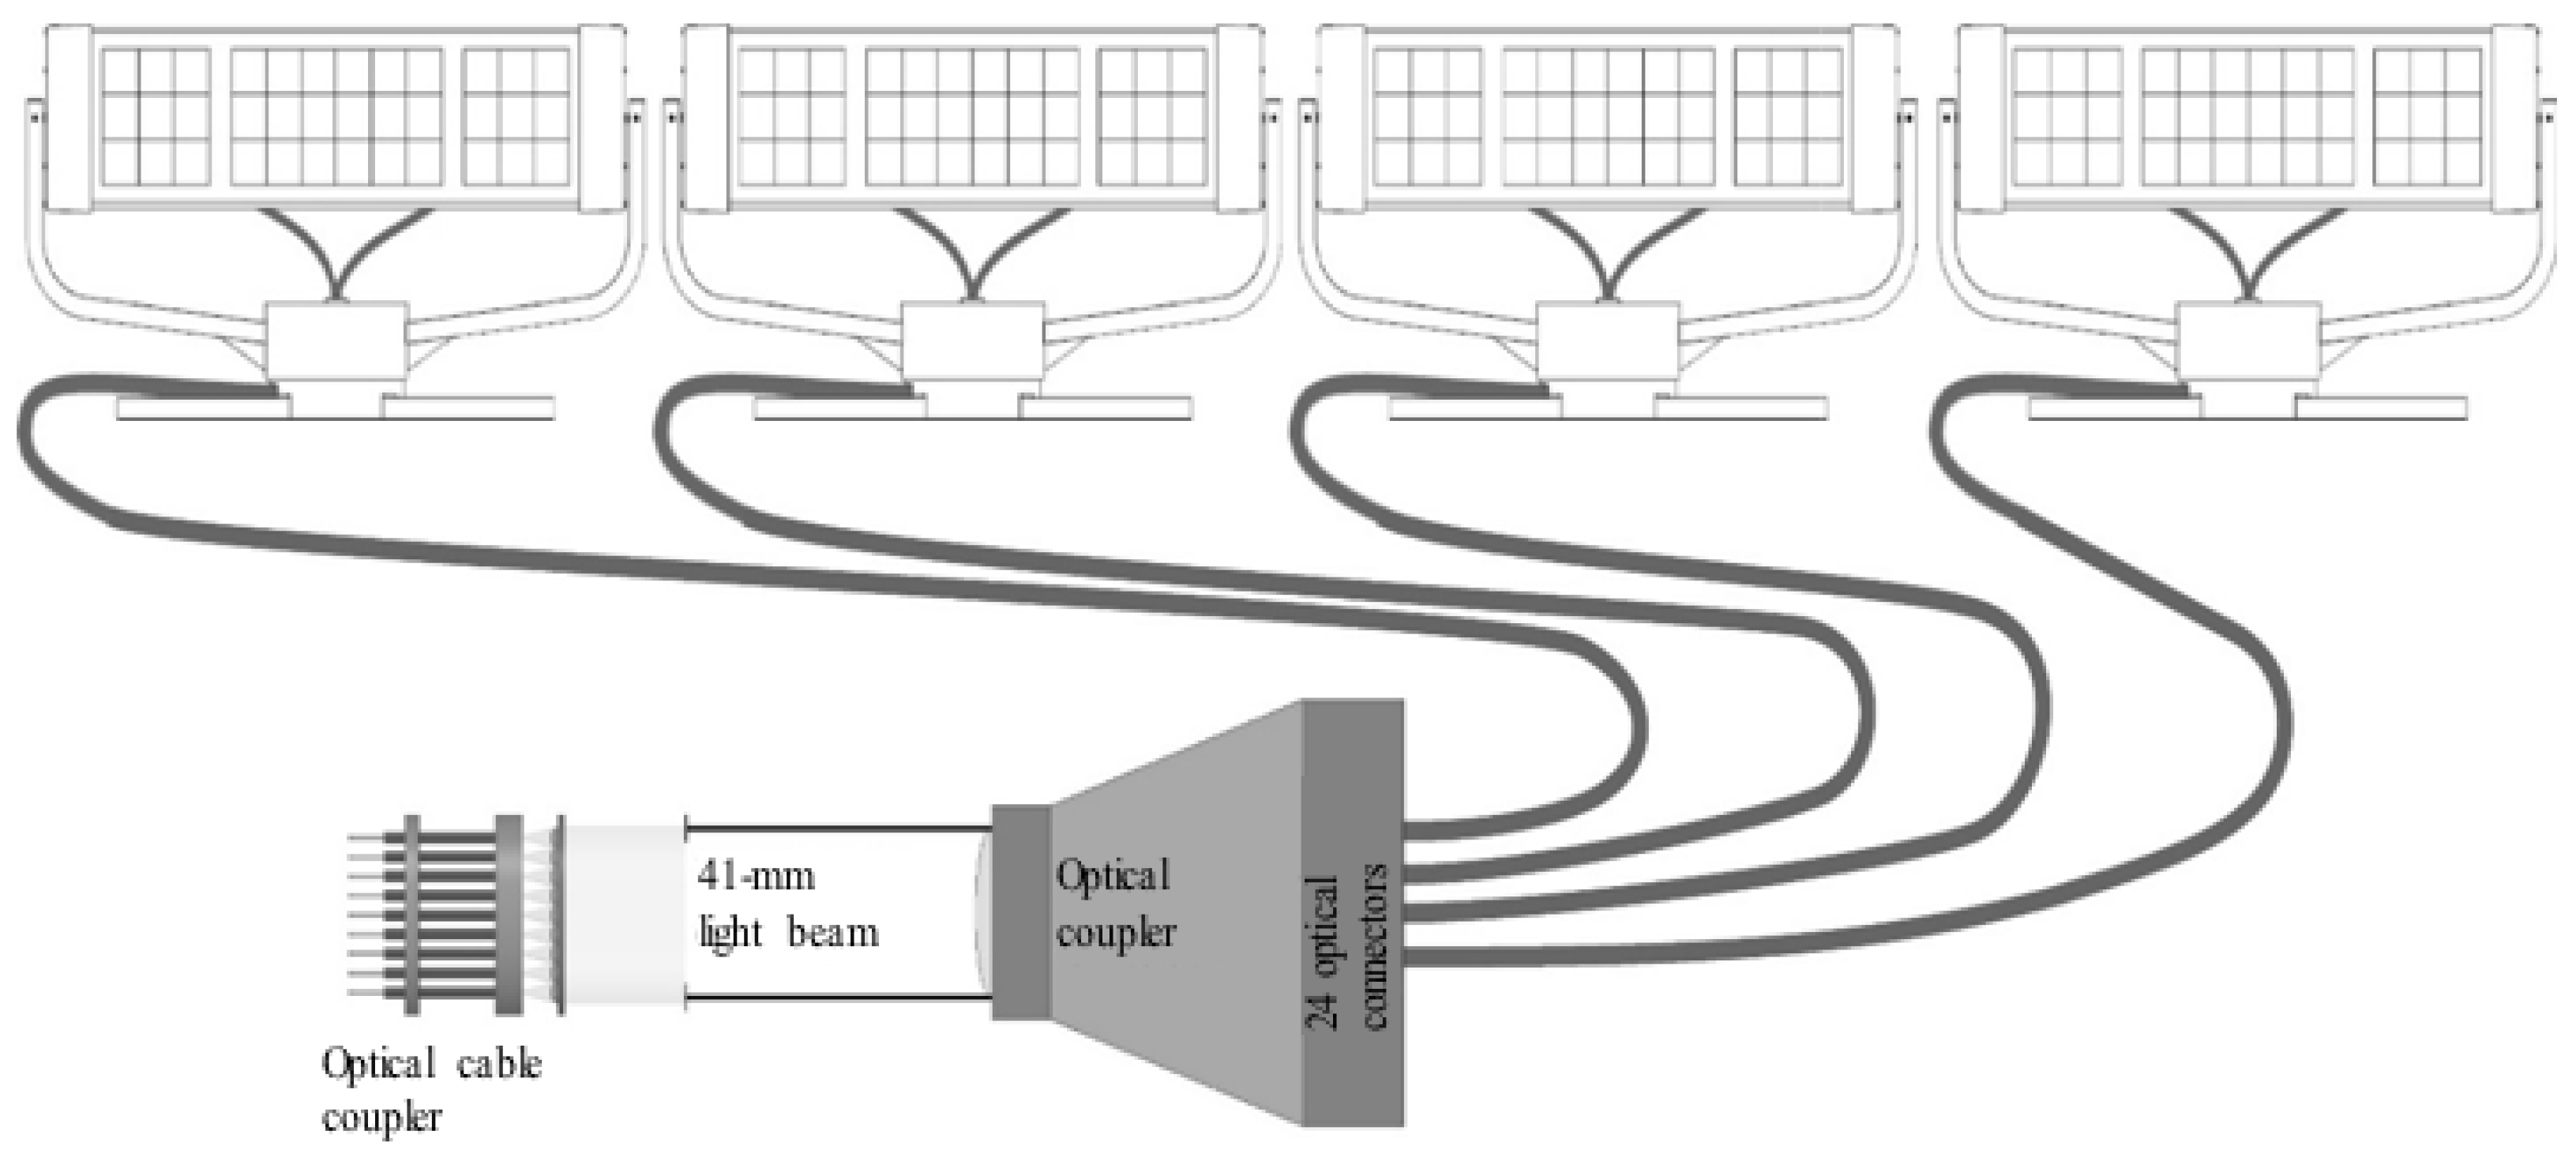
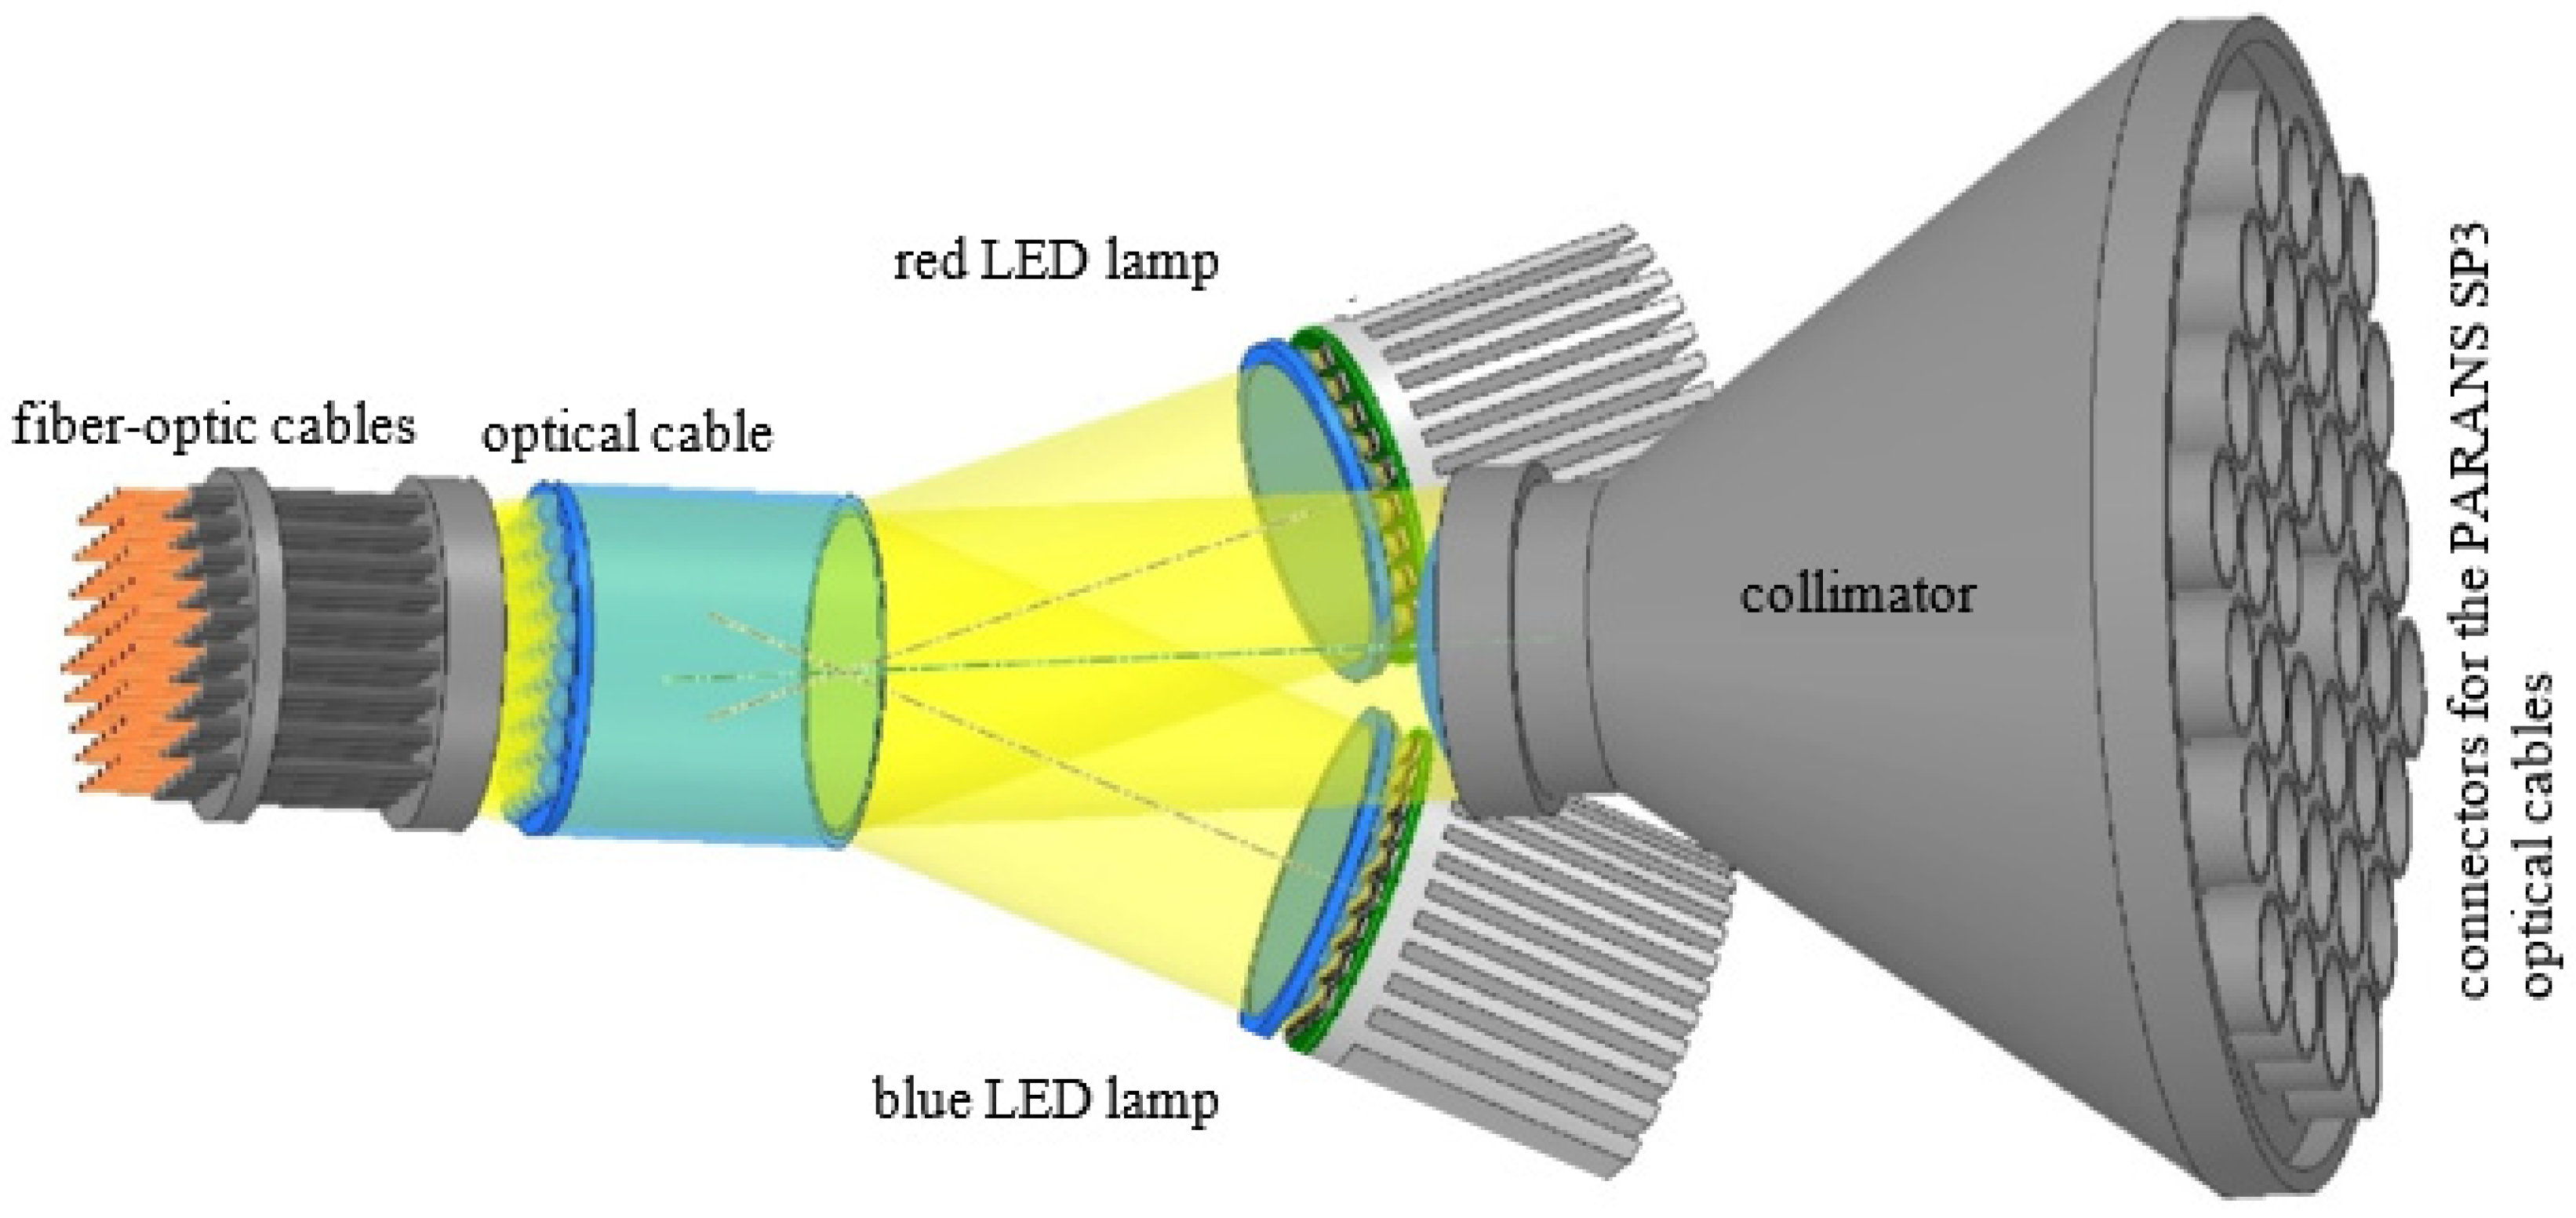
4.7. Supplying Sunlight to the Capsules

Advances in fiber optics led to the development of visible light transmission technology referred to as daylighting, which uses fiber-optic cables and can be utilized to supply light to an IMC-CO2PBR. For the present analysis, we used a daylighting system developed and mass manufactured by PARANS, a company headquartered in Göteborg, Sweden (http://www.parans.com/eng/, accessed on 10 August 2021). The system consists of solar collectors that capture sunlight and transmit it to optical fibers. The sunlight, with the UV and IR radiation filtered out, is transmitted to special diffuser components as a replacement for traditional lamps. The company’s offer also includes spotlights, which can be used to supply the capsules with sunlight using a coupling system.
For adequate illumination, a single module containing approximately 10,000 15-mm capsules require approximately 74 Ws of solar energy (Table 5), which corresponds to approximately 19,400 lm. According to the manufacturer’s specifications, a single collector has a 5500 lm capacity, which means that at least 4 collectors are needed for one module. A diagram of connections between the system and the optic-fiber cable array is shown in Figure 8. The collectors are fully automated and include a tracking system with a near 360o range of movement, ensuring optimal positioning relative to the sun at all times. The system is very efficient and suitable for the cultivation of encapsulated microalgae. However, a system supplied exclusively with sunlight can only biosequester CO2 during the day. PBRs operating 24/7 thus require additional artificial lighting.

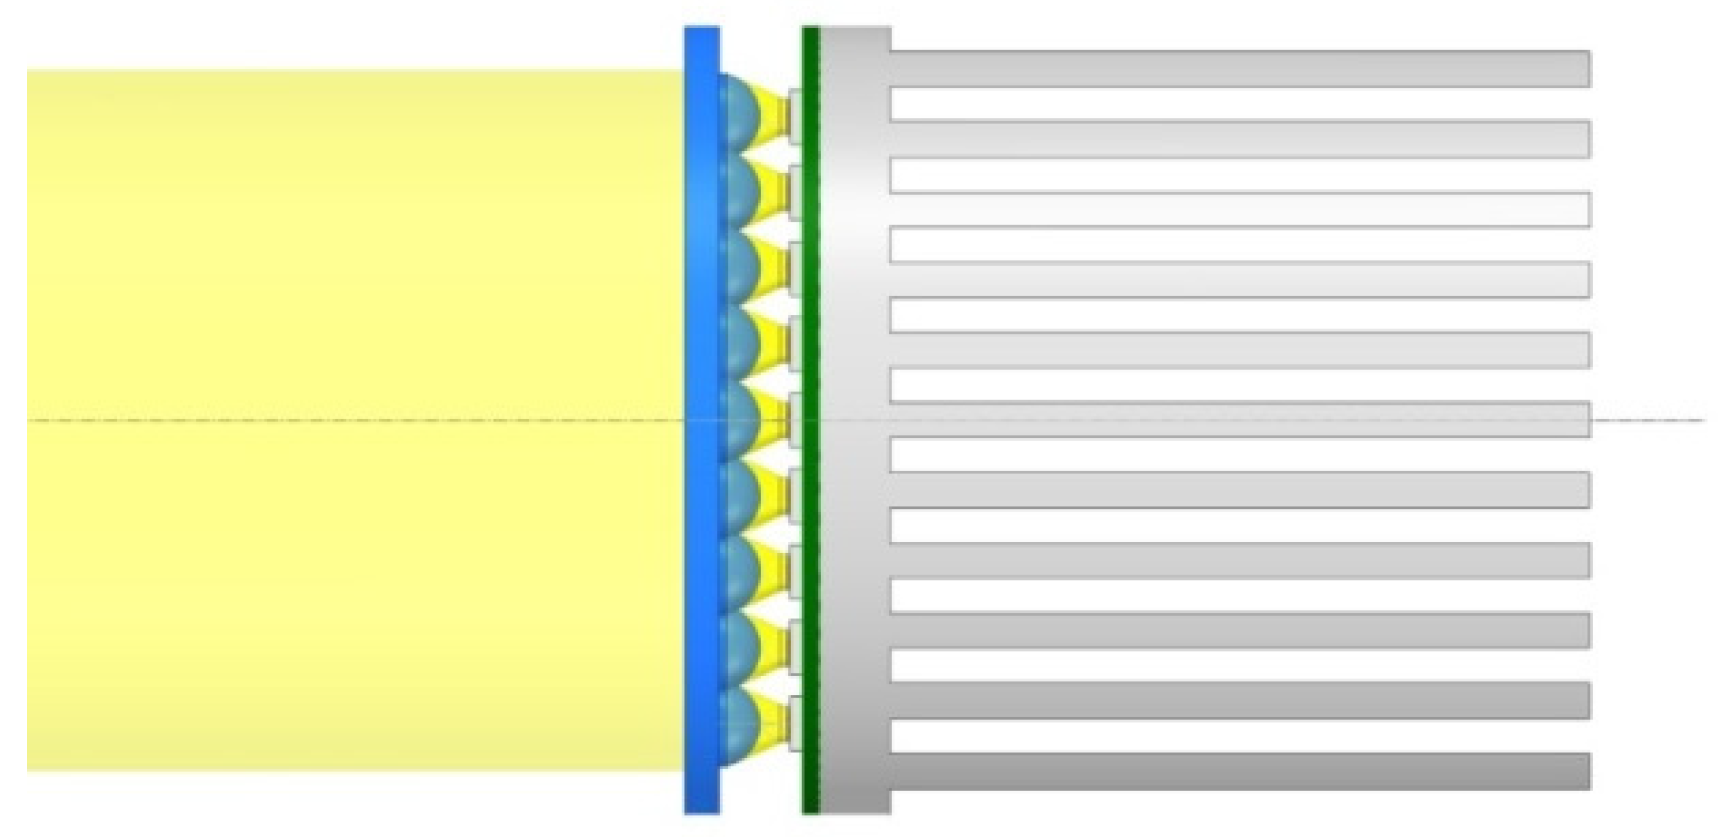
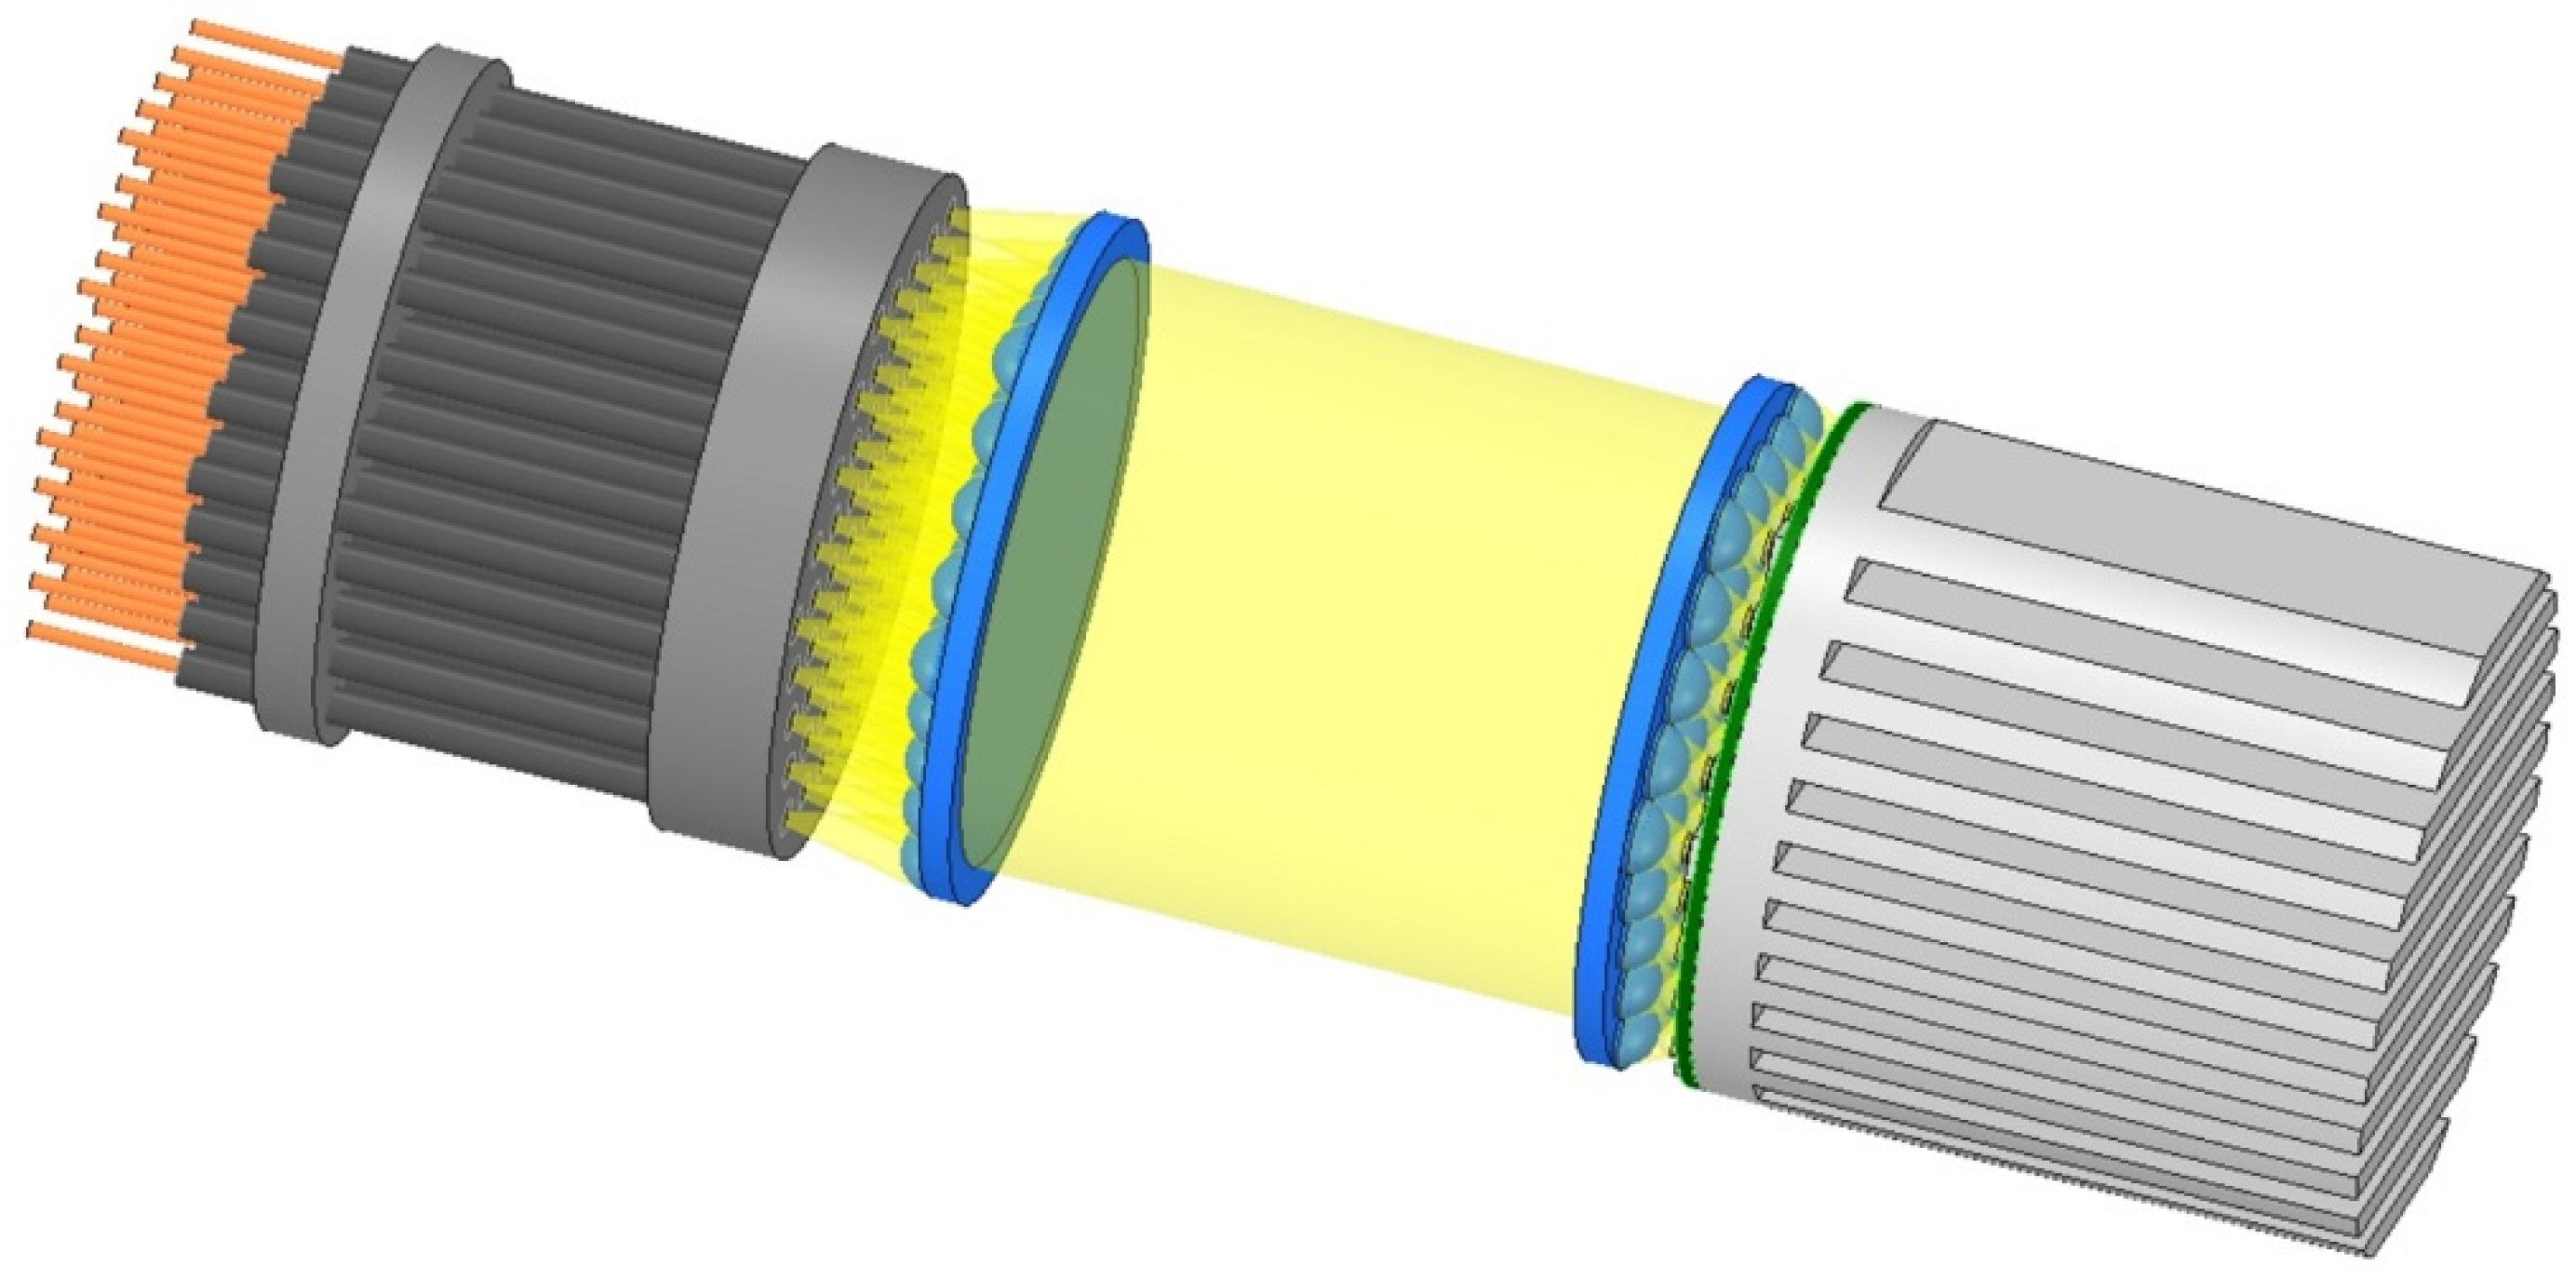
4.8. Supplying LED Light to the Capsules

In response to the large demand for LED illumination systems for plant cultivation, LED manufacturers have filled the niche of LEDs spectrally optimized for growing plants. OSRAM has marketed LEDs that are very well suited to the light preferences of plants: LHCP7P (red) and LDCQ7P (blue). These LEDs can be used to build a compact LED lamp with high luminous efficacy. An exemplary design for the lamp (sans body) is presented in Figure 9. The LEDs are mounted on a printed circuit board attached to a heat sink to form a fixed-raster array. The LED beam angle is 80o. Therefore, in order to efficiently fiber-couple light, an additional optical system is required to create a uniform parallel beam (collimated light). Microlens technology can be used to that end. A diagram of an exemplary lens array with an LED lamp is presented in Figure 10.
The parallel beam produced by the lenses can be directed into the coupling system shown in Figure 11. With a light energy requirement for the LED of 40 W (Table 6 and Table 7), the LED lamp will be approximately 45 mm in diameter (sans body). The beam should have a diameter of about 40 mm, which perfectly matches the size of the coupling system shown in Figure 11.
In this case, the red light source will consume approximately 39 W of power (15.7 W radiated power, 45% LED efficacy, and 90% power system efficiency). The blue light source will consume approximately 61 W (24.9 W radiated power, 45% LED efficacy, and 90% power system efficiency). The optical system will be slightly more complex, as various colors of light need to be supplied. Mixing light from two different sources requires an expanded optical system. Two collimated light beams can be blended using an optical rod, or any other type of optic cable with a suitable diameter. Optical rods are usually composed of a specific polymer, i.e., polymethyl methacrylate (PMMA). PMMA possesses very high optical transparency and is used to manufacture plastic optical fibers. A scheme of an optical system for illuminating cultured microalgae with two light sources is shown in Figure 12.
This system for illuminating encapsulated algal cultures can work 24/7. It can be used for indoor algae cultivation closed off to sunlight, if economically or climatically reasonable. As noted above, daylighting systems make it possible to efficiently transmit light with the use of existing technologies. Coupling sunlight with artificial lighting, where possible, seems to be a practical approach. It is possible to create a hybrid system (sunlight + artificial lighting) using a currently available technology; an example is presented in Figure 13. Such a hybrid system should be equipped with a suitable automatic control system. Since the amount of sunlight varies wildly throughout the day/year, this control system should measure the intensity of sunlight and, if the solar exposure is insufficient, activate the LED lamps to offset the shortage.
Hybrid systems provide the best CO2 biosequestration performance in terms of energy efficiency. Sunlight is transmitted to the system with virtually no additional energy input, and the tracking systems supplying the solar collectors consume very little power. Despite higher generation costs, this hybrid system design should ultimately prove cheaper to operate.

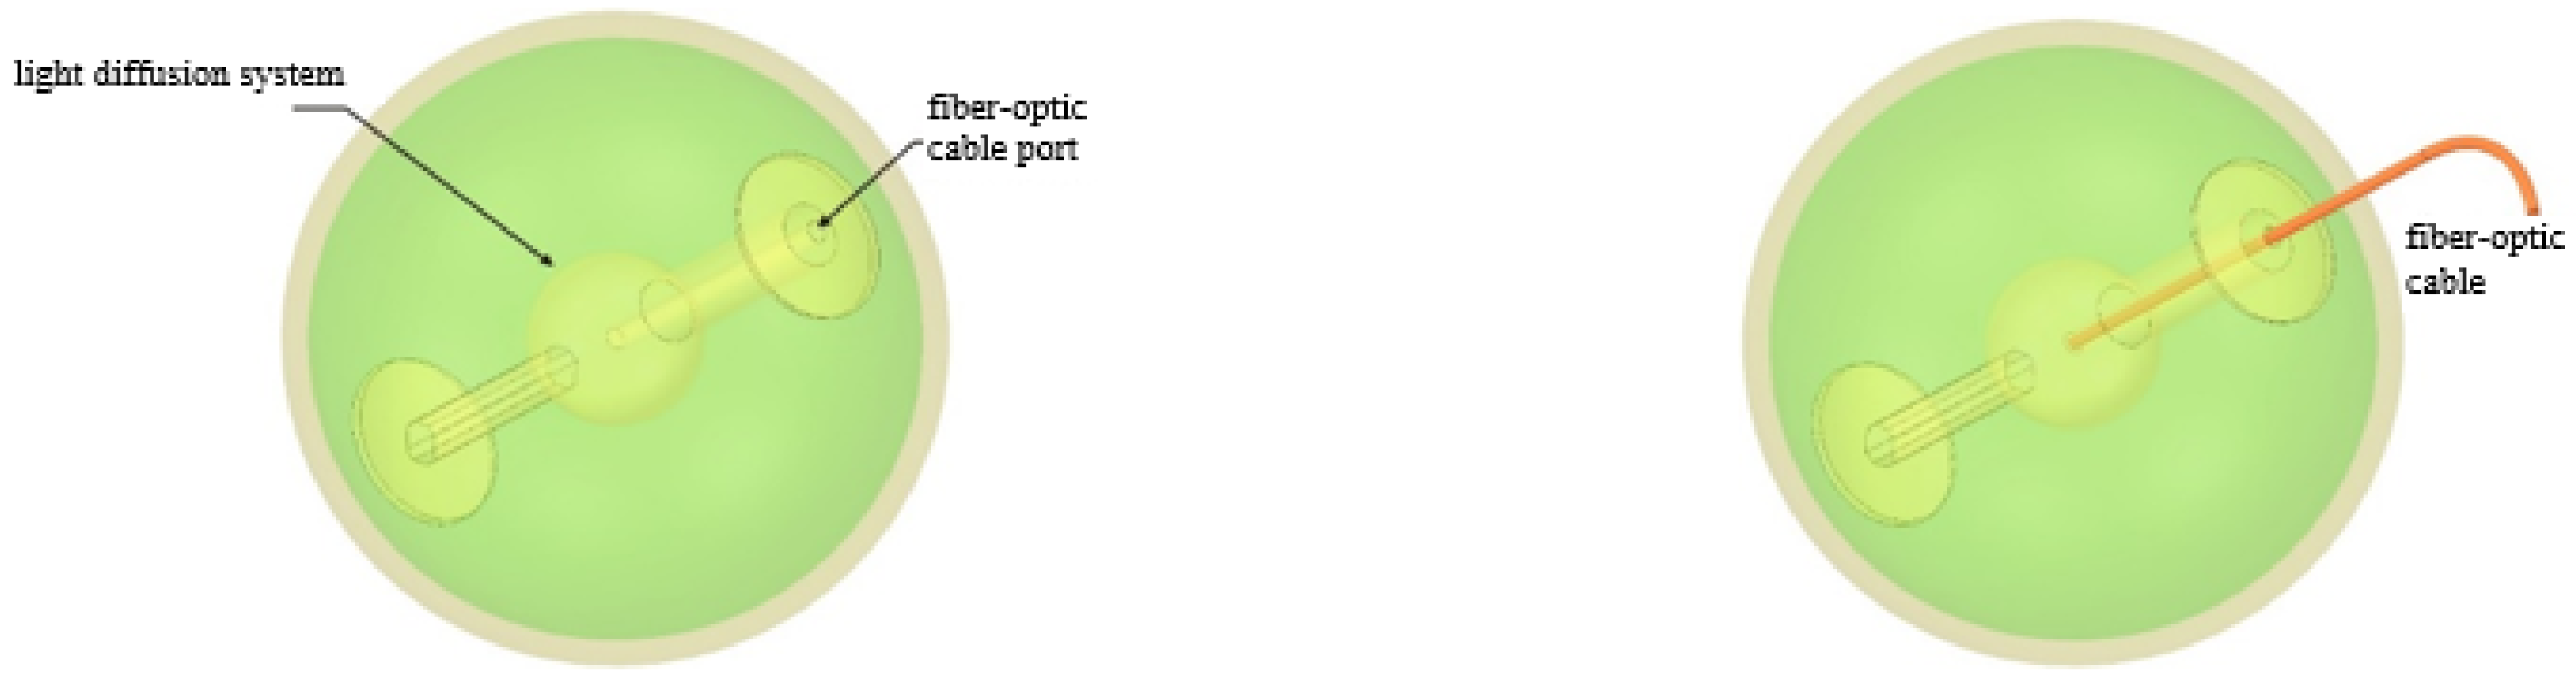
4.9. Fixing the Fiber-Optic Cables within the Capsules

The presented method involves a pre-assembled optical component made of a plastic material with high optical permeability, e.g., polymethyl methacrylate (PMMA), being inserted and permanently fixed in the capsule, with an open port for the cable. This optical system would include a diffuser component, as shown in Figure 14. Using this method, the capsules and the fiber-optic cable array (including the cables themselves) can be produced in separate processes. Fiber-optic cables are cut, run, and fitted (with, for example, high-optical-clarity Masterbond EP30LV-1 epoxy) at the final stage of assembly. The cable can be cut with a special knife during assembly, with no tip adaptation required. If the capsule needs to be replaced for any reason, e.g., due to dead algae, the optical fiber can be re-cut and re-fixed in a new capsule. This method of assembly also seems to provide the best resilience. Anchors (rings) are permanently embedded in the capsule material and form a permanent connection between the optical system and the capsule. Similarly, inserting the fiber-optic cable into the optical system over a relatively large area results in a very stable fixture.

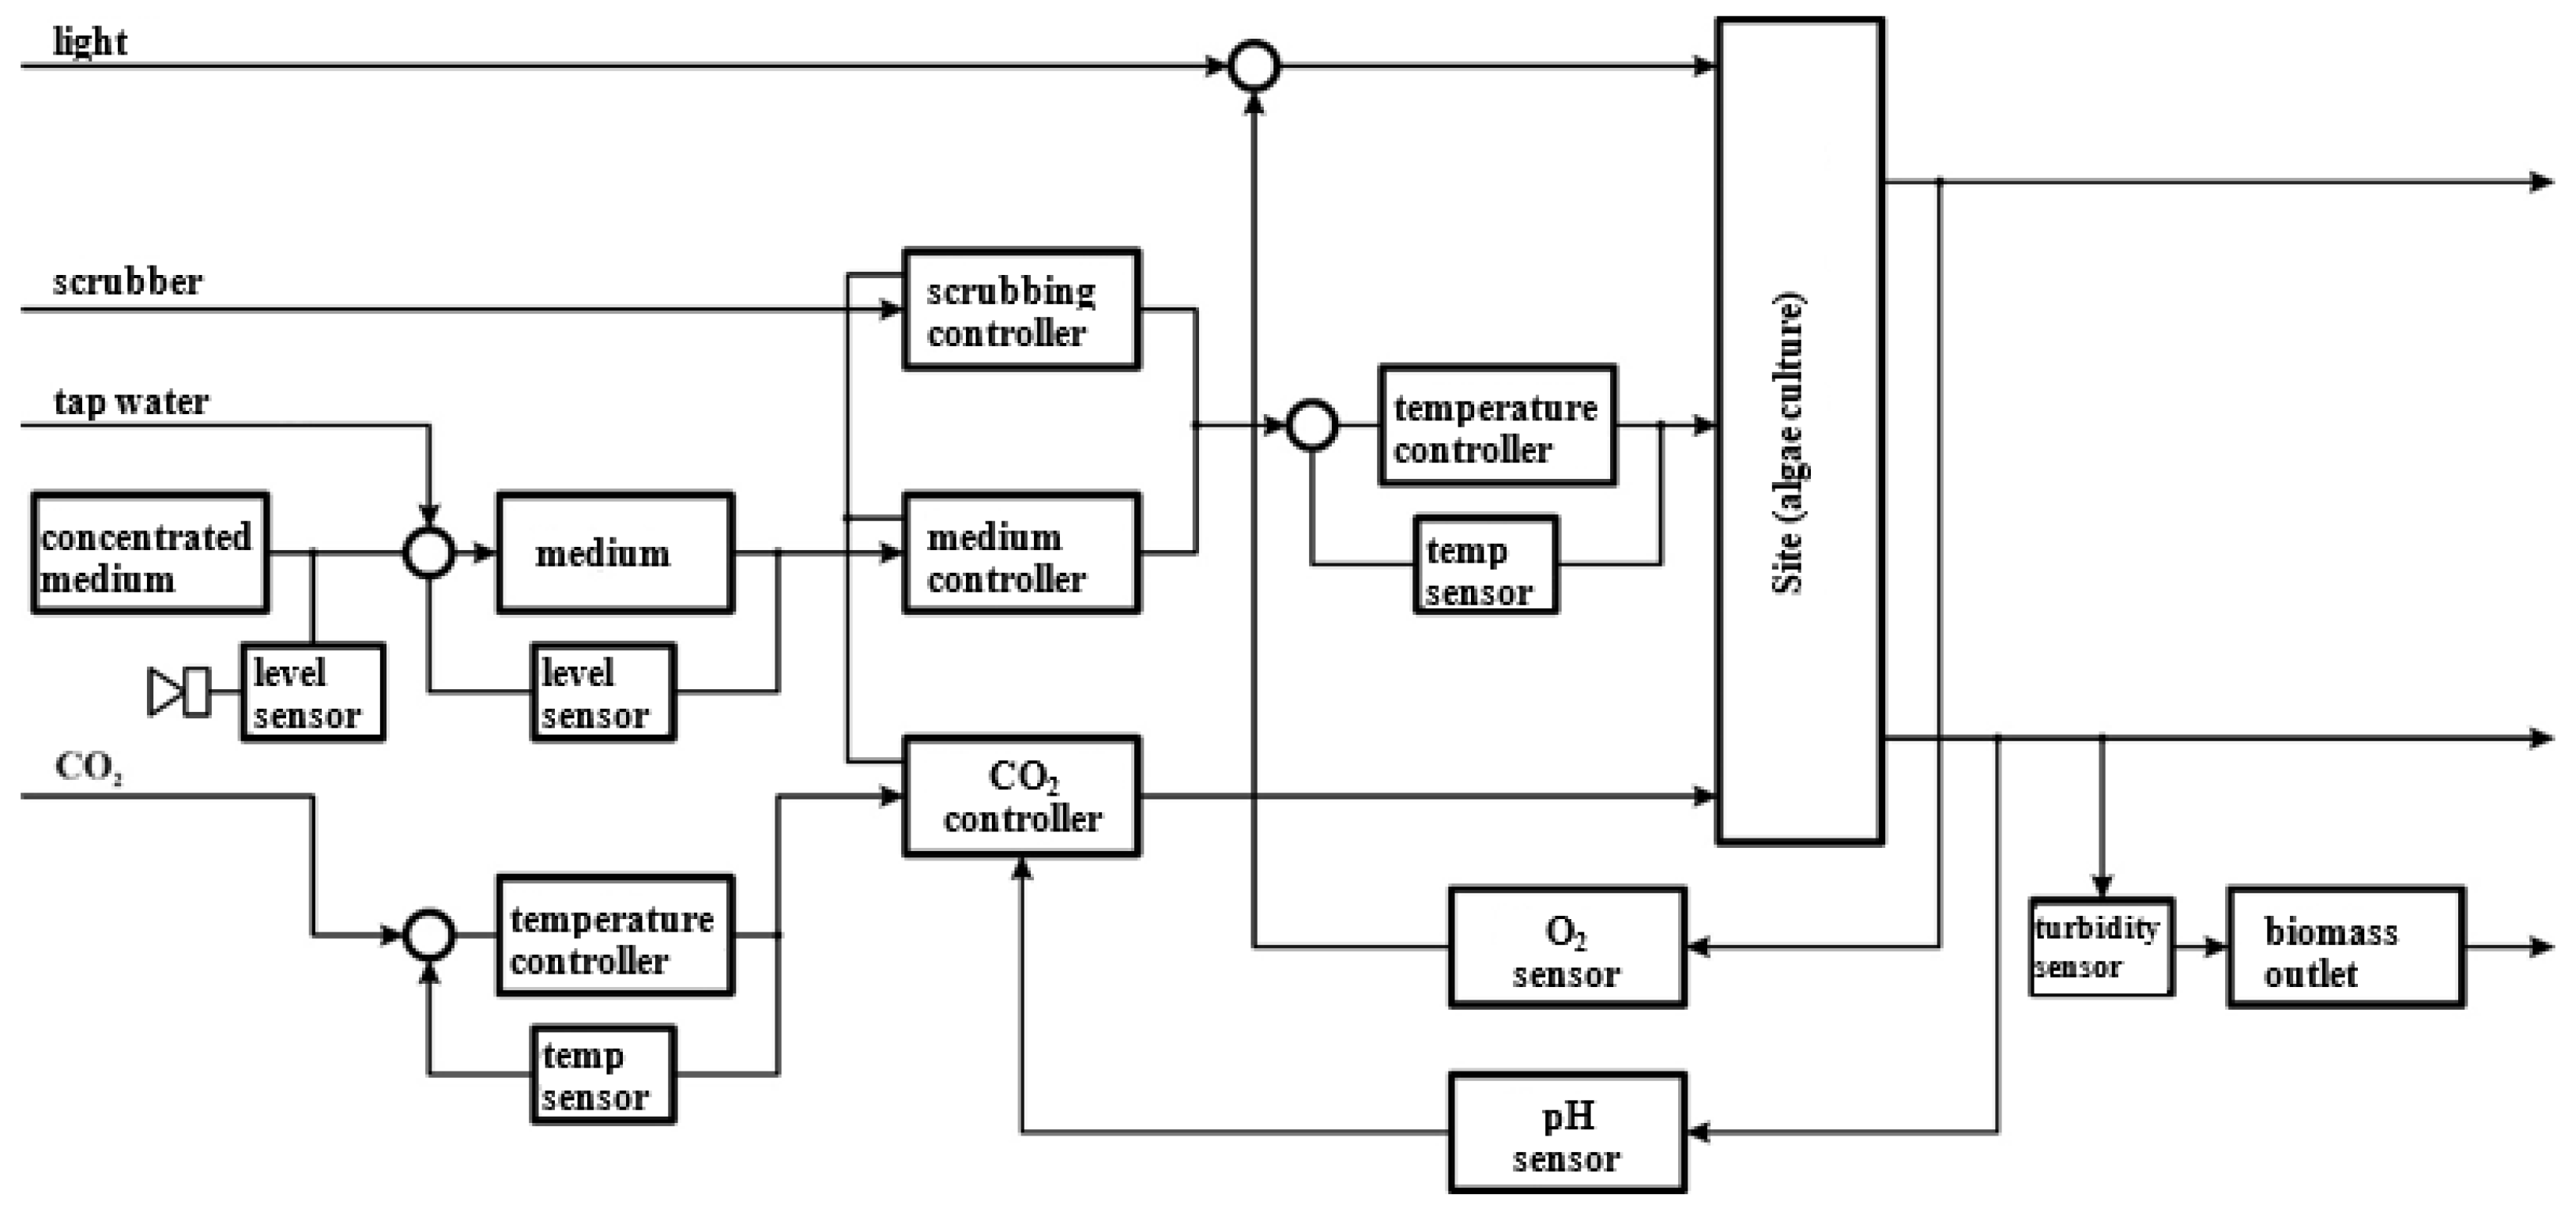
4.10. Automated Process Control Systems

We propose an intermittent control system, with the main input parameters derived from experimentally verified time intervals. The system can be upgraded with a number of modifications to stabilize the operating conditions and provide notifications on critical system states. A diagram of a PBR analogous to the laboratory-scale model used for our tests, with additional modifications, is shown in Figure 15. The prototype system included a temperature controller for the bed-rinsing water/medium (25), temperature controller for the CO2 feed (26), concentrated medium tank (23), concentrated medium pump (24), and tamp water supply valve (26). These components are essential for an automatically controlled reactor to function properly. The system was also fitted with the following additional measurement equipment (not shown in the diagram): O2 sensor for measuring oxygen in output gas, acidity (pH) sensor for the water discharge, separator turbidity (suspension) sensor, medium tank level sensor, concentrated medium tank level sensor, medium (scrubber) temperature sensor, and CO2 temperature sensor. The full control system is presented in Figure 16, whereas Figure 17 shows exemplary visualizations.

5. Conclusions

The microalgae (Chlorella vulgaris) immobilization technology used in the experiment produced high-volume biomass yields of approximately 100 g DM/dm3. Good CO2 biosequestration efficiency is predicated, in part, to ensure high concentrations and growth rates of microalgal biomass. The experiment showed a relationship between CO2 removal in the IMC-CO2PBR and the gas volume flux. When the IMC-CO2PBR was fed at 25 dm3 of gas per hour, the CO2 removal rates were close to 40%.
From a practical standpoint, producing membranes by adding drops of a crosslinker into a biopolymer gel precursor offers superior adaptability in terms of controlling the final capsule size and otherwise modifying the capsule in the IMC-CO2PBR.
We propose a hybrid illumination set-up for IMC-CO2PBR that combines sunlight and LEDs to provide 24/7 illumination, even in closed cultures closed off to sunlight (if economically and climactically reasonable).
We also recommend that an intermittent control system be used, with the main input parameters derived from experimentally verified time intervals. The system can be upgraded with a number of modifications to stabilize the reactor operating conditions and provide notifications on critical system states or situations requiring human intervention.

Author Contributions

Conceptualization, M.D.; Data curation, M.D. and M.K.; Formal analysis, M.D. and M.Z.; Funding acquisition, M.D. and M.K.; Investigation, M.K. and J.K.; Methodology, M.D. and M.K.; Project administration, M.Z.; Resources, J.K.; Supervision, M.D., M.Z. and J.K.; Validation, M.Z.; Visualization, M.K., M.Z. and J.K.; Writing—original draft, M.D. and J.K.; Writing—review and editing, M.D., M.K., M.Z. and J.K. All authors have read and agreed to the published version of the manuscript.

Funding

Research and design works were co-financed from the funds of the project “Obtaining intellectual property protection for a device for intensive CO₂ capture” co-financed by the European Union under the European Regional Development Fund No. UDA-POIG.01.03.02-28-079/12-00 and the “Project financially co-supported by Minister of Science and Higher Education in the range of the program entitled “Regional Initiative of Excellence” for the years 2019–2022, Project No. 010/RID/2018/19, amount of funding 12,000,000 PLN.”

Institutional Review Board Statement

Not applicable.

Informed Consent Statement

Not applicable.

Data Availability Statement

Not applicable.

Conflicts of Interest

The authors declare no conflict of interest.

References

  1. Liu, J.L.; Ma, C.Q.; Ren, Y.S.; Zhao, X.W. Do Real Output and Renewable Energy Consumption Affect CO2 Emissions? Evidence for Selected BRICS Countries. Energies 2020, 13, 960. [Google Scholar] [CrossRef] [Green Version]
  2. Jacob-Lopes, E.; Scoparo, C.H.G.; Queiroz, M.I.; Franco, T.T. Biotransformations of carbon dioxide in photobioreactors. Energy Convers. Manag. 2010, 51, 894–900. [Google Scholar] [CrossRef]
  3. Panepinto, D.; Riggio, V.A.; Zanetti, M. Analysis of the Emergent Climate Change Mitigation Technologies. Int. J. Environ. Res. Public Health 2021, 18, 6767. [Google Scholar] [CrossRef] [PubMed]
  4. Peter, A.P.; Khoo, K.S.; Chew, K.W.; Ling, T.C.; Ho, S.H.; Chang, J.S.; Show, P.L. Microalgae for biofuels, wastewater treatment and environmental monitoring. Environ. Chem. Lett. 2021, 19, 2891–2904. [Google Scholar] [CrossRef]
  5. Dębowski, M.; Zieliński, M.; Kazimierowicz, J.; Kujawska, N.; Talbierz, S. Microalgae Cultivation Technologies as an Opportunity for Bioenergetic System Development—Advantages and Limitations. Sustainability 2020, 12, 9980. [Google Scholar] [CrossRef]
  6. Khoo, K.S.; Chia, W.Y.; Chew, K.W.; Show, P.L. Microalgal-bacterial consortia as future prospect in wastewater bioremediation, environmental management and bioenergy production. Indian J. Microbiol. 2021, 61, 262–269. [Google Scholar] [CrossRef]
  7. Aghaalipour, E.; Akbulut, A.; Güllü, G. Carbon dioxide capture with microalgae species in continuous gas-supplied closed cultivation systems. Biochem. Eng. J. 2020, 163, 107741. [Google Scholar] [CrossRef]
  8. Chisti, Y. Biodiesel from microalgae. Biotechnol. Adv. 2007, 25, 294–306. [Google Scholar] [CrossRef]
  9. Chiu, S.Y.; Kao, C.J.; Chen, C.H.; Kuan, T.C.; Ong, S.C.; Lin, C.S. Reduction of CO2 by a high-density culture of Chlorella sp. in a semicontinuous photobioreactor. Bioresour. Technol. 2008, 99, 3389–3396. [Google Scholar] [CrossRef]
  10. Morais, K.C.; Conceicao, D.; Vargas, J.V.; Mitchell, D.A.; Mariano, A.B.; Ordonez, J.C.; GalliTersawa, L.V.; Kava, V.M. Enhanced microalgae biomass and lipid output for increased biodiesel productivity. Renew. Energy 2021, 163, 138–145. [Google Scholar] [CrossRef]
  11. Zhang, F.; Kabeya, H.; Kitagawa, R.; Hirotsu, T.; Yamashita, M.; Otsuki, T. An exploratory research of PVC-Chlorella composite material (PCCM) as effective utilization of Chlorella biologically fixing CO2. J. Mater. Sci. 2000, 35, 2603–2609. [Google Scholar] [CrossRef]
  12. Benedetti, M.; Vecchi, V.; Barera, S.; Dall’Osto, L. Biomass from microalgae: The potential of domestication towards sustainable biofactories. Microb. Cell Factories 2018, 17, 173. [Google Scholar] [CrossRef] [Green Version]
  13. Rumin, J.; Nicolau, E.; Gonçalves de Oliveira Junior, R.; Fuentes-Grünewald, C.; Picot, L. Analysis of Scientific Research Driving Microalgae Market Opportunities in Europe. Mar. Drugs 2020, 18, 264. [Google Scholar] [CrossRef]
  14. Kumar, R.; Ghosh, A.K.; Pal, P. Fermentative ethanol production from Madhuca indica flowers using immobilized yeast cells coupled with solar driven direct contact membrane distillation with commercial hydrophobic membranes. Energy Convers. Manag. 2019, 181, 593–607. [Google Scholar] [CrossRef]
  15. Kumar, R.; Ghosh, A.K.; Pal, P. Synergy of biofuel production with waste remediation along with value-added co-products recovery through microalgae cultivation: A review of membrane-integrated green approach. Sci. Total Environ. 2020, 698, 134169. [Google Scholar] [CrossRef]
  16. Emparan, Q.; Jye, Y.S.; Danquah, M.K.; Harun, R. Cultivation of Nannochloropsis sp. microalgae in palm oil mill effluent (POME) media for phycoremediation and biomass production: Effect of microalgae cells with and without beads. J. Water Process Eng. 2020, 33, 101043. [Google Scholar] [CrossRef]
  17. Jimenez-Perez, M.V.; Sánchez-Castillo, P.; Romera, O.; Fernández-Moreno, D.; Pérez-Martínez, C. Growth and nutrient removal in free and immobilized planktonic green algae isolated from pig manure. Enzym. Microb. Technol. 2004, 34, 392–398. [Google Scholar] [CrossRef]
  18. Srinuanpan, S.; Cheirsilp, B.; Boonsawang, P.; Prasertsan, P. Immobilized oleaginous microalgae as effective two-phase purify unit for biogas and anaerobic digester effluent coupling with lipid production. Bioresour. Technol. 2019, 281, 149–157. [Google Scholar] [CrossRef]
  19. Ruiz-Marin, A.; Mendoza-Espinosa, L.G.; Stephenson, T. Growth and nutrient removal in free and immobilized green algae in batch and semi-continuous cultures treating real wastewater. Bioresour. Technol. 2010, 101, 58–64. [Google Scholar] [CrossRef] [PubMed]
  20. Soo, C.-L.; Chen, C.-A.; Bojo, O.; Hii, Y.-S. Feasibility of marine microalgae immobilization in alginate bead for marine water treatment: Bead stability, cell growth, and ammonia removal. Int. J. Polym. Sci. 2017, 2017, 6951212. [Google Scholar] [CrossRef] [Green Version]
  21. Aguilar-May, B.; del Pilar Sánchez-Saavedra, M.; Lizardi, J.; Voltolina, D. Growth of Synechococcus sp. immobilized in chitosan with different times of contact with NaOH. J. Appl. Phycol. 2007, 19, 181–183. [Google Scholar] [CrossRef] [PubMed] [Green Version]
  22. Pane, L.; Feletti, M.; Bertino, C.; Carli, A. Viability of the marine microalga Tetraselmis suecica grown free and immobilized in alginate beads. Aquac. Int. 1998, 6, 411–420. [Google Scholar] [CrossRef]
  23. Barati, B.; Zeng, K.; Baeyens, J.; Wang, S.; Addy, M.; Gan, S.-Y.; El-Fatah Abomohra, A. Recent progress in genetically modified microalgae for enhanced carbon dioxide sequestration. Biomass Bioenergy 2021, 145, 105927. [Google Scholar] [CrossRef]
  24. Kim, P.; Otim, O. Optimizing a municipal wastewater-based Chlorella vulgaris photobioreactor for sequestering atmospheric CO2. South. Calif. Acad. Sci. 2019, 118, 42–57. [Google Scholar] [CrossRef]
  25. Fernández, F.G.A.; González-López, C.V.; Fernández Sevilla, J.M.F.; Grima, E.M. Conversion of CO2 into biomass by microalgae: How realistic a contribution may it be to significant CO2 removal? Appl. Microbiol. Biotechnol. 2012, 96, 577–586. [Google Scholar] [CrossRef]
  26. Krzemieniewski, M.; Szwarc, D.; Zieliński, M.; Kupczyk, K.; Rokicka, M.; Dębowski, M. The possibility of using carbon dioxide from biogas in the production of microalgae biomass. Maint. Probl. 2016, 1, 5–15. [Google Scholar]
  27. Zaporozhets, A. Development of software for fuel combustion control system based on frequency regulator. CEUR Workshop Proc. 2019, 2387, 223–230. [Google Scholar]
  28. Packer, M. Algal capture of carbon dioxide; biomass generation as a tool for greenhouse gas mitigation with reference to New Zealand energy strategy and policy. Energy Policy 2009, 37, 3428–3437. [Google Scholar] [CrossRef]
  29. Alami, A.H.; Alasad, S.; Ali, M.; Alshamsi, M. Investigating algae for CO2 capture and accumulation and simultaneous production of biomass for biodiesel production. Sci. Total Environ. 2021, 759, 143529. [Google Scholar] [CrossRef]
  30. Chiu, S.Y.; Kao, C.Y.; Huang, T.T.; Lin, C.J.; Ong, S.C.; Chen, C.D.; Chang, J.S.; Lin, C.S. Microalgal biomass production and on-site bioremediation of carbon dioxide, nitrogen oxide and sulfur dioxide from flue gas using Chlorella sp. Cultures. Bioresour. Technol. 2011, 102, 9135–9142. [Google Scholar] [CrossRef]
  31. Hende, S.V.D.; Vervaeren, H.; Boon, N. Flue gas compounds and microalgae: (bio) chemical interactions leading to biotechnological opportunities. Biotech. Adv. 2012, 30, 1405–1424. [Google Scholar] [CrossRef] [PubMed]
  32. Tong, H.; Shen, Y.; Zhang, J.; Wang, C.-H.; Ge, T.S.; Tong, Y.W. A comparative life cycle assessment on four waste-to-energy scenarios for food waste generated in eateries. Appl. Energy 2018, 225, 1143–1157. [Google Scholar] [CrossRef]
  33. Kandimalla, P.; Vatte, P.; Bandaru, C.S.R. Phycoremediation of automobile exhaust gases using green microalgae. Environ. Dev. Sustain. 2021, 23, 6301–6322. [Google Scholar] [CrossRef]
  34. Lee, C.M.; Chen, P.C.; Wang, C.C.; Tung, Y.C. Photohydrogen production using purple nonsulfur bacteria with hydrogen fermentation reactor effluent. Int. J. Hydrogen Energy 2002, 27, 1309–1313. [Google Scholar] [CrossRef]
  35. Lam, M.K.; TeongLee, K.; Rahman, M.A. Current status and challenges on microalgae-based carbon capture. Int. J. Greenh. Gas Control. 2012, 10, 456–469. [Google Scholar] [CrossRef]
  36. Kumar, K.; Banerjee, D.; Das, D. Carbon dioxide sequestration from industrial flue gas by Chlorella sorokiniana. Bioresour. Technol. 2014, 152, 225–233. [Google Scholar] [CrossRef]
  37. Kvamsdal, H.M.; Haugen, G.; Svendsen, H.F. Flue-gas cooling in post combustion capture plants. Chem. Eng. Res. Des. 2011, 89, 1544–1552. [Google Scholar] [CrossRef]
  38. Lill, J.O.; Salovius-Lauren, S.; Harju, L.; Rajander, J.; Saarela, K.-E.; Lindroos, A. Temporal changes in elemental composition in decomposing filamentous algae (Cladophora glomerata and Pilayella littoralis) determined with PIXE and PIGE. Sci. Total Environ. 2012, 414, 646–652. [Google Scholar] [CrossRef]
  39. Aráujo, S.C.; Garcia, V.M.T. Growth biochemical composition of the diatom Chaetoceros cf. Wighamii brightwell under different temperature, salinity and carbon dioxide levels. I. Protein, carbohydrates and lipids. Aquaculture 2005, 46, 405–412. [Google Scholar] [CrossRef]
  40. Chang, E.H.; Yang, S.S. Some characteristics of microalgae isolated in Taiwan for biofixation of carbon dioxide. Bot. Bull. Acad. Sin. 2003, 44, 43–52. [Google Scholar]
  41. Dasan, Y.K.; Lam, M.K.; Yusup, S.; Lim, J.W.; Show, P.L.; Tan, I.S.; Lee, K.T. Cultivation of Chlorella vulgaris using sequential-flow bubble column photobioreactor: A stress-inducing strategy for lipid accumulation and carbon dioxide fixation. J. CO2 Util. 2020, 41, 101226. [Google Scholar] [CrossRef]
  42. Zheng, Q.; Xu, X.; Martin, G.J.O.; Kentish, S.E. Critical review of strategies for CO2 delivery to large-scale microalgae cultures. Chin. J. Chem. Eng. 2018, 26, 2219–2228. [Google Scholar] [CrossRef]
  43. Cheng, J.; Miao, Y.; Guo, W.; Song, Y.; Tian, J.; Zhou, J. Reduced generation time and size of carbon dioxide bubbles in a volute aerator for improving Spirulina sp. growth. Bioresour. Technol. 2018, 270, 352–358. [Google Scholar] [CrossRef] [PubMed]
  44. Zheng, Q.; Martin, G.J.; Wu, Y.; Kentish, S.E. The use of monoethanolamine and potassium glycinate solvents for CO2 delivery to microalgae through a polymeric membrane system. Biochem. Eng. J. 2017, 128, 126–133. [Google Scholar] [CrossRef]
  45. Anjos, M.; Fernandes, B.D.; Vicente, A.A.; Teixeira, J.A.; Dragone, G. Chlamydomonas reinhardii optimization of CO2 bio-mitigation by Chlorella vulgaris. Bioresour. Technol. 2013, 139, 149–154. [Google Scholar] [CrossRef] [PubMed] [Green Version]
  46. Brilman, W.; Alba, L.G.; Veneman, R. Capturing atmospheric CO2 using supported amine sorbents for microalgae cultivation. Biomass Bioenerg. 2013, 53, 39–47. [Google Scholar] [CrossRef]
  47. Vargas-Estrada, L.; Torres-Arellano, S.; Longoria, A.; Arias, D.M.; Okoye, P.U.; Sebastian, P.J. Role of nanoparticles on microalgal cultivation: A review. Fuel 2020, 280, 228598. [Google Scholar] [CrossRef]
  48. Yang, Y.; Gao, K. Effects of CO2 concentrations on the freshwatermicroalgae, Chlorella pyrenoidosa and Scenedesmus obliquus (Chlorophyta). J. Appl. Phycol. 2003, 15, 379–389. [Google Scholar] [CrossRef]
  49. De Morais, M.G.; Costa, J.A.V. Isolation and selection of microalgae from coal fired thermoelectric power plant for biofixation of carbon dioxide. Energy Convers. Manag. 2007, 48, 2169–2173. [Google Scholar] [CrossRef]
  50. Cheng, L.; Zhang, L.; Chen, H.; Gao, C. Carbon dioxide removal from air by microalgae cultured in a membrane-photobioreactor. Sep. Purif. Technol. 2006, 50, 324–329. [Google Scholar] [CrossRef]
  51. Fan, L.H.; Zhang, Y.T.; Zhang, L.; Chen, H.L. Evaluation of a membrane-sparged helical tubular photobioreactor for carbon dioxide biofixation by Chlorella vulgaris. J. Membr. Sci. 2008, 325, 336–345. [Google Scholar] [CrossRef]
  52. Cheng, J.; Yang, Z.; Ye, Q.; Zhou, J.; Cen, K. Improving CO2 fixation with microalgae by bubble breakage in raceway ponds with up–down chute baffles. Bioresour. Technol. 2016, 201, 174–181. [Google Scholar] [CrossRef]
  53. Kumar, N.; Das, D. Continuous hydrogen production by immobilized Enterobacter cloacae IIT-BT 08 using lignocellulosic materials as solid matrices. Enzym. Microb. Technol. 2001, 29, 280–287. [Google Scholar] [CrossRef]
  54. Ho, S.; Chen, C.; Lee, D.; Chang, J. Perspectives on microalgal CO2-emission mitigation systems—a review. Biotech. Adv. 2011, 29, 189–198. [Google Scholar] [CrossRef] [PubMed]
  55. Eguiheneuf, F.; Ekhan, A.; Tran, L.-S.P. Genetic Engineering: A Promising Tool to Engender Physiological, Biochemical, and Molecular Stress Resilience in Green Microalgae. Front. Plant Sci. 2016, 7, 400. [Google Scholar] [CrossRef] [Green Version]
  56. Shokravi, Z.; Shokravi, H.; Chyuan, O.H.; Lau, W.J.; Koloor, S.S.R.; Petrů, M.; Ismail, A.F. Improving ‘Lipid Productivity’ in Microalgae by Bilateral Enhancement of Biomass and Lipid Contents: A Review. Sustainability 2020, 12, 9083. [Google Scholar] [CrossRef]
  57. Sun, H.; Zhao, W.; Mao, X.; Li, J.; Wu, T.; Chen, F. High-value biomass from microalgae production platforms: Strategies and progress based on carbon metabolism and energy conversion. Biotechnol. Biofuels 2018, 11, 227. [Google Scholar] [CrossRef] [PubMed] [Green Version]
  58. Cui, X.; Yang, J.; Cui, M.; Zhang, W.; Zhao, J. Comparative experiments of two novel tubular photobioreactors with an inner aerated tube for microalgal cultivation: Enhanced mass transfer and improved biomass yield. Algal Res. 2021, 58, 102364. [Google Scholar] [CrossRef]
  59. Dębowski, M.; Zieliński, M.; Krzemieniewski, M.; Dudek, M.; Grala, A. Microalgae cultivation methods. Pol. J. Nat. Sci. 2012, 27, 151–164. [Google Scholar]
  60. Huang, B.; Shan, Y.; Yi, T.; Tang, T.; Wei, W.; Quinn, N.W.T. Study on high-CO2 tolerant Scenedesmus sp. and its mechanism via comparative transcriptomic analysis. J. CO2 Util. 2020, 42, 101331. [Google Scholar] [CrossRef]
  61. Dębowski, M.; Zieliński, M.; Grala, A.; Dudek, M. Algae biomass as an alternative substrate in biogas production technologies—review. Renew. Sustain. Energy Rev. 2013, 27, 596–604. [Google Scholar] [CrossRef]
  62. Sung, K.D.; Lee, J.S.; Shin, C.S.; Park, S.C.; Choi, M.J. CO2 fixation by Chlorella sp. KR-1 and its cultural characteristics. Bioresour. Technol. 1999, 68, 269–273. [Google Scholar] [CrossRef]
  63. Dolganyuk, V.; Belova, D.; Babich, O.; Prosekov, A.; Ivanova, S.; Katserov, D.; Patyukov, N.; Sukhikh, S. Microalgae: A Promising Source of Valuable Bioproducts. Biomolecules 2020, 10, 1153. [Google Scholar] [CrossRef]
  64. Keffer, J.E.; Kleinheinz, G.T. Use of Chlorella vulgar is for CO2 mitigation in a photobioreactor. J. Ind. Microbiol. Biotechnol. 2002, 29, 275–280. [Google Scholar] [CrossRef]
  65. Chiu, S.Y.; Tsai, M.T.; Kao, C.Y.; Ong, S.C.; Lin, C.S. The air-lift photobioreactors with flow patterning for high-density cultures of microalgae and carbon dioxide removal. Eng. Life Sci. 2009, 9, 254–260. [Google Scholar] [CrossRef]
  66. Stuart, C.; Hessami, M.A. A study of methods of carbon dioxide capture and sequestration–the sustainability of a photosynthetic bioreactor approach. Energy Convers. Manag. 2005, 46, 403–420. [Google Scholar] [CrossRef]
  67. Jacob-Lopes, E.; Scoparo, C.H.G.; Franco, T.T. Rates of CO2 removal by Aphanothece microscopica Nageli in tubular photobioreactors. Chem. Eng. Process. 2008, 47, 1371–1379. [Google Scholar] [CrossRef]
  68. Cheirsilp, B.; Thawechai, T.; Prasertsan, P. Immobilized oleaginous microalgae for production of lipid and phytoremediation of secondary effluent from palm oil mill in fluidized bed photobioreactor. Bioresour. Technol. 2017, 241, 787–794. [Google Scholar] [CrossRef] [PubMed]
  69. Kumar, K.; Dasgupta, C.N.; Nayak, B.; Lindblad, P.; Das, D. Development of suitable photobioreactors for CO2 sequestration addressing global warming using green algae and cyanobacteria. Bioresour. Technol. 2011, 102, 4945–4953. [Google Scholar] [CrossRef] [PubMed]
  70. Zhao, B.; Su, Y. Process effect of microalgal-carbon dioxide fixation and biomass production: A review. Renew. Sustain. Energy Rev. 2014, 31, 121–132. [Google Scholar] [CrossRef]
  71. Jiang, Y.; Zhang, W.; Wang, J.; Chen, Y.; Shen, S.; Liu, T. Utilization of simulated flue gas for cultivation of Scenedesmus dimorphus. Bioresour. Technol. 2013, 128, 359–364. [Google Scholar] [CrossRef]
  72. Kao, C.-Y.; Chen, T.-Y.; Chang, Y.-B.; Chiu, T.-W.; Lin, H.-Y.; Chen, C.-D.; Chang, J.-S.; Lin, C.-S. Utilization of Carbon Dioxide in Industrial Flue Gases for the Cultivation of Microalgal Chlorella sp. Bioresour. Technol. 2014, 166, 485–493. [Google Scholar] [CrossRef] [PubMed]
  73. Prajapati, S.K.; Kaushik, P.; Malik, A.; Vijay, V.K. Phycoremediation coupled production of algal biomass, harvesting and anaerobic digestion: Possibilities and challenges. Biotechnol. Adv. 2013, 31, 1408–1425. [Google Scholar] [CrossRef] [PubMed]
  74. Pires, J.C.M.; Alvim-Ferraz, M.C.M.; Martins, F.G.; Simões, M. Carbon dioxide capture from flue gases using microalgae: Engineering aspects and biorefinery concept. Renew. Sustain. Energy Rev. 2012, 16, 3043–3053. [Google Scholar] [CrossRef]
  75. Sun, J.; Cheng, J.; Yang, Z.; Zhou, J. Heavy metal control in microalgae cultivation with power plant flue gas entering into raceway pond. Environ. Sci. Pollut. Res. 2020, 27, 37357–37362. [Google Scholar] [CrossRef] [PubMed]
  76. Ghorbani, A.; Rahimpour, H.R.; Ghasemi, Y.; Zoughi, S.; Rahimpour, M.R. A review of carbon capture and sequestration in Iran: Microalgal biofixation potential in Iran. Renew. Sustain. Energy Rev. 2014, 35, 73–100. [Google Scholar] [CrossRef]
  77. Douskova, J.; Doucha, J.; Livansky, K.; Machat, J. Simultaneous flue gas bioremediation and reduction of microalgal biomass production costs. Apply Microbiol. Biotechnol. 2009, 82, 179–185. [Google Scholar] [CrossRef]
  78. Morel, A. Available, usable, and stored radiant energy in relation to marine photosynthesis. Deep. Sea Res. 1978, 25, 673–688. [Google Scholar] [CrossRef]
Figure 1. Scheme of a trickle bed photobioreactor used for the laboratory-scale experiment (1) photobioreactor housing, (2) support grid, (3) immobilized microalgal biomass, (4) capsule membrane, (5) fiber-optic cable, (6) light source, (7) CO2 inlet, (8) gas-feeding pump, (9) CO2 tank, (10) gas outlet, (11) spray nozzles, (12) growth medium-feeding pump, (13) growth medium tank, (14) scrubber pump, (15) collection tank, (16) separation tank for excess algal biomass (including blue-green algae), (17) outlet, (18) valve, (19) discharge line, (20) liquid outlet, (21) in-capsule end of the optic-fiber cable, and (22) line.
Atmosphere 12 01031 g001
Figure 2. Scheme of the biomass concentrator with a rotary vacuum filter.
Atmosphere 12 01031 g002
Figure 3. Scheme of the hydrogel encapsulation unit: (1) Biopolymer mixer, (2) tank for concentrated biomass, (3) crosslinker mixer, (4) mixer, (5) buffer tank for crosslinker, (6) device for forming and separating capsules.
Atmosphere 12 01031 g003
Figure 4. Immobilization of microalgal biomass: (a) Encapsulation matrix, (b) sieved out capsules, (c) immobilized microalgae initial phase, (d) immobilized microalgae exploitation phase.
Atmosphere 12 01031 g004
Figure 5. Spectral profile of an exemplary LED lamp suggested as a light source for immobilized microalgal biomass.
Atmosphere 12 01031 g005
Figure 6. Example of a functional design of a single-layer module.
Atmosphere 12 01031 g006
Figure 7. Example of a functional design of a three-layer module.
Atmosphere 12 01031 g007
Figure 8. Scheme of system-fiber optic array connections.
Atmosphere 12 01031 g008
Figure 9. Exemplary LED lamp layout.
Atmosphere 12 01031 g009
Figure 10. Lens array forming a parallel beam.
Atmosphere 12 01031 g010
Figure 11. Scheme of the LED-based illumination set-up.
Atmosphere 12 01031 g011
Figure 12. Scheme of the dual-LED-lamp optical system.
Atmosphere 12 01031 g012
Figure 13. Scheme of the hybrid system for illuminating encapsulated algal cultures.
Atmosphere 12 01031 g013
Figure 14. Proposed method for inserting and fitting fiber-optic cables into capsules.
Atmosphere 12 01031 g014
Figure 15. Scheme of IMC-CO2PBR.
Atmosphere 12 01031 g015
Figure 16. Scheme of the IMC-CO2 PBR control system.
Atmosphere 12 01031 g016
Figure 17. Exemplary visualizations.
Atmosphere 12 01031 g017
Table 1. Experimental design.
VariantGas Volume Flux (dm3/h)% CO2 by Volume
(% Vol.)
CO2 Volume Flux
(dm3/h)
CO2 Mass Flow Rate (g/h)CO2 Mass Flow Rate (g/Day)
125256.2512.3294.5
25012.524.6589.1
31002549.21178.2
415037.573.61767.3
52005098.22356.4
Table 2. Performance indicators for the experimental IMC-CO2PBR.
VariantMicroalgal Biomass Growth
(g DM/Day)
CO2 Removal
(g/Day)
Per-Unit CO2 Removal (gCO2/g DM)CO2 Removal
(g CO2/Day)
CO2 Removal Efficiency (%)% CO2 by Volume
(% v/v)
121.498.2564.59117.439.915.0
227.6116.8444.23136.023.119.2
329.1125.4154.31144.612.321.9
432.3121.0413.75140.27.923.0
531.9119.8553.76139.15.923.5
Table 3. Results of comparative statistical analysis of CO2 removal (gCO2/g microalgae dry mass) performed with the Tukey’s honest significant difference test.
Variant12345
1 0.0081760.0062900.0019400.002077
20.008176 0.0782900.0144300.019011
30.0062900.078290 0.0096630.012441
40.0019400.0144300.009663 0.978262
50.0020770.0190110.0124410.978262
Values in bold indicate significant differences at p ≤ 0.05.
Table 4. Module mass at different loads and diameters of immobilized microalgal biomass-containing capsules.
Diameter Capsule (mm)Capsule Load
500010,00015,00020,00030,00040,000
Weight (kg)
50.40.71.11.42.22.9
102.95.88.611.517.323.0
159.719.429.238.958.377.8
2023.046.169.192.2138.2184.3
2545.090.0135.0180.0270.0360.0
3077.8155.5233.3311.0466.5622.0
35123.5246.9370.4493.9740.8987.8
40184.3368.6552.9737.21105.81474.5
45262.4524.8787.31049.71574.52099.4
Table 5. Dimensions of a single-layer module at different capsule loads and diameters.
Diameter Capsule (mm)Capsule Load
5000
50 × 100
10,000
100 × 100
15,000
100 × 150
20,000
100 × 200
30,000
150 × 200
40,000
200 × 200
Panel Dimensions (mm)
5250 × 500500 × 500500 × 750500 × 1000750 × 10001000 × 1000
10500 × 10001000 × 10001000 × 15001000 × 20001500 × 20002000 × 2000
15750 × 15001500 × 15001500 × 22501500 × 30002250 × 30003000 × 3000
201000 × 20002000 × 20002000 × 30002000 × 40003000 × 40004000 × 4000
251250 × 25002500 × 25002500 × 37502500 × 50003750 × 50005000 × 5000
301500 × 30003000 × 30003000 × 45003000 × 60004500 × 60006000 × 6000
351750 × 35003500 × 35003500 × 52503500 × 70005250 × 70007000 × 7000
402000 × 40004000 × 40004000 × 60004000 × 80006000 × 80008000 × 8000
452250 × 45004500 × 45004500 × 67504500 × 90006750 × 90009000 × 9000
Table 6. Light requirements by capsule diameter and load.
Diameter of the CapsuleTransverse Sectional AreaSolar Energy Requirement
Light Energy Per CapsuleEnergy for 5000 CapsulesEnergy for 10,000 CapsulesEnergy for 15,000 CapsulesEnergy for 20,000 CapsulesEnergy for 30,000 CapsulesEnergy for 40,000 Capsules
(mm)(mm2)(Ws)
519.6358.25 × 10−44.128.2512.3716.4924.7432.99
1078.5403.30 × 10−316.4932.9949.4865.9798.96131.95
15176.7157.42 × 10−337.1174.22111.33148.44222.66296.88
20314.1591.32 × 10−265.97131.95197.92263.89395.84527.79
25490.8742.06 × 10−2103.08206.17309.25412.33618.50824.67
30706.8582.97 × 10−2148.44296.88445.32593.76890.641187.52
35962.1134.04 × 10−2202.04404.09606.13808.171212.261616.35
401256.6375.28 × 10−2263.89527.79791.681055.581583.362111.15
451590.4316.68 × 10−2333.99667.981001.971335.962003.942671.92
Table 7. Red light requirements by capsule diameter and load.
Diameter of the CapsuleTransverse Sectional AreaRed Light Energy Requirement
Light Energy Per CapsuleEnergy for 5000 CapsulesEnergy for 10,000 CapsulesEnergy for 15,000 CapsulesEnergy for 20,000 CapsulesEnergy for 30,000 CapsulesEnergy for 40,000 Capsules
(mm)(mm2)(Ws)
519.6351.75 × 10−40.871.752.623.505.246.99
1078.5406.99 × 10−43.506.9910.4913.9820.9727.96
15176.7151.57 × 10−37.8615.7323.5931.4647.1862.91
20314.1592.80 × 10−313.9827.9641.9455.9283.88111.84
25490.8744.37 × 10−321.8443.6965.5387.38131.06174.75
30706.8586.29 × 10−331.4662.9194.37125.82188.73251.64
35962.1138.56 × 10−342.8185.63128.44171.26256.88342.51
401256.6371.12 × 10−255.92111.84167.76223.68335.52447.36
451590.4311.42 × 10−270.77141.55212.32283.10424.65566.19
Table 8. Blue light requirements by capsule diameter and load.
Diameterof the CapsuleTransverse Sectional AreaBlue Light Energy Requirement
Light Energy Per CapsuleEnergy for 5000 CapsulesEnergy for 10,000 CapsulesEnergy for 15,000 CapsulesEnergy for 20,000 CapsulesEnergy for 30,000 CapsulesEnergy for 40,000 Capsules
(mm)(mm2)(Ws)
519.6352.77 × 10−41.382.774.155.548.3111.07
1078.5401.11 × 10−35.5411.0716.6122.1533.2244.30
15176.7152.49 × 10−312.4624.9237.3849.8374.7599.67
20314.1594.43 × 10−322.1544.3066.4488.59132.89177.19
25490.8746.92 × 10−334.6169.21103.82138.43207.64276.85
30706.8589.97 × 10−349.8399.67149.50199.33299.00398.67
35962.1131.36 × 10−267.83135.66203.49271.32406.97542.63
401256.6371.77 × 10−288.59177.19265.78354.37531.56708.74
451590.4312.24 × 10−2112.13224.25336.38448.50672.75897.00
Publisher’s Note: MDPI stays neutral with regard to jurisdictional claims in published maps and institutional affiliations.

