Article

A Vulnerability Curve Method to Assess Risks of Climate-Related Hazards at County Level

1
National Disaster Reduction Center of China, Beijing 100124, China
2
Key Laboratory of Land Surface Pattern and Simulation, Institute of Geographic Sciences and Natural Resources Research, CAS, Beijing 100101, China
*
Author to whom correspondence should be addressed.
Co-first authors contributed equally to this work.
Atmosphere 2021, 12(8), 1022; https://doi.org/10.3390/atmos12081022
Submission received: 23 June 2021 / Revised: 31 July 2021 / Accepted: 7 August 2021 / Published: 10 August 2021
(This article belongs to the Section Climatology)

Abstract

:
A comprehensive risk assessment of different types of natural disasters at the county level can promote quantitative disaster risk assessment and can provide a scientific basis for the formulation of disaster prevention measures. Focusing on climate-related hazards and based on natural disaster risk assessment theories and methods, this study integrates disaster statistics, meteorological data, geographic information, and other multivariate data to quantify the hazards of various disasters and the vulnerability and exposure of hazard-bearing bodies and conducts an integrated assessment of comprehensive risks of multiple climate-related hazards in Cangnan County, Zhejiang Province. Typhoon disaster risk is high in the central and northern parts of this county and low in its surroundings, with high-risk areas mainly distributed in Lingxi Town to the north. The comprehensive risk distribution patterns of drought and flood disasters in Cangnan County are similar: low in the south and high in the north. With the method of standard deviation, the comprehensive risk of multiple climate-related hazards in Cangnan County shows a distribution pattern of being low in the south and high in the north, with high risk in the northeast and low risk in the northwest and south.

1. Introduction

China is among the countries that suffer many types of heavy disasters, with a wide distribution area and high frequency of occurrence, causing serious losses [1,2]. Against the background of global environmental change and frequent natural disasters, China faces a serious situation. In 2020, natural disasters resulted in 138 million person affects and 100,000 house collapses, the area of affected crops was 19,957.7 thousand hectares, and direct economic losses amounted to CNY 370.15 billion [3]. Among all natural hazards, climate-related hazards are characterized by their high frequency, extensive impact, and destructive power, and are the type of hazard that has affected the largest number of people in the last 20 years, seriously affecting the sustainable and stable development of the social economy [1,2]. In June 2021, an unprecedented and dangerous heat wave swept across the West Coast of North America, with extreme heat in several cities, including a record-breaking 49.5 °C in Lytton, British Columbia, resulting in nearly 600 deaths. A month later, rare floods were triggered by heavy rainfall in west-central Europe. As of 20 July, more than 200 people have been killed by the floods, including 171 in Germany and 31 in Belgium. The direct economic loss caused by this flood to Germany has reached EUR 3 billion. At about the same time, Henan Province, China, experienced extreme heavy rainfall. The 24-h rainfall in Zhengzhou, the center of heavy rainfall, reached 696.9 mm. Floods caused by heavy rainfall have caused 73 deaths. The direct economic losses exceed CNY 80 billion (approximately EUR 10 billion). Scientific and quantitative judgment of the degree and pattern of natural disaster risk is necessary to gain understanding and can provide important guarantees for policies of risk management and for reducing losses from natural disasters [4].
Currently, natural disaster risk assessment is mainly focused on single-hazard disasters, including typhoons [5], earthquakes [6], landslides [7,8], forest and grassland fires [9], marine [10], droughts [11], and flood [12,13]. However, it is often affected by multiple hazards at the regional scale. Therefore, there is also widespread interest in the comprehensive risk assessment of multi-hazard disasters at the regional level [14]. For example, Bell et al. [15] chose debris flows, avalanches, and landslides as subjects for risk research; Kappes et al. [16] conducted risk assessments for potential seismic landslides, floods, and storm buildings; and the Federal Emergency Management Agency and National Institute of Building Research conducted a comprehensive risk assessment of earthquake, hurricane, and flood disaster in the United States [17]. With the continued expansion of natural disaster risk research, the assessment methods are becoming more varied and moving from qualitative to quantitative. It is generally believed that multi-hazard risk is the total risk caused by multiple hazards in a region. According to the complexity of the structure and functional characteristics of the disaster system, it can be divided into three categories: disaster cluster, disaster chain, and disaster compound [18]. At present, the main methods for disaster risk assessment include probability statistics [19], artificial neural networks [20], index system methods [21], model simulations [22], and disaster statistics [23]. In addition, disaster risk assessments are conducted on a demand-driven basis with assessment units at different scales. The Disaster Risk Index (DRI), developed by the United Nations Development Programme (UNDP), evaluates population mortality risk worldwide using countries as assessment modules [24]. The Munich Reinsurance Company assesses the risk of economic loss for the world’s 50 largest cities or urban agglomerations [25]. Ge et al. [26] selected three research areas with different spatial scales in cities, counties, and villages to conduct comprehensive risk research.
In China, local governments, other than special administrative regions, are generally divided into three levels: province, city (county), and township (town). There are 2856 administrative areas at the county level, covering basically all of China’s land and accounting for more than 85% of the population [27]. Generally speaking, the scope of impact of many serious natural disasters is concentrated within county-level administrative regions, which are also the grass-root units responsible for implementing policies and practices for disaster risk management [28,29]. As a result, county-level governments are often front-line leaders and important participants in dealing with major natural disasters, with their agencies carrying out disaster risk prevention and emergency management to be efficient and effective [30]. Comprehensive risk assessment of natural disasters at the county scale is carried out with a small degree of dispersion and more accurate loss estimation. Previous studies have focused on assessing disasters at the county level. Wang et al. [31] evaluated multi-hazard intensity and the level of urbanization in China with county-level administrative regions as the basic unit and obtained urban natural disaster regionalization of the country. Shi et al. [32] selected 12 major natural disasters in China and completed a comprehensive multi-hazard risk assessment and mapping based on county-level administrative units. These studies used the county as the unit to explore natural disaster risk patterns on a macro scale. Most studies lack quantitative assessment and pattern analysis of disaster risk within counties.
In view of this, this paper takes Cangnan County, Zhejiang Province, China, as an example, collecting climate-related hazard disaster loss, typhoon track, meteorological, and socioeconomic statistical data from 2000 to 2016. Based on natural disaster risk assessment theories and methods, a comprehensive risk assessment of multiple climate-related hazards—typhoons, droughts, and floods—in Cangnan County was carried out by integrating the hazards of disaster-causing factors and the vulnerability and exposure of disaster-bearing bodies and by combining a risk assessment model and geographic information technology in order to correctly and comprehensively understand the climate-related hazard risk level of each township in Cangnan County and to improve the disaster prevention, mitigation, and relief capabilities of the county and each township and the capabilities of the natural disaster database.

2. Materials and Methods

2.1. Study Area

Cangnan County, located in the southernmost part of Zhejiang Province, was established in June 1981 as one of the five counties under the jurisdiction of Wenzhou (Figure 1). At the end of 2018, Cangnan County covered 17 towns and 2 ethnic townships, with a total population of 1.34 million, ranking first in Zhejiang Province and 40th in the country; GDP totaled CNY 56.06 billion, ranking about 80th in the country, with a per capita GDP About CNY 42,000, lower than the national average. In addition, Cangnan County had a sown grain area of 20.83 thousand hectares, an agricultural output value of CNY 1.86 billion, and a grain output of 129.08 thousand tons [33]. The geographical coordinates of Cangnan County are 27°30′ N and 120°23′ E, and it belongs to the subtropical maritime monsoon climate, warm in winters and cool in summers, with an average annual temperature of 17.9 °C and average annual precipitation of 1670.1 mm, with the flood season lasting about six months. Most of Cangnan’s territory belongs to the Aojiang River system, with higher terrain in the southwest and lower terrain in the northeast. The total area is 1261.08 km2, the sea area is 37,200 km2, and the coastline is 155 km long. In summary, Cangnan County is densely populated, has a relatively low level of overall economic development, and is heavily influenced by the monsoon climate.
Cangnan County is one of the high-risk areas for climate-related hazards [34]. Since 1949, typhoons that landed in Cangnan County accounted for 17% of the total number of typhoons that landed in Zhejiang Province. Among them, the landing of super typhoon “Saomai” in 2006 caused the collapse of 20,310 houses, 153 deaths, and direct economic loss of CNY 9.124 billion [35]. Drought and flood disaster risk in Cangnan County is also at a high level, seriously threatening local socio-economic development [36]. Comprehensive risk assessment of climate-related hazards is of great significance for Cangnan County to prevent and mitigate natural disasters.

2.2. Data Sources

In this paper, climate-related hazard disaster loss, typhoon track, meteorological, and socioeconomic statistical data were used. The data sources are detailed below.
The climate-related hazard disaster loss data were provided by the National Disaster Reduction Center of China and were used to calculate the loss rate of disaster-bearing bodies. The center recorded a total of 41 climate-related hazards in Cangnan County from 2000 to 2016, including 28 typhoons, 5 floods, 3 droughts, 3 freezes, and 2 hailstorms. It is difficult to construct a vulnerability curve due to the infrequent occurrence, small social and economic losses, and lack of recorded data on freezing and hailstorm disasters. Therefore, typhoons, floods, and droughts were selected in this study for comprehensive risk assessment.
Typhoon track data were from the Shanghai Typhoon Institute of China Meteorological Administration (CMA-STI, http://tcdata.typhoon.org.cn/en/index.html, (accessed on 3 December 2020). Based on the track data of 28 typhoons landing in or affecting Cangnan County combined with the disaster loss data, the vulnerability curve of typhoons between the intensity level and the loss rate of disaster-bearing bodies was established.
Meteorological data came from the China Meteorological Administration, which was used to calculate the intensity of flood and drought disasters in Cangnan and its surrounding area. The vulnerability curve of flood and drought between the intensity level and the loss rate of disaster-bearing bodies was established.
Socioeconomic statistical data at the community level (2016) was provided by official Cangnan County government agencies and was considered as a measure of population, economic, crop, and house exposure.

2.3. Methods

2.3.1. Natural Disaster Risk Assessment Model

The constituent risks include two dimensions (disaster-causing factors and disaster-bearing bodies) and three aspects (hazard or possibility, vulnerability, and exposure) [37,38]. The disaster-causing factors determine the probability of risk occurrence [39]. Disaster-bearing bodies are social economic and resource environments that have been negatively affected. Exposure refers to the number of disaster-bearing bodies that are likely to be adversely affected [40]. Vulnerability refers to the tendency to be adversely affected, which is often characterized by sensitivity and fragility [41,42].
According to the mechanism of natural disaster risk assessment, climate-related hazard risk (R) is a function of the hazard or possibility (P), exposure (E), and vulnerability (V), which is expressed with the following equation:
R = P × E × V
where R indicates the climate-related hazard disaster risk, P indicates the hazard, E indicates the exposure and V indicates the vulnerability.
  • Hazards
The hazards mainly have to do with the occurrence probability of disaster events. For typhoons, intensity is based on the average wind speed of the typhoon track. Using the classification scheme of CMA-STI, it is divided into 6 grades, corresponding to the 6 classification types in the national standard (GB/T19201-2006). Since there were no records of losses caused by tropical depressions and tropical storms in the selected typhoon disaster data, only typhoons of grades 3 to 6 are analyzed in this paper (Table 1). According to the typhoon wind field model, buffers of 75, 100, 125, and 150 km were extracted according to the typhoon intensity level. The communities covered by the buffers were considered typhoon-affected areas, and the frequency of communities affected by typhoons was calculated. The cumulative length of the typhoon track in each community is another indicator that reflects the possibility of typhoon occurrence. The length of each typhoon track was calculated according to the expanse of the communities it passed through, and the total length of grade 3 to 6 typhoons in each community was obtained. The occurrence probability of typhoons is a comprehensive index of frequency and total length. Since the dimensions of the two indices were inconsistent, they were normalized separately, and the occurrence probability of typhoons of different grades was obtained by summing with equal weights [43].
For droughts, the intensity was calculated by the meteorological drought composite index (MCI; GB/T 20481–2017), which can reflect precipitation anomalies at different time scales and water deficits at shorter time scales. The function is as follows:
M C I = K a × ( a × S P I W 60 + b × M I 30 + c × S P I 90 + d × S P I 150 )
where MCI is the meteorological drought composite index; SPIW60 is the weighted standardized precipitation index in the past 60 days; MI30 is the relative moisture index in the past 30 days; SPI90 is the standardized precipitation index in the past 90 days; SPI150 is the standardized precipitation index in the past 150 days; a, b, c, and d are weight coefficients, with values of 0.5, 0.6, 0.2, and 0.1, respectively; and Ka is the seasonal adjustment coefficient, with a value between 0.9 and 1.1.
According to MCI, droughts are divided into 5 grades, among which grades 1 and 2 have little impact on production and life. Therefore, grades 3–5 were divided into mild, moderate, and severe drought, respectively, in this study (Table 2) [44].
For floods, the intensity was calculated by the flood index (FI), which is based on the maximum 3-day precipitation and is corrected by underlying surface correction parameters [45]. According to the index values, floods were divided into 3 levels: mild, moderate, and severe flood, indicating the level and impact degree (Table 2).
  • Vulnerability
A vulnerability curve is an effective way to quantitatively study the relationship between hazard intensity grade and disaster loss. The specific evaluation process is as follows:
First, the disaster-bearing bodies of typhoons and floods were defined as population, economy, crops, and houses. Drought does not damage houses, and its disaster-bearing bodies are population, economy, and crops [43,44,45].
Second, we analyzed the disaster loss data from 2000 to 2016 to determine the scope of hazard impact and calculated the loss rate of each disaster-bearing body:
v i = L i E i  
where vi is the loss rate; Li is the loss, Ei is the exposure; and i is the category of the disaster-bearing body, where the values can be population, economy, crops, or houses.
Finally, we analyzed the relationship between hazard intensity grade and disaster loss rate according to the data on 28 typhoons, 5 floods, and 3 droughts in Cangnan County from 2000 to 2016.
The vulnerability curves for different grades of typhoons, droughts, and floods were established based on the exponential curve fitting method (Figure 2):
y = m * e n * x
where y is the loss rate (%), x is the hazard intensity grade, e is the Euler’s number, and m and n are coefficients. Figure 2 shows an example of an economic vulnerability curve of typhoons. Then, we constructed the disaster loss criteria according to Equation (4) for different grades of typhoons, droughts, and floods in Cangnan County (Table 3, Table 4 and Table 5).
  • Exposure
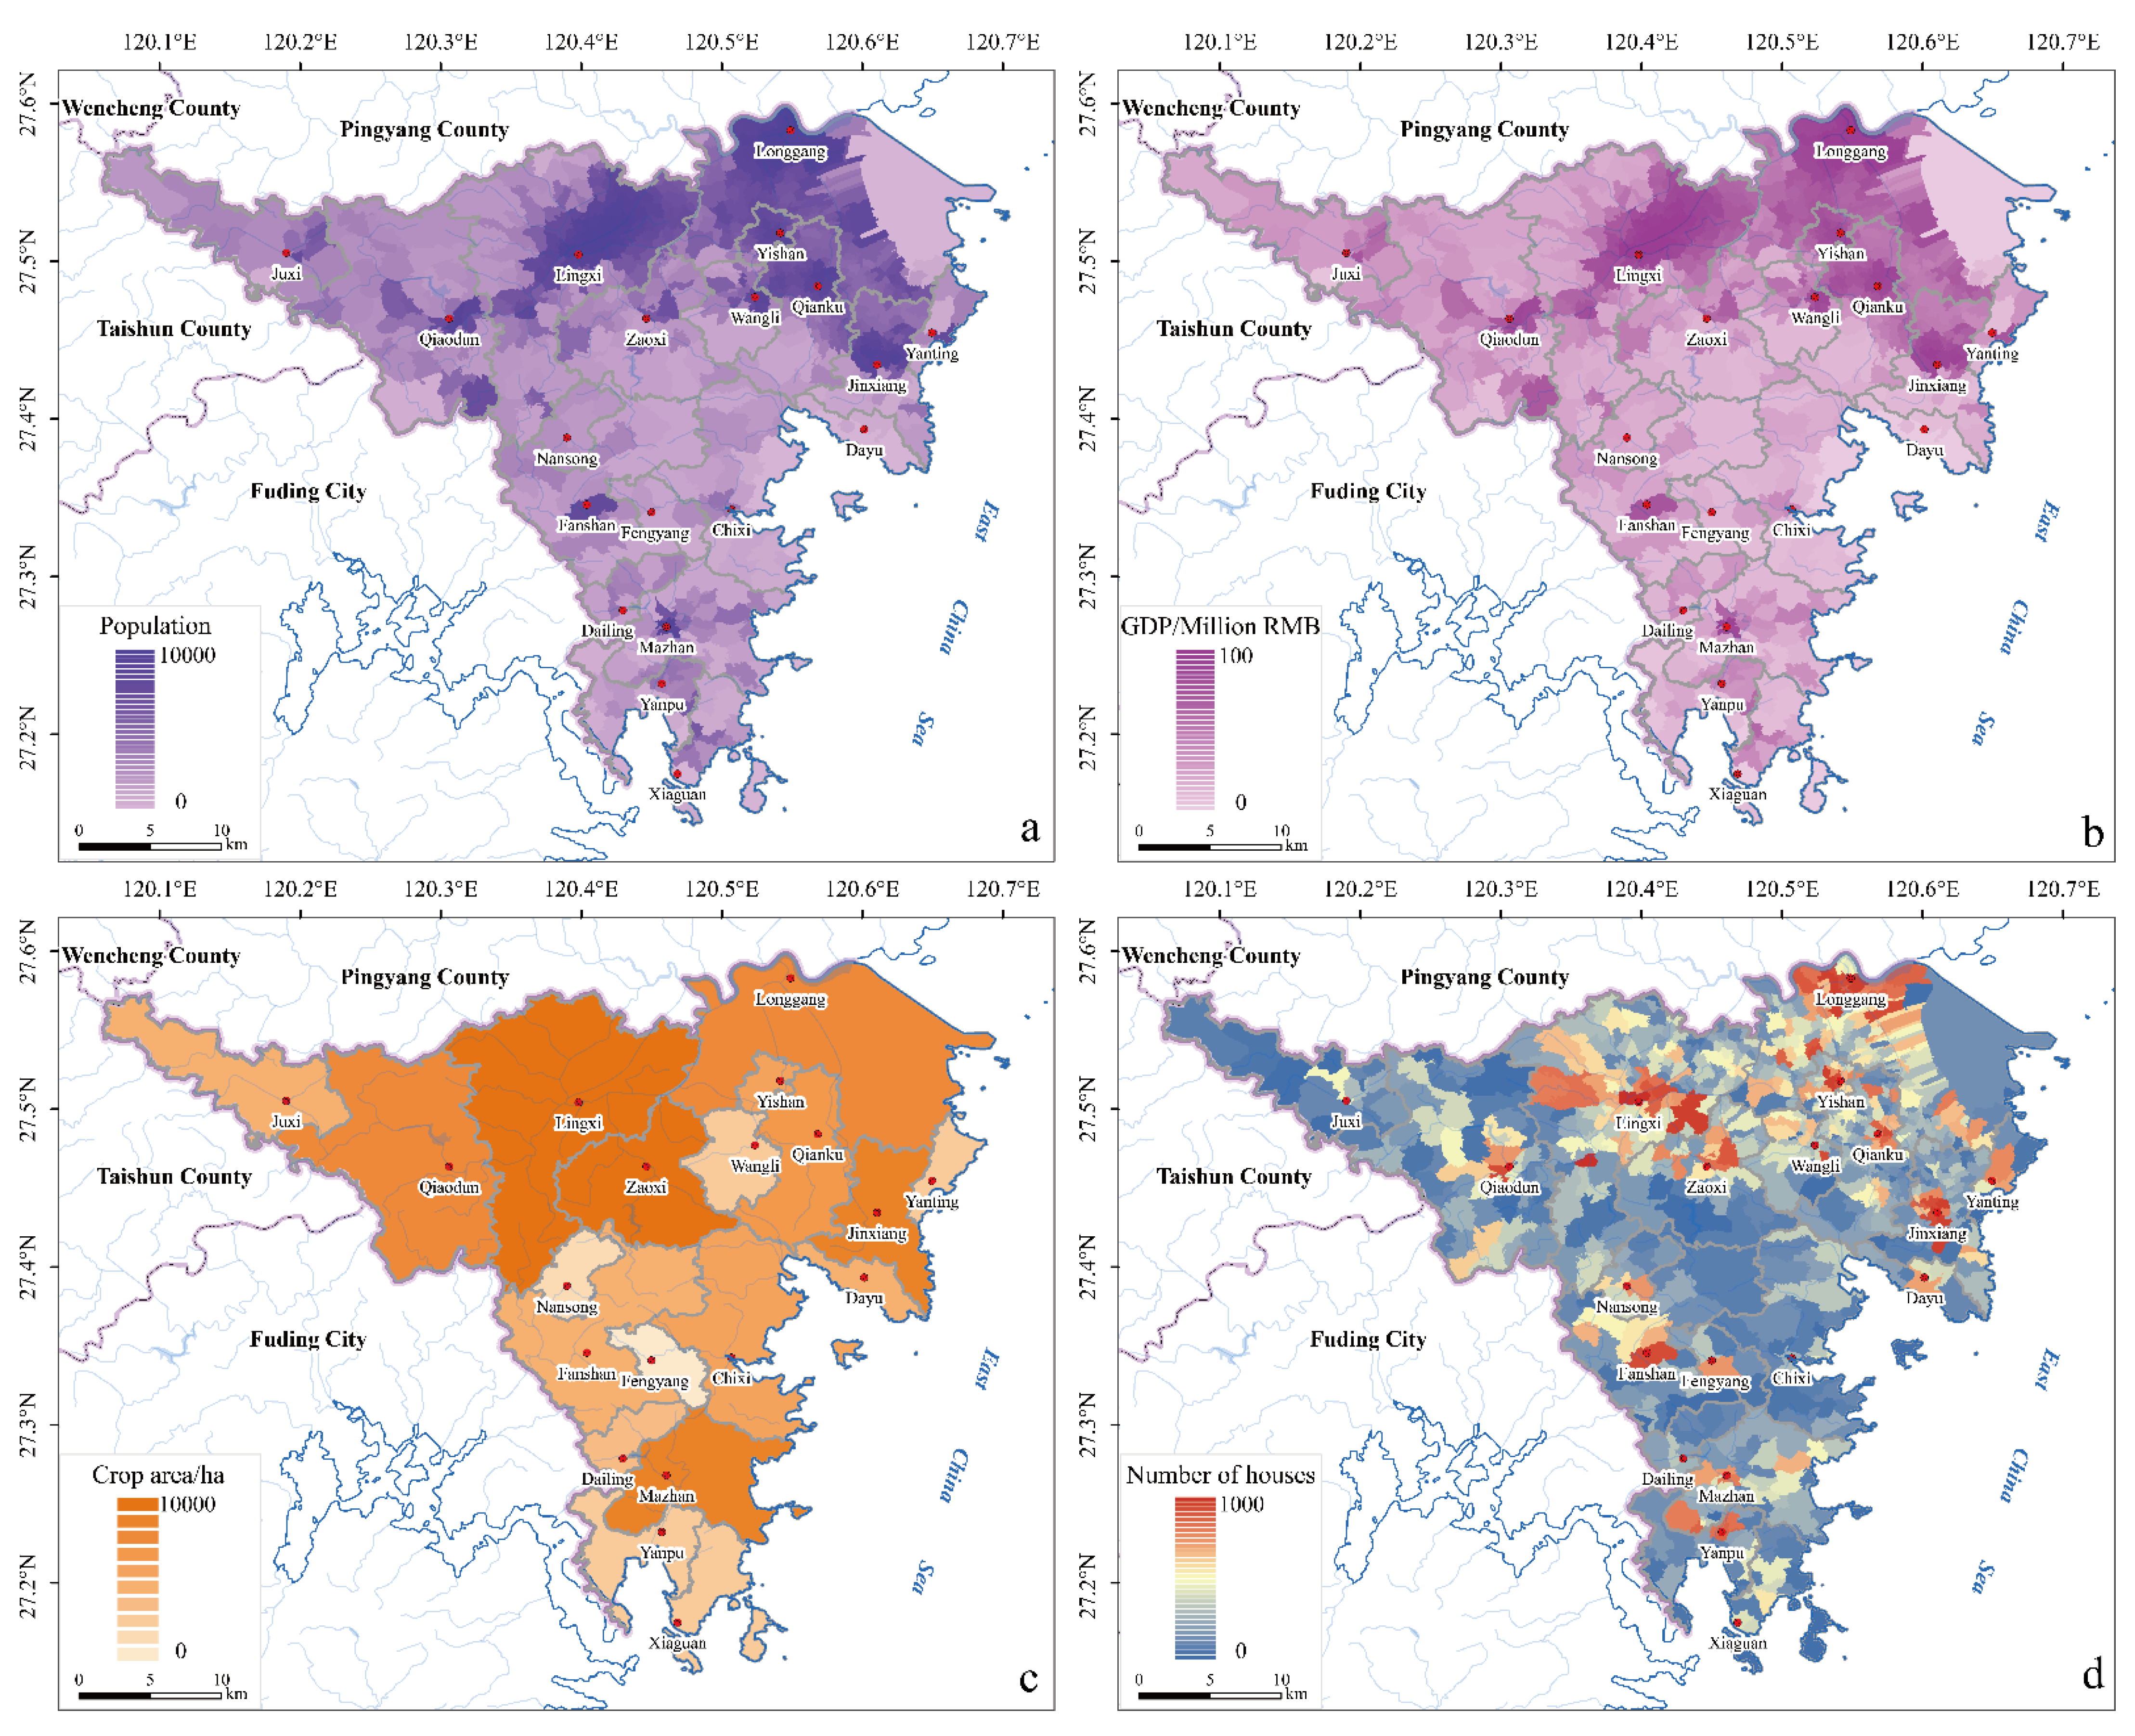
According to data from the Statistical Socioeconomic Survey of Government Authorities, the population, economy, crop, and house data of various towns and villages in Cangnan County in 2016 were selected to represent the socioeconomic exposure of climate-related hazard risk. The total household population of Cangnan County was 1.342 million, and the high-density areas were mainly distributed in areas centered around government housing in Lingxi, Longgang, Yishan, Qianku, Jinxiang, and Qiaodun Towns (Figure 3a). The gross regional product of Cangnan County was CNY 46.017 billion, and the per capita gross regional product was CNY 37,700. The economically developed areas were mainly located in the government housing of Lingxi, Longgang, Yishan, Qianku, and Jinxiang Towns in the northeast (Figure 3b). The total sown area of crops in Cangnan County was 43,761.67 hectares, and the main types of crops were grains, vegetables, and fruits. The main types of grain crops were rice and potatoes, with the larger sown areas mainly distributed in Lingxi and Zaoxi Towns (Figure 3c). There were more than 80,000 houses in Cangnan County, mainly concentrated in the government housing of each town (Figure 3d).

2.3.2. Comprehensive Risk of Multiple Climate-Related Hazards in Cangnan County

Based on the results of quantitative risk assessment of single hazards and single disaster-bearing bodies, by integrating the risk results of each disaster-bearing body, the comprehensive risk of multiple climate-related hazards was determined by a method of overlay analysis. By integrating the comprehensive risk of each hazard, the comprehensive risk of multiple climate-related hazards was determined by the same method. The comprehensive risk levels and the risk sources in medium- and high-risk areas were evaluated.
The comprehensive risk of multiple climate-related hazards was determined by the multiplicity of standard deviation, which uses the following equation:
α = x i x ¯ δ
where α indicates the multiples of standard deviation and δ indicates the standard deviation of each grid value, which is calculated with the following equation:
δ = i = 1 n ( x i x ¯ ) 2 n 1
where x i is the value of each grid greater than zero and x ¯ is the average of the grid values greater than zero.
For the classification standard, a value of α greater than one-quarter of the standard deviation was defined as high risk, a value lower than the negative one-quarter of the standard deviation was defined as low risk, and a value between low and high risk was defined as a moderate risk; a comprehensive risk value of zero was defined as no risk [40].

3. Results

This section presents an evaluation of the socio-economic risks of typhoons, floods, and droughts and the comprehensive risk of multiple climate-related hazards based on the natural disaster risk assessment model and the multiplicity of the standard deviation method. Given the more significant changes and impacts of severe hazards and the need for disaster prevention and mitigation, the following analysis focuses on the risk distribution of severe hazards. The risk patterns of strong tropical storms, typhoons, and strong typhoons with regard to typhoon hazard can be seen in the Supplementary Materials.

3.1. Typhoon Risk

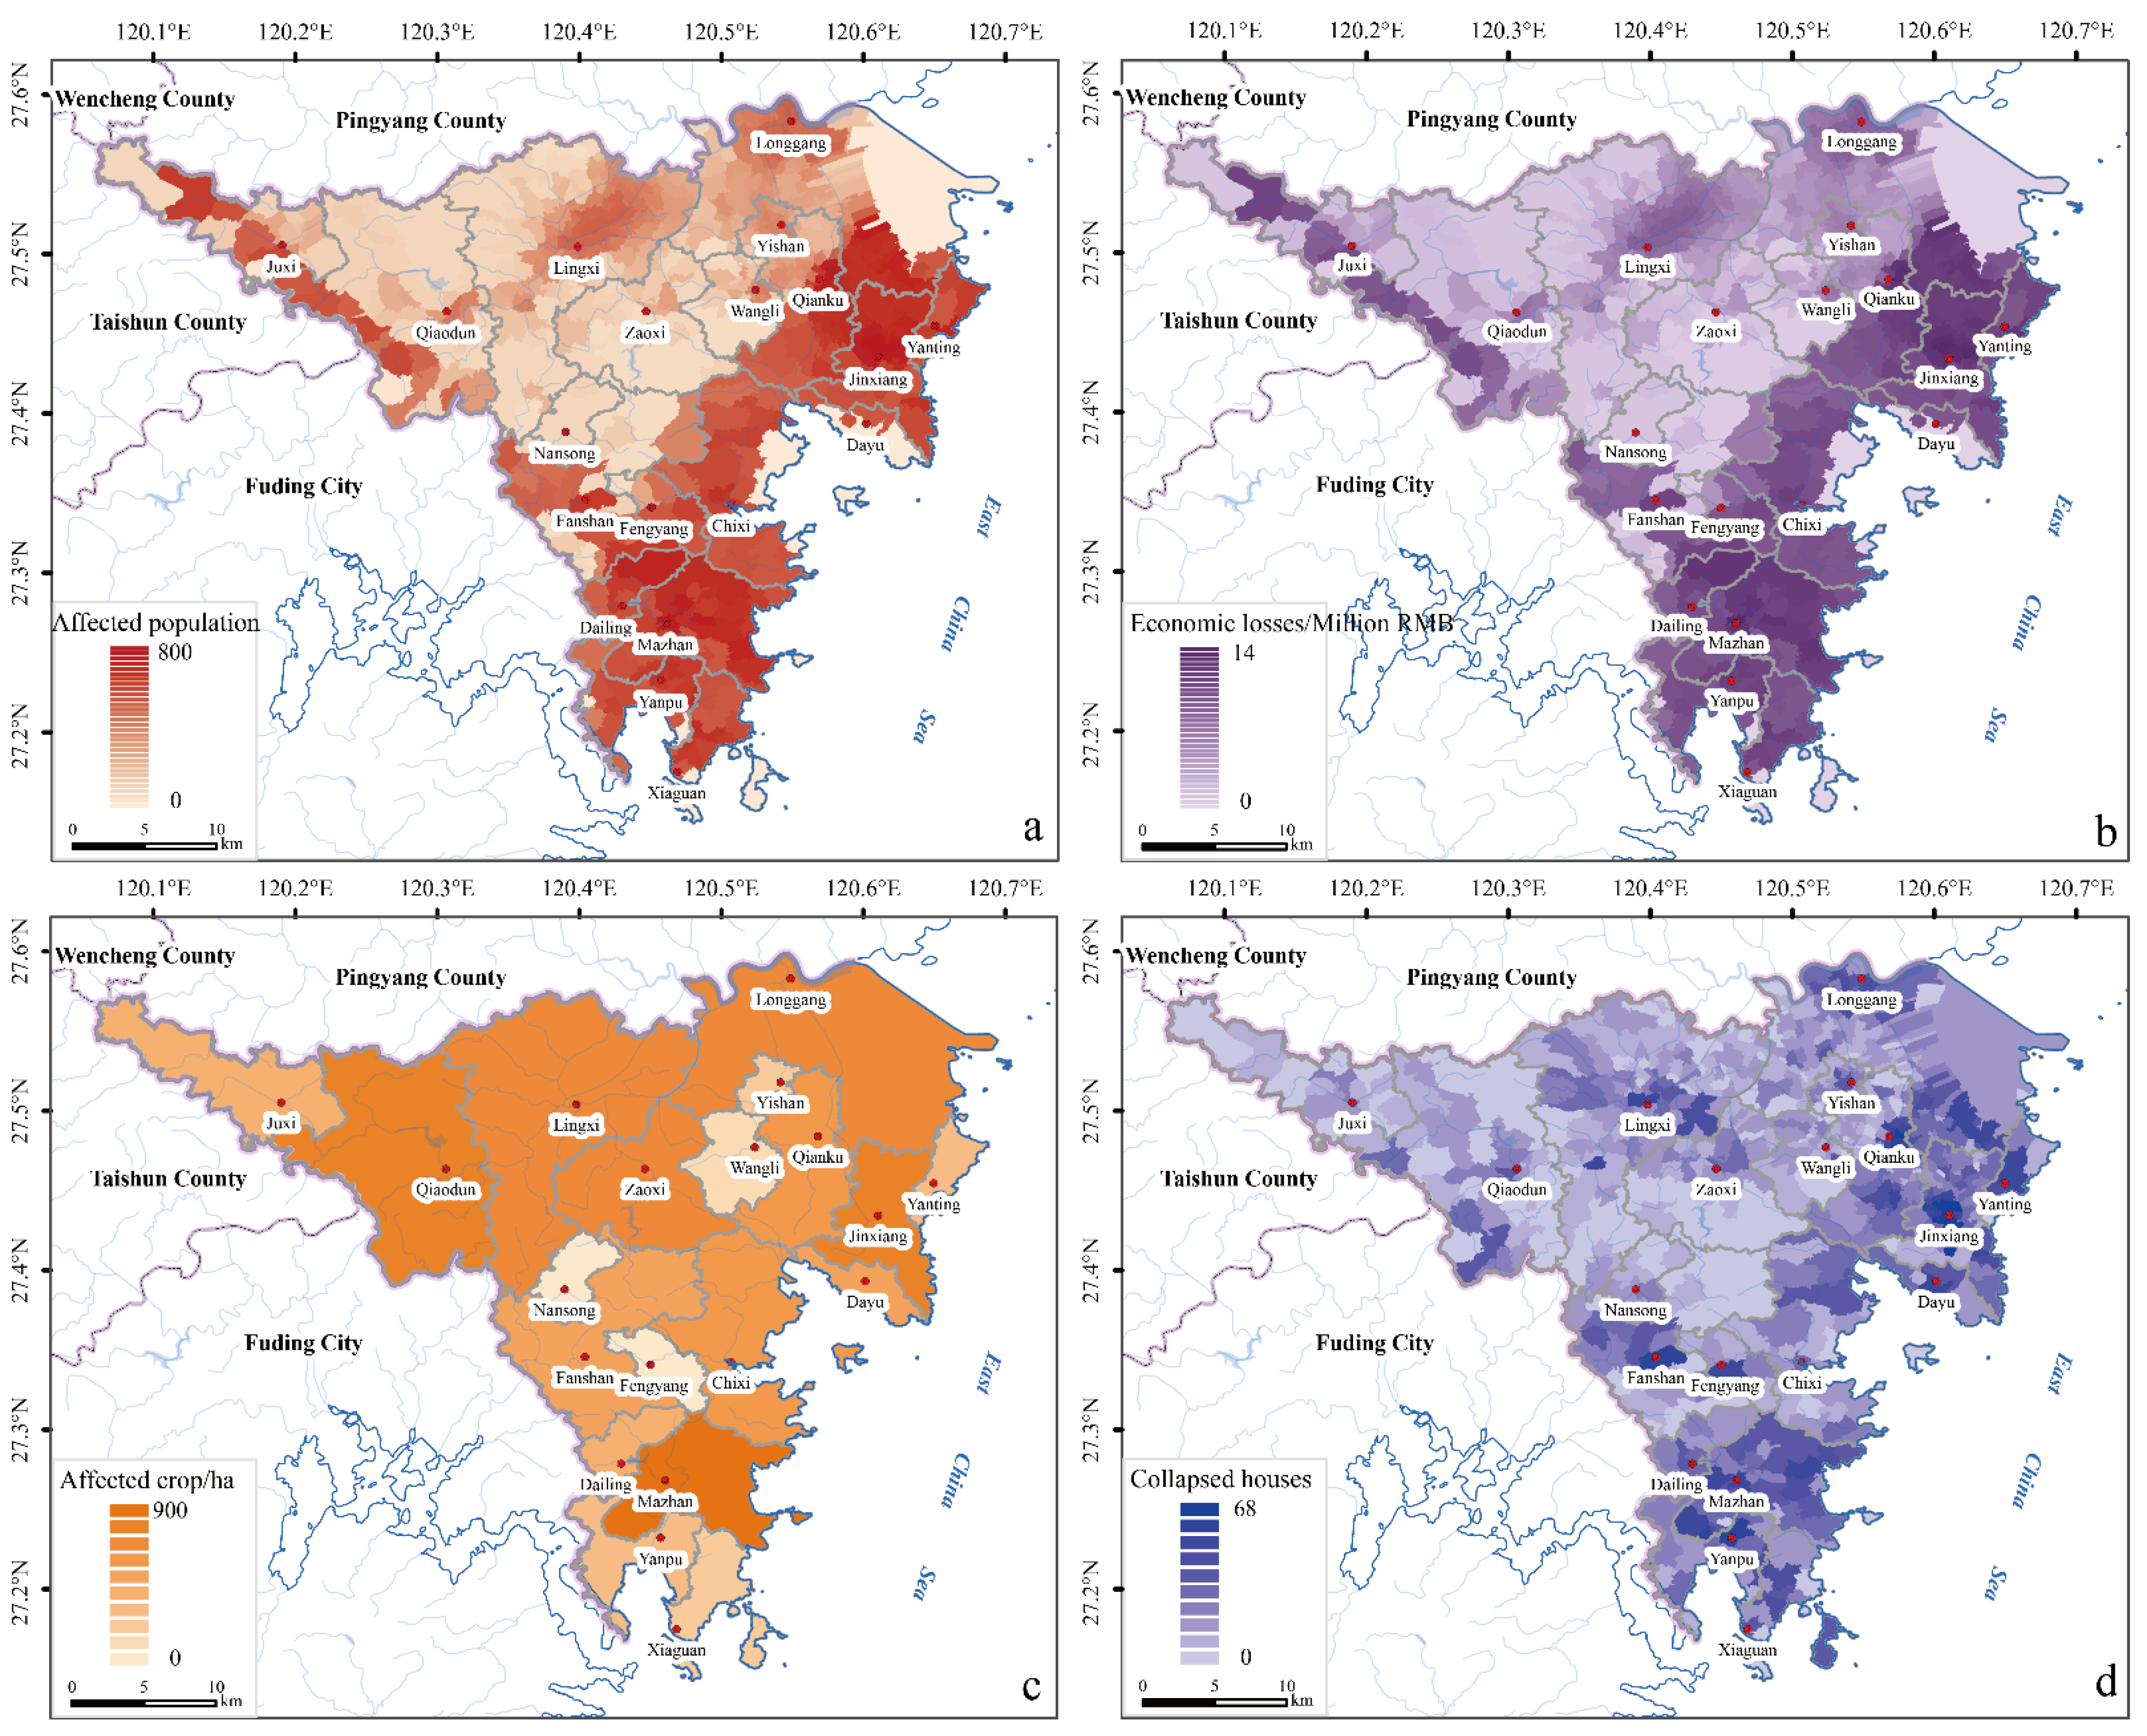
A super typhoon in Cangnan County would affect 127,500 people, collapse 4087 houses, cause economic losses of CNY 2.29 billion, and affect 3593 hectares of crops (Table 6). The distribution patterns of population, economy, house, and crop risks caused by a super typhoon are relatively balanced in the whole region, implying significant losses across the region due to a large amount of energy. The distribution patterns of population and economic risks are high in the southeast and low in the northwest, with the highest risk in Mazhan, Xiaguan, Yanpu, Dailing, and Jinxiang Towns (Figure 4a,b). Mazhan has the largest area of affected crops, followed by Qiaodun and Jinxiang (Figure 4c). The highest risk of house damage is in Jinxiang and Fanshan (Figure 4d). Among the three elements that constitute risk, hazard has the greatest impact on the high risk of a typhoon.
Synthesizing the population, economy, house, and crop risks caused by severe tropical storms, typhoons, severe typhoons, and super typhoons, based on the principle of prioritizing and the method of overlay analysis, the distribution pattern of comprehensive typhoon risk in Cangnan County was obtained. The comprehensive typhoon risk shows a high–low–high distribution pattern from north to south, with high-risk areas in northern Lingxi and Longgang and with medium-risk areas in southern Lingxi; northeastern Fanshan; and eastern Qiaodun, Zaoxi, and Mazhan (Figure 5).
Based on the natural hazard risk assessment model, typhoon risk depends on three aspects: hazard, exposure, and vulnerability. The distinct regional characteristics of typhoon tracks lead to different spatial patterns of risk for different typhoons with the same vulnerability and exposure distributions. Except for super typhoons, the risk of a severe typhoon, typhoon, and severe tropical storms present a distribution pattern of high in the north and low in the south (Supplementary Materials Figures S1–S3), and the synthesized comprehensive typhoon risk shows a distribution pattern of high in the north and south and low in the middle.

3.2. Drought Risk

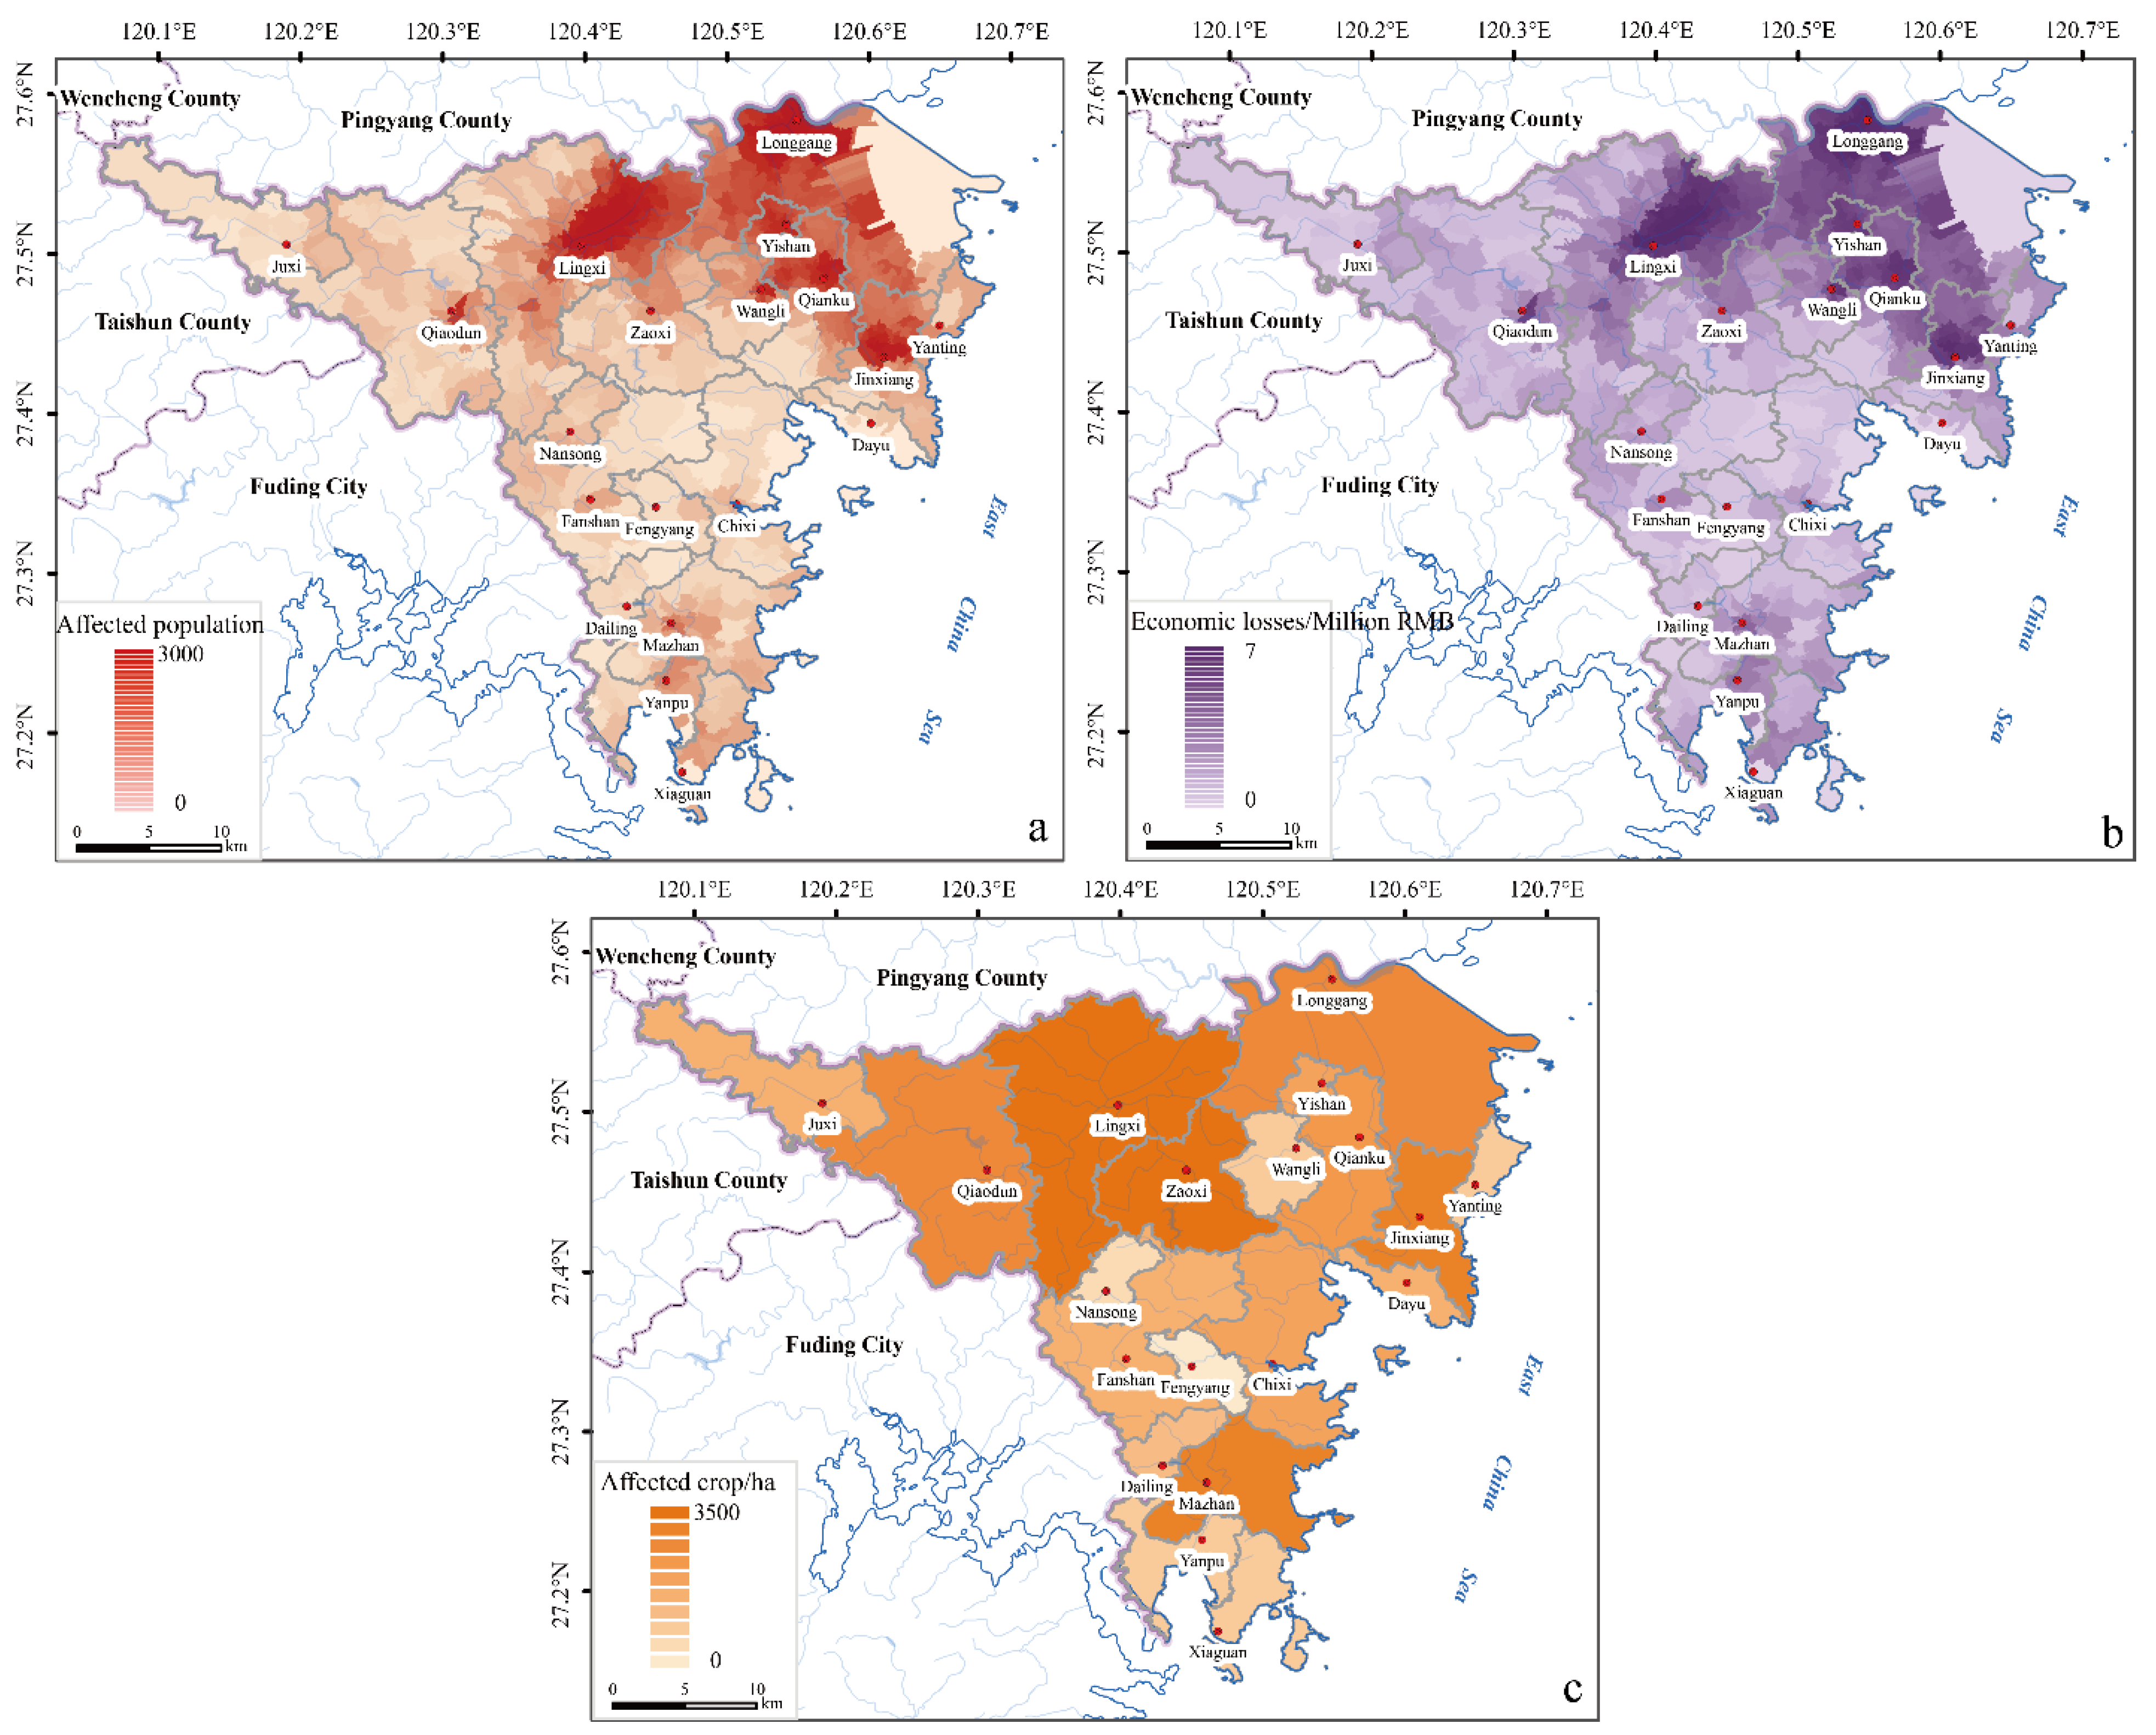
A severe drought disaster in Cangnan County would affect more than 1 million people and nearly 14,000 hectares of crops and would cause economic losses of CNY 91.63 million (Table 7). Under severe drought, the population and economic risk areas are mainly concentrated in the northeast, and the highest risks are in northwestern Longgang, eastern Lingxi, eastern Qiaodun, northern Qianku, eastern Wangli, and Yishan, and central Jinxiang (Figure 6a,b). The affected crop areas are larger in Lingxi and Zaoxi (Figure 6c). Among the three elements that constitute risk, exposure has the greatest impact on the high risk of drought.
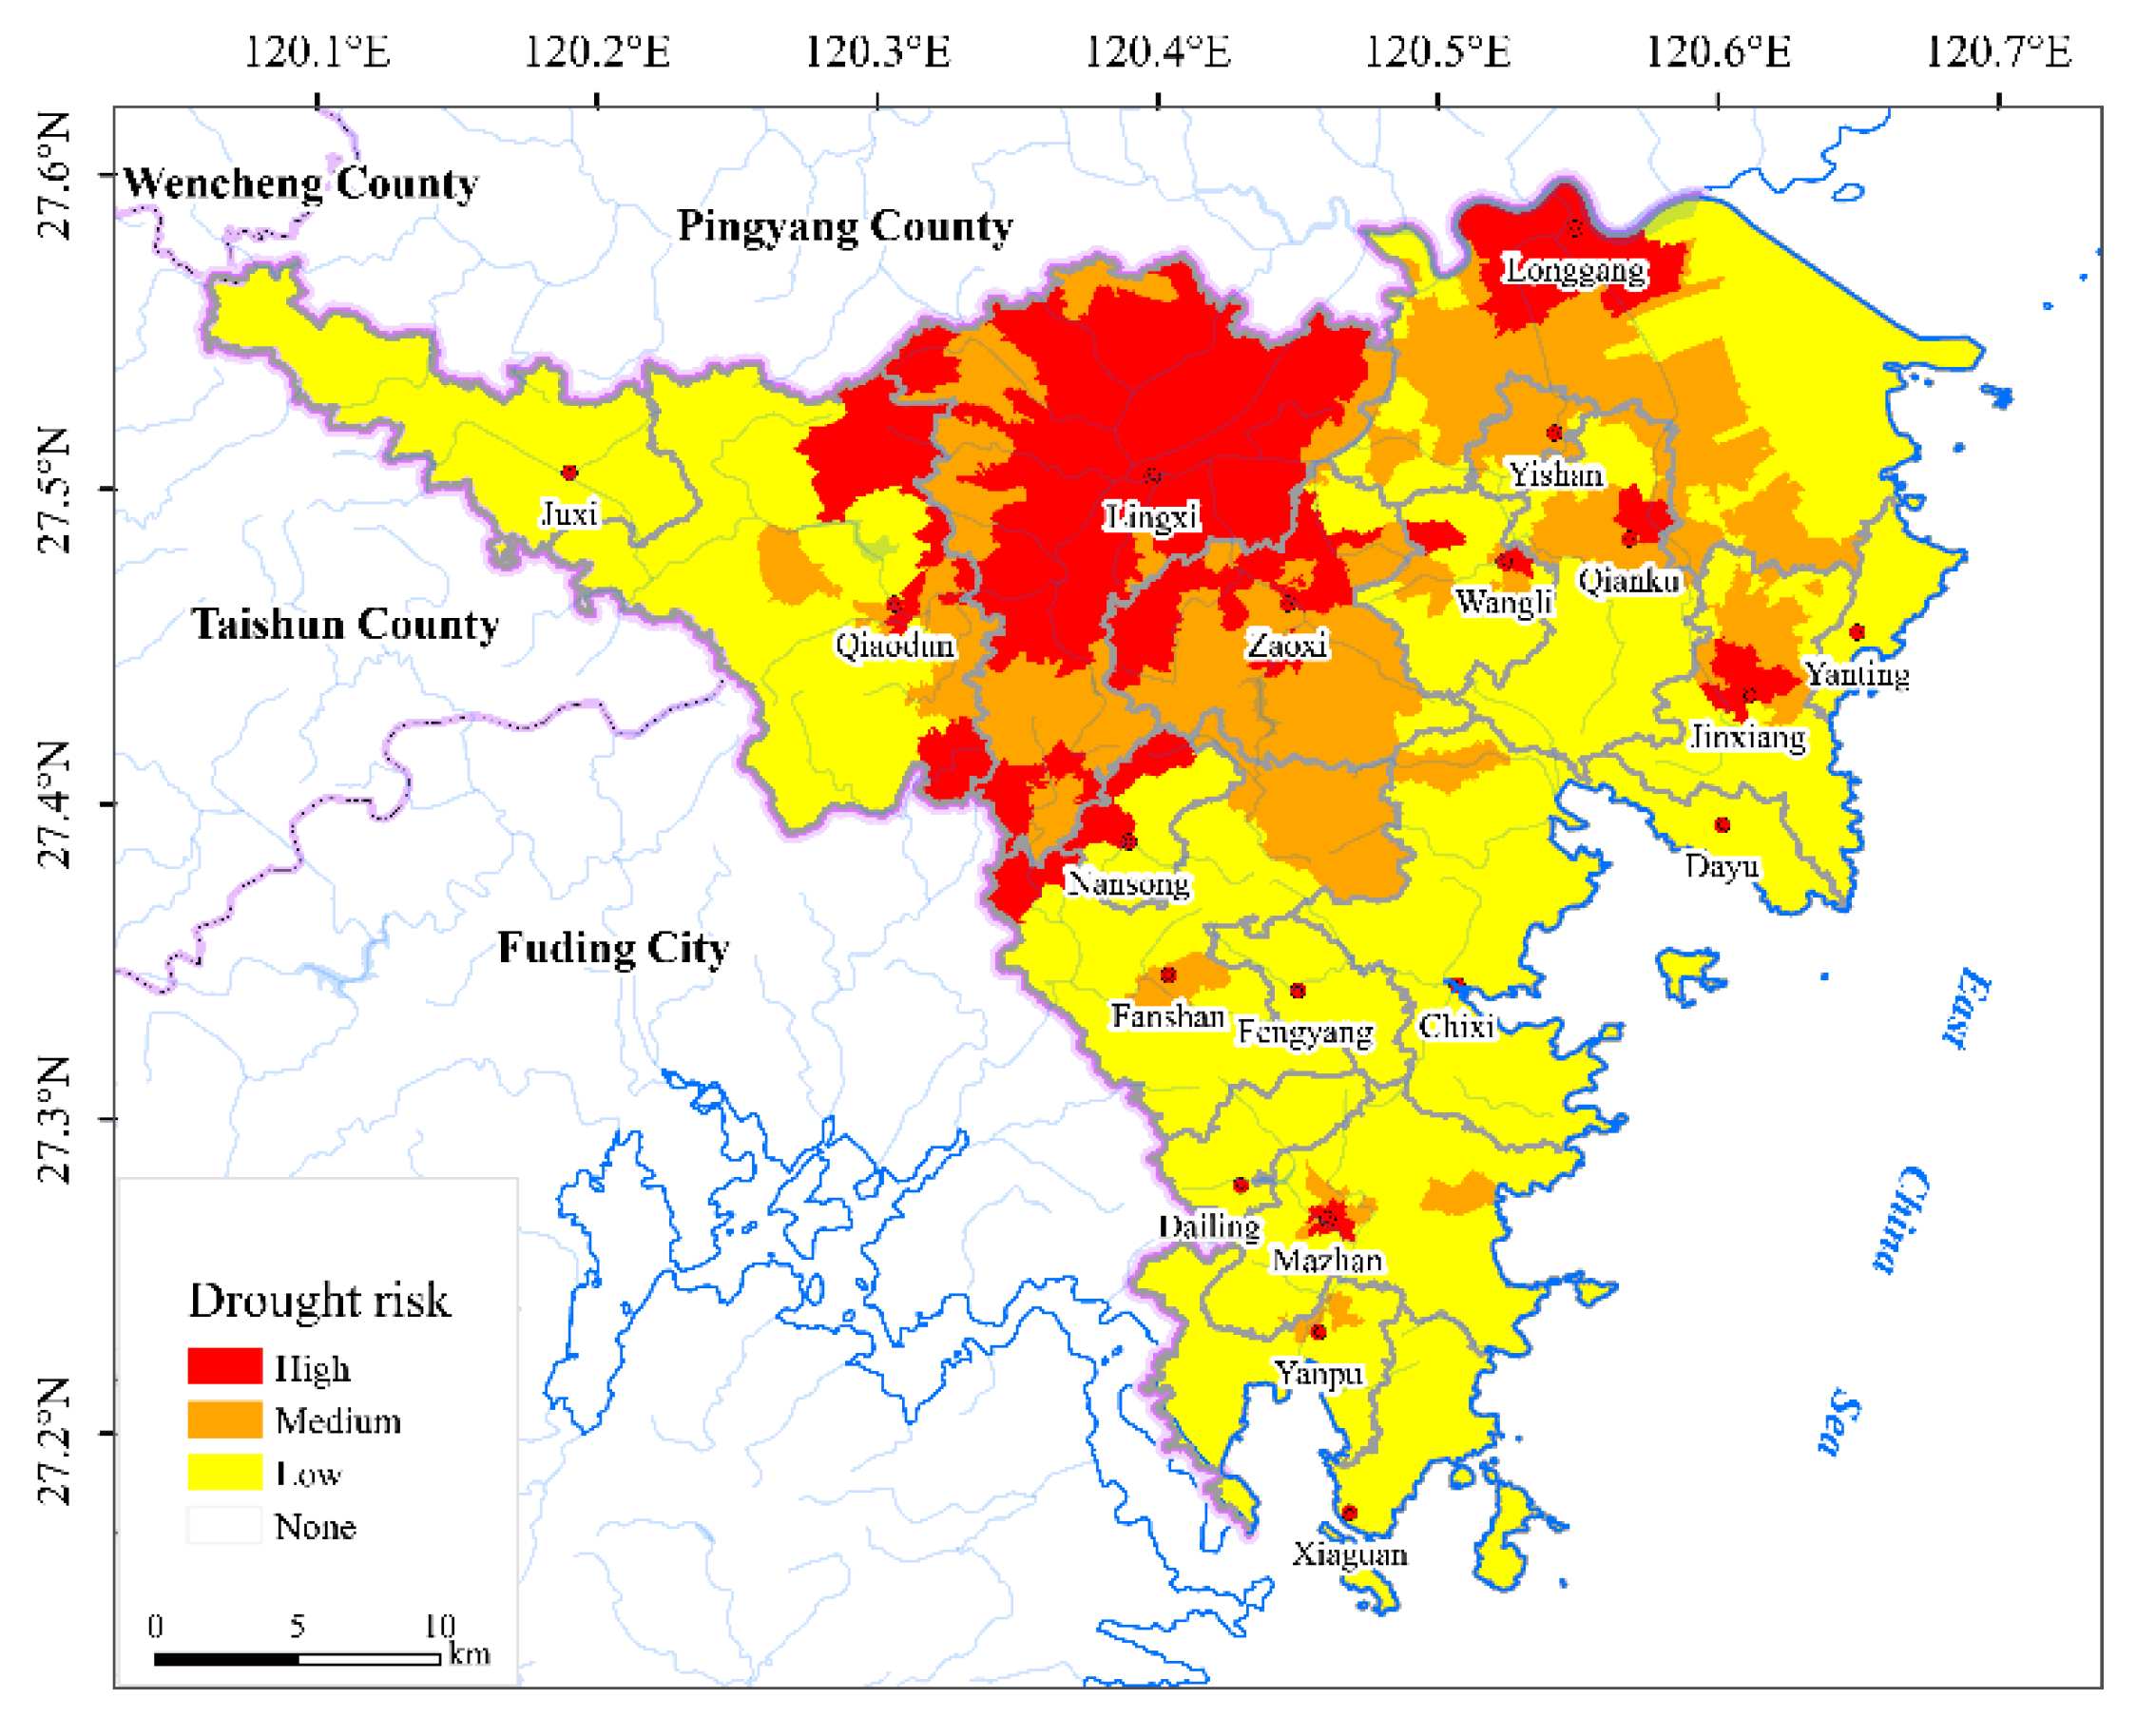
The distribution pattern of comprehensive drought risk in Cangnan County was obtained by synthesizing the risk to the population, economy, and crops caused by mild, moderate, and severe drought. Spatially, the comprehensive drought risk pattern is low in the south and high in the north, with high-risk areas mainly concentrated in northern Longgang, Lingxi, and Qianku; central Jinxiang; eastern Qiaodun; northern Zaoxi and Nansong; and central Mazhan and with middle-risk areas mainly distributed in central and southern Longgang, western and southern Lingxi, central and southern Zaoxi and Yishan, central Qianku, northern Jinxiang, central and eastern Qiaodun, and central Mazhan and Yanpu (Figure 7).
Compared with typhoons, drought hazard has a strong spatial consistency. With the same distribution of vulnerability and exposure, the spatial distribution pattern of risk for different droughts is similarly based on the natural hazard risk assessment model, showing a distribution pattern of high in the north and low in the south, and the distribution pattern of the synthesized comprehensive drought risk is also the same.

3.3. Flood Risk

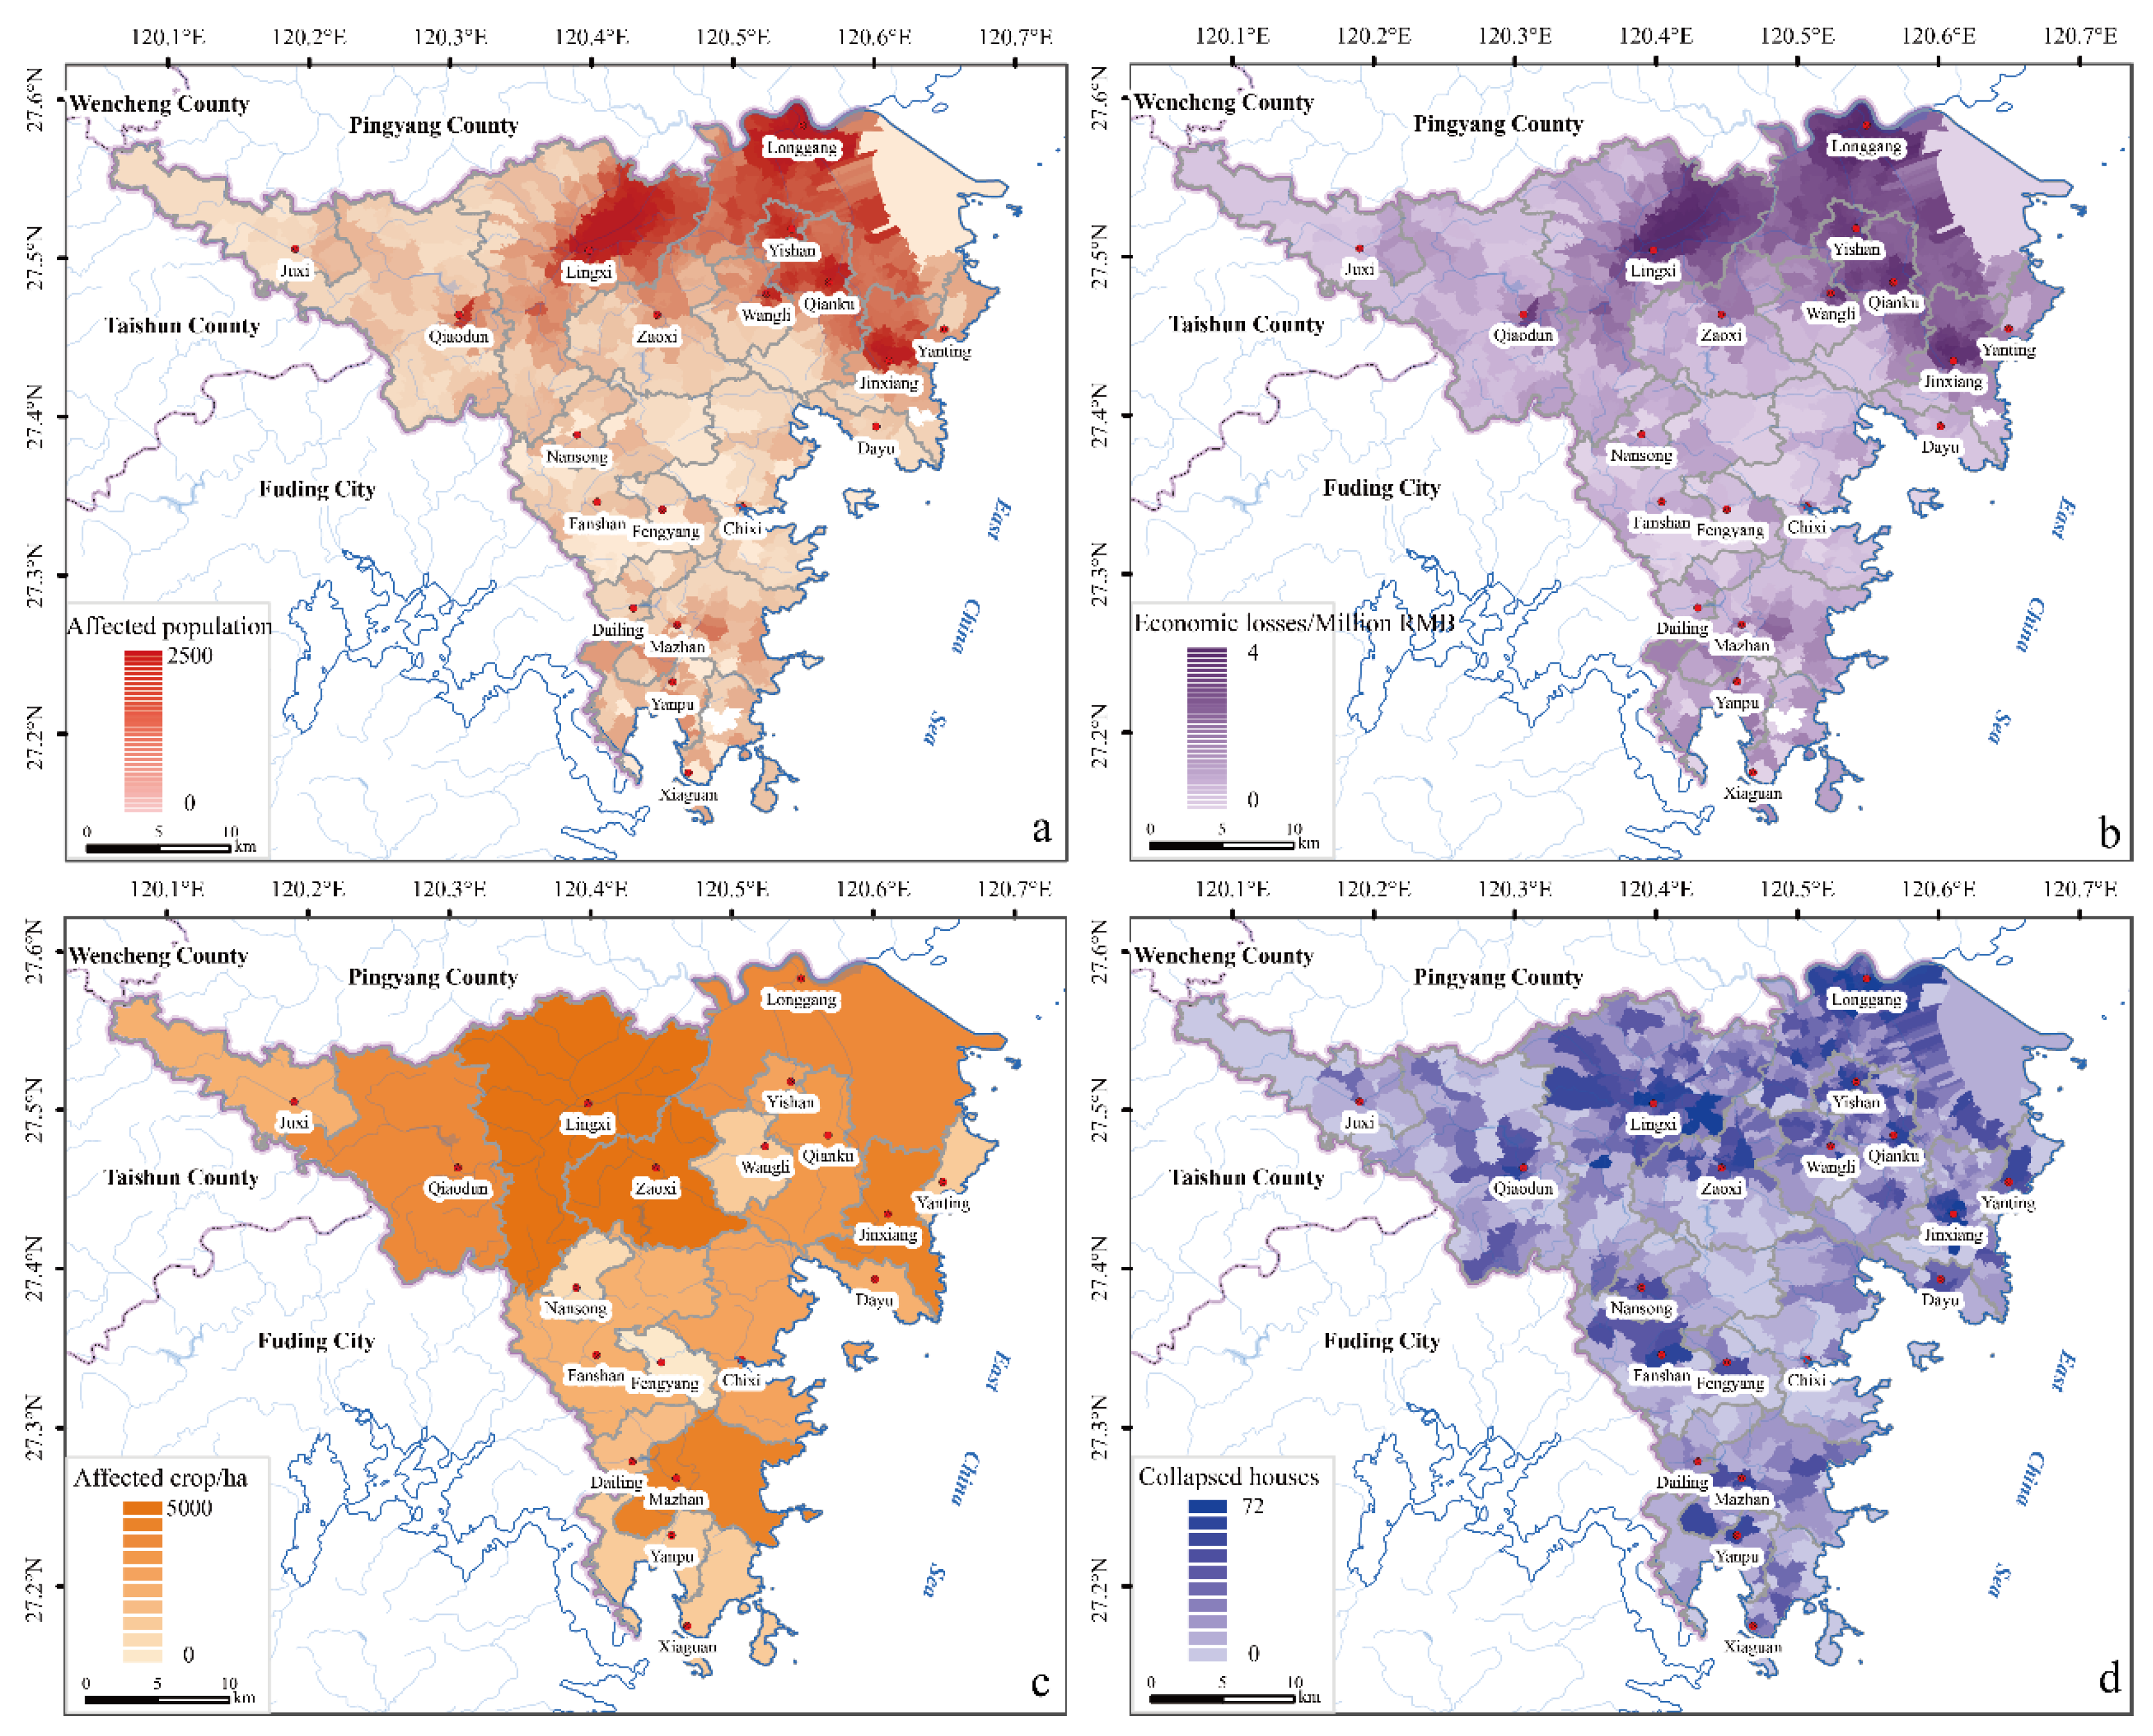
A severe flood in Cangnan County would affect 576,500 people, cause economic losses of CNY 843 million, damage 5600 houses, and affect more than 20,000 hectares of crops (Table 8). Under severe floods, the spatial distribution of population and economic risks is concentrated in the northeast, with the highest risk in northwestern Longgang, eastern Lingxi, northern Qianku, and central Yishan and Jinxiang (Figure 8a,b). The affected crop areas in Lingxi and Zaoxi would be relatively large (Figure 8c). In the north, houses in Lingxi, Longgang, and Yishan would be seriously damaged (Figure 8d). Among the three elements that constitute risk, exposure has the greatest impact on the high risk of floods.
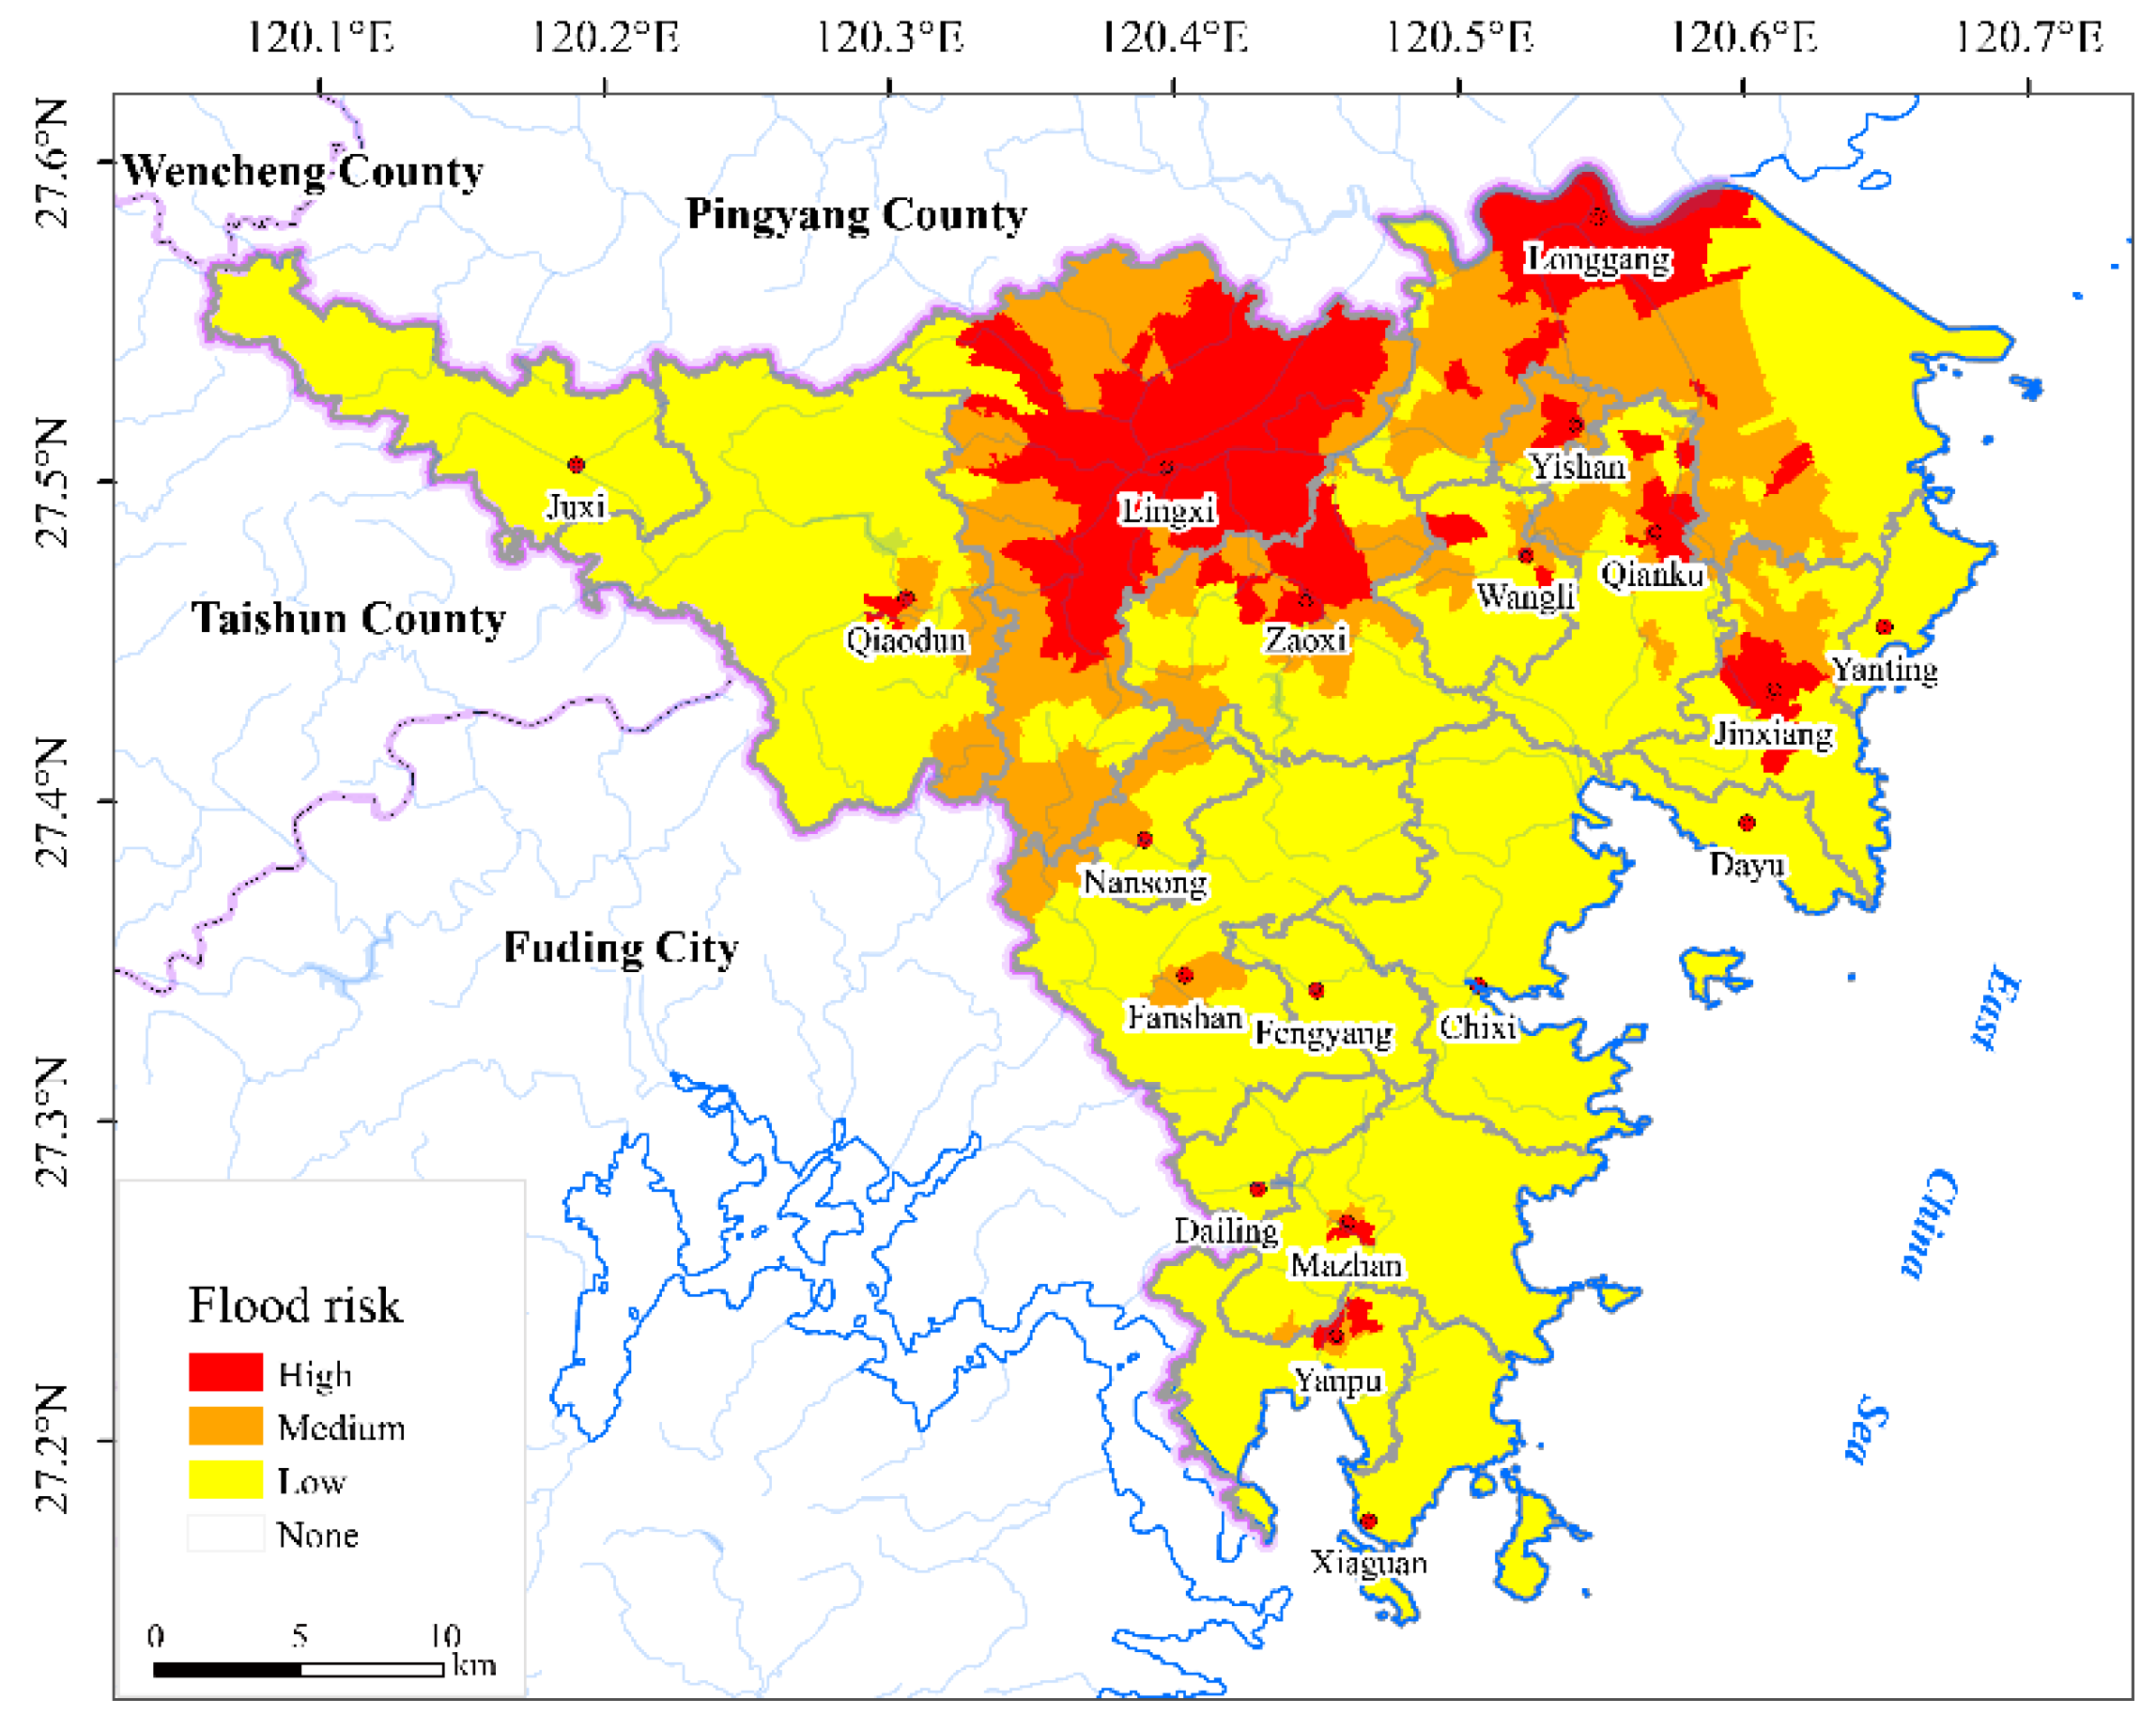
Synthesizing the population, economy, crop, and house risk caused by mild, moderate, and severe floods, the comprehensive risk distribution pattern of flood disasters in Cangnan County was obtained. Spatially, the comprehensive flood risk shows a pattern of low in the south and high in the north, with high-risk areas mainly concentrated in northern Longgang, Lingxi, Zaoxi, Yishan, and Qianku and central Jinxiang and with medium-risk areas mainly distributed in central and southern Longgang; northern and southern Lingxi; northern Yishan, Jinxiang, and Nansong; eastern Qiaodun; central Zaoxi, Fanshan, and Mazhan; and northern Yanpu (Figure 9).
In addition to the influence of climatic processes, floods are also affected by non-climatic processes such as topography, terrain, and river. The northeastern part of Cangnan County, with its low elevation, flat terrain, and dense river network, has a higher risk level, and risk of different floods and comprehensive flood risk patterns basically show this feature.

3.4. Comprehensive Multi-Hazard Risk

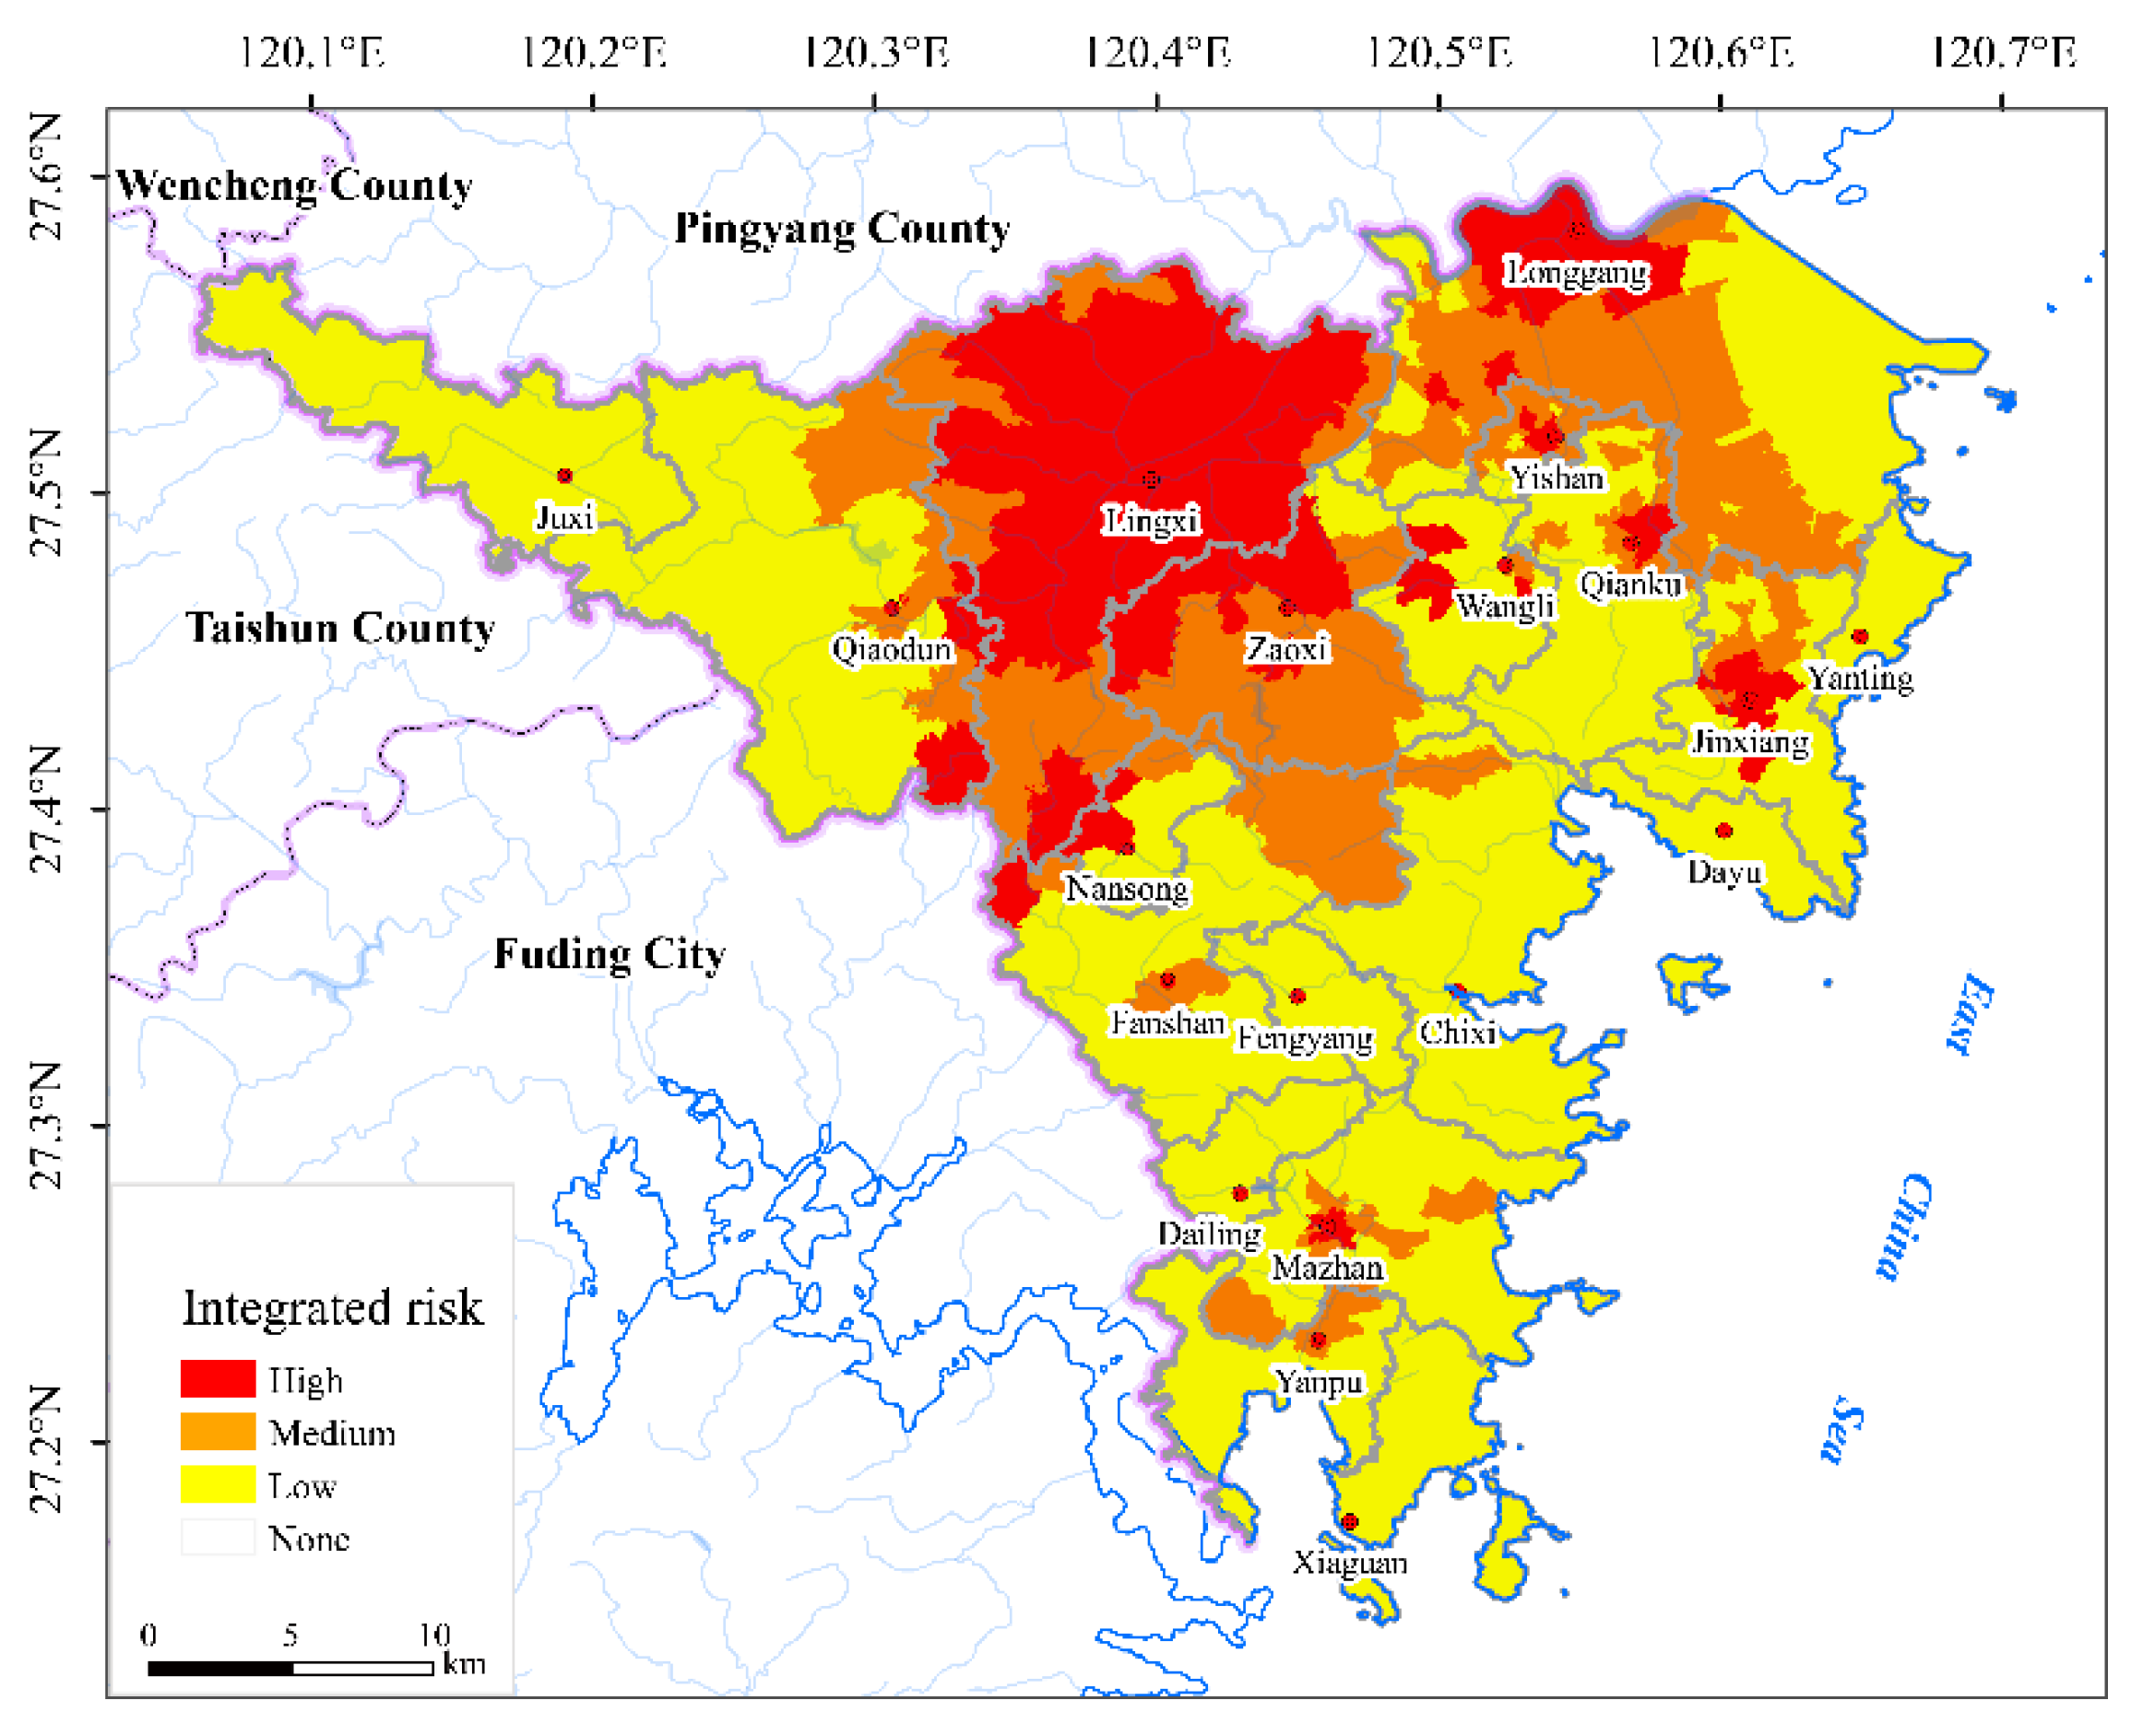
Based on the risk levels of typhoons, droughts, and floods in Cangnan County, an overlay analysis was used to determine the comprehensive risk of multiple climate-related hazards and to assess the risk sources in high-risk areas. The comprehensive risk is distributed in a pattern of being low in the northwest and south and being high in the north. Specifically, high risk is mainly distributed in central and northern Lingxi, northern and southern Longgang, northern Zaoxi, southeastern Qiaodun, northern Yishan, and central Qianku and Jinxiang, and medium risk is mainly distributed in northwestern and southern Lingxi, southern Longgang and Yishan, northern Qianku and Jinxiang, western Zaoxi, northern Nansong, central Fanshan and Mazhan, and northern Yanpu (Figure 10).
According to the risk analyses of typhoon, drought, and flood, the high risk in the southeast of Qiaodun Town is mainly due to typhoon and drought disasters, the high risk in the north of Yishan Town is mainly due to typhoon and flood disasters, while the other high-risk areas are due to the combined impacts of three disasters.

4. Discussion

(1)
East China has the highest level of natural disaster risk in the country, and the main contributing disaster-bearing bodies include water resources, the cryosphere, ecosystems, agriculture, transportation, energy, livelihood, and health [46]. Therefore, we first determined the scope of the selection of typical regions in East China. Then, according to the literature [34], areas with high hazard intensity and exposure to disaster-bearing bodies were selected for evaluation, considering the availability of disaster loss data. Finally, Cangnan County was selected as a typical area for the study. Compared with other regions, the terrain is mainly mountainous and hilly, natural disasters occur frequently, and the population density is large, so natural disasters have a far-reaching impact on social and economic development. In addition, Cangnan County completed a preliminary risk survey in 2017, compiling the basic data needed for risk assessment (see Section 2.2 in Materials and Methods), which laid the foundation for this work.
(2)
According to a series of reports from the Intergovernmental Panel on Climate Change (IPCC), disaster risk results from the interaction of hazards with the vulnerability and exposure of human and natural systems [37]. Therefore, disaster risk depends not only on the hazard but also on the exposure and vulnerability level of the disaster-bearing body. Taking typhoon disaster in Cangnan County as an example, the hazard intensity of super typhoons is the worst but the risk to the population and crops is lower than that of severe typhoons. The main reason is that the exposure of eastern regions affected by super typhoons is lower than that of central and northern regions affected by strong typhoons.
(3)
This study provides a comprehensive quantitative method for assessing the risk of single and multiple hazards at the county level. This method is a significant improvement over the semi-quantitative assessment of regional natural disaster risk by grade. Comprehensive multi-hazard risk is calculated using equal-weighted overlap analysis. Before obtaining the scientific weight, this is a feasible choice that can avoid underestimating the risk of events with small probability and large loss.
(4)
Comprehensive risk is the possible damage to the society, economy, and resources, and environment caused by multiple natural disasters. Quantitative assessment is needed to support risk prevention. We quantify the loss risk from three elements. The interaction of multiple elements will lead to complex results. It is difficult to merge and classify the research objects. In addition, the research area is small (and the village is the evaluation unit) and there are many disasters, also to avoid fragmentation of risk levels within the towns and townships and to facilitate risk management. Therefore, the division of the three risk levels of high, medium, and low is more conducive to the display space pattern, which is more suitable than the four levels of high, medium-high, medium, and low or the five levels high, medium-high, medium, medium-low, and low. In summary, this study uses the multiplicity of standard deviation method as the basis for risk classification. Taking the direct economic loss risk of a severe typhoon in Cangnan County as an example, the high risk is roughly the 80th percentile of this type of hazard/hazard-bearing body risk.
(5)
The county unit is a unique administrative unit in China and an important part of disaster impact and relief. It is important to carry out a quantitative assessment and pattern analysis of disaster risk within counties to correctly and comprehensively understand the risk of natural disasters; to improve the capacity of disaster prevention, mitigation, and relief; and to complete the database of natural disaster capacity. Taking Cangnan County as an example, this study relied on high-precision meteorological and geographic information data to calculate the hazards of different disasters as well as the exposure and vulnerability of disaster-bearing bodies based on official survey data. According to the natural disaster risk assessment mechanism, county-scale disaster risks were obtained by calculating the functions of hazard, exposure, and vulnerability, thus laying a methodological foundation for county-scale risk assessment.
(6)
At the same time, due to limitations in data availability, many indicators (for example, loss records from earthquakes, hailstorms, snowstorms, lightning, and other disasters as well as survey results on disaster-bearing bodies such as roads and public service facilities) were not obtained, which might have a certain impact on the results of the risk assessment. However, in this paper, the data of disaster-bearing bodies were accurate at the village and town levels. Although the samples were limited, this ensured data aggregation, less dispersion, and more accuracy in the loss estimation. Overall, this paper clarifies the definition and formation mechanism of main disaster risks at the county scale; quantifies the regional hazard of disasters and the vulnerability of disaster-bearing bodies; improves the assessment level of main disaster risks; and is expected to provide scientific support for disaster prevention, mitigation, and emergency management at the county level.

5. Conclusions

This paper comprehensively analyzed the socioeconomic risks of typhoons, droughts, and floods in Cangnan County and reached the following conclusions:
(1)
The distribution pattern of comprehensive risk of multiple climate-related hazards in Cangnan County is low to the south and high to the north, and the high-risk areas are mainly located in Lingxi and Longgang Towns in the north. The high risk in most areas is affected by the combined effects of three types of climate-related hazards.
(2)
The probability of typhoon occurrence in Cangnan County changes from a pattern of being high in the west and low in the east to be high in the south and low in the north as the level increases, and the risk shows a pattern of being low in the north and west and being high in the west and east, with high-risk areas mainly distributed in Lingxi Town. The spatial patterns of drought and flood risks in the county are similar, showing a pattern of being low in the south and being high in the north, with high-risk areas mainly concentrated in Longgang, Lingxi, Qianku, and Zaoxi Towns. The distribution of typhoon risk is mainly affected by hazards, while the distribution of drought and flood risk is most influenced by exposure.
Due to the high concentration of population, houses, economy, and arable land in the north-northeast, the possibility of climate-related hazards is also high, resulting in a high-risk level in this area; the high exposure of arable land and vulnerability in the south makes it a high-risk area after the north-northeast. According to the risk characteristics of climate-related hazards, based on strengthening the early warning of climate-related hazards, in areas with dense population, houses and economy, reinforce coastal embankments and set up multi-level defense system urban flood relief area planning; in areas with high exposure of arable land, the standard of agricultural production against typhoon, flood, and drought should be improved. In addition, attention should be paid to coastal wetland protection and ecological reconstruction in coastal areas.
This work proposes a new method for comprehensive risk assessment of multiple climate-related hazards, and selects Cangnan County as a typical area, considering three disasters: typhoon, flood, and drought. The evaluation method proposed in this work is scientific and universal, easy to operate, and can be widely used in risk assessment at the district and county levels. However, natural disasters have obvious regional differentiation characteristics in China [47,48]. The disasters and disaster-bearing bodies selected in this study have strong regional characteristics, and it is necessary to consider the disaster-causing and disaster-forming mechanisms of the region when using this method in other regions, which can be done in the following three aspects: firstly, consider the regional dominant disasters, such as earthquake disaster, geological disaster, meteorological disaster, hydrological disaster, forest fire disaster, and marine disaster; secondly, consider the distribution of regional disaster-bearing bodies and select the appropriate ones for the assessment in conjunction with the vulnerability level; finally, the comprehensive risk of multi-hazards could determine the respective weights according to the risk level of single hazards. The single-hazard risk and the comprehensive risk of multi-hazard in this study are divided into three levels according to the risk value. The risk assessment results can be provided to government decision-makers, business leaders, and the public to facilitate the formulation of risk management plans from disaster prevention, resilience, and relief, and encourage stakeholders to actively participate in the process. This can provide the necessary response measures for the management of different levels of risk, reduce the risk of natural disasters, enhance the awareness of natural disaster prevention, optimize the early warning system of natural disasters, and realize the sustainable development of the regional social economy.
Disaster cluster refers to hazards clustering in space and time without any linkage, which is mainly affected by the disaster-generating environment in a specific area (such as climate type, topography, and surface interface characteristics) and can be used to measure the severity of disaster clustering in a specific area or a specific period [49]. For example, influenced by atmospheric circulation and topographic fluctuations, large-scale heatwaves, floods, and periodic droughts occurred frequently in the middle reaches of the Yangtze River in 2018. The quantitative assessment model of comprehensive risk of multi-hazard proposed in this work provides a feasible idea for disaster cluster risk assessment. A disaster chain is a series of disaster phenomena caused by a kind of disaster, which can be divided into concurrent disaster chain and serial disaster chain according to the chain characteristics. The earthquake has a strong disturbance on the surface, leading to the occurrence of many secondary mountain disasters, and the disaster chain behaves strongly. Disaster encounter is the simultaneous or successive occurrences of two or more disaster events that have no root cause relationship. Even if a single event is not extreme, its extreme will be expanded due to the effect of the encounter. The most obvious example is that in the context of sea level rise, the encounter of storm surges and astronomical high tides will create the most extreme water levels. For the disaster chain and disaster encounter, the hazard factors have a genetic connection, which is manifested as the cascading effect or superposition effect between the hazard factors. The risks need to strengthen the research of the vulnerability curve or the vulnerability surface and carry out risk assessment through a probability model.

Supplementary Materials

The following are available online at https://www.mdpi.com/article/10.3390/atmos12081022/s1, Figure S1: Spatial patterns of severe typhoons risks in Cangnan County (a, population; b, economy; c, crop; d, house), Figure S2: Spatial patterns of typhoons risks in Cangnan County (a, population; b, economy; c, crop; d, house), Figure S3: Spatial patterns of severe tropical storm risks in Cangnan County (a, population; b, economy; c, crop; d, house).

Author Contributions

Conceptualization, G.G. and L.L.; methodology, J.G.; validation, G.G., J.G. and S.W.; formal analysis, L.L.; data curation, S.L.; writing—original draft, G.G. and Y.L.; writing—review and editing, L.L. and J.G.; visualization, L.L.; supervision, G.G.; project administration, G.G.; funding acquisition, J.G. and S.W. All authors have read and agreed to the published version of the manuscript.

Funding

This research was supported by the National Key Research and Development Program of China (2018YFC1508900, 2018YFC1508801, and 2018YFC1509002) and by the Strategic Priority Research Program of the Chinese Academy of Sciences (XDA19040304).

Institutional Review Board Statement

Not applicable.

Informed Consent Statement

Not applicable.

Data Availability Statement

Publicly available datasets were analyzed in this study.

Conflicts of Interest

The authors declare no conflict of interest.

References

  1. UNDRR; CRED. Economic Losses, Poverty & Disasters (1998–2017); CRED: Brussels, Belgium, 2018; Available online: https://www.unisdr.org/files/61119_credeconomiclosses.pdf (accessed on 20 July 2021).
  2. UNDRR; CRED. The Human Cost of Disasters: An Overview of the Last 20 Years (2000–2019); UNDRR: Geneva, Switzerland, 2020. [Google Scholar]
  3. Ministry of Emergency Management of the People’s Republic of China Website. Available online: https://www.mem.gov.cn/xw/yjglbgzdt/202101/t20210108_376745.shtml (accessed on 20 July 2021).
  4. UNGA. Sendai Framework for Disaster Risk Reduction 2015–2030; UN: Sendai, Japan, 2015. [Google Scholar]
  5. Ding, Y.; Shi, P.J. Fuzzy risk assessment model of typhoon hazard. J. Nat. Disasters 2007, 11, 34–43. [Google Scholar] [CrossRef]
  6. Wang, W.; Wang, T.; Su, J.; Lin, C.; Seng, C.; Huang, T. Assessment of damage in mountain tunnels due to the Taiwan Chi-Chi Earthquake. Tunn. Undergr. Space Technol. 2001, 16, 133–150. [Google Scholar] [CrossRef]
  7. Dai, F.C.; Lee, C.F.; Ngai, Y.Y. Landslide risk assessment and management: An overview. Eng. Geol. 2002, 64, 65–87. [Google Scholar] [CrossRef]
  8. Bosa, S.; Petti, M. A Numerical Model of the Wave that Overtopped the Vajont Dam in 1963. Water Resour. Manag. 2013, 27, 1763–1779. [Google Scholar] [CrossRef]
  9. Liu, X.; Zhang, J.; Tong, Z.; Bao, Y. GIS-based multi-dimensional risk assessment of the grassland fire in northern China. Nat. Hazards 2012, 64, 381–395. [Google Scholar] [CrossRef]
  10. Lin, N.; Emanuel, K.; Smith, J.; Vanmarcke, E. Risk assessment of hurricane storm surge for New York City. J. Geophys Res.-Atmos 2010, 115, D18121. [Google Scholar] [CrossRef] [Green Version]
  11. Shahid, S.; Behrawan, H. Drought risk assessment in the western part of Bangladesh. Nat. Hazards 2008, 46, 391–413. [Google Scholar] [CrossRef]
  12. Fox-Rogers, L.; Devitt, C.; O’Neill, E.; Brereton, F.; Clinch, J. Is there really “nothing you can do”? Pathways to enhanced flood-risk preparedness. J. Hydrol. 2016, 543, 330–343. [Google Scholar] [CrossRef] [Green Version]
  13. Ozger, M. Assessment of flood damage behaviour in connection with large-scale climate indices. J. Flood Risk Manag. 2017, 10, 79–86. [Google Scholar] [CrossRef] [Green Version]
  14. Pelling, M. Visions of risk: A review of international indicators of disaster risk and its management. ISDR/UNDP King’s Coll. Univ. Lond. 2004, 2004, 1–56. [Google Scholar]
  15. Bell, R.; Glade, T. Multi-hazard analysis in natural risk assessments. Risk Anal. 2004, 77, 1–10. [Google Scholar]
  16. Kappes, M.S.; Papathoma-Kohle, M.; Keiler, M. Assessing physical vulnerability for multi-hazards using an indicator-based methodology. Appl. Geogr. 2012, 32, 577–590. [Google Scholar] [CrossRef]
  17. Buriks, C.; Bohn, W.; Kennett, M.; Scola, L.; Srdanovic, B. Using HAZUS-MH for Risk Assessment: A How-to-Guide, 1st ed.; Federal Emergency Management Agency: Washington, DC, USA, 2004. [Google Scholar]
  18. Shi, P.; Lv, L.; Wang, M.; Wang, J.; Chen, W. Disaster system: Disaster cluster, disaster chain and disaster compound. J. Nat. Disasters 2014, 23, 1–12. [Google Scholar] [CrossRef]
  19. Kim, J.M.; Sitar, N. Probabilistic evaluation of seismically induced permanent deformation of slopes. Soil Dyn. Earthq. Eng. 2013, 44, 67–77. [Google Scholar] [CrossRef]
  20. Zhao, Y.; Liu, X. Application of ANN to risk assessment on debris flow. J. Geol. Hazards Environ. Preserv. 2005, 16, 135–138. [Google Scholar]
  21. Yan, J.; Zuo, Z. Research on Natural Disaster Risk Assessment Index System and Method. China Saf. Sci. J. 2010, 11, 61–65. [Google Scholar] [CrossRef]
  22. Yin, Z.; Xu, S.; Yin, J.; Wang, J. Small-scale Based Scenario Modeling and Disaster Risk Assessment of Urban Rainstorm Water-logging. Acta Geograph. Sin. 2010, 65, 553–562. [Google Scholar] [CrossRef]
  23. Dong, C.; Wang, X.; Xiao, Q.; Li, S.; Gao, X. GIS-based study and application of meteorological disaster assessment system. J. Nat. Disasters 2010, 19, 107–111. [Google Scholar] [CrossRef]
  24. Pelling, M.; Maskrey, A.; Ruiz, P. Reducing Disaster Risk–A Challenge For. Development, 1st ed.; United Nations Development Programme: New York, NJ, USA, 2005. [Google Scholar]
  25. Munich Reinsurance Company. Topics: Annual Review: Natural Catastrophes 2002, 1st ed.; Munich Re Group: Munich, Germany, 2003. [Google Scholar]
  26. Ge, Q.S.; Zou, M.; Zheng, J.Y. Preliminary Study of Integrated Risk Assessment of Natural Hazards of China, 1st ed.; Science Press: Beijing, China, 2008. [Google Scholar]
  27. Song, W. Study on County-level Governments’ Emergency Response Capability of Serious Natural Disasters; Xiangtan University: Beijing, China, 2011. [Google Scholar]
  28. Chen, F.; Jia, H.; Zhang, C. A comprehensive method for evaluating marine disaster risk reduction capacity in China. Sustainability 2020, 12, 825. [Google Scholar] [CrossRef] [Green Version]
  29. Shi, P. On the role of government in integrated disaster risk governance—Based on practices in China. Int. J. Disaster Risk Sci. 2012, 3, 139–146. [Google Scholar] [CrossRef] [Green Version]
  30. He, Z.; Yang, W. Study on the emergency management mechanism of the county government respond to the major natural disaster. J. Risk Disaster Crisis Res. 2016, 63, 133–147. [Google Scholar]
  31. Wang, J.; Shi, P.; Yi, X.; Jia, H.; Zhu, L. The regionalization of urban natural disasters in China. Nat. Hazards 2008, 44, 169–179. [Google Scholar] [CrossRef]
  32. Shi, P. Atlas of Natural Disaster Risk in China, 1st ed.; Science Press: Beijing, China, 2011. [Google Scholar]
  33. Zhejiang Provincial Bureau of statistics and Zhejiang Survey Team of National Bureau of Statistics. Zhejiang Statistical Yearbook, 1st ed.; China Statistics Press: Beijing, China, 2019. [Google Scholar]
  34. Wu, S.; Pan, T.; Liu, Y.; Deng, H.; Jiao, K.; Lu, Q.; Feng, A.; Yue, X.; Yin, Y.; Zhao, D.; et al. Comprehensive climate change risk regionalization of China. Acta Geograph. Sin. 2017, 72, 3–17. [Google Scholar] [CrossRef]
  35. Zhu, S.; Dong, D. Typhoon disaster and its prevention in Cangnan County, Zhejiang Province. China Flood Drought Manag. 2014, 5, 69–73. [Google Scholar] [CrossRef]
  36. Cao, L.; Li, J. Integrated risk assessment of flood disaster in Zhejiang Province based on RS and GIS. J. Nat. Disaster. 2015, 24, 111–119. [Google Scholar] [CrossRef]
  37. IPCC. Climate Change 2014: Impacts, Adaptation, and Vulnerability, 1st ed.; Cambridge University Press: Cambridge, UK; New York, NJ, USA, 2014. [Google Scholar]
  38. Wu, S. Comprehensive Risk Prevention: China’s Comprehensive Climate Change Risks, 1st ed.; Science Press: Beijing, China, 2011. [Google Scholar]
  39. IPCC. Climate Change 2007: Impacts, Adaptations and Vulnerability: The Fourth Assessment Report of Working Group II, 1st ed.; Cambridge University Press: Cambridge, MA, USA, 2007. [Google Scholar]
  40. Jones, R. When do POETS become dangerous. In Proceedings of IPCC Workshop on Describing Scientific Uncertainties in Climate Change to Support Analysis of Risk and of Options, 1st ed.; Martin, M., Michel, P., David, E., James, M., Anand, P., Hans-Holger, R., Rob, S., Gary, Y., Eds.; National University of Ireland: Maynooth, Ireland, 2004. [Google Scholar]
  41. IPCC. Managing the Risks of Extreme Events and Disasters to Advance Climate Change Adaptation: A Special Report of Working Groups I and II of the Intergovernmental Panel on Climate Change, 1st ed.; Cambridge University Press: Cambridge, UK; New York, NY, USA, 2012. [Google Scholar]
  42. Wu, S.; Gao, J.; Deng, H.; Liu, L.; Pan, T. Climate change risk and methodology for its quantitative assessment. Prog. Geog. 2018, 37, 28–35. [Google Scholar]
  43. Yin, J.; Wu, S.; Dai, E. Assessment of Economic Damage Risks from Typhoon Disasters in Guangdong, China. J. Resour. Ecol. 2012, 3, 144–150. [Google Scholar] [CrossRef]
  44. Xu, X.; Zheng, J.; Ge, Q.; Dai, E.; Liu, C. Drought Risk Assessment on Regional Agriculture: A Case in Southwest China. Prog. Geog. 2011, 30, 883–890. [Google Scholar] [CrossRef]
  45. Li, K.; Wu, S.; Dai, E.; Xu, Z. Flood loss analysis and quantitative risk assessment in China. Nat. Hazards 2012, 63, 737–760. [Google Scholar] [CrossRef]
  46. Feng, A.; Chao, Q. An overview of assessment methods and analysis for climate change risk in China. Phys. Chem. Earth 2020, 117, 102861. [Google Scholar] [CrossRef]
  47. Guan, Y.; Zheng, F.; Zhang, P.; Qin, C. Spatial and temporal changes of meteorological disasters in China during 1950–2013. Nat. Hazards 2015, 75, 2607–2623. [Google Scholar] [CrossRef]
  48. Wu, S.; Liu, L.; Gao, J.; Wang, W. Integrate Risk From Climate Change in China under Global Warming of 1.5 and 2.0 °C. Earths Future 2019, 7, 1307–1322. [Google Scholar] [CrossRef] [Green Version]
  49. Shi, P. Theory and practice of disaster study. J. Nat. Disast. 1996, 5, 6–17. [Google Scholar]
Figure 1. Study area, Cangnan County, located in Zhejiang Province, East China.
Atmosphere 12 01022 g001
Figure 2. Economic vulnerability curve for different grades of typhoons.
Atmosphere 12 01022 g002
Figure 3. Spatial distribution of (a) population, (b) gross regional product, (c) crop areas, and (d) houses in Cangnan County.
Atmosphere 12 01022 g003
Figure 4. Spatial patterns of super typhoon risk in Cangnan County: (a) population, (b) economy, (c) crops, and (d) houses.
Atmosphere 12 01022 g004
Figure 5. Spatial pattern of comprehensive typhoon risk in Cangnan County.
Atmosphere 12 01022 g005
Figure 6. Spatial patterns of severe drought risk in Cangnan County: (a) population, (b) economy, and (c) crops.
Atmosphere 12 01022 g006
Figure 7. Spatial pattern of comprehensive drought risk in Cangnan County.
Atmosphere 12 01022 g007
Figure 8. Spatial patterns of severe flood risk in Cangnan County: (a) population, (b) economy, (c) crops, and (d) houses.
Atmosphere 12 01022 g008
Figure 9. Spatial pattern of comprehensive flood risk in Cangnan County.
Atmosphere 12 01022 g009
Figure 10. Spatial pattern of comprehensive multi-hazard risk in Cangnan County.
Atmosphere 12 01022 g010
Table 1. Classification standard of typhoon disasters in Cangnan County.
Tropical CycloneMaximum Wind Speed (m/s)Maximum Wind (Scale)
Severe tropical storm (3) *24.5–32.610–11
Typhoon (4)32.7–41.112–13
Severe typhoon (5)41.5–50.914–15
Super typhoon (6)≥51.0≥16
Note: * Numbers in parentheses indicate the level of the typhoon.
Table 2. Classification standard of drought and flood disaster in Cangnan County.
IndexMildModerateSevere
MCI−1.5 < MCI ≤ −1.0−2.0 < MCI ≤ −1.5MCI ≤ −2.0
FI35–150 mm150–250 mm≥250 mm
Table 3. Vulnerability to typhoons of different levels in Cangnan County.
Tropical CycloneAffected Population Rate (%)Economic Loss Rate (%)Affected Crop Rate (%)House Collapse
Rate (%)
Severe tropical storm (3) *8.200.2111.790.02
Typhoon (4)26.572.2324.611.25
Severe typhoon (5)30.994.0125.501.81
Super typhoon (6)41.6121.7828.1922.97
Note: * Numbers in parentheses indicate the level of the typhoon.
Table 4. Vulnerability to droughts of different levels in Cangnan County.
Drought LevelAffected Population Rate (%)Economic Loss Rate (%)Affected Crop Rate (%)
Mild2.560.515.59
Moderate21.072.1413.31
Severe74.7705.0731.67
Table 5. Vulnerability to floods of different levels in Cangnan County.
Flood LevelAffected Population Rate (%)Economic Loss Rate (%)Affected Crop Rate (%)House Collapse
Rate (%)
Mild29.840.439.250.8
Moderate47.100.9420.792.35
Severe57.842.4746.736.98
Table 6. Socioeconomic risk of different typhoons in Cangnan County.
Disaster BodiesPopulation (10,000)Economy (Million CNY)Crops (Hectares)Houses
Severe tropical storm5.0543.952243.99
Typhoon6.97200.251669.8209
Severe typhoon20.77921.765548.1729
Super typhoon12.752286.873593.94087
Table 7. Socioeconomic risks of droughts in Cangnan County.
Disaster BodiesPopulation (10,000)Economy (Million CNY)Crops (Hectares)
Mild drought3.449.152446.3
Moderate drought28.2838.625824.7
Severe drought100.2591.6313,859.3
Table 8. Socioeconomic risks of different floods in Cangnan County.
Disaster BodiesPopulation (10,000)Economy (Million CNY)Crops (Hectares)Houses
Mild flood29.74146.844048.0648
Moderate flood46.95321.019098.11902
Severe flood57.65843.5020,449.85650
Publisher’s Note: MDPI stays neutral with regard to jurisdictional claims in published maps and institutional affiliations.