Article

Deficit Irrigation Using Saline Water of Fruit Trees under Water Scarcity Conditions of Southern Tunisia

1
Institute of Arid Regions (IRA), Médenine 4119, Tunisia
2
National Institute of Agronomy of Tunisia (INAT), University of Carthage, 43 Avenue Charles Nicolle, Tunis 1082, Tunisia
3
Desertification Research Center, University of Sassari (UNISS), Piazza Università, 21, 07100 Sassari, Italy
*
Author to whom correspondence should be addressed.
Atmosphere 2021, 12(7), 864; https://doi.org/10.3390/atmos12070864
Submission received: 5 May 2021 / Revised: 18 June 2021 / Accepted: 26 June 2021 / Published: 2 July 2021
(This article belongs to the Special Issue Agricultural Microclimate and Irrigation Water Management)

Abstract

:
Both water scarcity and salinity are major obstacles for crop production in arid parts of Tunisia and require adoption of strategies aimed at improving water-use efficiency. Field experiments on deficit irrigation (DI) of table olive, orange trees, and grapevines with saline water (2 dS·m−1) were conducted in the arid region of Médenine, Tunisia. Three irrigation treatments were compared with the farmer’s method (FM) over two years (2013–2014): deficit irrigation (DI75) and (DI50), which received 75% and 50% less water than full irrigation (FI), respectively, and full compensation of the crop evapotranspiration (FI). Measurements included seasonal changes in soil water content, soil salinity, yield, fruit quality, and economic return. Results showed that in-season water limitations, roughly between 700–250 mm, caused significant reductions in yield and fruit weight, but improved the total soluble solids of fruits. Under FI, DI75, DI50, and FM, average yields were 26.6, 20.1, 14.7, and 21.2 t·ha−1 for orange, 4.5, 4.0, 3.1, and 3.5 t·ha−1 for table olive, and 3.8, 3.4, 3.1, and 3.5 t·ha−1 for grapevine, respectively. Soil salinity build up increased linearly with decreasing irrigation water. Irrigation water productivity (IWP), although lowest for FM, was relatively high (3.30–4.30 kg·m−3 for orange, 0.65–1.20 kg·m−3 for table olive, and 0.74–1.30 kg·m−3 for grapevine). Economic evaluation showed that the FI strategy generated the greatest net income (1800–6630 USD·ha−1), followed by DI75 (1350–3940 USD·ha−1), FM (844–4340 USD·ha−1), and DI50 (600–2400 USD·ha−1). The results show an important potential for reasonably sustaining farmer’s income under increased water scarcity.

1. Introduction

Water scarcity is the main factor limiting agricultural production in arid regions. In this context, adaptation strategies to increasing water scarcity must be developed and adopted by farmers in order to optimize the use of limited water resources [1]. Deficit irrigation (DI) scheduling, considered as an interesting and sustainable production practice for arid regions [2,3], reduces tree water consumption without a harmful impact on crop productivity [4] and allows improvement of water productivity for higher yields per unit of evapotranspired (ET) or applied irrigation water [2,4,5,6,7]. Applying DI is considered an effective option that can be adopted to achieve water saving in water-limited conditions and with high price of water allocation [2,8]. In the Mediterranean regions, DI strategies have been used to save water and to improve water productivity of various crops [5,6,7]. DI of fruit trees seems to be a relevant choice in Mediterranean semi-arid agro-systems for currently cultivated fruit crops with higher water requirements [9].
Fruit crops such as table olive, orange, and grapevines are among the most important horticultural crops that can adapt well to DI practices [10]. In Tunisia, orange, grapevine, and table olive are considered strategic fruit species and are concentrated in semi-arid regions exposed to severe water scarcity. Under the semi-arid conditions of Tunisia, the impact of DI on yield and water saving was investigated in field experiments on orange, olive, and grapevines [11,12,13,14]. Nevertheless, an important increase of irrigated area of such crops has been observed in the arid regions of Tunisia despite the high temperature and relatively high levels of water salinity, which may affect the yield of fruit trees. Moreover, the high temperature and radiation induce earlier maturity of fruits and have a positive effect on fruit quality [15,16]. The loss in productivity may be compensated by the increase in economic value resulting from the precocity and the improvement of fruit quality.
Many studies have demonstrated the advantages of using DI strategies to improve water use, and fruit quality of orange, olive, and grapevine [11,13,17,18,19], but the profitability of these strategies in commercial orchards is rarely addressed [20]. However, soil salinization, caused by using DI under high evaporative demand and water scarcity conditions, may have a negative effect on the economic profitability of the farm. Information on DI scheduling of orange, table olive, and grapevine, considered as moderately tolerant to salinity [21] is limited for arid climate, especially in Southern Tunisia. In this area, orchards are drip-irrigated from private wells having salinity more than 2 dS·m−1 and most growers are irrigating their field according to their own experience without reference to actual crop water requirements. Irrigation with saline water, without provision for drainage increases the risk of salt accumulation in the root zone [22] which may compromise the sustainability of the irrigated orchards. Thus, there is a necessity to develop adapted irrigation strategies that allow optimum use of saline with reduced impact on productivity and soil salinization of orchards. The main objective of this work was to assess the effect of applying DI on soil salinization, yield, and income as well as on water productivity of orange and table olive tree orchards and grapevines during two consecutive years under the arid climate of Southern Tunisia.

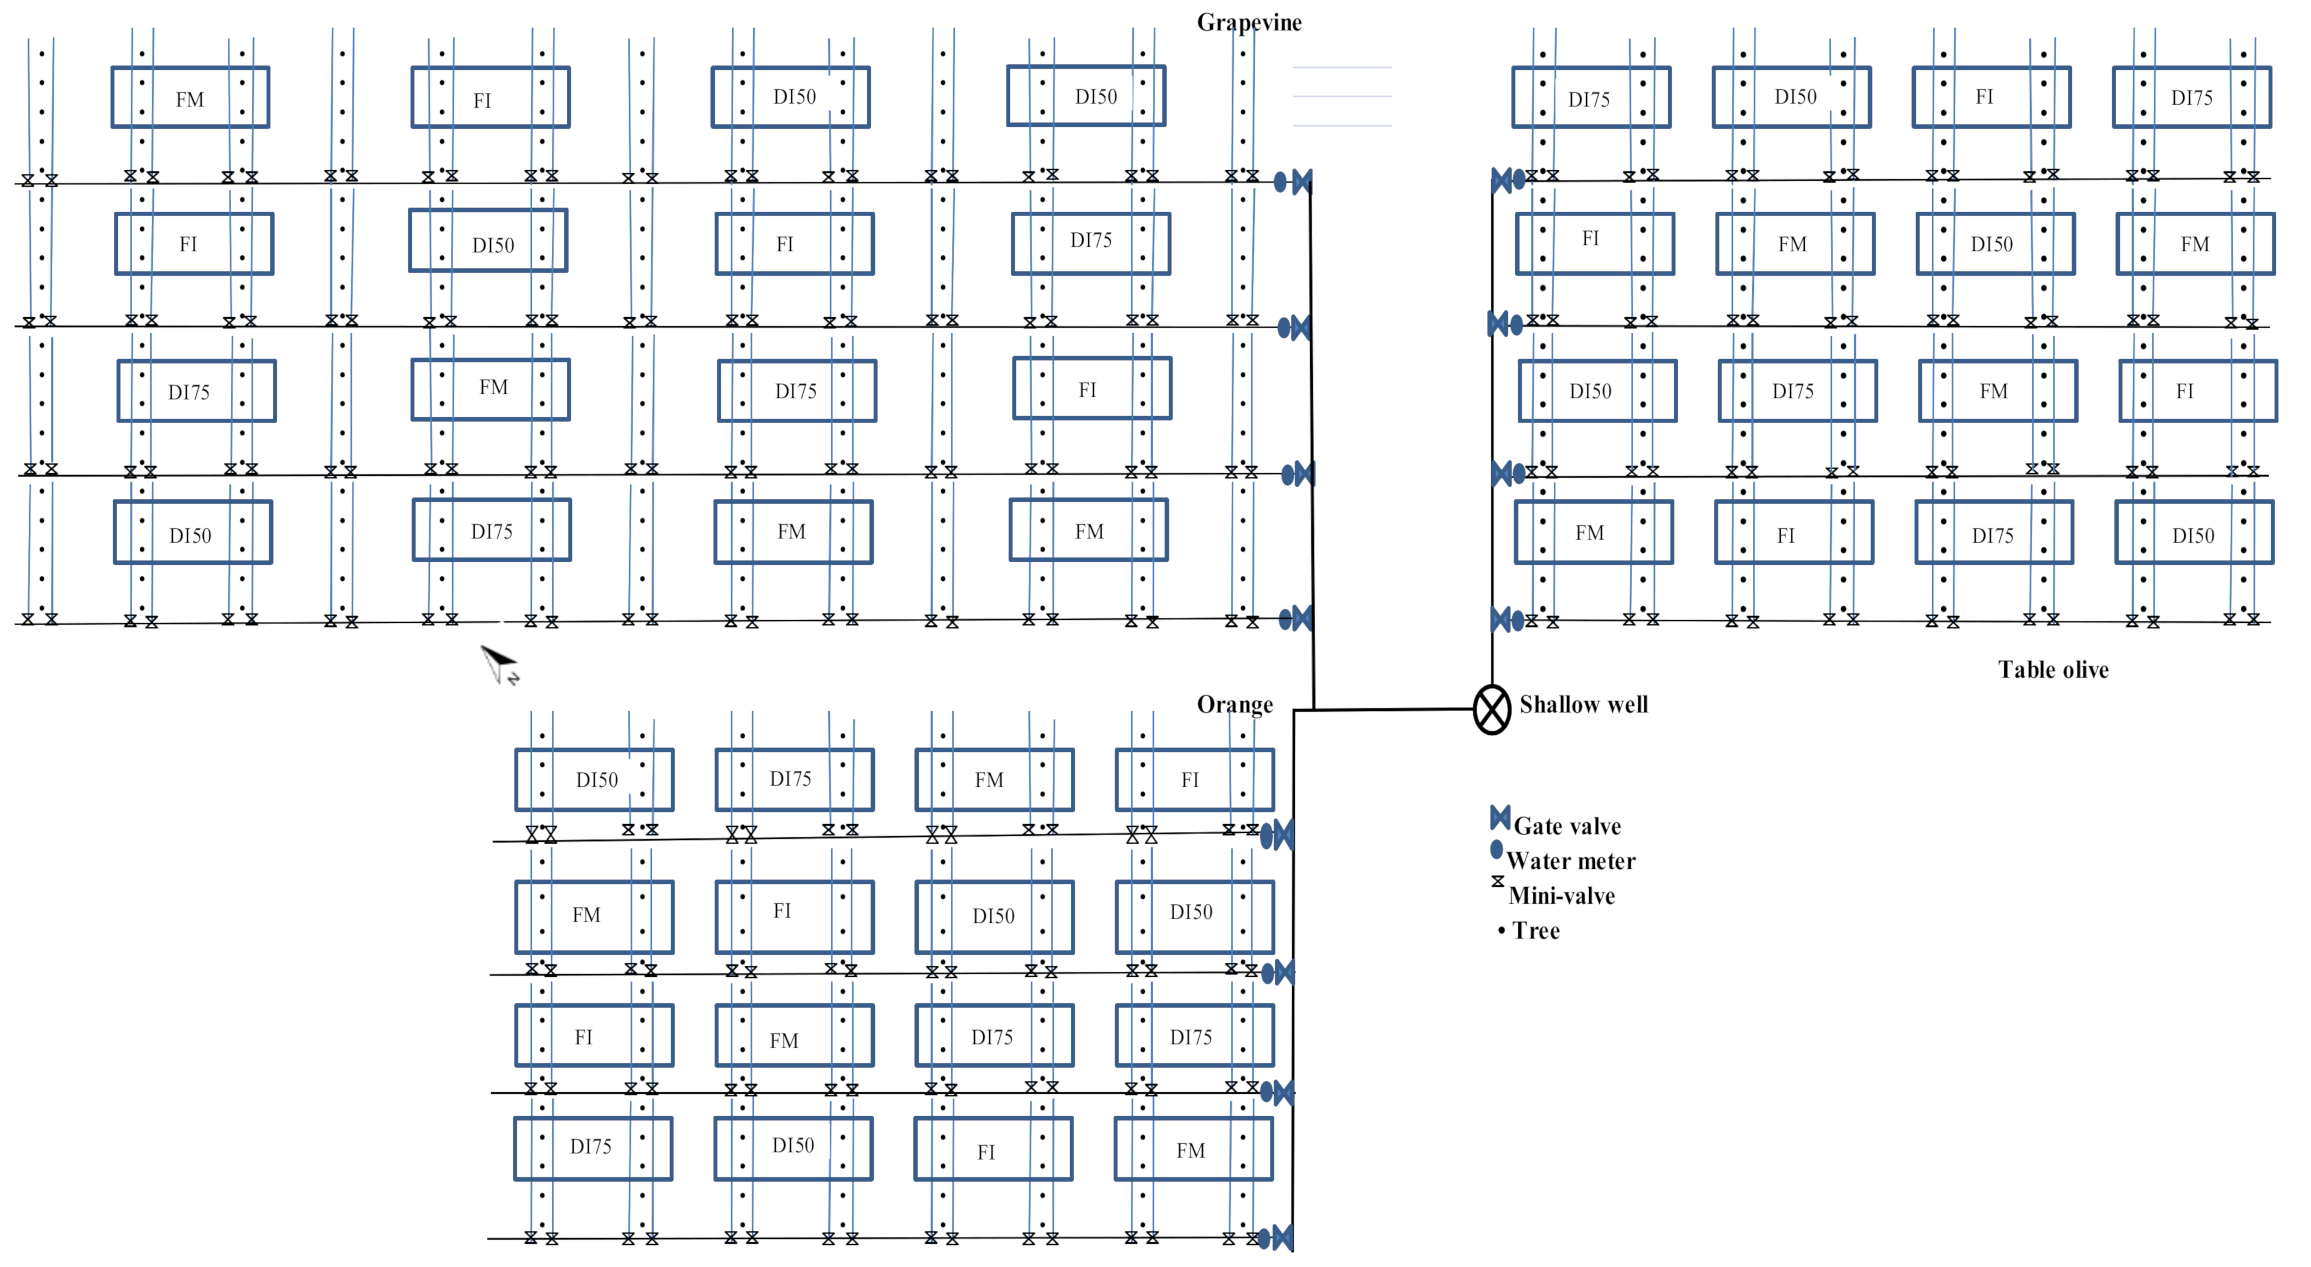
2. Materials and Methods

The experimental work was conducted in 2013 and 2014 in commercial orchards of mature table olive trees (Olea europaea L., cv. Meski), orange trees (Citrus sinensis L. Osbeck, cv. Meski Maltaise), and grapevines (Vitis vinifera L. cv. Superior Seedless) grafted on Bigaradier and 1103 P rootstocks located in Médenine, Southern Tunisia (33°19′ N, 10°27′ E, altitude 146 m). Trees were 12, 14, and 10 years old and were planted at spacing of 7 m × 7 m, 7 m × 6 m, and 2 m × 3 m, respectively. Surface drip irrigation was used with 4 emitters per tree (4 L/h), 1 m apart, using irrigation waters having an electrical conductivity (ECiw) of about 2 dS·m−1. The total surface monitored was up to 0.6 ha for orange, and 0.8 ha for table olive and grapevines.
The soil was a sandy loam with 62% sand, 29% silt, and 9% clay. The roots of the orange and olive trees and grapevine were situated mainly at a depth of 0.8 m. The average values for field capacity (FC) and permanent wilting point (PWP) in the top 80 cm depth of soil were 0.239 and 0.129 m3·m−3, respectively. The average bulk density was 1.41 g·cm−1. The total available water for roots extraction depth of 0.80 m was 88 mm.
The climate was typical of arid regions, with annual reference evapotranspiration (ETo-PM) of about 1400 mm and an annual rainfall of 150 mm, distributed mainly during autumn to early spring, November to February being the wettest months of the year. The total rainfall values measured from January to December in 2013 and 2014 were relatively low, 66 and 82 mm, respectively. Mean daily temperatures rarely fell below 15 °C in winter and they were high in summer, often exceeding 40 °C during July and August.
The experiment, arranged in a randomized block design, included four irrigation treatments with 2 rows each, organized as 4 replicates of 4 trees in each treatment. Every table olive, orange, and grapevine row was irrigated by 2 laterals equipped with a gate valve and a water meter. Figure 1 shows the experiment layout. The four irrigation treatments tested in olive and orange orchards and grapevines were:
  • Full irrigation (FI), where trees were irrigated to provide them with their full water requirement based on computing crop evapotranspiration (ETc);
  • Moderate (DI75) and severe (DI50) deficit irrigation, where 75% and 50% of ETc were covered by irrigation, respectively;
  • Grower’s irrigation program (FM), which consisted in supplying fixed amounts on a weekly basis.
Water and irrigation needs were estimated using a spreadsheet developed in Excel for managing irrigation of fruit trees according to the FAO 56 method [23]. Data on weather and crop and growth stages were used for estimation of reference evapotranspiration (ETo) and crop coefficient (Kc). ETc was determined from reference crop water use (ETo) obtained by the Penman–Monteith method, using long term climatic data from a weather station located 6 km from the plot, with crop coefficient (Kc) estimated based on the work of Allen et al. [23], using local observations of crop phenology.
An irrigation was applied to all treatments at the start of the irrigation season in order to replenish the upper 80 cm of soil to field capacity. Starting with a soil at field capacity in the root zone, irrigation was applied from early May to the end of December to orange trees, from February until December to table olive trees, and from March until early July to grapevines. All treatments were applied with an interval of 7–10 days, usually adopted by growers in the area, and variable doses were determined for each irrigation treatment.
Nutrient supply was similar for the 2 years and was applied based on the fertilization practices used by growers for table olive, orange, and grapevine production in the study area, with 400–150–150 kg·ha−1; 200–100–150 kg·ha−1, and 400–150–250 kg·ha−1 of N, P2O5, and K2O, respectively. The nutrients were applied in the same amounts in the case of all treatments across the irrigation system.
Soil water content (θg) was measured by the gravimetric method to determine the soil water depletion. The soil samples were taken before, during, and at the end of the irrigation season of orange and table olive trees in 4 replicates of each treatment. For each repetition, soil samples were taken from 5 locations at 0.2 and 0.5 m from the drip gate and 0.2, 1.0, and 2.0 m from the line. In each location, soil of the 0–20, 20–40, 40–60, and 60–80 cm layers were taken to determine average soil moisture. The volumetric soil water content (θv, m3·m−3) was determined using measured soil water content θg (g·g−1) and the bulk density estimated at the start of the experiment.
Soil salinity was also estimated before and at the end of the irrigation season using the same sampling layout as in the case of soil moisture, considering an elementary surface representing one quarter of the area covered by each tree. Soil samples were taken at different points around the monitored trees by measuring the electrical conductivity of the extract of saturated paste (ECe).
For both years, the yield was determined for each monitored tree by weighing the orange, table olive, and grape fruits with a precision digital balance. The total yield (kg/tree) was transformed in t·ha−1, considering that each olive and orange trees and grapevine covered an area of 49, 42, and 6 m2, respectively. At harvest, a representative sample of 20 fruits was taken from different sides of each monitored tree to determine fruit weight and size. The total soluble solids content (TSS) was measured by a thermo-compensated refractometer. Water productivity (WP) is defined as yield/ET, but economists and farmers are most concerned about the yield per unit of irrigation water applied [24]. Therefore, the WP (kg·m3) was calculated as the final yield (kg·ha−1) divided by the volume of irrigation water (m3/ha) during the irrigation period of 2013 and 2014.
A simple economic evaluation was carried out to analyze the different irrigation strategies. The net income was calculated for each strategy by deducting all the production costs from gross returns. Orange, table olive, and grape production costs included fixed costs as the depreciation of the irrigation equipment, fertilizer, pesticide, labor, and cost of water considered as variable between the different treatments. The gross return was determined by multiplying the total amount of the product (kg·ha−1) by its market price.
The effects of irrigation strategies on soil salinity, yields, fruit quality, and WP were evaluated by comparison through analysis of variance (ANOVA). Data were analyzed using a one-way ANOVA with the Statgraphics Plus 5.1 software, using least significant difference (LSD) test for mean separations at 5% level.

3. Results and Discussion

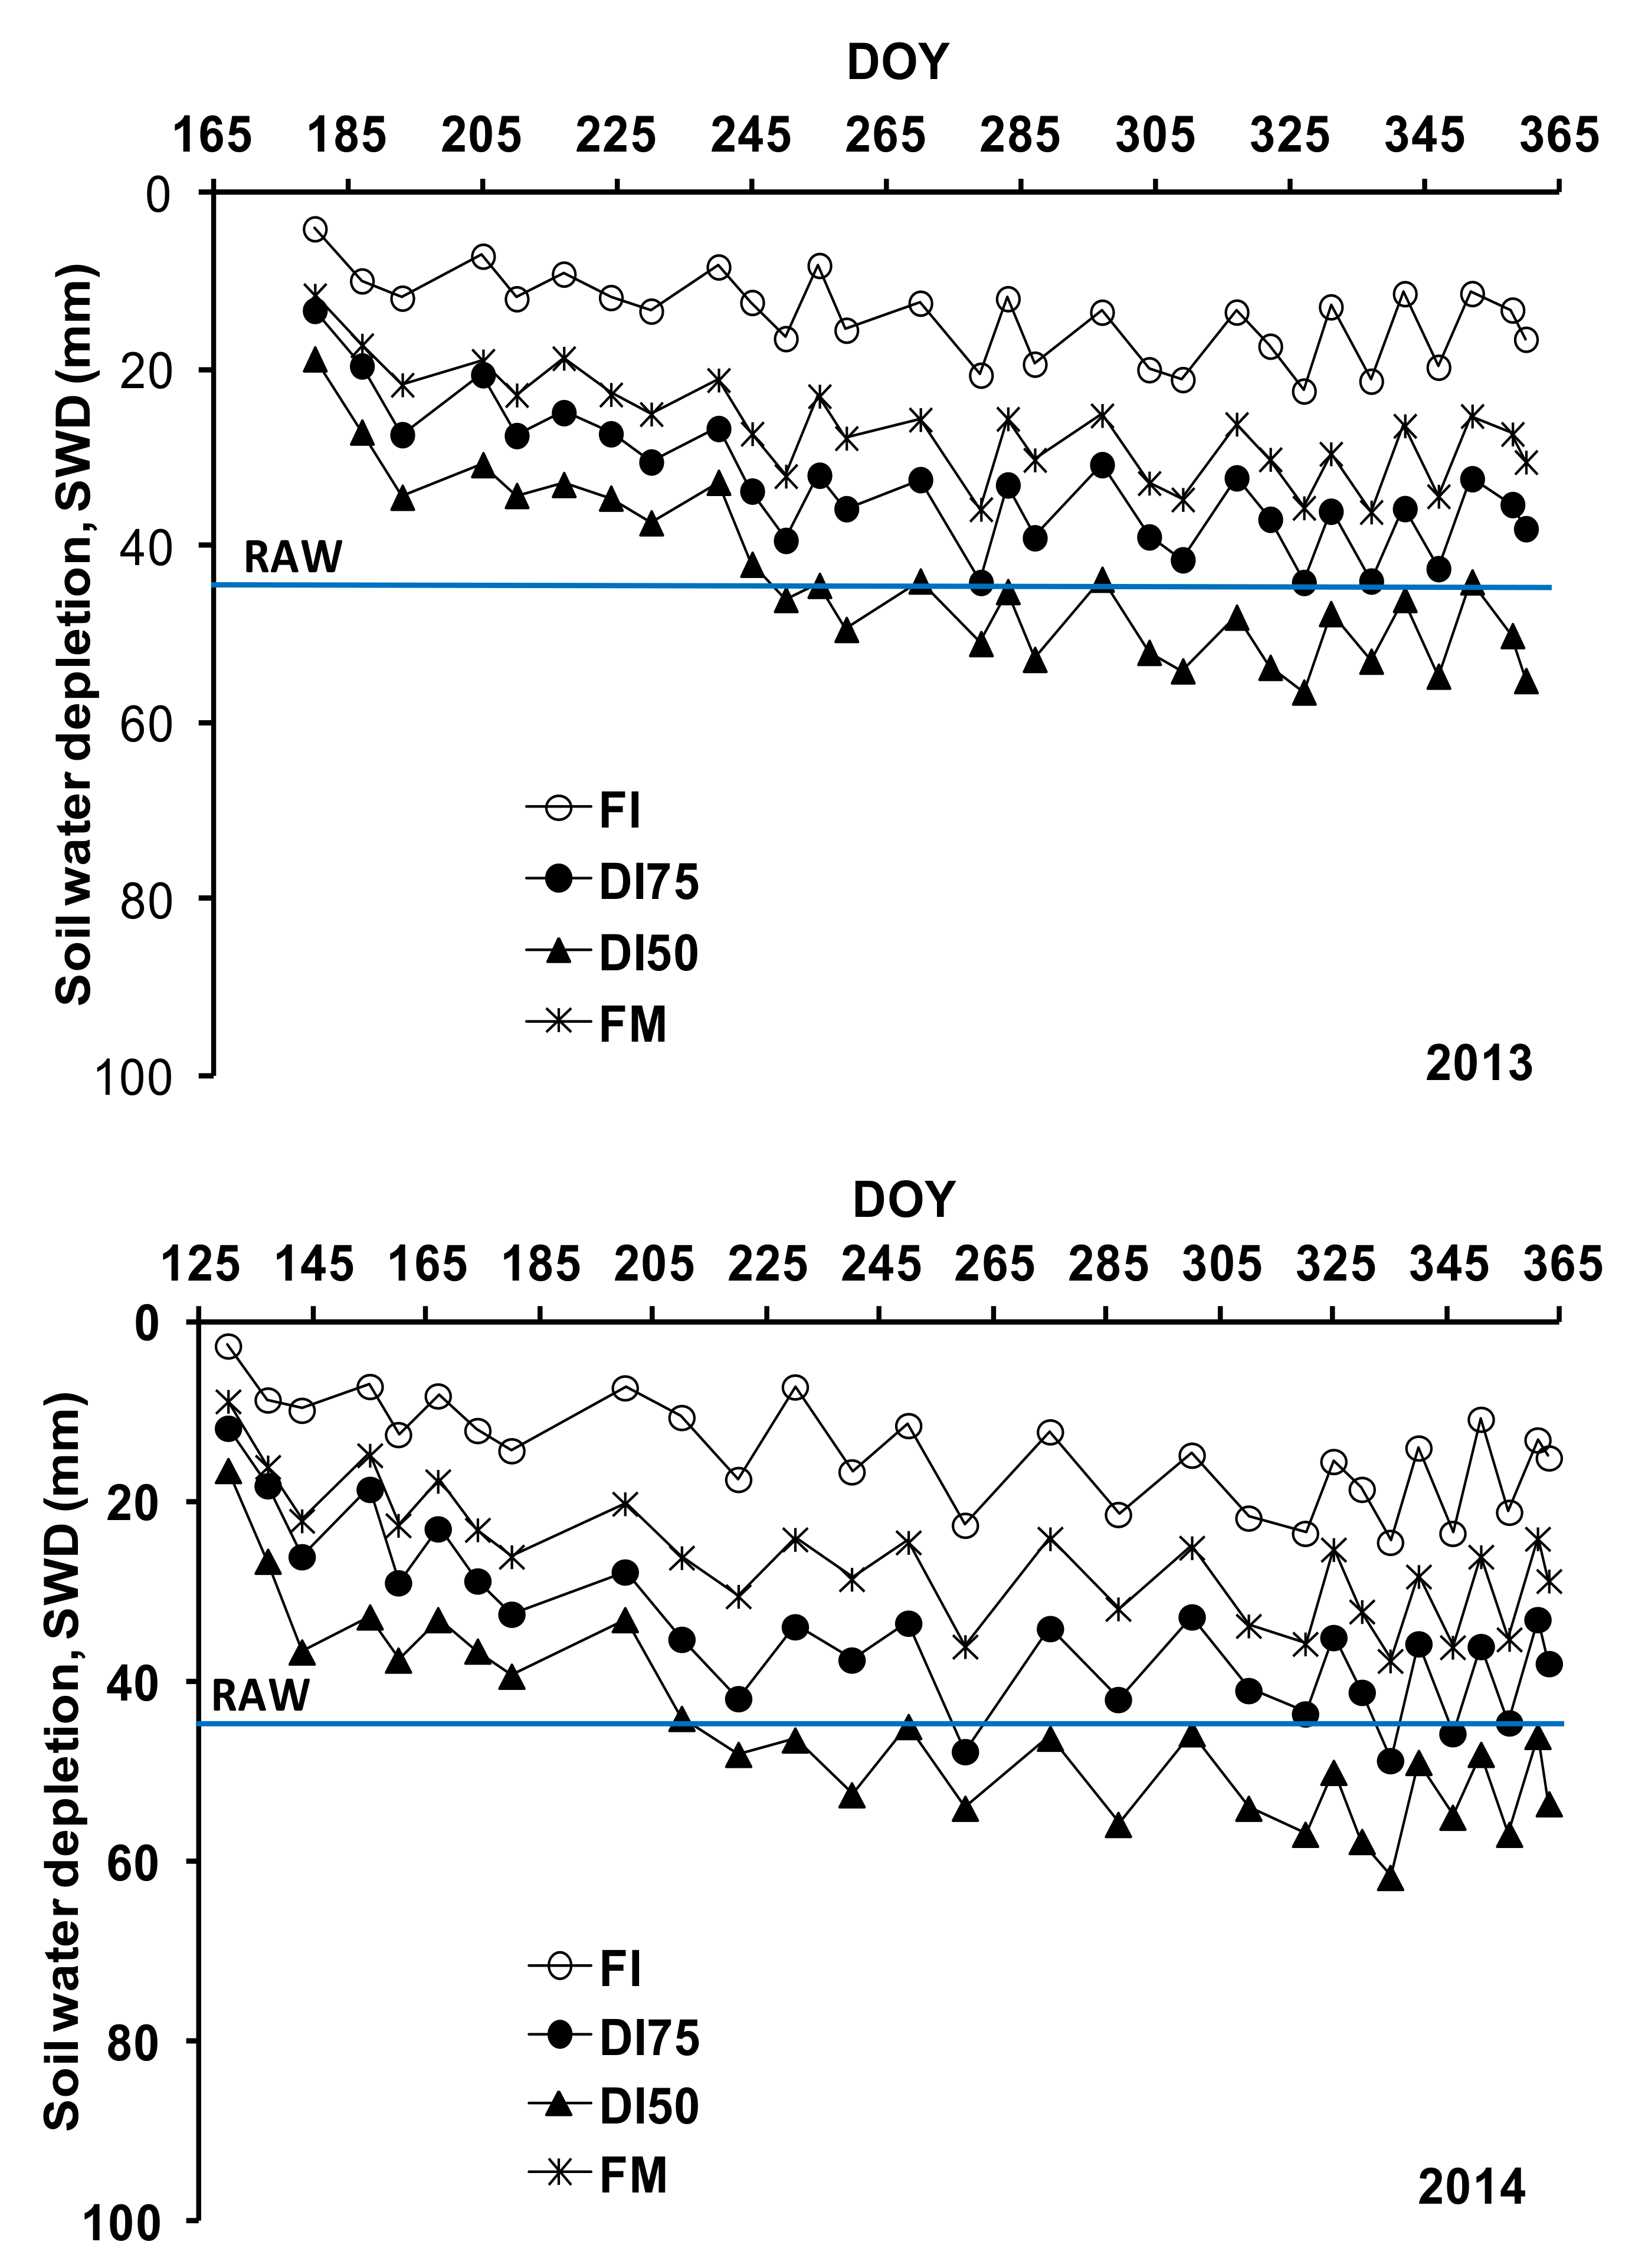
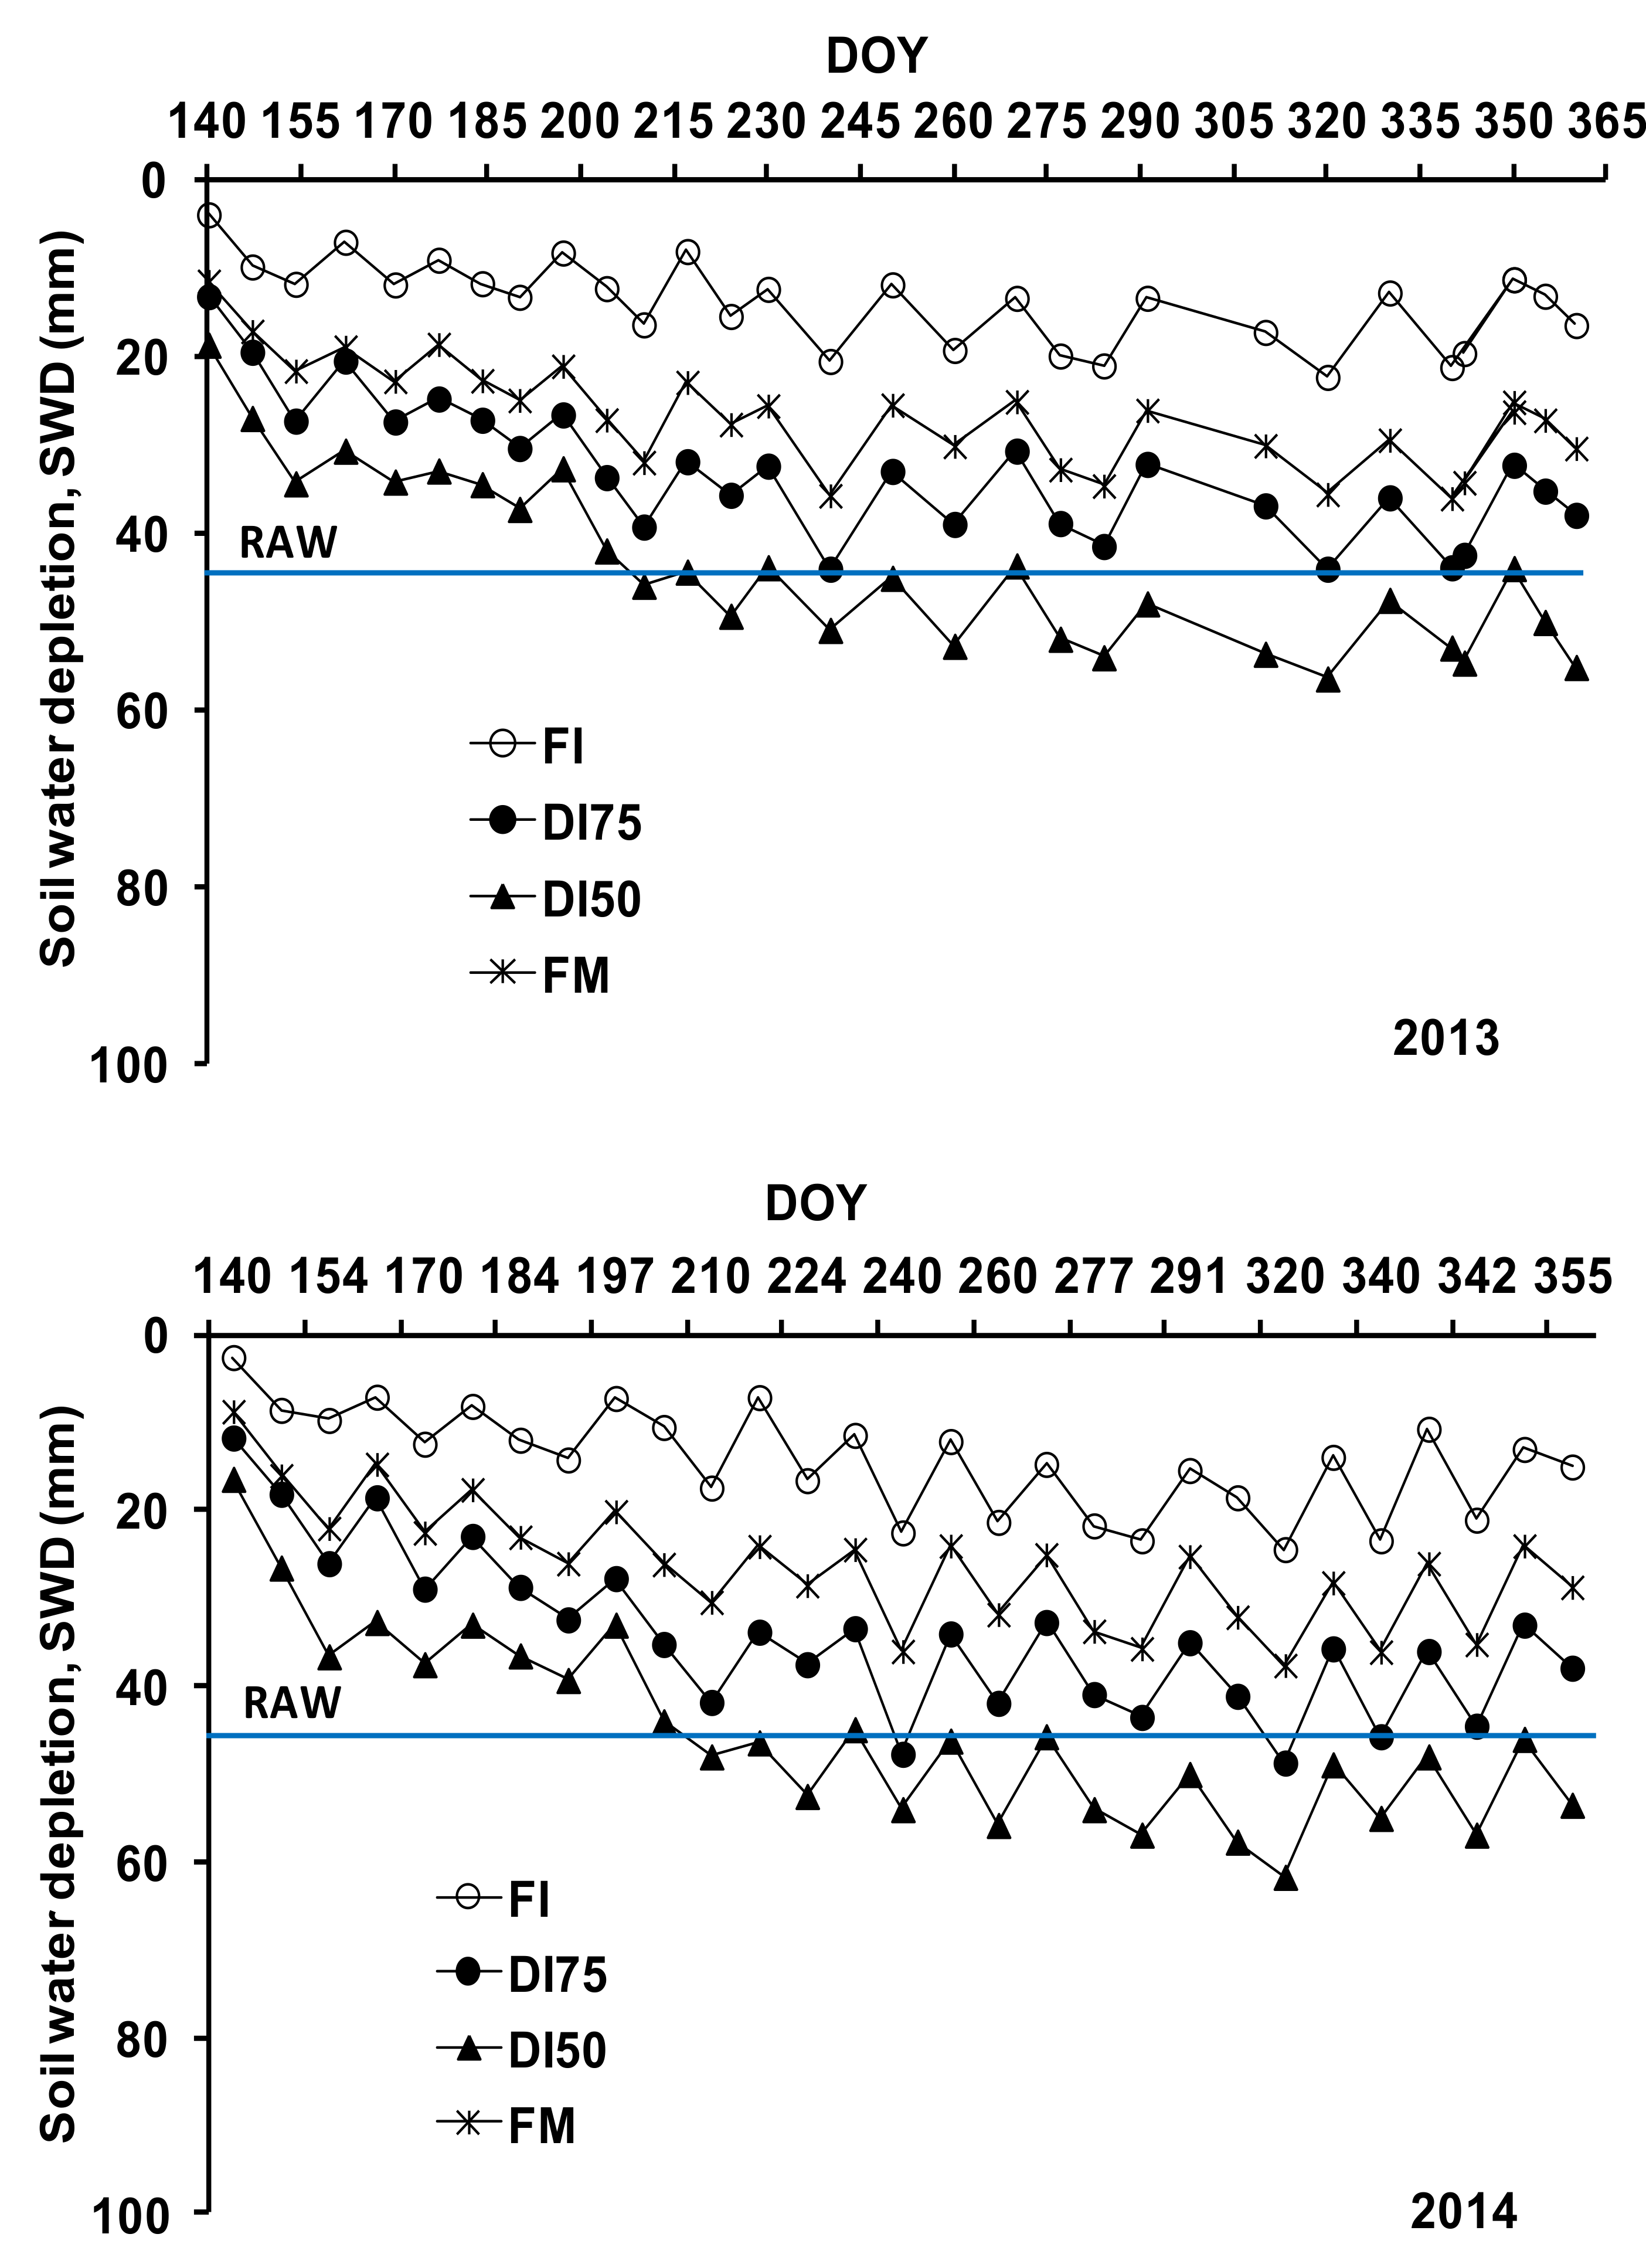
3.1. Soil Water Balance
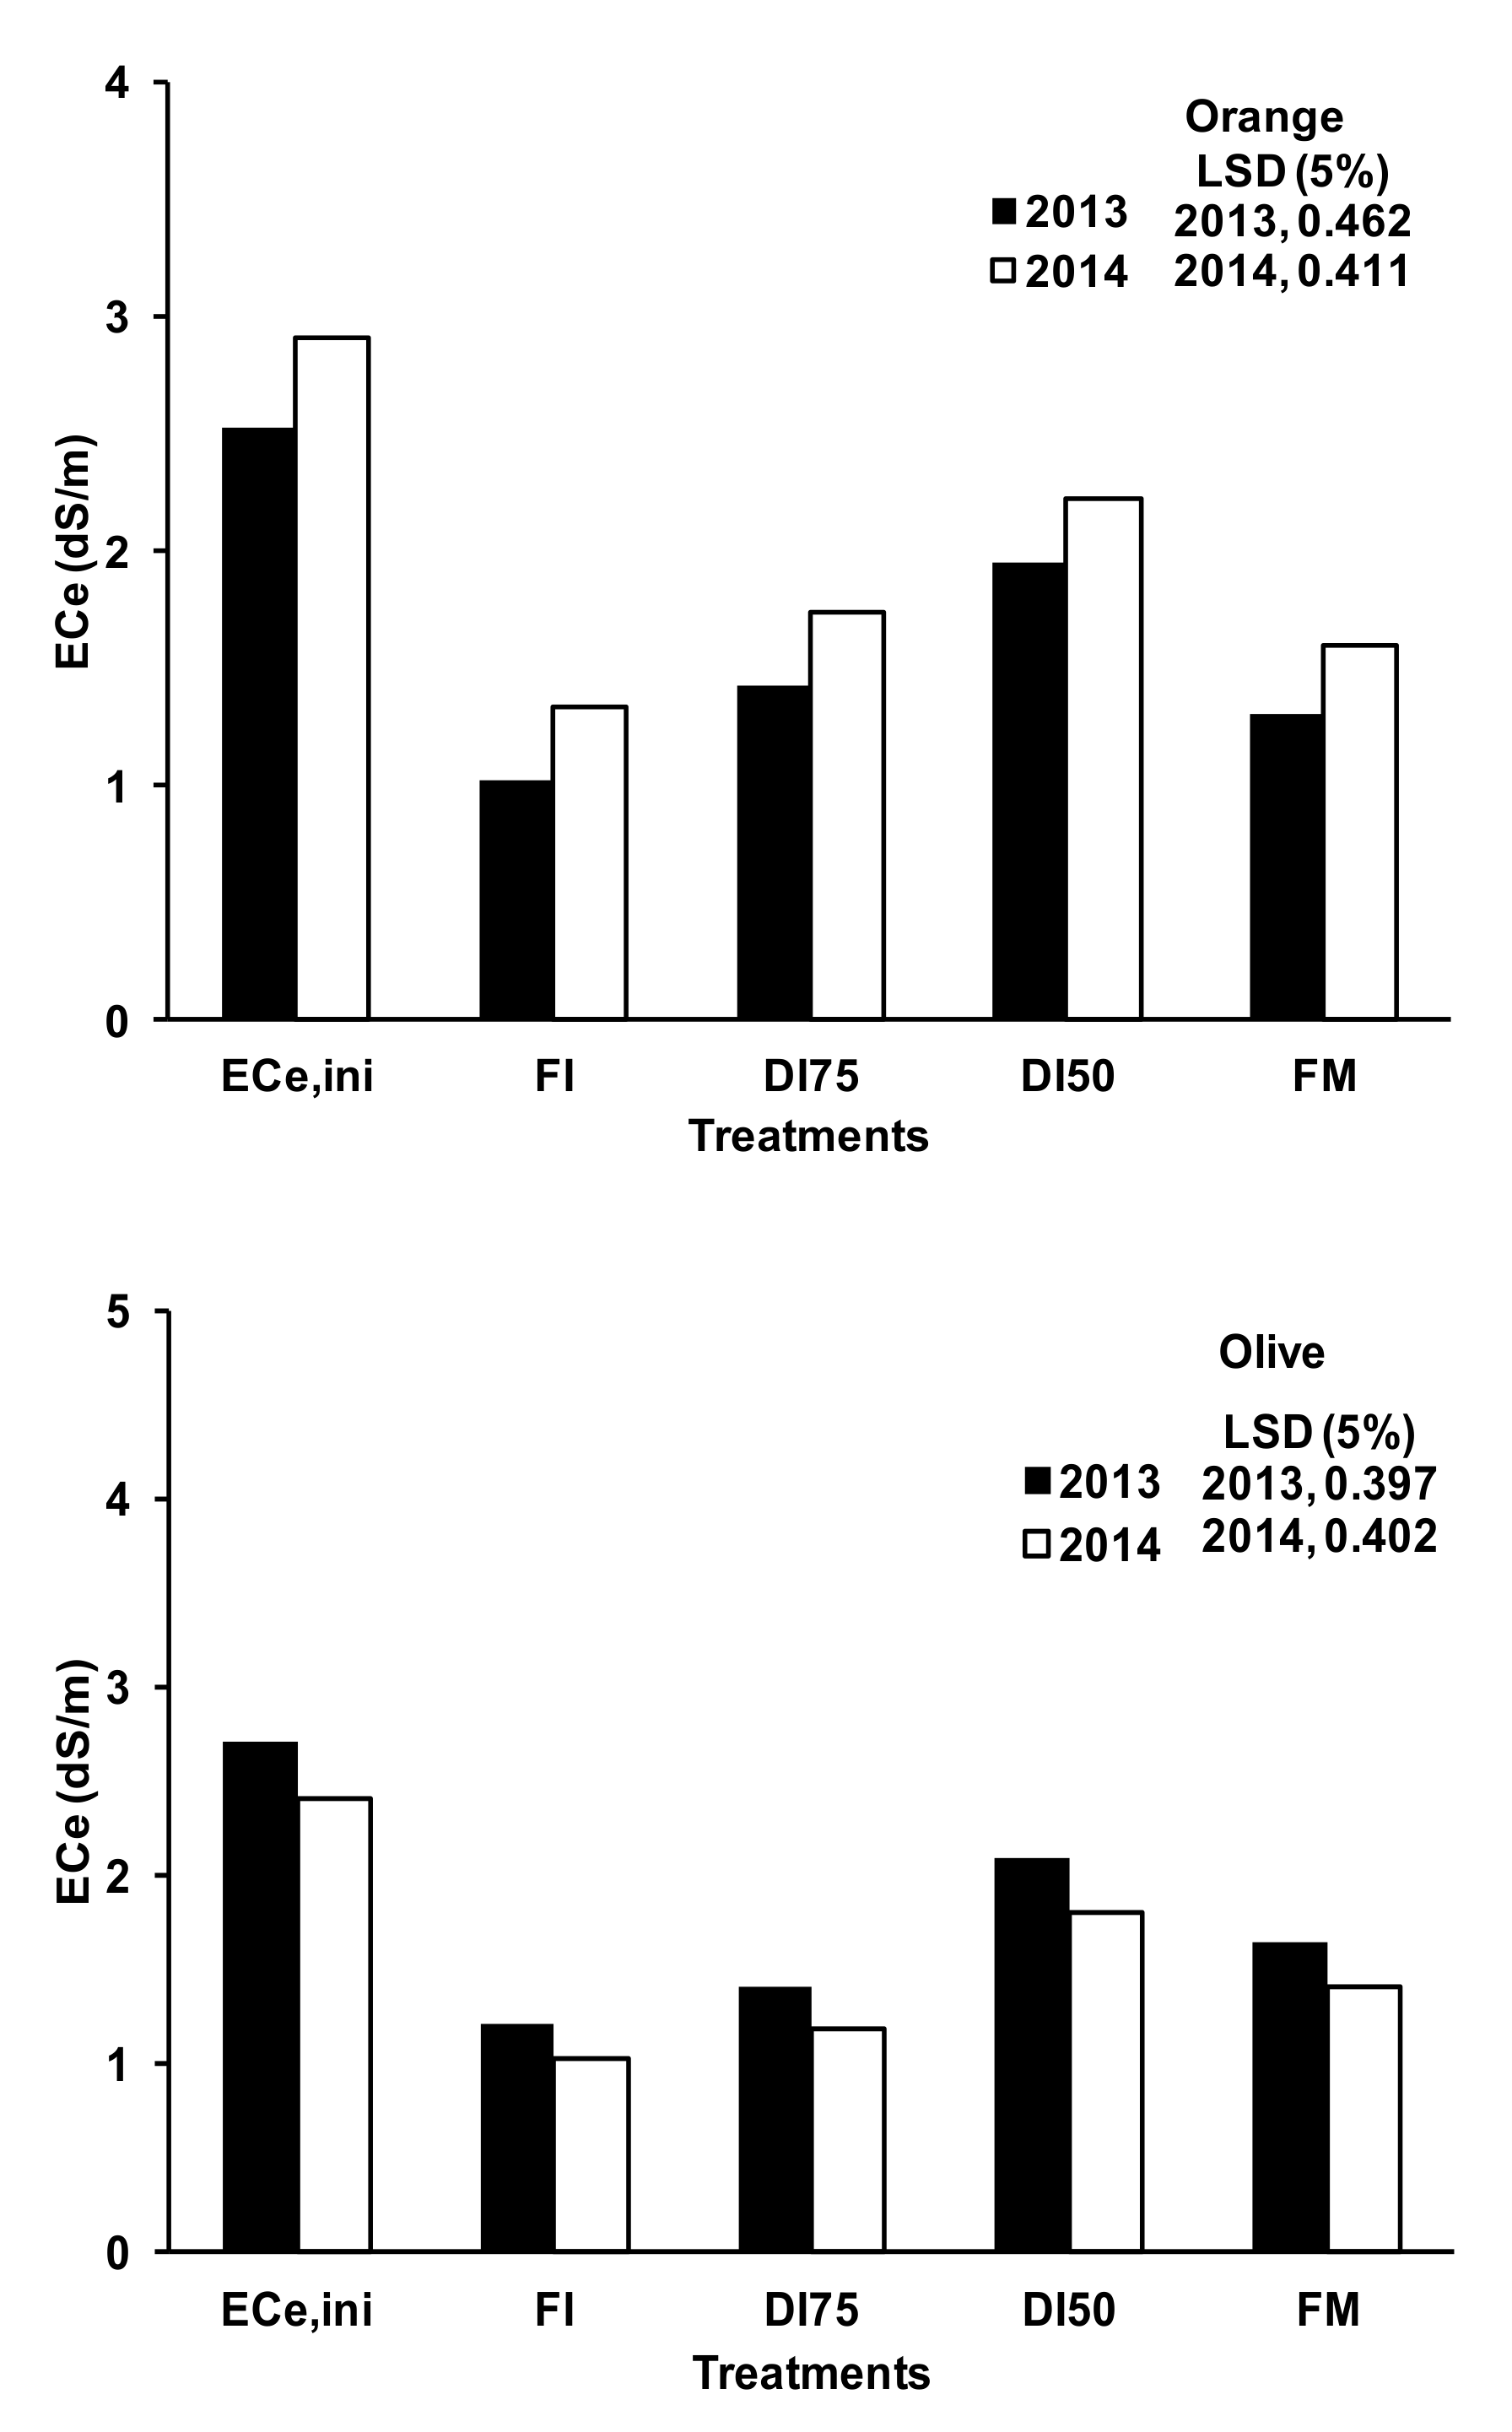
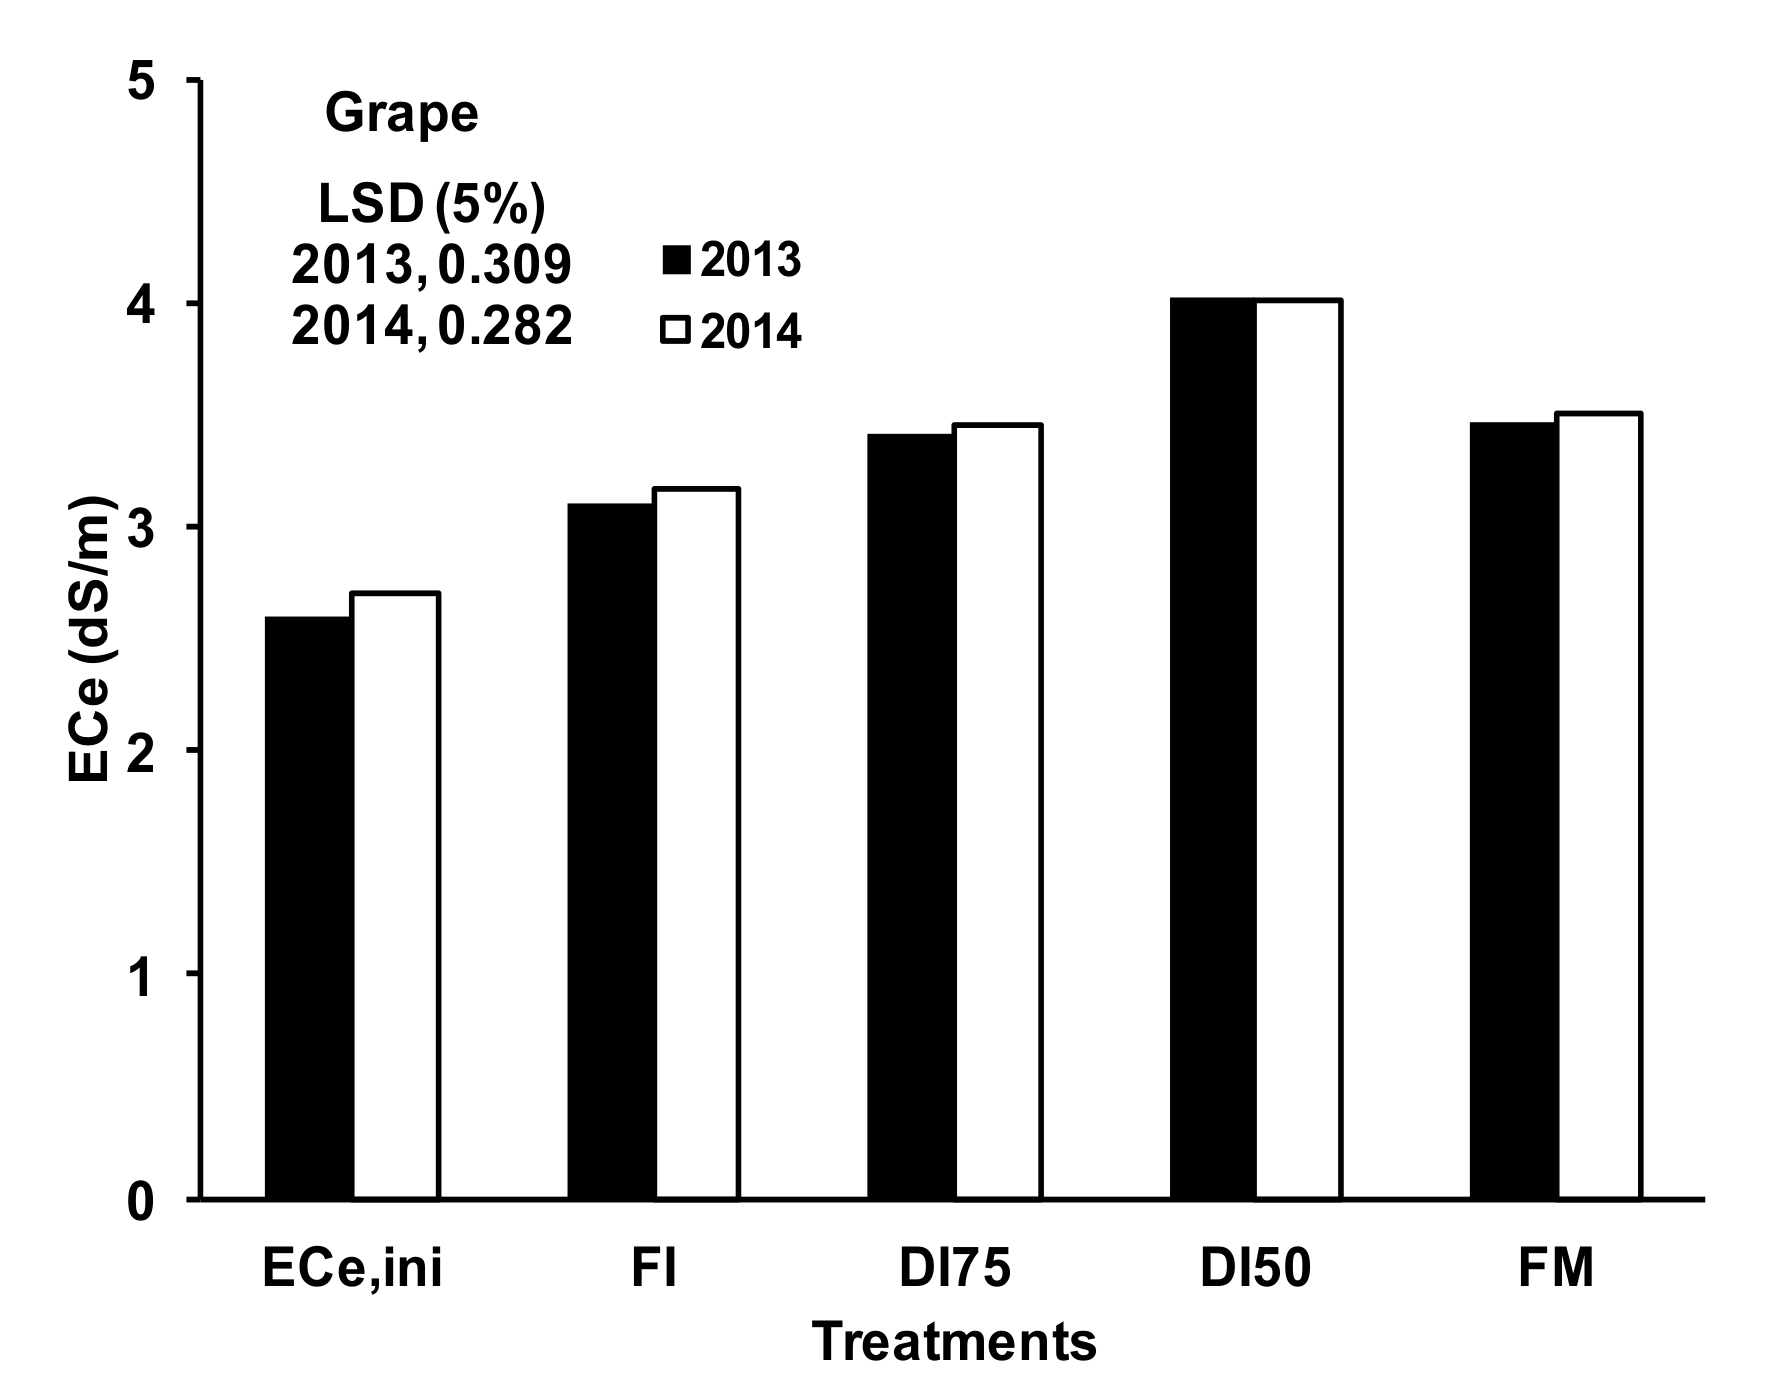
Total available water (TAW) in the root zone of orange and table olive was estimated to 88 mm depth and readily available water (RAW) was considered to be 50% TAW, i.e., 44 mm [23]. An irrigation of 80 mm was applied each year in April and February to orange and table olive trees in order to refill the root zone and start with a soil at field capacity in the root zone, and irrigation continued until the end of December with amounts estimated by the FAO-56 method and delivered on a weekly basis. Soil water depletion (SWD) was determined using soil moisture measured by the gravimetric method; it is the difference between actual measured water content (AW) and water content at field capacity (TAW).
The evolution of soil water depletion (SWD) during the irrigation period of orange and table olive trees in 2013 and 2014 can be observed in Figure 2 and Figure 3, which show obvious differences between irrigation strategies. SWD values in orange and table olive orchards did not fall under the RAW threshold value for FI and FM treatments, which indicated good watering conditions for both treatments and both years. However, depleted soil water increased gradually during the whole season with the DI50 treatment, and it went beyond RAW from the day of year (DOY) 245 in 2013 and DOY 225 in 2014 in orange trees, and from DOY 210 in 2013 and DOY 200 in 2014 in table olive trees, indicating continuous water stress for this irrigation treatment. SWD were smaller for DI75 compared with DI50 with intermediate values and approached the RAW threshold at the end of the irrigation season.

3.2. Soil Salinity

The average ECe values at the beginning (ECe,ini) and the end of the irrigation season for the different treatments of orange, table olive, and grapevine are presented in Figure 4. During both years, ECe values measured at harvest of orange and table olive were overall lower compared with the initial ECe,ini values in all irrigation treatments. For the FI, DI75, and FM treatments, ECe values were generally lower than the salinity of the irrigation water (2 dS·m−1). This was due to leaching of soluble salts by rainfall events (66 and 82 mm). Higher ECe values were observed for the DI50 treatment and lower values for FI treatment. The DI75 and FM treatments resulted in low ECe values at harvest and did not differ significantly (p < 0.05) from FI but were statically different from DI50. The higher soil salinity observed for the DI50 treatment may be attributed to lack of leaching under deficit irrigation conditions as reported by Geerts et al. [25] and Aragüés et al. [26], who indicated that increase in soil salinity was more pronounced under deficit irrigation due to the lower soil water content and the reduced leaching under these irrigation strategies. Low values of ECe observed under current climatic conditions and high irrigation water supply with ECiw of 2 dS·m−1 were due to the natural leaching of soluble salts by rainfall received during both years. The relatively high soil moisture levels (Figure 2 and Figure 3) seemed to have increased the leaching capacity of rains. The soil salinity measured at harvest of the grapevines was higher than the ECe at the start of irrigation (ECe,ini) for all treatments. Soil salinity values under full and deficit irrigation and grower’s treatments in the grapevines showed significant differences, except for DI75 and FM, between which the difference was not significant. The ECe obtained under FI, DI75, DI50, and farmer’s treatments increased from 2.4 dS·m−1 at the start of the irrigation season to 2.9, 3.2, 3.9, and 3.3 dS·m−1, respectively, in 2013, and from 2.1 dS·m−1 to 2.6, 3.1, 3.6, and 3.0 dS·m−1, respectively, in 2014. Similarly, Aragüés et al. [26,27] observed an increase in soil salinity and they found that it was more pronounced during deficit treatments compared with a full treatment in fields with grape vineyard, nectarine, and peach. In spite of the rains received during the period of February–April in 2013 (15 mm) and in 2014 (33 mm), which were supposed to cause leaching of salts accumulated in the root zone, the increase in ECe values in both years can be explained by absence of rain later in the irrigation season and the sampling date, which corresponds to a period of high evaporation demand. Thus, under all irrigation treatments of grapevine, the largest values of soil salinity were observed during periods of high evaporative demand in the absence of rainfall. However, soil salinity decreased during the irrigation periods of orange and table olive orchards due to natural leaching by rainfall events.

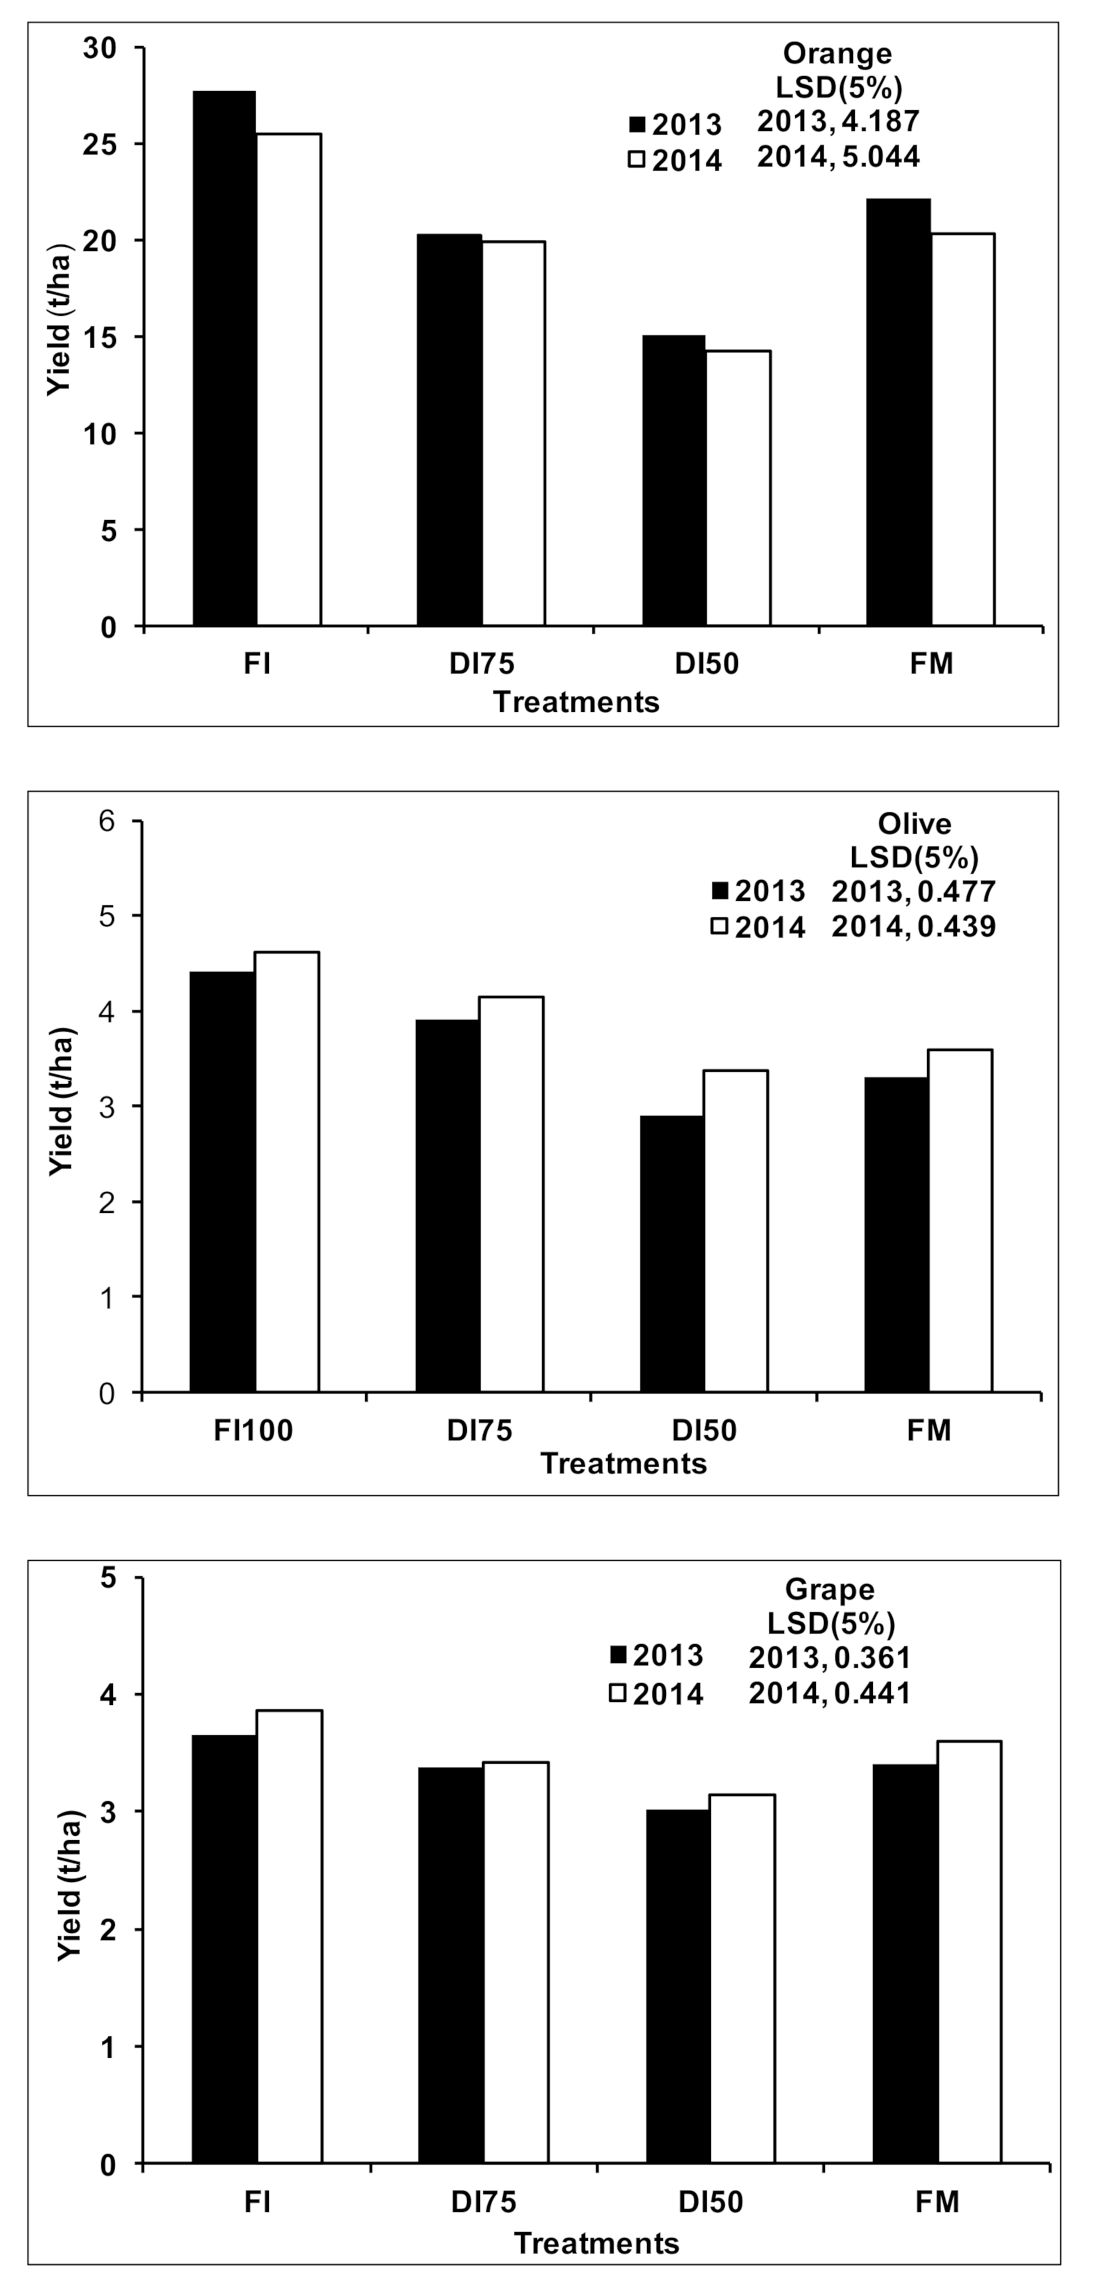
3.3. Yield and Fruit Quality

Yield and fruit quality parameters of orange, grapevine, and olive are presented in Figure 5 and Table 1, Table 2 and Table 3. For orange trees, there was a significant difference among tested treatments on fruit weight and total soluble solids (TSS) (Table 1). The highest yields and fruit weights and the lowest TSS were obtained in FI treatment, whereas DI50 gave the lowest yields and fruit weights but the highest TSS (Figure 5 and Table 1). Fruit yields were considerably lower under DI75 and DI50 treatments compared with that in FI treatment. That was not the case in the study of Martínez-Gimeno et al. [28] who found no differences in clementine yield observed between treatments over years of their study in spite of the differences registered in fruit weight. Furthermore, these results are in contrast to those reported by Vélez et al. [29] who did not find significant differences in final yield, fruit weight, and number in deficit irrigated “Clementine of Nules”. In fact, they applied a moderate deficit in terms of irrigation (reduction of irrigation in the range of 12–18%) and an even lower level in terms of total water supply by rainfall (R) and irrigation (I) (R+I reduction in the range of 5–10%). It seems that under such low levels of deficit, they did not observe significant differences in yield and fruit quality. In our experiment, the percentage of reduction in deficit irrigation treatment was 25–50% in terms of irrigation and 20–45% in terms of total water supply (R+I) as the amount of rainfall was very low (66 and 82 mm). Average fruit yields for DI75 and FM were not significantly different with comparable values of 20.1 and 21.2 t·ha−1. That yield was significantly greater under the FI strategy (26.6 t·ha−1) than that under DI75, which in turn was significantly higher than that under the DI50 (14.6 t·ha−1). The fruit quality variables (Table 1) showed also significant differences with higher total soluble solids for DI50 and greater fruit weight for FI and FM. Fruit weight observed under DI75 was greater than DI50 without a statistical difference between them. Furthermore, the highest TSS was obtained under the deficit treatments (particularly DI50) than those under the FI and FM treatments. However, there were no statistical differences (p < 0.05) among treatments in juice content.
Fruit yields and weights were higher in 2013 than in 2014 under all treatments. In contrast, TSS was higher in 2014 than in 2013. These results may be assigned to physiological responses of orange trees to water and salinity stresses induced by the higher salinity in 2014 and the stress due the high initial soil salinity (ECe,ini). Thus, the yield decrease in 2014 could be attributed to the higher ECe,ini in that year, which affected all treatments. Furthermore, Aragüésa et al. [30] reported that the relative productivity of peach trees tended to decrease above a threshold ECe value of about 4 dS·m−1, whereas Grieve et al. [31] and Nicolás et al. [32] reported that fruit yields decrease about 13% for each 1.0 dS/m increase in ECe when soil salinity exceeds a threshold ECe of 1.4 dS·m−1.
Thus, in this experiment, the use of deficit irrigation significantly reduced orange yield and weight while improving fruit quality in terms of total soluble solids. DI50 was the treatment with the highest reduction in yield and fruit weight (45% and 42%), but resulted in 17% increase in the TSS. It has been shown that fruit quality in terms of TSS improved under deficit irrigation for cv. “Tarocco Meli” orange trees [17], peach species [33,34], and grapevine [35,36,37].
For table olive, there was a significant difference between the impacts of irrigation treatments on yield, fruit weigh, and size during the study years 2013 and 2014. The yield in olive orchard was higher in FI treatment (4.2 and 4.6 t.ha−1) across both study years (Figure 4). Significant differences were also observed between the FI and the other treatments. The lowest yield was obtained with the DI50 strategy with 29–35% reduction compared with FI, whereas the fruit yield decrease was about 10–12% and 23–25% for the DI75 and FM strategies in comparison with FI, respectively. The differences were not significant between DI50 and FM strategies and the lower yield was due to a lower fruit set in the last two strategies. Vita et al. [38] and Talozi et al. [39] observed that the reduction in water supply by 50% and 35% decreased yields by 26% and 23.5%, respectively. Furthermore, Grijalva-Contreras et al. [40] found significant differences in yield, fruit weigh, and fruit diameter of table olive with deficit treatments compared with those under full irrigation. In our study, the fruit weight and size of table olive were affected by the irrigation strategies (Table 2). The difference in both parameters under FI and DI75 treatments was not significant. The fruit weight and size were lower for the DI50 treatment and statistically different from the DI75 treatment. No significant differences were observed in fruit weight and size when we compared the DI50 and FM treatments. The differences in fruit weight and size may be due to differences in fruit load between treatments as reported by Kaya et al. [41] and Grijalva-Contreras et al. [40], who found that fruit weight decreased considerably in response to the level of water stress and fruit load.
For grapevine, higher yield was obtained under the FI treatment in both years (Figure 5). Significant differences between the FI and other treatments were observed. The grape yield was smallest for DI50 with 17% and 19% reduction compared with that under the FI treatment, respectively, in 2013 and 2014. The low yield under DI50 and DI75 treatments was due to a smaller fruit weight (Table 3). Similar results were found by Vita et al. [42] in Argentina in the Superior cultivar, and Acevedo-Opazo et al. [37] in grapevine orchard (cv. Cabernet Sauvignon) in Chile. Among all treatments, FI gave the highest fruit weight and lowest TSS, while DI50 yielded the lowest fruit weight but the highest TSS (Table 3). The differences between DI75 and FM in terms of fruit weight and TSS were statistically not significant. However, the fruit weight yielded by DI50 was significantly lower than those obtained under the FI treatment and statistically different from the DI75 and FM treatments. Contrarily to yield and fruit weight, the deficit irrigation improved TSS. These results were also similar to those obtained by Trégoat et al. [35], Carolin et al. [36] and Acevedo-Opazo et al. [37], who found higher TSS in berries of plants under water restriction conditions. The TSS was significantly greater under DI50 compared with the FI and FM treatments, but the difference between the two latter was not significant. Permanhani et al. [43] reported that as berry weight is a crucial qualitative characteristic in grape production, reducing water supply had a negative impact on grape quality, although TSS values were higher for deficit irrigation strategies of grapevine. Similar results have been reported by Mabrouk [13] for the table grape in a DI experiment under semi-arid conditions of Tunisia.

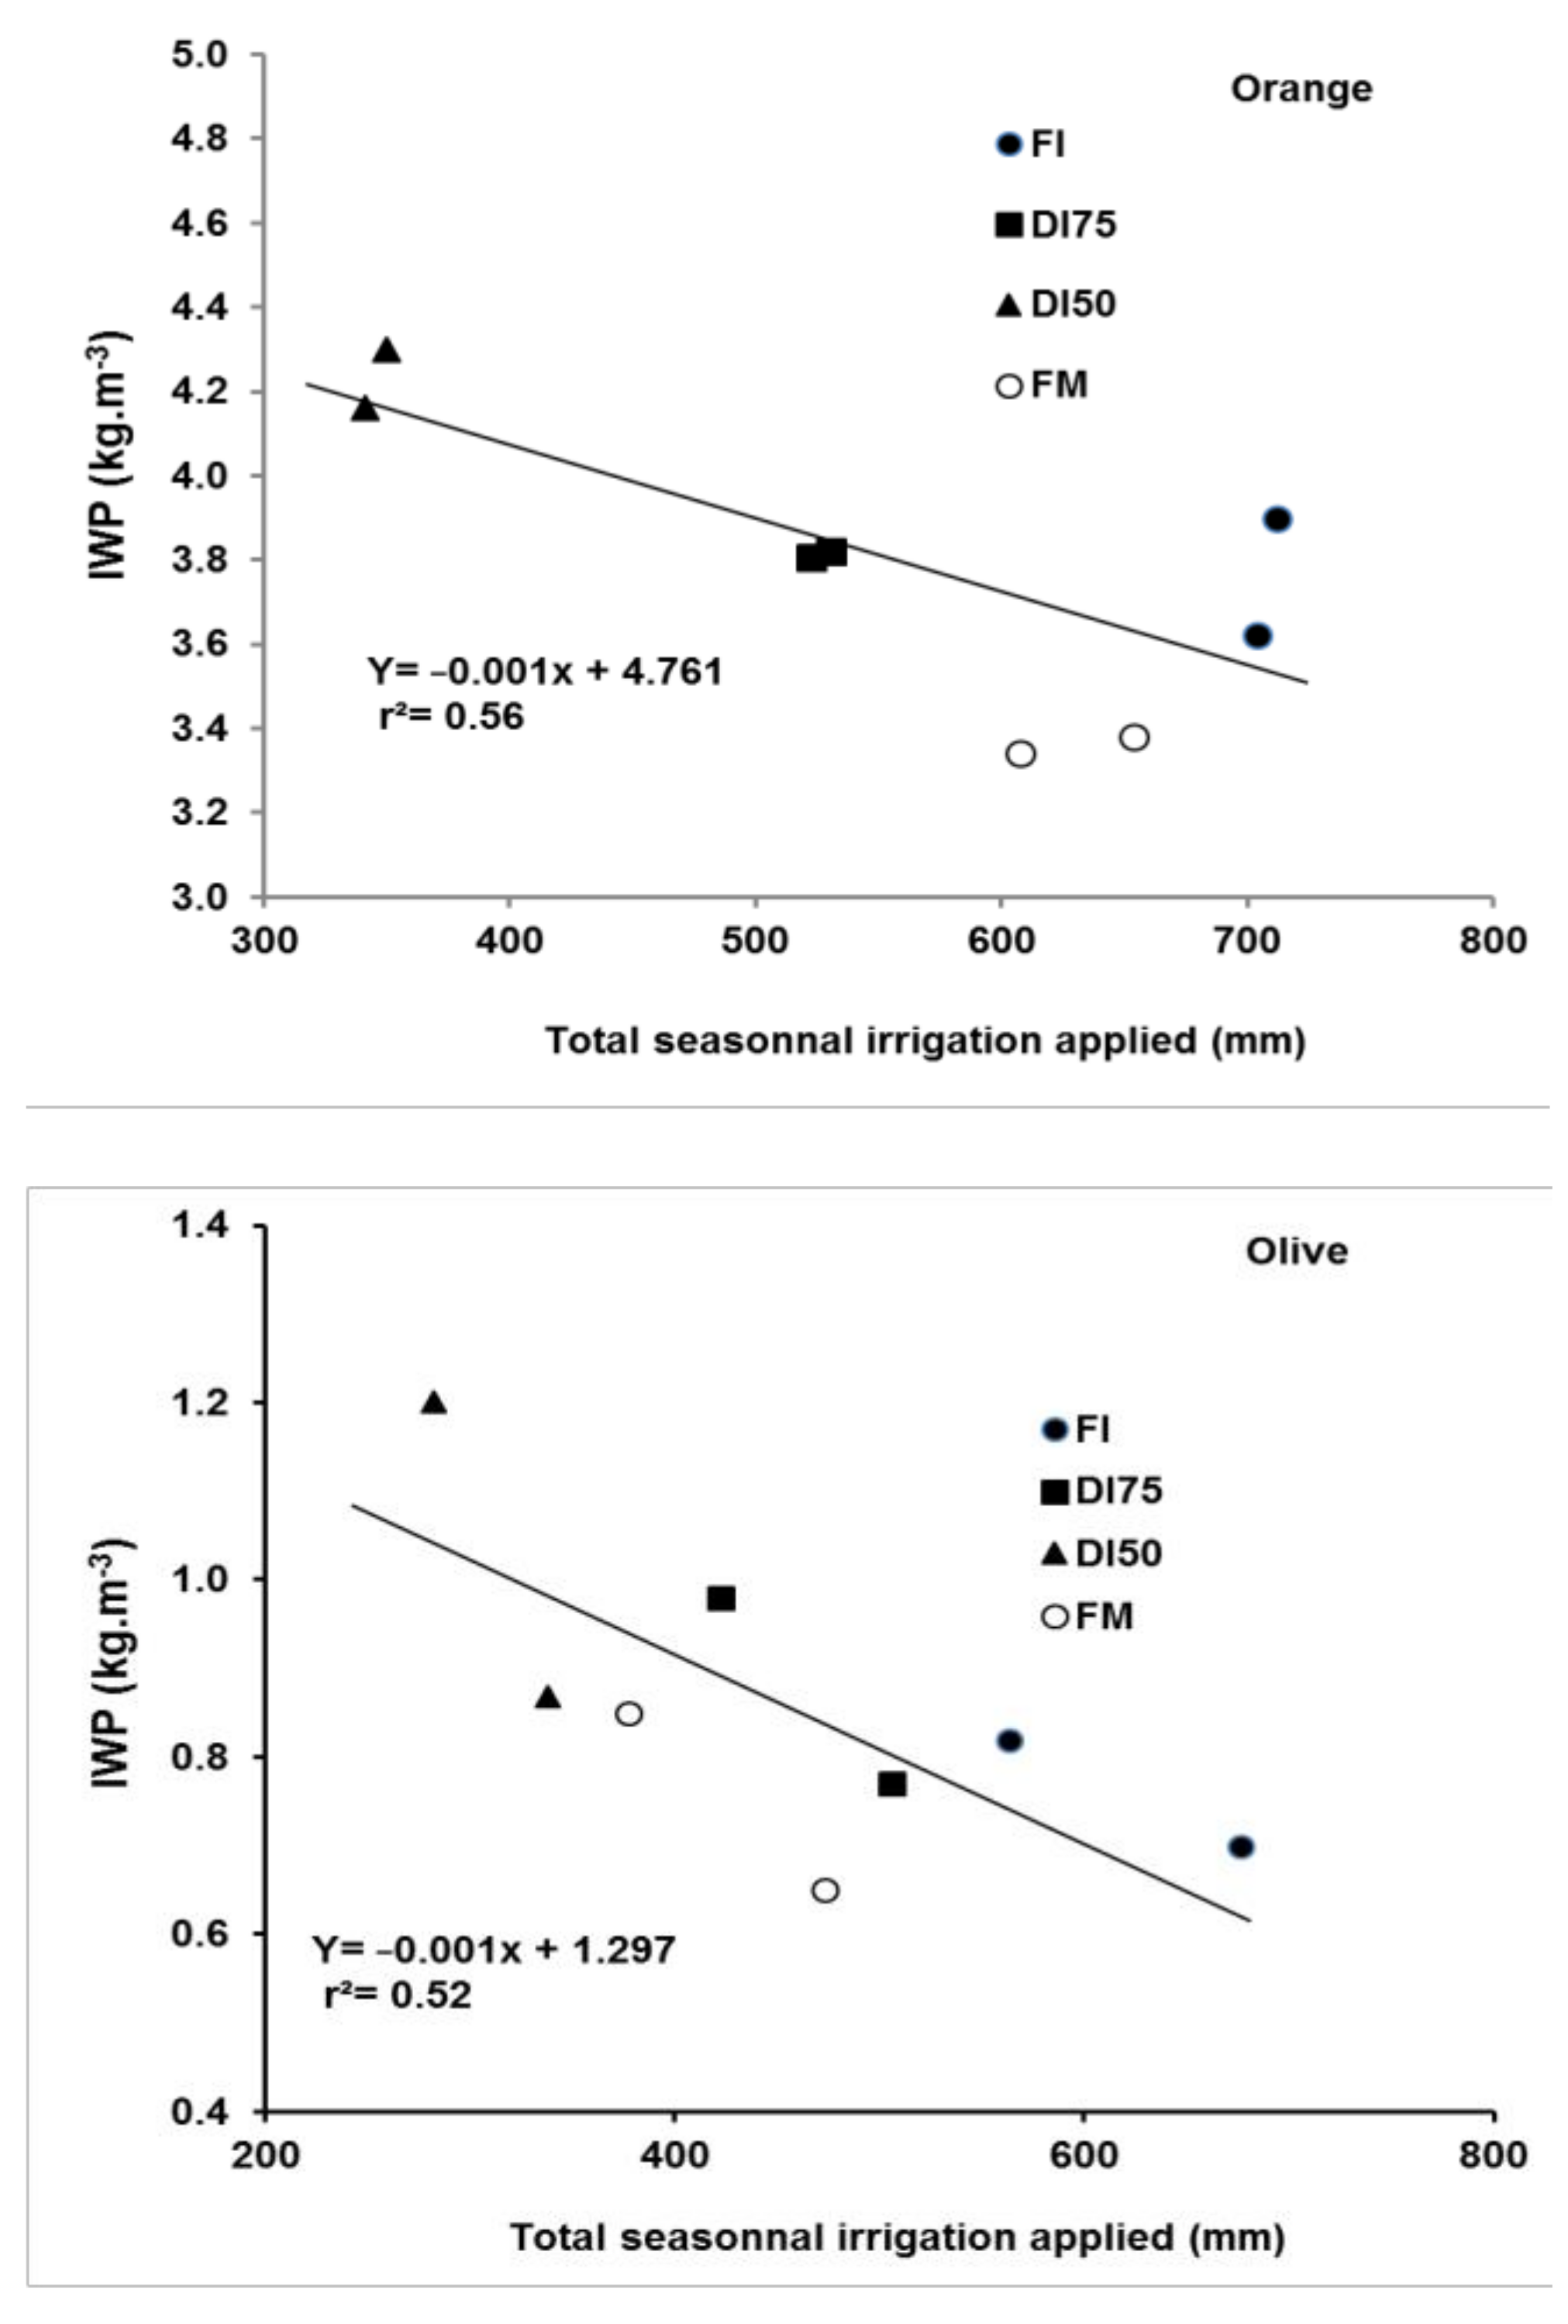
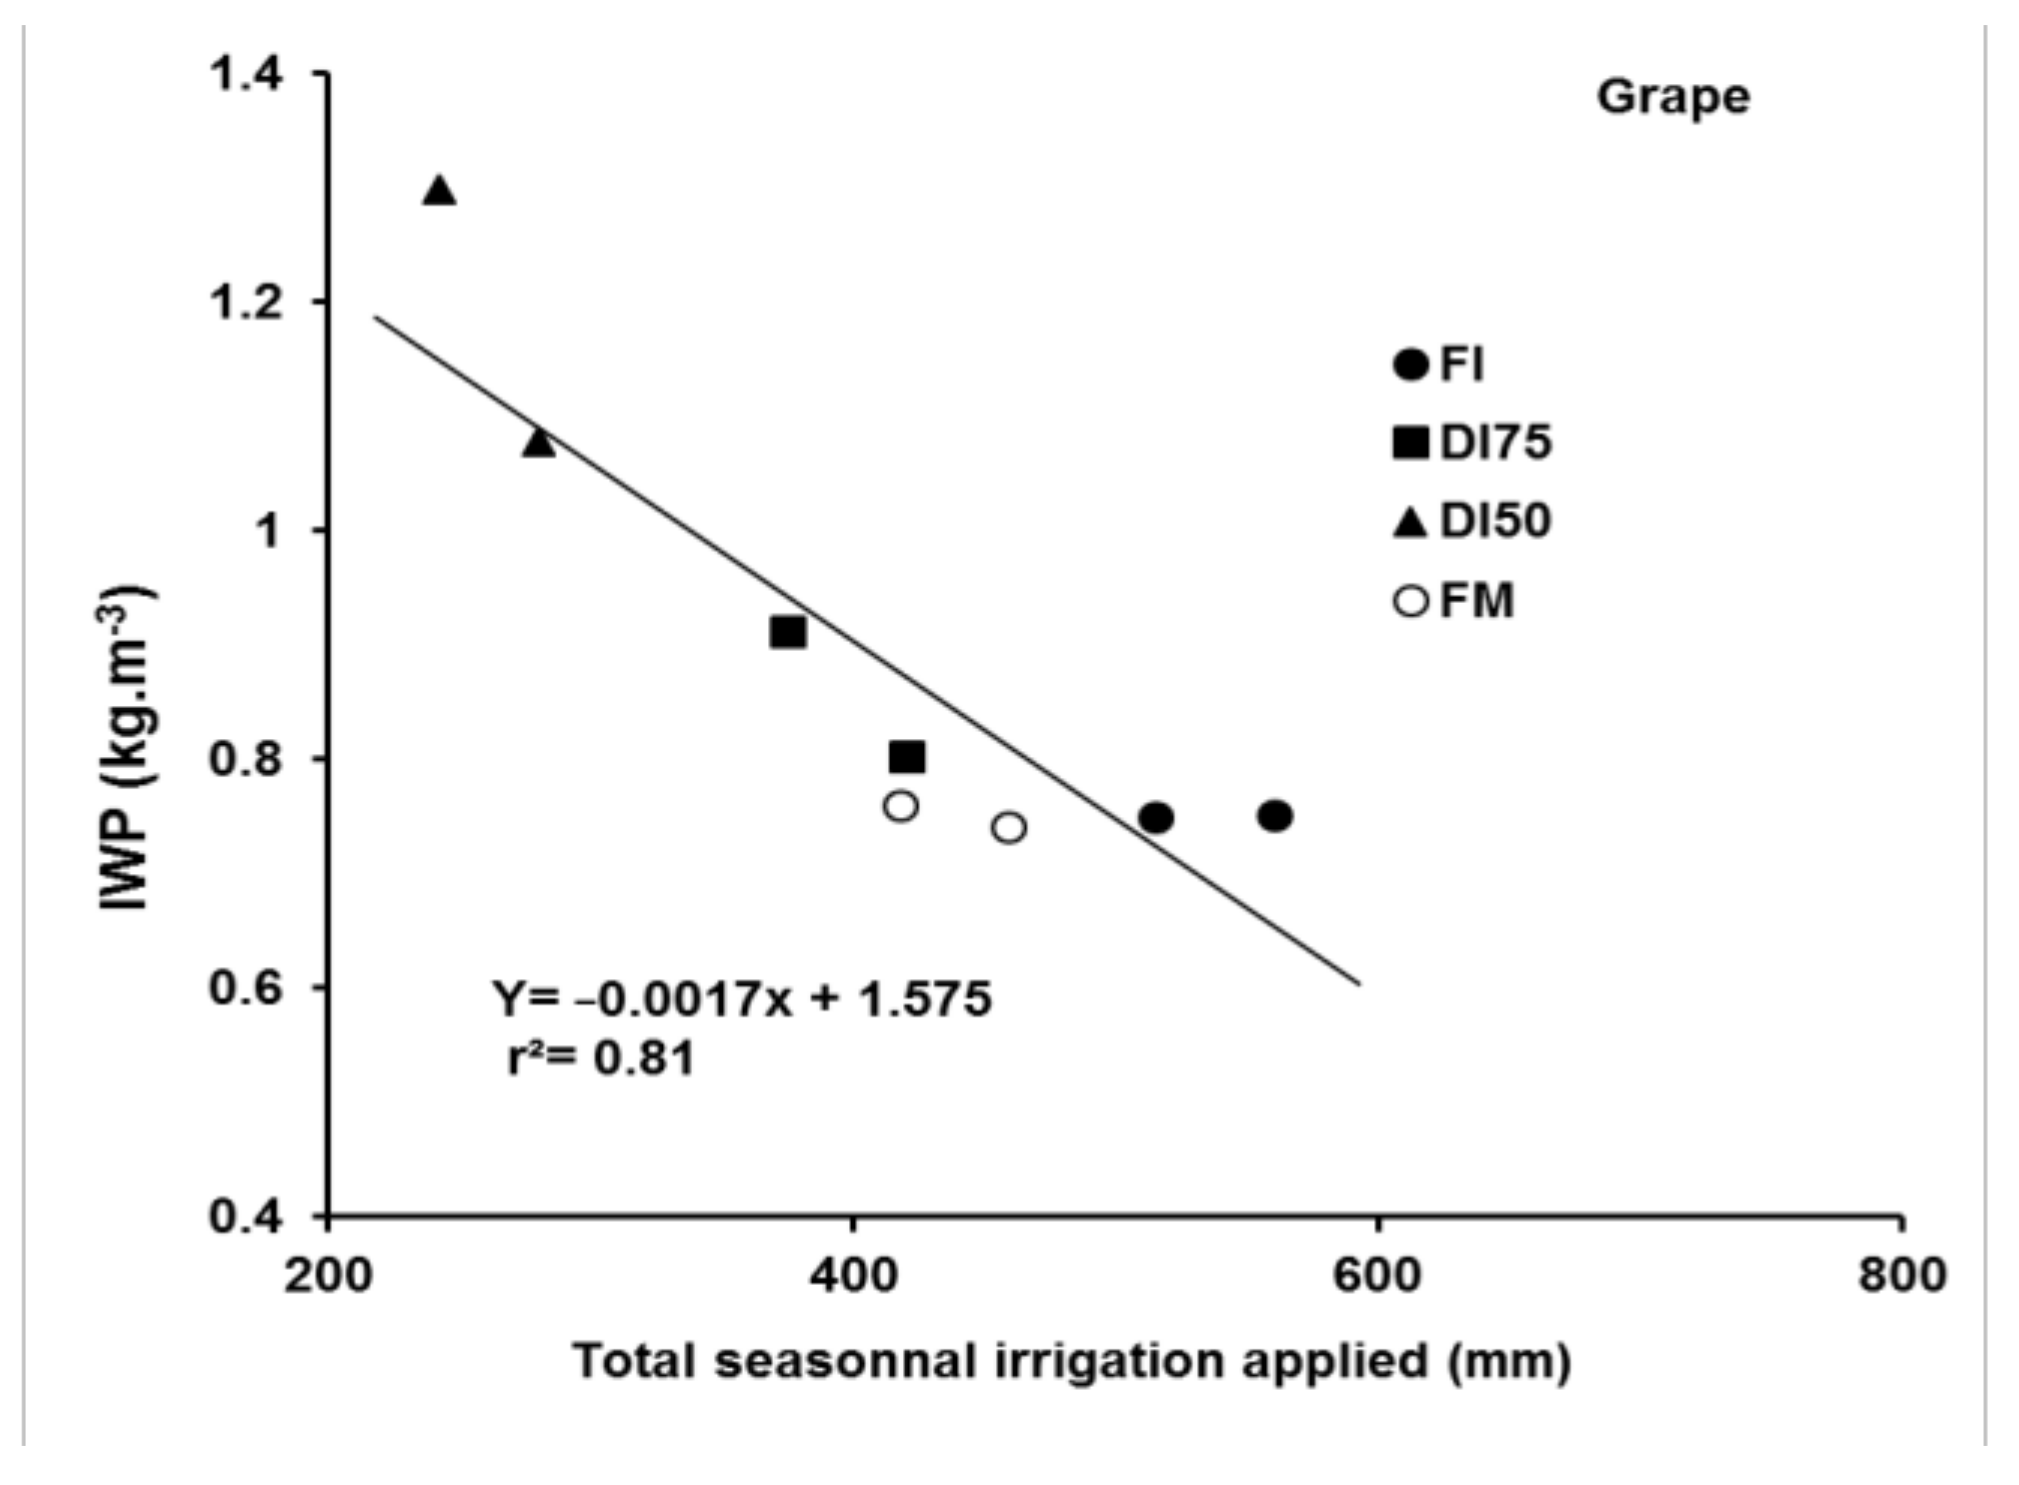
3.4. Water Productivity

Irrigation treatments were applied from early May to the end of December to orange trees, from February until December to table olive trees, and from March until early July to grapevines. The fruit trees differed in the irrigation amount that was applied according to the FAO-56 method. For all treatments, the highest values of irrigation amounts were recorded in orange orchard and the lowest amounts were applied to grapevine, while olive orchard received intermediate irrigation. Greatest irrigation quantities were applied in case of the FI treatment (Figure 6). Compared with the FI treatment, orange trees under FM, DI75, and DI50 received 578 to 1810 m3.ha−1 and 960 to 3540 m3·ha−1 less irrigation water in 2013 and 2014, respectively (Figure 6), which saved 8% to 51% water in 2013 and 14% to 52% in 2014. For table olive orchards, the reduction in applied water was 170 to 338 mm in 2013 and 140 to 281 mm in 2014. This stands for a saving of 25% to 50% of irrigation water over the monitoring period 2013–2014, while for grapevine, the water savings achieved due to these treatments were 104 to 280 mm (18% to 51%) and 97 to 273 mm (19% to 53%) in 2013 and 2014, respectively. It is of note that under the FM treatments, irrigation amounts were less than those applied under the FI treatment over two years of study. This indicated that growers likely practiced DI, perhaps due, in part, to the increase of irrigated areas and the cultivation of high-economic value crops during spring and summer seasons where the crop water requirements were high.
Water productivity (WP), measured as fruit yield (kg) per cubic meter of irrigation water, decreased as applied water increased (Figure 6), confirming previous results of studies on peach trees [34] and almond trees [6]. It varied between 4.3 and 3.3 kg·m−3 for orange, 1.2 and 0.65 kg·m−3 for olive, and 1.3 and 0.74 kg·m−3 for grapevine observed under the DI50 and FM treatments, respectively. The highest WP was obtained under DI50, which used about 50% of irrigation the water of FI and 54%, 59%, and 73% of FM for orange trees, grapevines, and olive trees, respectively. That treatment (DI50) increased significantly the WP compared with the FI treatment in 2013 (11% for orange trees, 24% for olive trees, and 43% for grapevines) and in 2014 (15% for orange trees, 46% for olive trees, and 73% for grapevines). Most of the studies addressing WP in peach, table grape, orange, and olive under deficit irrigation reported an increase in comparison with full irrigation practices, although with lower yields under a moderate or severe water stress [40,44,45,46,47], whereas the grower’s treatment (FM) had lower values of WP. It is of note that WP values recorded under FI treatment were over the regression line (Figure 6) and those under FM were beneath this line, which indicated a better water use by FI and a lower efficiency of the grower’s irrigation program. The low WP for the FM treatment during the two years can be attributed to reduced yields but also to relatively higher irrigation water use.
Many works have proved that deficit irrigation (DI) is especially appropriate for regions where water is scarce, as in the arid areas, and improving WP is a critical goal [2,48,49]. Furthermore, DI has been proposed as one of the ways to increase water productivity for fruit trees under the semi-arid and arid environment of Tunisia [4]. Tolzi et al. [39] suggested that the DI regime that saves about 35% of full ETc may be useful in conserving water while maintaining high yield and fruit quality. In our study, yield and WP values in orange and table olive trees and grapevine under FI treatment were 26.6 t/ha and 3.8 kg/m3, 4.51 t·ha−1 and 0.8 kg·m−3, and 3.8 and 0.75 kg·m−3, respectively. Restriction of irrigation water led to a decrease in yield by 24% and 45% for orange, 11% and 30% for table olive, and 10% and 19% for grapevine under the DI75 and DI50 treatments, respectively. Thus, deficit irrigation provides an alternative for orange, table olive, and grapevine irrigation in the context of increasing water scarcity.

3.5. Economic Evaluation

The average values of the economic analysis for the different irrigation strategies FI, DI75, DI50, and FM are presented in Table 4. Net return was calculated for tested treatments considering actual price of fruits and the fixed and variable expenditures (irrigation system, fertilizers and pesticides, labor, and water). The highest net return was obtained with the FI treatment, and this could be explained by the higher yields achieved under this treatment in comparison with the DI75, DI50, and FM treatments. The DI50 treatment gave a significantly lower net income, while the FM and DI75 treatments resulted in intermediate net return values. Full irrigation scheduling (100% ETc) using the soil water balance method (FI) could be recommended in orange and table olive orchards and for grapevines with no water scarcity. However, under water limited conditions, irrigation of orange, table olive, and grapevines can be managed using deficit irrigation, saving irrigation water. For deficit irrigation treatments, a decrease in net income values were recorded in case of DI50 compared with the FI. That treatment does not seem to be profitable under the current prices of orange, table olive, grape fruits, and irrigation water, while DI75 and FM generated a better net income compared with DI50. Thus, the viability of the deficit irrigation treatment depends on the production and water prices [8]. The use of the DI75 treatment in orange and table olive orchards and grapevines resulted in saving 25% of irrigation water and in reductions in yields (24%, 11%, 10%) and in the net income (40%, 23%, 13%) when compared with the FI treatment. Thus, the adoption of this strategy by orange, table olive, and grapevines growers could be a solution to the increasing water scarcity in the region.

4. Conclusions

This study showed that irrigation water quantity applied by farmers in orange, table olive, and grapevines orchards using empirical knowledge and fixed amounts and frequency was lower than needed according to the FAO-56 method. In orange, table olive, and grapevine, the farmers (FM) used 8–13.7%, 30–33%, and 18–19% less water, respectively, than the full irrigation method (FI), where 100% ETc were covered by irrigation but resulted in substantial reduction of yields. Additional savings of irrigation water can be reached by adopting an SWB-based continuous deficit irrigation practice without additional reduction of yield and income. In our experiment, deficit irrigation was applied using 25% less water (DI75) than full irrigation (FI) and resulted in a yield reduction by approximately 24%, 11%, and 10% in orange, table olive, and grapevine, respectively. DI75 resulted in comparable yield to that obtained by farmer (FM), who applied 14–19% and 8.5–10% more irrigation water in orange and grapevines orchards, respectively. A 50% reduction of irrigation water (DI50) caused a large reduction in yields and affected also the size and weight of fruits of all crops, but fruit quality was significantly improved in terms of total soluble solids (TSS).
Irrigation water productivity (IWP) was between 3.34 and 4.30 kg of orange, 0.65 and 1.20 kg of table olive, and 0.74 and 1.30 kg of grape for each m3 of irrigation water used. DI50 had the highest IWP and FM the lowest. FI and DI75 had intermediate values of IWP while being highly productive and economically profitable. The application of a severe water deficit (DI50) reduced significantly the economic return compared with the full irrigation treatment, while intermediate values of IWP and net income were obtained under a moderate deficit (DI75). The FI strategy generated the greatest net income and was found to be a good alternative in terms of IWP and soil salinization. However, under water scarcity conditions, DI75 could represent a reasonable strategy for increasing water productivity with small reduction of yield and economic net income and relatively low impact on soil salinity. Under our experimental conditions, its application on orange, table olive, and grapevines orchards allowed water savings of 25% with reductions of about 24%, 11%, and 10%, of yield and 40%, 24%, 13% of the net income for orange, table olive and grapevine, respectively. This conclusion is consistent with the experimental results of [22,50] and confirms the great potential of deficit irrigation to improve the water productivity [4,51] and the control of soil salinization [26,27,52] by combining the use of drip irrigation technology with deficit irrigation strategies and by exploiting the natural leaching of salts by the rain. Future studies should be undertaken to evaluate the efficiency of the rains for natural leaching.

Author Contributions

Conceptualization, F.E.M., and K.N.; methodology, F.E.M., and K.N.; writing—original draft preparation, F.E.M., K.N., and G.G.; writing—review and editing, K.N., M.M.M., and N.B.M. All authors have read and agreed to the published version of the manuscript.

Funding

This research was funded by USAID and EU.

Institutional Review Board Statement

Not applicable.

Informed Consent Statement

Not applicable.

Data Availability Statement

Not applicable.

Acknowledgments

The authors acknowledge that this work was funded by USAID and managed by ICARDA through the Water and Livelihood Initiative (WLI) and by the European Union, through the WADIS-MAR project (ENPI/2011/280-008).

Conflicts of Interest

The authors declare no conflict of interest.

References

  1. Topak, R.; Süheri, S.; Acar, B. Effect of different drip irrigation regimes on sugar beet (Beta vulgaris L.) yield, quality and water use efficiency in Middle Anatolian, Turkey. Irrig. Sci. 2011, 29, 79–89. [Google Scholar] [CrossRef]
  2. Fernandes-Silva, A.; Oliveira, M.; Paço, T.A.; Ferreira, I. Deficit Irrigation in Mediterranean Fruit Trees and Grapevines: Water Stress Indicators and Crop Responses. In Irrigation in Agroecosystems; Gabrijel, O., Ed.; IntechOpen: Rijeka, Croatia, 2018; Volume 24, pp. 1–24. [Google Scholar] [CrossRef] [Green Version]
  3. Geerts, S.; Raes, D. Deficit irrigation as an on-farm strategy to maximize crop water productivity in dry areas. Agric. Water Manag. 2009, 96, 1275–1284. [Google Scholar] [CrossRef] [Green Version]
  4. Ghrab, M.; Masmoudi, M.M.; Ben Mechlia, N. Water productivity in fruit trees orchards under water Scarcity. Acta Hortic. 2017, 1150, 317–332. [Google Scholar] [CrossRef]
  5. Naor, A. Irrigation scheduling and evaluation of tree water status in deciduous orchards. Hortic. Rev. 2013, 32, 111–166. [Google Scholar]
  6. Manuel, L.; Mónica, E.; Luca, T.; Ignacio, J.L.; Francisco, O.; Elías, F. Yield response of almond trees to transpiration deficits. Irrig. Sci. 2018, 36, 111–120. [Google Scholar] [CrossRef]
  7. Garcia-Tejero, I.; Duran, Z.V.H.; Jimenez, B.J.A.; Muriel, F.J.L. Improved water-use efficiency by deficit-irrigation programmes: Implications for saving in citrus orchards. Sci. Hortic. 2011, 128, 274–282. [Google Scholar] [CrossRef]
  8. Mahmoudzadeh Varzi, M.; Trout, T.; DeJonge, K.; Oad, R. Optimal Water Allocation under Deficit Irrigation in the Context of Colorado Water Law. J. Irrig. Drain. Eng. 2019, 145, 05019003. [Google Scholar] [CrossRef]
  9. Galindoa, A.; Collado-Gonzálezb, J.I.; Griñánc, I.; Corelld, M.; Centenof, A.; Martín-Palomod, M.J.; Giróne, I.F.; Rodríguezh, P.; Cruzh, Z.N.; Memmif, H.; et al. Deficit irrigation and emerging fruit crops as a strategy to save water in Mediterranean semiarid agrosystems. Agric. Water Manag. 2018, 202, 311–324. [Google Scholar] [CrossRef]
  10. Miguel Costa, J.; Ortuno, M.F.; Chaves, M.M. Deficit Irrigation as a Strategy to Save Water: Physiology and Potential Application to Horticulture. J. Integr. Plant Biol. 2007, 49, 1421–1434. [Google Scholar] [CrossRef]
  11. Masmoudi-Charfi, C.; Ayachi-Mezghani, M.; Gouiaa, M.; Laabidi, F.; Ben Reguaya, S.; Ouled Amor, A.; Bousnina, M. Water relations of olive trees cultivated under deficit irrigation regimes. Sci. Hortic. 2010, 125, 573–578. [Google Scholar] [CrossRef]
  12. Hammami, A.; Mellouli, J. Drip Irrigation Scheduling of Citrus Orchard in Tunisia. In Proceedings of the 21st ICID International Congress Of Irrigation and Drainage, Teheran, Iran, 15–23 October 2011; pp. 1–14. [Google Scholar]
  13. Mabrouk, H. The use of water potentials in irrigation management of table grape grown under semi-arid climate in Tunisia. J. Int. Sci. Vigne Vin 2014, 48, 123–133. [Google Scholar]
  14. Mahjoub, I.; Zitouna-Chebbi, R.; Mekki, I.; Ben Mechlia, N. Assessing irrigation scheduling by FAO method using soil-plant atmosphere water stress indicators on four orange cultivars. Acta Hortic. 2015, 1150, 139–144. [Google Scholar] [CrossRef]
  15. Colauto Stenzel, N.M.; Vieira Janeiro Neves, C.S.; Marur, C.J.; dos Santos Scholz, M.B.; Gomes, J.C. Maturation curves and degree-days accumulation for fruits of ‘folha murcha’ orange trees. Sci. Agric. 2006, 63, 219–225. [Google Scholar] [CrossRef] [Green Version]
  16. Janez, H.; Rajko, V. Impacts of climate change on fruit physiology and quality. In Proceedings of the 50th Croatian and 10th International Symposium on Agriculture, Opatija (Hrvatska), Croatia, 16–20 February 2015. [Google Scholar]
  17. Fiorella, S.; Francesco, I.; Simona, C.; Alberto, C.; Giancarlo, R. Response of Orange Trees to Deficit Irrigation Strategies:Effects on Plant Nutrition, Yield, and Fruit Quality. J. Irrig. Drain. Eng. 2015, 141, 141–149. [Google Scholar]
  18. Muriel, J.L.; Jimenez, J.A.; Garcia, I.; Vaquero, I. Relaciones hídricas en una plantación de naranjos (Citrus Sinensis, L. In cv Navelino) bajoe strategias de riego deficitario mantenido. In Proceedings of the VIII Simposium Hispano Portugués de Relaciones Hídricas en las Plantas; Resúmenes, Puerto de la Cruz (Tenerife), Spain, 17–21 September 2006; pp. 139–142. [Google Scholar]
  19. Garcia-Tejero, I.; Jimenez-Bocanegra, J.A.; Duran-Zuazo, V.H.; Romero-Vicente, R.; Muriel-Fernandez, J.L. Positive impact of deficit irrigation on physiological response and fruit yield in citrus orchards: Implications for sustainable water saving. J. Agric. Sci. Technol. 2010, 4, 38–44. [Google Scholar]
  20. Pérez-Pérez, J.G.; Garcia, J.; Robles, J.M.; Botia, P. Economic analysis of naval orange cv “Lane late” grown in two different drought-tolerant rootstocks under deficit irrigation in south eastern Spain. Agric. Water Manag. 2010, 97, 157–164. [Google Scholar] [CrossRef]
  21. Maas, E.V. Crop salt tolerance. Ed Tanji KK, Agricultural salinity assessment and management. In ASCE Manuals and Reports on Engineering Practice No. 71; American Society of Civil Engineers: New York, NY, USA, 1990; pp. 262–304. [Google Scholar]
  22. Nagaz, K.; El Mokh, F.; Alva, A.K.; Masmoudi, M.M.; Ben Mechlia, N. Potato response to different irrigation regimes using saline water. Irrig. Drain. 2016, 65, 654–663. [Google Scholar] [CrossRef]
  23. Allen, R.G.; Perreira, L.S.; Raes, D.; Smith, M. Crop. Evapotranspiration: Guidelines for Computing Crop Water Requirements; FAO-Food and Agriculture Organization of the United Nations: Rome, Italy, 1998; p. 300. [Google Scholar]
  24. Nagaz, K.; Masmoudi, M.M.; Ben Merchlia, N. Impacts of irrigation regimes with saline water on carrot productivity and soil salinity. J. Saudi Soc. Agric. Sci. 2012, 11, 19–27. [Google Scholar] [CrossRef] [Green Version]
  25. Geerts, S.; Raes, D.; Garcia, M.; Condori, O.; Mamani, J.; Miranda, R.; Cusicanqui, J.; Taboada, C.; Vacher, J. Could deficit irrigation be a sustainable practice for quinoa (Chenopodium quinoa Willd.) in the Southern Bolivian Altiplano? Agric. Water Manag. 2008, 95, 909–917. [Google Scholar] [CrossRef]
  26. Aragüés, R.; Medina, E.T.; Claveria, I.; Martinez-Cob, A.; Faci, J. Regulated deficit irrigation, soil salinization and soil sodification in a table grape vineyard drip-irrigated with moderately saline waters. Agric. Water Manag. 2014, 134, 84–93. [Google Scholar] [CrossRef] [Green Version]
  27. Aragüés, R.; Medina, E.T.; Zribi, W.; Claveria, I.; Alvaro-Fuentes, J.; Faci, J. Soil salinization as a threat to the sustainability of deficit irrigation under present and expected climate change scenarios. Irrig. Sci. 2015, 33, 67–79. [Google Scholar] [CrossRef] [Green Version]
  28. Martínez-Gimeno, M.A.; Bonet, L.; Provenzano, G.; Badal, E.; Intrigliolo, D., S.; Ballester, C. Assessment of yield and water productivity of clementine trees under surface and subsurface drip irrigation. Agric. Water Manag. 2018, 206, 209–216. [Google Scholar] [CrossRef]
  29. Vélez, J.E.; Intrigliolo, D.S.; Castel, J.R. Scheduling deficit irrigation of citrus trees with maximum daily trunk shrinkage. Agric. Water Manag. 2007, 90, 197–204. [Google Scholar] [CrossRef]
  30. Aragüésa, R.; Medinaa, E.T.; Martínez-Cobb, A.; Faci, J. Effects of deficit irrigation strategies on soil salinizationand sodification in a semiarid drip-irrigated peach orchard. Agric. Water Manag. 2014, 142, 1–9. [Google Scholar] [CrossRef] [Green Version]
  31. Grieve, C.M.; Grattan, S.R.; Maas, E.V. Plant salt tolerance. In ASCE Manual and Reports on Engineering Practice No. 71 Agricultural Salinity Assessment and Management, 2nd ed.; Wallender, W.W., Tanji, K.K., Eds.; ASCE: Reston, VA, USA, 2012. [Google Scholar]
  32. Nicolás, E.; Alarcón, J.J.; Mounzer, O.; Pedrero, F.; Nortes, P.A.; Alcobendas, R.; Romero-Trigueros, C.; Bayona, J.M.; Maestre-Valero, J.F. Long-term physiological and agronomic responses of mandarin treesto irrigation with saline reclaimed water. Agric. Water Manag. 2016, 166, 1–8. [Google Scholar] [CrossRef]
  33. Ben Mechlia, N.; Ghrab, M.; Zitouna, R.; Ben Mimoun, M.; Masmoudi, M.M. Cumulative effect over five years of deficit irrigation on peach yield and quality. Acta. Hortic. 2002, 592, 301–307. [Google Scholar] [CrossRef]
  34. Ghrab, M.; Zitouna, R.; Ben Mimoun, M.; Masmoudi, M.M.; Ben Mechlia, N. Yield and water productivity of peach trees under continuous deficit irrigation and high evaporative demand. Biol. Agric. Hortic. Int. J. Sustain. Prod. Syst. 2013, 29, 29–37. [Google Scholar] [CrossRef]
  35. Trégoat, O.; Van Leeuwen, C.; Choné, X.; Gaudillere, J.P. Etude du régime hydrique et de la nutrition azotée de la vigne per des indicateurs physiologiques. Influence sur le comportement de la vigne et la maturation du raisin (Vitis vinifera L. cv. Merlot, 2000, Bordeaux). J. Int. Sci. Vigne Vin 2002, 36, 133–142. [Google Scholar]
  36. Carolin, S.W.; Nikolaus, M.; Simone, G.H. Impact of Water Deficit during Fruit Development on Quality and Yield of Young Table Grape Cultivars. Horticulturae 2018, 4, 45–50. [Google Scholar]
  37. Acevedo-Opazo, C.; Ortega-Farias, S.; Fuentes, S. Effects of grapevine (Vitis vinifera L.) water status on water consumption, vegetative growth and grape quality: An irrigation scheduling application to achieve regulated deficit irrigation. Agric. Water Manag. 2010, 97, 956–964. [Google Scholar] [CrossRef]
  38. Vita Serman, F.; Pacheco, D.; Olguín Pringles, A.; Bueno, L.; Carelli, A.; Capraro, F. Effect of Regulated Deficit Strategies on Productivity, Quality and Water Use Efficiency in a High-Density ‘Arbequina’ Olive Orchard Located in an arid Region of Argentina. Acta Hortic. 2011, 888, 81–88. [Google Scholar] [CrossRef]
  39. Talozi, S.; Al Waked, L. The effects of regulated deficit irrigation on the water demand and yield of olive trees. Appl. Eng. Agric. 2016, 32, 55–62. [Google Scholar]
  40. Grijalva-Contreras, R.L.; Macías-Duarte, R.; Martínez-Díaz, G.; Robles-Contreras, F.; de Jesús Valenzuela-Ruiz, M.; Nuñez-Ramírez, F. Effect of Regulated Deficit Irrigation on Productivity, Quality and Water Use in Olive cv “Manzanilla”. Am. J. Plant Sci. 2013, 4, 109–113. [Google Scholar] [CrossRef] [Green Version]
  41. Kaya, U.; Öztürk, F.G.; Çamoğlu, G.; Akkuzu, E.; Aşik, S.; Köseoğlu, O. Effect of deficit irrigation regimes on yield and fruit quality of olive trees (cv. memecik) on the aegean coast of turkey. Irrig. Drain 2017, 66, 820–827. [Google Scholar] [CrossRef]
  42. Vita, F.; Liotta, M.; Parera, C. Effects of irrigation deficit on table grape cv. Superior Seedless production. Acta Hortic. 2004, 646, 183–186. [Google Scholar] [CrossRef]
  43. Permanhani, M.; Miguel Costa, J.; Conceicao, M.A.; de Souza, R.T.; Vasconcellos, M.A.; Chave, M.M. Deficit irrigation in table grape: Eco-physiological basisand potential use to save water and improve quality. Theor. Exp. Plant Physiol. 2016, 28, 85–108. [Google Scholar] [CrossRef] [Green Version]
  44. Zhou, H.M.; Zhang, F.C.; Kjelgren, R.; Wu, L.F.; Gong, D.Z.; Zhao, N.; Yin, D.X.; Xiang, Y.Z.; Li, Z.J. Peach yield and fruit quality is maintained under mild deficit irrigation in semi-arid China. J. Integr. Agric. 2017, 16, 1173–1183. [Google Scholar] [CrossRef]
  45. Zúñiga-Espinoza, C.; Aspillaga, C.; Ferreyra, R.; Selles, G. Response of Table Grape to Irrigation Water in the Aconcagua Valley, Chile. Agronomy 2015, 5, 405–417. [Google Scholar] [CrossRef] [Green Version]
  46. Pérez-Pérez, J.G.; Romero, P.; Navarro, J.M.; Botia, P. Response of sweet orange cv ‘Lane late’ to deficit-irrigation strategy in two rootstocks. II: Flowering, fruit growth, yield and fruit quality. Irrig. Sci. 2008, 26, 519–529. [Google Scholar] [CrossRef]
  47. Wahbi, S.; Wakrim, R.; Aganchich, B.; Tahi, H.; Serraj, R. Effects of partial rootzone drying (PRD) on adult olive tree (Olea europaea) in field conditions under arid climate: I. Physiological and agronomic responses. Agric. Ecosyst. Environ. 2005, 106, 289–301. [Google Scholar] [CrossRef]
  48. Molden, D.A. Water-productivity framework for understanding and action. In Water Productivity in Agriculture: Limits and Opportunities for Improvement; Kijne, J.W., Barker, R., Molden, D., Eds.; International Water Management Institute: Colombo, Sri Lanka, 2013; pp. 1–18. [Google Scholar]
  49. Pereira, L.S.; Cordery, I.; Iacovides, I. Improved indicators of water use performance and productivity for sustainable water conservation and saving. Agric. Water Manag. 2012, 108, 39–51. [Google Scholar] [CrossRef]
  50. Nagaz, K.; El Mokh, F.; Ben Hassen, N.; Masmoudi, M.M.; Ben Mechlia, N.; Baba Sy, M.O.; Belkheiri, O.; Ghiglieri, G. Impact of deficit irrigation on yield and fruit quality in orange trees (Citrus Sinensis l. Osbeck cv. Meski Maltaise) in southern Tunisia. Irrig. Drain. 2020, 69, 186–193. [Google Scholar] [CrossRef] [Green Version]
  51. Romero, P.; Botia, P.; Garcia, F. Effects of regulated deficit irrigation under subsurface drip irrigation conditions on vegetative development and yield of mature almond trees. Plant Soil 2004, 260, 169–181. [Google Scholar] [CrossRef]
  52. Nagaz, K.; Masmoudi, M.M.; Ben Mechlia, N. Field studies on the use of saline water for deficit irrigation in arid Tunisia. In Irrigation Management, Technologies and Environmental Impact; Hossain Ali, M., Ed.; Nova Science Publishers Inc: Hauppauge, NY, USA, 2013; pp. 87–128. [Google Scholar]
Figure 1. Experiment layout.
Atmosphere 12 00864 g001
Figure 2. Soil water depletion (SWD, mm) in orange trees for the 4 irrigation treatments in 2013 and 2014. The irrigation treatments consisted of providing 100% ETc (FI), 75% ETc (DI75), 50% ETc (DI50), and grower’s irrigation program (FM); ETc was estimated by the FAO-56 method; and DOY is the day of year. Blue horizontal line represents the RAW level.
Atmosphere 12 00864 g002
Figure 3. Soil water depletion (SWD, mm) in table olive trees for the 4 irrigation treatments in 2013 and 2014. The irrigation treatments consisted of providing 100% ETc (FI), 75% ETc (DI75), 50% ETc (DI50), and grower’s irrigation program (FM); ETc was estimated by the FAO-56 method; and DOY is the day of year. Blue horizontal line represents the RAW level.
Atmosphere 12 00864 g003
Figure 4. Values of soil salinity (ECe, dS/m) before (initial) and at the end of the irrigation season of orange, table olive, and grapevine in 2013 and 2014 for full (FI), deficit (I75, DI50), and grower’s (FM) irrigation methods.
Atmosphere 12 00864 g004aAtmosphere 12 00864 g004b
Figure 5. Yields of orange, olive, and grapevine under the irrigation treatment and a year of production for full (FI), deficit (DI75, DI50), and grower’s (FM) irrigation methods. LSD is the least significant difference between treatments.
Atmosphere 12 00864 g005
Figure 6. Irrigation water productivity (IWP, kg/m3) of orange, table olive, and grapevine as related to water supply by irrigation under the applied irrigation strategies in 2013 and 2014. Full irrigation supplying 100% ETc (FI), deficit irrigation supplying 75% ETc (DI75) and 50% ETc (DI50), and traditional farmer’s irrigation method (FM). ETc was estimated by the FAO-56 method.
Atmosphere 12 00864 g006aAtmosphere 12 00864 g006b
Table 1. Orange fruit yield and quality parameters under irrigation strategies for the study periods 2013 and 2014.
ParametersFruit Weight (g/fruit)TSS (°Brix)Juice (%)
Year201320142013201420132014
FI29829510.611.664.765.8
DI7523519011.812.766.767.8
DI5017716612.613.464.365.1
FM26226111.212.266.167.2
LSD (5%)50.98841.7070.7670.7773.7702.979
FI—full irrigation supplying 100% ETc, DI75 and DI50—deficit irrigation supplying 75% and 50% ETc, and FM—traditional farmer’s irrigation method. ETc was estimated by the FAO-56 method. LSD—the least significant difference between treatments at p ≤ 0.05. TSS—total soluble solids content.
Table 2. Olive fruit yield and quality under irrigation strategies for the study periods 2013 and 2014.
ParametersFruit Weight (g)Fruit Size (mm)
Year2013201420132014
FI5.496.0118.5019.93
DI755.055.5218.3019.40
DI504.084.5916.5016.98
FM4.514.9317.1018.10
LSD (5%)0.4110.6351.2341.507
Table 3. Grape fruit yield and quality under irrigation strategies for the study periods 2013 and 2014.
ParametersBerry Weight (g)TSS (°Brix)
Year2013201420132014
FI9.39.7219.620.7
DI759.039.3920.821.6
DI508.338.5221.622.7
FM9.129.4620.220.7
LSD (5%)0.4280.3790.8011.012
Table 4. Net return (1000 USD·ha−1) of orange, table olive, and grape productions under different strategies. Values represent averages of 2013 and 2014.
TreatmentsOrangeTable OliveGrapevine
FI6.631.803.21
DI753.941.402.79
DI501.820.602.41
FM4.340.842.90
Publisher’s Note: MDPI stays neutral with regard to jurisdictional claims in published maps and institutional affiliations.

