Article

Which Is More Sensitive to Water Stress for Irrigation Scheduling during the Maturation Stage: Grapevine Photosynthesis or Berry Size?

1
School of Geography and Planning, Sun Yat-sen University, Guangzhou 510275, China
2
School of Civil Engineering, Sun Yat-sen University (Zhuhai Campus), Tangjiawan, Zhuhai 519082, China
3
Guangdong Engineering Technology Research Center of Water Security Regulation and Control for Southern China, Sun Yat-sen University, Guangzhou 510275, China
4
Guangdong Provincial Key Laboratory for Marine Civil Engineering, Sun Yat-sen University (Zhuhai Campus), Tangjiawan, Zhuhai 519082, China
5
Faculty of Agriculture and Life Science, Hirosaki University, 3 Bunkyo, Hirosaki, Aomori 0368561, Japan
6
School of Environment and Energy, Peking University, Shenzhen 518055, China
*
Author to whom correspondence should be addressed.
Atmosphere 2021, 12(7), 845; https://doi.org/10.3390/atmos12070845
Submission received: 10 June 2021 / Revised: 23 June 2021 / Accepted: 25 June 2021 / Published: 29 June 2021
(This article belongs to the Special Issue Agricultural Microclimate and Irrigation Water Management)

Abstract

:
To better understand the sensitivity of berry size and grapevine photosynthesis to water stress, and determine the soil water potential (ψ) threshold for scheduling irrigation during the maturation stage, we simultaneously measured berry size with photographs, leaf net photosynthesis with a portable meter, and ψ with tensiometers during the drying cycles for grapevines (Vitis vinifera L.). Our results showed that in berry development stage III (maturation), photosynthesis was more sensitive to water stress than berry size. When ψ decreased beyond −13.2 ± 0.82 kPa, photosynthesis, stomatal conductance, transpiration, and extrinsic (AN/E) and intrinsic (AN/gs) water use efficiency (WUE) decreased rapidly and did not recover thereafter. In contrast, the berry size remained close to unaffected by the decreasing ψ until it reached a value of −16.2 ± 0.77 kPa and, thereafter, the berry shrank significantly. In conclusion, we suggest that during the maturation stage of grapevines, for the potted mixture used in our experiments, irrigation should be triggered when the ψ reaches a value of −13.2 ± 0.82 kPa. Further, ψ should be kept lower than −6.9 ± 0.15 kPa after irrigation, because the highest values of intrinsic WUE (AN/gs) occurred when ψ decreased from −6.9 ± 0.15 to −14.6 ± 0.7 kPa. In arid areas, the threshold ψ should be considered as −16.2 ± 0.77 kPa during maturation to achieve high-efficiency use of water resources and sustainable production of grapevines.

1. Introduction

Because of increasing population and global warming, water, as a resource, is under stress [1], and it is a limited resource in arid lands [2,3]. Irrigation water represents more than 70% of the available water resources [4]. Grapevine is an essential crop planted in semi-arid and arid lands. The problem of water scarcity is going to be further aggravated by climate change, which is also likely to affect the quality of grapes/wine and, ultimately, the overall economics and sustainability of grape production [5,6]. Therefore, establishing the minimum amount of irrigation water, while maximizing the quantity and quality of the harvested grape, is a long-term objective of an irrigation scheme, which is essential to sustain grape production and the wine industry.
Understanding how plant physiological parameters respond to water stress will contribute to determining the irrigation threshold for improving water use efficiency (WUE). The term WUE is usually used to represent the biomass production (kg of biomass produced or moles of CO2 assimilated) per unit water cost (m3 of water used or moles of water transpired) [7]. The concept of intrinsic WUE (WUEi) represents the amount of net carbon assimilation per unit of stomatal conductance (gs) in leaf, while extrinsic WUE (WUEe) represents the amount of net carbon assimilation per unit of transpiration rate (E) [8].
The effects of different irrigation methods on grapevine growth and WUE have been studied [9,10,11,12]. Applying water at high soil water potential (ψ) value would result in wasteful use [13]. A moderate or slight water deficit was helpful for berry development in grapevines, and yet severe water-stress decreased the production of assimilates, transpiration (E) and stomatal conductance (gs), yield, shoot growth, and quality of fruit [9,14,15,16]. The water-saving potential of water-use-efficient irrigation and deficit irrigation in fruit crops needs to be studied further [17]. The evapotranspiration (ET) rates of plants and vineyard water requirements (VWR) vary across the crop stages and for a whole generalized growing season [18,19]. Therefore, it is important to establish the critical timing for starting irrigation, especially in arid areas where drought represents a serious threat to the sustainability of agriculture [7,20,21].
Although the commercialization of plant-based sensing is limited by technical limitations, plant-based measurement is more suitable for plant function and irrigation needs than soil-based measurement [22]. Plant parameters are essential to establish a plant-based sensing system, and examples with different fruit trees have shown water savings along with high yields and quality of the harvested products [23]. Ton et al. and Carr [24,25] gave examples of fine-tuning irrigation management using physiological indices. Many of these studies used a continuous measuring of the stem diameter [26,27] and/or fruit diameter [28,29] on test plants. Some of this research included the berry size of grapevines [30,31,32]. The viticultural practices and environmental conditions determine berry size, and the quality of the grapes and wines [33]. In the early periods of berry growth, berry and cane shrinkages occurred due to the water deficit in grapevines [34]. Therefore, it is safe to reduce water applications for most of the season, but immediately after flowering, any water stress should be avoided [35]. However, trunk size could reflect the water deficit in grapevines only in a short stage, before veraison [36].
Generally, the growth of the berry in grapevines is represented by a double sigmoidal shape with a steep enhancement in berry size early in the process (stage I), a slower lag stage (stage II), and a strong development from veraison (stage III), which then gradually decreases [37]. Stage III is the maturation stage, which includes the veraison and ripening stages. Imai et al. [36] showed that the grape-berry diameter shrank when ψ (the sensor section was set at a depth of 12 cm below the surface) decreased from −12.6 to −63.1 kPa during the maturation stage. They further reported that the daily variation in berry diameter might be a useful index to control soil moisture in grape production. However, the critical average ψ, beyond which the berry shrank the most during the maturation stage, was not established in their study because no other values of ψ between −12.6 kPa and −63.1 kPa were measured. Soil water potential is a soil property affecting a large variety of bio-physical processes, such as seed germination, plant growth, and plant nutrition. Gradients in soil water potential are the driving forces of water movement, affecting water infiltration, redistribution, percolation, evaporation, and plants’ transpiration [38]. The relationships between soil water potential, leaf water potential, and stomatal conductance are highly correlated [13]. Water potential (WP) is usually used as an indicator of plant water status and irrigation timing [39,40].
Cifre et al. [41] reported that stomatal conductance (gs), sap flow, and trunk growth variations could be used as indicators of water stress for grapevines. Our previous studies have indicated that during stage I of grape berry development, berry size was a more sensitive indicator of water stress than E and photosynthesis, and that the average ψ threshold for scheduling irrigation was about −5.4 kPa [42]. However, an unanswered question was: in stage III of berry development, which is more sensitive to water stress, photosynthesis or berry size?
We hypothesized that the sensitivity of photosynthesis and berry size to water stress could be identified and that an average ψ threshold could be determined by simultaneously measuring variations in berry diameter and some plant parameters of grapevines, which experienced increasing soil moisture stress during the maturation stage. It is, however, a requirement that the diameter measurement of the berry size is made with precision no less than 0.2 mm because the changes due to water stress are rather small. Hence, a new photogrammetry-system with 0.2 mm measurement precision was applied to measure the size of berries.
As a non-contact and non-destructive technique [43], the digital image method can be used for yield estimation, quality evaluation, disease detection, and grape phenology [44,45]. A system equipped with automated photogrammetry was developed by Moritani et al. [46] to measure soil erosion. The system could be adapted and applied to measure berry size with three major advantages: high precision, automation of monitoring berry size, and nondestructive measurement (Figure 1).
In this study, our objectives were to provide a detailed understanding of the sensitivity of berry size and photosynthesis to water stress, and to determine the critical average ψ for when to start irrigation of grapevines by examining instantaneous variations in net photosynthesis (AN), gs, berry diameter, and ψ, as the water deficit developed in the soil during the maturation stage.

2. Materials and Methods

2.1. Plant and Soil Materials

In February 2018, 2-year-old “Pione” grapevines (Vitis vinifera L., cv. V. labrasca) were transplanted into 34-L pots in a greenhouse that could be ventilated. Every pot (39 cm surface diameter, a smaller bottom size, 32 cm depth) contained 28 kg of a mixture of lime, humic allophone soil, peat moss, and sandy soil (sieved through a 2-mm sieve) in a volumetric ratio of: 1:200; 600:1200, respectively. The mixture was put on a 2 cm thick layer of microvesicular pumice to allow free drainage. The top of the pot was 5 cm higher than the soil surface, so the soil depth was 25 cm. The roots of the vine were influenced by the water availability from 5 to 25 cm depth. The soil mixture had a pH of 6.2. The pots were irrigated with drip irrigation. The irrigation amounts for March, April, May, June, July, and August were: 2.9, 3.8, 5.4, 7.2, 9.0 and 10.2 mm/d, respectively. Liquid fertilizer containing various important nutrients [47] was provided once per week.
To promote uniform vegetative development, vines were pruned to hold back 12 nodes per vine. Only two shoots per vine were retained and were trained horizontally. Shoots were trimmed two times between the bloom and the veraison period of the berries. Lateral shoots were cut back to the first node. At flowering, one cluster was retained on each shoot. Each cluster was thinned to hold only 200–250 florets and once berry-set occurred, further trimming and thinning of berry was conducted to hold only 40–50 berries per cluster.

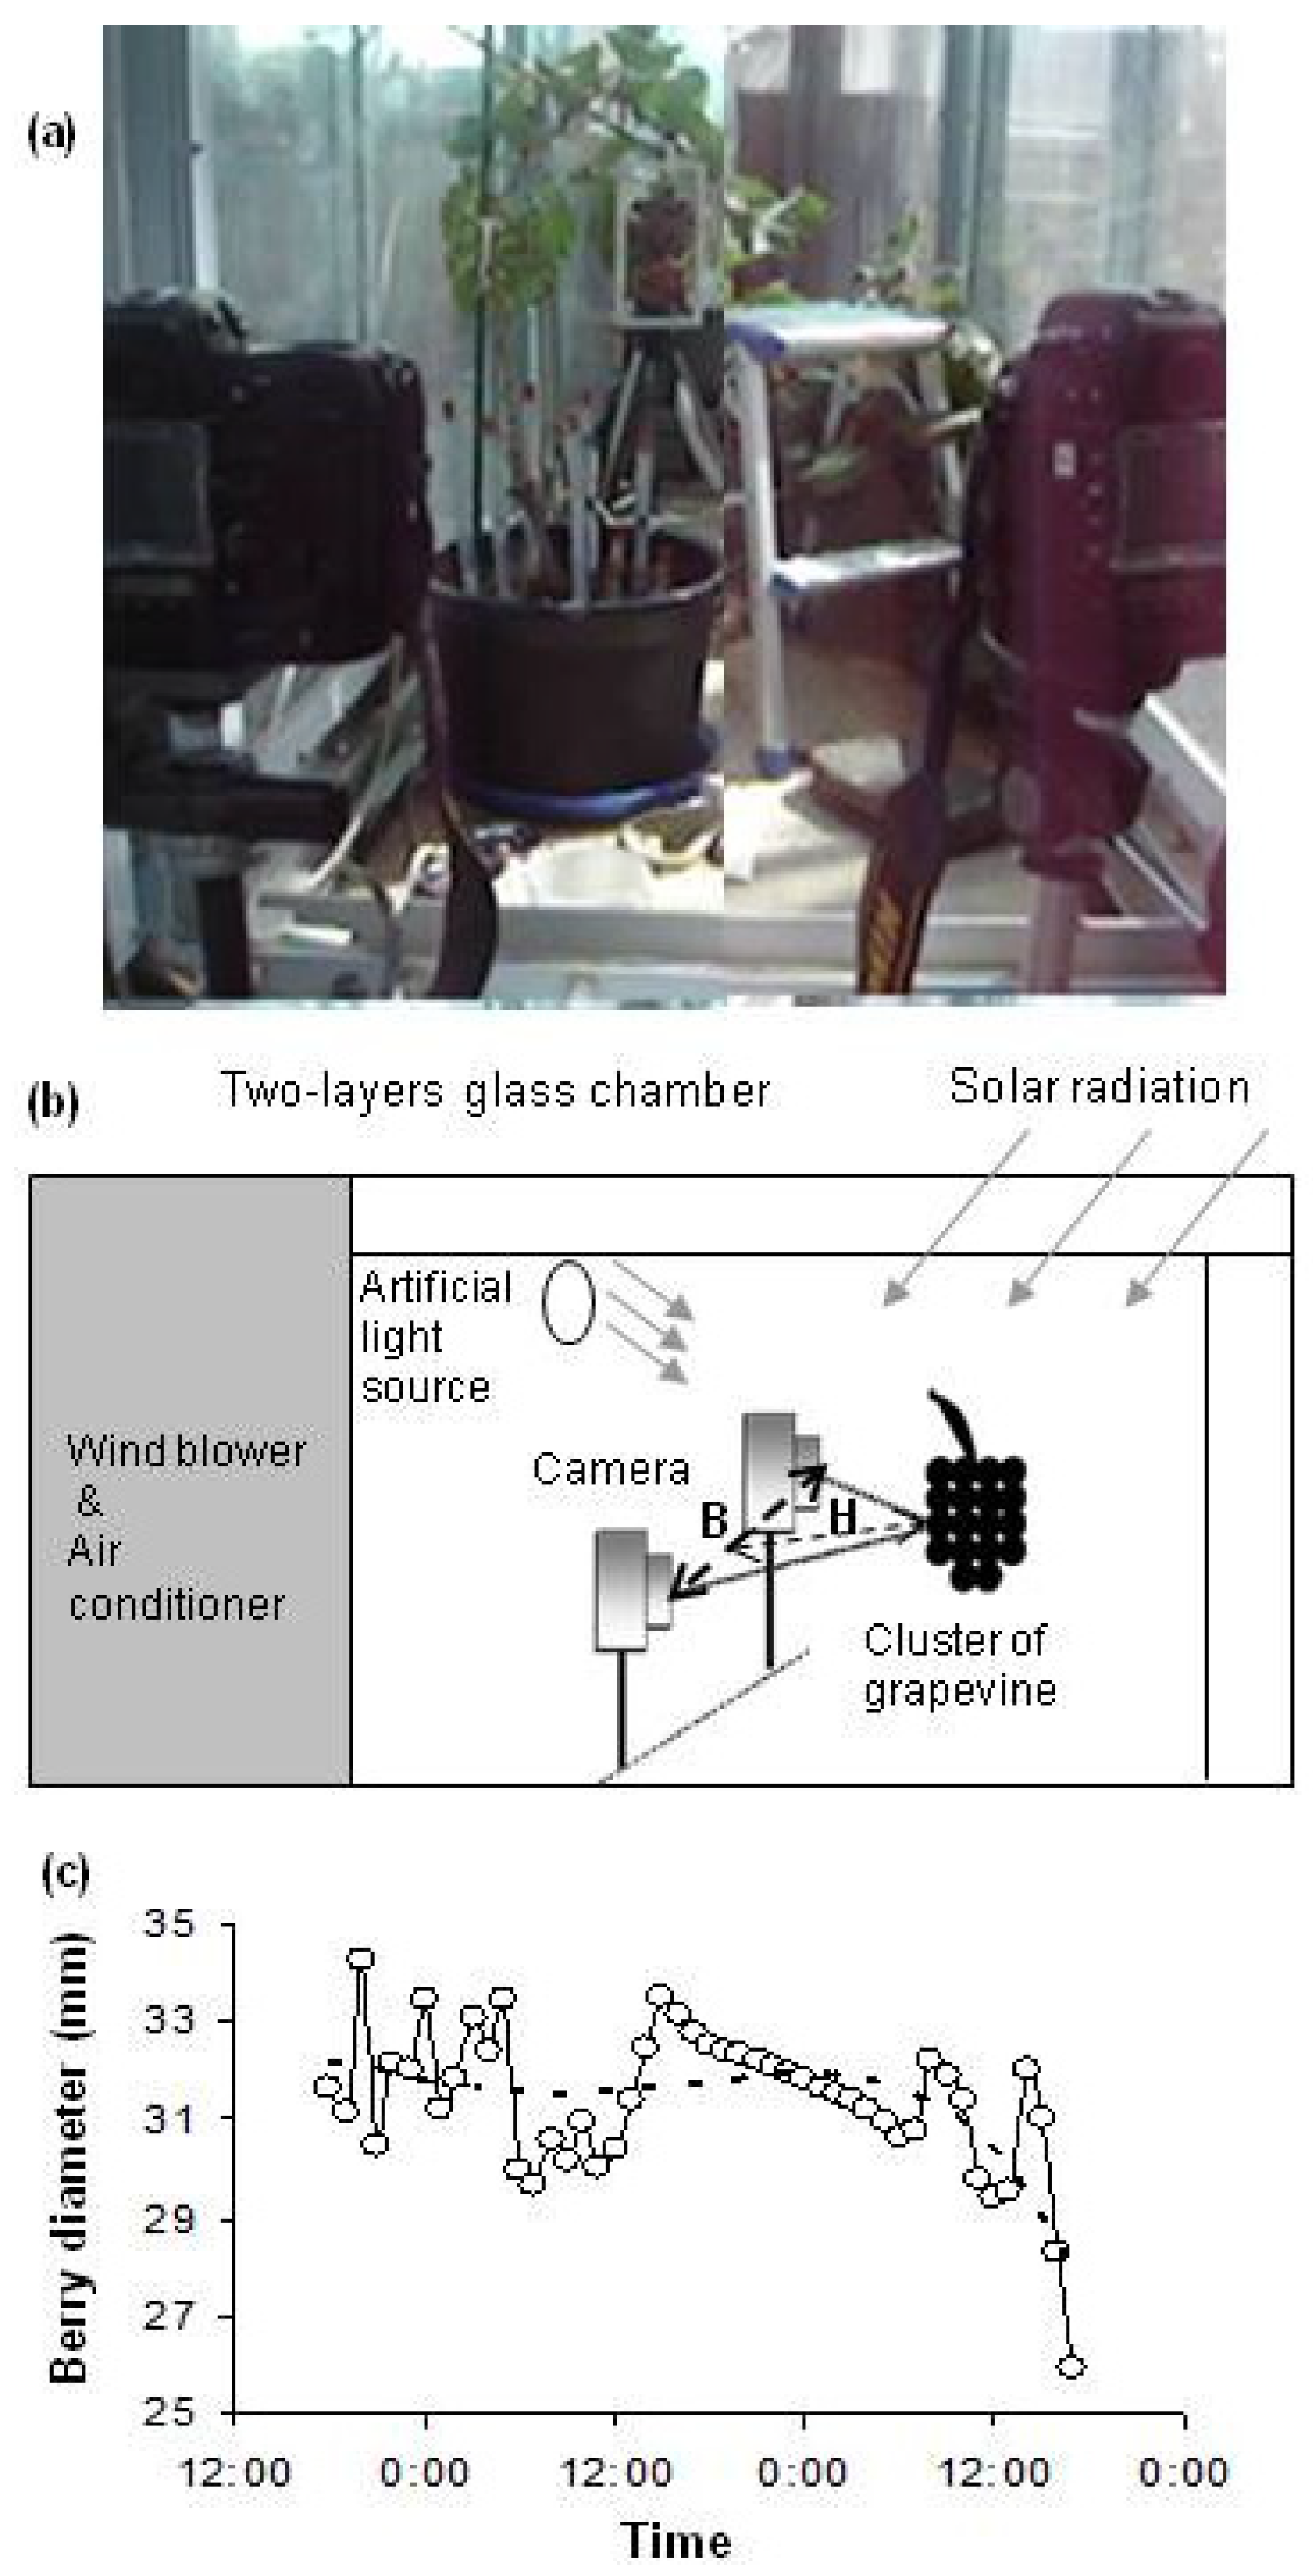
2.2. Experimental Design

In August 2008 (88 days after flowering), when the berries were in the maturation stage, a pot containing the grapevine was placed in a wind tunnel with a two-layer glass chamber (schematically illustrated in Figure 1a,b) in a glass dome building of the Arid Land Research Center, Tottori University, Tottori (35°15′ N, 133°47′ E), Japan. Natural solar radiation could pass through the glass dome. An artificial light source was set 0.5 m higher than the top of the grapevine to supply sufficient radiation energy. The diurnal artificial luminous intensity, relative humidity, and air flow of the environment-controlled chamber were set at 3000 µmol m−2 s−1, 50% and 0.3 m s−1, respectively. The temperature was set to 12/12 h (day/night) cycles of 35/20 °C.
After placing the potted grape plant in the wind tunnel, the pot was irrigated to saturation. No irrigation was applied until the end of this experiment; thus, the grapevine experienced drying, represented by a decreasing value of ψ. Soil water potential was measured every two hours using a pressure transducer system [48], which contained twelve tensiometers in the pot: six at a depth of 0.10 m and another six at a depth of 0.20 m from the surface. The tensiometers were calibrated under constant pressure heads of 0, −20, −40, −60, and −80 cm, according to the calibrating process reported by Azooz and Arshad [49]. The calibration equation of each system was used to convert the output recordings (mV) to kPa.
Berry size was measured every hour by a new photogrammetry system that consisted of two high precision digital cameras (Nikon) connected to a computer rendering a three-dimensional image, with 0.2 mm measurement precision. The photogrammetry precision was determined by measuring scales attached to the berries and comparing between actual and photogrammetry values. As the precision is influenced by the base ratio, the scales were photographed in 11 different positions, ranging from a distance H of 2.4 to 4.8 m, and with a base length B (between the two cameras) from 0.3 to 1 m (Figure 1). Because the highest precision with 0.2 mm was obtained when the base ratio (B/H) was 0.37, the positions of cameras and the object were kept with that base ratio (0.37) during the measurement.
An analytical frame, with scale, was fixed on the grapevine, outside a grape cluster. A pair of marked berries and two cameras were placed as shown in Figure 1a. Pictures were taken using a pair of digital cameras and, subsequently, collected on a computer. The resolution of CCD (δccd) and focal length (ƒc) of the cameras were 0.0094 mm and 50 mm, respectively. The inner orientation factors of the digital camera were provided by Moritani et al. [46]. The gradient and relative orientation of the pair pictures were trimmed to minimize parallax in order to obtain a rectified photograph. Through the elimination of longitudinal parallax, the y-coordinate of a point in the left rectified image was the same as that in the right one. The same point in the paired graphs could be found easily by scrolling the point along the x-axis direction.
Simultaneously with ψ measurements, photosynthesis, stomatal conductance, transpiration, sub-stomatal CO2 concentration (Ci), and leaf temperature of two spur leaves of the grapevine were measured every two hours (from 7:00 to 23:00) per day, using a portable photosynthesis system (LI-6400, Li-Cor Inc., Lincoln, NE, USA). Measurements were taken on 2 cm × 3 cm leaf portions, in the middle part of a leaf blade, confined in the leaf chamber of the system. The measurements were repeated three times on each primary and lateral leaf (the leaf on lateral shoot).

2.3. Time Series Analysis of Berry Diameter Data

Because the berry size showed diurnal fluctuations, it was essential to remove the periodic variations using time series analysis [50]. Size fluctuations were due to water movement in tissues inducing a daily cycle of shrinkage (from the beginning of the day) and swelling (from the mid-afternoon) [51]. Periodic variations of the berry diameter were filtered by the quartic polynomial trend line, and the main secular growth trend part was obtained. Thereafter, we determined the relationship between ψ (at 0.1 m depth) and the tendency part of berry diameter.
The method of establishing the trend line of the time series of berry diameter is given in Figure 1c. The trend line in this figure could help us to remove short-term variations in the time series of the berry diameter. The trend values of the berry diameter in berry development stage III were computed as:
yi = 32.267 − 0.0546 xi − 0.0032 xi2 + 0.0003 xi3 − 0.000006 xi4, r2 = 0.41, n = 48.
where xi is the berry diameter measurement time (ith hour), yi is the trend value of the berry diameter (mm) at the ith hour, and n is the total hours of measurement in this figure.

2.4. Statistical Analysis

Values of ψ, photosynthesis, gs, and transpiration for each replicate were averaged for daily variation of these parameters before the mean and the standard error were calculated.

3. Results and Discussion

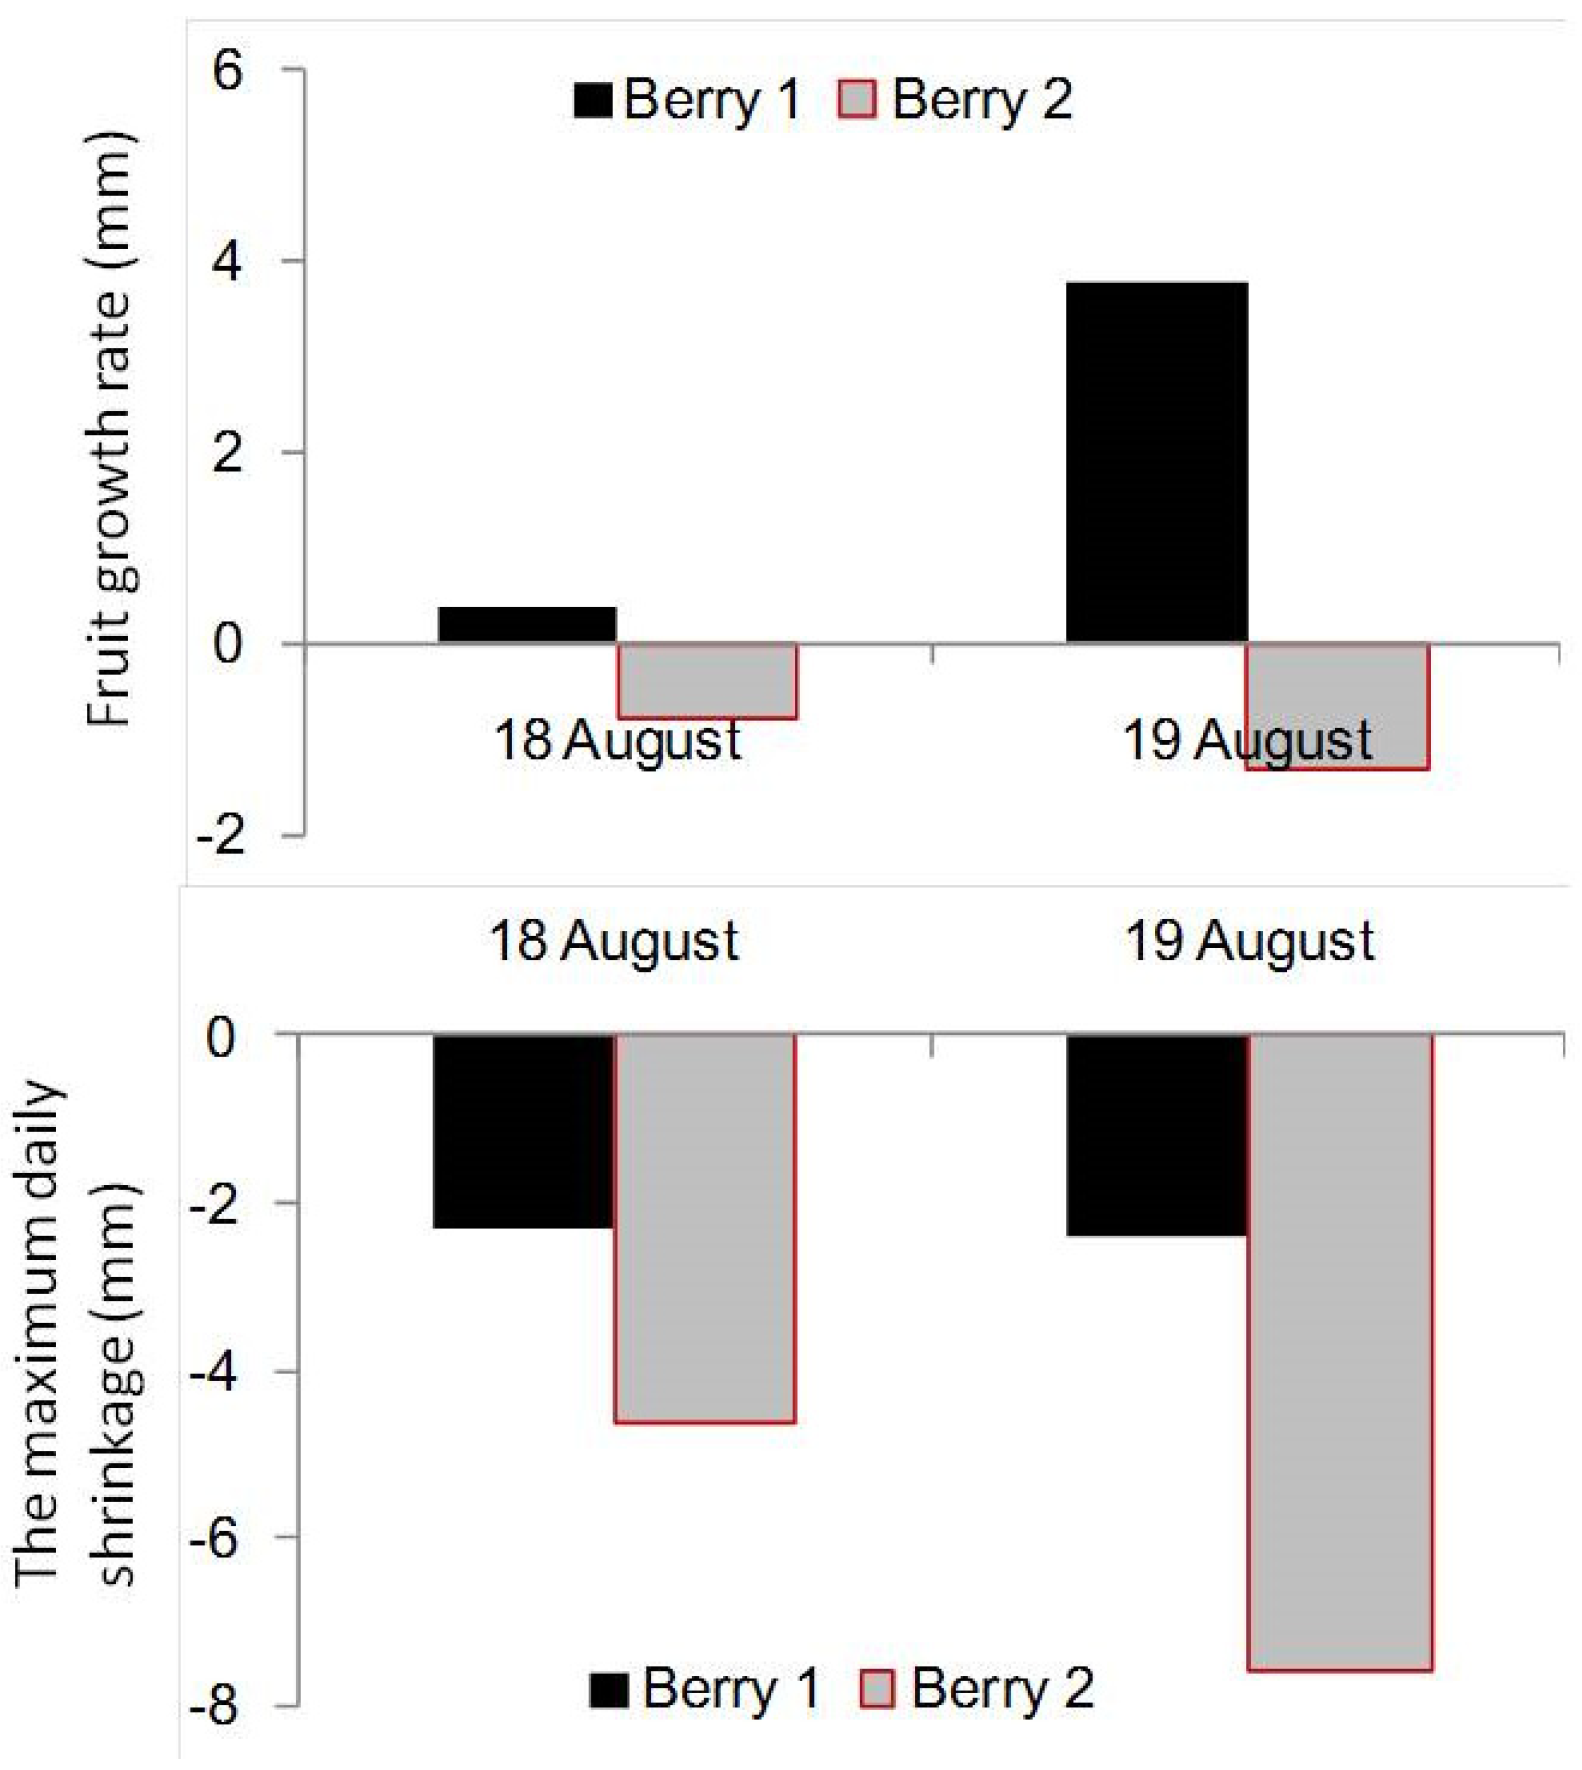
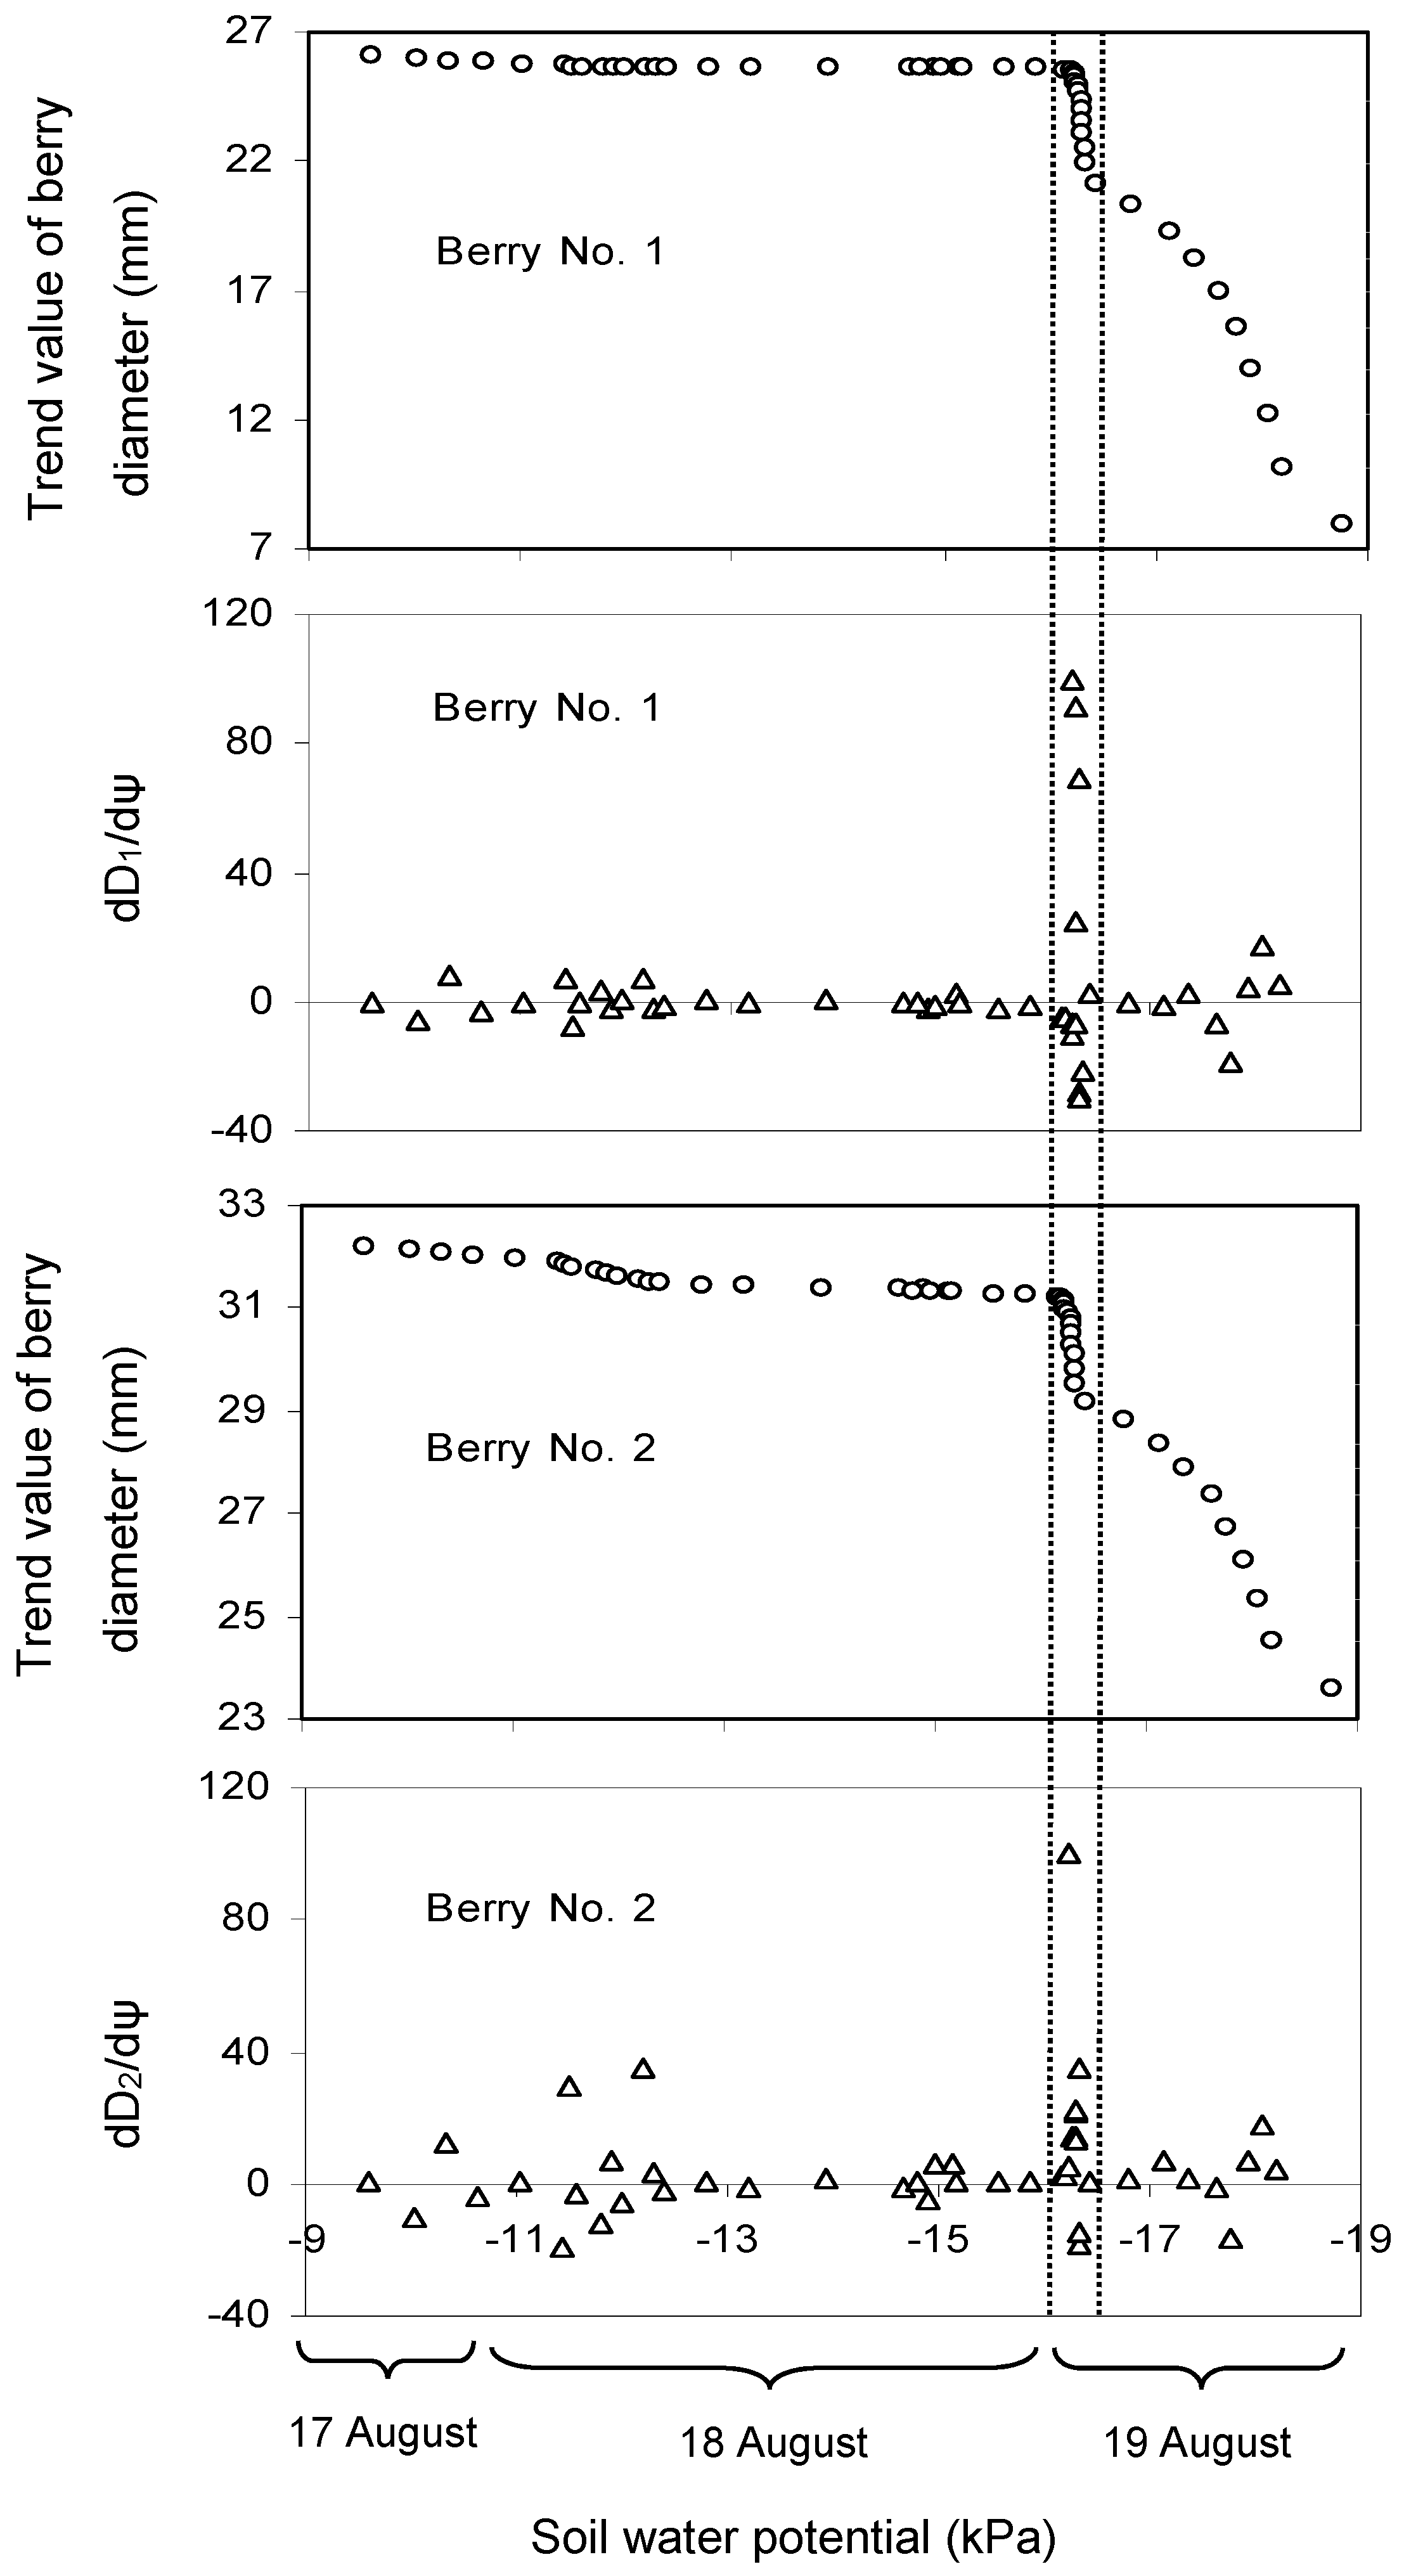
3.1. Effect of Soil Water Potential (ψ) on the Trend Value of Berry Diameter

Table 1 shows the average values and standard deviation (SD) of soil water potential (ψ) at 0.1 m depth. In the last few days, the maximum daily shrinkage was higher than the fruit growth rate (Figure 2), which indicated that water stress prevented berry growth. Keller et al. [52] indicated that grape berry size decreased during a soil dry-down period. Meggio et al. [53] also reported that the berry diameter for water stress treatment was lower than that for well-watered conditions. The diurnal fluctuations in berry diameter time series data in berry development Stage III were removed by time series analysis, and the relation between the trend value of berry size and the average ψ at 0.1 m soil depth is given in Figure 3. The x-axes scale of ψ is from −7.14 ± 0.18 kPa (9:00, 17 August) to −20.39 ± 1.04 kPa (19:00, 19 August). The berry contracted very slowly when the average ψ at 0.1 m depth decreased from −9.6 ± 0.44 kPa to −16.2 ± 0.77 kPa. However, when ψ decreased beyond −16.2 ± 0.77 kPa, the berry shrank rapidly. Therefore, for the potted mixture used in our experiments, irrigation should start no later than when ψ = −16.2 ± 0.77 kPa in berry development Stage III. The result needs to be further evaluated for other soil types.
Imai et al. [34] only tested two levels of ψ using physiologically based irrigation tools, so they could not point out the critical ψ, after which the berry would begin contraction. In the current study, instantaneous variations in ψ and berry size were measured continuously, so it was possible to find the potential ψ for scheduling irrigation.

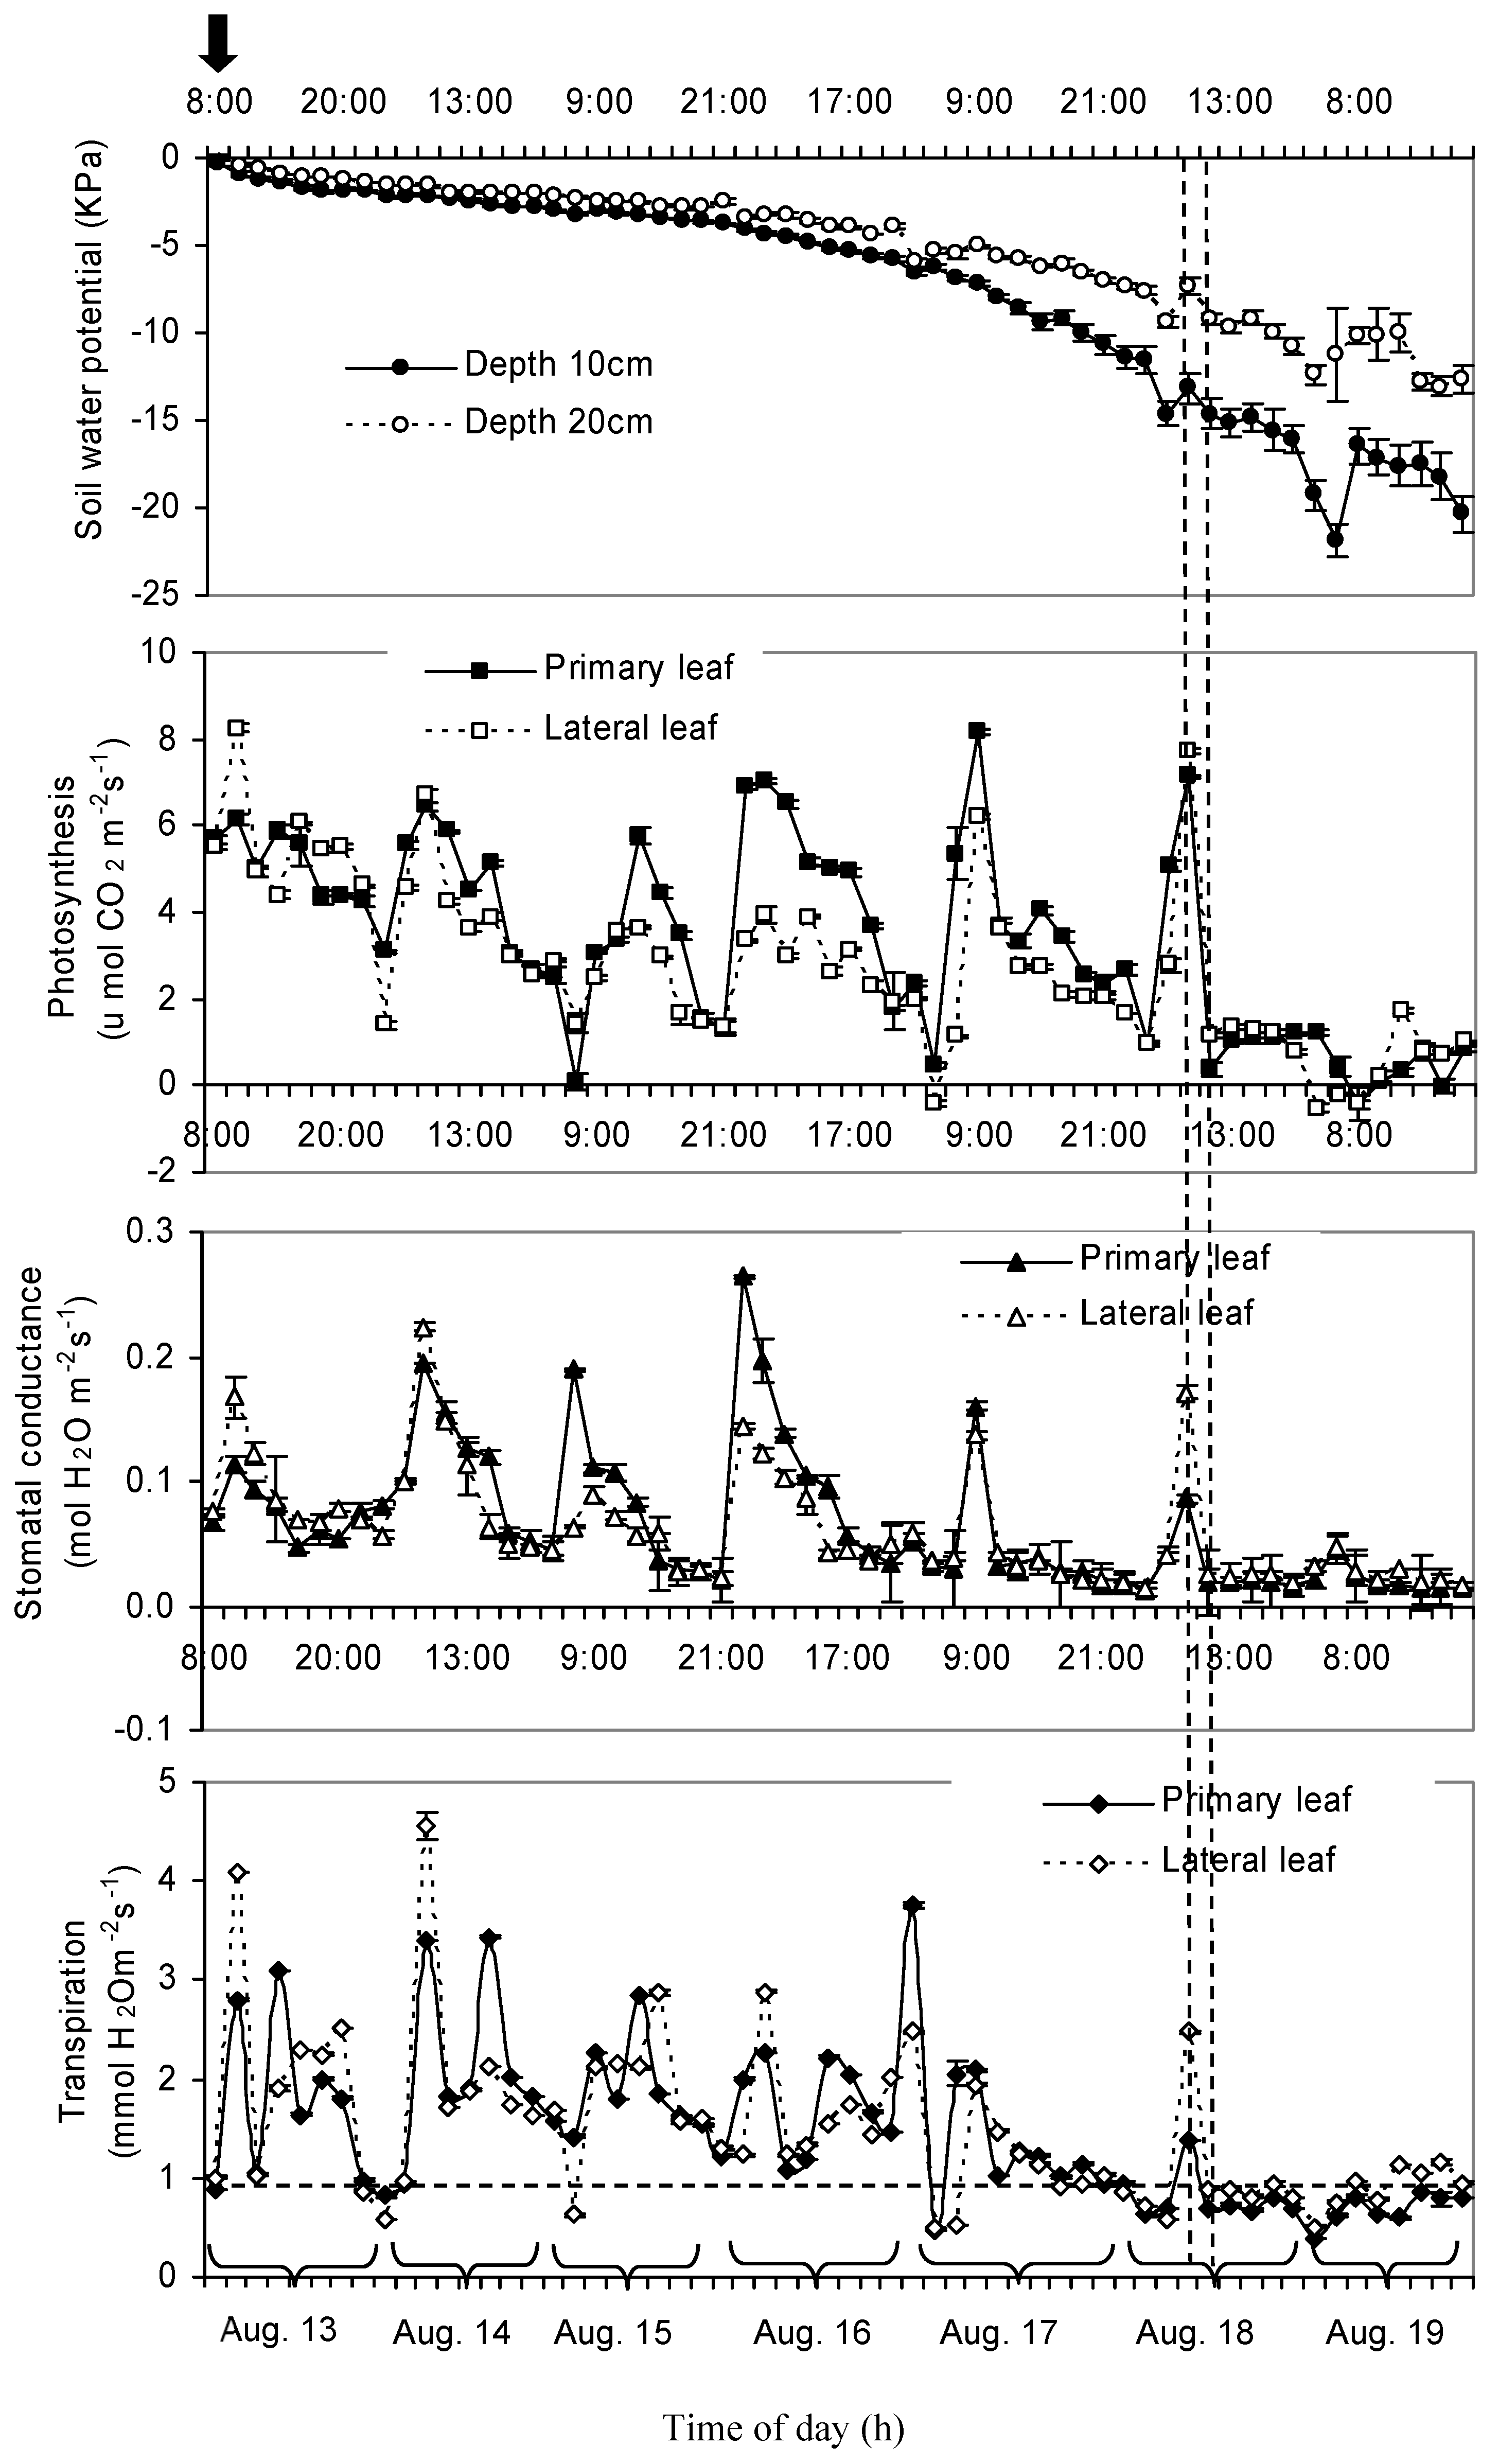
3.2. Daily Variation of Soil Water Potential, Stomatal Conductance, Net Photosynthesis, and Transpiration

After irrigation in the morning of 13 August 2008, the ψ decreased slowly in the first several days (Figure 4), but decreased at a faster rate when the ψ reached −6.2 ± 0.37 kPa at 0.1 m depth. The trends for the change in ψ at both the 0.2 and 0.1 m depth were similar, although ψ at 0.2 m depth was higher than that at 0.1 m depth due to the evaporation of water from the soil surface.
In the first five days, the highest values of AN and gs occurred during the daytime and the lowest values occurred during the night (Figure 4). Before ψ decreased to −13.2 ± 0.82 kPa, photosynthesis, gs, and E fluctuated in a normal range, that is, they could recover to a high value. However, when ψ decreased from −13.2 ± 0.82 kPa to −14.7 ± 0.84 kPa, AN decreased from 7.1 to 0.38 µmol CO2 m−2 s−1 for the primary leaves (the leaves on the primary shoot). In addition, in the following 33 h, AN fluctuated in a low-value range. The measured AN, gs, and E for the primary and lateral leaves showed a similar trend.
It is interesting to note that a decrease in ψ, up to −16.2 ± 0.77 kPa, had no significant effect on the berry size (Figure 3), while AN, gs, and E started to decline as the ψ decreased beyond −13.2 ± 0.82 kPa (Figure 4). In addition, AN, gs, and E did not recover to the previous high values (Figure 4). Photosynthesis did not significantly decrease when the soil matric potential decrease beyond −16.2 ± 0.77 kPa, since photosynthesis has already decreased significantly, when the soil matric potential decrease beyond −14.7 ± 0.76 kPa. Therefore, AN, gs, and E were more sensitive to moisture stress than berry size during the maturation stage (stage III). The lag phenomenon of berry size to water stress could be related to the fact that in the maturation stage, the berry enlargement may correspond to the berry growth, which is due mainly to the photosynthates accumulation and transformation (from leaf to fruit), and the berry growth is probably not caused directly by the swelling of fresh pulp that depends on the water status. Therefore, photosynthesis parameters (AN, gs, and E) are better indicators of the soil moisture stress than berry size during the maturation stage of the grapevine. Zsόfi et al. [54] also concluded that gs was a reliable tool for determining the degree of water stress. Goldhamer et al. [55] reported that AN was more sensitive to water deficit than fruit volume in peach trees. Boini et al. [56] indicated that although the fruit daily growth rate was not related to midday stem water potential as tightly as leaf gas exchanges at 10 weeks after full bloom in apple, it represented a promising physiological indicator to be implemented in a decision support system for irrigation scheduling. In berry development stage 1, berry size was more sensitive for moisture stress than AN, which could be related to the fact that water deficits during stage 1 of fruit growth reduced berry size by reducing cell division [42].

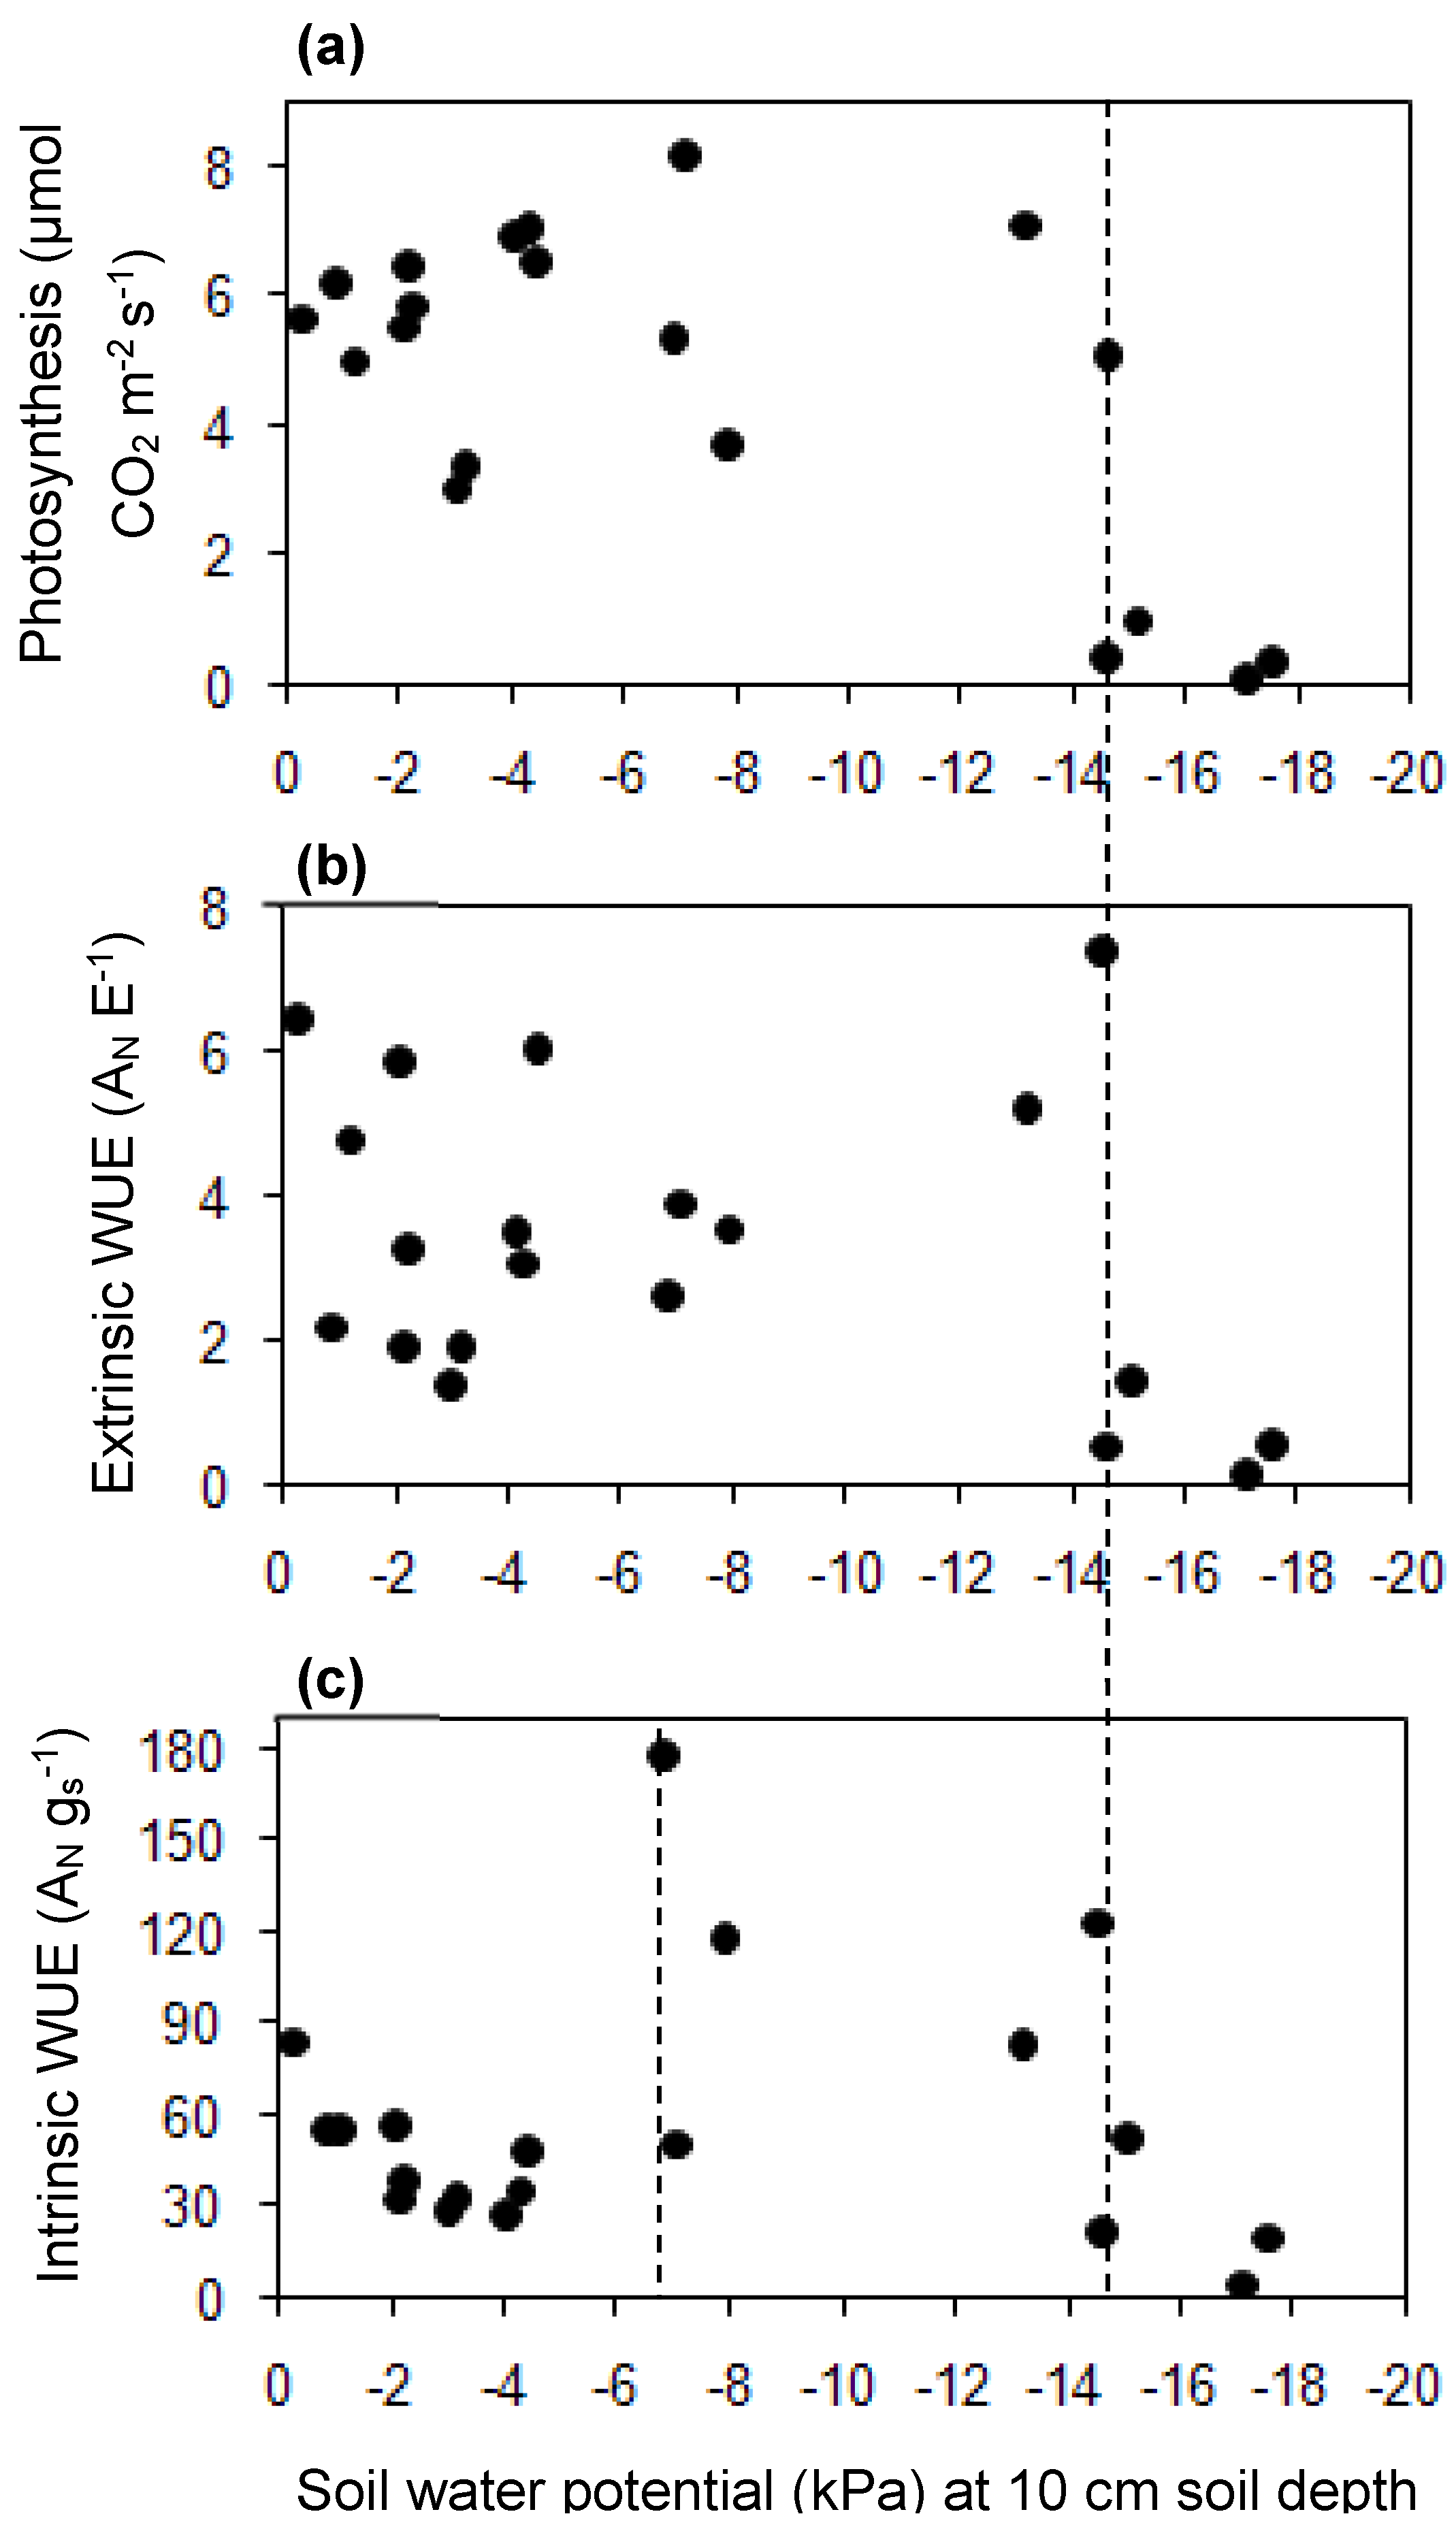
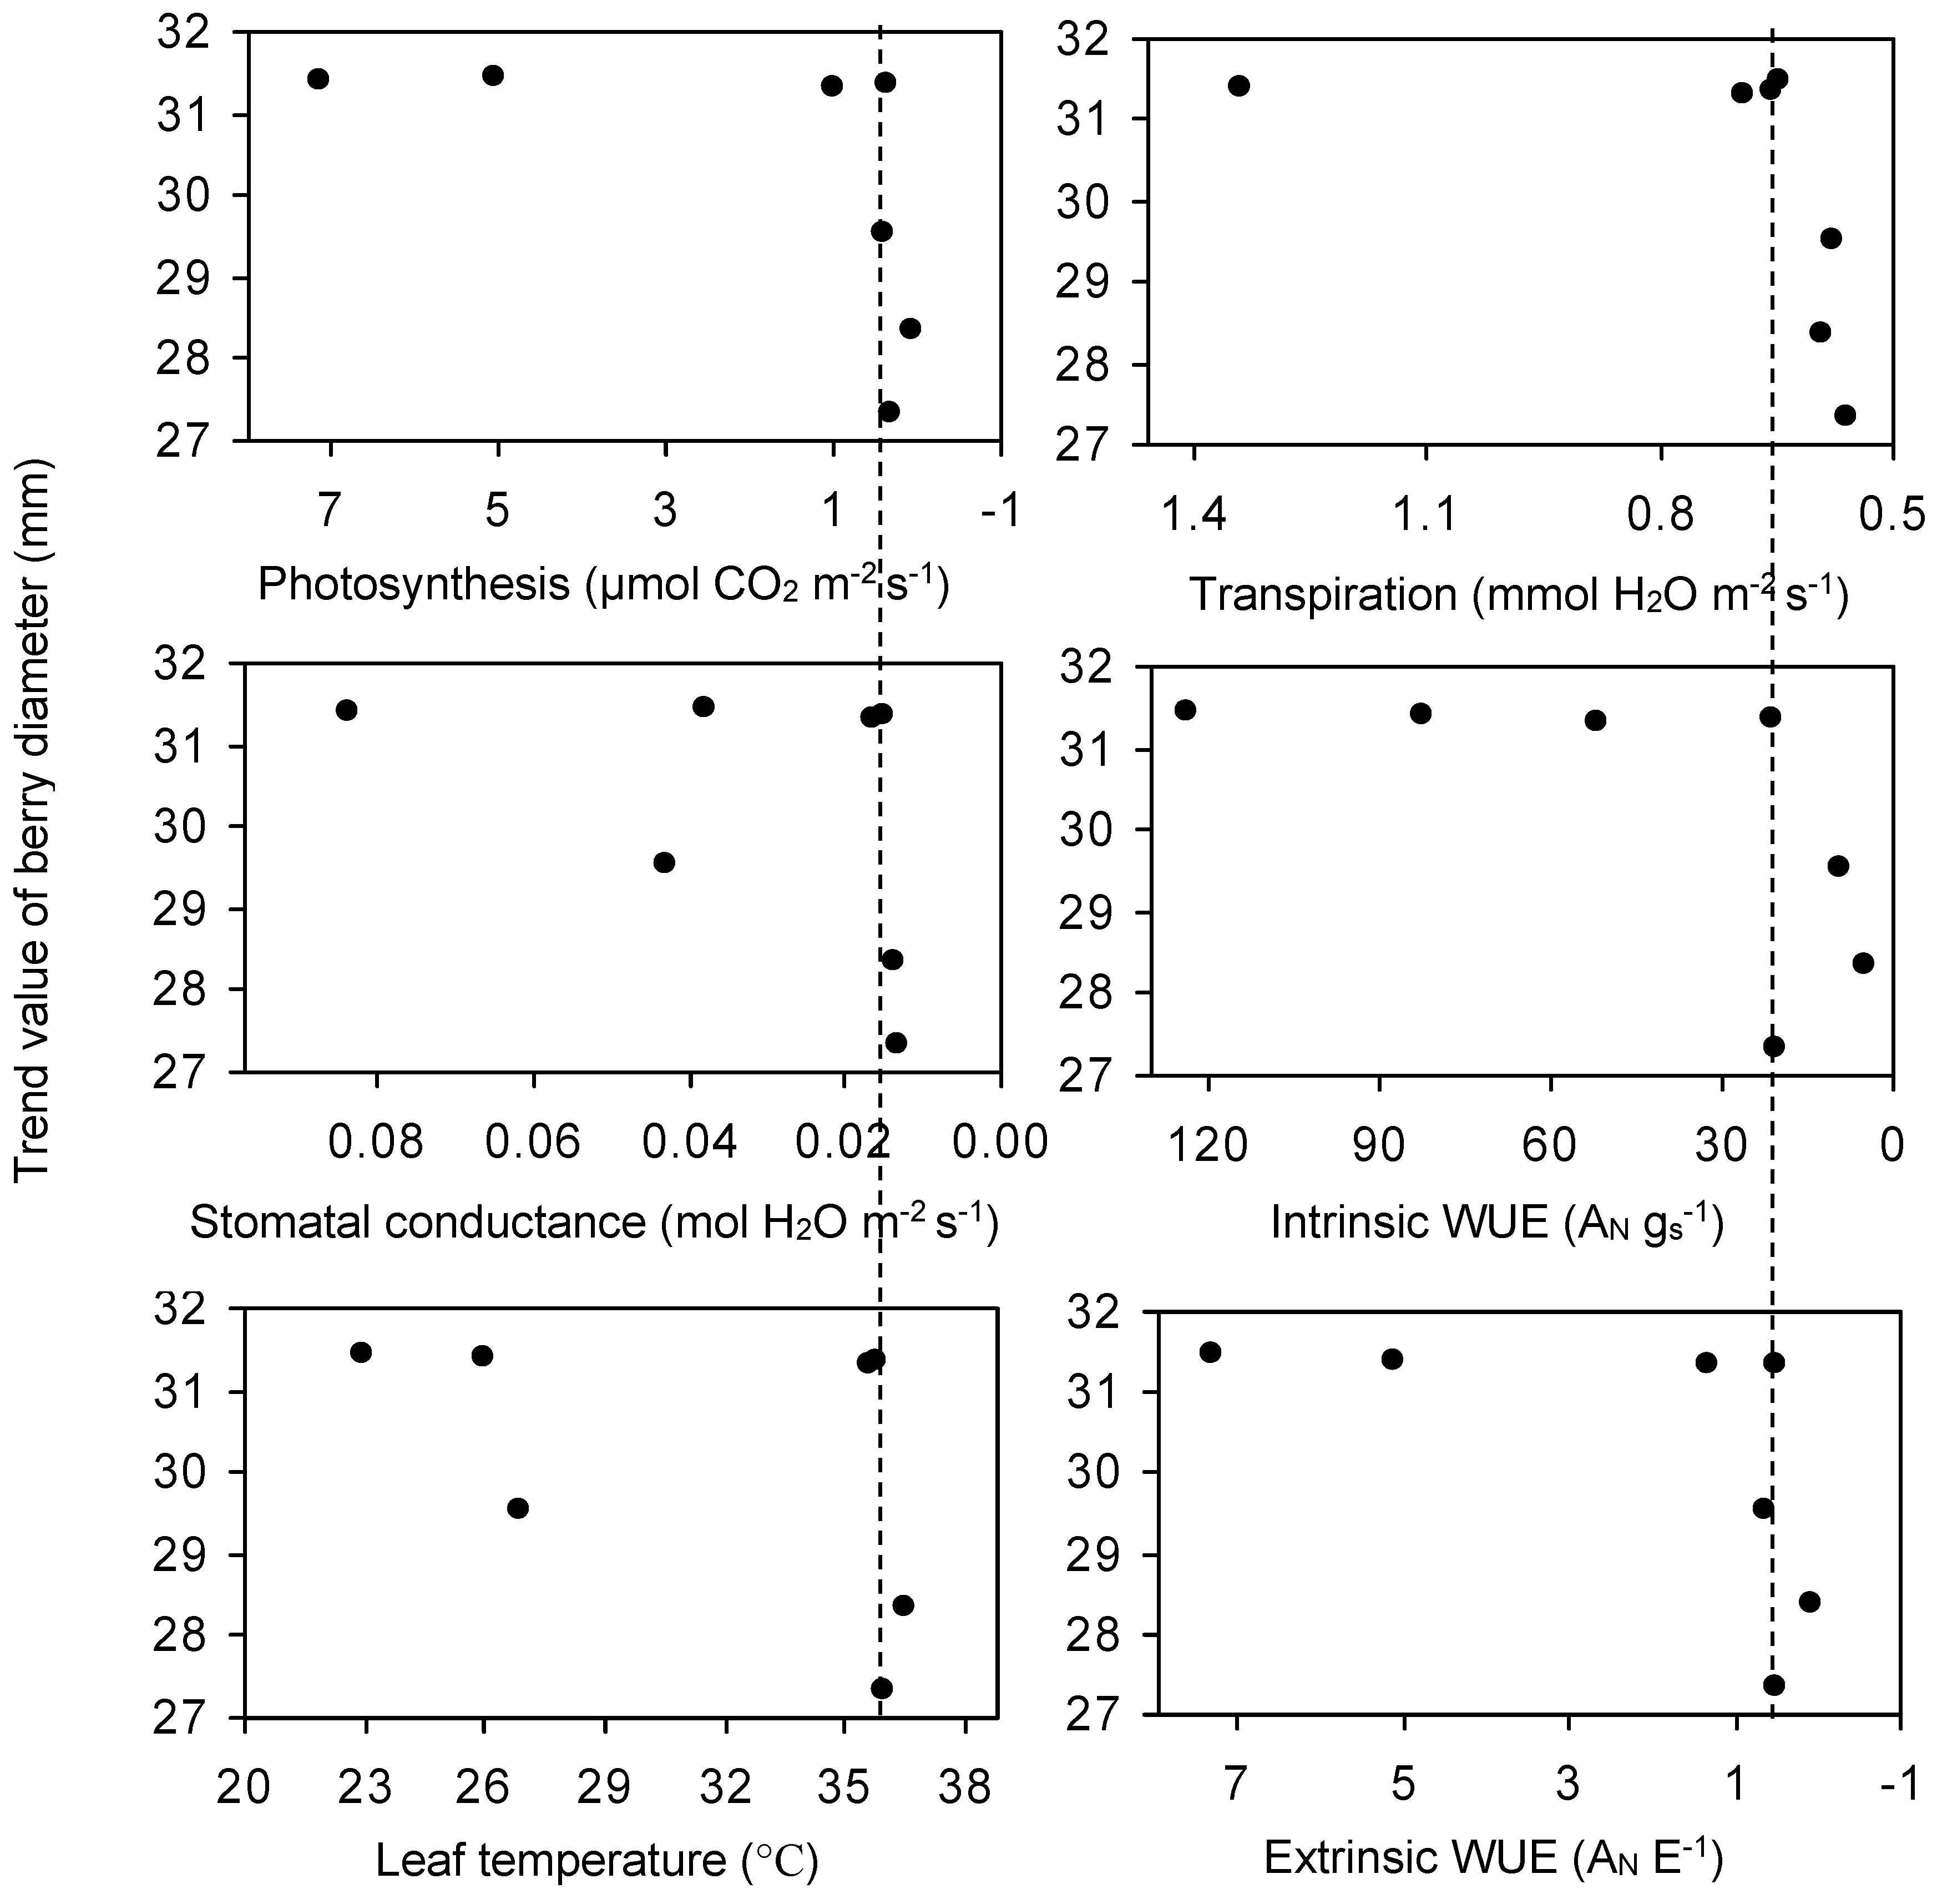
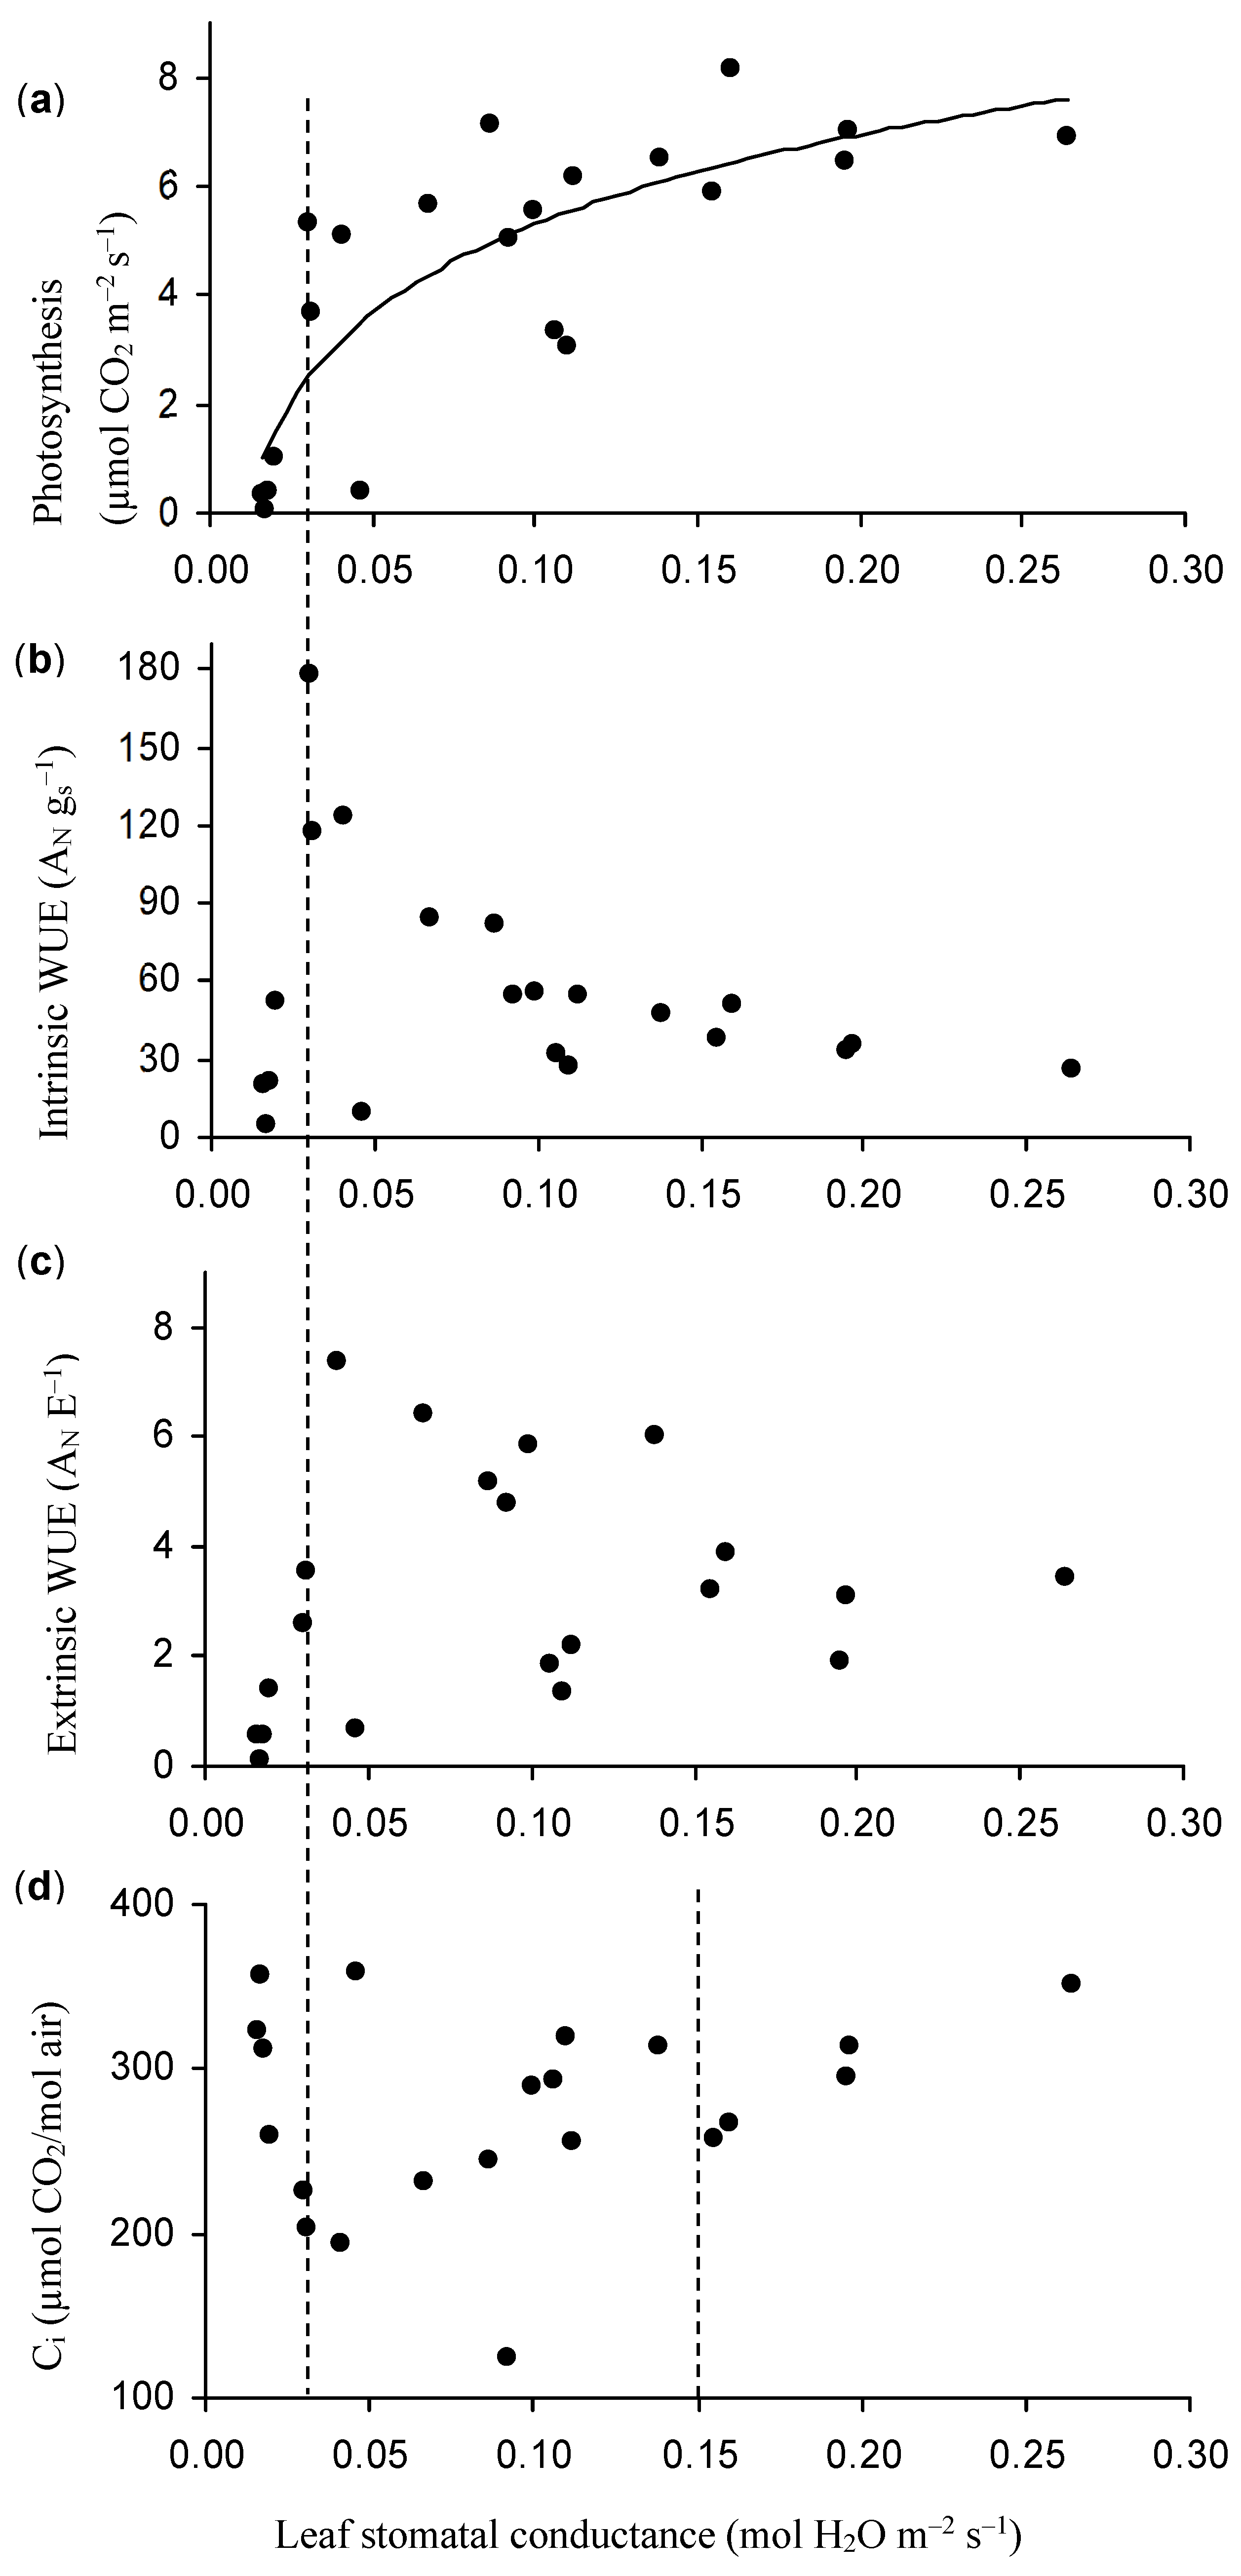
3.3. The Relationship among ψ, Berry Diameter, Leaf Photosynthesis, Stomatal Conductance, and Water Use

When the average ψ decreased from −6.9 ± 0.15 to −14.6 ± 0.7 kPa, the highest values of intrinsic WUE (AN/gs) (µmol CO2 mol H2O−1) of the primary leaf of grapevine (in the morning) occurred (Figure 5c). Compared with extrinsic WUE (AN/E), intrinsic WUE (AN/gs) is considered to be more realistic and comparable among studies, as it is not influenced by changes in air VPD (vapor pressure deficit) in the leaf chamber. Before ψ decreased to −14.6 ± 0.7 kPa, photosynthesis (in the morning) fluctuated in a range of 3.06 to 8.16 µmol CO2 m−2 s−1 for primary leaf (Figure 5a). When the average ψ decreased beyond −14.6 ± 0.7 kPa, photosynthesis decreased from 5.1 to 0.38 µmol CO2 m−2 s−1 for the primary leaf, and furthermore, the photosynthesis, extrinsic WUE (mmol CO2 mol H2O−1) and intrinsic WUE (n = 3) of the primary leaf of grapevine (in the morning) decreased rapidly and could not recover to the previous high value (Figure 5a–c). When the average ψ reached −17.1 kPa, photosynthesis, and the extrinsic and intrinsic WUE, became near zero. Cifre et al. [41] also reported that photosynthesis and intrinsic WUE decreased steeply in the phase of severe water stress. Resco et al. [57] reported that excess water stress even constrained photosynthetic recovery after re-watering. Photosynthesis, transpiration, gs, and intrinsic and extrinsic WUE had only slight effects on berry growth when they were relatively high, whereas the berry contracted steeply when these values were too low, during which the average ψ reached −14.7 kPa (Figure 4 and Figure 6). Therefore, it is necessary to determine a degree of soil water stress that would enhance the productivity of irrigation water [58]. Hence, the establishment of critical average ψ (when to irrigate) becomes important.
The relationship between the leaf physiological parameters and berry growth of grapevine is shown in Figure 6. When leaf transpiration (in the morning) decreased from 1.38 to 0.69 mmol H2O m−2 s−1, the trend value of berry diameter did not decrease significantly and was maintained at a value > 31 mm. However, the trend value of berry diameter decreased fast (<30 mm) when transpiration decreased beyond 0.69 mmol H2O m−2 s−1 (Figure 6). The relationships among berry diameter and photosynthesis, gs, leaf temperature, and intrinsic and extrinsic WUE of the primary leaves of the grapevine also showed a similar trend. When leaf temperature was too high, or photosynthesis, transpiration, gs, intrinsic and extrinsic WUE were too low, the berry contracted as expected (Figure 6). In future experiments, we would place the potted plant over a digital balance and measure the whole grape water use.
Photosynthesis decreased with gs (Figure 7a) and their relation could be illustrated as: y = 2.36 Ln(x) + 10.8, r2 = 0.66, where y is photosynthesis, and x is the gs value of the primary leaf of grapevine in August. The drought-induced, curvilinear correlation between gs and photosynthesis (Figure 7a) is consistent with Koundouras et al. [59]. A significant decrease occurred in photosynthesis (Figure 7a) when gs (in the morning) decreased from 0.03 to 0.02 mol H2O m−2 s−1, during which the average ψ reached −14.7 kPa (Figure 4).
When gs (in the morning) decreased from 0.26 to 0.03 (or 0.04) mol H2O m−2 s−1, the intrinsic and extrinsic WUE increased (Figure 7b,c). Thereafter, a significant decrease occurred in the intrinsic and extrinsic WUE (Figure 7b,c) when gs (in the morning) decreased from 0.03 to 0.02 mol H2O m−2 s−1, during which the average ψ reached −14.7 kPa (Figure 4). When gs decreased to 0.017 mol H2O m−2 s−1, photosynthesis, and intrinsic and extrinsic WUE became almost zero (Figure 7a–c). The sub-stomatal CO2 concentration (Ci) decreased with decreasing gs (in the morning) in the ranges of 0.26 and 0.03 mol H2O m−2 s−1; however, it increased steeply when gs decreased beyond 0.03 mol H2O m−2s−1 (Figure 7d).

3.4. Suggestions for Irrigation Scheduling during the Maturation Stage of Grapevines

Based on Figure 7, three phases of grape leaf photosynthesis response could be differentiated along a water stress gradient:
(1) A phase of severe water stress occurred when gs was < 0.03 mol H2O m−2 s−1. During this stress phase, photosynthesis, intrinsic WUE (AN gs−1), and extrinsic WUE decreased rapidly with decreasing gs (Figure 7a–c), whereas Ci increased steeply (Figure 7d), which indicated that non-stomatal limitations to photosynthesis became dominant. A similar response was found by Cifre et al. [41] who reported that non-stomatal limitations to photosynthesis become dominant when gs < 0.05 mol H2O m−2 s−1. This value is a little higher than our data, which could be related to different grapevine cultivars. When gs < 0.05 mol H2O m−2 s−1, a general decline in the activity and number of photosynthetic enzymes was observed [60] and photosynthesis did not recover after irrigation [61], indicating that non-stomatal inhibition (metabolic and/or restricted internal CO2 diffusion) occurred. In addition, our data showed that when gs decreased beyond 0.03 mol H2O m−2 s−1 (corresponding to an average ψ −14.7 kPa, as shown in Figure 4), transpiration decreased rapidly. The curvilinear relationship between gs and photosynthesis (Figure 7a) implies a more sensitive response of photosynthesis to water limitation compared to gs, at the last stage of soil drying, leading to a decrease in intrinsic WUE (Figure 7b), i.e., a decline of carbon assimilation in relation to water supply.
(2) A phase of moderate water stress was defined for a decreasing range of gs from 0.15 to 0.03 mol H2O m−2 s−1. In this phase, photosynthesis and Ci decreased with decreasing gs (Figure 7a,d), while extrinsic and intrinsic WUE mainly increased (Figure 7b,c). Cifre et al. [41] showed a similar phenomenon for intermediate gs values (0.15 > gs > 0.05 mol H2O m−2 s−1). Zsόfi et al. [54] reported that the improved wine quality of the grapevine was due to moderate water stress, which induced a higher concentration of anthocyanins and phenolics in the berries. During this phase, the activity of photosynthetic enzymes, such as Rubisco, is mostly unaffected [60]. Therefore, in this phase, stomatal limitations seem dominant and photosynthesis is rapidly reversed upon re-watering [62], but non-stomatal limitations are already developing [41].
(3) A mild water stress phase is characterized by relatively high values of gs (>0.15 H2O m−2 s−1). During this phase, photosynthesis decreased slightly with decreasing gs, which resulted in small increases in intrinsic and extrinsic WUE (Figure 7a–c). A decline in Ci also occurred (Figure 7d). These results are consistent with those of Flexas et al. [63]. At this stage, stomatal closure is probably the only limitation to photosynthesis [41].
During phase II and phase III, when, for instance, gs was higher than 0.03 mol H2O m−2 s−1, and the average ψ was larger than −14.7 kPa, the curvilinear relationship between gs and photosynthesis (Figure 7a) implied a less sensitive response of photosynthesis to water limitation compared to gs at these stages of soil drying, leading to an increase in intrinsic WUE (Figure 7b), i.e., a near optimization of carbon assimilation in relation to water supply [59].
Based on our results, the following suggestions were made for appropriate irrigation during the maturation stage of grapevines under different water resource availability scenarios. In semi-arid areas, where water availability is low or moderate, the critical average soil water potential for scheduling irrigation should be −13.2 ± 0.82 kPa (corresponding to gs = 0.09 mol H2O m−2 s−1) for the potted mixture used in our experiments, because photosynthesis, gs, transpiration, and extrinsic and intrinsic WUE decreased steeply in the phase of severe water stress (when ψ decreased beyond this value). Furthermore, this will permit a more substantial water saving than irrigation scheduled at a higher ψ. After irrigation, ψ should be kept lower than −6.9 ± 0.15 kPa because the highest values of intrinsic WUE occurred when the average ψ decreased from −6.9 ± 0.15 to −14.6 ± 0.7 kPa. A higher intrinsic WUE agreed with a higher biomass production for grapevines [64]. Some farmers would like to obtain high quantities of berries, specifically farmers who cultivate grapevines for table grapes sold by weight.
In arid areas, irrigation water is precious and should be used even more economically. For the potted mixture used in our experiments, the critical point for scheduling irrigation should be approximately, and on average, ψ −16.2 ± 0.77 kPa (corresponding to a gs value of 0.02 mol H2O m−2 s−1), because the grape berry contracted in size steeply when the average ψ decreased beyond −16.2 ± 0.77 kPa. Although permitting the development of severe moisture stress, in this case, might affect the yield, the limitations of grape yield are a common practice (if not compulsory) for market standard wine production and premium wines [41].
The results obtained in the study, particularly for the ψ, only apply for the potted soil mixture. These results cannot be extrapolated to other soil types. This experiment only determines a trigger to irrigate. What about the amount of irrigation for application? How would this method be applied and used under field conditions? These are the next steps to be pursued.

4. Conclusions

Photosynthesis response was more sensitive to water stress than berry size during the maturation stage (stage III) of grapevines. Based on the results of our study, the following suggestions were made for appropriate irrigation during the maturation stage of grapevines. In semi-arid areas, for the potted mixture used in the experiments, the critical soil water potential for scheduling irrigation should be −13.2 ± 0.82 kPa (corresponding to gs = 0.09 mol H2O m−2 s−1). However, ψ should be kept lower than −6.9 ± 0.15 kPa after irrigation because the highest values of intrinsic WUE occurred when ψ decreased from −6.9 ± 0.15 to −14.6 ± 0.7 kPa. In hyper-arid and arid areas, the threshold ψ for scheduling irrigation should be considered as −16.2 ± 0.77 kPa (corresponding to a gs value of 0.02 mol H2O m−2 s−1) to achieve efficient use of water resources and fruit quality in grapevines during this important stage of economic yield development.

Author Contributions

Data curation, Q.Z. and S.M.; validation, Q.Z. and S.M.; software, S.M.; formal analysis, Q.Z., S.M. and X.W.; funding acquisition, X.C.; methodology, C.Y. and S.M.; investigation, Q.Z. and S.M.; supervision, X.C.; writing—original draft, Q.Z.; writing—review and editing, Y.C., Y.X., X.W. and C.Y. All authors have read and agreed to the published version of the manuscript.

Funding

The study was funded by the National Natural Science Foundation of China (U1911204, 51861125203 and 31270748).

Acknowledgments

We would like to acknowledge Joyce G. Webb for additional language checks and editorial advice.

Conflicts of Interest

The authors declare no conflict of interest.

References

  1. Vörösmarty, C.J.; McIntyre, P.B.; Gessner, M.O.; Dudgeon, D.; Prusevich, A.; Green, P.; Glidden, S.; Bunn, S.E.; Sullivan, C.A.; Liermann, C.R.; et al. Global threats to human water security and river biodiversity. Natrue 2010, 467, 555–561. [Google Scholar] [CrossRef]
  2. Zhang, Q.T.; Wang, S.P.; Li, L.; Inoue, M.; Xiang, J.; Qiu, G.Y.; Jin, W.B. Effects of mulching and sub-surface irrigation on vine growth, berry sugar content and water use of grapevines. Agric. Water Manag. 2014, 143, 1–8. [Google Scholar] [CrossRef]
  3. Yan, N.N.; Wu, B.F.; Zhu, W.W. Assessment of agricultural water productivity in arid China. Water 2020, 12, 1161. [Google Scholar] [CrossRef]
  4. Conesa, M.R.; Dodd, I.C.; Temnani, A.; De la Rosa, J.M.; Pérez-Pastor, A. Physiological response of post-veraison deficit irrigation strategies and growth patterns of table grapes (cv. Crimson Seedless). Agric. Water Manag. 2018, 208, 363–372. [Google Scholar] [CrossRef] [Green Version]
  5. Santos, T.P.; Lopes, C.M.; Rodrigues, M.L.; de Souza, C.R.; Ricardo-da-Silva, J.M.; Maroco, J.P.; Pereira, J.S.; Chaves, M.M. Effects of deficit irrigation strategies on cluster microclimate for improving fruit composition of Moscatel field-grown grapevines. Sci. Hortic. 2007, 112, 321–330. [Google Scholar] [CrossRef]
  6. Schultz, H.R.; Stoll, M. Some critical issues in environmental physiology of grapevines: Future challenges and current limitations. Aust. J. Grape Wine Res. 2010, 16, 4–24. [Google Scholar] [CrossRef]
  7. Tomás, M.; Medrano, H.; Escalona, J.M.; Martorell, S.; Pou, A.; Ribas-Carbó, M.; Flexas, J. Variability of water use efficiency in grapevines. Environ. Exp. Bot. 2014, 103, 148–157. [Google Scholar] [CrossRef]
  8. Zhao, X.H.; Kang, L.F.; Wang, Q.; Lin, C.; Liu, W.; Chen, W.L.; Sang, T.; Yan, J. Water use efficiency and stress tolerance of the potential energy crop miscanthus lutarioriparius grown on the loess plateau of China. Plants 2021, 10, 544. [Google Scholar] [CrossRef]
  9. Poni, S.; Bernizzoni, F.; Civardi, S.; Gatti, M.; Porro, D.; Camin, F. Performance and water use efficiency (single-leaf vs. whole-canopy) of well-watered and half-stressed split-root Lambrusco grapevines grown in Po Valley (Italy). Agric. Ecosyst. Environ. 2009, 129, 97–106. [Google Scholar] [CrossRef]
  10. Chaves, M.M.; Zarrouk, O.; Francisco, R.; Costa, J.M.; Santos, T.; Regalado, A.P.; Rodrigues, M.L.; Lopes, C.M. Grapevine under deficit irrigation: Hints from physiolo-gical and molecular data. Ann. Bot. 2010, 105, 661–676. [Google Scholar] [CrossRef] [Green Version]
  11. Tomás, M.; Medrano, H.; Pou, A.; Escalona, J.M.; Martorell, S.; Ribas-Carbó, M.; Flexas, J. Water use efficiency in grapevine cultivars grown under controlled conditions: Effects of water stress at the leaf and whole-plant level. Aust. J. Grape Wine Res. 2012, 18, 164–172. [Google Scholar] [CrossRef]
  12. Atroosh, K.B.; Mukred, A.W.O.; Moustafa, A.T. Water requirement of grape (Vitis vinifera) in the northern highlands of Yemen. J. Agric. Sci. 2013, 5. [Google Scholar] [CrossRef] [Green Version]
  13. Centeno, A.; Baeza, P.; Lissarrague, J.R. Relationship between soil and plant water status in wine grapes under various water deficit regimes. HortTechnology 2010, 20, 585–593. [Google Scholar] [CrossRef] [Green Version]
  14. Lovisolo, C.; Perrone, I.; Hartung, W.; Schubert, A. An abscisic acid-related reduced transpiration promotes gradual embolism repair when grapevines are rehydrated after drought. New Phytol. 2008, 180, 642–651. [Google Scholar] [CrossRef]
  15. Perrone, I.; Gambino, G.; Chitarra, W.; Vitali, M.; Pagliarani, C.; Riccomagno, N.; Balestrini, R.; Kaldenhoff, R.; Uehlein, N.; Gribaudo, I.; et al. The grapevine root-Specific Aquaporin VvPIP2; 4N controls root hydraulic conductance and leaf gas exchange under well-watered conditions but not under water stress. Plant Physiol. 2012, 160, 965–977. [Google Scholar] [CrossRef] [Green Version]
  16. Bassoi, L.H.; Correia, J.D.; dos Santos, A.R.L.; Silva, J.A.; Costa, B.R.S. Deficit Irrigation in grapevine cv. Syrah during two growing seasons in the brazilian semiarid. Eng. Agric. 2015, 35, 430–441. [Google Scholar] [CrossRef] [Green Version]
  17. Fereres, E.; Goldhamer, D.A.; Parsons, L.R. Irrigation water management of horticultural crops. Hortscience 2004, 38, 1036–1042. [Google Scholar] [CrossRef] [Green Version]
  18. Teixeira, A.H.D.; Sherer-Warren, M.; Hernandez, F.B.T.; Lopes, H.L. Water productivity assessment by using MODIS images and agrometeorological data in the Petrolina municipality, Brazil. Remote Sens. 2012, 8531. [Google Scholar] [CrossRef]
  19. Teixeira, A.H.D.; Hernandez, F.B.T.; Lopes, H.L. Up scaling table grape water requirements in the low-middle Sao Francisco river basin, Brazil. Acta. Hort. 2014, 1038, 655–662. [Google Scholar] [CrossRef]
  20. Konukcu, F.; Gowing, J.W.; Rose, D.A. Dry drainage: A sustainable solution to waterlogging and salinity problems in irrigation areas? Agric. Water Manag. 2006, 83, 1–12. [Google Scholar] [CrossRef]
  21. Romero, P.; Gil-Muñoz, R.; del Amor, F.M.; Valdés, E.; Fernández, J.I.; Martinez-Cutillas, A. Regulated deficit irrigation based upon optimum water status improves phenolic composition in Monastrell grapes and wines. Agric. Water Manag. 2013, 121, 85–101. [Google Scholar] [CrossRef]
  22. Jones, H.G. Irrigation scheduling: Advantages and pitfalls of plant-based methods. J. Exp. Bot. 2004, 55, 2427–2436. [Google Scholar] [CrossRef] [Green Version]
  23. Azorín, P.R.; García, J.G. The productive, economic, and social efficiency of vineyards using combined drought-tolerant rootstocks and efficient low water volume deficit irrigation techniques under mediterranean semiarid conditions. Sustainability 2020, 12, 1930. [Google Scholar] [CrossRef] [Green Version]
  24. Ton, Y.; Kopyt, M.; Zachs, I.; Ben-Ner, Z. Phytomonitoring technique for tuning irrigation of fruit trees. Acta. Hort. 2004, 646, 127–132. [Google Scholar] [CrossRef]
  25. Carr, M.K.V. The water relations and irrigation requirements of pineapple (Ananas comosus var. comosus): A review. Exp. Agric. 2011, 47, 27–51. [Google Scholar] [CrossRef]
  26. Goldhamer, D.A.; Fereres, E. Irrigation scheduling of almond trees with trunk diameter sensors. Irrig. Sci. 2004, 23, 11–19. [Google Scholar] [CrossRef]
  27. Fernández, J.E.; Cuevas, M.V. Irrigation scheduling from stem diameter variations: A review. Agric. For. Meteorol. 2010, 150, 135–151. [Google Scholar] [CrossRef]
  28. Avidan, A.; Hazan, A.; Kopyt, M.; Ton, Y.; Phytech, L. Application of the phytomonitoring technique for table grapes. In Proceedings of the International Workshop on Advances Ingrapevine and Wine Research, Venosa, Italy, 15–17 September 2005. [Google Scholar]
  29. Gratacos, E.; Gurovich, L. Phytomonitoring in kiwifruit orchards as a plant water status indicator and its use in irrigation scheduling. Cien. Inv. 2003, 30, 113–137. [Google Scholar] [CrossRef]
  30. Ton, Y.; Kopyt, M.; Nilov, N. Phytomonitoring technique for tuning irrigation of vineyards. Acta. Hort. 2004, 646, 133–139. [Google Scholar] [CrossRef]
  31. Ton, Y.; Kopyt, M. Phytomonitoring in realization of irrigation strategies for wine grapes. Acta. Hort. 2004, 652, 167–173. [Google Scholar] [CrossRef]
  32. Kopyt, M.; Ton, Y.; Tsadok, S. Chardonnay trunk diameter growth and microvariations: Four-year trial results and outlook for irrigation control. Aust. N. Z. Grapegrow. Winemak. 2005, 493, 23–25. [Google Scholar]
  33. Matthews, M.A.; Nuzzo, V. Berry size and yield paradigms on grapes and wines quality. Acta. Hort. 2007, 754, 423–435. [Google Scholar] [CrossRef] [Green Version]
  34. Imai, S.; Iwao, K.; Fujiwara, T. Measurements of plant physiological informations of vine tree and indexation of soil moisture control(3). Environ. Control Biol. 1991, 29, 19–26. [Google Scholar] [CrossRef]
  35. Greven, M.M.; Raw, V.; West, B.A. Effects of timing of water stress on yield and berry size. Water Sci. Technol. 2009, 60, 1249–1255. [Google Scholar] [CrossRef]
  36. Intrigliolo, D.S.; Castel, J.R. Evaluation of grapevine water status from trunk diameter variations. Irrig. Sci. 2007, 26, 49–59. [Google Scholar] [CrossRef] [Green Version]
  37. Chatelet, D.S.; Rost, T.L.; Matthews, M.A.; Shackel, K.A. The peripheral xylem of grapevine (Vitis vinifera) berries. 2. Anatomy and development. J. Expt. Bot. 2008, 59, 1997–2007. [Google Scholar] [CrossRef] [Green Version]
  38. Bittelli, M. Measuring soil water potential for water management in agriculture: A review. Sustainability 2010, 2, 1226–1251. [Google Scholar] [CrossRef] [Green Version]
  39. Barbagallo, M.G.; Vesco, G.; Di Lorenzo, R.; Lo Bianco, R.; Pisciotta, A. Soil and regulated deficit irrigation affect growth, yield and quality of ‘Nero d’Avola’ grapes in a semi-arid environment. Plants 2021, 10, 641. [Google Scholar] [CrossRef]
  40. Torres, R.; Ferrara, G.; Soto, F.; Lopez, J.A.; Sanchez, F.; Mazzeo, A.; Perez-Pastor, A.; Domingo, R. Effects of soil and climate in a table grape vineyard with cover crops. Irrigation management using sensors networks. Cienc. Tec. Vitivinic. 2017, 32, 72–81. [Google Scholar] [CrossRef] [Green Version]
  41. Cifre, J.; Bota, J.; Escalona, J.M.; Medrano, H.; Flexas, J. Physiological tools for irrigation scheduling in grapevine (Vitis vinifera L.): An open gate to improve water use efficiency? Agric. Ecosyst. Environ. 2005, 106, 159–170. [Google Scholar] [CrossRef]
  42. Zhang, Q.T.; Wang, S.P.; Inoue, M.; Moritani, S.; Tsuji, W.; Geng, S.; Qiu, G.Y.; Xie, Q. A new methodology for determining irrigation schedule of grapevines using photogrammetric measurement of berry diameter. J. Food Agric. Environ. 2012, 10, 582–587. [Google Scholar] [CrossRef]
  43. Chherawala, Y.; Lepage, R.; Doyon, G. Food grading/sorting based on color appearance trough machine vision: The case of fresh cranberries. Informat. Commun. Technol. 2006, 4, 1569–1574. [Google Scholar]
  44. Whalley, J.; Shanmuganathan, S. Applications of image processing in viticulture: A review. In Proceedings of the 20th International Congress on Modelling and Simulation, Adelaide, Australia, 1–6 December 2013; pp. 531–537. [Google Scholar]
  45. Herrero-Huerta, M.; Gonzalez-Aguilera, D.; Rodriguez-Gonzalvez, P.; Hernández-López, D. Vineyard yield estimation by automatic 3D bunch modelling in field conditi-ons. Comput. Electron. Agr. 2015, 110, 17–26. [Google Scholar] [CrossRef]
  46. Moritani, S.; Yamamoto, T.; Henintsoa, A.; Muraki, H. Monitoring of soil erosion using digital camera under simulated rainfall. Trans. JSIDRE 2006, 244, 545–551. [Google Scholar] [CrossRef]
  47. Wang, S.P.; Okamoto, G.; Hirano, K.; Lu, J.; Zhang, C.X. Effects of restricted rooting volume on vine growth and berry development of kyoho grapevines. Am. J. Enol. Vitic. 2001, 52, 248–253. [Google Scholar] [CrossRef]
  48. Marthaler, H.P.; Vogelsanger, W.; Richard, F.; Wierenga, P.J. A pressure transducer for field tensiometers. Soil Sci. Soc. Am. J. 1983, 47, 624–627. [Google Scholar] [CrossRef]
  49. Azooz, R.H.; Arshad, M.A. Laboratory calibration of pressure transducer-tensiometer system for hydraulic studies. Can. J. Soil. Sci. 1994, 74, 315–319. [Google Scholar] [CrossRef]
  50. Moran, M.S.; Scott, R.L.; Keefer, T.O.; Emmerich, W.E.; Hernandez, M.; Nearing, G.S.; Paige, G.B.; Cosh, M.H.; O’Neill, P.E. Partitioning evapotranspiration in semiaridgrassland and shrubland ecosystems using time series of soil surface temperature. Agric. For. Meteorol. 2009, 149, 59–72. [Google Scholar] [CrossRef]
  51. Conesa, M.R.; Torres, R.; Domingo, R.; Navarro, H.; Soto, F.; Perez-Pastor, A. Maximum daily trunk shrinkage and stem water potential reference equations for irrigation scheduling in table grapes. Agric. Water Manag. 2016, 172, 51–61. [Google Scholar] [CrossRef]
  52. Keller, M.; Smith, J.P.; Bondada, B.R. Ripening grape berries remain hydraulically connected to the shoot. J. Exp. Bot. 2006, 57, 2577–2587. [Google Scholar] [CrossRef] [PubMed] [Green Version]
  53. Meggio, F.; Trevisan, S.; Manoli, A.; Ruperti, B.; Quaggiotti, S. Systematic Investigation of the effects of a novel protein hydrolysate on the growth, physiological parameters, fruit development and yield of grapevine (Vitis Vinifera L., cv Sauvignon Blanc) under water stress conditions. Agronomy 2020, 10, 1785. [Google Scholar] [CrossRef]
  54. Zsόfi, Z.; Gal, L.; Szilagyi, Z.; Szucs, E.; Marschall, M.; Nagy, Z.; Balo, B. Use of stomatal conductance and pre-dawn water potential to classify terroir for the grape variety Kékfrankos. Aust. J. Grape Wine Res. 2009, 15, 36–47. [Google Scholar] [CrossRef]
  55. Goldhamer, D.A.; Fereres, E.; Mata, M.; Girona, J.; Cohen, M. Sensitivity of continuous and discrete plant and soil water status monitoring in peach trees subjected to deficit irrigation. J. Am. Soc. Hortic. Sci. 1999, 124, 437–444. [Google Scholar] [CrossRef] [Green Version]
  56. Boini, A.; Manfrini, L.; Bortolotti, G.; Corelli-Grappadelli, L.; Morandi, B. Monitoring fruit daily growth indicates the onset of mild drought stress in apple. Sci. Hortic. 2019, 256. [Google Scholar] [CrossRef]
  57. Resco, V.; Ewers, B.E.; Sun, W.; Huxman, T.E.; Weltzin, J.F.; Williams, D.G. Drought-induced hydraulic limitations constrain leaf gas exchange recovery after precipitation pulses in the C3 woody legume, prosopis velutina. New Phytol. 2009, 181, 672–682. [Google Scholar] [CrossRef]
  58. Santesteban, L.G.; Royo, J.B. Water status, leaf area and fruit load influence on berry weight and sugar accumulation of cv. ‘Tempranillo’ under semiarid conditions. Sci. Hortic. 2006, 109, 60–65. [Google Scholar] [CrossRef]
  59. Koundouras, S.; Tsialtas, I.T.; Zioziou, E.; Nikolaou, N. Rootstock effects on the adaptive strategies of grapevine (Vitis vinifera L. cv. Cabernet-Sauvignon) under contrasting water status: Leaf physiological and structural responses. Agric. Ecosyst. Environ. 2008, 128, 86–96. [Google Scholar] [CrossRef]
  60. Maroco, J.P.; Rodrigues, M.L.; Lopes, C.; Chaves, M.M. Limitations to leaf photosynthesis in field-grown grapevine under drought-metabolic and modelling approaches. Funct. Plant Biol. 2002, 29, 451–459. [Google Scholar] [CrossRef] [PubMed]
  61. Quick, W.P.; Chaves, M.M.; Wendler, R.; David, M.; Rodrigues, M.L.; Passaharinho, J.A.; Pereira, J.S.; Adcock, M.D.; Leegood, R.C.; Stitt, M. The effect of water stress on photosynthetic carbon metabolism in four species grown under field conditions. Plant Cell Environ. 1992, 15, 25–35. [Google Scholar] [CrossRef]
  62. Flexas, J.; Escalona, J.M.; Medrano, H. Water stress induces different levels of photosynthesis and electron transport rate regulation in grapevines. Plant Cell Environ. 1999, 22, 39–48. [Google Scholar] [CrossRef]
  63. Flexas, J.; Bota, J.; Escalona, J.M.; Sampol, B.; Medrano, H. Effects of drought on photosynthesis in grapevines under field conditions: An evaluation of stomatal and mesophyll limitations. Funct. Plant Biol. 2002, 29, 461–471. [Google Scholar] [CrossRef] [PubMed] [Green Version]
  64. Stamatiadis, S.; Christofides, C.; Tsadila, E.; Taskos, D.; Tsadilas, C.; Schepers, J.S. Relationship of leaf stable isotopes (delta 13C and delta 15N) to biomass production in two fertilized merlot vineyards. Am. J. Enol. Vitic. 2007, 58, 67–74. [Google Scholar]
Figure 1. Schematic illustration of experimental setup (a,b) and diurnal variations in a time series of berry diameter (berry No. 2) in berry development Stage III (c). The solid line represents the measured berry diameter, and the dashed line represents the trend. When the berries were in the maturation stage, a pot containing the grapevine was placed in a wind tunnel with a two-layer glass chamber in a glass dome building of the Arid Land Research Center, Tottori University, Tottori (35°15′ N, 133°47′ E), Japan. Natural solar radiation can pass through the glass dome. In the glass chamber, an artificial light source was set 0.5 m higher than the top of the grapevine to supply sufficient radiation energy; the diurnal artificial luminous intensity, relative humidity and air flow were set at 3000 µmol m−2 s−1, 50% and 0.3 m s−1, respectively. The air temperature was set to 12/12 h (day/night) cycles of 35/20 °C. After placement in the wind tunnel, the pots were irrigated to saturation. No irrigation was applied until the end of this experiment and the grapevine experienced deceasing ψ.
Atmosphere 12 00845 g001
Figure 2. Fruit growth rate (mm) and maximum daily shrinkage (mm). The fruit growth rate was the difference between the maximum diameter of two consecutive days. The maximum daily shrinkage was the difference between the daily minimum diameter minus the maximum diameter of the former day.
Atmosphere 12 00845 g002
Figure 3. Effect of average soil water potential (ψ) (0.1 m soil depth, n = 6) on the trend value of berry diameter in berry development Stage III (dD1/dψ and dD2/dψ represent the differential of trend values of berry diameter No. 1 and No. 2 on soil water potential). The x-axes scale of ψ is from −7.14 kPa (9:00, 17 August) to −20.39 kPa (20:00, 19 August).
Atmosphere 12 00845 g003
Figure 4. Daily variation of average soil water potential (ψ), photosynthesis, stomatal conductance (gs), and transpiration (E) of grapevine in berry development Stage III. Each symbol represents the average, and error bars represent SE. There were six replicates of measurements for soil water potential, while three replications were measured for photosynthesis, stomatal conductance, and transpiration. The bold arrow represents the irrigation event.
Atmosphere 12 00845 g004
Figure 5. Relationship among average soil water potential (at 0.1 m soil depth) (n = 6), photosynthesis (AN) (n = 3), intrinsic WUE (AN gs−1 as µmol CO2 mol H2O−1), and extrinsic WUE (AN E−1 as mmol CO2 mol H2O−1) (n = 3) of primary leaves of the grapevine in the morning in August, in berry development Stage III. gs: stomatal conductance; E: transpiration.
Atmosphere 12 00845 g005
Figure 6. Relationship between trend value of berry diameter and leaf photosynthesis (AN), stomatal conductance (gs), transpiration (E), leaf temperature, intrinsic WUE (AN gs−1 as µmol CO2 mol H2O−1) and extrinsic WUE (AN E−1 as mmol CO2 mol H2O−1) of primary leaves of the grapevine in the morning in Stage III. Values are means and error bars represent SE (n = 3).
Atmosphere 12 00845 g006
Figure 7. Relationship between leaf stomatal conductance (gs) and leaf photosynthesis (AN), intrinsic WUE (AN gs−1 as µmol CO2 mol H2O−1), extrinsic WUE (AN E−1 as mmol CO2 mol H2O−1), and sub-stomatal CO2 concentration (Ci) of primary leaves of the grapevine in the morning in Stage III. Values are means and error bars represent SE (n = 3). E: transpiration.
Atmosphere 12 00845 g007
Table 1. The average values and SD/SE of soil water potential (ψ) at 0.1 m depth.
DateTime7:009:0011:0013:0015:0017:0019:0021:00
13 AugustΨ (kPa)−0.33−0.93−1.18−1.33−1.69−1.91−1.86−1.86
SD0.350.230.160.240.260.180.160.14
SE0.140.090.070.100.110.070.070.06
14 AugustΨ (kPa)−2.21−2.12−2.21−2.29−2.44−2.72−2.77−2.84
SD0.170.210.120.180.140.120.090.06
SE0.090.050.070.060.050.040.030.05
15 AugustΨ (kPa)−3.22−3.02−3.15−3.29−3.40−3.60−3.65−3.72
SD0.050.150.180.080.070.150.110.05
SE0.020.060.070.030.030.060.040.02
16 AugustΨ (kPa)−4.12−4.30−4.50−4.85−5.22−5.35−5.62−5.76
SD0.150.150.230.140.260.200.280.38
SE0.060.060.090.060.110.080.110.16
17 AugustΨ (kPa)−6.87−7.14−7.92−8.57−9.37−9.17−10.04−10.65
SD0.360.440.440.711.070.961.131.31
SE0.150.180.180.290.440.390.460.54
18 AugustΨ (kPa)−14.61−13.20−14.67−15.14−14.79−15.57−16.15−19.25
SD1.722.012.051.791.862.841.892.05
SE0.700.820.840.730.761.160.770.84
19 AugustΨ (kPa)−21.87−16.44−17.14−17.62−17.45−18.22−20.39−21.87
SD2.302.512.532.893.123.242.552.30
SE0.941.021.031.181.271.321.040.94
SD: standard deviation; SE: standard error; n = 6.
Publisher’s Note: MDPI stays neutral with regard to jurisdictional claims in published maps and institutional affiliations.

