Article

Effects of Excessive Equatorial Cold Tongue Bias on the Projections of Tropical Pacific Climate Change. Part II: The Extreme El Niño Frequency in CMIP5 Multi-Model Ensemble

1
College of Oceanography, Hohai University, Nanjing 210098, China
2
Southern Marine Science and Engineering Guangdong Laboratory (Zhuhai), Zhuhai 519082, China
3
State Key Laboratory of Loess and Quaternary Geology, Institute of Earth Environment, Chinese Academy of Sciences, Xi’an 710061, China
4
Laboratory for Climate Studies and CMA-NJU Joint Laboratory for Climate Prediction Studies, National Climate Center, China Meteorological Administration, Beijing 100081, China
*
Authors to whom correspondence should be addressed.
Atmosphere 2021, 12(7), 851; https://doi.org/10.3390/atmos12070851
Submission received: 2 June 2021 / Revised: 23 June 2021 / Accepted: 25 June 2021 / Published: 30 June 2021
(This article belongs to the Special Issue Tropical Ocean-Atmosphere Interaction and Climate Change)

Abstract

:
Under increased greenhouse gas (GHG) forcing, climate models tend to project a warmer sea surface temperature in the eastern equatorial Pacific than in the western equatorial Pacific. This El Niño-like warming pattern may induce an increase in the projected occurrence frequency of extreme El Niño events. The current models, however, commonly suffer from an excessive westward extension of the equatorial Pacific cold tongue accompanied by insufficient equatorial western Pacific precipitation. By comparing the Representative Concentration Pathway (RCP) 8.5 experiments with the historical simulations based on the Coupled Model Intercomparison Project phase 5 (CMIP5), a “present–future” relationship among climate models was identified: models with insufficient equatorial western Pacific precipitation error would have a weaker mean El Niño-like warming pattern as well as a lower increase in the frequency of extreme El Niño events under increased GHG forcing. Using this “present–future” relationship and the observed precipitation in the equatorial western Pacific, this study calibrated the climate projections in the tropical Pacific. The corrected projections showed a stronger El Niño-like pattern of mean changes in the future, consistent with our previous study. In particular, the projected increased occurrence of extreme El Niño events under RCP 8.5 forcing are underestimated by 30–35% in the CMIP5 multi-model ensemble before the corrections. This implies an increased risk of the El Niño-related weather and climate disasters in the future.

1. Introduction

The El Niño-Southern Oscillation (ENSO) is a tropical Pacific interannual mode of coupled ocean–atmosphere variability with global reach [1,2,3,4,5,6,7,8,9]. El Niño, as the warm phase of ENSO, is characterized by anomalously warm sea surface temperature (SST) in the equatorial Pacific and a basin-wide equatorial trade wind slowing or reversal. This is accompanied by a pronounced eastward shift of atmospheric convection and hence a large increase in precipitation in the eastern equatorial Pacific, where it is usually cold and dry [10]. It has been recognized that such an anomalous condition of atmospheric convection/precipitation has substantial remote effects on weather and climate patterns around the globe, affecting the Indian summer monsoon [11,12,13,14,15], North American weather and climate [16,17,18], East Asian summer monsoon [19,20,21,22], Western North Pacific (WNP) tropical cyclone activity [23,24,25,26], global precipitation, SST, and sea level pressure (SLP) [5,27,28,29,30,31,32,33,34].
The 1982/83 and 1997/98 events have been regarded as “extreme El Niño episodes” [35,36], with an extraordinary eastward extension of warm SSTs exceeding 28 °C into the eastern equatorial Pacific and exceptional precipitation over the usually dry eastern equatorial Pacific (Figure 1a) [10,30]. Such a strong adjustment of atmospheric convection/precipitation critically disturbs global weather and climate patterns, leading to devastating consequences in several parts of the globe [37,38]. For instance, Indonesia and its surrounding countries experienced catastrophic droughts and wildfires [36,39] as well as severe human health problems associated with smoke and haze [40,41]. By contrast, the eastern equatorial regions and northern Peru suffered from devastating floods [35] and severe ecological environment problems [42,43].
Such widespread socio-economic consequences urgently call for attention to potential changes in extreme El Niño occurrences under global warming. Because it is still too difficult to reliably extract extreme El Niño changes under global warming forcing from observed records [44,45,46,47,48,49], climate model projections are widely used at present. In particular, the multi-model ensembles from the Coupled Model Intercomparison Project phase 5 (CMIP5) [50] and CMIP3 [51] suggested that greenhouse warming tends to induce a higher frequency of extreme El Niño occurrences, predicting approximately one event every 10 years in future greenhouse gas (GHG) emission scenarios compared with one event every 20 years in the historical runs [10,38]. This has an important implication for the increasing risk of natural disasters induced by El Niño since an extreme El Niño event can exert considerable influences on the weather and climate, environmental ecosystems, and human health both locally and in remote regions [35,36].
Cai et al. [10] attributed this projected increased frequency of extreme El Niño to an El Niño-like warming pattern in response to increased GHG forcing [52,53,54,55,56]. This projected mean change in the tropical Pacific SST pattern would be conducive to more frequent development of atmospheric deep convection [38] and hence increased precipitation in the equatorial eastern Pacific (even higher than 5 mm/day). The El Niño-like projection largely arises from the equatorial Pacific west–east contrast for mean clouds and SST [53,55]. Toward the equatorial western Pacific, with high SSTs and strong atmospheric convection/precipitation, an increased SST can reduce surface radiation by increasing convection and cloud cover, resulting in negative feedback onto the SST increases [57,58]. By contrast, in the equatorial eastern Pacific where SST is lower, an SST increase can increase the radiation at the ocean surface by breaking up the low clouds, resulting in positive feedback onto the SST increases [59,60,61,62,63,64].
However, several generations of coupled general circulation models (CGCMs) have commonly produced insufficient equatorial Pacific gradients in west–east SSTs along with insufficient precipitation/clouds over the equatorial western Pacific [60,65]. This is because of an excessive cold tongue that extends too far westward relative to observations [66,67,68,69]. Moreover, our previous study [70] revealed that CGCMs with an excessive equatorial Pacific cold tongue tend to have a weaker El Niño-like warming because of insufficient negative SST radiation feedback in the western Pacific. Therefore, we further calibrated the projected SST warming pattern over the tropical Pacific based on an observational constraint of equatorial western Pacific precipitation.
The present study further explored the effect of the Pacific cold tongue error on the projected frequency change in the occurrence of extreme El Niño events from 22 CMIP5 CGCMs, as an extension of our previous work [70]. Similar to our previous study [70], an observational constraint of western Pacific precipitation was applied to calibrate the model error effects. The corrections indicate that both the projected increase in the occurrence of extreme El Niño events and the El Niño-like response pattern under global warming were greatly strengthened.

2. Models, Datasets, and Methods

2.1. Models

Both the Representative Concentration Pathway (RCP) 8.5 (a high emission scenario) and the historical runs from the CMIP5 models [50] were examined. Monthly outputs in 22 CMIP5 models were used, including SST, precipitation, and surface wind stress. The model names, their letter labels, as well as the modeling groups/centers, are shown in Table 1. In this study, only one ensemble member output (“r1i1p1”) of each model is shown, as the results from different members of each model were very similar (figure not shown) [71]. In particular, the 1999–2098 means from the RCP 8.5 experiments are featured as the future climatology, and the 1899–1998 means are used as the present climatology. Compared with our previous work [70], we increased the study years to identify more extreme events. Here, for each model, all the climatology changes were normalized by a global mean SST increase to eliminate the effect of the inter-model response sensitivity differences in increased GHG forcing. The multi-model ensemble (MME) mean, unless otherwise specified, is a simple average from 22 CGCMs.

2.2. Datasets

The observed datasets for the satellite era (1979–2010) were used in this study. The winds at 1000 hPa were obtained from the ERA-Interim reanalysis [72]. The precipitation data were from the Global Precipitation Climatology Project [73]. We used the SST data from the Hadley Centre Sea Ice and SST reanalysis [74]. Both the observed datasets and the model outputs were interpolated into a uniform 1° × 1° horizontal grid.

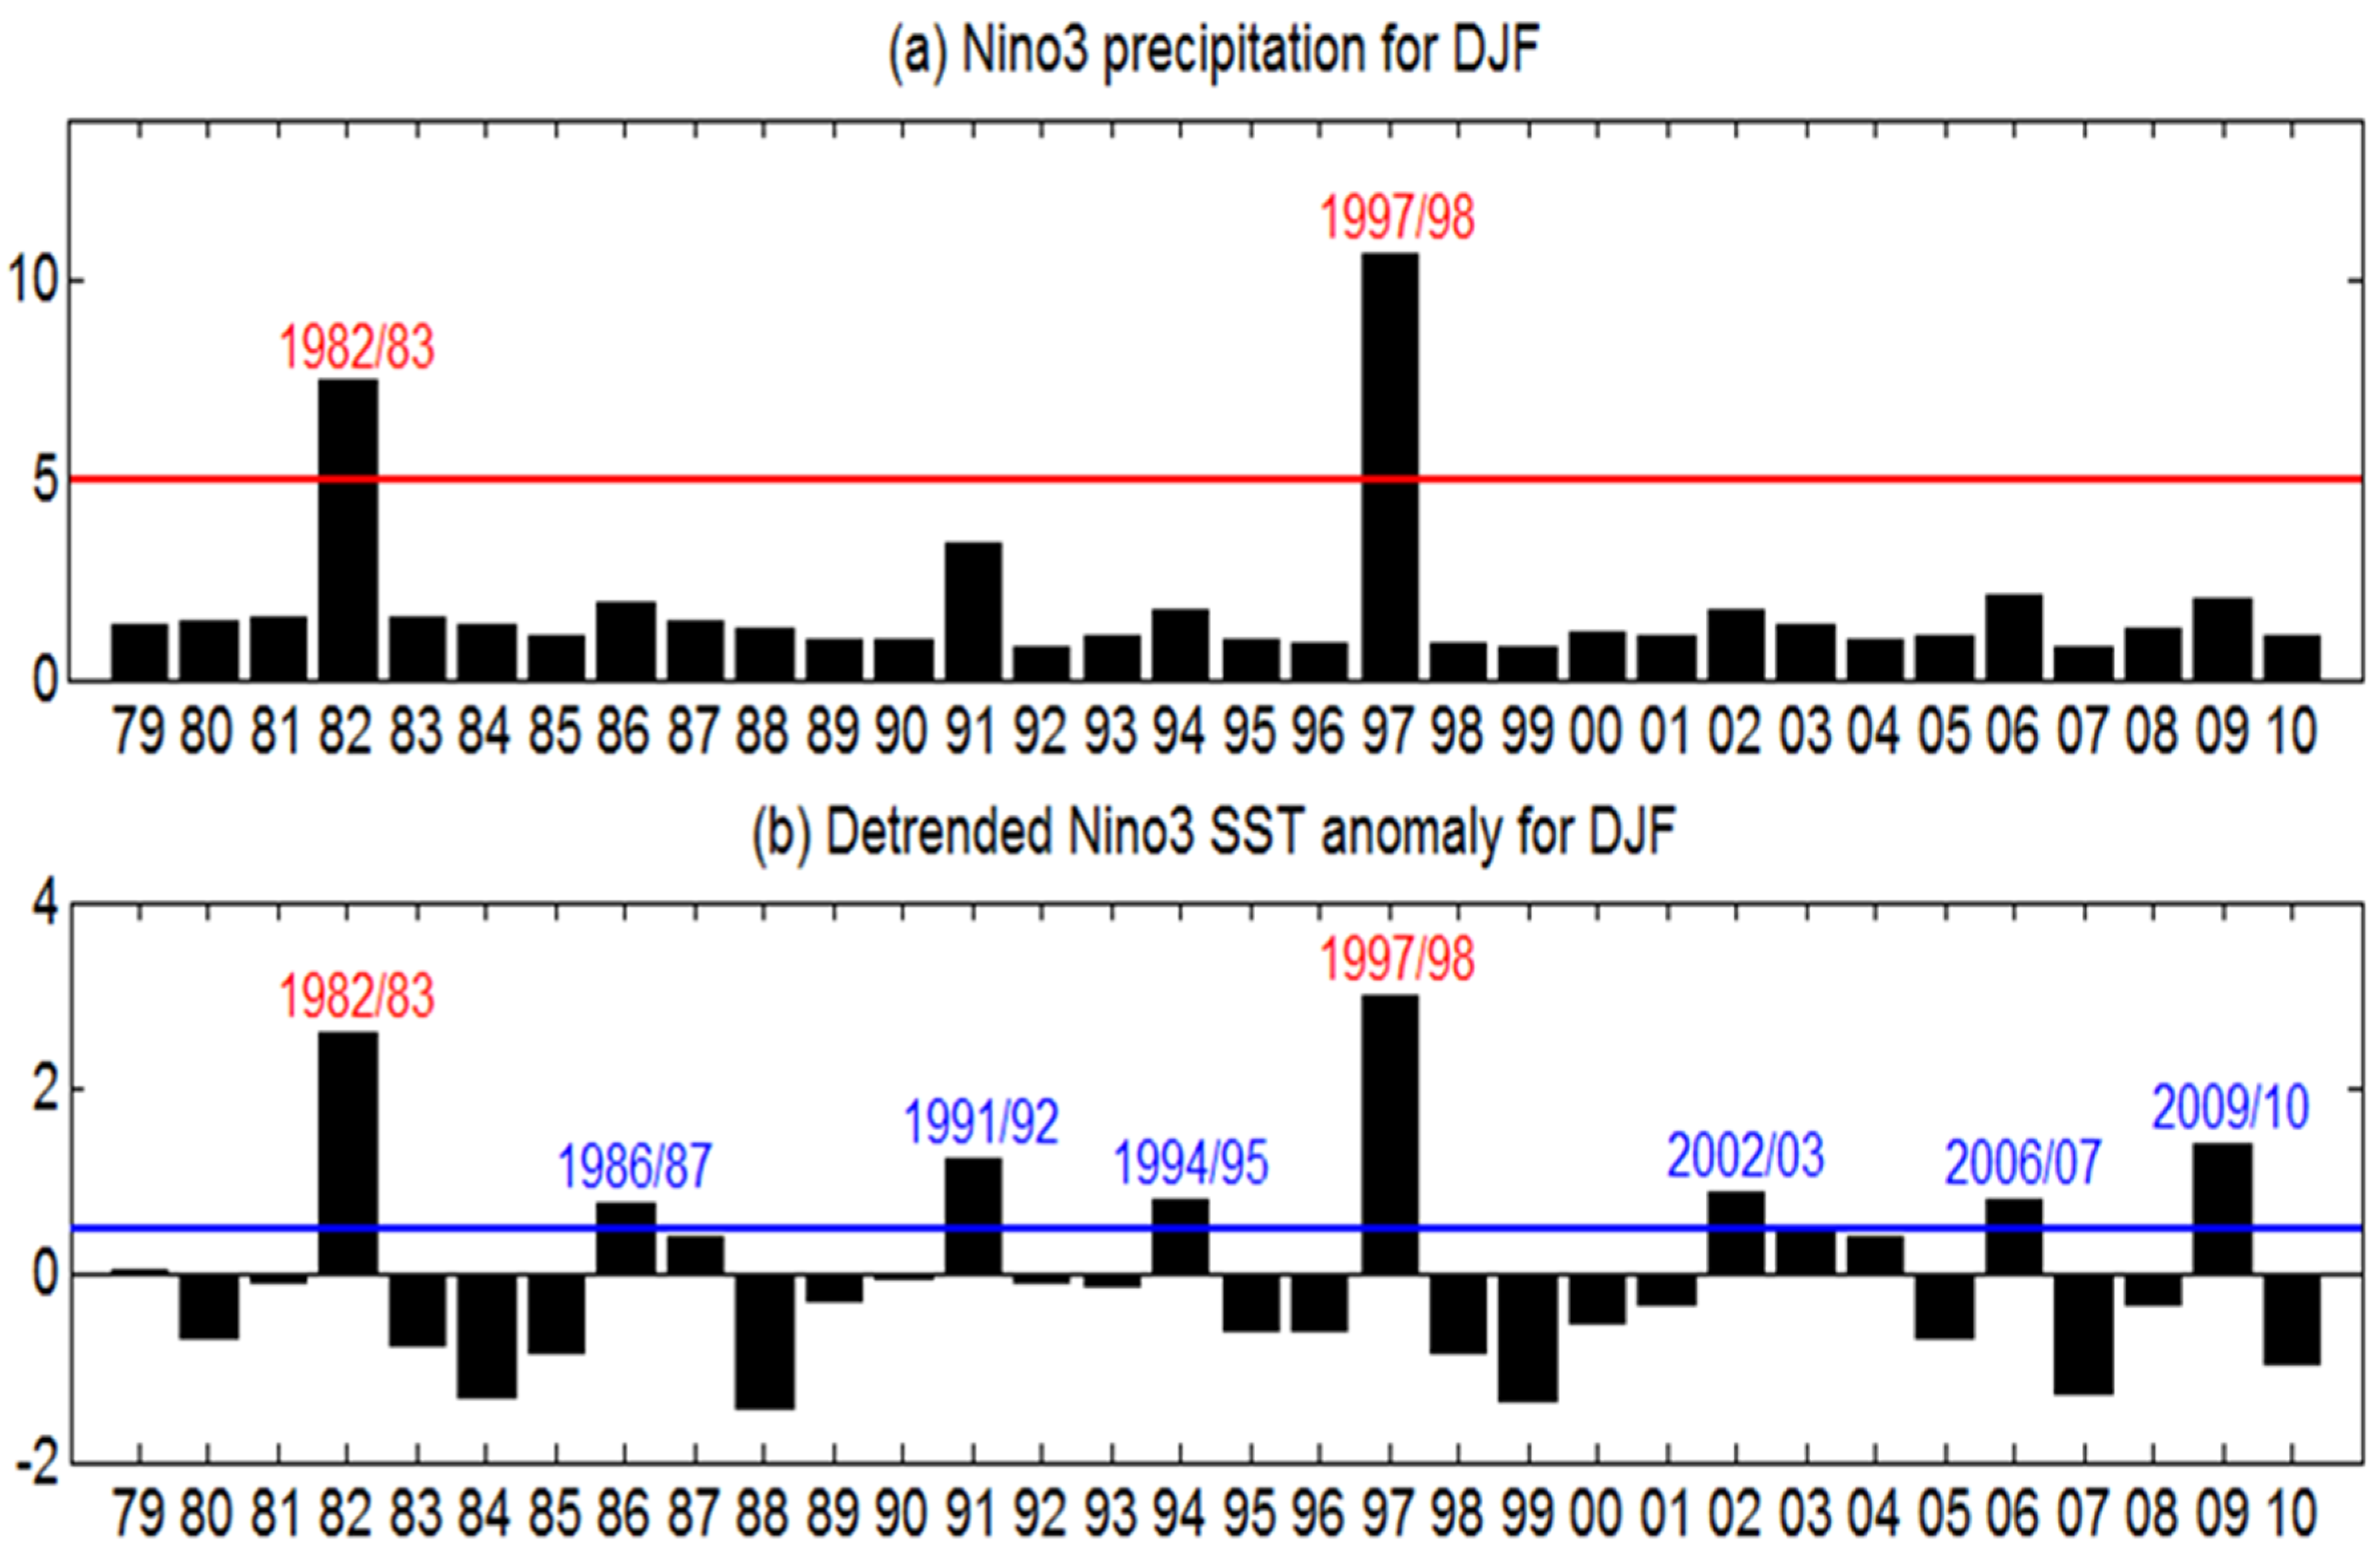
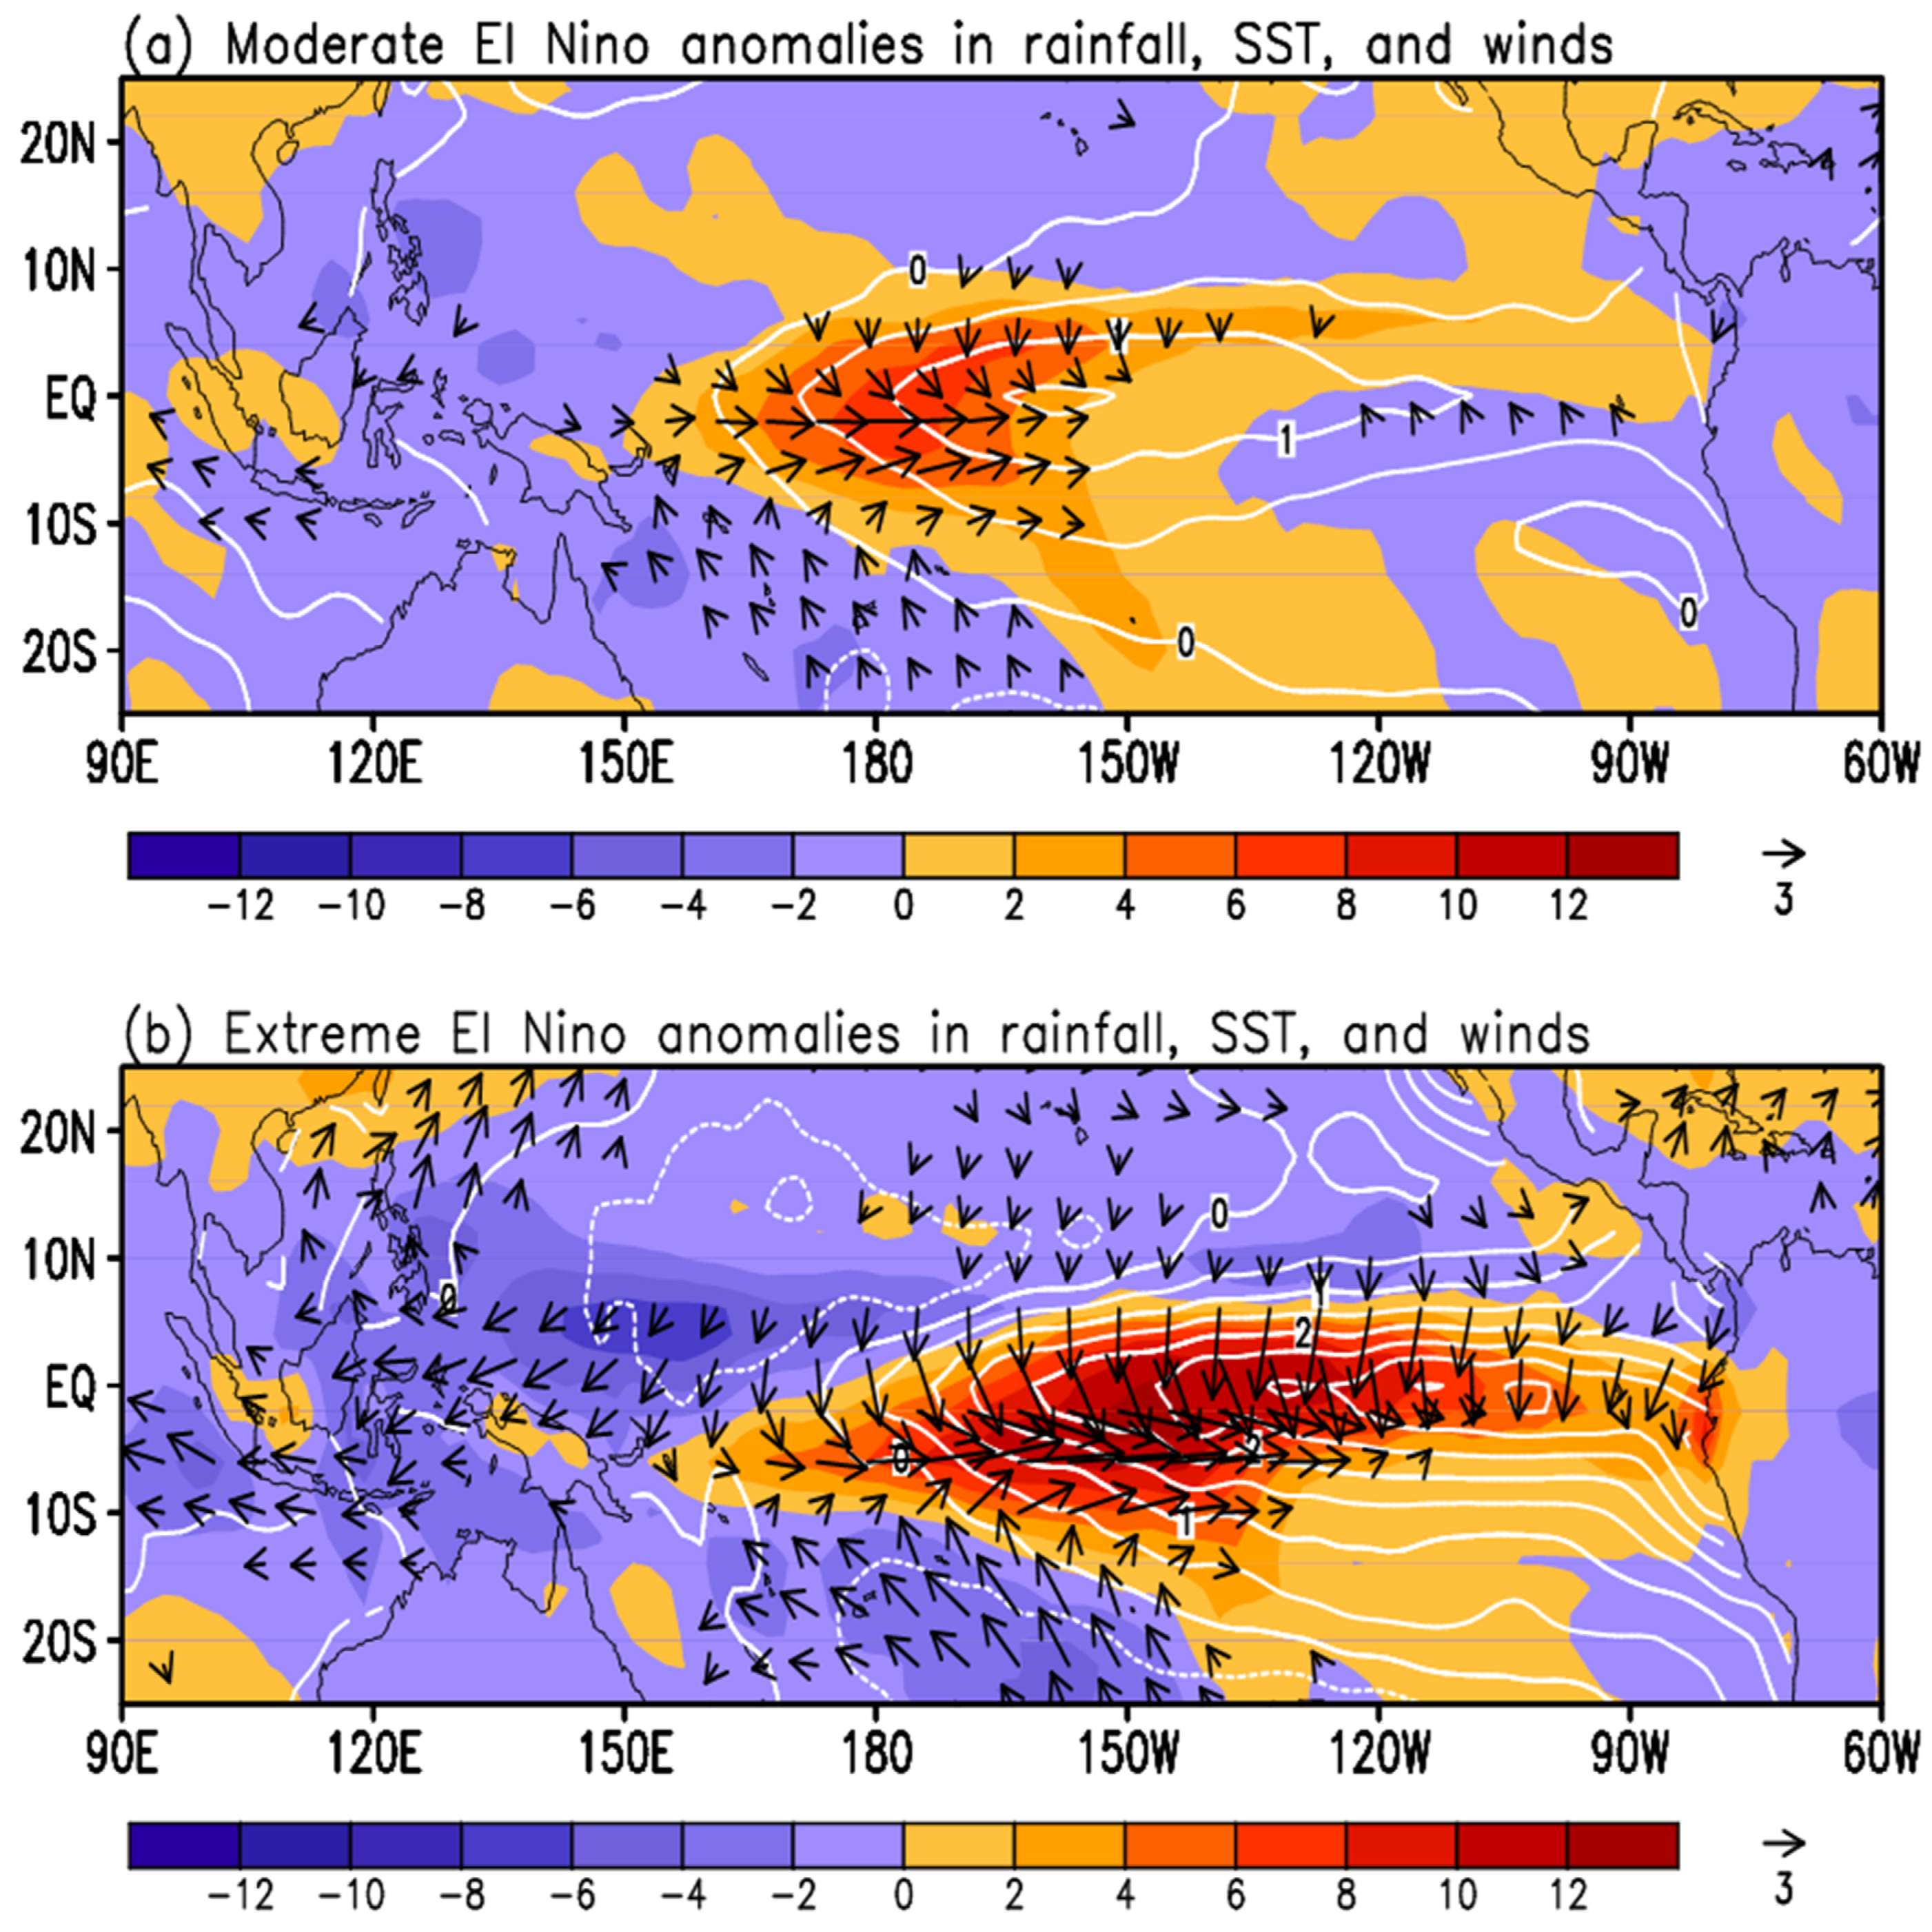
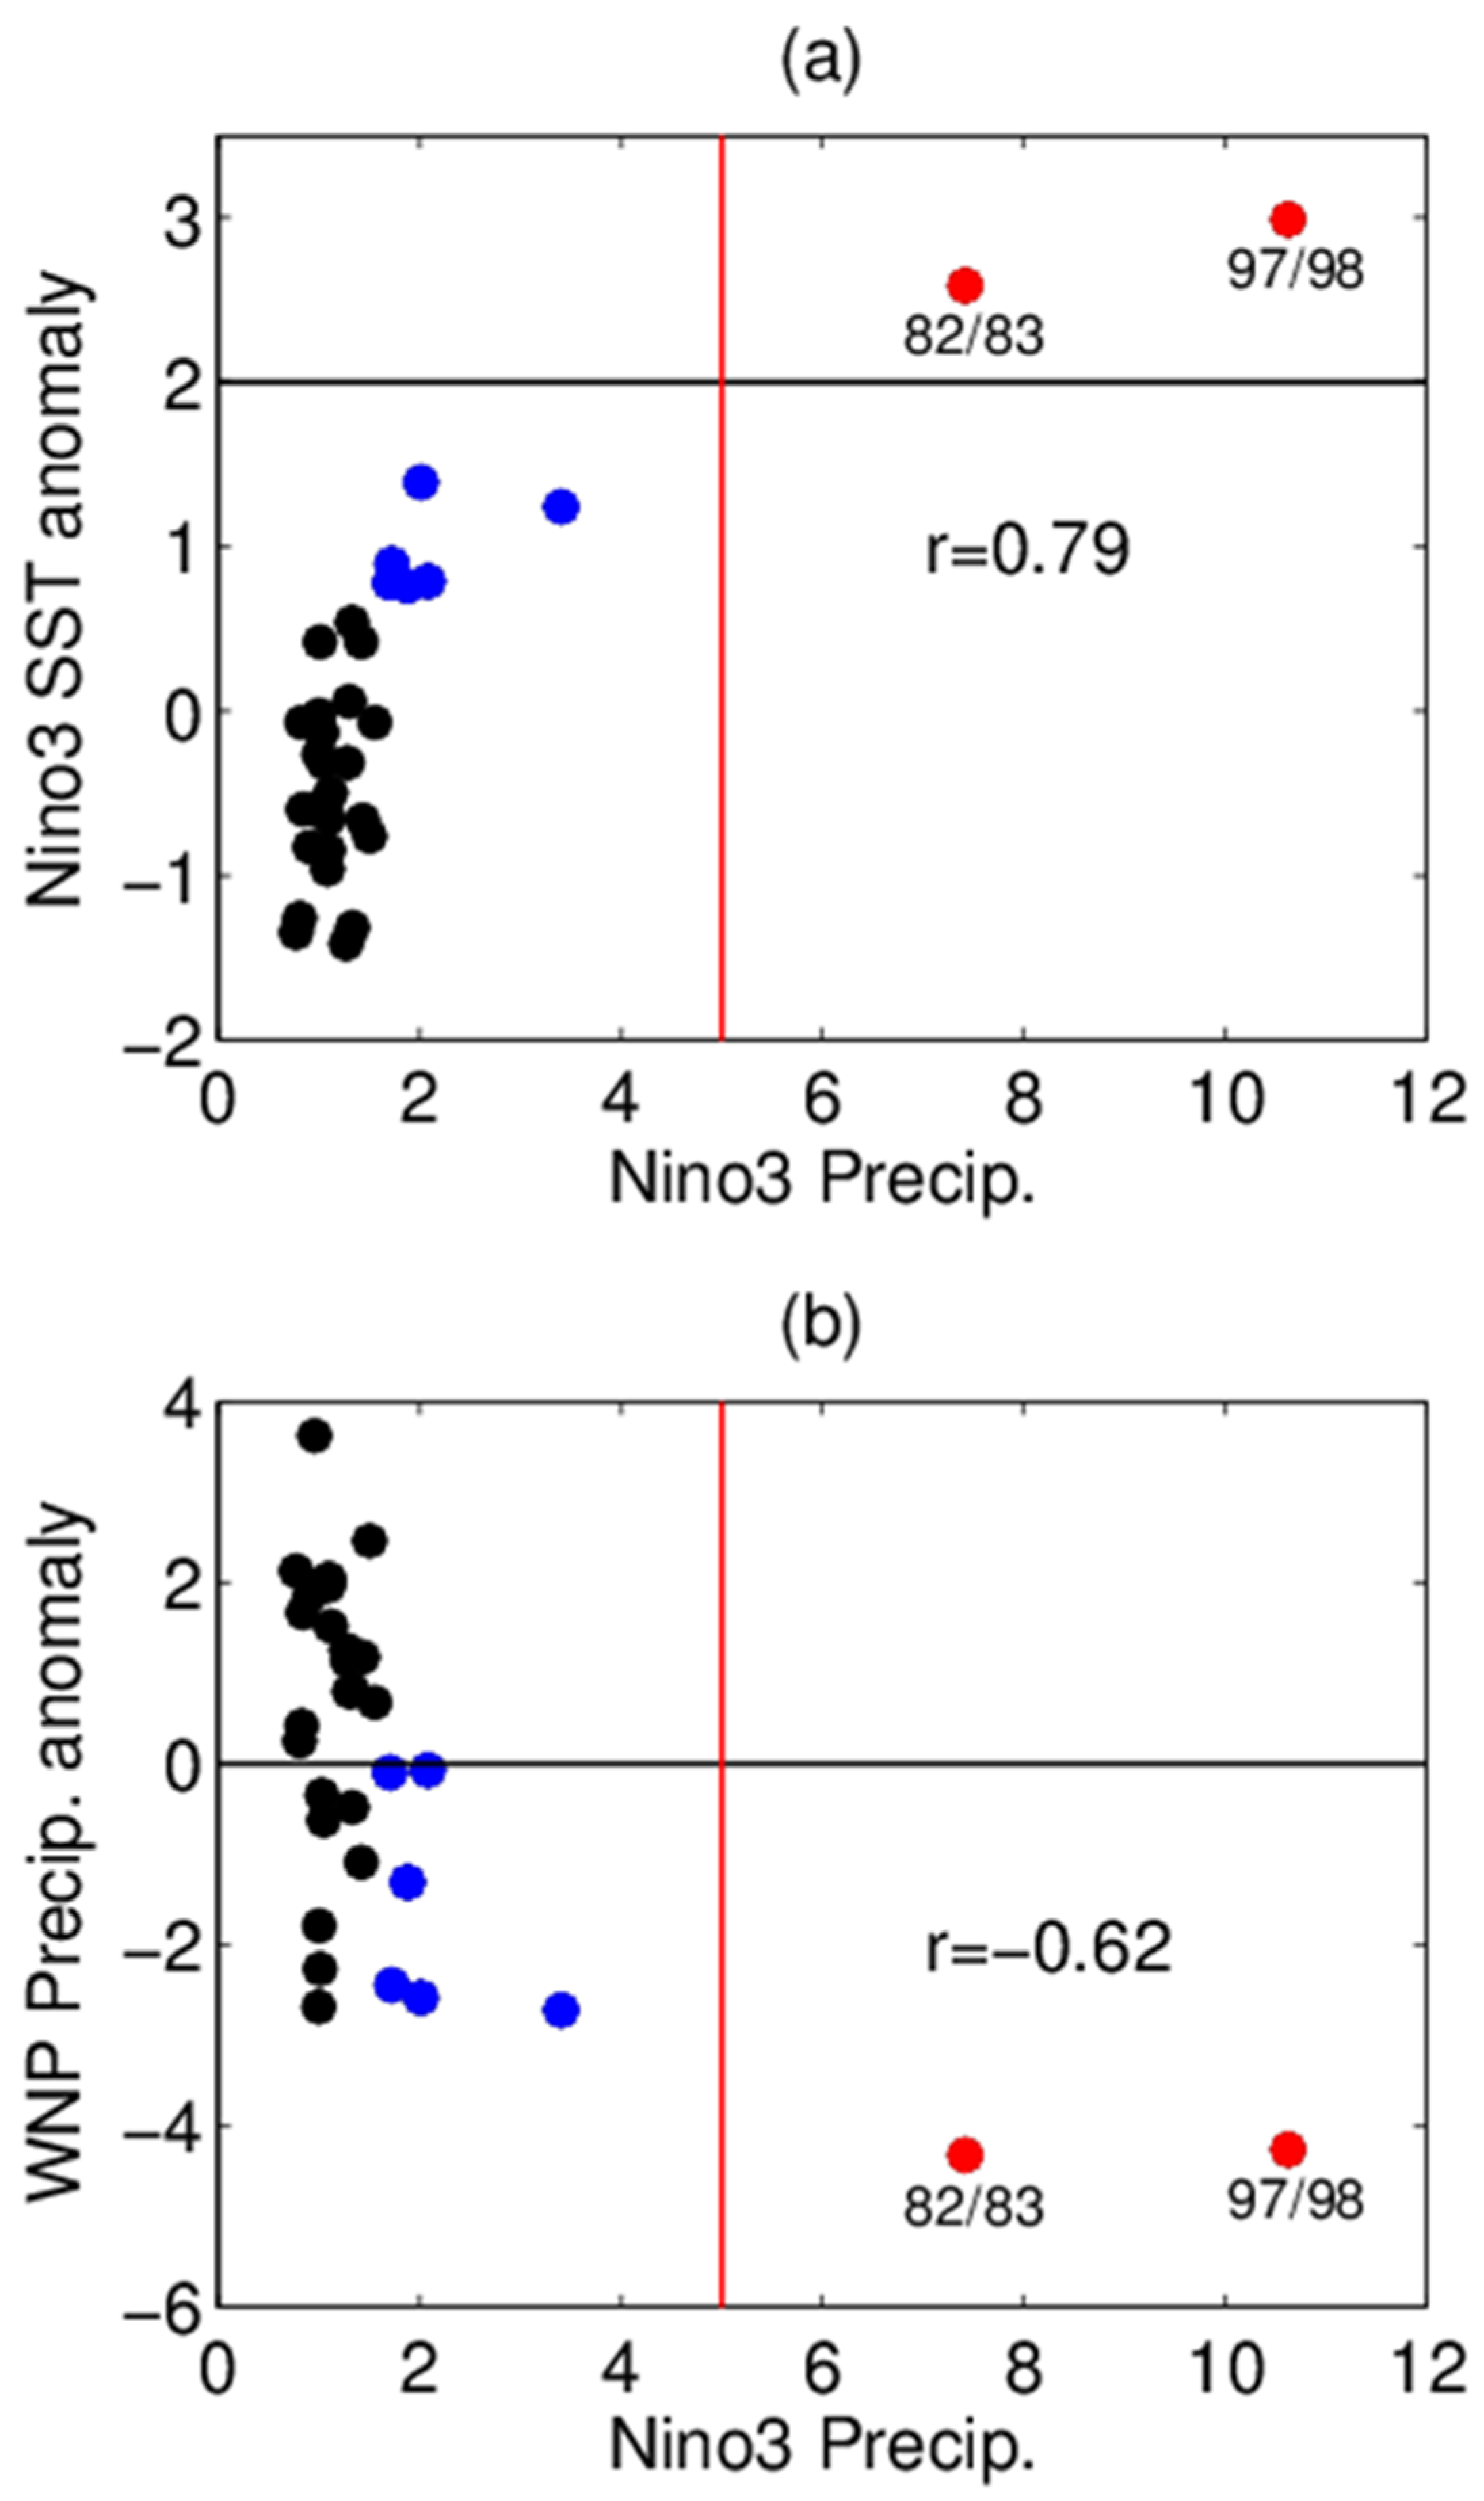
2.3. Definition of Extreme El Niño Events

Following our previous work [10], this study identified an extreme El Niño event when the December–January–February (DJF) mean precipitation over the Niño3 (150° W–90° W, 5° S–5° N) region was greater than 5 mm/day unless otherwise specified. Because El Niño-related SST anomalies cause a pronounced eastward shift in atmospheric convection and precipitation in the equatorial Pacific, which in turn affect global weather and climate [5,30,68], Niño3 precipitation is a good index for extreme El Niño events [75,76].
Figure 1a shows the DJF Niño3 precipitation from observations between 1979 and 2010. The Niño3 region is located in the descending branch of the Pacific Walker circulation, and the local climate condition, because of large-scale atmospheric subsidence, is generally dry, with DJF mean precipitation of less than 2.0 mm/day. However, the periods of 1982/83 and 1997/98 were two extremely unusual (extreme El Niño) years, with DJF Niño3 precipitation of about 7.5 mm/day and 10.5 mm/day, respectively. Based on the definition that detrended Niño3 SSTs greater than 0.5 °C are anomalies but not extreme El Niño events, we identified six moderate El Niño events (1986/87, 1991/92, 1994/95, 2002/03, 2006/07, and 2009/10) for 1979–2010 (Figure 1b).
Figure 2 compares the composite DJF anomalies in SST, precipitation, and 1000 hPa winds over the tropical Pacific between the moderate and extreme El Niño events. For moderate El Niño events, the SST along the central and eastern equatorial Pacific was warmer than normal, accompanied by increased convection/precipitation and anomalous westerly winds near the central part of the equatorial Pacific, while the WNP region experiences drought. Compared with moderate El Niño events, the warm SST anomaly is larger in extreme El Niño events, and the anomalous precipitation is stronger and expands farther eastward along the equator, resulting in uncommon precipitation of more than 5 mm/day in the usually dry equatorial eastern Pacific. The easterly wind anomalies along the equator are a response to and act to amplify the extreme El Niño-related SST warming by deepening the eastern thermocline, which is suggestive of Bjerknes feedback [1]. In addition, the anomalous anticyclonic circulation over the WNP [22], as an important response to the El Niño, is more evident, and the corresponding WNP precipitation decrease is more intense in extreme El Niño events relative to moderate El Niño events.
Figure 3a shows the relationship between Niño3 DJF precipitation values and the detrended Niño3 DJF SST anomalies for 1979–2010. When the Niño3 SST anomalies are negative, the Niño3 precipitation values are nearly constant and less than 2 mm/day. By contrast, the Niño3 precipitation increases sharply with SST when the Niño3 SST anomalies are more than zero. Following the largest SST anomalies, the Niño3 precipitation for the 1982/83 and 1997/98 extreme El Niño events is striking, with the DJF values of more than 5 mm/day. The strongest Niño3 DJF precipitation is accompanied by strong anticyclone (Figure 2b) and large precipitation decrease (Figure 3b) anomalies over the WNP, which could in turn remotely affect the East Asian climate [22]. Both inter-model correlation coefficients in Figure 3 exceed the 0.001 significance level obtained using the Student’s t-test.

2.4. Correction Method of the Future Projections

Given the historical state, H(s,m), and future state, F(s,m), of two dimensional fields, future climate changes can be defined as:
C(s,m) = F(s, m) − H(s, m)
where s and m denote space (latitude and longitude) and model, respectively. Following our previous study [70], the calibrations in this study used the relationships between the climatological mean precipitation in the equatorial western Pacific and future climate projections in a multi-model ensemble to constrain projections. This is similar to the concept of “emergent constraints” [70,77,78,79,80,81]. The mean precipitation bias in the present climate for model m is expressed as:
P(m)′ = P(m) − Pobs
where the P(m) and Pobs represent the climatological mean precipitation values in the equatorial western Pacific (140° E–170° W, 2° S–2° N) for model m and observations, respectively.
Because of an excessive equatorial cold tongue, CGCMs tend to have insufficient precipitation over the equatorial western Pacific compared with observations [60,65,70]. The present–future relationship among CGCMs between the simulated present-day precipitation, P(m), and projected future climate changes, C(s,m), can be performed by a linear regression analysis, defined as:
C(s,m) = a(s) × P(m) + b(s)
where a is regression pattern and b is the regression constant term.
Considering the assumption that the simulated present-day precipitation bias in the equatorial western Pacific would transmit into future climate projections over the tropical Pacific and that the identified present–future relationship in Equation (3) is statistically significant, we can estimate the errors in climate changes, C(s,m)′, projected by the simulated equatorial western Pacific precipitation bias from each model. By projecting P(m)′ into future climate changes, C(s,m)′ can be estimated as:
C(s,m)′ = a(s) × P(m)′
Therefore, the corrected future climate changes for each model are given as:
C(s, m)* = C(s,m) − C(s,m)′
Finally, the MME mean of corrected future climate changes in individual models is calculated as:
C ( s ,   m ) * ¯ = 1 N m = 1 N C ( s ,   m ) *
where N is the total number of climate models. Alternatively, by directly substituting Pobs into Equation (3), we obtain the corrected MME mean of future climate projections among models as follows:
C ( s ,   m ) * ¯ = a ( s ) × P obs +   b ( s )
Equations (6) and (7) are identical for the MME mean.

3. Results

3.1. Extreme El Niño Occurrences vs. El Niño-Like Warming Pattern

Figure 4a compares the numbers of occurrences of extreme El Niño events between the climate change period (1999–2098) and the present period (1899–1998) in 22 CMIP5 CGCMs. In particular, there were five CMIP5 CGCMs, i.e., CSIRO-Mk3-6-0 (M8), inmcm4 (M15), IPSL-CM5A-LR (M16), IPSL-CM5A-MR (M17), and MPI-ESM-LR (M19), which could not reproduce the extreme El Niño events of observations; furthermore, there was no DJF season with Niño3 precipitation greater than 5 mm/day over a 200-year period (1899–2098) for these five CMIP5 CGCMs. In addition, the other 17 CMIP5 CGCMs consistently projected increased occurrence of extreme El Niño events in response to the greenhouse warming forcing, similar to the finding of Cai et al. [10]. The results were very similar when the definition of an extreme El Niño event was the DJF precipitation value averaged over the Niño3 region was greater than 6 mm/day (Figure 4b), further supporting the robustness.
Multi-model statistics displayed increased (decreased) occurrence of DJF precipitation averaged over the Niño3 region of greater (less) than 2 mm/day under RCP 8.5 forcing, with an increase of approximately 0.9 mm/day in mean Niño3 DJF precipitation (Figure 5a). However, the projected increased occurrence of extreme El Niño events with Niño3 DJF precipitation greater than 5 mm/day were not simply due to an increase in mean Niño3 DJF precipitation, as the increased occurrence was also clearly found for the detrended Niño3 DJF precipitation anomalies greater than 2 mm/day, which removed the mean shift of climatological precipitation (Figure 5b).
Rather, the increased frequency of extreme Niño3 DJF precipitation may result from the El Niño-like future responses in the mean to global warming (Figure 6a) [10]. The faster SST increase in the equatorial eastern Pacific can cause an eastern shift of atmospheric convection/precipitation [70]. As a result, a stronger convection/precipitation anomaly may be required in the equatorial eastern Pacific for a given warm SST anomaly. Indeed, the CMIP5 CGCMs projected a strengthened sensitivity of precipitation over the Niño3 region to local SST anomalies under increased GHG forcing, with a statistically significant inter-model consensus at the 0.05 significant level according to the Student’s t-test (Figure 5c). The only exceptions in Figure 5c are IPSL-CM5A-LR (M16), IPSL-CM5A-MR (M17), and MPI-ESM-LR (M19), which did not virtually project an increased future occurrence of extreme El Niño either(Figure 4). The hypothesis that the projected increase in extreme El Niño occurrences in the future is attributed to the El Niño-like warming pattern [10] is further supported by the inter-model statistics; models with stronger east-minus-west gradients of equatorial Pacific SST warming tended to project larger increases in extreme El Niño occurrences under RCP 8.5 forcing (Figure 6b,c), with the inter-model correlations of 0.57 and 0.51 exceeding the 0.05 and 0.01 significance levels according to the Student’s t-test, respectively.

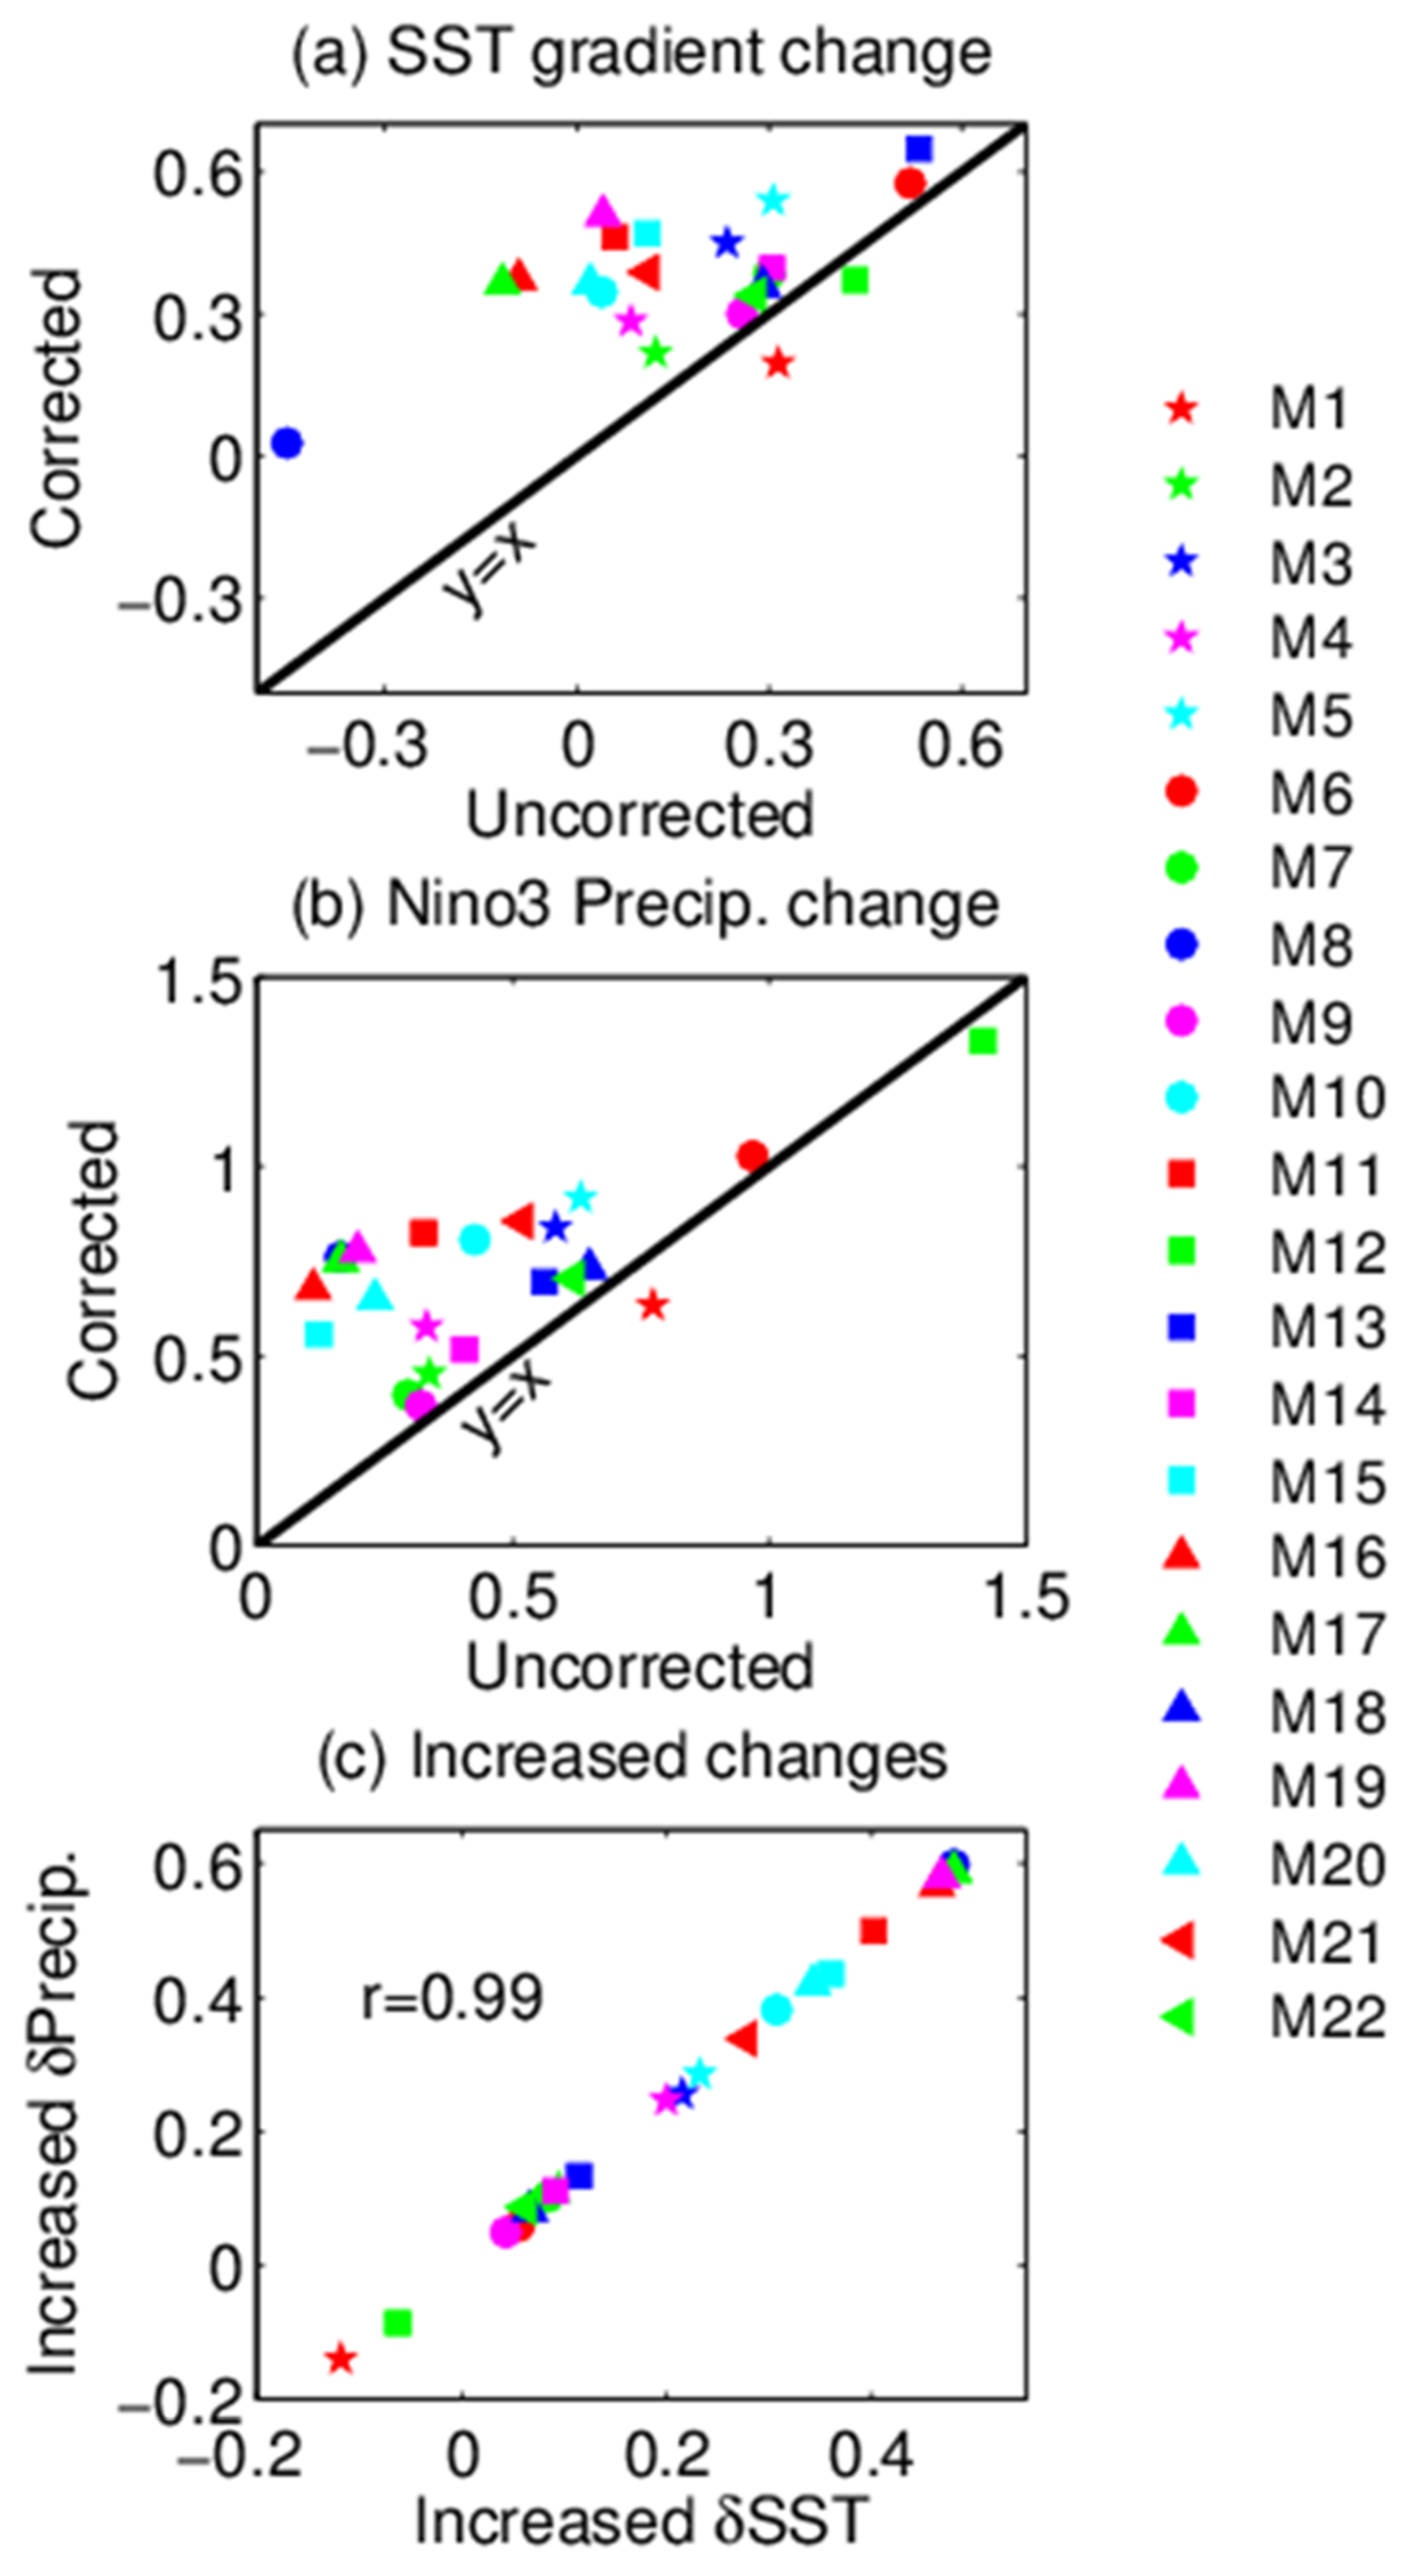
3.2. Effect of the Cold Tongue Bias on El Niño-Like Warming Pattern

However, as stated in the introduction, the current CGCMs commonly suffer from an excessive cold tongue SST error in the equatorial Pacific, along with insufficient precipitation over the equatorial western Pacific [60,65]. In particular, our previous work [70] indicated that the common cold tongue mean error and resulting underestimation in the negative SST-convective feedback over the equatorial western Pacific could transmit into the tropical Pacific future projections, leading to an underestimation for the El Niño-like responses in the mean under the increased GHG. Figure 7a shows the inter-model relationship between the projected future changes in east–west SST differences in the equatorial Pacific and the simulated present-day SSTs over the equatorial Pacific cold tongue among 22 CMIP5 models. The CGCMs with a colder Pacific cold tongue SST projected a weaker east–west SST warming gradient in the equatorial Pacific (a 0.65 inter-model correlation). Such an inter-model relationship between the projected changes in east–west SST differences in the equatorial Pacific and the underestimations of western Pacific precipitation was more evident, with a high inter-model correlation of 0.81 (Figure 7b). Both inter-model correlation coefficients exceeded the 0.001 significance level according to the Student’s t-test.
Therefore, the future projections over the tropical Pacific can be further calibrated based on an observational constraint of equatorial western Pacific precipitation (red line in Figure 7b; see Section 2.4). Compared with the uncorrected MME mean projections (Figure 6a), the corrected MME mean projections exhibited stronger El Niño-like responses under RCP 8.5 forcing (Figure 8a). Figure 8b shows the corrected-minus-uncorrected differences between MME mean projections in SST, precipitation, and surface wind stress over the tropical Pacific. Pronounced positive (negative) SST anomalies over the equatorial eastern (western) Pacific, along with positive precipitation responses over the equatorial central and eastern basin, indicate an underestimated El Niño-like warming pattern over the tropical Pacific before the corrections. At the equator, westerly wind anomalies can amplify the El Niño-like warming pattern. This relationship between wind and SST/precipitation is indicative of Bjerknes feedback.
After the corrections for the observed precipitation in the equatorial western Pacific, CMIP5 CGCMs commonly projected a stronger east–west SST warming gradient in the equatorial Pacific relative to the uncorrected models, i.e., a stronger El Niño-like response (Figure 9a). Correspondingly, the Niño3 precipitation increases in the future projections of CMIP5 CGCMs were commonly larger after the corrections (Figure 9b). The corrected Niño3 precipitation increases were strongly associated with the corrected east-minus-west SST warming gradients, with an inter-model correlation of 0.99 (Figure 9c). Overall, the excessive Pacific cold tongue error in the models could result in common underestimations of the projected El Niño-like responses in the means under increased GHG forcing.

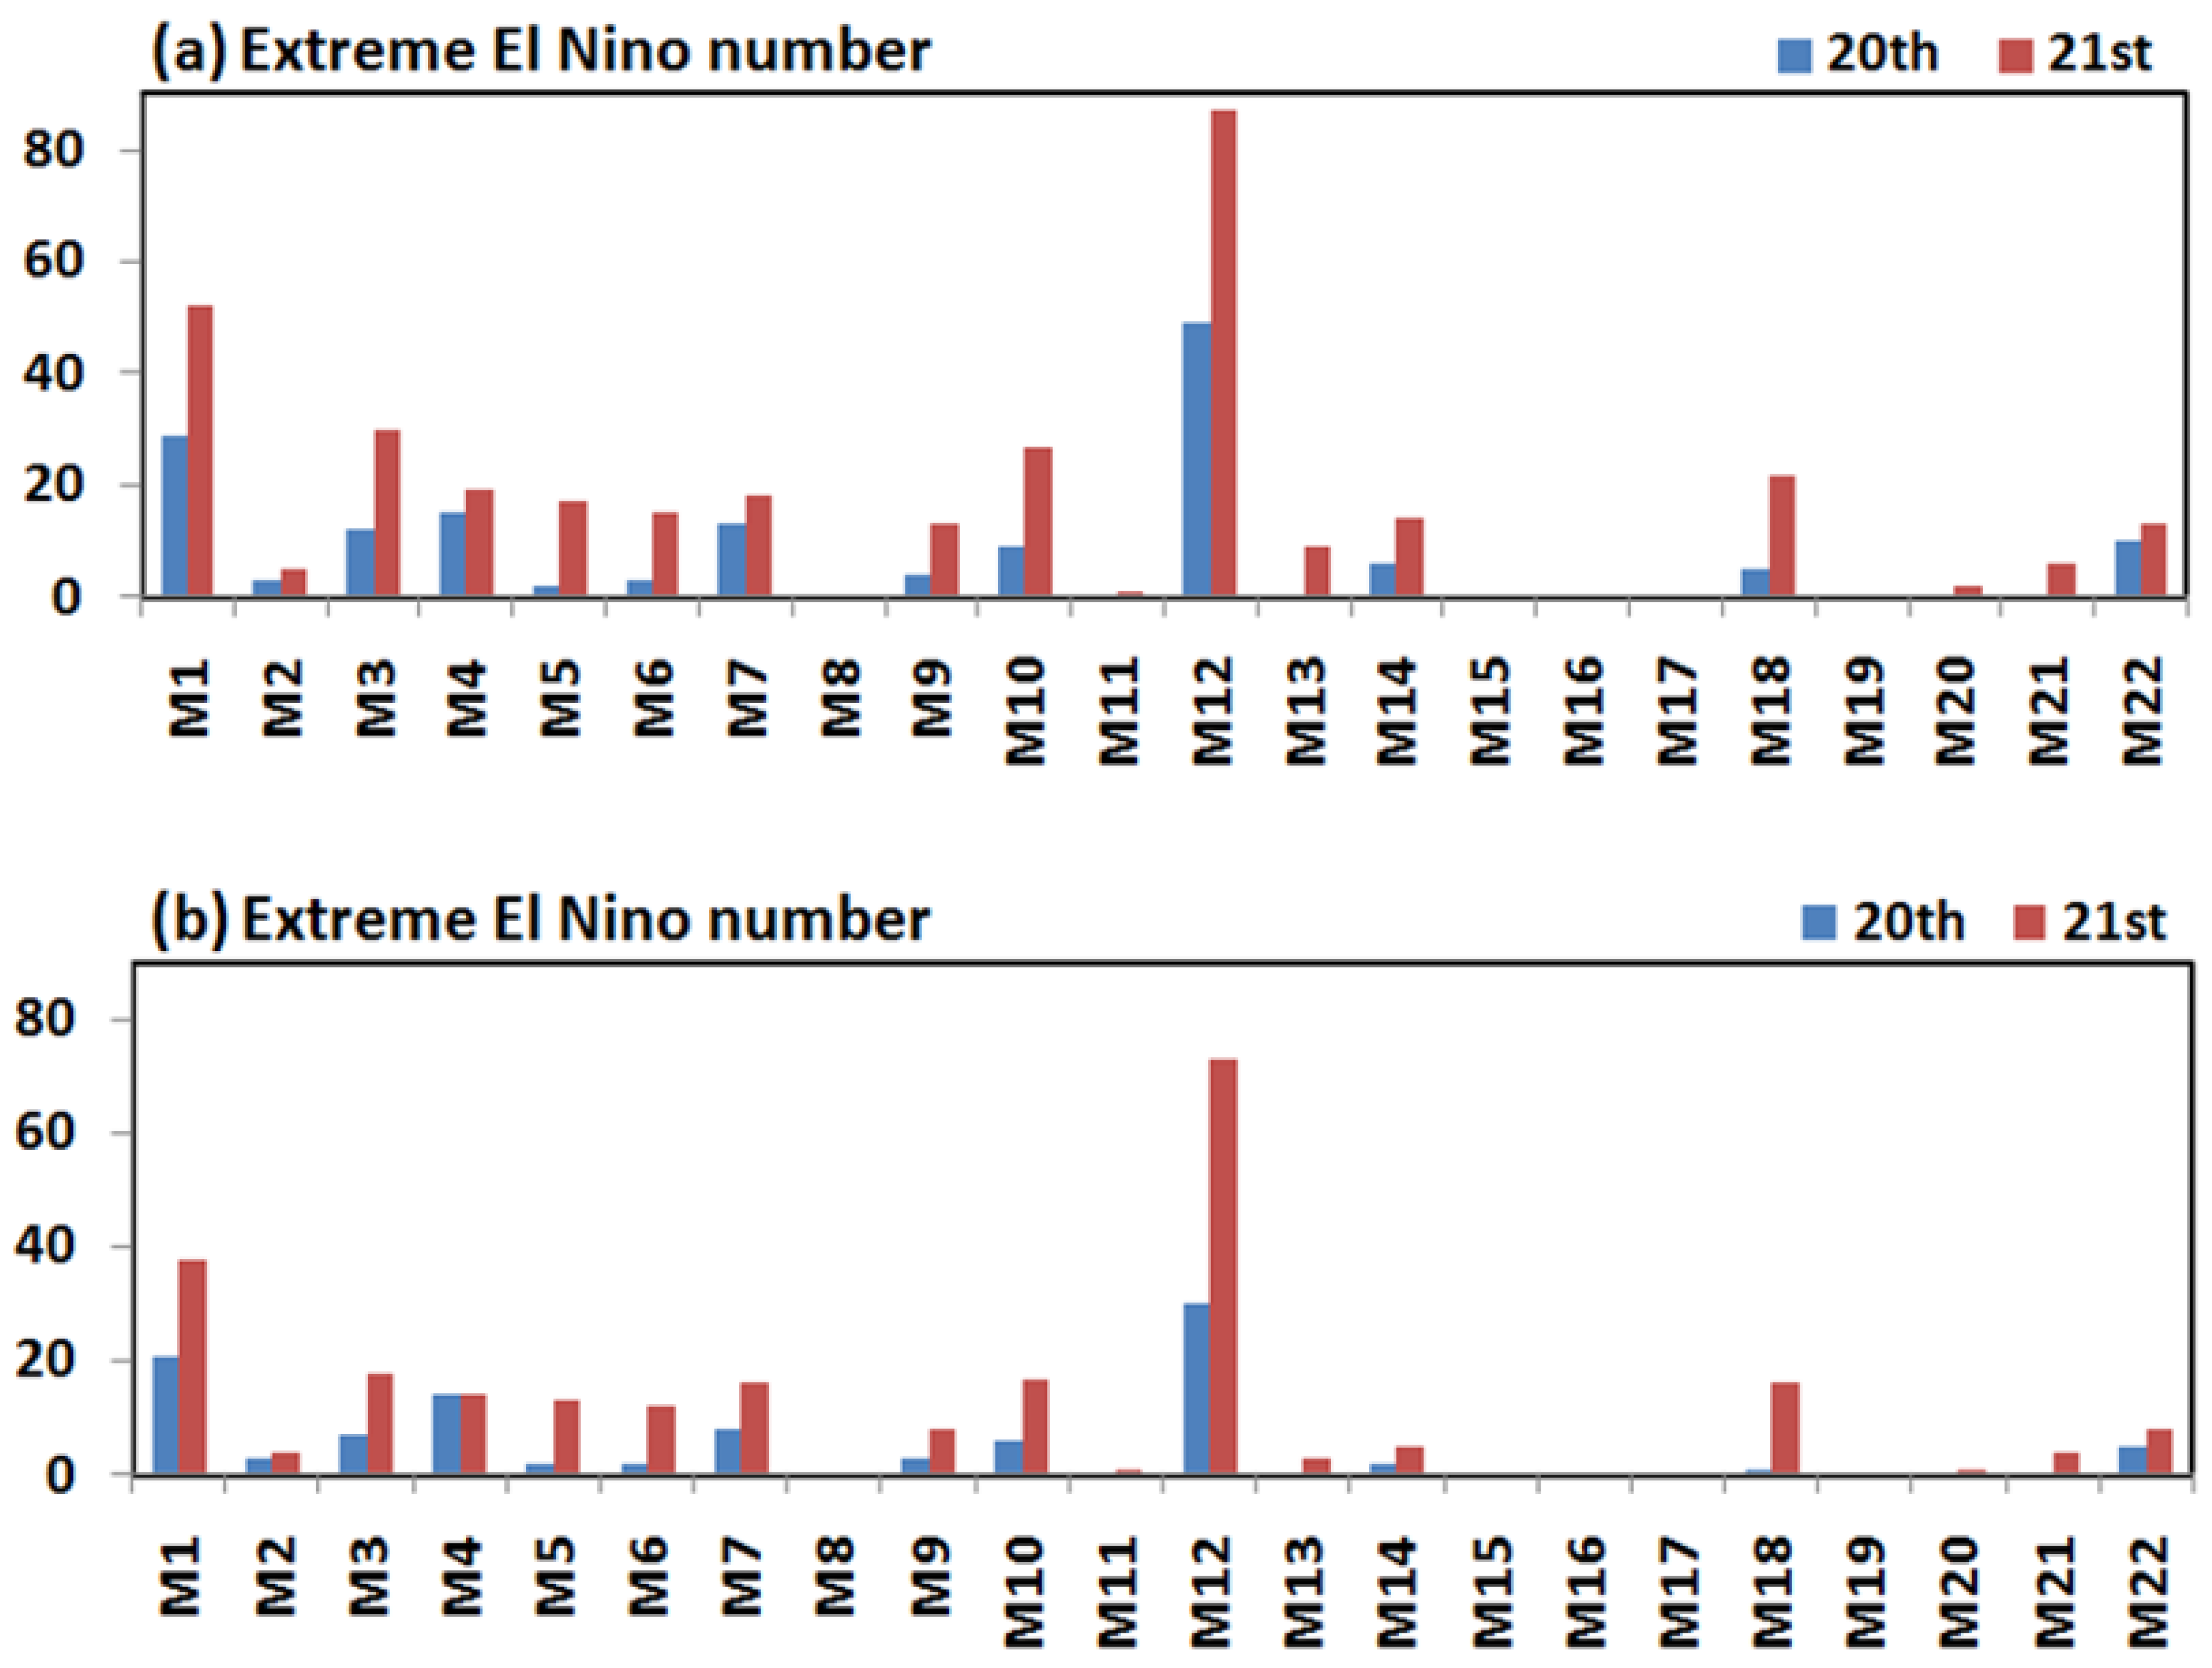
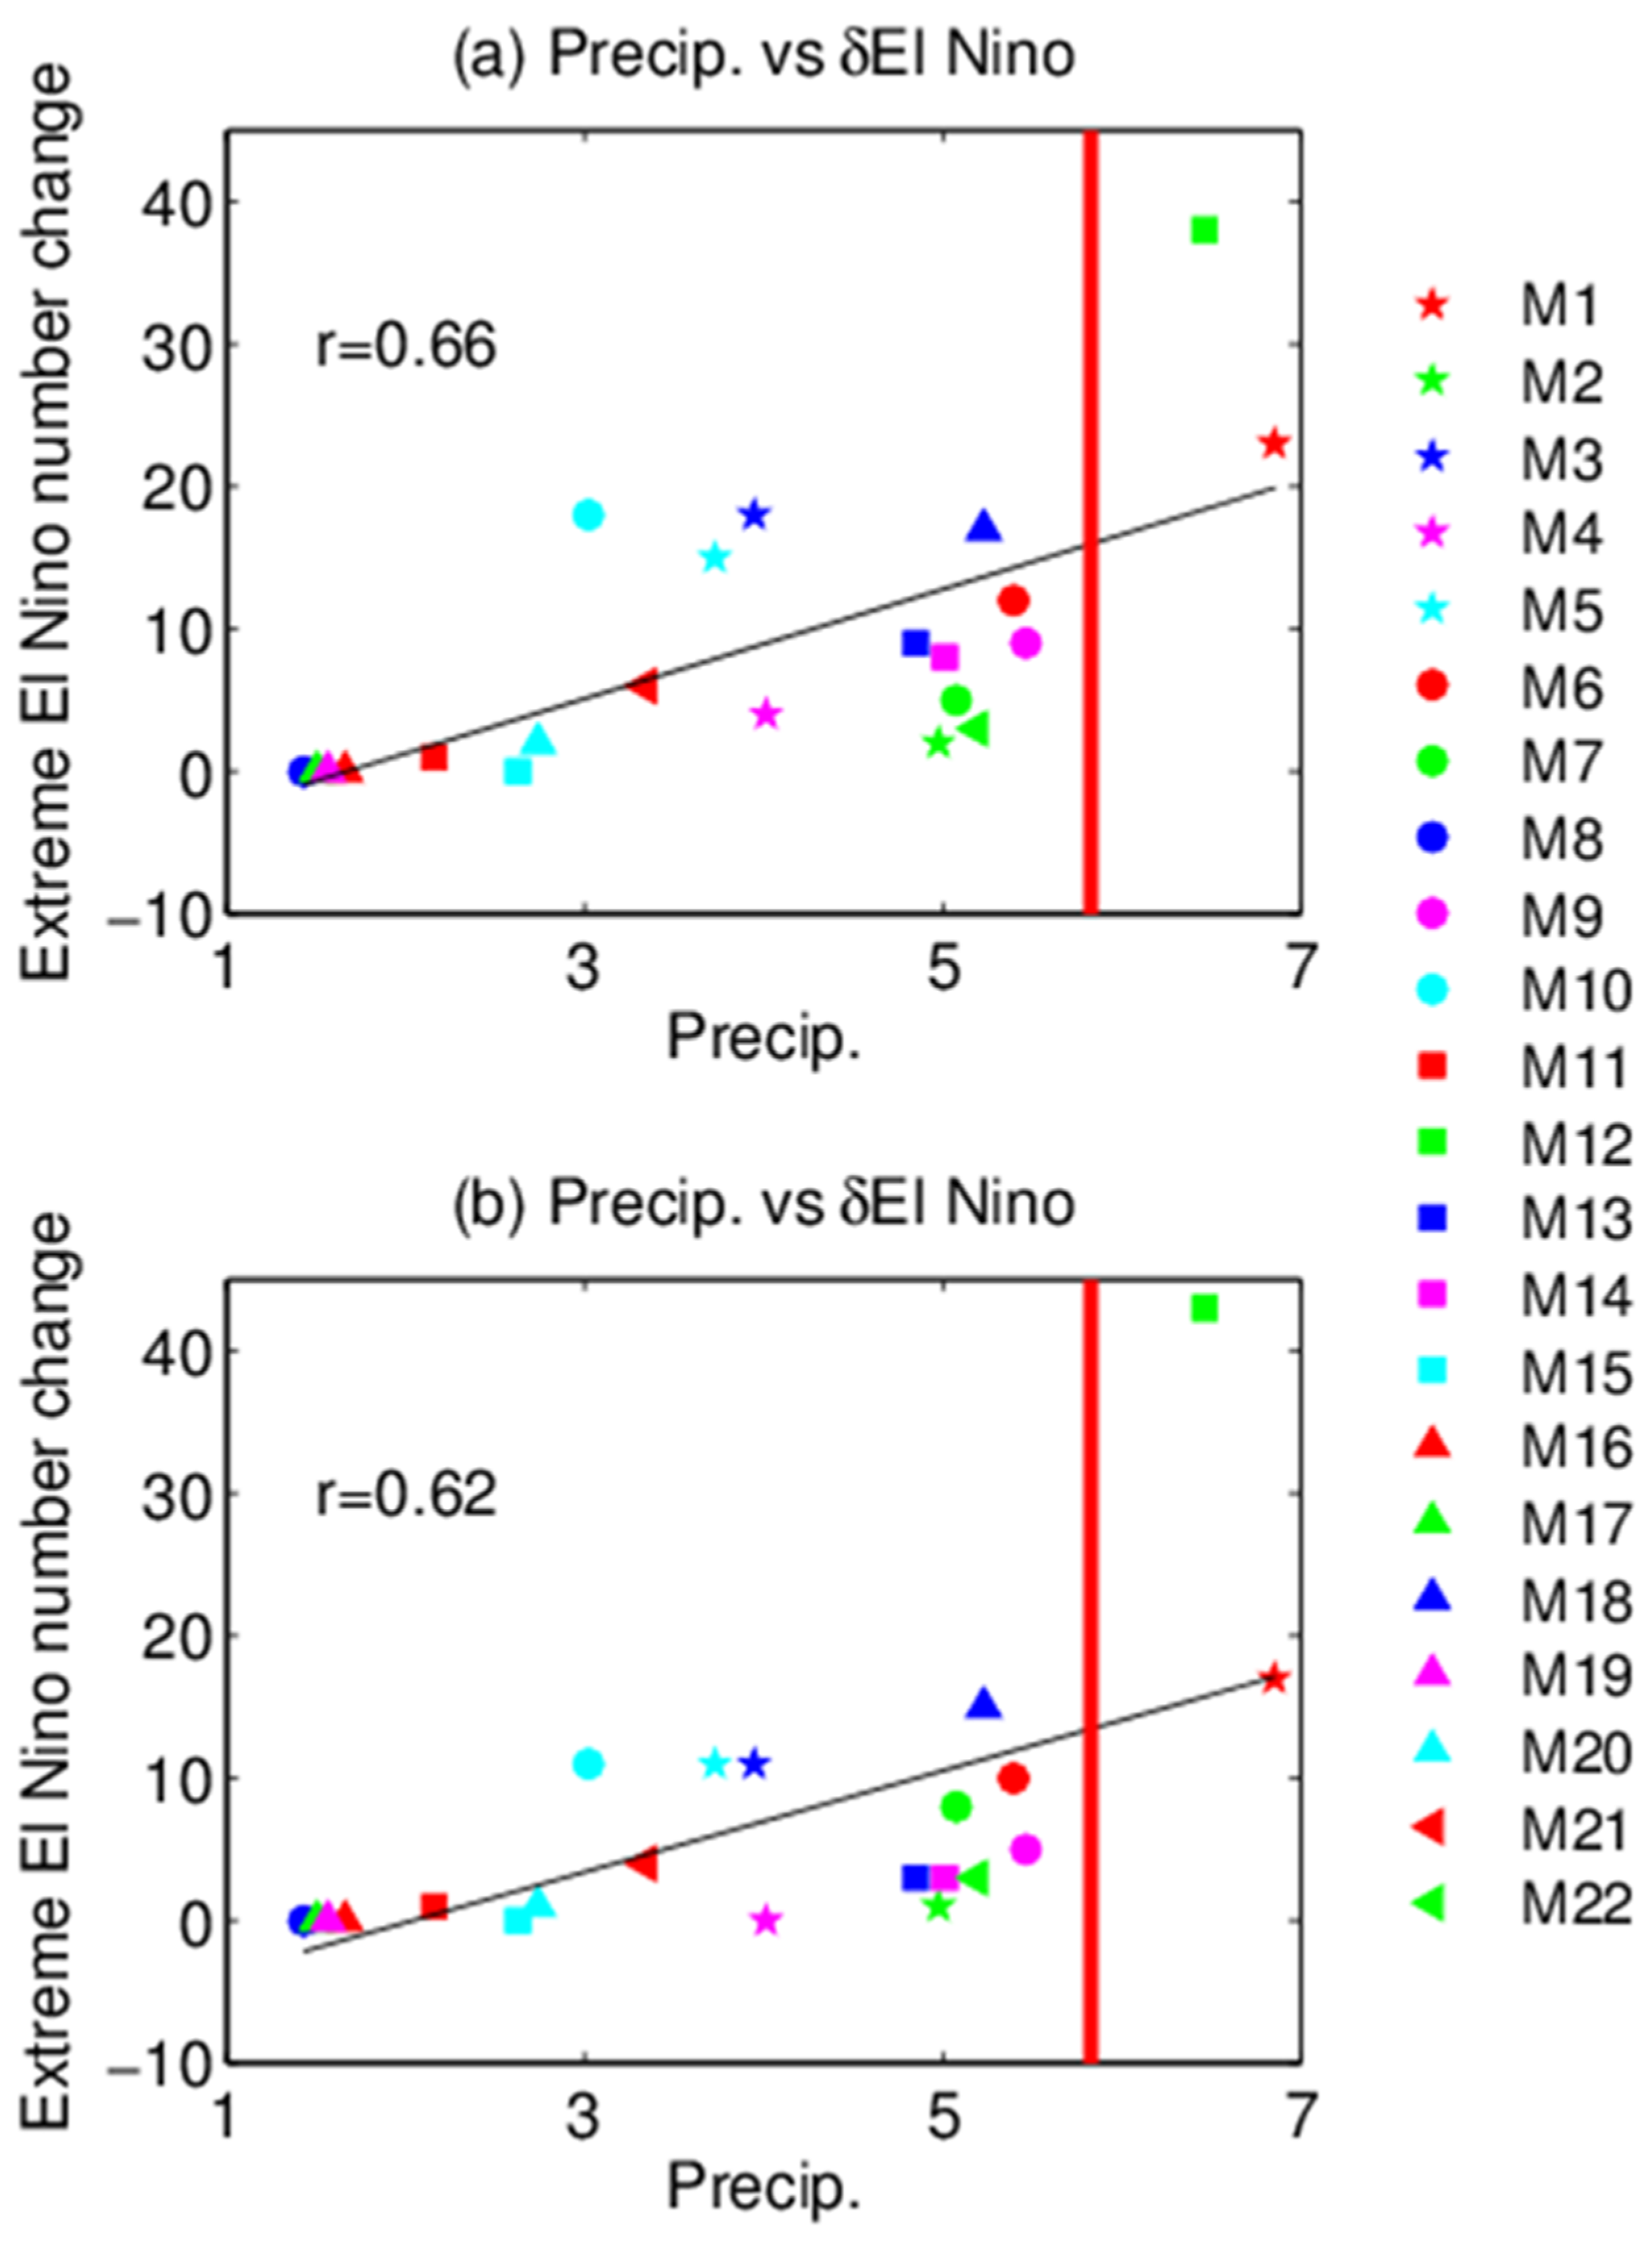
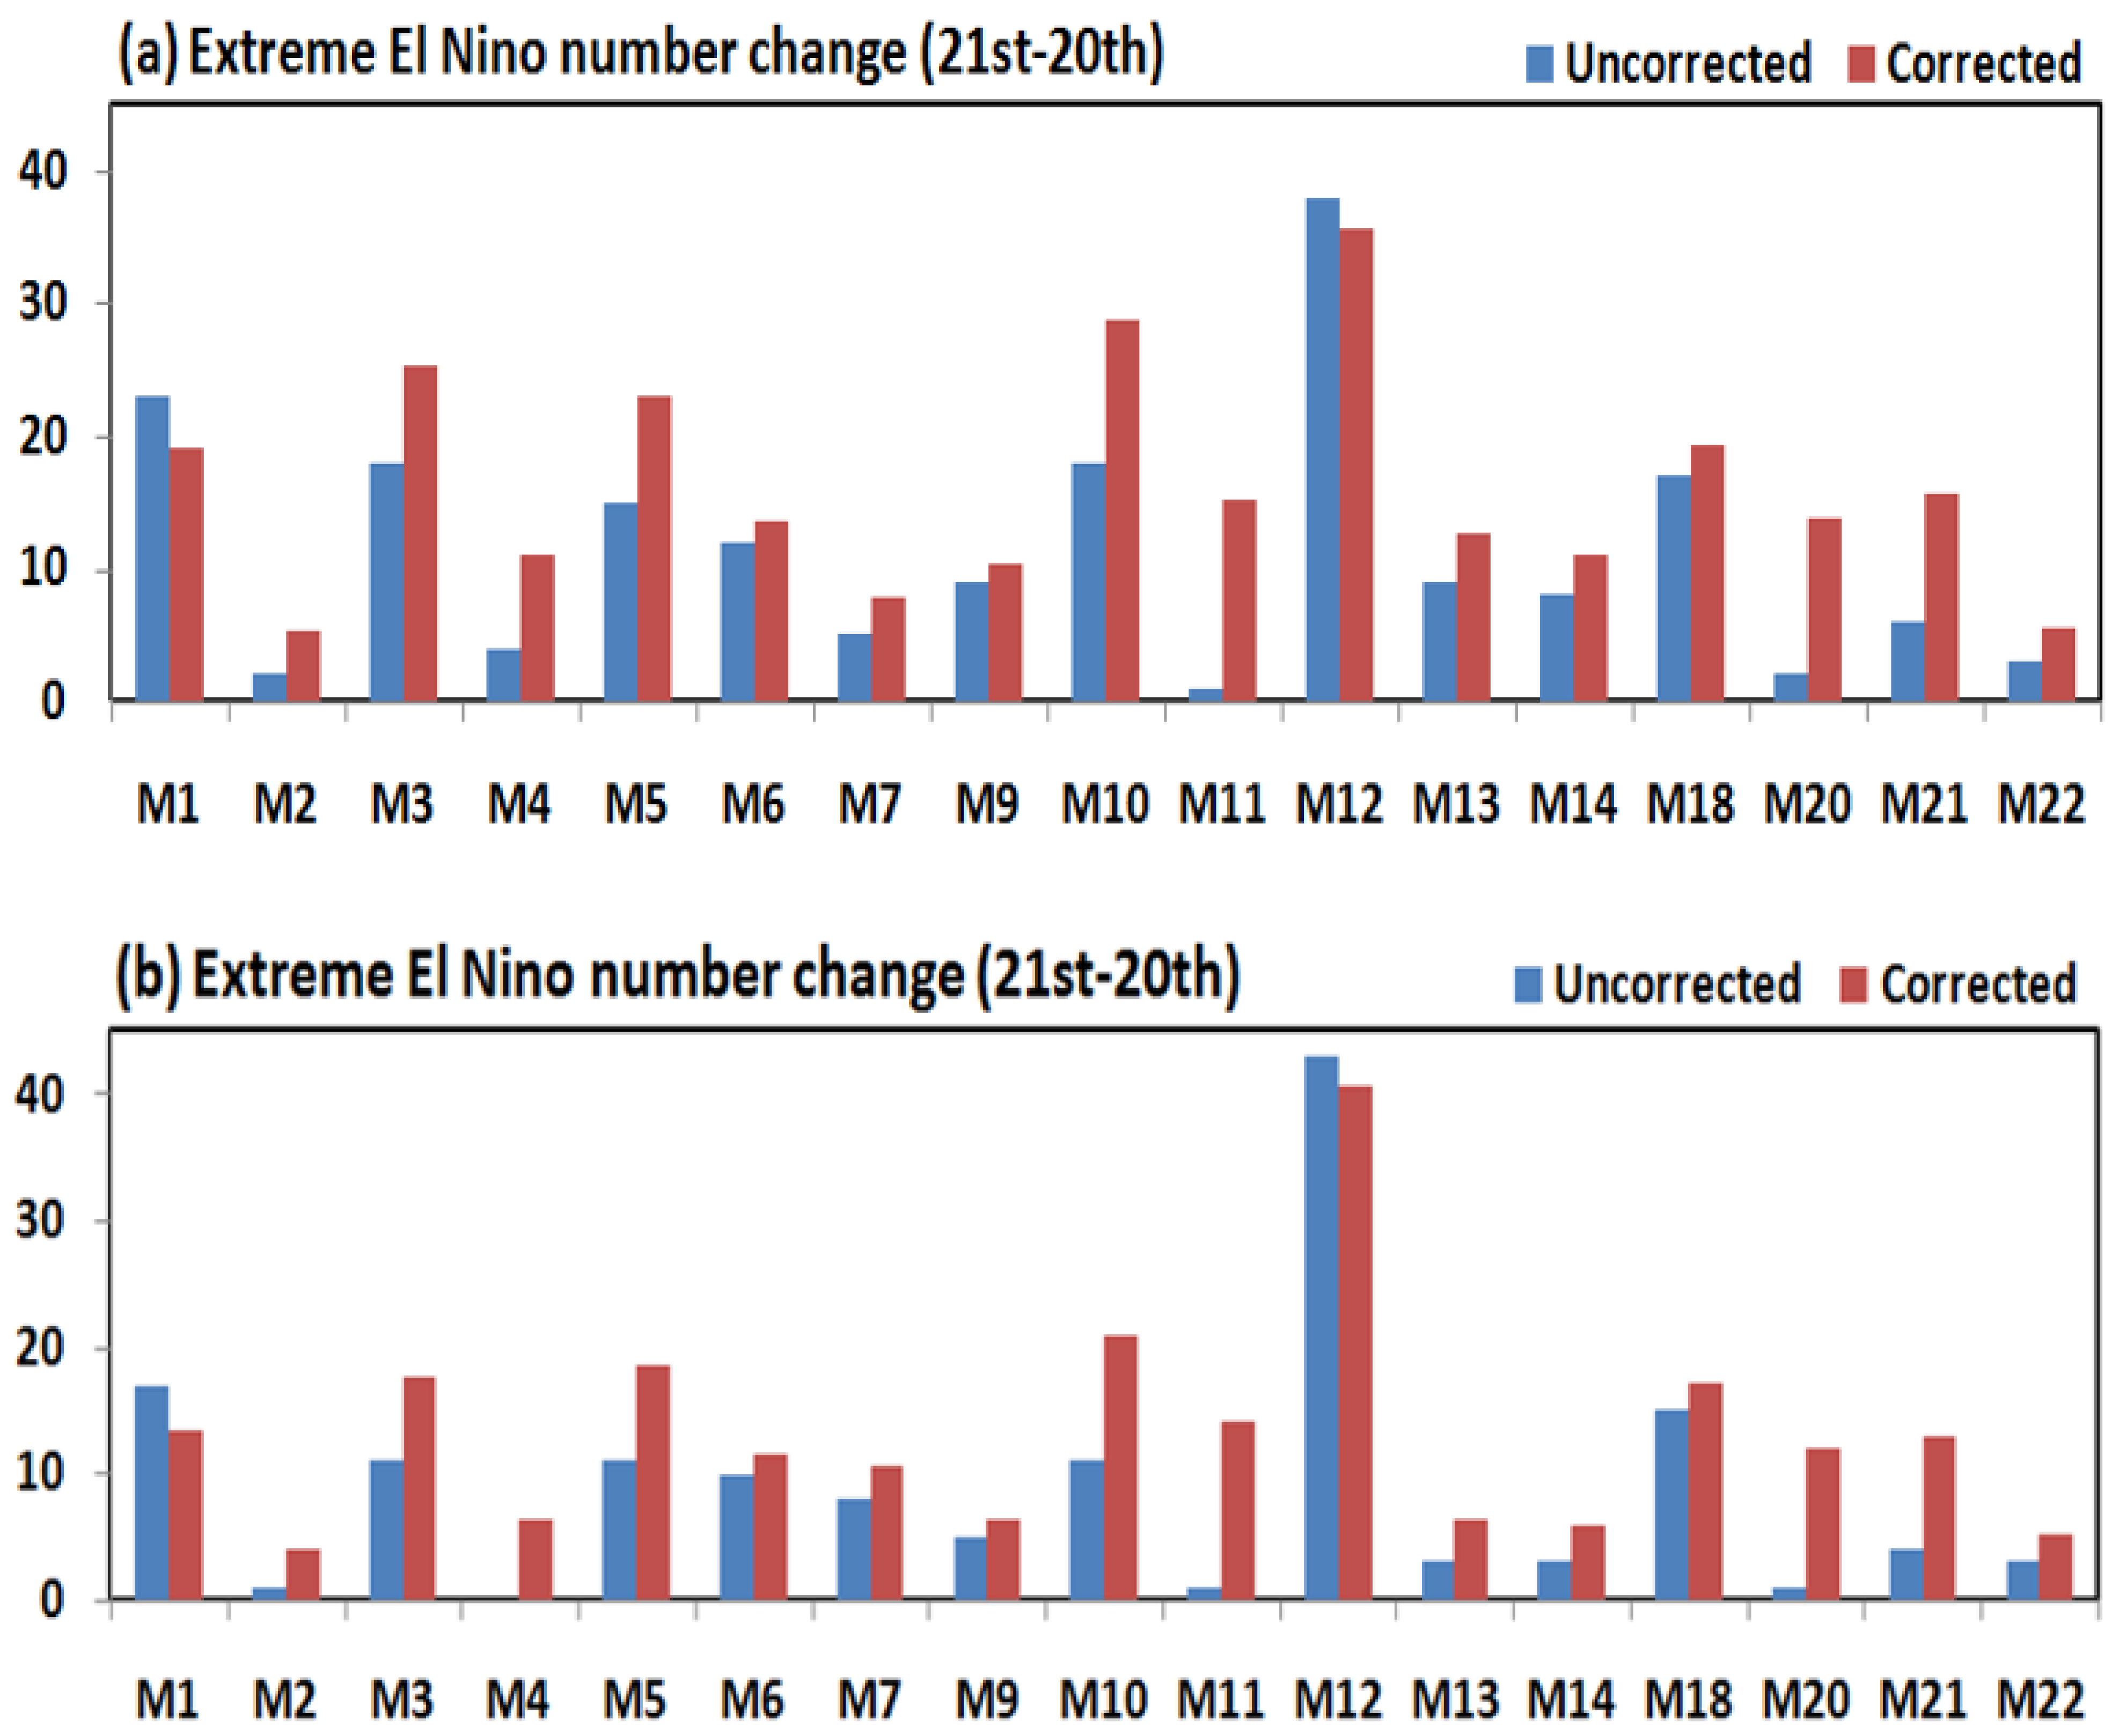
3.3. Effect of the Excessive Pacific Cold Tongue Error on Extreme El Niño Occurrences

Considering that the projected increase in extreme El Niño occurrences in the future is attributed to the El Niño-like warming pattern (Figure 6), we turn our attention to the effect of the excessive Pacific cold tongue error on the projected changes in the frequency of extreme El Niño events under global warming based on CMIP5 CGCMs. Figure 10 examines the inter-model relationships between the simulated present-day equatorial western Pacific precipitation and projected future changes in the number of extreme El Niño events between the 21st and 20th centuries. Models with insufficient equatorial western Pacific precipitation tended to have a lower future increase in the number of extreme El Niño events. When an extreme El Niño event was defined when Niño3 DJF precipitation was greater than 5 mm/day, the inter-model correlation was 0.66 (Figure 10a), exceeding the 0.001 significance level according to the Student’s t-test. In other words, excessive equatorial Pacific cold tongue bias in GCCMs could result in a common underestimation of the projected increase in the occurrence of extreme El Niño events under increased GHG forcing.
Using an observational constraint of the western Pacific precipitation, the models commonly projected a larger increase in the number of extreme El Niño occurrences (Figure 11). The projected increased occurrence of extreme El Niño events due to global warming was underestimated by about 30% (35%) in the multi-model ensemble before the corrections when Niño3 DJF precipitation exceeding 5 mm/day (6 mm/day) was defined as an extreme El Niño event.

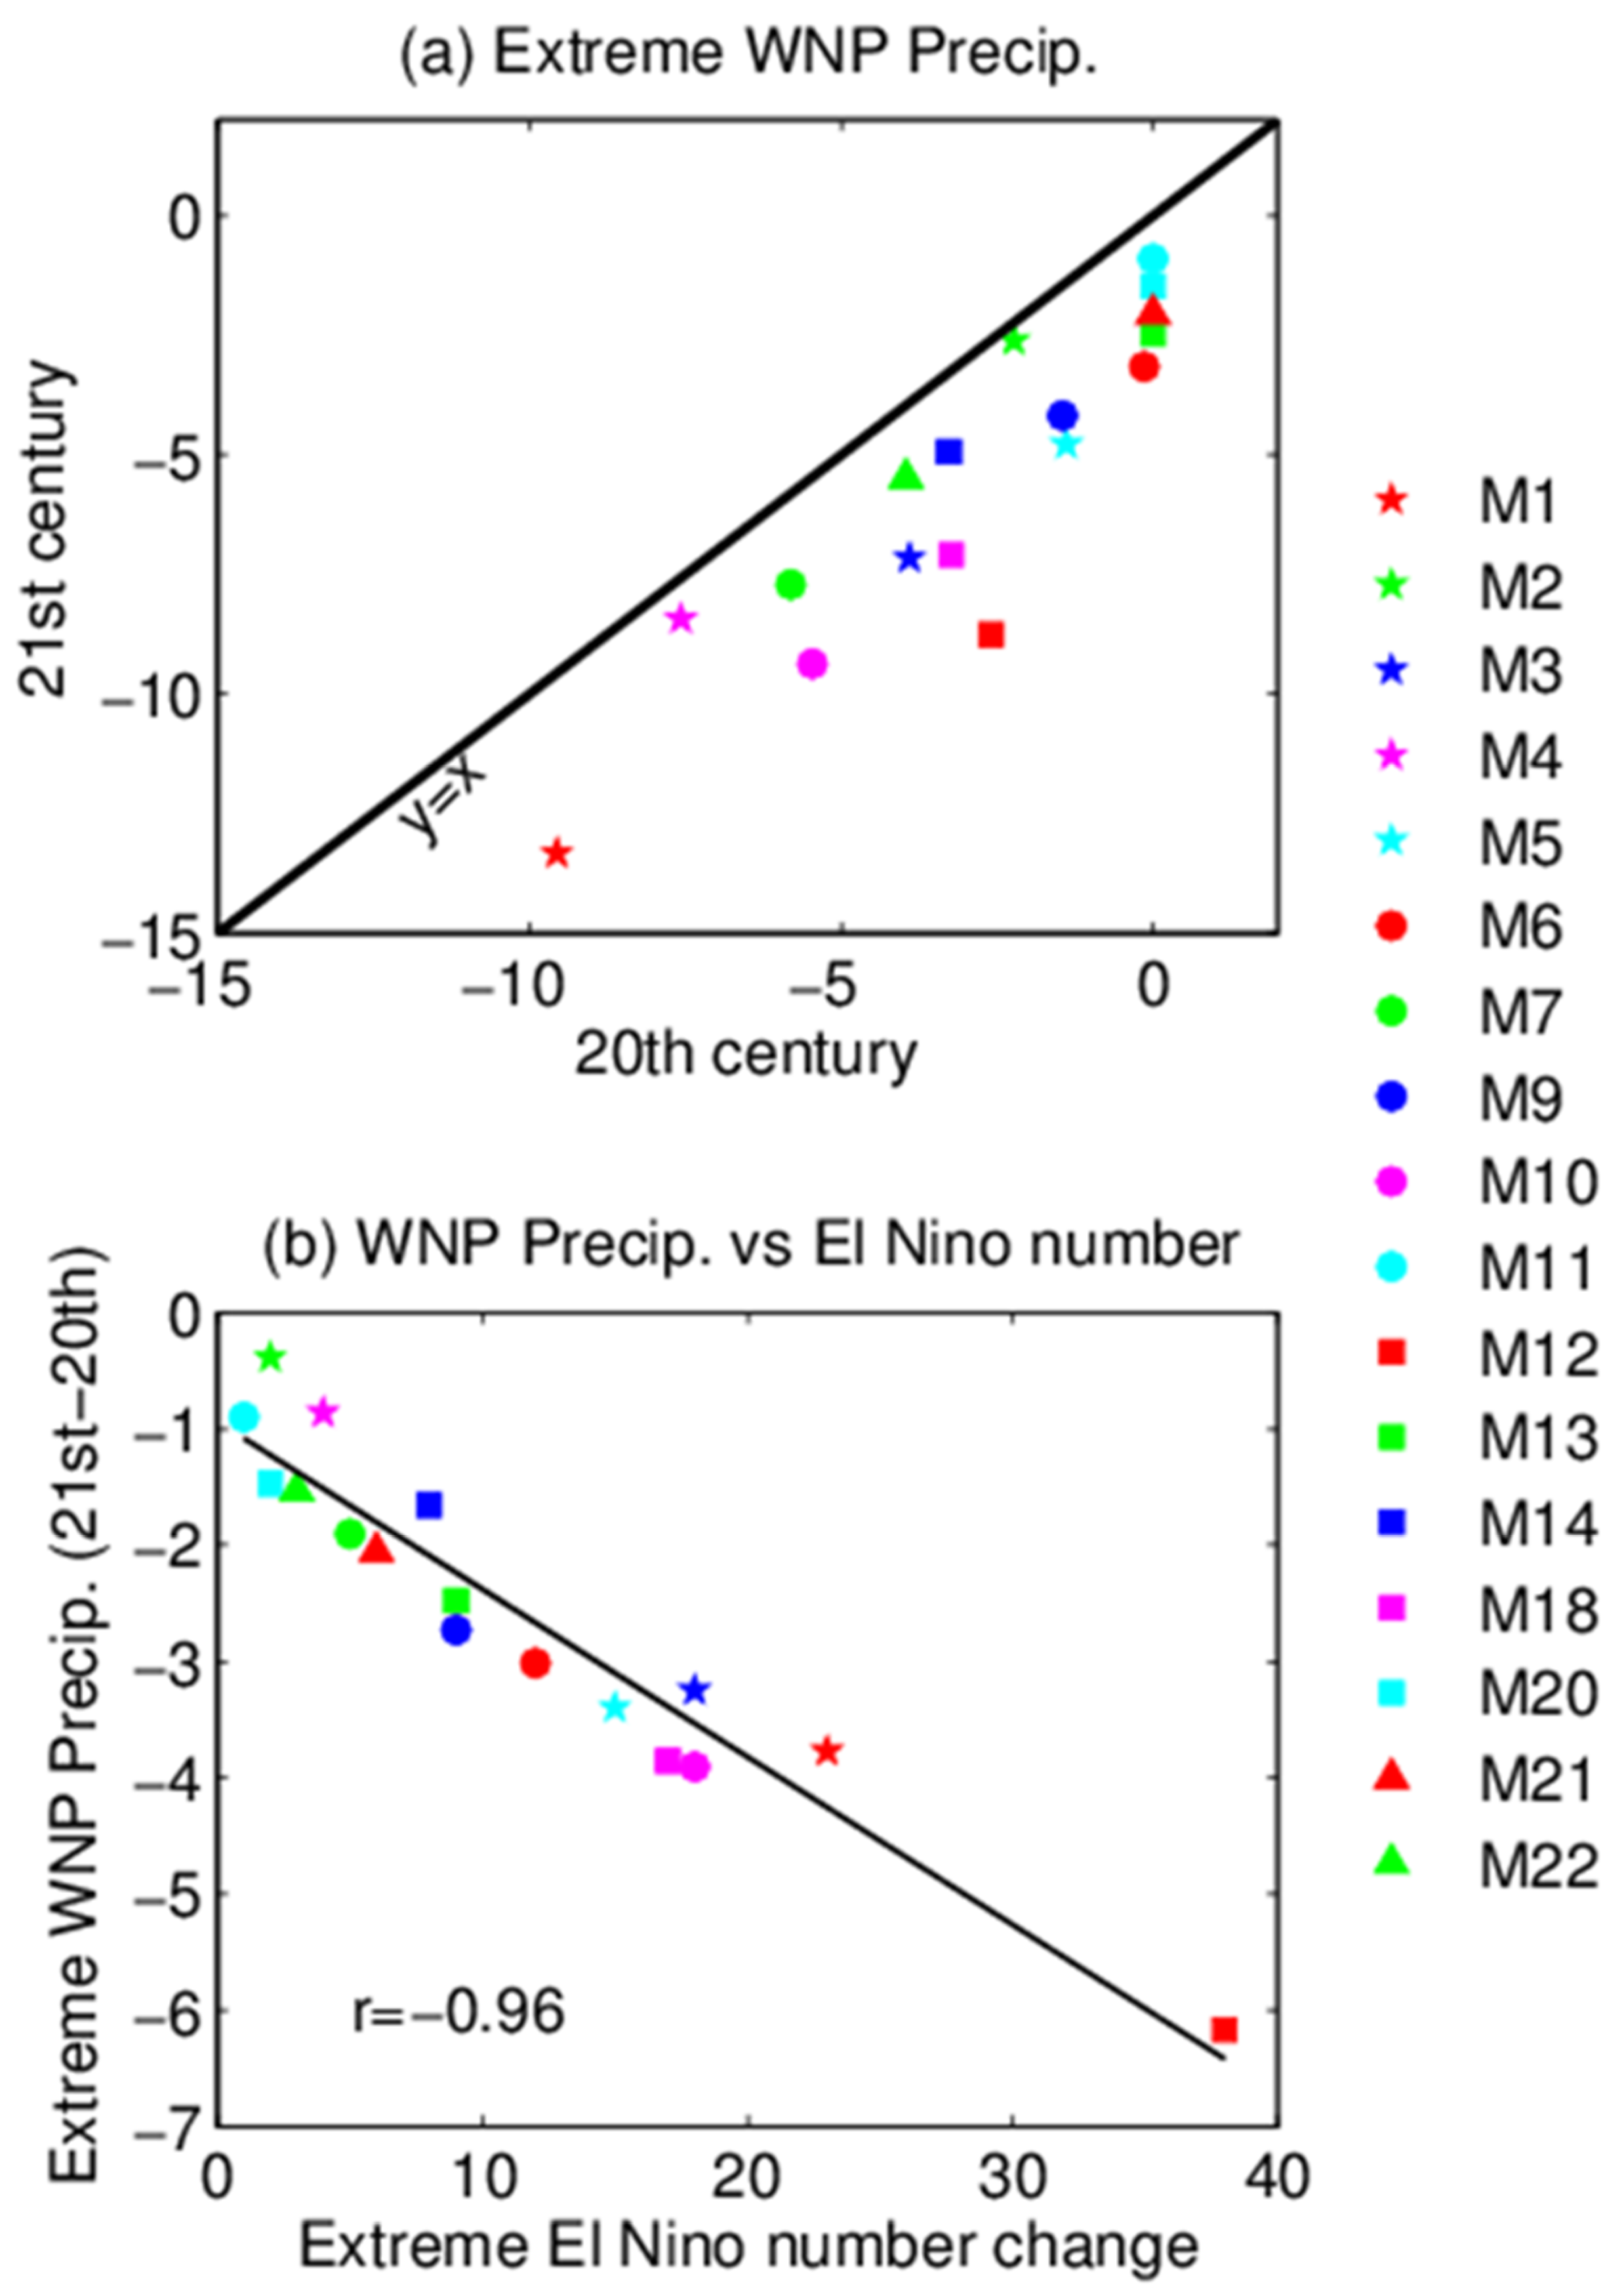
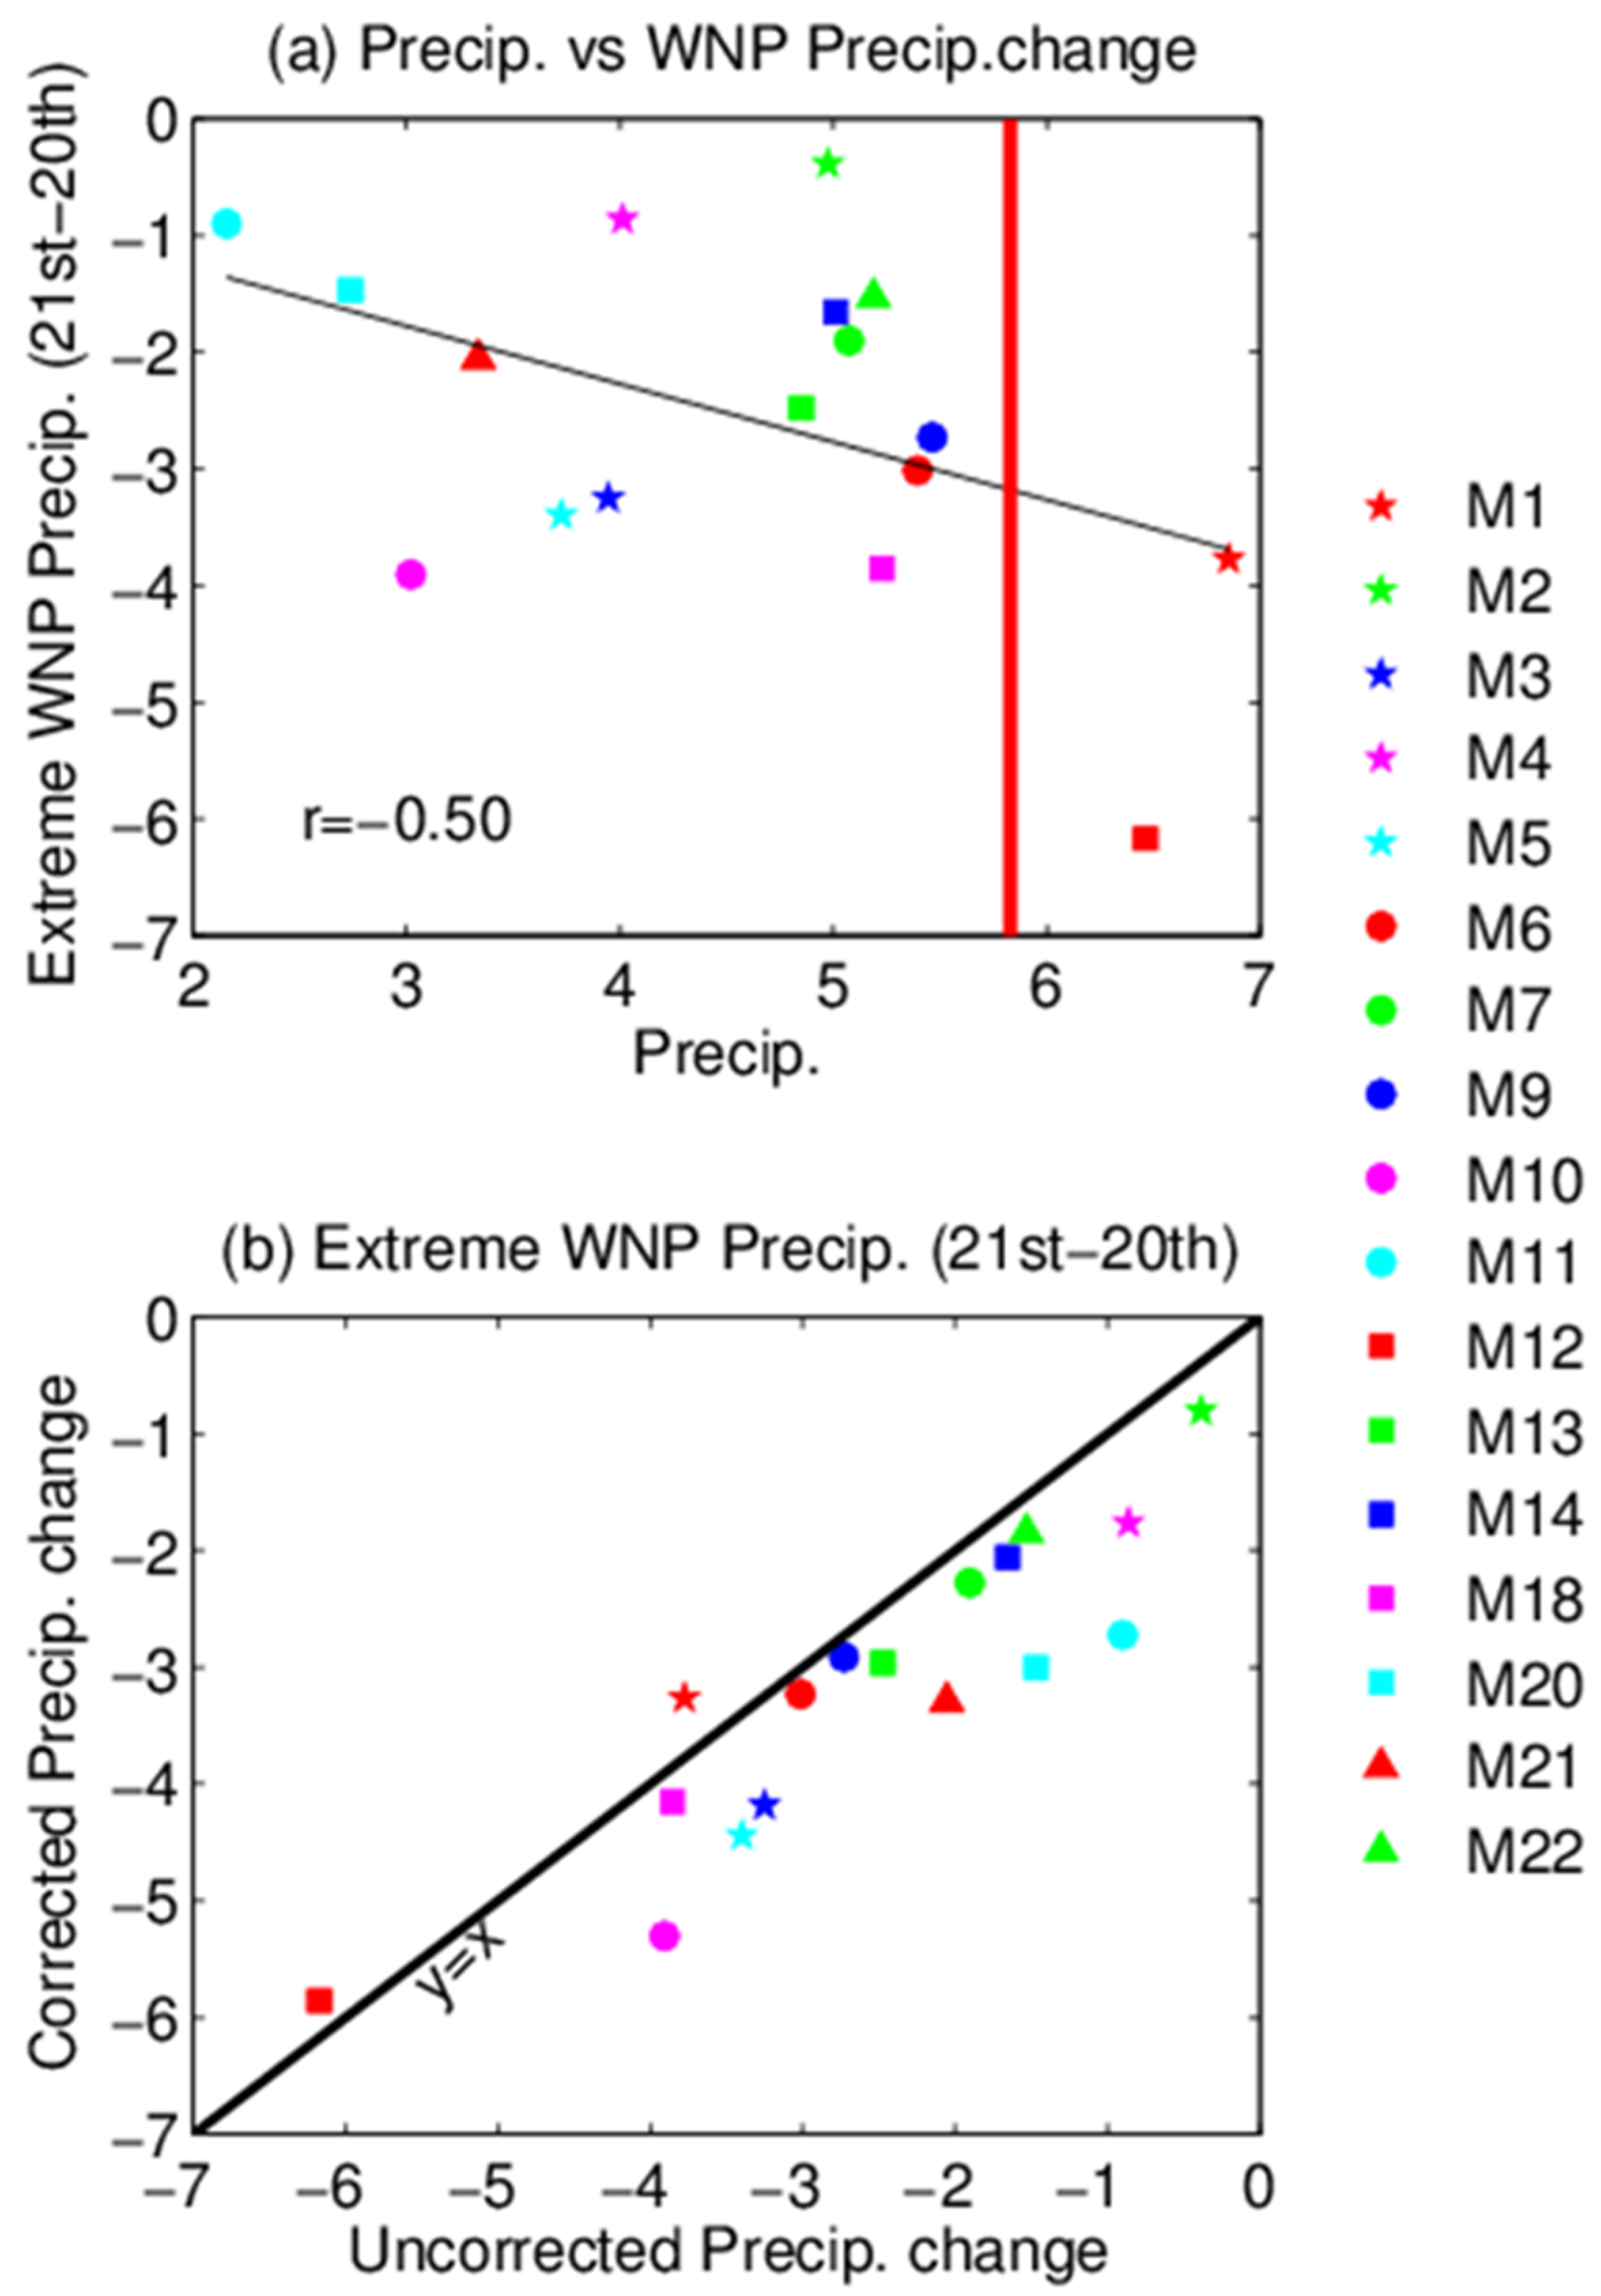
3.4. Uncorrected vs. Corrected WNP Precipitation Changes

Extreme El Niño warming can force an anomalous anticyclonic circulation and precipitation decrease in the WNP (Figure 2b), which could in turn convey widespread climatic impacts to East Asia from the winter to the ensuing summer of an El Niño [22,82,83,84,85,86]. Figure 12a compares the wet anomalies over the WNP caused by extreme El Niño events between 20th and 21st centuries among CMIP5 CGCMs. The CMIP5 CGCMs consistently projected enhanced precipitation decreases over the WNP from the 20th to 21st century under increased GHG forcing. Moreover, the enhanced wet anomalies over the WNP followed the projected increased occurrence of extreme El Niño events, with a very high inter-model correlation of 0.96 (Figure 12b). This implies a more frequent repetition of extreme El Niño impacts on the WNP/East Asian climate.
Similar to the correction of projected changes in extreme El Niño occurrence (Figure 10), the inter-model relationship between the simulated present-day precipitation in the equatorial western Pacific and the projected future changes in WNP precipitation anomalies caused by extreme El Niño events under RCP 8.5 forcing among CMIP5 CGCMs was identified (Figure 13a). Models with insufficient equatorial western Pacific precipitation tended to project less extreme precipitation anomalies over the WNP under RCP 8.5 forcing, with an inter-model correlation of −0.50 exceeding the 0.05 significance level according to the Student’s t-test. After the corrections, CMIP5 CGCMs commonly projected stronger extreme precipitation anomalies over the WNP (Figure 13b), implying a more active effect of extreme El Niño events on the WNP/East Asian climate in the future.

4. Conclusions

In response to global warming forcing, climate models tend to project an El Niño-like warming pattern (Figure 6a) [54]. Such mean state changes cause an increase in projected future extreme El Niño event frequency (Figure 6b,c) [10], implying an increasing risk for the weather and climate disasters in regions/countries affected by extreme El Niño events, including catastrophic droughts and wildfires in Indonesia and its surrounding countries and devastating floods in eastern equatorial regions and northern Peru [35,36,38]. These climate responses to increased GHG forcing are common in CMIP5 CGCMs.
We noticed that these projections do not take into account the potential effects of climate model errors. The equatorial Pacific cold tongue error remains an outstanding bias in climate models [60,65]. Climate models commonly simulate SSTs that are too cool and insufficient equatorial western Pacific precipitation. The insufficient precipitation error in the western Pacific could result in a common underestimation of the projected El Niño-like responses under GHG forcing in CMIP5 CGCMs (Figure 7b) [70]. Therefore, we calibrated the projected SST warming pattern over the tropical Pacific based on an observational constraint of equatorial western Pacific precipitation. The correction showed that CMIP5 CGCMs commonly underestimate the El Niño-like response pattern to increased GHG forcing, with a multi-model ensemble (MME) mean increase in the corrected east–west SST warming gradient along the equatorial Pacific of a factor of 2.3 compared with the uncorrected model. Conceivably, the common excessive cold tongue error and resulting underestimation in the projected mean El Niño-like future response in CGCMs could also transmit into the projected frequency change in extreme El Niño events. This study further indicated that underestimated El Niño-like responses could also lead to a common underestimation of the increased frequency of extreme El Niño events projected by CMIP5 CGCMs. In other words, CGCMs with a larger cold tongue bias tended to have a weaker El Niño-like warming, resulting in a smaller increase in extreme El Niño frequency in response to increased GHG forcing. After the corrections with the observed equatorial western Pacific precipitation (Figure 10; also see Section 2.4), we found that the projected increased occurrence of extreme El Niño events under RCP 8.5 forcing were underestimated by 30–35% in the CMIP5 multi-model ensemble before the corrections (Figure 11).

5. Discussion

With a larger increase in extreme El Niño occurrences after the corrections, we should remain vigilant for the potentially increased occurrence of weather and climate disasters in the future in regions/countries affected by extreme El Niño events. In particular, the anomalous anticyclonic circulation and extreme precipitation decrease over the WNP may appear more frequently in the future than we expected before, which will have noticeable implications for the 21st-century climate in East Asia [22,82,86], where a quarter of the world’s population lives.
Our correction method, called “emergent/observational constraints,” was suggested to deal with the effects of model errors on future climate projections by deriving relationships between observable quantities in the present climate and projected responses of Earth’s climate system to global warming forcing in a multi-model ensemble to constrain future climate responses. In essence, emergent/observational constraints are based on an assumption that projected future climate responses of one variable can strongly depend on the model’s present-day state [70,77,78,79,80,81]. This approach requires a strong relationship between the model’s present-day state and the projected future climate responses. In locations where the climate response is uncorrelated with the present-day state (e.g., a(s) = 0 in Equation (3)), this method effectively reverts to an ensemble mean approach. In this study, the identified present–future relationships were statistically significant. In the approach, there is also a risk that the present –future relationship is an artifact of climate models. In our case, however, the identified present–future relationships were consistent with our understanding of El Niño dynamics. Thus, the corrections in this study are physically credible.
Climate models are becoming widely used for global climate projections. There are, however, still large biases in the mean state simulation, e.g., the excessive equatorial Pacific cold tongue [65] and double intertropical convergence zone (ITCZ) [60,65,87] problems, despite continued efforts of model developers to reduce biases. On the basis of our previous study [70], this study further highlights the importance of reducing the cold tongue error for improving the tropical Pacific future projections. On the other hand, it might be also important to evaluate and correct the effects of other tropical biases in the mean (e.g., the double ITCZ problem) on regional climate projections, as the coupled ocean–atmosphere feedbacks dominating tropical climate projections are very sensitive to the simulated mean state of the ocean–atmosphere system [53,54,55,56,88]. A previous study [89] suggested that the double ITCZ problem may result in an overestimation (underestimation) of the projected precipitation increase south (north) of the equatorial eastern Pacific under increased GHG forcing, illustrating the importance of a realistic mean state simulation for reliable regional future climate projections.

Author Contributions

Conceptualization, G.L.; Formal analysis, G.L.; Investigation, G.L., Z.Z. and B.L.; Writing—original draft, G.L.; Writing—review & editing, G.L., Z.Z. and B.L. All authors have read and agreed to the published version of the manuscript.

Funding

This research was funded by the Natural Science Foundation of China (41975097 and 41831175), the Fundamental Research Funds for the Central Universities (B210201015 and B200202138), the National Key Research and Development Program of China (2018YFC1506002), and the Open fund of State Key Laboratory of Loess and Quaternary Geology (520013212).

Institutional Review Board Statement

Not applicable.

Informed Consent Statement

Not applicable.

Data Availability Statement

The datasets used in this study are publicly available online.

Acknowledgments

The authors acknowledge the climate modeling groups (Table 1) for producing and making available their model output, the WCRP’s Working Group on Coupled Modeling (WGCM) for organizing the CMIP5 analysis activity, the Program for Climate Model Diagnostics and Intercomparison (PCMDI) for collecting and archiving the CMIP5 multi-model data, and the Office of Science, U.S. Department of Energy for supporting these datasets in partnership with the Global Organization for Earth System Science Portals.

Conflicts of Interest

The authors declare no conflict of interest.

References

  1. Bjerknes, J. Atmospheric teleconnections from the equatorial Pacific. Mon. Weather. Rev. 1969, 97, 163–172. [Google Scholar] [CrossRef]
  2. Rasmusson, E.; Carpenter, T. Variations in tropical sea surface temperature and surface wind fields associated with the Southern Oscillation/El Niño. Mon. Weather Rev. 1982, 110, 354–384. [Google Scholar] [CrossRef]
  3. Zebiak, S.E.; Cane, M.A. A model El Niño–Southern Oscillation. Mon. Weather Rev. 1987, 115, 2262–2278. [Google Scholar] [CrossRef] [Green Version]
  4. Suarez, M.J.; Schopf, P.S. A delayed action oscillator for ENSO. J. Atmos. Sci. 1988, 45, 3283–3287. [Google Scholar] [CrossRef]
  5. Lau, N.C.; Nath, M.J. The role of the “atmospheric bridge” in linking tropical Pacific ENSO events to extratropical SST anomalies. J. Clim. 1996, 9, 2036–2057. [Google Scholar] [CrossRef]
  6. Jin, F.F. An equatorial recharge paradigm for ENSO. Part I: Conceptual model. J. Atmos. Sci. 1997, 54, 811–829. [Google Scholar] [CrossRef]
  7. Dai, A.; Wigley, T.M.L. Global patterns of ENSO-induced precipitation. Geophys. Res. Lett. 2000, 27, 1283–1286. [Google Scholar] [CrossRef] [Green Version]
  8. McPhaden, M.J.; Zebiak, S.E.; Glantz, M.H. ENSO as an integrating concept in earth science. Science 2006, 314, 1739–1745. [Google Scholar] [CrossRef] [Green Version]
  9. Guilyardi, E.; Wittenberg, A.; Fedorov, A.; Collins, M.; Wang, C.Z.; Capotondi, A.; van Oldenborgh, G.J.; Stockdale, T. Understanding El Niño in ocean-atmosphere general circulation models: Progress and challenges. Bull. Am. Meteorol. Soc. 2009, 90, 325–340. [Google Scholar] [CrossRef]
  10. Cai, W.; Santoso, A.; Wang, G.; Yeh, S.-W.; An, S.-I.; Cobb, K.M.; Collins, M.; Guilyardi, E.; Jin, F.-F.; Kug, J.-S.; et al. Increasing frequency of extreme El Niño events due to greenhouse warming. Nat. Clim. Chang. 2014, 4, 111–116. [Google Scholar] [CrossRef] [Green Version]
  11. Li, G.; Xie, S.-P.; He, C.; Chen, Z. Western Pacific emergent constraint lowers projected increase in Indian summer monsoon rainfall. Nat. Clim. Chang. 2017, 7, 708–712. [Google Scholar] [CrossRef]
  12. Wu, R.; Chen, J.; Chen, W. Different types of ENSO influences on the Indian summer monsoon variability. J. Clim. 2012, 25, 903–920. [Google Scholar] [CrossRef]
  13. Webster, P.J.; Yang, S. Monsoon and ENSO: Selectively interactive systems. Q. J. R. Meteorol. Soc. 1992, 118, 877–926. [Google Scholar] [CrossRef]
  14. Wang, Z.; Li, G.; Yang, S. Origin of Indian summer monsoon rainfall biases in CMIP5 multimodel ensemble. Clim. Dyn. 2018, 51, 755–768. [Google Scholar] [CrossRef]
  15. Kumar, K.K.; Rajagopalan, B.; Cane, M.A. On the weakening relationship between the Indian monsoon and ENSO. Science 1999, 284, 2156–2159. [Google Scholar] [CrossRef] [PubMed] [Green Version]
  16. Zou, Y.; Yu, J.-Y.; Lee, T.; Lu, M.-M.; Kim, S.T. CMIP5 model simulations of the impacts of the two types of El Niño on the U.S. winter temperature. J. Geophys. Res. Atmos. 2014, 119, 3076–3092. [Google Scholar] [CrossRef] [Green Version]
  17. Larkin, N.K.; Harrison, D.E. On the definition of El Niño and associated seasonal average US weather anomalies. Geophys. Res. Lett. 2005, 32, L13705. [Google Scholar] [CrossRef]
  18. Ropelewski, C.F.; Halpert, M.S. North American precipitation and temperature patterns associated with the El Niño/Southern Oscillation (ENSO). Mon. Weather Rev. 1986, 114, 2352–2362. [Google Scholar] [CrossRef] [Green Version]
  19. Li, G.; Jian, Y.; Yang, S.; Du, Y.; Wang, Z.; Li, Z.; Zhuang, W.; Jiang, W.; Huang, G. Effect of excessive equatorial Pacific cold tongue bias on the El Niño-Northwest Pacific summer monsoon relationship in CMIP5 multi-model ensemble. Clim. Dyn. 2019, 52, 6195–6212. [Google Scholar] [CrossRef]
  20. Yang, C.; Ren, B.; Li, G.; Zheng, J. Change of the wintertime SSTA variability over the West Pacific after the mid-1980s: Effect of the increasing El Niño Modoki. J. Geophys. Res. Atmos. 2014, 119, 5204–5225. [Google Scholar] [CrossRef]
  21. Zhou, L.-T.; Wu, R. Respective impacts of the East Asian winter monsoon and ENSO on winter rainfall in China. J. Geophys. Res. 2010, 115, D02107. [Google Scholar] [CrossRef]
  22. Wang, B.; Wu, R.; Fu, X. Pacific-East Asian teleconnection: How does ENSO affect East Asian climate? J. Clim. 2000, 13, 1517–1536. [Google Scholar] [CrossRef]
  23. Teng, H.F.; Lee, C.-S.; Hsu, H.-H. Influence of ENSO on formation of tropical cloud clusters and their development into tropical cyclones in the western North Pacific. Geophys. Res. Lett. 2014, 41, 9120–9126. [Google Scholar] [CrossRef]
  24. Camargo, S.J.; Emanuel, K.A.; Sobel, A.H. Use of a genesis potential index to diagnose ENSO effects on tropical cyclone genesis. J. Clim. 2007, 20, 4819–4834. [Google Scholar] [CrossRef]
  25. Camargo, S.J.; Sobel, A.H. Western North Pacific tropical cyclone intensity and ENSO. J. Clim. 2005, 18, 2996–3006. [Google Scholar] [CrossRef]
  26. Wang, B.; Chan, J.C.L. How strong ENSO events affect tropical storm activity over the Western North Pacific. J. Clim. 2002, 15, 1643–1658. [Google Scholar] [CrossRef]
  27. Banholzer, S.; Donner, S. The influence of different El Niño types on global average temperature. Geophys. Res. Lett. 2014, 41, 2093–2099. [Google Scholar] [CrossRef]
  28. Larkin, N.K.; Harrison, D.E. Global seasonal temperature and precipitation anomalies during El Niño autumn and winter. Geophys. Res. Lett. 2005, 32, L16705. [Google Scholar] [CrossRef]
  29. Yulaeva, E.; Wallace, J.M. The signature of ENSO in global temperature and precipitation fields derived from the microwave sounding unit. J. Clim. 1994, 7, 1719–1736. [Google Scholar] [CrossRef] [Green Version]
  30. Alexander, M.A.; Bladé, I.; Newman, M.; Lanzante, J.R.; Lau, N.-C.; Scott, J.D. The atmospheric bridge: The influence of ENSO teleconnections on air-sea interaction over the global oceans. J. Clim. 2002, 15, 2205–2231. [Google Scholar] [CrossRef]
  31. Kiladis, G.N.; Diaz, H.F. Global climatic anomalies associated with extremes in the Southern Oscillation. J. Clim. 1989, 2, 1069–1090. [Google Scholar] [CrossRef] [Green Version]
  32. Trenberth, K.E.; Caron, J.M. The Southern Oscillation revisited: Sea level pressures, surface temperatures, and precipitation. J. Clim. 2000, 13, 4358–4365. [Google Scholar] [CrossRef]
  33. Ropelewski, C.F.; Halpert, M.S. Global and regional scale precipitation patterns associated with the El Niño/Southern Oscillation. Mon. Weather Rev. 1987, 115, 1606–1626. [Google Scholar] [CrossRef] [Green Version]
  34. Klein, T.A.; Soden, B.J.; Lau, N.-C. Remote sea surface temperature variations during ENSO: Evidence for a tropical atmospheric bridge. J. Clim. 1999, 12, 917–932. [Google Scholar] [CrossRef] [Green Version]
  35. Philander, S.G.H. Anomalous El Niño of 1982–83. Nature 1983, 305, 16. [Google Scholar] [CrossRef]
  36. McPhaden, M.J. El Niño: The child prodigy of 1997–98. Nature 1999, 398, 559–562. [Google Scholar] [CrossRef]
  37. Hoerling, M.P.; Kumar, A. Origins of extreme climate states during the 1982–83 ENSO winter. J. Clim. 1997, 10, 2859–2870. [Google Scholar] [CrossRef]
  38. Cai, W.; Santoso, A.; Wang, G.; Yeh, S.-W.; An, S.-I.; Cobb, K.M.; Collins, M.; Guilyardi, E.; Jin, F.-F.; Kug, J.-S.; et al. ENSO and greenhouse warming. Nat. Clim. Chang. 2015, 5, 849–859. [Google Scholar] [CrossRef]
  39. Page, S.E.; Siegert, F.; Rieley, J.O.; Boehm, H.-D.V.; Jaya, A.; Limin, S. The amount of carbon released from peat and forest fires in Indonesia in 1997. Nature 2002, 420, 61–65. [Google Scholar] [CrossRef]
  40. Emmanuel, S. Impact to lung health of haze from forest fires: The Singapore experience. Respirology 2000, 5, 175–182. [Google Scholar] [CrossRef]
  41. Frankenberg, E.; McKee, D.; Thomas, D. Health consequences of forest fires in Indonesia. Demography 2005, 42, 109–129. [Google Scholar] [CrossRef] [Green Version]
  42. Merlen, G. The 1982–1983 El Niño: Some of its consequences for Galapagos wildlife. Oryx 1984, 18, 210–214. [Google Scholar] [CrossRef]
  43. Valle, C.A.; Cruz, F.; Cruz, J.B.; Merlen, G.; Coulter, M.C. The impact of the 1982–1983 El Niño-Southern Oscillation on seabirds in the Galapagos Islands, Ecuador. J. Geophys. Res. 1987, 92, 14437–14444. [Google Scholar] [CrossRef]
  44. Tokinaga, H.; Xie, S.-P.; Timmermann, A.; McGregor, S.; Ogata, T.; Kubota, H.; Okumura, Y.M. Regional patterns of tropical Indo-Pacific climate change: Evidence of the Walker Circulation weakening. J. Clim. 2012, 25, 1689–1710. [Google Scholar] [CrossRef]
  45. Domingues, C.M.; Church, J.A.; White, N.J.; Gleckler, P.J.; Wijffels, S.E.; Barker, P.M.; Dunn, J.R. Improved estimates of upper-ocean warming and multi-decadal sea-level rise. Nature 2008, 453, 1090–1093. [Google Scholar] [CrossRef] [PubMed]
  46. Kaplan, A.; Cane, M.A.; Kushnir, Y.; Clement, A.C.; Blumenthal, M.B.; Rajagopalan, B. Analyses of global sea surface temperature 1856–1991. J. Geophys. Res. 1998, 103, 18567–18589. [Google Scholar] [CrossRef] [Green Version]
  47. Deser, C.; Phillips, A.; Alexander, M. Twentieth century tropical sea surface temperature trends revisited. Geophys. Res. Lett. 2010, 37, L10701. [Google Scholar] [CrossRef] [Green Version]
  48. Hansen, J.; Sato, M.; Ruedy, R.; Lo, K.; Lea, D.W.; Medina-Elizade, M. Global temperature change. Proc. Natl. Acad. Sci. USA 2006, 103, 14288–14293. [Google Scholar] [CrossRef] [PubMed] [Green Version]
  49. Cane, M.A.; Clement, A.C.; Kaplan, A.; Kushnir, Y.; Pozdnyakov, D.; Seager, R.; Zebiak, S.; Murtugudde, R. Twentieth century sea surface temperature trends. Science 1997, 275, 957–960. [Google Scholar] [CrossRef] [PubMed] [Green Version]
  50. Taylor, K.E.; Stouffer, R.J.; Meehl, G.A. An overview of CMIP5 and the experimental design. Bull. Am. Meteorol. Soc. 2012, 93, 485–498. [Google Scholar] [CrossRef] [Green Version]
  51. Meehl, G.A.; Covey, C.; Delworth, T.; Latif, M.; McAvaney, B.; Mitchell, F.B.; Stouffer, R.J.; Taylor, K.E. The WCRP CMIP3 multimodel dataset: A new era in climate change research. Bull. Am. Meteorol. Soc. 2007, 88, 1383–1394. [Google Scholar] [CrossRef] [Green Version]
  52. Tokinaga, H.; Xie, S.-P.; Deser, C.; Kosaka, Y.; Okumura, Y.M. Slowdown of the Walker circulation driven by tropical Indo-Pacific warming. Nature 2012, 491, 439–443. [Google Scholar] [CrossRef]
  53. Knutson, T.R.; Manabe, S. Time-mean response over the tropical Pacific due to increased CO2 in a coupled ocean-atmosphere model. J. Clim. 1995, 8, 2181–2199. [Google Scholar] [CrossRef] [Green Version]
  54. Vecchi, G.A.; Soden, B.J. Global warming and the weakening of the tropical circulation. J. Clim. 2007, 20, 4316–4340. [Google Scholar] [CrossRef] [Green Version]
  55. Meehl, G.A.; Washington, W.M. El Niño-like climate change in a model with increased atmospheric CO2 concentrations. Nature 1996, 382, 56–60. [Google Scholar] [CrossRef]
  56. Xie, S.-P.; Deser, C.; Vecchi, G.A.; Ma, J.; Teng, H.; Wittenberg, A.T. Global warming pattern formation: Sea surface temperature and rainfall. J. Clim. 2010, 23, 966–986. [Google Scholar] [CrossRef]
  57. Lloyd, J.; Guilyardi, E.; Weller, H. The role of atmosphere feedbacks during ENSO in the CMIP3 models. Part II: Using AMIP runs to understand the heat flux feedback mechanisms. Clim. Dyn. 2011, 37, 1271–1292. [Google Scholar] [CrossRef]
  58. Bony, S.; Lau, K.-M.; Sud, Y.C. Sea surface temperature and large scale circulation influences on tropical greenhouse effect and cloud radiative forcing. J. Clim. 1997, 10, 2055–2077. [Google Scholar] [CrossRef]
  59. Ramanathan, V.; Collins, W. Thermodynamic regulation of ocean warming by cirrus clouds deduced from observations of the 1987 El Niño. Nature 1991, 351, 27–32. [Google Scholar] [CrossRef]
  60. Li, G.; Xie, S.-P. Tropical biases in CMIP5 multimodel ensemble: The excessive equatorial Pacific cold tongue and double ITCZ problems. J. Clim. 2014, 27, 1765–1780. [Google Scholar] [CrossRef]
  61. Ma, C.-C.; Mechoso, C.R.; Robertson, A.W.; Arakawa, A. Peruvian stratus clouds and the tropical Pacific circulation: A coupled ocean-atmosphere GCM study. J. Clim. 1996, 9, 1635–1645. [Google Scholar] [CrossRef] [Green Version]
  62. Lloyd, J.; Guilyardi, E.; Weller, H. The role of atmosphere feedbacks during ENSO in the CMIP3 Models. Part III: The shortwave flux feedback. J. Clim. 2012, 25, 4275–4293. [Google Scholar] [CrossRef]
  63. Philander, S.G.H.; Gu, D.; Lambert, G.; Li, T.; Halpern, D.; Lau, N.-C.; Pacanowski, R. Why the ITCZ is mostly north of the equator. J. Clim. 1996, 9, 2958–2972. [Google Scholar] [CrossRef] [Green Version]
  64. Gordon, C.T.; Rosati, A.; Gudgel, R. Tropical sensitivity of a coupled model to specified ISCCP low clouds. J. Clim. 2000, 13, 2239–2260. [Google Scholar] [CrossRef] [Green Version]
  65. Li, G.; Du, Y.; Xu, H.; Ren, B. An intermodel approach to identify the source of excessive equatorial Pacific cold tongue in CMIP5 models and uncertainty in observational datasets. J. Clim. 2015, 28, 7630–7640. [Google Scholar] [CrossRef]
  66. Zheng, Y.; Lin, J.-L.; Shinoda, T. The equatorial Pacific cold tongue simulated by IPCC AR4 coupled GCMs: Upper ocean heat budget and feedback analysis. J. Geophys. Res. 2012, 117, C05024. [Google Scholar] [CrossRef] [Green Version]
  67. Davey, M.K.; Huddleston, M.; Sperber, K.R.; Braconnot, P.; Bryan, F.; Chen, D.; Colman, R.A.; Cooper, C.; Cubasch, U.; Delecluse, P. STOIC: A study of coupled model climatology and variability in tropical ocean regions. Clim. Dyn. 2002, 18, 403–420. [Google Scholar]
  68. Yu, J.-Y.; Mechoso, C.R. Links between annual variations of Peruvian stratocumulus clouds and of SST in the eastern equatorial Pacific. J. Clim. 1999, 12, 3305–3318. [Google Scholar] [CrossRef]
  69. Mechoso, C.R.; Robertson, A.W.; Barth, N.; Davery, M.K.; Delecluse, P.; Gent, P.R.; Ineson, S.; Kirtman, B.; Latif, M.; Treut, H.L.; et al. The seasonal cycle over the tropical Pacific in coupled ocean-atmosphere general circulation models. Mon. Weather Rev. 1995, 123, 2825–2838. [Google Scholar] [CrossRef] [Green Version]
  70. Li, G.; Xie, S.-P.; Du, Y.; Luo, Y. Effects of excessive equatorial cold tongue bias on the projections of tropical Pacific climate change. Part I: The warming pattern in CMIP5 multi-model ensemble. Clim. Dyn. 2016, 47, 3817–3831. [Google Scholar] [CrossRef]
  71. Milinksi, S.; Maher, N.; Olonscheck, D. How large does a large ensemble need to be? Earth Syst. Dyn. 2020, 11, 885–901. [Google Scholar]
  72. Dee, D.P.; Uppala, S.M.; Simmons, A.J.; Berrisford, P.; Poli, P.; Kobayashi, S.; Andrae, U.; Balmaseda, M.A.; Balsamo, G.; Bauer, P.; et al. The ERA-Interim reanalysis: Configuration and performance of the data assimilation system. Q. J. R. Meteorol. Soc. 2011, 137, 553–597. [Google Scholar] [CrossRef]
  73. Adler, R.F.; Huffman, G.J.; Chang, A.; Ferraro, R.; Xie, P.-P.; Janowiak, J.; Rudolf, B.; Schneider, U.; Curtis, S.; Bolvin, D.; et al. The version 2 global precipitation climatology project (GPCP) monthly precipitation analysis (1979–present). J. Hydrometeorol. 2003, 4, 1147–1167. [Google Scholar] [CrossRef]
  74. Rayner, N.A.; Parker, D.E.; Horton, E.B.; Folland, C.K.; Alexander, L.V.; Rowell, D.P.; Kent, E.C.; Kaplan, A. Global analyses of sea surface temperature, sea ice, and night marine air temperature since the late nineteenth century. J. Geophys. Res. 2003, 108, 4407. [Google Scholar] [CrossRef]
  75. Lengaigne, M.; Vecchi, G.A. Contrasting the termination of moderate and extreme El Niño events in coupled general circulation models. Clim. Dyn. 2010, 35, 299–313. [Google Scholar] [CrossRef]
  76. Chiodi, A.M.; Harrison, D.E. Characterizing warm-ENSO variability in the equatorial Pacific: An OLR perspective. J. Clim. 2010, 23, 2428–2439. [Google Scholar] [CrossRef] [Green Version]
  77. Boe, J.; Hall, A.; Qu, X. September sea-ice cover in the Arctic ocean projected to vanish by 2100. Nat. Geosci. 2009, 2, 341–343. [Google Scholar] [CrossRef]
  78. Huang, P.; Ying, J. A multimodel ensemble pattern regression method to correct the tropical Pacific SST change patterns under global warming. J. Clim. 2015, 28, 4706–4723. [Google Scholar] [CrossRef]
  79. Cox, P.M.; Pearson, D.; Booth, B.B.; Friedlingstein, P.; Huntingford, C.; Jones, C.D.; Luke, C.M. Sensitivity of tropical carbon to climate change constrained by carbon dioxide variability. Nature 2013, 494, 341–344. [Google Scholar] [CrossRef]
  80. Bracegirdle, T.J.; Stephenson, D.B. On the robustness of emergent constraints used in multimodel climate change projections of Arctic warming. J. Clim. 2013, 26, 669–678. [Google Scholar] [CrossRef] [Green Version]
  81. Collins, M.; Chandler, R.E.; Cox, P.M.; Huthnance, J.M.; Rougier, J.; Stephenson, D.B. Quantifying future climate change. Nat. Clim. Chang. 2012, 2, 403–409. [Google Scholar] [CrossRef] [Green Version]
  82. Nitta, T. Convective activities in the tropical western Pacific and their impacts on the Northern Hemisphere summer circulation. J. Meteorol. Soc. Jpn. 1987, 65, 373–390. [Google Scholar] [CrossRef] [Green Version]
  83. Huang, R.; Lu, L. Numerical simulation of the relationship between the anomaly of subtropical high in East Asia and the convective activities in the tropical western Pacific. Adv. Atmos. Sci. 1989, 6, 202–214. [Google Scholar]
  84. Xie, S.-P.; Hu, K.; Hafner, J.; Tokinaga, H.; Du, Y.; Huang, G.; Sampe, T. Indian Ocean capacitor effect on Indo-Western Pacific climate during the summer following El Niño. J. Clim. 2009, 22, 730–747. [Google Scholar] [CrossRef]
  85. Yang, J.; Liu, Q.; Xie, S.-P.; Liu, Z.; Wu, L. Impact of the Indian Ocean SST basin mode on the Asian summer monsoon. Geophys. Res. Lett. 2007, 34, L02708. [Google Scholar] [CrossRef] [Green Version]
  86. Huang, R.-H.; Wu, Y.-F. The influence of ENSO on the summer climate change in China and its mechanism. Adv. Atmos. Sci. 1989, 6, 21–32. [Google Scholar]
  87. Hwang, Y.-T.; Frierson, D.M.M. Link between the double-Intertropical Convergence Zone problem and cloud biases over the Southern Ocean. Proc. Natl. Acad. Sci. USA 2013, 110, 4935–4940. [Google Scholar] [CrossRef] [Green Version]
  88. DiNezio, P.N.; Clement, A.C.; Vecchi, G.A.; Soden, B.J.; Kirtman, B.P.; Lee, S.-K. Climate response of the equatorial Pacific to global warming. J. Clim. 2009, 22, 4873–4892. [Google Scholar] [CrossRef]
  89. Zhou, Z.-Q.; Xie, S.-P. Effects of climatological model biases on the projection of tropical climate change. J. Clim. 2015, 28, 9909–9917. [Google Scholar] [CrossRef]
Figure 1. Time series of December–January–February (DJF) mean (a) precipitation (mm/day) and (b) detrended SST anomalies (°C) over the Niño3 (150° W–90° W, 5° S–5° N) region during 1979–2010 in observations. The red line in (a) and the blue line in (b) denote the 5 mm/day precipitation and 0.5 °C SST anomaly, respectively. The events of 1982/83 and 1997/98 are two extreme episodes, with more than 5 mm/day mean precipitation over the Niño3 region during DJF, as shown in (a). Based on the definition that detrended Niño3 SSTs greater than 0.5 °C are anomalies but not extreme El Niño events, we also identified six moderate El Niño events, as shown in (b).
Atmosphere 12 00851 g001
Figure 2. Composite anomalies in 1000 hPa winds (m/s; only wind speeds larger than 1 m/s are shown) and precipitation (color-shaded; mm/day) for (a) moderate and (b) extreme El Niño events.
Atmosphere 12 00851 g002
Figure 3. Relationship of Niño3 DJF precipitation (mm/day) with (a) detrended Niño3 DJF SST anomalies (°C) and (b) DJF precipitation anomalies averaged over the WNP (120° E–140° E, 5° N–10° N) for 1979–2010. Extreme El Niño, moderate El Niño, and other events are indicated by red, blue, and black dots, respectively.
Atmosphere 12 00851 g003
Figure 4. The number of extreme El Niño occurrences for the 21st versus the 20th century in 22 CMIP5 models. An extreme El Niño event in (a) was identified when the Niño3 DJF precipitation was over 5 mm/day. (b) Same as (a), but an extreme El Niño was identified when the Niño3 DJF precipitation was over 6 mm/day.
Atmosphere 12 00851 g004
Figure 5. Multi-model histograms of the (a) Niño3 DJF precipitation and (b) detrended Niño3 DJF precipitation anomalies greater than zero. The samples for the 20th (blue) and 21st (red) centuries are distributed into 1 mm/day bins. The MME mean values during the 21st (red lines) and 20th (blue lines) centuries are shown in (a) and (b). (c) Comparison of regressions of interannual Niño3 DJF precipitation upon local SST anomalies between the 20th and 21st centuries in 22 CMIP5 models.
Atmosphere 12 00851 g005
Figure 6. (a) The MME mean changes for surface wind stress (N/m2; vectors), precipitation (mm/day; white contours), and SST (°C; color-shaded) projected by 22 CMIP5 models under RCP 8.5 forcing. (b) Scatterplot of the projected changes in the number of extreme El Niño events versus east–west gradient changes in SST between the eastern (140° W–90° W, 2° S–2° N) and western (140° E–170° W, 2° S–2° N) equatorial Pacific in models. An extreme El Niño in (b) was identified when the Niño3 mean DJF precipitation was over 5 mm/day. (c) Same as (b), but an extreme El Niño event was identified when the Niño3 mean DJF precipitation was over 6 mm/day.
Atmosphere 12 00851 g006
Figure 7. Relationships of the projected future east–west SST (°C) gradient changes between equatorial eastern (140° W–90° W, 2° S–2° N) and western (140° E–170° W, 2° S–2° N) Pacific with the present-day (a) equatorial Pacific cold tongue (160 °E–90 °W, 2 °S–2 °N) SST and (b) equatorial western Pacific precipitation (mm/day) among the 22 CMIP5 models. The red lines in (a) and (b) indicate the corresponding observed values. The inter-model correlation (r) in each panel is given in the top-left corner.
Atmosphere 12 00851 g007
Figure 8. (a) Same as Figure 6a, except for the corrected MME mean changes using an observational constraint of equatorial western Pacific precipitation. (b) Corrected-minus-uncorrected differences in MME mean changes.
Atmosphere 12 00851 g008
Figure 9. The uncorrected and corrected changes in the (a) east–west SST (°C) gradient in the equatorial Pacific and (b) Niño3 DJF precipitation (mm/day) under the RCP 8.5 scenario. (c) Relationship between corrected-minus-uncorrected changes in the east-minus-west gradient of equatorial Pacific SST and Niño3 DJF precipitation among the 22 models.
Atmosphere 12 00851 g009
Figure 10. Inter-model relationship between the projected future changes in the number of extreme El Niño occurrences and simulated present-day precipitation (mm/day) over the equatorial western Pacific. The red line for each panel denotes the observed equatorial western Pacific precipitation. An extreme El Niño event in (a) was defined when Niño3 DJF precipitation was greater than 5 mm/day. (b) Same as (a), but an extreme El Niño event was identified when the Niño3 DJF precipitation was over 6 mm/day.
Atmosphere 12 00851 g010
Figure 11. Uncorrected versus corrected increases in extreme El Niño occurrences between the 21st and 20th centuries in CMIP5 models. An extreme El Niño event in (a) was identified when the Niño3 DJF precipitation was over 5 mm/day. (b) Same as (a), but an extreme El Niño event was identified when the Niño3 DJF precipitation was over 6 mm/day.
Atmosphere 12 00851 g011
Figure 12. (a) Comparison of DJF precipitation anomalies (mm/day) over the WNP caused by extreme El Niño events during the 20th versus the 21st century. The precipitation anomalies were normalized by the corresponding WNP DJF mean precipitation for each model. (b) Scatterplot of the projected changes in WNP precipitation anomalies caused by extreme El Niño versus changes in the number of extreme El Niño events.
Atmosphere 12 00851 g012
Figure 13. (a) Inter-model relationship between the projected changes in the WNP precipitation anomalies caused by extreme El Niño events and simulated present-day equatorial western Pacific precipitation (mm/day). The red line in (a) displays the observed equatorial western Pacific precipitation. (b) Uncorrected versus corrected changes in the WNP precipitation anomalies caused by extreme El Niño events under the RCP 8.5 scenario in CMIP5 CGCMs.
Atmosphere 12 00851 g013
Table 1. A list of the 22 models used in this work and the letter labels used to denote them in the text and figures.
Model NameModel Group (or Center)Letter Label
ACCESS1-0CSIRO-BOMM1
bcc-csm1-1-mBCCM2
CanESM2CCCmaM3
CCSM4NCARM4
CESM1-CAM5NSF-DOE-NCARM5
CMCC-CESMCMCCM6
CNRM-CM5CNRM-CERFACSM7
CSIRO-Mk3-6-0CSIRO-QCCCEM8
FGOALS-s2LASG-IAPM9
GFDL-CM3NOAA GFDLM10
GFDL-ESM2GNOAA GFDLM11
GISS-E2-RNASA GISSM12
HadGEM2-AOMOHCM13
HadGEM2-CCMOHCM14
inmcm4INMM15
IPSL-CM5A-LRIPSLM16
IPSL-CM5A-MRIPSLM17
IPSL-CM5B-LRIPSLM18
MPI-ESM-LRMPI-MM19
MPI-ESM-MRMPI-MM20
MRI-CGCM3MRIM21
NorESM1-MENCCM22
Publisher’s Note: MDPI stays neutral with regard to jurisdictional claims in published maps and institutional affiliations.

