Article

A Case Study of Birch Pollen and the Synergy with Environmental Factors: Relation to Asthma in Montreal, Canada

Environment and Climate Change Canada, 2121 Trans-Canada Highway, Dorval, QC H9P 1J3, Canada
Atmosphere 2021, 12(6), 789; https://doi.org/10.3390/atmos12060789
Submission received: 14 May 2021 / Revised: 25 May 2021 / Accepted: 15 June 2021 / Published: 19 June 2021
(This article belongs to the Special Issue Challenges in Measuring and Assessing Environmental Health)

Abstract

:
Environmental factors such as air pollution are known to exacerbate respiratory illness and increase the overall health risk. However, on a daily or seasonal basis, the relation between air pollutants, weather and a disease such as asthma is not clear. When combined with aeroallergens such as birch pollen and under specific weather conditions, synergistic effects may increase symptoms of respiratory illness and morbidity and then reveal interesting links with environmental factors. Hence, it is important to improve the understanding of pollution-pollen-weather and broaden the public health message. Combined analysis and model simulation of aeroallergens, air pollution and weather as presented here is important to correctly evaluate health burdens and allow a better forecast of the potential health risk. However, analyzing the combined effects of several environmental factors is not well understood and represents a challenging task. This paper shows: (1) the results of data analysis performed in Montreal for asthma hospitalization in relation to complex synergistic environmental factors, and (2) model simulation of birch pollen using a coupled weather-air quality model (GEM-MACH) compared with model-data fusion of classical chemical species (e.g., near-surface ozone, nitrogen dioxide and fine particulate matter) in order to evaluate spatiotemporal vulnerable zone for asthma health risk.

1. Introduction

1.1. Scientific Context

Respiratory illness has multifactorial causes and is one of the most widespread diseases among children and the elderly. Asthma is estimated to affect about 3.8 million Canadians and is the most common chronic respiratory disease in Canada [1,2]. Between 12% and 25% of Canadian children have received a diagnosis of asthma ([2,3] and references therein) and associated costs to the healthcare system reach more than $2 billion each year [4]. Despite the fact that medical services and treatment have improved over the years, the prevalence of respiratory diseases such as asthma has increased worldwide over the past few decades [5,6,7,8,9,10] as well as in Canada [2]. Recently, although some countries are showing a decline of the prevalence of pediatric asthma (certain parts of Europe and North America, [4]), asthma prevention still remains a challenge difficult to tackle, possibly exacerbated by climate change and other environmental factors such as air pollution and increasing aeroallergens [3,8,9,10,11]. Other related allergic diseases such as rhinitis are also of concern. Globally, the prevalence of allergic rhino-conjunctivitis has increased as well in the great majority of countries in children [12] and is currently affecting up to 20–25% of Canadians [13]. Although both asthma and rhinitis have multifactorial causes, air pollution is considered an important one. Gases such as ozone causes oxidative stress, airway inflammation, and increased airway permeability, then facilitating the access of allergens to immunogenic effector cells [14,15]. Moreover, air pollutants such as ozone, nitrogen oxides, and acid gases, can interact with bioaerosols, damaging pollen grains and facilitating the release of allergenic cytoplasmic granules which can penetrate deeper into the respiratory tract and increase the respiratory health risk [12,16,17,18,19,20,21]. The presence of synergy between environmental factors (pollution-pollen-weather) means that better tools need to be developed to reach efficient respiratory disease management (e.g., asthma and rhinitis). For example, developing tools to map the environmental factors related to respiratory disease is needed to identify spatiotemporal zones of vulnerability and of higher risk.

1.2. Aeroallergens Concentration, Pollution, Climate and Weather: What Are the Connections?

Although there is a still substantial lack of knowledge and uncertainty, mounting evidence in the literature points towards the conclusion that environmental factors (daily weather, global warming, chemical pollution) may interact with aeroallergens in many ways. First, global warming contributes to an earlier start of the pollen season [22,23,24], increases the length of the pollen season [9,10,11,12,23,25,26], augments the quantity of emitted pollen [11,21,22,27] and also increases the pollen allergenicity [21,27,28]. Second, environmental factors (air pollution, high humidity, temperature, precipitation) could also change the patient individual sensitivity to pollen and allergens, favor pollen rupture or cracks in its surface, releasing hundreds to thousands of small allergens or pollen fragments (size 30 nm–5 μm) containing allergenic proteins which could penetrate deeper into the lungs and exacerbate respiratory problems such as asthma [12,21,29,30,31,32,33]. Schäppi et al. [18] demonstrated the allergenic character of birch pollen inner granules and the influence of rain in releasing allergens into the atmosphere under precipitation. Moreover, air pollutants such as ozone and particulate matter can prime the airways for pro-allergic responses, act as adjuvants and alter the immunogenicity of allergenic proteins [12,21].
The concept of “polluen” (i.e., pollutant + pollen) has been introduced by Peltre [34] to describe a contaminated pollen by adsorbed atmospheric gases (such as nitrogen dioxide, ammonia or others, e.g., Chassard et al. [35]) or by deposition of trace metals or black carbon on its surface [20]. Okuyama et al. [36] reported adsorption of air pollutants on the grain surface of Japanese cedar pollen. With pollutants loaded on its surface, pollen can break up more easily [12,32,35] and release its inner-pollen allergens, which are much smaller and present a higher risk for asthma patients [29,30]. Proof of pollen rupture in the atmosphere and release of inner allergens is numerous for tree pollen including birch [19,30,31,37,38], as well as for other pollen such as grass pollen [29,30]. Moreover, these fine allergens released can deposit on particulate matter (PM2.5/PM10) which can be more harmful than any individual “non biologically-contaminated” aerosol [34,39,40]. Allergens of birch pollen (e.g. Bet v. 1) were noted by Ormstad et al. [41] on diesel particles. These particles released from exhaust vehicles then become allergen carriers, but also a powerful “polluen” increasing the allergic reaction of exposed patient ([12,34] and references therein).
In general, bioaerosols (such as the pollen grain and small aeroallergens) are made of proteins such as tryptophan and tyrosine. It has been established that protein nitration by air pollutants (smog and NOy: NO, NO2, HNO3, PAN, etc.) might play a role in the development of allergies [21] and ref. therein. More specifically, nitrotyrosine (nitrated tyrosine, e.g., NOy + tyrosine) has been reported as a biomarker for oxidative stress, inflammation, and a wide range of diseases [42,43,44]. Nitrated variants of the major birch pollen allergen Bet v 1 induced enhanced levels of specific IgE in murine models [45]. Therefore, polluted urban environments (especially by NOy) are favorable for allergy development due to a complex pollen-pollutant synergy. This is the reason why it becomes so important to map pollutants together with aeroallergens such as birch pollen to locate zones where pollutants and pollen overlap. Using the GEM-MACH model, as carried out in this paper, it becomes possible to establish spatio-temporal coincidence between pollen and pollution (NO2, O3, and particulate matter).
Note that synergies could occur differently with changing daily weather and at different spatiotemporal scales from local (with timescales of minutes), such as in the case of thunderstorm asthma [46,47], up to synoptic scale fronts [48] to longer and global scales such as the impact of climate change [3,9,10,11]. Few studies have examined this synergy. Rosas et al. [49] analyzed the relationship between environmental factors (aeroallergens, air pollution and weather) and asthma emergency admissions to a hospital in Mexico City. However, since then, only a few more studies, e.g., [48,50], have focused on the impact of daily changing weather in the synergy of pollution and aeroallergens. Other authors have analyzed atmospheric air mass type [51], or specific weather conditions in relation to asthma [18,29,30,46,52] but without including important environmental factors such as air pollution. Therefore, more studies are needed to clarify this aspect.

1.3. Respiratory Health Risks under Specific Weather Conditions

One of the most known interactions of weather with respiratory illness is the phenomenon known as thunderstorm asthma, which is a sudden increase in asthma hospitalizations following a thunderstorm. The thunderstorm asthma phenomenon is described elsewhere in more detail by D’Amato et al. [9,10], Mark and Bush [46] and Taylor and Jonsson [47]. In Canada, this phenomenon has not been examined in the literature so far. Rather, the impact of changing airmasses or weather conditions has been analyzed for a possible link between weather types and the risks for respiratory health [48,50,51]. However, the link between specific synoptic weather patterns and health risk is not clear and needs to be further elucidated. Robichaud and Comtois [48] show that asthma hospitalization has higher counts in a situation of active fronts, occluded fronts (or trowals) and proposed a concept to account for it, e.g., “frontal-asthma”. Within fronts and trowals, pollutants and aerosols converge and have a tendency to be trapped within the weather system by the effect of converging winds within the front. Since rain and humidity are often present in such systems, several mechanisms described above occur, such a pollen breaking up due to osmose pressure. Moreover, during aqueous phase processing (when aerosol particles are activated as cloud or fog droplets), nitration of the grain pollen and released allergens may also proceed [21]. Other studies have discussed the trapping effect of pollution by specific weather systems. Mandrioli et al. [53] discussed the situation that occurs in occlusion where air pollutants are trapped by this weather pattern. Robichaud and Comtois [54] provided simulation of aerosol dispersion, which shows airborne birch pollen trapped into a surface pressure trough (this weather system experiences surface converging air as well). Table 1 summarizes the results of the impact of weather on the respiratory health risk (from literature).

1.4. Transport of Pollen from Source Areas to Urban Environment vs. Local Sources

Regional and long-range transport of pollen has been recognized for a long time for several anemophilic plants [53,54,55,56,57,58,59,60], including birch pollen [54,61,62,63,64]. Pollen transported over long distance (100–1000 km) is less numerous, but seems to produce more health risk ([65,66,67] and references included). Transported pollen grains over a long distance could induce intense respiratory allergy symptoms attributed to chemical damage of grains by strong oxidants appearing in polluted environments, and to deposition of air pollutants on the pollen grain [68,69]. Many studies have estimated the pollen quantity and local sources in urban areas with the help of land-use regression (LUR) models to estimate exposure information for epidemiologic studies [70]. However, it is not known the portion which is locally produced and the one which is coming from regional transport or long-range remote locations. Consideration of medium or regional transport is essential in many studies of urban allergenic species, including birch pollen [63,71], and neglecting this aspect could lead to incoherent results and incomplete conclusions. The second part of this paper shows spatio-temporal distribution of pollen using a regional transport model. Simulation of airborne birch pollen is also presented and compared with objective analyses maps of classical pollutants over Eastern Canada (with a focus on the southern part of the province of Quebec). This could help to better establish the combined effect of both aeroallergens and air pollution on respiratory health risk and better evaluate the spatial occurrence of pollutant-pollen-weather synergy as described above.
The birch pollen is studied here for many reasons: (1) it is the most allergenic tree pollen in Canada [72,73] and elsewhere [12,74]; (2) winds and turbulence could transport it over long distances [57,61,63,64]; and (3) birch is among common trees the most abundant producer of airborne pollen [74]. The central aim of this paper is to present, in a holistic view, some results of analysis data and model outputs describing several links between respiratory disease (e.g., asthma), air pollution, and weather.

2. Materials and Methods

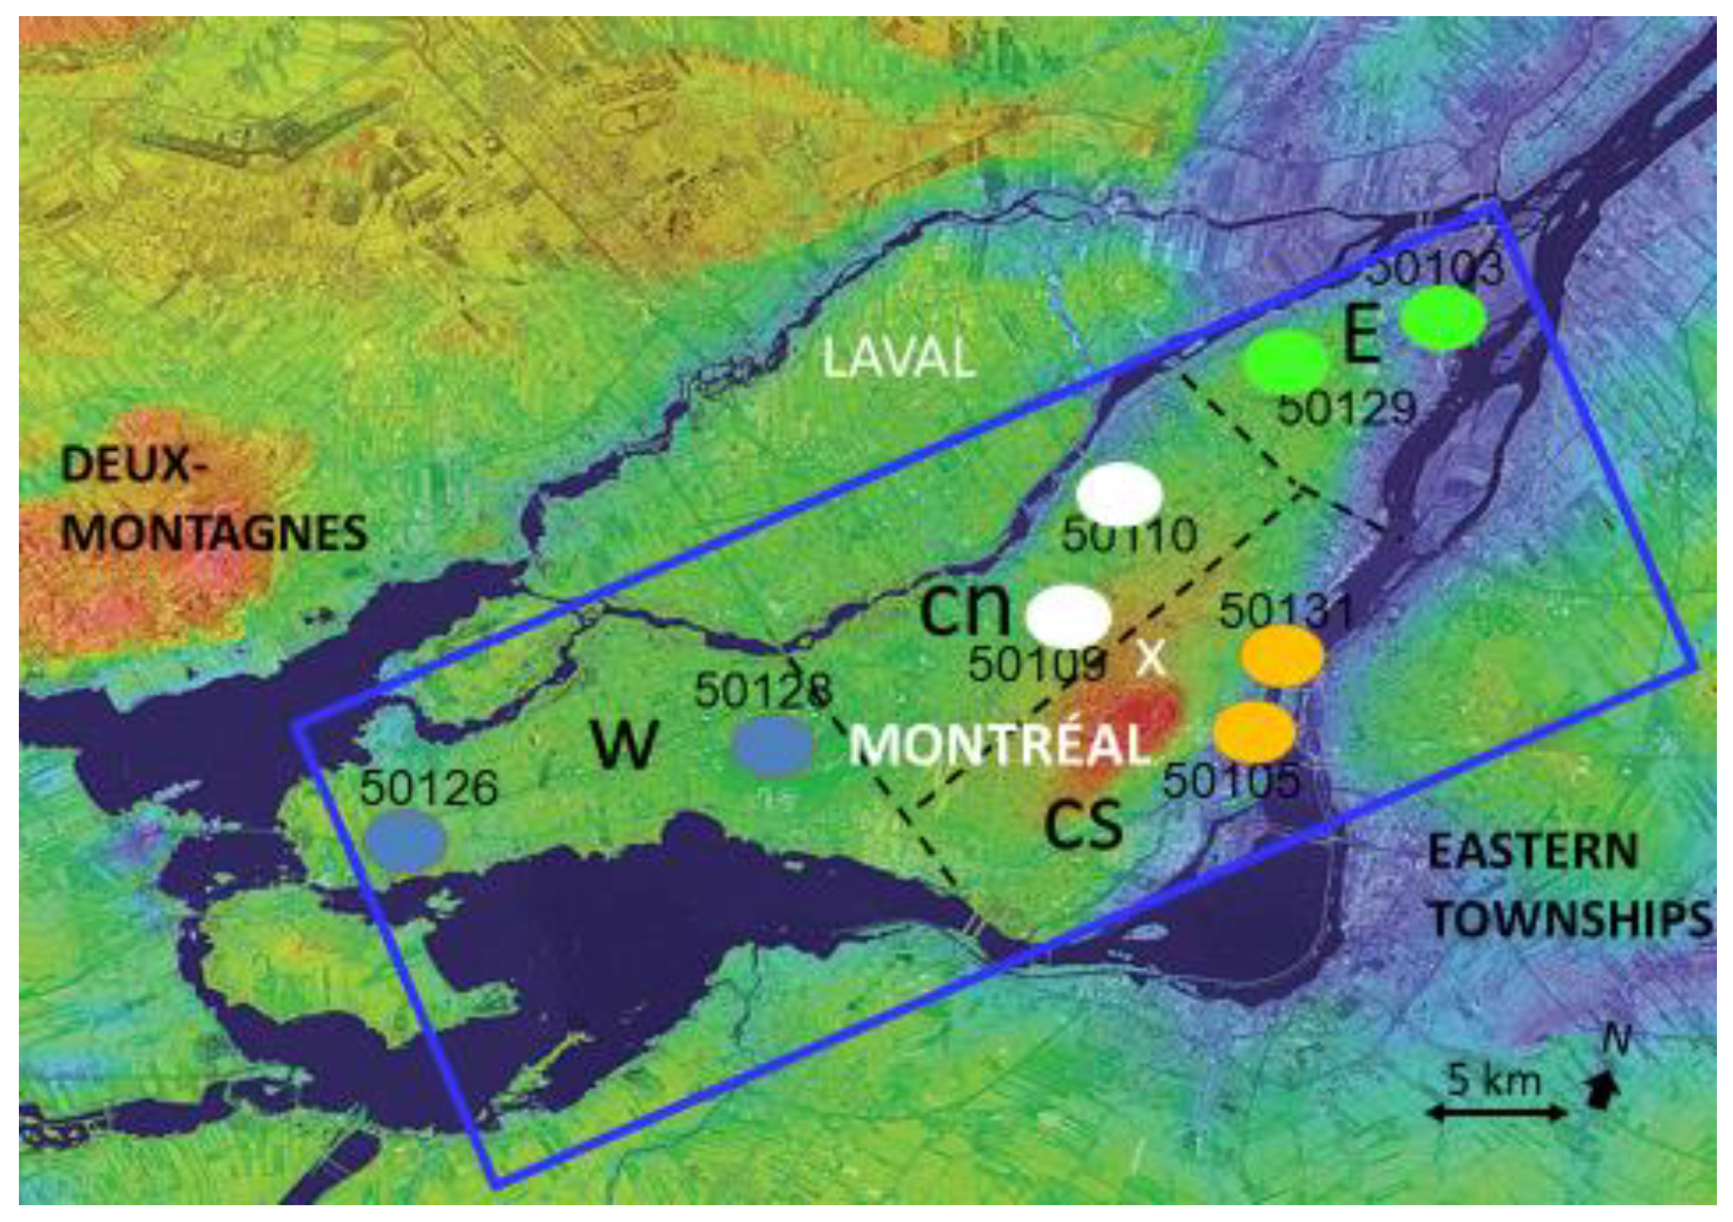
2.1. Study Region and Site for Data Analysis and Measurements

The region studied here is the eastern part of Canada from the Southern Laurentides, north and west of Montreal (Province of Quebec), and Appalachian Mountain (Eastern Townships of Quebec). These regions have significant density of birch tree (see Figure S1 for a map of birch vegetation). Montreal is a focus in this study since there is an important regional transport of birch pollen from rural pollen sources to urban locations [54]. Montreal also has the largest urban population of Quebec and the second highest in Canada (after Toronto), so the combined effect of both pollen and urban pollution on humans is significant. The climate relevant to the study area (i.e., Montreal and the surrounding parts of Laurentides and Appalachian Mountains) is semi-continental, with a warm, humid summer and a cold winter (Dfb: Köppen climate classification) [79]. During the birch pollen season, the region has numerous sunny days (mid-April/May) with moving high pressure and frontal systems which are ideal conditions for birch pollen dispersion as well as photochemical pollution.

2.2. Health Data

Asthma is a disease characterized by recurrent attacks of breathlessness and wheezing, which varies in severity and frequency among different individuals while exacerbated by air pollution [1,2,3]. The daily asthma hospitalization count for Montreal has been obtained for 4 different sectors of the Montreal Island: W (West), CN (center-north), CS (center-south) and E (east) (see Figure 1 for the localization of sectors in Montreal) from INSPQ (Institut National de Santé Publique du Québec). Daily hospitalization statistics are more robust than the daily emergency department visits (ED) or medical doctors’ visits, since hospitalization has less time lag after exposure to the environmental trigger as compared to physician visits or ED cases (the latter having a lag between 1 and 7 days, ANSES [12] and references therein). Moreover, medical visits data do not reflect asthma prevalence, but rather access to community health care and public health services ([1] and references therein). Another piece of health data of interest analyzed here is the quarterly number of registered counts for the peak expiratory flow rate (PEFR), a diagnosis used for patients with respiratory issues. Although, this diagnosis is not only used for asthmatic patients, but also for other respiratory diseases (e.g., chronic obstructive pulmonary disease), all asthmatic patients usually take a PEFR test. On a seasonal basis, the number of tests administrated in a particular region is taken as a proxy for the prevalence and severity of asthma in that same region during the same period and could be related here to the quarterly average of local environmental triggers (such as pollen, pollution concentration and weather). PEFR data was obtained from the Government of Quebec for Montreal and for the whole Province of Québec (Assurance-maladie du Québec, https://www.ramq.gouv.qc.ca, accessed on 17 June 2021). The health risk of air pollutant exposure is well depicted by the AQHI (Air Quality Health Index [80]) which is calculated based on the relative risks of a combination of classical air pollutants that is known to harm human health. These pollutants are: ozone (O3), particulate matter less than 2.5 or 10 µm (PM2.5/PM10) and nitrogen dioxide (NO2), all measured near-ground level. The AQHI is measured on a scale ranging from 1 to 10+. AQHI values of 0–3 are considered to present a low risk for health, 4–6 a moderate health risk, 7–10 a high health risk and above 10, a very high health risk. More details on the AQHI index can be found at https://www.canada.ca/en/environment-climate-change/services/air-quality-health-index/about.html, accessed on 17 June 2021.

2.3. Other Environmental Data

Data on air pollution (ozone, nitrogen dioxide, fine particulate matter concentrations) and meteorological observations were all obtained through Environment and Climate Change Canada on an hourly basis (National Air Pollution Surveillance network data). Data for vegetation cover of birch were obtained from forest inventories based on the Biogenic Emissions Landuse Database, version 3 (BELD3 of US/EPA [81]) supplemented by the Canadian forestry inventory (for more details see Robichaud and Comtois [54]). The vegetation file was processed from raw data obtained from US/EPA (BELD3 database, https://www.epa.gov/air-emissions-modeling/biogenic-emissions-landuse-database-version-3-beld3, accessed on 17 June 2021). Finally, for details on weather type and the related methodology, the reader is referred to Robichaud and Comtois [48]. Appendix A below describes the different weather types and their associated most likely clouds and weather used in this manuscript.

2.4. Pollen Measurement

At Université de Montréal (UdeM), pollen was collected using a volumetric pollen sampler (Lanzoni VPPS: two stage vacuum pump) based on Hirst’s design [82]. A 7-day clockwork allowed an hourly resolution of recording spore trap installed on the rooftop of the geography department at UdeM roughly 20 m above the street level. Pollen grains impact a cylindrical drum covered by a melinex-coated film. The sampler at the site was calibrated to handle a flow of 10 liters of air per minute which roughly corresponds to human breathing [83]. The last step was the pollen counting which was conducted under a light microscope. Limitations of this type of measurement are numerous: electrical power outage may occur, malfunctioning of the clock, and obstruction of the inlet and the risk of uncertainty may be potentially important regarding human manipulation. For example, laboratory methodology, microscope manipulation and other errors may introduce biases [84]. The UdeM site has provided routine pollen monitoring for the whole study period. Weather Network public media (WXN) provides a 24 h pollen forecast. The forecast value is used in some comparison with model as shown below.

2.5. Regional Modelling and Pollen Emissions

GEM-MACH (Global Environmental Multiscale semi-coupled with the Model for Air quality and Chemistry) is the numerical platform used at ECCC (Environment and Climate Change Canada) to produce an air quality forecast in Canada. The model has been described elsewhere in the following references: Refs [85,86] for GEM; Refs [87,88] for MACH; and [54] to allow for pollen simulation. In this research, the model version 1.3.8 has been used to produce model outputs. Supplementary Material S2 gives detailed information about the modelling platform used here. The benefits of modeling pollen in the framework of regional air-quality models are multiple: (1) it can be used in forecast mode to predict pollen concentration; (2) it allows us to analyze potential synergetic effects of pollen with air pollutants; and (3) can eventually allow us to test how pollen could be effective cloud condensation nuclei (CCN) or ice nuclei (IN), which may affect precipitation and radiative forcing. In our study, we have focused on the first two aspects and leave (3) for future research.

3. Results

Given the complexity of allergic asthma and rhinitis and environmental trigger mechanisms, better analyses and tools need to be developed to understand and forecast better the impact of aeroallergens on these respiratory illnesses. Establishing seasonal and hourly patterns of pollen presence as well as asthma occurrence is a first step towards developing predictive capabilities of aeroallergens and related asthma/rhinitis. Mapping vulnerable zones where both atmospheric pollution and pollen load coincide is another useful tool to increase the knowledge to protect respiratory health. Below, we develop more on these two themes.

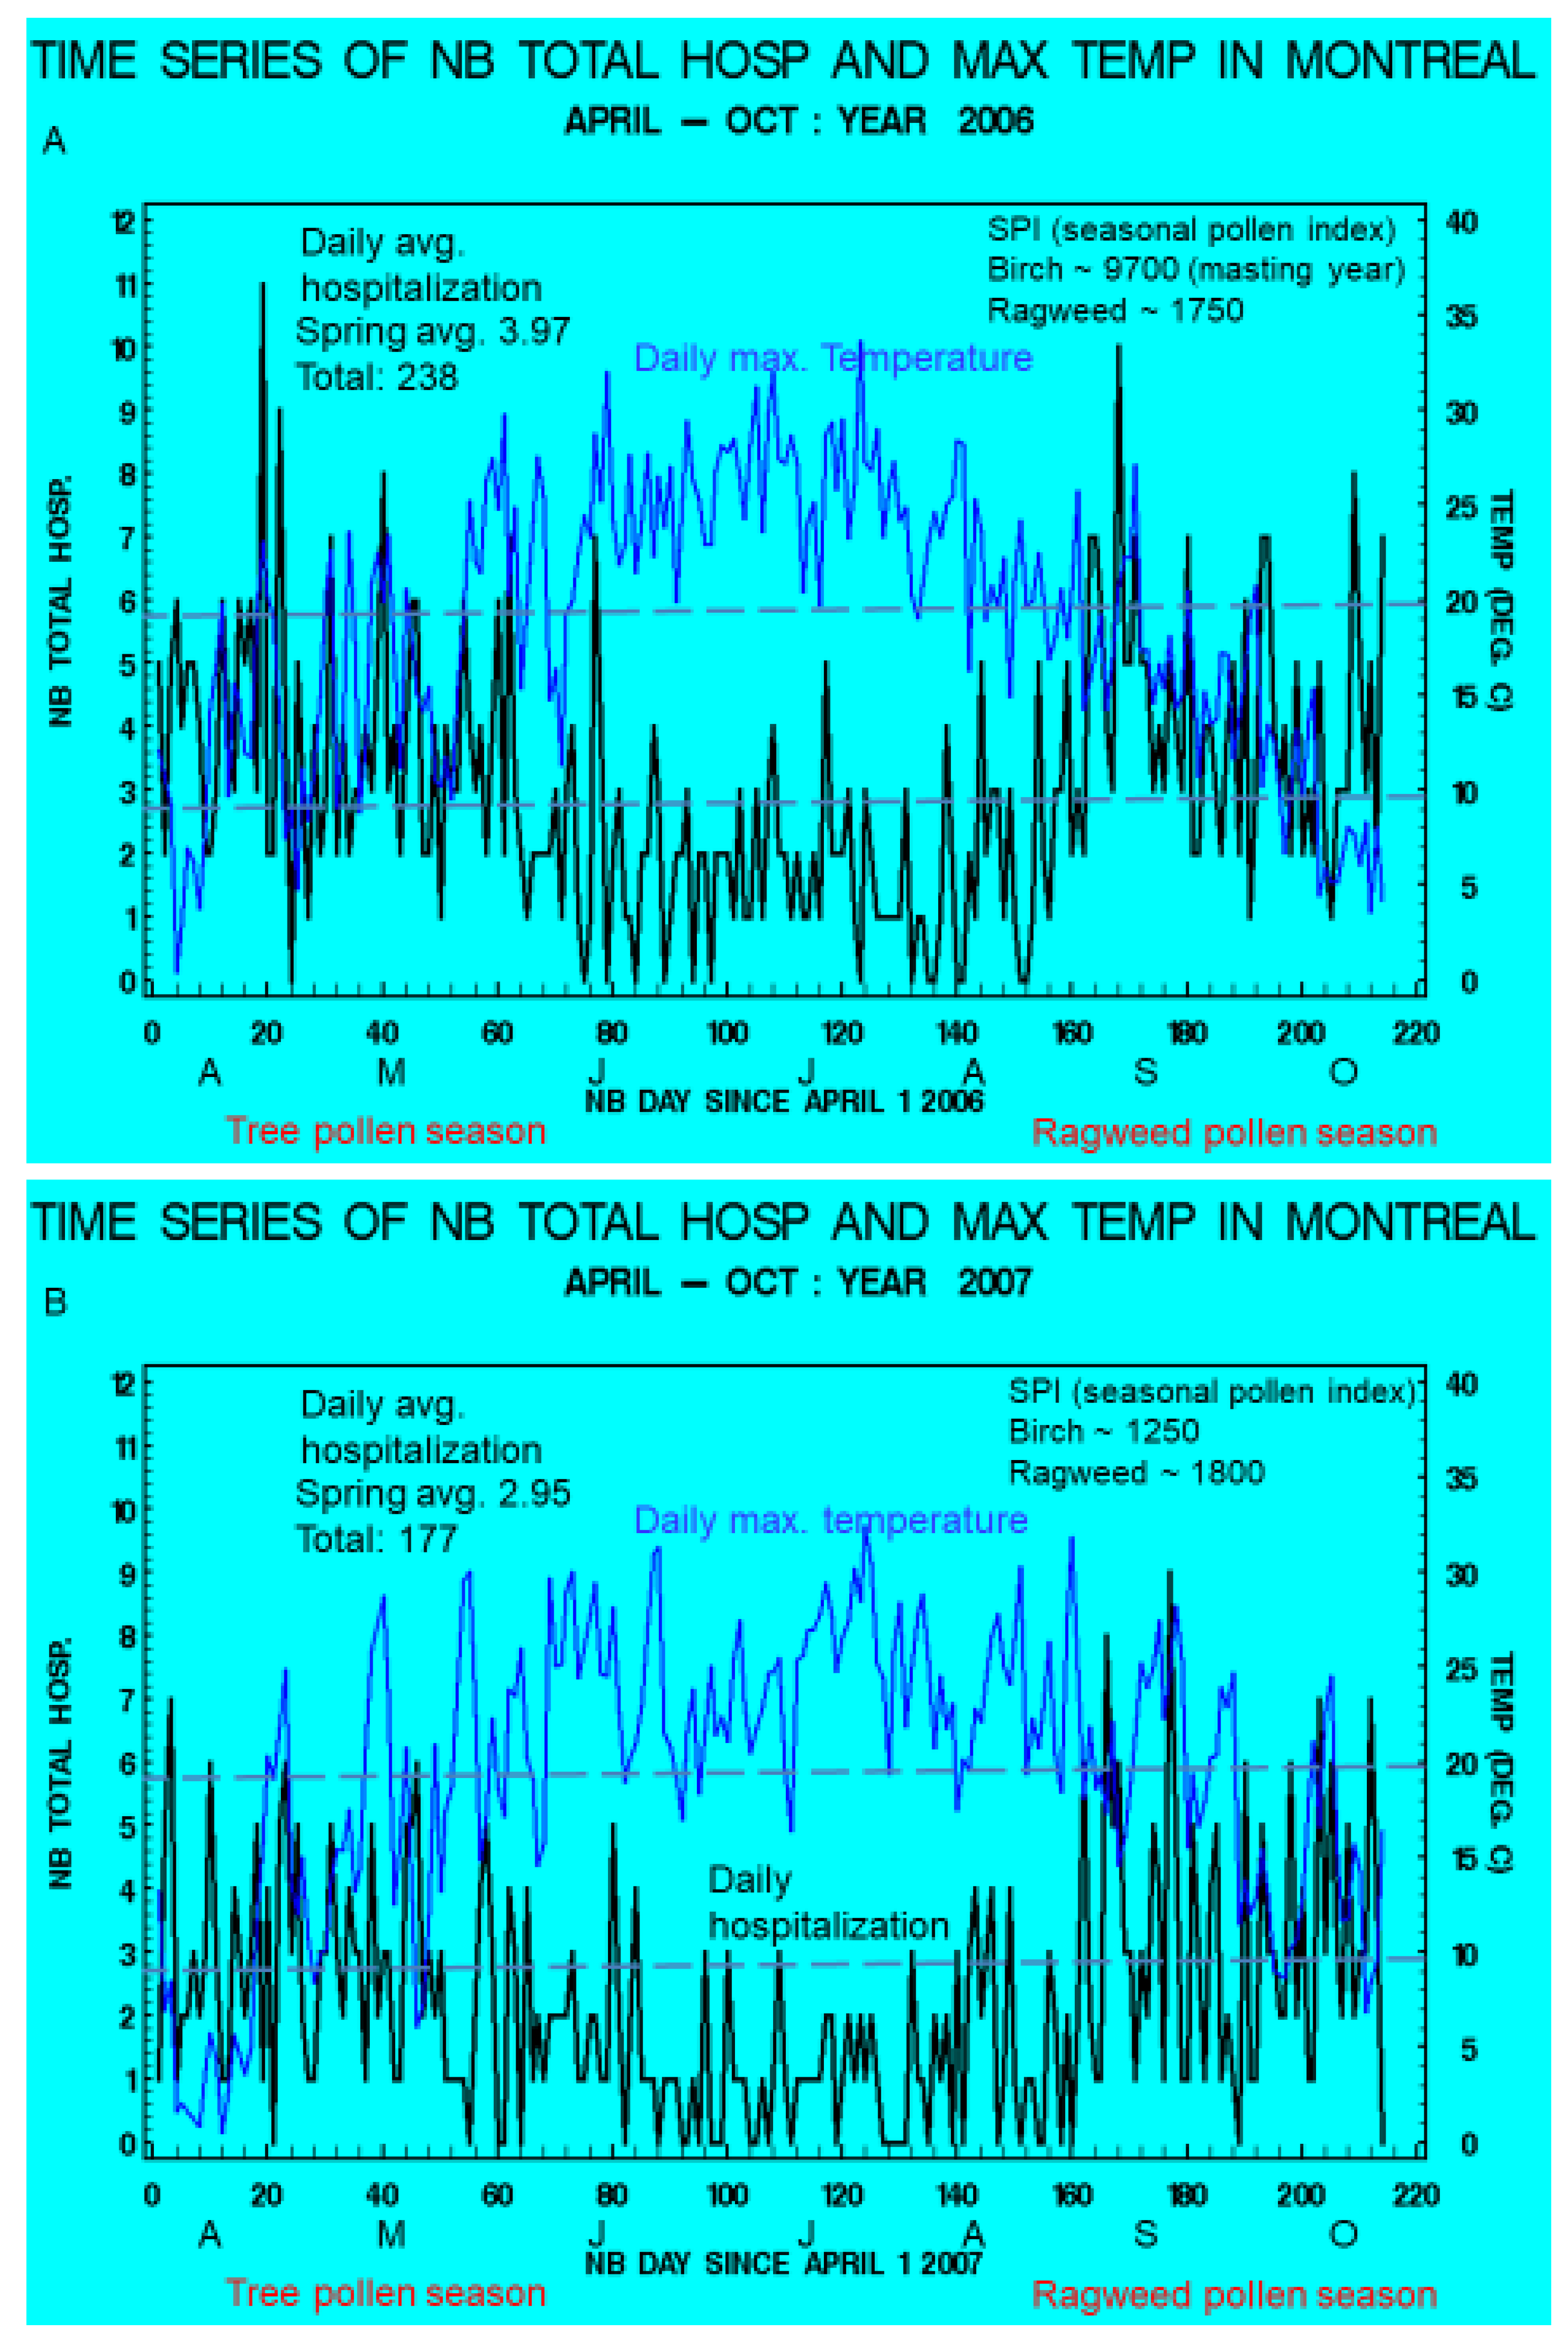
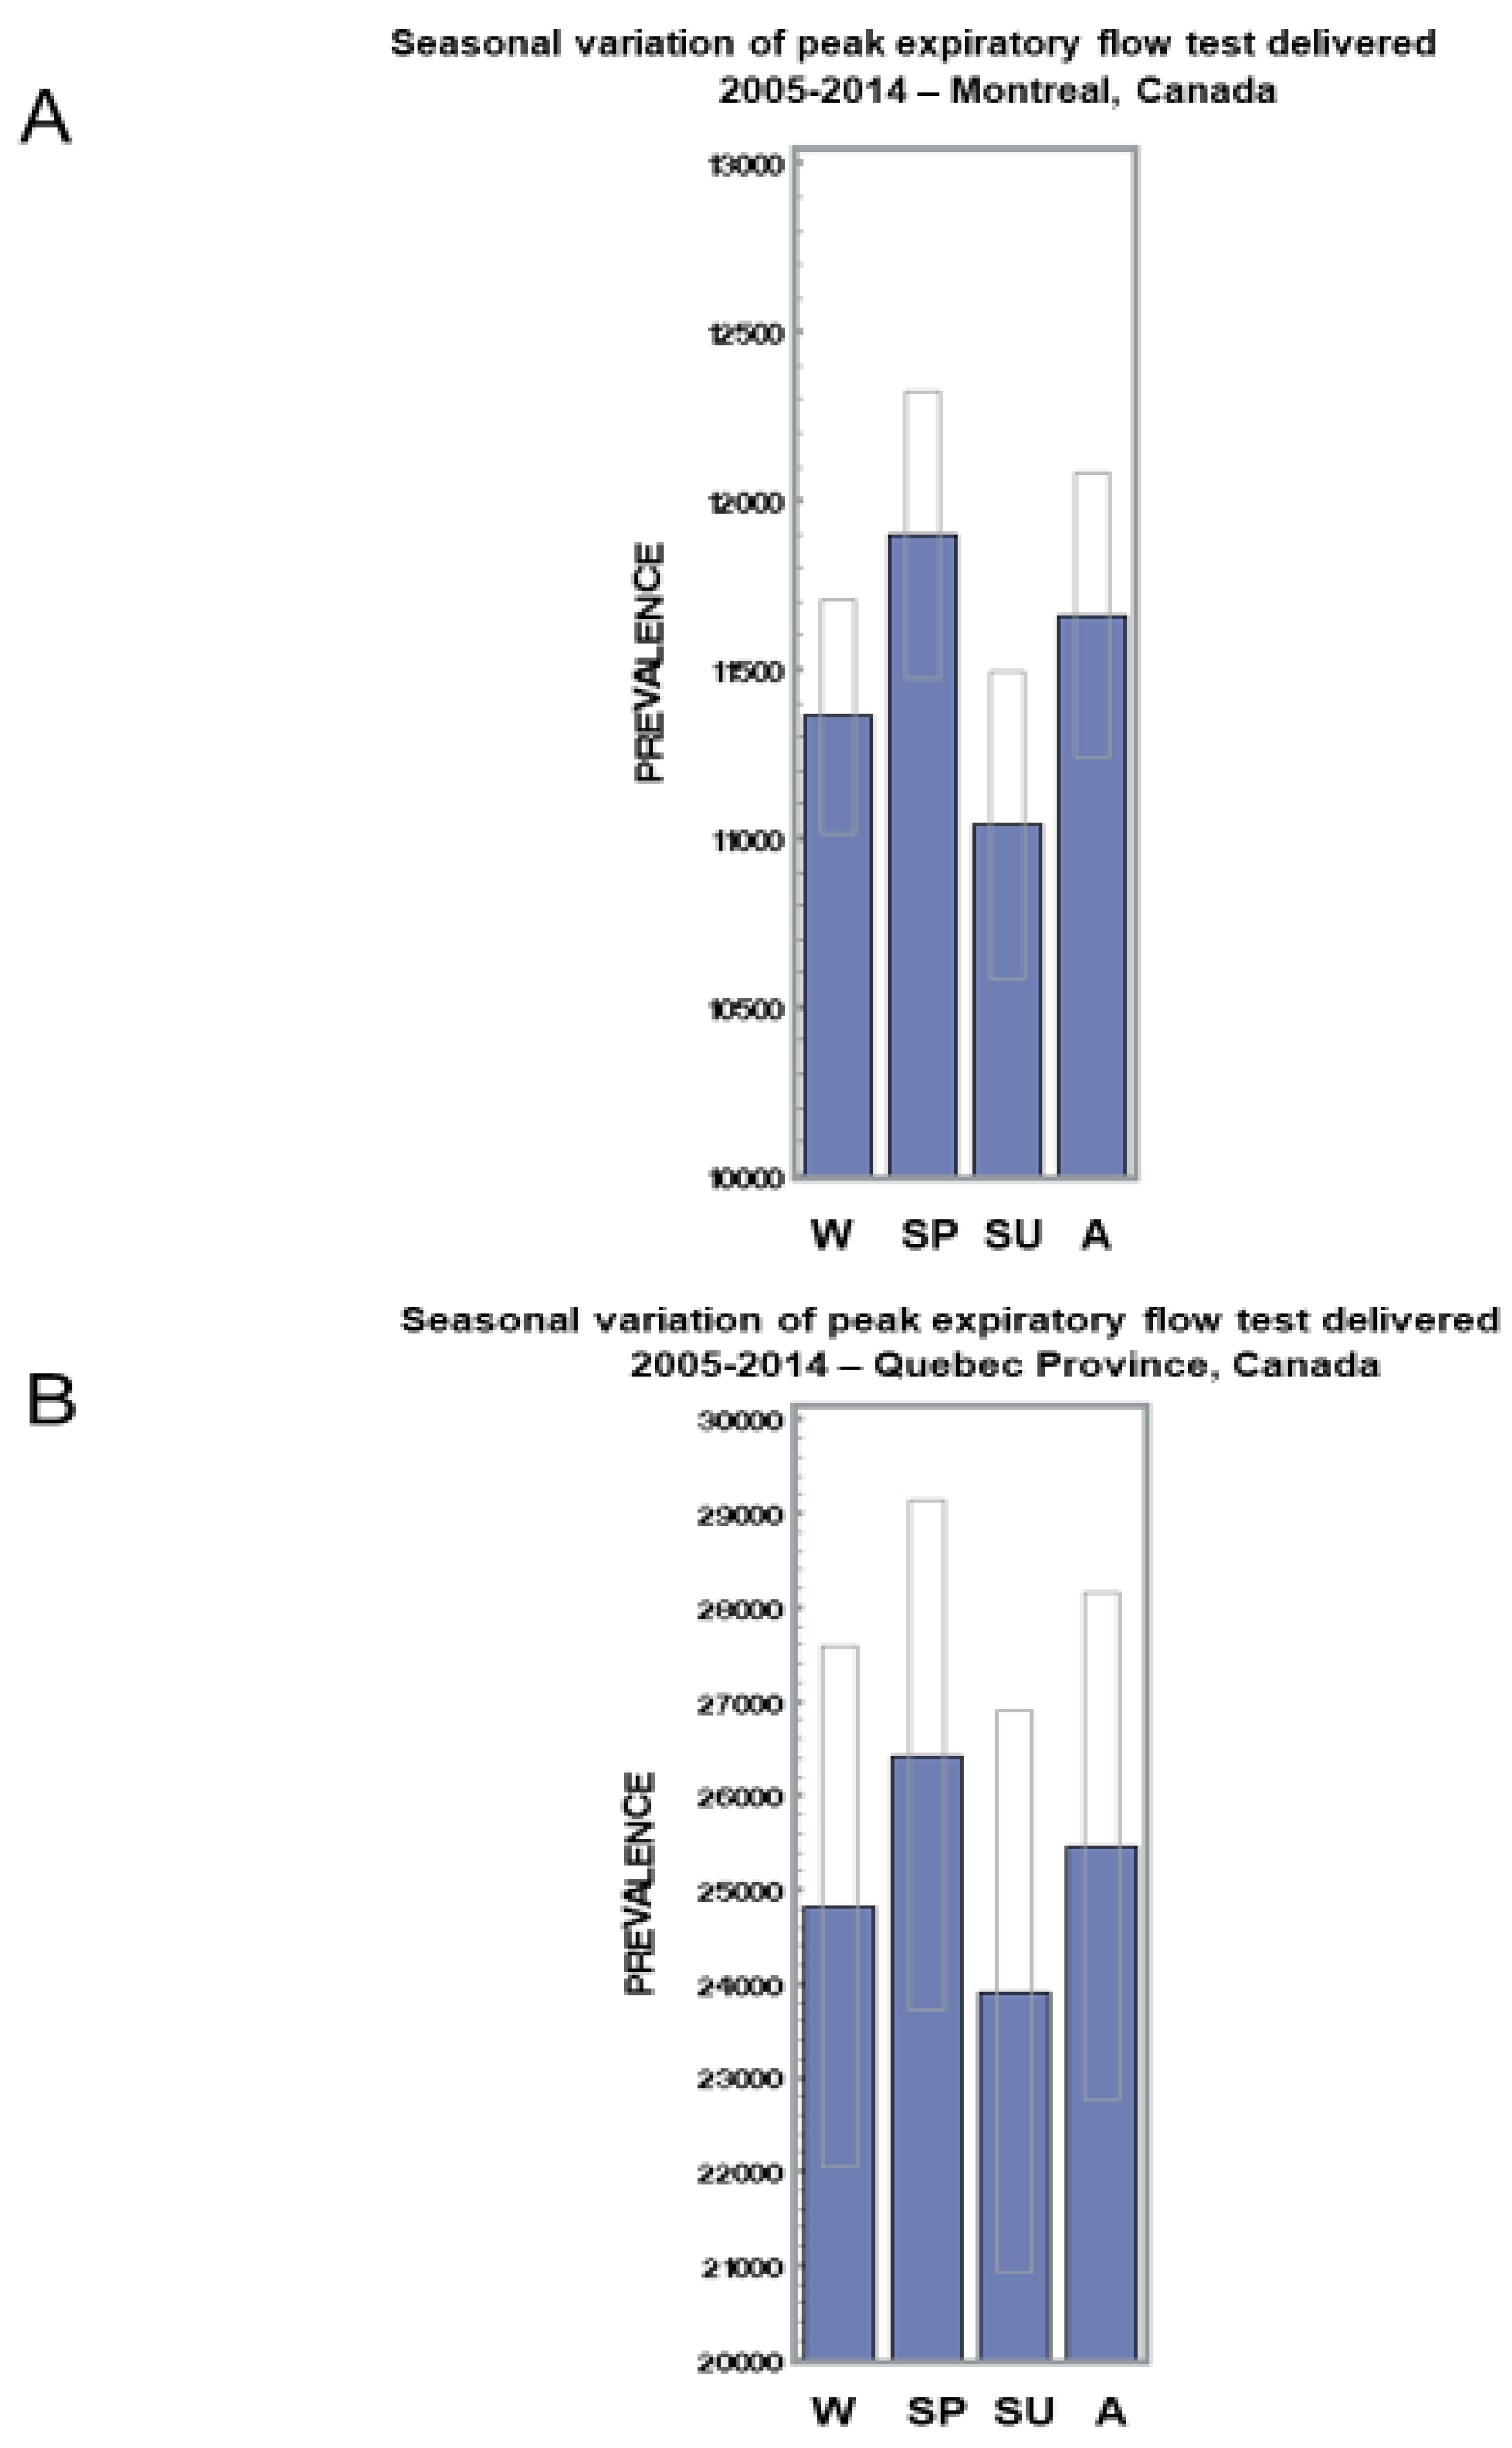
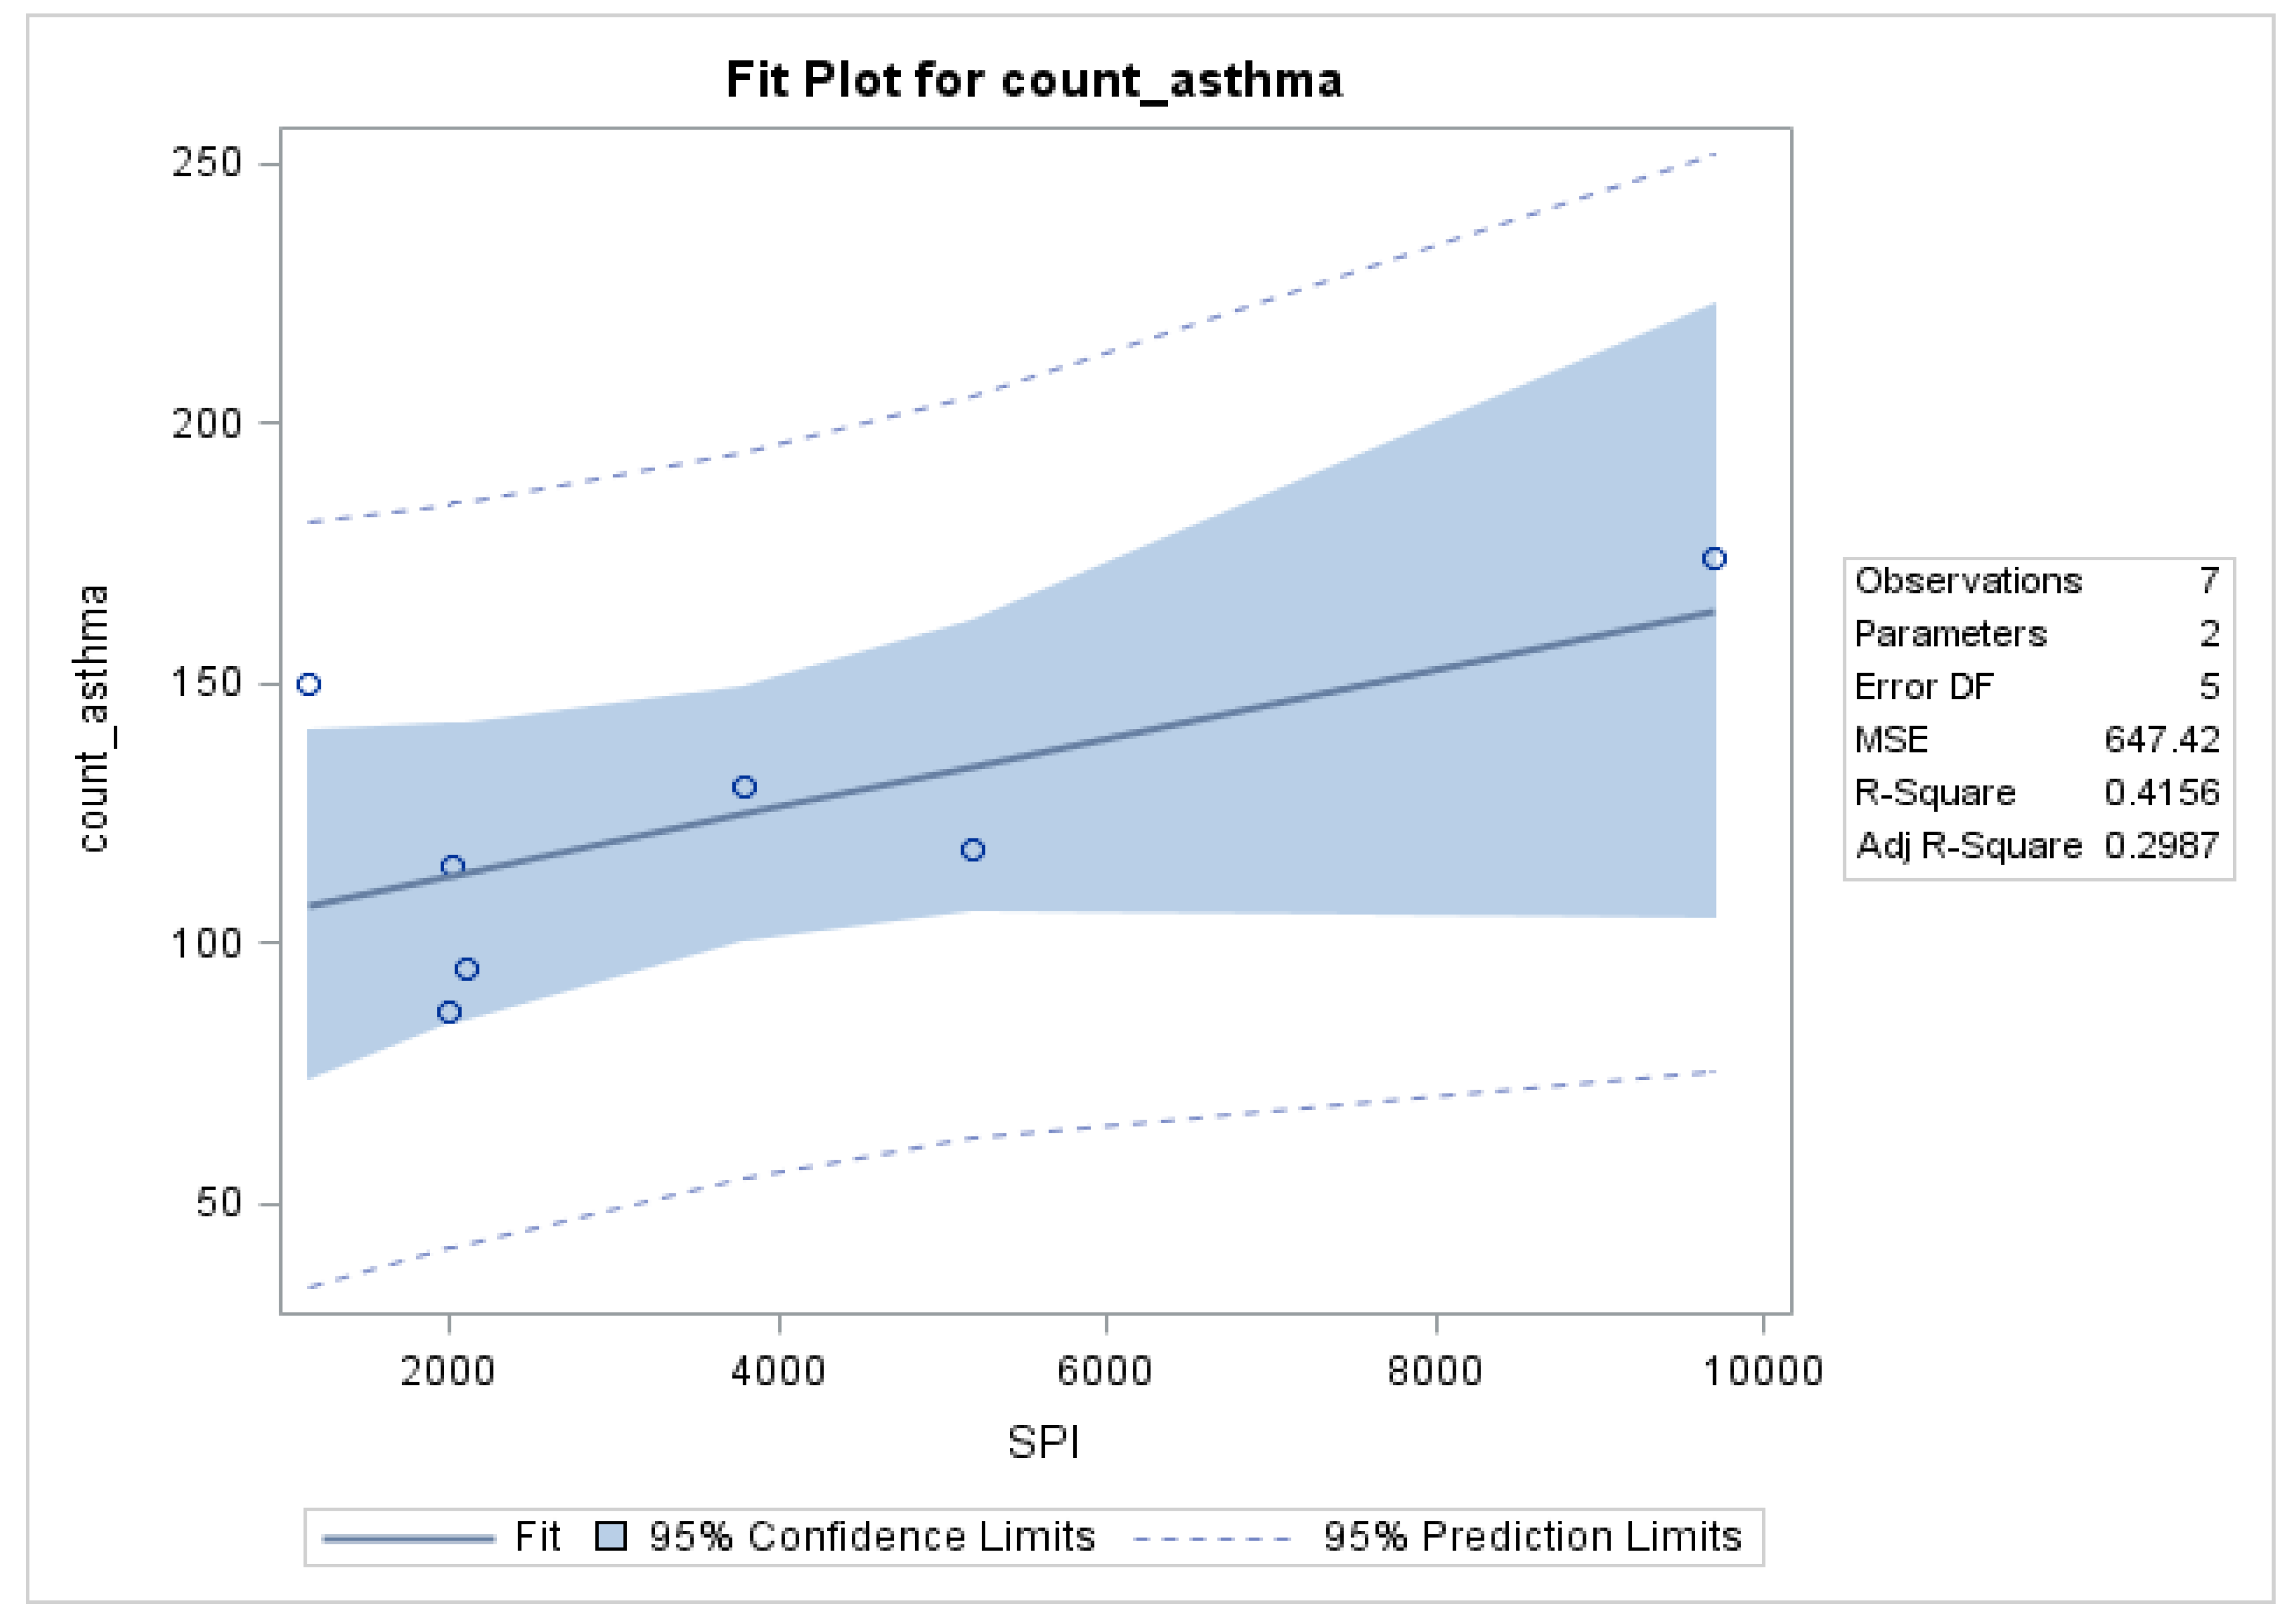
3.1. Seasonal Variations and Statistical Relationships between Daily Asthma Counts and Environmental Variables

Seasonal variation of asthma daily hospitalization is important to examine if we want to relate it to aeroallergens or other environmental factors which are themselves strongly dependent on the seasons. Figure 2A,B show a time series of daily asthma hospitalization (DAH) count and the daily maximum temperature for the warm season of the years 2006 and 2007 in Montreal. These two years represent, respectively, a high year and a low year for pollen production [25]. During the birch pollen season 2006, the seasonal pollen index (SPI) was more elevated (SPI = 9700) than that during the same season of the year of 2007 (SPI = 1250). Correspondingly, the daily average asthma hospitalization count was also more elevated, that is 3.97 (seasonal total = 238 hospitalizations) during the tree pollen season 2006 compared to 2.95 (seasonal total = 177 hospitalizations) for the year 2007. Note the lower daily average hospitalizations during the summer season in both years (while daily maximum temperature is peaking). Note also the increase of the DAH after summer, which is likely associated with the starting ragweed pollen season, which is known to peak in early autumn in Montreal [89]. To further investigate the seasonal dependency on respiratory risk, Figure 3 plots the mean prevalence for the demand of peak expiratory flow rate (PEFR) tests for each trimester during the period 2005–2014 for Montreal (Figure 3A) as well as for the rest of the province of Quebec (Figure 3B). The highest demand for PEFR tests occurs during the second trimester (i.e., spring tree pollen season). The increase from winter to spring (quarterly W to SP) of PEFR is about 550 counts on average for Montreal (Figure 3A) and 1600 counts for the whole province of Quebec (Figure 3B), which is likely due to the impact of tree pollen in spring. Figure 4 shows a plot relating the SPI index for birch pollen for every single year for the period 2006–2012 with the total number of asthma hospitalizations during the same period. Although the correlation is only marginally significant (p = 0.075), the explained variance is over 50% (R2 = 0.5019), suggesting a dominant link between SPI and counts of asthma hospitalization during the tree pollen season.
Altogether, Figure 2, Figure 3 and Figure 4 suggest a strong and robust seasonal dependency of respiratory risk for Montrealers which is likely related to pollen. As expected, this leaves no doubt to the significant influence of pollen on the asthma hospitalization count in Montreal and related disease (e.g., allergic rhinitis).
In a subtle way, daily weather also impacts daily hospitalization, as depicted by the phenomenon of thunderstorm asthma (as discussed in the Introduction). But even without a thunderstorm occurrence, different weather types present different respiratory risks. Figure 5 shows the daily mean hospitalization count for different weather types during the tree pollen season (Julian day 100–160 in Montreal). The description of weather types is given in Appendix A. In both weather type 9 (trowal, i.e., through of warm air aloft) and 12 (warm front) one can observe a significant increase (p < 0.05) in asthma hospitalizations as compared to some weather types (period 2006–2017). The concept of “frontal-asthma” has been suggested for the first time by Robichaud and Comtois [48] to explain a higher respiratory risk of asthma associated with active synoptic fronts (warm fronts and trowals). Air pollution also influences the asthma occurrence, but the link is not clear whether or not and how aeroallergens play a role. Table 2 suggests a complex relation between asthma triggering factors. First, Table 2A presents only a weak correlation between both ozone and pollen with asthma daily hospitalization count for lag0 (correlation within the same day), lag1 (current day for asthma count and previous day for environmental factors) and lag2 (2 days lag between asthma count and environmental variables). Note that the correlation with PM2.5 is negative with asthma hospitalization, which is biologically non-plausible, but such a relationship has been observed elsewhere [90,91]. The true link between asthma and environmental variables seems difficult to pinpoint. However, in Table 2B, all the correlations are re-computed for only specific weather types (7, 9 and 12) and for the four different geographical sectors of the city (see Figure 1). The reason for selecting these three particular weather types is that in these, the highest daily counts of daily hospitalizations were observed (Figure 5). The re-computed correlations in the specific weather types now become higher and more statistically significant (Table 2B). Therefore, evaluating the asthma statistics in different geographical sectors and under different weather types is useful to improve the understanding of asthma occurrence. These relationships between daily asthma counts and environmental variables are thought to be helpful to improve forecast of daily respiratory health risks.

3.2. Spatio-Temporal Coincidence of Birch Pollen and Air Pollutants

The coupled weather-chemical GEM-MACH platform is ideal to study pollen-pollutant interaction in Canada and the spatio-temporal coincidence between pollen and pollutant distribution. This is necessary to better evaluate the possible synergy between different environmental variables and allergic respiratory disease. Figure 6 shows the monthly average (May 2012) of diurnal profiles of near-surface pollutant concentrations and birch pollen load obtained from the GEM-MACH model simulations for May 2012. The ozone diurnal profile is the one which matches the most closely the birch pollen diurnal profile, suggesting a combined ozone-pollen exposure to the population and a possible synergistic effect on the health of the exposed population. Note also that the morning PM2.5 peak also roughly coincides with the simulated birch pollen peak at about 11 a.m. The classical Canadian AQHI index [80] whenever exceeding a threshold of four (significant health risk) is indicated by a green dot on the top of Figure 6. Therefore, the period of the day whenever AQHI poses a risk for health also coincides on average with birch pollen peak, suggesting a possible confounding effect of pollen on respiratory risk not represented by the actual AQHI index during the pollen season in epidemiological studies. The synergy between air pollutants and birch pollen could potentially be more active during the time window from late morning to early afternoon (11–14 h) in Montreal. During this period of the day, the triggers of asthma could be more present and, therefore, the combined pollen-pollutant public health risk higher. Note there is an emission peak from local birch trees noted near 8 a.m. (local time) which coincides with the morning peak of NO2 (rush-hour). Near local sources of pollen emission, the health risk could be also at times higher when both nitrogen dioxide and pollen emission window coincide. As discussed in the Introduction, nitration of pollen grains and its allergen is known to have synergistic impacts on respiratory disease. Further research is needed to elucidate these relationships.
Figure 7 shows the result of model output of birch pollen simulation together with spatial mapping of classical air pollutants (the latter was obtained by model-data fusion, see [92,93] for details). Birch model concentrations averaged over the month of May 2012 are shown on the left upper panel, PM2.5 on the right upper panel, NO2 on the left bottom panel and near-surface ozone on the right bottom panel. The simulation shows that the Toronto-Montreal-Quebec corridor, where most of the population of Eastern Canada is concentrated, experiences not only high air pollutant concentration (as expected) but also relatively high levels of birch pollen as well (not expected). The public health risk and the possible synergy between birch pollen and air pollutants is relatively high despite few sources of birch pollen in this corridor (see Figure S1 for the vegetation distribution). The discrepancy is explained by the regional transport which brings the pollen from source regions (e.g., forest of Laurentides and northern Ontario) to this corridor (which is also a river valley at lower elevation). This corridor acts as a trap for air pollutants and pollen aerosols posing a risk for allergic respiratory patients living in this region (which is also the most populated region of Canada). Note that in this corridor, the prevalence of asthma is the highest [1,94]. To a lesser extent, the region of Sudbury (Northern Ontario) also has an overlap between industrial pollution and birch pollen sources. Not surprisingly, asthma prevalence is relatively higher in this sector of Northern Ontario [1]. Therefore, Figure 7 (combined birch pollen and air pollution) depicts zones of vulnerability for asthmatic patients during spring birch pollen season (and likely during any species pollen season). In the future, more simulation and analysis should be carried out for other seasons and with other aeroallergen type to better assess the environmental risk (pollution-aeroallergen-weather synergy).
Finally, the time series of pollen simulation for Montreal are compared with observations (UdeM site) and with a public forecast issued by the Weather Network (WXN) in Figure 8. Three-day moving averages are used in all cases (model, observations and WXN). Model simulation shows very good agreement with observation (UdeM) as well as with the public forecast (WXN), suggesting robust model forecast for the daily forecast of birch pollen by the GEM-MACH model. Note that the highest values of birch pollen concentrations occur in a window between roughly 10 and 20 °C for average daily temperature (measured at Montreal’s Trudeau airport). Correspondingly, the asthma count of hospitalization was shown to be higher in this temperature range in Montreal (Figure 2A,B). This information is important since it constrains the highest risk of allergic respiratory disease to the days where temperature is within this window.

4. Discussion

Given the fact that smog and the number of days with poor air quality are usually relatively low in Montreal during spring and early autumn (although moderate in summer and higher in winter [95]), the results presented in Figure 2, Figure 3 and Figure 4 were somehow unexpected. Both asthma daily hospitalizations and counts of PEFR peak during spring and early autumn (during pollen tree season and weeds, respectively), and the presence of a minimum in summer in hospitalization and PEFR as shown in this paper, are hard to explain in terms of air pollution without including the impact of presence or absence of aeroallergens. In fact, these levels of asthma hospitalizations occurring in spring and early autumn do not correspond to peak levels of air pollutants (ozone, PM2.5 and NO2) in Montreal. Observations show that the peak within the city rather occurs in summer for ozone and winter or summer for PM2.5 but not in spring or autumn [95]. According to the literature, DAH seasonal patterns (minimum in summer and peak in spring and early fall) occur elsewhere as well and are not unique to Montreal. For example, a study made by Lajoie et al. [96] identified a similar seasonal pattern for the daily asthma emergency visits and DAH for the region of Quebec City (Canada). In Israel, Garty et al. [90] attributed the summer asthma minimum in hospital emergency visits to less medical services available during that season. However, it is believed that this hypothesis does not hold in the case of emergency services such as asthma hospitalizations as opposed to the count of non-emergency medical visits for asthma. The latter may be related to seasonal changes of medical resources availability [1]. Goldstein and Currie [97] analyzed the asthma emergency room visits in New York and New Orleans and also found peaks in spring and autumn. In Detroit (Michigan), a similar seasonal pattern of asthma was also noted [98]. Therefore, the results found in Figure 2, Figure 3 and Figure 4 here support the presence of a seasonal pattern of asthma in Montreal and other locations in North America, and the likely dominance of airborne pollen and other aeroallergens in explaining these peaks. However, in the future, the role of air pollution and its synergy with aeroallergens needs to be further clarified in the context of asthma management.
Across the world, many studies have shown that people exposed to both plant allergens and ozone are likely to become more ill and with more frequency than people exposed to just one of the two factors [9,10,12,99]. The combination of ozone and pollen in Figure 6 shows the coincidence of ozone and birch pollen diurnal profile supporting the importance of a possible pollen-ozone interaction. This is consistent with the report in 2014 that 34 out of the top 50 “Asthma Capitals” identified by the Asthma and Allergy Foundation of America (AAFA) are in US counties where both problems of pollen and ozone occur [100]. In the US, more than 100 million people are exposed to both ozone exceeding air quality standards and significant pollen load at the same time. In Ontario, Crighton et al. [1] found that the asthma prevalence is higher in a corridor from Windsor through Toronto and extending eastward towards Montreal. This result is entirely consistent with the results of Figure 7, which shows numerous hot spots of both birch pollen concentration overlapping air pollution hot spots. This would suggest a vulnerable zone for a west to east corridor of pollution in Southern Ontario (just north of Lake Ontario) which is suspected to extend through the province of Quebec through Montreal and Quebec City. This zone of overlapping aeroallergens and pollution does not necessarily present a threat for other respiratory disease such as COPD (chronic obstructive pulmonary disease), a disease not related to aeroallergens. In fact, according to Crighton et al. [101], COPD does not show a spatial pattern of maximum in the corridor mentioned above. This suggests that the aeroallergen-pollution synergy is typical of asthma, but likely absent for COPD, although the latter disease is also related to air pollution [2].
Both ozone concentrations and pollen occurrence are likely to increase with climate change [3,99]. Moreover, the allergenicity of plants might also increase with climate change (such as for birch, see [12,28]). Finally, several researchers [92,102] have found that air pollutants such as ozone show an increasing trend during springtime at least in some parts of North America (a period coinciding with the tree pollen season). Moreover, the coincidence of nitrogen dioxide and PM2.5 has been shown to increase the asthmatic reaction during inhalation of allergenic pollen [103]. In Figure 7, in the Toronto-Montreal-Quebec corridor, this is exactly the situation with higher levels of these two pollutants and prevalence of asthma, which is also higher, according to medical studies, both in Ontario in this corridor (1) as well as in the province of Quebec [94,96].
Producing numerical simulations of pollen dispersion (from tree, grass or weeds) may seem straightforward if a sound model for pollen emission is available (e.g., [104]) but numerous questions remain unanswered, such as the need to develop adequate phenology models or techniques to predict the start of the pollen season and its length, two critical parameters required to feed the pollen emission module. The production of such a phenology model is for now limited to small regions or countries as pointed in the literature [48,105,106] and cannot be easily extrapolated to large regions such as a territory as large as Canada. The second challenge is the modelling of allergen release under different environmental factors (which could not be tackled in this research) and which is especially difficult given the absence of measurement of these sub-pollen aerosols and related aeroallergens. Vertical measurement of pollen and related bioaerosols (subpollen particles and debris) is also needed. Up to now, very few measurements have been taken for vertical sounding of pollen [53,107], and none for aeroallergens.
Long-range transport of aeroallergens is another complication which shows up whenever analyzing the link between aeroallergen load, air pollution and health impact. It seems plausible that the pollen, which has undergone long-range transport, has been exposed over vast regions of pollution and becomes contaminated by pollution that the pollen emitted locally in rural regions. This would explain, in part, the higher prevalence of respiratory allergies in urban compared to rural environments. Although, the major sources of birch pollen and other aeroallergens may not necessarily be in urban areas such as Montreal, they are regionally transported from source regions [54,61] and could get trapped in corridor valleys such as the Lower Great Lakes and St Lawrence valley (as indicated in Figure 7). In this corridor lies a great density of the population, so the exposure to both birch pollen and air pollutants is enhanced. Note, finally, that popular techniques such as land-use regression models as a mapping tool for aeroallergens and pollen [70,108] may fail if the pollen source is not local but transported from regional sources. Taking into account regional transport of pollen is crucial as shown for birch pollen in this study, e.g., the main sources of birch pollen are located in the Laurentides but most of the pollen ends up in the Toronto-Montreal-Quebec corridor. The difference between Figure S1 (pollen sources) and the actual pollen distribution by the regional transport (Figure 7) is striking and it is obvious that neglecting regional transport and long-range transport is not possible. Robichaud and Comtois [54], using the GEM-MACH model, showed that less than 1% of the birch pollen arriving in Montreal is of local origin.
This paper has provided some tools to help allergy sufferers avoid exposure by better forecast and identifying vulnerability zones, seasonal cycles of birch pollen, zones of pollen-pollution overlap and weather types more likely associated with asthma hospitalization. According to AAPCEH [109]: “Avoiding environmental allergens and irritants is one of the primary goals of good asthma management” and the information presented here could be helpful as a tool for this strategy to become successful.

5. Conclusions

Aeroallergen load in the atmosphere will likely increase in the future as global warming continues [9,10,11]. This will likely increase population exposure to aeroallergens in combination with air pollution. Longer pollen seasons, higher SPI and higher population exposure will likely become more common. For example, the length of the birch pollen season in Montreal over the past three decades or so has increased by 2.6 days per decade [48]. Therefore, it is important to develop tools to forecast and map aeroallergens more accurately, identify at which moment of the day and the season this risk is the highest, and understand better the synergy between aeroallergens, air pollution and weather. Currently, a pollen allergy forecast is available both in Canada and USA (actually run by private consortiums), but a better involvement and a more multidisciplinary work is required to examine the aeroallergen-pollution-weather synergy and its impact on public health. It is essential to develop exposure–outcome functions which combine both aeroallergens and air pollution for any future epidemiological analysis, especially given global warming where the pollen load is expected to increase in the future [9,10,11,27]. Finally, forecasting tools and related analyses (such as mapping the most vulnerable regions for allergic patients) are needed to better protect public health against aeroallergens and their potential synergy with air pollutants on a daily basis, such as presented in this paper. Three major challenges will need to be overcome for efficient pollen plant forecasts to be successful in the future: (1) better phenology models (to efficiently predict the start and length of the pollen season) and covering large areas such as Canada; (2) increase the knowledge of pollen-pollutant-weather synergy; and (3) implant measurements of all bioaerosols (not only for pollen grain and spores but also for more allergenic inner-pollen and fragments which can penetrate deeper in the respiratory tract and trigger asthma). The main conclusions of this paper are:
(1)
An increase of monitoring pollen and associated allergens (subpollen and pollen fragments) is necessary in Canada to better assess the population exposure and to better understand the relation to asthma and related disease (e.g., allergic rhinitis).
(2)
The use of satellite data to evaluate in near real-time phenology parameters (which are critical input to pollen emission simulation) should be further developed.
(3)
The modelling aspects related to pollen-pollutant-weather synergy must be closely examined. The link between asthma and air pollutants is not clear (Table 2A) but becomes significant whenever the pollen-pollution-weather synergy is revealed (such as Table 2B).
(4)
Developing a machine-learning algorithm to predict pollen/allergen occurrence is desirable.
(5)
Predicting pollen concentration using land-use regression models only without a regional transport model is not adequate, at least in the case of birch pollen in Canada.
(6)
A strong regional variation of overlap between birch pollen and air pollution is revealed by GEM-MACH simulation within most zones of higher health risk in Canada (Windsor area, Toronto-Montreal-Quebec corridor and Sudbury regions). Better characterization of this variability is needed to better understand the link between asthma and environmental factors.
Finally, it is recommended that any asthma forecast, prevention and/or avoidance guidelines should take into consideration weather (including regional transport model of aeroallergens by the wind), seasonal patterns, air pollution, aeroallergens and their possible synergy. This is essential to get a complete picture in the case of anemophilous pollen such as birch. An aeroallergen alert system would benefit from a model of aeroallergen production and dispersion that also incorporates weather-related variations and long-term impacts of climate change and could be coupled with existing air quality predictions.

Supplementary Materials

The following are available online at https://www.mdpi.com/article/10.3390/atmos12060789/s1, Figure S1: Vegetation density (Birch) over the eastern portion of North America, Figure S2: Components of the atmospheric modelling system including pollen simulation. Note. BC stands for boundary conditions, DB for database, OA for Objective analysis (model-data fusion) and AQ for air quality, Table S1: Parameters used in the pollen modelling simulation (H04: [104], S06: [61], S13: [64]).

Funding

This research received no external funding.

Institutional Review Board Statement

Not applicable.

Informed Consent Statement

Not applicable.

Data Availability Statement

Any data will be provided upon request.

Acknowledgments

Health data used in this study’s analysis was obtained through INSPQ thanks to Robert Pampalon (now retired) and processed by Denis Hamel of the INSPQ. Birch pollen data were made available from Paul Comtois of Université de Montréal. The author thanks the GEM-MACH team for their help in running version V1.3.8 and make configuration of GEM-MACH available for this project (particularly Pabla Balbir and Radenko Pavlovic from ECCC) and to Janusz Pudykiewicz for kindly reviewing this paper. Finally, acknowledgment goes to US/EPA AIRNow program and also CAPMON and NAPS program managed by Environment Canada for the free use of surface ozone and PM2.5 data and NO2 data.

Conflicts of Interest

The author declares no conflict of interest.

Appendix A. Weather Types Used and Most Likely Associated Clouds and Weather

Table A1. Description of synoptic meteorology classes (i.e., weather type) over Montreal with its impact on clouds and weather. The last column indicates the number of cases and frequency of each type during spring periods of years 2006–2008 (observed at 18 UTC, i.e., mid-afternoon).
Weather Types Impacting MontrealClouds and Weather in MontrealNb. Cases Frequency (%) (18 UTC)
1Back of the high pressure located on the eastern US seabordSunny with temperature much above normal (i.e., heat wave).11 (4.5%)
2Flat pressure gradientCalm winds. Temperature are often above normal.10 (4.1%)
3Warm sectorTemperature above normal (unstable situation) with southerly winds.18 (7.4%)
4Cold front passageSudden changes of wind (speed and direction) and temperatures turning colder.21 (8.6%)
5Behind cold frontNorthwest winds and colder and below normal.5 (2.1%)
6Approaching high pressureSunny, windy and cool.19 (7.8%)
7Ridge of high pressureSunny skies, dry and windy.19 (7.8%)
8Low pressureClouds and steady light rain.34 (14.0%)
9Occluded frontUnstable, clouds and showers, turbulence.10 (4.1%)
10Approaching lowIncreasing cloudiness and winds.13 (5.3%)
11Surface throughWindy, cloudy and unstable, risk of showers.29 (11.9%)
12Warm frontCloudy, unstable, showers, increasing temperature and humidity.13 (5.3%)
13Unclassified/missing dataVariable41(16.9%)

References

  1. Crighton, E.J.; Feng, J.; Gershon, A.; Guan, J.; To, T. A spatial analysis of asthma prevalence in Ontario. Can. J. Public Health 2012, 103, 384–389. [Google Scholar] [CrossRef]
  2. Public Health Agency of Canada. Report from the Canadian Chronic Disease Surveillance System: Asthma and Chronic Obstructive Pulmonary Disease (COPD) in Canada; Public Health Agency of Canada: Ottawa, ON, Canada, 2018; ISBN 978-0-660-09274-4.
  3. Sierra-Heredia, C.; North, M.; Brook, J.; Daly, C.; Ellis, A.K.; Henderson, D.; Henderson, S.B.; Lavigne, É.; Takaro, T.K. Aeroallergens in Canada: Distribution, public health impacts, and opportunities for prevention. Int. J. Res. Public Health 2018, 15, 1577. [Google Scholar] [CrossRef] [PubMed] [Green Version]
  4. Patrick, D.M.; Sbihi, H.; Dai, D.L.Y.; Mamun, A.; Rasali, D.; Rose, C.; Marra, F.; Boutin, R.C.T.; Petersen, C.; Stiemsma, L.T.; et al. Decreasing antibiotic use, the gut microbiota, and asthma incidence in children: Evidence from population-based and prospective cohort studies. Lancet Respir. Med. 2020, 8, 1094–1105. [Google Scholar] [CrossRef]
  5. Asher, M.I.; Montefort, S.; Björkstén, B.; Lai, C.K.; Strachan, D.P.; Weiland, S.K.; Williams, H.; the ISACC Phase Three Group. Worldwide time trends in the prevalence of symptoms of asthma, allergic rhinoconjunctivitis, and eczema in childhood: ISAAC Phases One and Three repeat multi-country cross-sectional survey. Lancet 2006, 368, 733–743. [Google Scholar] [CrossRef]
  6. Eder, W.; Ege, M.J.; von Mutius, E. The asthma epidemic. N. Engl. J. Med. 2006, 355, 2226. [Google Scholar] [CrossRef] [Green Version]
  7. Anandan, C.; Nurmatov, U.; van Schayck, O.C.P.; Sheik, A. Is the prevalence of asthma declining? Systematic review of epidemiological studies. Allergy 2010, 65, 152–167. [Google Scholar] [CrossRef]
  8. Beasly, R.; Semprini, A.; Mitchell, E.A. Risk factors for asthma: Is prevention possible? Lancet 2015, 386, 1075–1085. [Google Scholar] [CrossRef]
  9. D’Amato, G.; Holgate, S.T.; Pawankar, R.; Ledford, D.K.; Cecchi, L.; Al-Ahmad, M.; Al-Enezl, F.; Al-Muhsen, S.; Ansotegui, I.; Baena-Cagnani, C.E.; et al. Meteorological conditions, climate change, new emerging factors, and asthma and related allergic disorders. A statement of the World Allergy Organization. World Allergy Organ. J. 2015, 8, 25. [Google Scholar] [CrossRef] [Green Version]
  10. D’Amato, G.; Vitale, C.; D’Amato, M.; Cecchi, L.; Liccardi, G.; Molino, A.; Vatrella, A.; Sanduzzi, A.; Maesano, C.; Annesi-Maesano, I. Thunderstorm-related asthma: What happens and why. Clin. Exp. Allergy 2015, 46, 390–396. [Google Scholar] [CrossRef] [PubMed]
  11. Anderegg, W.R.L.; Abatzoglou, J.T.; Anderegg, L.D.L.; Bielory, L.; Kinney, P.L.; Ziska, L. Anthropogenic climate change is worsening North American pollen season. Proc. Natl. Acad. Sci. USA 2021, 118, e2013284118. [Google Scholar] [CrossRef] [PubMed]
  12. ANSES. État des Connaissances sur l’Impact Sanitaire lié à l’Exposition de la Population Générale aux Pollens Présents dans l’Air Ambient; Agence Nationale de Sécurité Sanitaire de l’Alimentation, de l’Environnement et du Travail; Avis de l’ANSES: Buenos Aires, Argentina, 2014; Saisine 2011-SA-0151. [Google Scholar]
  13. Keith, P.K.; Desrosiers, M.; Laister, T.; Schellenberg, R.R.; Waserman, S. The burden of allergic rhinitis (AR) in Canada: Perspectives of physicians and patients. Allergy Asthma Clin. Immunol. 2012, 8, 7. [Google Scholar] [CrossRef] [Green Version]
  14. Saxon, A.; Diaz-Sanchez, D. Air pollution and allergy: You are what you breathe. Nat. Immunol. 2005, 6, 223–226. [Google Scholar] [CrossRef] [PubMed]
  15. Traidl-Hoffmann, C.; Jakob, T.; Behrendt, H. Determinants of allergenicity. J. Allergy Clin. Immunol. 2009, 123, 558–566. [Google Scholar] [CrossRef]
  16. Behrendt, H.; Becker, W.M.; Fritzsche, C.; Sliwa-Tomczok, W.; Tomczok, J.; Friedrichs, K.H.; Ring, J. Air pollution and allergy: Experimental studies on modulation of allergen release from pollen by air pollutants. Int. Arch. Allergy Immunol. 1997, 113, 69–74. [Google Scholar] [CrossRef]
  17. Behrendt, H.; Krämer, U.; Schäfer, T.; Kasche, A.; Eberlein-König, B.; Darsow, U.; Ring, J. Allergotoxicology—A research concept to study the role of environmental pollutants in allergy. ACI Int. 2001, 13, 122–128. [Google Scholar]
  18. Schäppi, G.F.; Suphioglu, C.; Taylor, P.E.; Knox, R.B. Concentrations of the major birch tree allergen Bet v 1 in pollen and respirable fine particles in the atmosphere. J. Allergy Clin. Immunol. 1997, 100, 656–661. [Google Scholar] [CrossRef]
  19. Behrendt, H.; Becker, W.M. Localization, release and bioavailability of pollen allergens: The influence of environmental factors. Curr. Opin. Immunol. 2001, 13, 709–715. [Google Scholar] [CrossRef]
  20. Behrendt, H.; Majd, A.; Chehregani, A.; Moin, M.; Gholami, M.; Kohno, S.; Nabe, T.; Shariatzade, M.A. The effects of air pollution on structures, proteins and allergenicity of pollen grains. Aerobiologia 2004, 20, 111–118. [Google Scholar]
  21. Reinmuth-Selzle, K.; Kampf, C.J.; Lucas, K.; Lang-Yona, N.; Frohlich-Nowoisky, J.; Shiraiwa, M.; Lakey, P.S.; Lai, S.; Liu, F.; Kunert, A.T.; et al. Air Pollution and Climate Change Effects on Allergies in the Anthropocene: Abundance, Interaction, and Modification of Allergens and Adjuvants. Environ. Sci. Technol. 2017, 51, 4119–4141. [Google Scholar] [CrossRef] [PubMed]
  22. Rasmussen, A. The effects of climate change on the birch pollen season in Denmark. Aerobiologia 2002, 18, 253–265. [Google Scholar] [CrossRef]
  23. Walther, G.R.; Post, E.; Convey, P.; Menzel, A.; Parmesan, C.; Beebee, T.J.C.; Fromentin, J.M.; Hoegh-Guldberg, O.; Bairlein, F. Ecological responses to recent climate change. Nature 2002, 416, 389–395. [Google Scholar] [CrossRef] [PubMed]
  24. Emberlin, J.; Laaidi, M.; Detandt, M. Changement climatique et évolution du contenu pollinique de l’air dans sept pays européens: Exemple du bouleau. Rev. Fr. D’allergologie Et D’immunologie Clin. 2007, 47, 57–63. [Google Scholar] [CrossRef]
  25. Robichaud, A.; Comtois, P. Statistical modelling, forecasting and time series analysis of birch phenology in Montreal, Canada. Aerobiologia 2017, 33, 529–554. [Google Scholar] [CrossRef]
  26. Frey, T.; Gassner, E. Climate change and its impact on birch pollen quantities and the start of the pollen season: An example from Switzerland for the period 1969–2006. Int. J. Biometeorol. 2008, 52, 667–674. [Google Scholar] [CrossRef] [PubMed]
  27. Ziska, L.H.; Makra, L.; Harry, S.K.; Bruffaerts, N.; Hendrickx, M.; Coates, F.; Saarto, A.; Thibaudon, M.; Oliver, G.; Damialis, A.; et al. Temperature-related changes in airborne allergenic pollenabundance and seasonality across the northern hemisphere: A retrospective data analysis. Lancet Planet Health 2019, 3, e124–e131. [Google Scholar] [CrossRef] [Green Version]
  28. Ahlholm, J.U.; Helander, M.L.; Savolainen, J. Genetic and environmental factors affecting the allergenicity of birch pollen (Betula pubescens ssp. Czerepanobii (Orl) Hämet-Ahti). Clin. Exp. Allergy 1998, 28, 1384–1388. [Google Scholar] [CrossRef]
  29. Taylor, P.E.; Flagan, R.C.; Valenta, R.; Glovsky, M.M. Release of allergens as respirable aerosols: A link between grass pollen and asthma. J. Allergy Clin. Immunol. 2002, 109, 51–56. [Google Scholar] [CrossRef] [PubMed]
  30. Taylor, P.E.; Flagan, R.C.; Miguel, A.G.; Valenta, R.; Glovsky, M. Birch pollen rupture and the release of aerosols of respirable allergens. Clin. Exp. Allergy 2004, 34, 1591–1596. [Google Scholar] [CrossRef]
  31. Miguel, A.G.; Taylor, P.E.; House, J.; Glovsky, M.M.; Flagan, R.C. Meteorological influences on respirable fragment release from Chinese Elm pollen. Aerosol Sci. Technol. 2006, 40, 690–696. [Google Scholar] [CrossRef] [Green Version]
  32. Sénéchal, H.; Visez, N.; Charpin, D.; Shahali, Y.; Peltre, G.; Biolley, J.P.; Lhuissier, F.; Couderc, R.; Yamada, O.; Malrat-Domenge, A.; et al. A review of the effects of major atmospheric pollutants on pollen grains, pollen content and allergenicity. Sci. World J. 2015, 2015, 940243. [Google Scholar] [CrossRef] [PubMed] [Green Version]
  33. Sedghy, F.; Varasteh, A.-R.; Sankia, M.; Moghadam, M. Interaction between air pollutants and pollen grains: The role on the rising trend in allergy. Rep. Biochem. Mol. Biol. 2018, 6, 219–224. [Google Scholar] [PubMed]
  34. Peltre, G. Inter-relationship between allergenic pollens and air pollution. Allerg. Immunol. 1998, 30, 324–326. [Google Scholar]
  35. Chassard, G.; Choël, M.; Gosselin, S.; Vorng, H.; Petitprez, D.; Shahali, Y. Kinetic of NO2 uptake by Phleum pratense pollen: Chemical and allergenic implications. Environ. Pollut. 2015, 196, 107–113. [Google Scholar] [CrossRef]
  36. Okuyama, Y.; Matsumoto, K.; Okochi, H.; Igawa, M. Adsorption of air pollutants on the grain surface of Japanese cedar pollen. Atmos. Env. 2007, 41, 253–260. [Google Scholar] [CrossRef]
  37. Rantio-Lehtimäki, A.; Viander, M.; Koivikko, A. Airborne birch pollen antigens in different particle sizes. Clin. Exp. Allergy 1994, 24, 23–28. [Google Scholar] [CrossRef] [PubMed]
  38. Puc, M.; Kotrych, D.; Lipiec, A.; Rapiejko, P.; Siergiejko, G. Birch pollen grains without cytoplasmic content in the air of Szczecin and Bialystok. Alergoprofil 2016, 12, 101–105. [Google Scholar]
  39. Laaidi, M.; Chinet, T.; Aegerter, P. Allergies au pollen, pollution et climat: Revue de la littérature. Rev. Fr. D’allergologie 2011, 51, 622–628. (In French) [Google Scholar] [CrossRef]
  40. Nomak, E.; Johansen, B.V.; Lovik, M. Detection of allergens adsorbed to ambient particles collected in four European cities. Toxicol. Lett. 2006, 165, 71–78. [Google Scholar]
  41. Ormstad, H.; Johansen, B.V.; Gaarder, P.I. Airborne house dust particles and diesel exhaust particles as allergen carriers. Clin. Exp. Allergy 1998, 28, 702–708. [Google Scholar] [CrossRef] [PubMed]
  42. Murata, M.; Kawanishi, S. Oxidative DNA damage induced by nitrotyrosine, a biomarker of inflammation. Biochem. Biophys. Res.Commun. 2004, 316, 123–128. [Google Scholar] [CrossRef]
  43. Ghosh, S.; Janocha, A.J.; Aronica, M.A.; Swaidani, S.; Comhair, S.A.; Xu, W.; Zheng, L.; Kaveti, S.; Kinter, M.; Hazen, S.L.; et al. Nitrotyrosineproteome survey in asthma identifies oxidative mechanism of catalase inactivation. J. Immunol. 2006, 176, 5587–5597. [Google Scholar] [CrossRef] [Green Version]
  44. Ischiropoulos, H. Protein tyrosine nitration-An update. Arch. Biochem. Biophys. 2009, 484, 117–121. [Google Scholar] [CrossRef] [PubMed]
  45. Gruijthuijsen, Y.K.; Grieshuber, I.; Stocklinger, A.; Tischler, U.; Fehrenbach, T.; Weller, M.G.; Vogel, L.; Vieths, S.; Pöschl, U.; Duschl, A. Nitration enhances the allergenic potential of proteins. Int. Arch. Allergy Immunol. 2006, 141, 265–275. [Google Scholar] [CrossRef] [PubMed]
  46. Marks, G.B.; Bush, R.K. It’s blowing in the wind: New insights into thunderstorm-related asthma. J. Allergy Clin. Immuno. 2007, 120, 530–532. [Google Scholar] [CrossRef] [PubMed]
  47. Taylor, P.E.; Jonsson, H. Thunderstorm asthma. Curr. Allergy Asthma Rep. 2004, 4, 409–413. [Google Scholar] [CrossRef]
  48. Robichaud, A.; Comtois, P. Environmental factors and asthma hospitalization in Montreal, Canada, during spring 2006–2008: A synergy perspective. Air Qual. Atmos. Health 2019, 12, 1495–1509. [Google Scholar] [CrossRef] [Green Version]
  49. Rosas, I.; McCartney, H.A.; Payne, R.W.; Calderón, C.; Lacey, J.; Chapela, R.; Ruiz-Velazco, S. Analysis of the relationship between environmental factors (aeroallergens, air pollution and weather) and asthma emergency admissions to a hospital in Mexico City. Allergy 1998, 53, 394–401. [Google Scholar] [CrossRef] [PubMed]
  50. Hebbern, C.; Cakmak, S. Synoptic weather types and aeroallergens modify the effect of air pollution on hospitalization for asthma hospitalizations in Canadian cities. Environ. Pollut. 2015, 204, 9–16. [Google Scholar] [CrossRef] [PubMed] [Green Version]
  51. Lee, C.C.; Sheridan, S.C.; Lin, S.S. Relating weather types to asthma-related hospital admissions in New-York State. EcoHealth 2012, 9, 427–439. [Google Scholar] [CrossRef]
  52. Mireku, N.; Wang, Y.; Ager, J.; Reddy, R.C.; Baptist, A.P. Changes in weather and the effects on pediatric asthma exacerbations. Ann. Allergy Asthma Immunol. 2009, 103, 220–224. [Google Scholar] [CrossRef]
  53. Mandrioli, P.; Negrini, M.G.; Cesari, G.; Morgan, G. Evidence for long range transport of biological and anthropogenic aerosol particles in the atmosphere. Grana 1984, 23, 43–53. [Google Scholar] [CrossRef]
  54. Robichaud, A.; Comtois, P. Numerical modelling of birch pollen dispersion in Canada. Environ. Res. 2021, 194, 110554. [Google Scholar] [CrossRef] [PubMed]
  55. Gregory, H.P. Distribution of airborne pollen and spores and their long-distance transport. Pure Appl. Geophys. 1978, 116, 309–315. [Google Scholar] [CrossRef]
  56. Mandrioli, P.; Negrini, M.G.; Zanotti, A.L. Airborne pollen from the Yugoslavian coast to the Po Valley (Italy). Grana 1982, 21, 121–128. [Google Scholar] [CrossRef]
  57. Comtois, P. Pollen dispersal and long-distance transport: The case of thermophilic pollen in subarctic Canada. Aerobiologia 1996, 13, 37–42. [Google Scholar] [CrossRef]
  58. Rogers, C.A.; Levetin, E. Evidence of long-distance transport of mountain cedar pollen in Tulsa, Oklahoma. Int. J. Biometeorol. 1998, 50, 392–402. [Google Scholar] [CrossRef]
  59. Rousseau, D.D.; Duzer, D.; Cambon, G.; Jolly, D.; Poulsen, U.; Ferrier, J.; Schevin, P.; Gros, R. Long distance transport of pollen to Greenland. Geophys. Res. Lett. 2003, 30, 1765. [Google Scholar] [CrossRef]
  60. Smith, M.; Skjoth, C.A.; Myszkowska, D.; Uruska, A.; Puc, M.; Stach, A.; Balwierz, Z.; Chlopek, K.; Piotrowska, K.; Kasprzyk, I.; et al. Long-range transport of Ambrosia pollen to Poland. Agric. For. Meteorol. 2008, 148, 1402–1411. [Google Scholar] [CrossRef]
  61. Sofiev, M.; Siljamo, P.; Ranta, H.; Rantio-Lehtimäki, A. Towards numerical forecasting of long-range air transport of birch pollen: Theoretical considerations and a feasibility study. Int. J. Biometeorol. 2006, 50, 392–402. [Google Scholar] [CrossRef]
  62. Mahura, A.G.; Korsholm, U.; Baklanov, S.; Rasmussen, A. Elevated birch pollen episodes in Denmark: Contributions from remote sources. Aerobiologia 2007, 23, 171–179. [Google Scholar] [CrossRef]
  63. 63. Siljamo, P.; Sofiev, M.; Severova, E.; Ranta, H.; Kukkonen, J.; Polevova, S.; Kubin, E.; Minin, A.A. Sources, impact and exchange of early-spring birch pollen in the Moscow region and Finland. Aerobiologia 2008, 24, 211–230. [Google Scholar] [CrossRef]
  64. Siljamo, P. Numerical Modelling of Birch Pollen Emissions and Dispersion on Regional and Continental Scales. Ph.D. Thesis, Finnish Meteorological Institute Contributions No. 99. FMI-CONT-99, Helsinki, Finland, 2013. [Google Scholar]
  65. Wallin, J.E.; Segerstrom, U.; Rosenhall, L.; Bergmann, E.; Hjelmroos, M. Allergic symptoms caused by long-distance transported birch pollen. Grana 1991, 30, 265–268. [Google Scholar] [CrossRef]
  66. Laaidi, K.; Laaidi, M.; Besancenot, J.P. Pollens, pollinoses et météorologie. Météorologie 1997, 20, 41–55. (In French) [Google Scholar] [CrossRef] [Green Version]
  67. de Weger, L.A.; Bergmann, K.C.; Rantio-Lehtimäki, A.; Dahl, A.; Buters, J.; Déchamp, J.; Belmonte, J. Impact of pollen. In Allergenic Pollen, A Review of the Production, Release, Distribution and Health Impacts; Sofiev, M., Bergmann, K.C., Eds.; Springer Science + Business Media: Dordrecht, The Netherlands, 2013; 256p, ISBN1 978-94-007-4880-4e. ISBN2 978-94-94-007-4881-1. [Google Scholar] [CrossRef]
  68. Ribeiro, H.; Costa, C.; Abreu, I.; da Silva, J.C.E. Effect of O3 and NO2 atmospheric pollutants on Platanus acerifolia pollen: Immunochemical and spectroscopic analysis. Sci. Total Environ. 2017, 599–600, 291–297. [Google Scholar] [CrossRef]
  69. Hong, Q.; Zhou, S.; Zhao, H.; Peng, J.; Li, Y.; Shang, Y.; Wu, M.; Zhang, W.; Lu, S.; Li, S.; et al. Allergenicity of recombinant Humulus japonicus pollen allergen 1 after combined exposure to ozone and nitrogen dioxide. Environ. Pollut. 2018, 234, 707–715. [Google Scholar] [CrossRef] [PubMed]
  70. Weinberger, K.R.; Kinney, P.L.; Robinson, G.S.; Sheehan, D.; Kheirbek, I.; Matte, T.D.; Lovasi, G.S. Levels and determinants of tree pollen in New York City. J. Expo. Sci. Environ. Epidemiol. 2018, 28, 119–124. [Google Scholar] [CrossRef] [PubMed]
  71. Sofiev, M.; Bergmann, K.C. Allergenic Pollen. A Review of the Production, Release, Distribution and Health Impacts; Springer Science+Business Media: Dordrecht, The Netherlands, 2013; ISBN1 978-94-007-4880-4e. ISBN2 978-94-94-007-4881-1. [Google Scholar]
  72. Dales, R.E.; Cakmak, S.; Judek, S.; Dann, T.; Coates, F.; Brook, J.R.; Burnett, R.T. Influence of outdoor aeroallergens on hospitalization for asthma in Canada. Environ. Occup. Disord. 2004, 113, 303–306. [Google Scholar] [CrossRef]
  73. Dales, R.E.; Cakmak, S.; Judek, S.; Coates, F. Tree Pollen and Hospitalization for Asthma in urban Canada. Int. Arch. Allergy Immunol. 2008, 146, 241–247. [Google Scholar] [CrossRef] [PubMed]
  74. Guérin, B. Pollen et Allergies; Édition Allerbio: Varennes-en-Argonne, France, 1993. [Google Scholar]
  75. Hasnain, S.M. Influence of meteorological factors on the air spora. Grana 1993, 32, 184–188. [Google Scholar] [CrossRef]
  76. Barnes, C.; Pacheco, F.; Landuyt, J.; Hu, F.; Portnoy, J. Hourly variation of airborne ragweed pollen in Kansas City. Ann. Allergy Asthma Immunol. 2001, 86, 166–171. [Google Scholar] [CrossRef]
  77. 77. Chathurika, M.R.; Metwali, N.; Jayarathne, T.; Kettler, J.; Huang, Y.; Thorne, P.S.; O’Shaughnessy, P.T.; Stone, E.A. Influence of rain on the abundance of bioaerosols in fine and coarse particles. Atmos. Chem. Phys. 2017, 17, 2459–2475. [Google Scholar] [CrossRef] [Green Version]
  78. Laaidi, M. Regional variations in the pollen season of Betula in Burgundy: Two models for predicting the start of the pollination. Aerobiologia 2001, 17, 247–254. [Google Scholar] [CrossRef]
  79. Climate: Montreal—Climate graph, Temperature graph, Climate table. Climate-Data.org. Archived. Retrieved 24 May 2021. Available online: https://en.climate-data.org/north-america/canada/quebec/montreal-3704/ (accessed on 17 June 2021).
  80. 80. Stieb, D.; Burnett, M.; Smith-Dorion, R.T.M.; Brion, O.; Shin, H.H.; Economou, V. A new multipollutant, no-threshold air quality health index based on short-term associations observed in daily time-series analyses. J. Air Waste Manag. Assoc. 2008, 58, 435–450. [Google Scholar] [CrossRef] [PubMed] [Green Version]
  81. Kinnee, E.; Geron, C.; Pierce, T. United States Land-Use Inventory for estimating Biogenic Ozone Precursor Emissions. Ecol. Appl. 1997, 7, 46–58. [Google Scholar] [CrossRef]
  82. Hirst, J.M. An automatic volumetric spore trap. Ann. Appl. Biol. 1952, 39, 257–265. [Google Scholar] [CrossRef]
  83. Mandrioli, P.; Comtois, P.; Levizzani, V. Methods in Aerobiology; Pitagora Editrice: Bologna, Italy, 1998; ISBN 8-371-1043-X. [Google Scholar]
  84. Institut National de Santé Publique du Québec (INSPQ). États des Connaissances sur le Pollen et les Allergies. Les Assises pour une Gestion Efficace; 2013; ISBN 978-2-550-68403-9. Available online: http://www.inspq.qc.ca (accessed on 17 June 2021).
  85. Côté, J.; Gravel, S.; Méthot, A.; Patoine, A.; Roch, M.; Staniforth, A.N. The operational CMC-MRB Global Environmental Multiscale (GEM) model. Part I: Design considerations and formulation. Mon. Weather Rev. 1998, 126, 1373–1395. [Google Scholar] [CrossRef]
  86. Côté, J.; Desmarais, J.G.; Gravel, S.; Méthot, A.; Patoine, A.; Roch, M.; Staniforth, A. The operational CMC–MRB Global Environmental Multiscale (GEM) model. Part II: Results. Mon. Weather Rev. 1998, 126, 1397–1418. [Google Scholar] [CrossRef]
  87. Moran, M.D.; Chen, J.; Ménard, S.; Pavlovic, R.; Landry, H.; Beaulieu, P.A.; Gilbert, S.; Makar, P.A.; Gong, W.; Stroud, C.; et al. Two years of operational AQ forecasting with GEM-MACH15: A look back and look ahead. In Proceedings of the 10th annual CMAS Conference, Chapel Hill, NC, USA, 24–26 October 2011. [Google Scholar]
  88. Moran, M.D.; Ménard, S.; Pavlovic, R.; Anselmo, D.; Antonopoulos, S.; Robichaud, A.; Gravel, S.; Makar, P.A.; Gong, W.; Stroud, C.; et al. Recent Advances in Canada’s National Operational Air Quality Forecasting System. In Proceedings of the 32nd NATO-SPS ITM, Utrecht, NL, USA, 7–11 May 2012. [Google Scholar]
  89. Comtois, P.; Gagnon, L. Concentration pollinique et fréquence des symptômes de pollinose: Une méthode pour déterminer les seuils cliniques. Rev. Fr. Allergol. 1998, 28, 279. [Google Scholar] [CrossRef]
  90. Garty, B.Z.; Kosman, E.; Ganor, E.; Berger, V.; Garty, L.; Wietzen, T.; Waisman, Y.; Mimouni, M.; Waisl, Y. Emergency room visits of asthmatic children, relation to air pollution, weather, and airborne allergens. Ann. Allergy Asthma Immunol. 1998, 81, 563–570. [Google Scholar] [CrossRef]
  91. Schwartz, J. Facts Not Fear on Air Pollution. NCPA Policy Report. 2006. Available online: https://www.georgiapolicy.org/issue/facts-not-fear-on-air-pollution/ (accessed on 12 May 2021).
  92. Robichaud, A.; Ménard, R. Multi-year objective analyses of warm season ground-level ozone and PM2.5 over North America using real-time observations and Canadian operational air quality models. Atmos. Chem. Phys. 2014, 13, 13967–14035. [Google Scholar] [CrossRef] [Green Version]
  93. Robichaud, A.; Ménard, R.; Zaitseva, Y.; Anselmo, D. Multi-pollutant objective analyses and mapping of AQHI over North America. Air Qual. Atmos. Health 2016, 97, 743–759. [Google Scholar] [CrossRef] [Green Version]
  94. Lajoie, P.; Laberge, A.; Lebel, G.; Boulet, L.P.; Demers, M.; Mercier, P.; Gagnon, M.F. Cartography of emergency department visits for asthma—Targeting high-mortality populations. Can. Respir. J. 2004, 11, 427–433. [Google Scholar] [CrossRef] [PubMed] [Green Version]
  95. Ville de Montréal. Bilan de la Qualité de l’Air. 2018. Available online: https://ville.montreal.qc.ca/pls/portal/docs/page/enviro_fr/media/documents/vdm_bilanrsqa_2018_vf.pdf (accessed on 17 June 2021).
  96. Lajoie, P.; Lebel, G.; Leduc, R.; Boulet, L.P.; Bourbeau, J.; Bernard, P.M. Étude sur la Relation Entre les Visites à l’Urgence des Hôpitaux pour l’Asthme, la Qualité de l’Air et les Conditions Météorologiques pour la Communauté Urbaine de Québec (1990–1991): Rapport Final 1992; QEN/QA94-2/6. Envirodoq EN940068; Département de Santé Communautaire du Centre Hospitalier de l’Université Laval, Ministère de l’Environnement et de la Faune, Gouvernement du Québec: Québec, ON, Canada, 1994.
  97. Goldstein, I.F.; Currie, B. Seasonal patterns of asthma: A clue to etiology. Environ. Res. 1984, 33, 201–215. [Google Scholar] [CrossRef]
  98. DeGuire, P.; Cao, B.; Wisnieski, L.; Strane, D.; Wahl, R.; Lyon-Callo, S.; Garcia, E. Detroit: The Current Status of Asthma. Michigan Department of Health and Human Services Bureau of Disease Control, Prevention and Epidemiology. 2016. Available online: https://www.michigan.gov/documents/mdhhs/Detroit-AsthmaBurden_516668_7.pdf (accessed on 12 May 2021).
  99. NRDC (Natural Resources Defence Council). Sneezing and Wheezing: How Climate Change Could Increase Ragweed Allergies, Air Pollution, and Asthma; NRDC: New York, NY, USA, 2015. [Google Scholar]
  100. AAFA Asthma Capital. 2014. Available online: https://www.aafa.org/media/2426/aafa-2014-asthma-capitals-report.pdf (accessed on 12 May 2021).
  101. Crighton, E.J.; Ragetlie, R.; Luo, J.; To, T.; Gershon, A. A Spatial analysis of COPD prevalence, incidence, mortality and health service use in Ontario. Health Rep. 2015, 26, 10–18. [Google Scholar] [PubMed]
  102. Cooper, O.R.; Parrish, D.D.; Stohl, A.; Trainer, M.; Nédélec, P.; Thouret, V.; Cammas, J.P.; Oltmans, S.J.; Johnson, B.J.; Tarasick, D.; et al. Increasing springtime ozone mixing ratios in the free troposphere over western North America. Nat. Lett. 2010, 463, 344–348. [Google Scholar] [CrossRef] [PubMed]
  103. Svartengren, M.; Strand, V.; Bylin, G.; Jarup, L.; Pershagen, G. Short-term exposure to air pollution in a road tunnel enhances the asthmatic response to allergen. Eur. Respir. J. 2000, 15, 716–724. [Google Scholar] [CrossRef] [PubMed] [Green Version]
  104. Helbig, N.; Vogel, B.; Vogel, H.; Fiedler, F. Numerical modelling of pollen dispersion on the regional scale. Aerobiologia 2004, 3, 3–19. [Google Scholar] [CrossRef]
  105. Andersen, T.B. A model to predict the beginning of the pollen season. Grana 1991, 30, 269–275. [Google Scholar] [CrossRef] [Green Version]
  106. García-Mozo, H.; Chine, I.; Aira, M.J. Regional phenological models for forecasting the start and peak of the Quercus pollen season in Spain. Agric. For. Meteorol. 2008, 148, 372–380. [Google Scholar] [CrossRef]
  107. Comtois, P.; Fernández-Gonzales, D.; Valencia-Barrera, R.; Sánchez, J.; Fraile, R.; Rodier, S. Pollen content study of the lower atmosphere in Léon (Spain) by use of a tethered balloon. Aerobiologia 2000, 16, 187–191. [Google Scholar] [CrossRef]
  108. Hjort, J.; Hugg, T.T.; Antikainen, H.; Rusanen, J.; Sofiev, M.; Kukkonen, J.; Jaakkola, M.S.; Jaakkola, J.J. Fine-Scale Exposure to Allergenic Pollen in the Urban Environment: Evaluation of Land Use Regression Approach. Environ. Health Perspect. 2016, 124, 619–626. [Google Scholar] [CrossRef] [Green Version]
  109. AAPCEH (American Academy of Pediatrics Committee on Environmental Health); Etzel, R.A. (Eds.) Pediatric Environmental Health, 2nd ed.; American Academy of Pediatrics: Elk Grove Village, IL, USA, 2003. [Google Scholar]
Figure 1. Location of sites for air pollution and pollen count measurement. The white X indicates the pollen measuring site at Université de Montréal (UdeM). Different sectors of Montreal are shown: W (West: blue), CN (center-north: white), CS (center-south: orange) and E (east: green). Orange colors indicate higher topographic elevation. Sites 50126: Ste-Anne-de-Bellevue; 50128: Airport; 50109: Décarie/Mt. Royal; 50110: Parc Pilon; 50105: Drummond; 50131: Hochelaga; 50129: Rivière-des-Prairies; 50103: Parc St-Jean-Baptiste.
Atmosphere 12 00789 g001
Figure 2. Time series of daily asthma hospitalization (DAH) count (in black) and daily maximum temperature (in blue) for the warm season of the year: (A) 2006 (SPI = 9700, total DAH = 238); (B) 2007 (SPI = 1250, total DAH = 177). The birch pollen season spans from April (A) through the first week of June (J) while the ragweed season takes place in September (S) and October (O) in Montreal. The two horizontal lines represent a window of temperatures between 10 and 20 °C where DAH is often peaking (see text for details).
Atmosphere 12 00789 g002
Figure 3. Prevalence of PEFR (peak expiratory flow rate) seasonal variation for: (A) Montreal; (B) the whole province of Québec (2005–2014). W: Winter; SP: Spring; SU: summer; A: Autumn. Gray bars indicate 95% confidence interval.
Atmosphere 12 00789 g003
Figure 4. Relation between birch SPI (seasonal pollen index) and daily asthma hospitalization count for the spring period 2006–2012.
Atmosphere 12 00789 g004
Figure 5. Daily hospitalization during birch pollen season (2006–2017) versus the weather type.
Atmosphere 12 00789 g005
Figure 6. Averaged diurnal variation of model birch pollen (grains/m3) and classical pollutant concentration (May 2012). af: aerosol fine (ug/m3); no2: Nitrogen dioxide (ug/m3); ozo: near-surface ozone (ppb); aqhif: air quality health index.
Atmosphere 12 00789 g006
Figure 7. Monthly mean (May 2012) of simulated birch pollen concentration (upper left panel), and pollutant objective analyses obtained from model-data fusion (PM2.5: upper right panel, NO2: lower left panel, O3: lower right panel). The Toronto-Montreal-Quebec corridor is depicted by a black arrow (T-M-Q), W: Windsor; A: Adirondack Mountains; MH: Murray Hills.
Atmosphere 12 00789 g007
Figure 8. Time series of birch pollen concentration (3-day moving Avg.) simulated by the GEM-MACH model compared with pollen observation (OBS: UdeM) and statistical pollen forecast (from the Weather Network, WXN). The coefficient of correlation between the model and observation is R = 0.62.
Atmosphere 12 00789 g008
Table 1. Weather elements and their documented or potential impacts on asthma (from literature).
Weather ElementImpactResultReference
Continuous light rainLikely washes out most bioaerosolsLikely low asthma[25,75,76]
Intermittent rain with dry cyclesLikely washes out large aerosols but may increase small bioaerosols due to pollen ruptureSmall bioaerosols penetrate deeper into lungs and increase asthma risk[29,30,31,77]
Clouds and fogNitration of pollen grain is activated in water dropletsIncreased risk of pollen-pollution synergy[21,35]
Ridge of high pressure with windsOptimum weather for pollen emission. Wind is the necessary condition for mechanical vibration to drive pollen grains out of the anther and be regionally transportedAirborne pollen load is maximum and allergy is up likely due to pollutant-pollen synergy[48,54,76]
ThunderstormPollen rupture increasing drastically the number of sub-pollen particles of smaller sizeSudden increase of asthma emergency visit and hospitalization[9,10,46]
Active frontsPollen-pollution-weather synergyDecrease of pollen counts but increase of asthma hospitalization (suggesting pollen rupture)[48,77]
Air massesSynergy between pollen with environmental factorsAsthma more likely in certain air masses[50,51,78]
Fronts, occlusion/trowal and high pressurePollution trapped in convergence zone and high pressure systems.Higher asthma counts[48,53]
Table 2. Correlation between asthma hospitalization and selected environmental factors in Montreal during the pollen season 2006–2008: (A) all sectors of Montreal and all weather types; (B) discriminated for geographical sectors and weather types (weather types 7,9 and 12 only). W: West Montreal; CN: Center North; CS: Center South. Note. [Birch] refers to birch airborne concentration.
ALag 0Lag 1Lag 2
[Birch]0.150.25−0.12 *
Ln [Birch]0.230.26NS
OzoneNS0.15NS
PM2.5−0.13 *NSNS
Temperature−0.12−0.13−0.17
AQHINSNSNS
BLag 0Lag 1Lag 2
[Birch]NS0.28 * (West)NS
Ln [Birch]0.40 (ALL SECTORS)0.41 (West)NS
OzoneNS0.41 (Center North)NS
PM2.5NS0.39 (Center South)NS
TemperatureNSNS−0.29 (Center South)
AQHI0.37 (Center North)0.53 (Center North)NS
Note. * Indicates non-significant correlation (i.e., p > 0.05 and <0.10). NS: non-significant, (p > 0.10). Otherwise, all correlations are statistically significant (p < 0.05).
Publisher’s Note: MDPI stays neutral with regard to jurisdictional claims in published maps and institutional affiliations.

