Development of a Health-Based Index to Identify the Association between Air Pollution and Health Effects in Mexico City
Abstract
1. Introduction
2. Materials and Methods
+ length of study period (24 df) + same day temperature (3 df) + lag days 1–3 temperature (3 df)
+ same day relative humidity (3 df) + lag days 1–3 relative humidity (3 df)
3. Results
4. Discussion
5. Conclusions
Author Contributions
Funding
Institutional Review Board Statement
Informed Consent Statement
Data Availability Statement
Acknowledgments
Conflicts of Interest
Appendix A. Mexico City Monitoring Locations
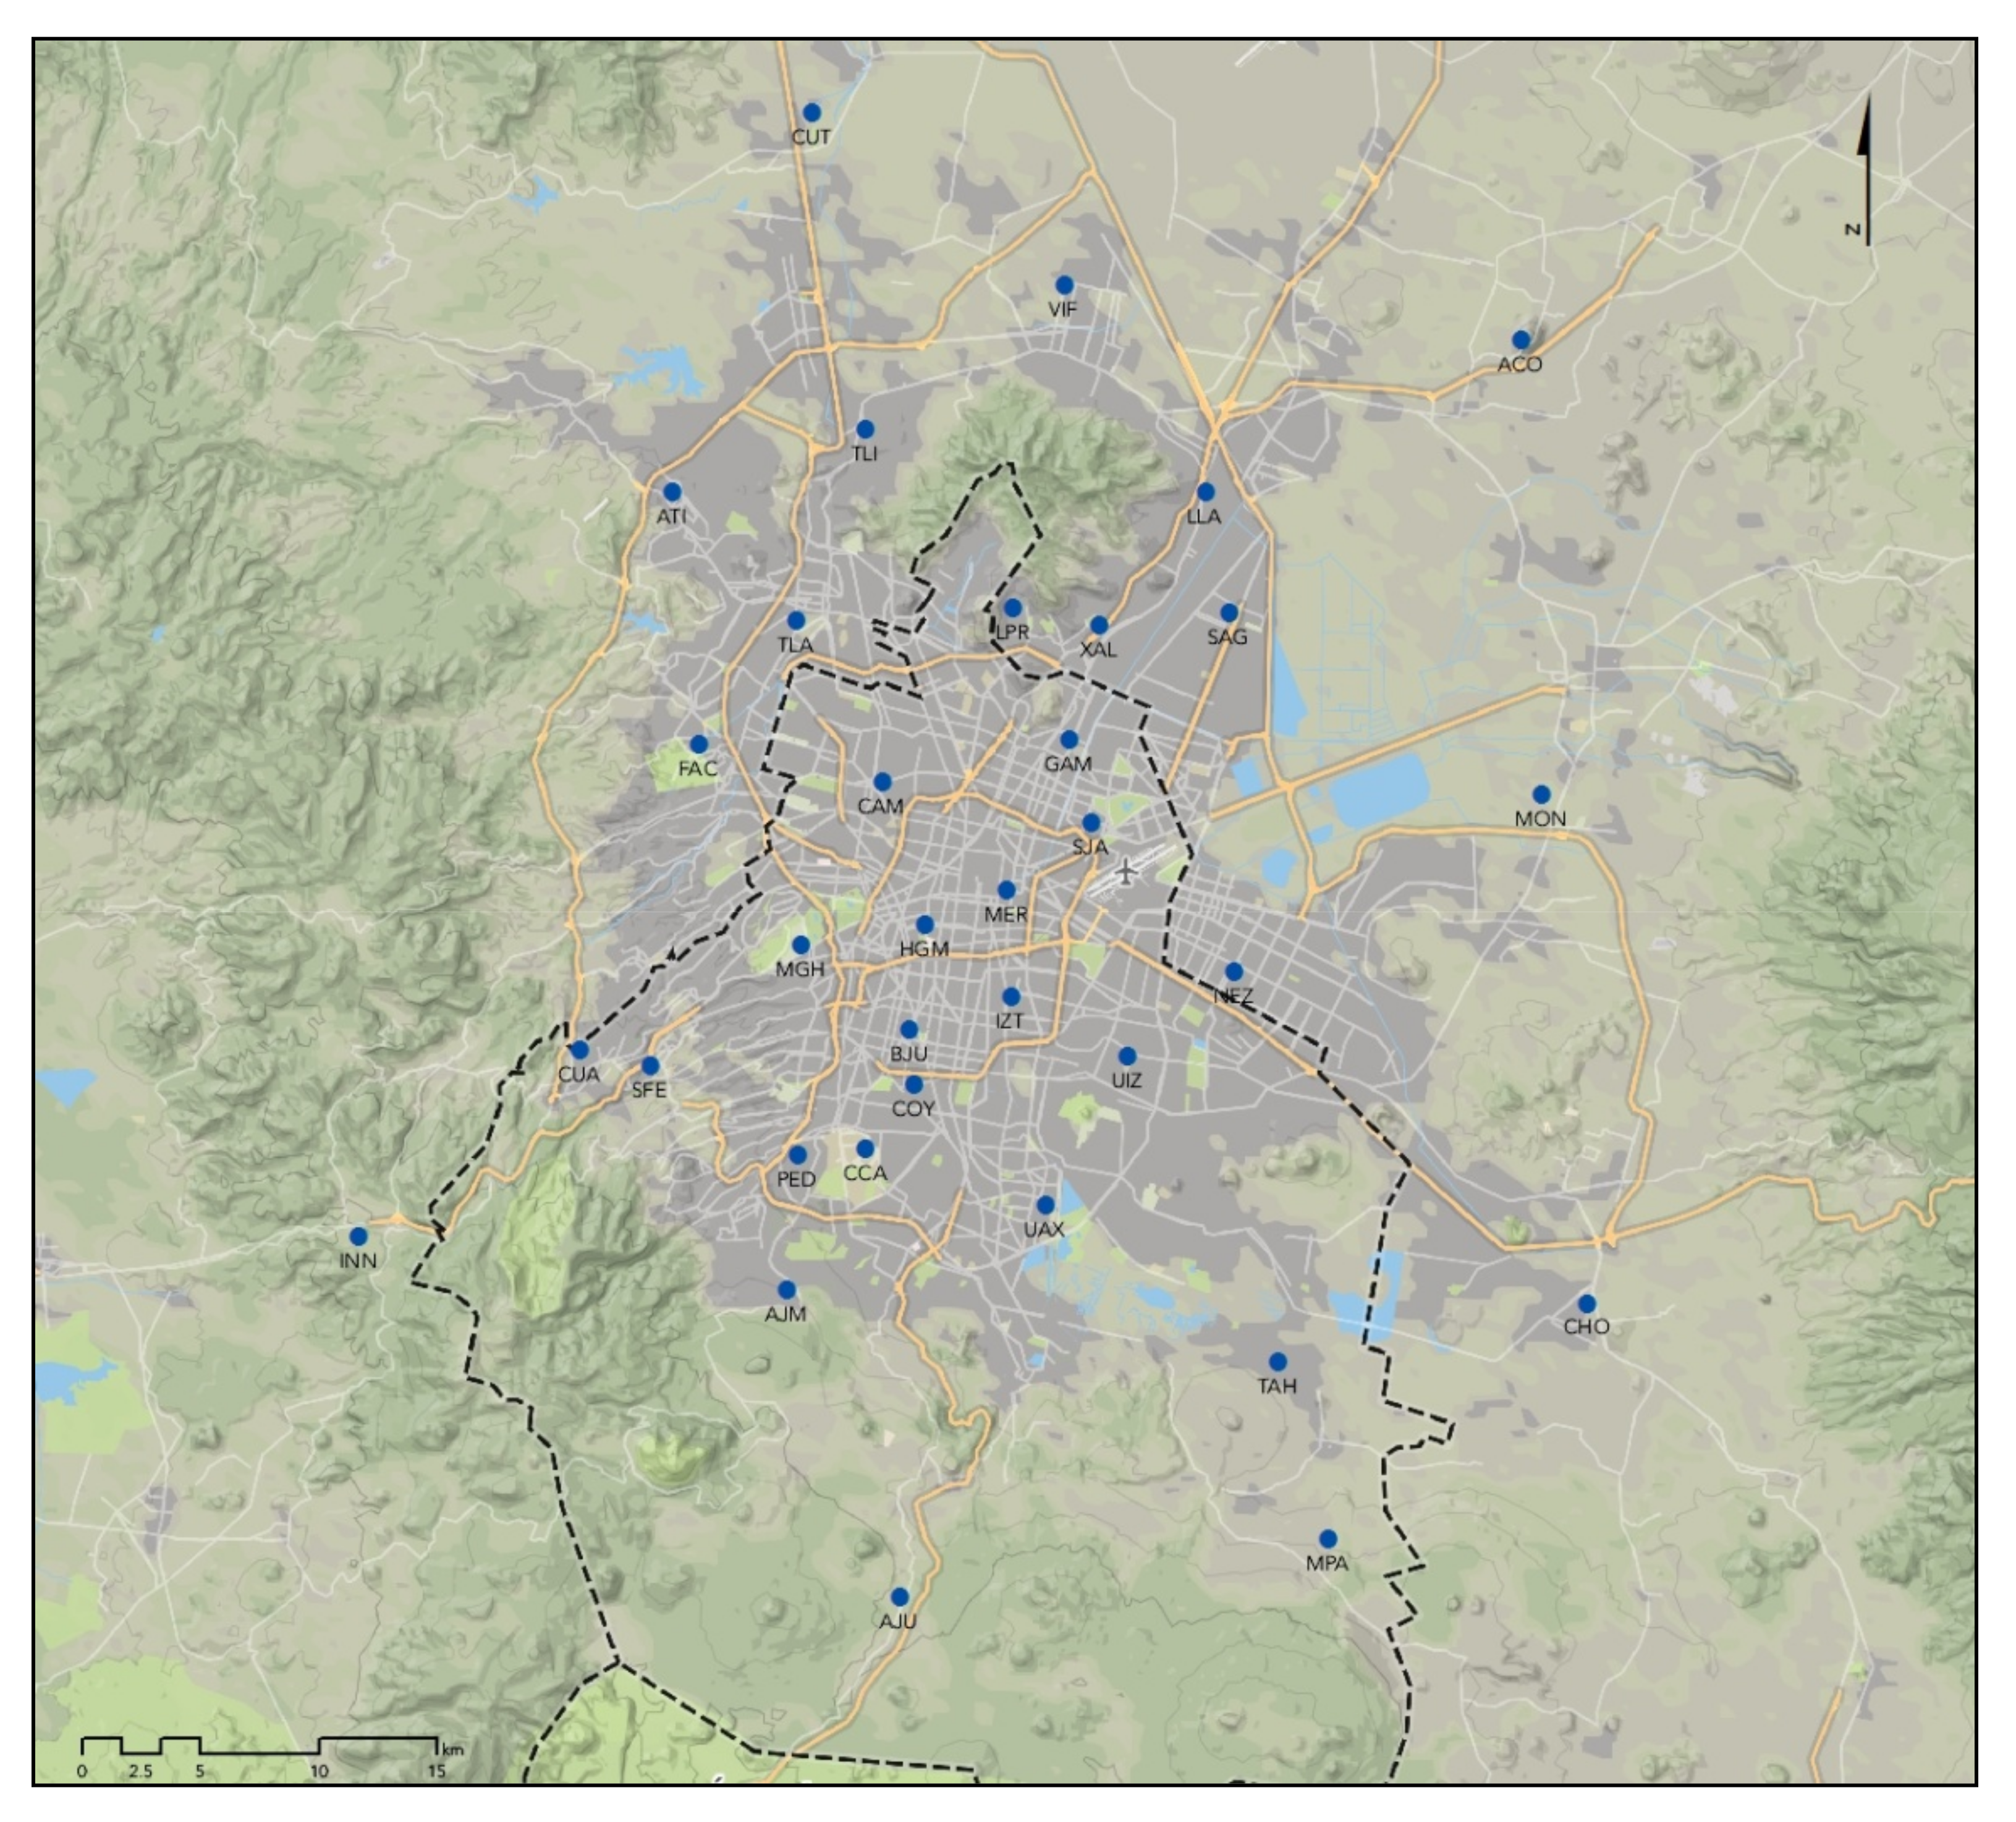
| PM2.5 Monitor Group: | CAM, COY, MER, SAG, SJA, TLA, UIZ |
| O3 Monitor Group: | COY, FAC, IZT, MER, PED, TAH, TLA, SAG, UIZ, XAL |
| NO2 Monitor Group: | IZT, MER, PED, SUR, UIZ |
| PM2.5 Station ID | Monitoring Frequency per Seasonal Period | |||
|---|---|---|---|---|
| 1 | 2 | 3 | 4 | |
| ACO | 31.1 | 24.8 | 18.2 | 12.9 |
| AJM | 11.8 | 12.0 | 13.7 | 12.6 |
| CAM | 83.5 | 84.0 | 69.5 | 80.2 |
| CCA | 13.8 | 13.2 | 19.7 | 27.7 |
| COY | 94.5 | 87.7 | 90.0 | 89.2 |
| HGM | 45.8 | 51.7 | 46.0 | 44.6 |
| MER | 93.2 | 90.8 | 79.5 | 92.3 |
| MGH | 13.7 | 13.1 | 14.0 | 13.1 |
| NEZ | 52.0 | 42.5 | 64.0 | 69.4 |
| PED | 48.5 | 50.3 | 64.0 | 59.8 |
| PER | 39.5 | 40.2 | 24.8 | 28.2 |
| SAG | 85.8 | 81.8 | 86.3 | 80.0 |
| SFE | 44.9 | 46.5 | 49.5 | 35.1 |
| SJA | 91.5 | 90.8 | 77.1 | 73.5 |
| TLA | 80.3 | 85.8 | 71.8 | 94.3 |
| UAX | 46.5 | 53.5 | 55.7 | 51.1 |
| UIZ | 90.8 | 90.5 | 93.1 | 94.8 |
| XAL | 39.8 | 50.2 | 51.7 | 55.2 |
Appendix B. Coefficients from the Primary Health Analysis
| PM2.5 | O3 | NO2 | |||||
|---|---|---|---|---|---|---|---|
| Age | Lag Days | Coefficient | Standard Error | Coefficient | Standard Error | Coefficient | Standard Error |
| 2–17 years | Lag 0–3 | 0.002473 | 0.000801 | 0.001231 | 0.000502 | 0.000834 | 0.000527 |
| Lag 0 | −0.000050 | 0.000557 | 0.000433 | 0.000372 | 0.000130 | 0.000354 | |
| Lag 1 | 0.001403 | 0.000549 | 0.000993 | 0.000367 | 0.000607 | 0.000350 | |
| Lag 2 | 0.001817 | 0.000539 | 0.001043 | 0.000369 | 0.000357 | 0.000347 | |
| Lag 3 | 0.001511 | 0.000539 | 0.000157 | 0.000360 | 0.000347 | 0.000339 | |
| Lag 4 | 0.000931 | 0.000538 | 0.000062 | 0.000338 | 0.000481 | 0.000332 | |
| Lag 5 | 0.000682 | 0.000534 | −0.000057 | 0.000325 | 0.000059 | 0.000326 | |
| 18+ years | Lag 0–3 | 0.003535 | 0.001185 | 0.002854 | 0.000749 | 0.000272 | 0.000790 |
| Lag 0 | 0.000804 | 0.000803 | 0.001777 | 0.000557 | 0.000297 | 0.000528 | |
| Lag 1 | 0.001062 | 0.000800 | 0.002070 | 0.000549 | −0.000070 | 0.000526 | |
| Lag 2 | 0.001726 | 0.000788 | 0.001437 | 0.000553 | 0.000305 | 0.000521 | |
| Lag 3 | 0.002776 | 0.000784 | 0.000863 | 0.000541 | −0.000055 | 0.000509 | |
| Lag 4 | 0.001666 | 0.000779 | 0.000974 | 0.000505 | 0.000474 | 0.000498 | |
| Lag 5 | 0.001137 | 0.000775 | 0.000605 | 0.000487 | 0.000072 | 0.000489 | |
| All ages | Lag 0–3 | 0.002586 | 0.000711 | 0.001593 | 0.000447 | 0.000524 | 0.000470 |
| Lag 0 | 0.000176 | 0.000494 | 0.000808 | 0.000332 | 0.000106 | 0.000315 | |
| Lag 1 | 0.001338 | 0.000487 | 0.001304 | 0.000326 | 0.000434 | 0.000312 | |
| Lag 2 | 0.001808 | 0.000478 | 0.001066 | 0.000328 | 0.000304 | 0.000309 | |
| Lag 3 | 0.001518 | 0.000478 | 0.000235 | 0.000321 | 0.000071 | 0.000303 | |
| Lag 4 | 0.000803 | 0.000477 | 0.000174 | 0.000301 | 0.000280 | 0.000296 | |
| Lag 5 | 0.000648 | 0.000474 | −0.000031 | 0.000290 | −0.000109 | 0.000291 | |
Appendix C. Calculating Daily Health-Based Index Values
References
- De San, J.A. Management of air pollution in Mexico. Manag. Environ. Qual. Int. J. 2019, 30, 578–592. [Google Scholar] [CrossRef]
- Parrish, D.D.; Singh, H.B.; Molina, L.; Madronich, S. Air quality progress in North American megacities: A review. Atmos. Environ. 2011, 45, 7015–7025. [Google Scholar] [CrossRef]
- Calderón-Garcidueñas, L.; Kulesza, R.J.; Doty, R.L.; D’Angiulli, A.; Torres-Jardón, R. Megacities air pollution problems: Mexico City Metropolitan Area critical issues on the central nervous system pediatric impact. Environ. Res. 2015, 137, 157–169. [Google Scholar] [CrossRef]
- Gouveia, N.; Junger, W.L.; Romieu, I.; Cifuentes, L.A.; De Leon, A.P.; Vera, J.; Strappa, V.; Hurtado-Díaz, M.; Miranda-Soberanis, V.; Rojas-Bracho, L.; et al. Effects of air pollution on infant and children respiratory mortality in four large Latin-American cities. Environ. Pollut. 2018, 232, 385–391. [Google Scholar] [CrossRef]
- Téllez-Rojo, M.M.; Rothenberg, S.J.; Texcalac-Sangrador, J.L.; Just, A.C.; Kloog, I.; Rojas-Saunero, L.P.; Gutiérrez-Avila, I.; Bautista-Arredondo, L.F.; Tamayo-Ortiz, M.; Romero, M.; et al. Children’s acute respiratory symptoms associated with PM2.5 estimates in two sequential representative surveys from the Mexico City Metropolitan Area. Environ. Res. 2020, 180, 108868. [Google Scholar] [CrossRef]
- Borbet, T.C.; Gladson, L.A.; Cromar, K.R. Assessing air quality index awareness and use in Mexico City. BMC Public Health 2018, 18, 1–10. [Google Scholar] [CrossRef]
- Cori, L.; Donzelli, G.; Gorini, F.; Bianchi, F.; Curzio, O. Risk Perception of Air Pollution: A Systematic Review Focused on Particulate Matter Exposure. Int. J. Environ. Res. Public Health 2020, 17, 6424. [Google Scholar] [CrossRef]
- Mirabelli, M.C.; Boehmer, T.K.; Damon, S.A.; Sircar, K.D.; Wall, H.K.; Yip, F.Y.; Zahran, H.S.; Garbe, P.L. Air Quality Awareness Among U.S. Adults With Respiratory and Heart Disease. Am. J. Prev. Med. 2018, 54, 679–687. [Google Scholar] [CrossRef] [PubMed]
- Mirabelli, M.C.; Ebelt, S.; Damon, S.A. Air Quality Index and air quality awareness among adults in the United States. Environ. Res. 2020, 183, 109185. [Google Scholar] [CrossRef]
- Delmas, M.A. Can Apps Make Air Pollution Visible? Springer: Dordrecht, The Netherlands, 2020; Volume 161, pp. 279–302. [Google Scholar]
- Wen, X.-J.; Balluz, L.; Mokdad, A. Association between Media Alerts of Air Quality Index and Change of Outdoor Activity Among Adult Asthma in Six States, BRFSS, 2005. J. Community Health 2008, 34, 40–46. [Google Scholar] [CrossRef] [PubMed]
- Kanchan, K.; Gorai, A.K.; Goyal, P. A Review on Air Quality Indexing System. Asian J. Atmos. Environ. 2015, 9, 101–113. [Google Scholar] [CrossRef]
- Suman. Air quality indices: A review of methods to interpret air quality status. Mater. Today Proc. 2020. [Google Scholar]
- Wang, X.-K.; Lu, W.-Z. Seasonal variation of air pollution index: Hong Kong case study. Chemosphere 2006, 63, 1261–1272. [Google Scholar] [CrossRef] [PubMed]
- Perlmutt, L.; Cromar, K. Evaluation of the air quality index as a risk communication tool. J. Environ. Health 2019, 81, 8–15. [Google Scholar]
- Perlmutt, L.; Stieb, D.; Cromar, K. Accuracy of quantification of risk using a single-pollutant Air Quality Index. J. Expo. Sci. Environ. Epidemiol. 2015, 27, 24–32. [Google Scholar] [CrossRef] [PubMed]
- Cromar, K.R.; Gladson, L.A.; Ewart, G. Trends in Excess Morbidity and Mortality Associated with Air Pollution above American Thoracic Society–Recommended Standards, 2008–2017. Ann. Am. Thorac. Soc. 2019, 16, 836–845. [Google Scholar] [CrossRef] [PubMed]
- Canada EaCC. Air Quality Health Index Categories and Health Messages. Available online: http://www.ec.gc.ca/cas-aqhi/default.asp?lang=En&n=79A8041B-1 (accessed on 26 January 2021).
- Stieb, D.M.; Burnett, R.T.; Smith-Doiron, M.; Brion, O.; Shin, H.H.; Economou, V. A New Multipollutant, No-Threshold Air Quality Health Index Based on Short-Term Associations Observed in Daily Time-Series Analyses. J. Air Waste Manag. Assoc. 2008, 58, 435–450. [Google Scholar] [CrossRef] [PubMed]
- Du, X.; Chen, R.; Meng, X.; Liu, C.; Niu, Y.; Wang, W.; Li, S.; Kan, H.; Zhou, M. The establishment of National Air Quality Health Index in China. Environ. Int. 2020, 138, 105594. [Google Scholar] [CrossRef] [PubMed]
- Xu, H.; Zeng, W.; Guo, B.; Hopke, P.K.; Qiao, X.; Choi, H.; Luo, B.; Zhang, W.; Zhao, X. Improved risk communications with a Bayesian multipollutant Air Quality Health Index. Sci. Total. Environ. 2020, 722, 137892. [Google Scholar] [CrossRef]
- Olstrup, H.; Johansson, C.; Forsberg, B.; Tornevi, A.; Ekebom, A.; Meister, K. A Multi-Pollutant Air Quality Health Index (AQHI) Based on Short-Term Respiratory Effects in Stockholm, Sweden. Int. J. Environ. Res. Public Health 2019, 16, 105. [Google Scholar] [CrossRef]
- Hu, J.; Ying, Q.; Wang, Y.; Zhang, H. Characterizing multi-pollutant air pollution in China: Comparison of three air quality indices. Environ. Int. 2015, 84, 17–25. [Google Scholar] [CrossRef] [PubMed]
- Zeng, Q.; Fan, L.; Ni, Y.; Li, G.; Gu, Q. Construction of AQHI based on the exposure relationship between air pollution and YLL in northern China. Sci. Total. Environ. 2020, 710, 136264. [Google Scholar] [CrossRef]
- Gauderman, W.J.; Urman, R.; Avol, E.; Berhane, K.; McConnell, R.; Rappaport, E.; Chang, R.; Lurmann, F.; Gilliland, F. Association of Improved Air Quality with Lung Development in Children. N. Engl. J. Med. 2015, 372, 905–913. [Google Scholar] [CrossRef] [PubMed]
- Lepeule, J.; Litonjua, A.A.; Coull, B.; Koutrakis, P.; Sparrow, D.; Vokonas, P.S.; Schwartz, J. Long-Term Effects of Traffic Particles on Lung Function Decline in the Elderly. Am. J. Respir. Crit. Care Med. 2014, 190, 542–548. [Google Scholar] [CrossRef]
- McDermott, M.; Srivastava, R.; Croskell, S. Awareness of and Compliance with Air Pollution Advisories: A Comparison of Parents of Asthmatics with Other Parents. J. Asthma 2006, 43, 235–239. [Google Scholar] [CrossRef] [PubMed]
- Neidell, M. Air quality warnings and outdoor activities: Evidence from Southern California using a regression discontinuity design. J. Epidemiol. Community Health 2009, 64, 921–926. [Google Scholar] [CrossRef]
- Ward, A.L.S.; Beatty, T.K.M. Who Responds to Air Quality Alerts? Environ. Resour. Econ. 2015, 65, 487–511. [Google Scholar] [CrossRef]
- Wells, E.M.; Dearborn, D.G.; Jackson, L.W. Activity Change in Response to Bad Air Quality, National Health and Nutrition Examination Survey, 2007–2010. PLoS ONE 2012, 7, e50526. [Google Scholar] [CrossRef]
- Chen, H.; Li, Q.; Kaufman, J.S.; Wang, J.; Copes, R.; Su, Y.; Benmarhnia, T. Effect of air quality alerts on human health: A regression discontinuity analysis in Toronto, Canada. Lancet Planet. Health 2018, 2, e19–e26. [Google Scholar] [CrossRef]
- R Core Team. R: A Language and Environment for Statistical Computing; R Foundation for Statistical Computing: Vienna, Austria, 2018. [Google Scholar]
- Van Buuren, S.; Groothuis-Oudshoorn, K. Mice: Multivariate imputation by chained equations in R. J. Stat. Softw. 2010, 1–68. [Google Scholar] [CrossRef]
- Zhu, Z.; Qiao, Y.; Liu, Q.; Lin, C.; Dang, E.; Fu, W.; Wang, G.; Dong, J. The impact of meteorological conditions on Air Quality Index under different urbanization gradients: A case from Taipei. Environ. Dev. Sustain. 2021, 23, 3994–4010. [Google Scholar] [CrossRef]
- Ishmatov, A. Influence of weather and seasonal variations in temperature and humidity on supersaturation and enhanced deposition of submicron aerosols in the human respiratory tract. Atmos. Environ. 2020, 223, 117226. [Google Scholar] [CrossRef]
- Karimian, H.; Chen, Y.; Tao, T.; Yaqian, L. Spatiotemporal analysis of air quality and its relationship with meteorological factors in the Yangtze River Delta. J. Elem. 2019. [Google Scholar] [CrossRef]
- Perlmutt, L.D.; Cromar, K.R. Comparing associations of respiratory risk for the EPA Air Quality Index and health-based air quality indices. Atmos. Environ. 2019, 202, 1–7. [Google Scholar] [CrossRef]
- Pan, W. Akaike’s information criterion in generalized estimating equations. Biometrics 2001, 57, 120–125. [Google Scholar] [CrossRef] [PubMed]
- Fang, X.; Li, R.; Kan, H.; Bottai, M.; Fang, F.; Cao, Y. Bayesian model averaging method for evaluating associations between air pollution and respiratory mortality: A time-series study. BMJ Open 2016, 6, e011487. [Google Scholar] [CrossRef] [PubMed]
- Glatting, G.; Kletting, P.; Reske, S.N.; Hohl, K.; Ring, C. Choosing the optimal fit function: Comparison of the Akaike information criterion and the F-test. Med Phys. 2007, 34, 4285–4292. [Google Scholar] [CrossRef] [PubMed]
- Yang, L.; Qin, G.; Zhao, N.; Wang, C.; Song, G. Using a generalized additive model with autoregressive terms to study the effects of daily temperature on mortality. BMC Med Res. Methodol. 2012, 12, 165. [Google Scholar] [CrossRef]
- Ma, X.; Longley, I.; Gao, J.; Salmond, J. Assessing schoolchildren’s exposure to air pollution during the daily commute—A systematic review. Sci. Total Environ. 2020, 737, 140389. [Google Scholar] [CrossRef] [PubMed]
- Moutinho, J.L.; Liang, D.; Golan, R.; Sarnat, S.E.; Weber, R.; Sarnat, J.A.; Russell, A.G. Near-road vehicle emissions air quality monitoring for exposure modeling. Atmos. Environ. 2020, 224, 117318. [Google Scholar] [CrossRef]
- Richmond-Bryant, J.; Snyder, M.; Owen, R.; Kimbrough, S. Factors associated with NO2 and NOX concentration gradients near a highway. Atmos. Environ. 2018, 174, 214–226. [Google Scholar] [CrossRef]
- Smith, L.; Mukerjee, S.; Kovalcik, K.; Sams, E.; Stallings, C.; Hudgens, E.; Scott, J.D.; Krantz, T.; Neas, L.M. Near-road measurements for nitrogen dioxide and its association with traffic exposure zones. Atmos. Pollut. Res. 2015, 6, 1082–1086. [Google Scholar] [CrossRef]
- Samet, J.M.; Zeger, S.L.; Dominici, F.; Curriero, F.; Coursac, I.; Dockery, D.W.; Schwartz, J.; Zanobetti, A. The National Morbidity, Mortality, and Air Pollution Study. Part II: Morbidity and mortality from air pollution in the United States. Res. Rep. Health Eff. Inst. 2000, 94, 5–79. [Google Scholar]
- Cheng, W.-L.; Chen, Y.-S.; Zhang, J.; Lyons, T.; Pai, J.-L.; Chang, S.-H. Comparison of the Revised Air Quality Index with the PSI and AQI indices. Sci. Total. Environ. 2007, 382, 191–198. [Google Scholar] [CrossRef] [PubMed]
- Cromar, K.; Ghazipura, M.; Gladson, L.; Perlmutt, L. Evaluating the US air quality index as a risk communcation tool: Comparing associations of index values with respiratory morbidity among adults in California. PLoS ONE 2020, 15, e0242031. [Google Scholar] [CrossRef]
- Thurston, G.D.; Ahn, J.; Cromar, K.R.; Shao, Y.; Reynolds, H.R.; Jerrett, M.; Lim, C.C.; Shanley, R.; Park, Y.; Hayes, R.B. Ambient Particulate Matter Air Pollution Exposure and Mortality in the NIH-AARP Diet and Health Cohort. Environ. Health Perspect. 2016, 124, 484–490. [Google Scholar] [CrossRef]
- Shi, C.; Guo, F.; Shi, Q. Ranking effect in air pollution governance: Evidence from Chinese cities. J. Environ. Manag. 2019, 251, 109600. [Google Scholar] [CrossRef]
- Tanner, K. Communicating health impacts of air pollution and establishing exposure levels. Air Qual. Clim. Chang. 2019, 53, 24–29. [Google Scholar]
- Ramírez, A.S.; Ramondt, S.; Van Bogart, K.; Perez-Zuniga, R. Public Awareness of Air Pollution and Health Threats: Challenges and Opportunities for Communication Strategies to Improve Environmental Health Literacy. J. Health Commun. 2019, 24, 75–83. [Google Scholar] [CrossRef] [PubMed]
- Zivin, J.G.; Neidell, M. Days of haze: Environmental information disclosure and intertemporal avoidance behavior. J. Environ. Econ. Manag. 2009, 58, 119–128. [Google Scholar] [CrossRef]
- Blanco-Becerra, L.C.; Miranda-Soberanis, V.; Barraza-Villarreal, A.; Junger, W.; Hurtado-Díaz, M.; Romieu, I. Effect of socioeconomic status on the association between air pollution and mortality in Bogota, Colombia. Salud Pública México 2014, 56, 371–378. [Google Scholar] [CrossRef] [PubMed]
- Cakmak, S.; Hebbern, C.; Cakmak, J.D.; Vanos, J. The modifying effect of socioeconomic status on the relationship between traffic, air pollution and respiratory health in elementary schoolchildren. J. Environ. Manag. 2016, 177, 1–8. [Google Scholar] [CrossRef]
- Muñoz-Pizza, D.M.; Villada-Canela, M.; Reyna, M.A.; Texcalac-Sangrador, J.L.; Serrano-Lomelin, J.; Osornio-Vargas, Á. Assessing the Influence of Socioeconomic Status and Air Pollution Levels on the Public Perception of Local Air Quality in a Mexico-US Border City. Int. J. Environ. Res. Public Health 2020, 17, 4616. [Google Scholar] [CrossRef] [PubMed]
- Sohrabi, S.; Zietsman, J.; Khreis, H. Burden of Disease Assessment of Ambient Air Pollution and Premature Mortality in Urban Areas: The Role of Socioeconomic Status and Transportation. Int. J. Environ. Res. Public Health 2020, 17, 1166. [Google Scholar] [CrossRef]

| Year | All Ages | 2–17 Years | 18+ Years | |||
|---|---|---|---|---|---|---|
| Total ED Visits | Counts/day | Total ED Visits | Counts/day | Total ED Visits | Counts/day | |
| 2010 | 103,013 | 282.2 | 72,325 | 198.2 | 12,779 | 35.0 |
| 2011 | 94,094 | 257.8 | 65,890 | 180.5 | 11,796 | 32.3 |
| 2012 | 110,777 | 302.7 | 77,243 | 211.0 | 15,094 | 41.2 |
| 2013 | 109,762 | 300.7 | 75,944 | 208.1 | 15,087 | 41.3 |
| 2014 | 111,138 | 304.5 | 74,355 | 203.7 | 20,147 | 55.2 |
| 2015 | 82,198 | 229.0 | 53,756 | 149.7 | 15,187 | 42.3 |
| 610,982 | 279.5 | 419,513 | 191.9 | 90,090 | 41.2 | |
| PM2.5 | O3 | NO2 | |||||
|---|---|---|---|---|---|---|---|
| Age | Lag Days | Risk Ratio (95% CI) | IQR (µg/m3) | Risk Ratio (95% CI) | IQR (ppb) | Risk Ratio (95% CI) | IQR (ppb) |
| 2–17 years | Lag 0–3 | 1.03 (1.01, 1.04) | 10.69 | 1.02 (1.00, 1.04) | 19.23 | 1.01 (1.00, 1.03) | 15.20 |
| Lag 0 | 1.00 (0.99, 1.01) | 13.00 | 1.01 (0.99, 1.03) | 22.20 | 1.00 (0.99, 1.02) | 19.80 | |
| Lag 1 | 1.02 (1.00, 1.03) | 13.00 | 1.02 (1.01, 1.04) | 22.25 | 1.01 (1.00, 1.03) | 19.80 | |
| Lag 2 | 1.02 (1.01, 1.04) | 13.03 | 1.02 (1.01, 1.04) | 22.30 | 1.01 (0.99, 1.02) | 19.70 | |
| Lag 3 | 1.02 (1.01, 1.03) | 13.05 | 1.00 (0.99, 1.02) | 22.30 | 1.01 (0.99, 1.02) | 19.70 | |
| Lag 4 | 1.01 (1.00, 1.03) | 13.10 | 1.00 (0.99, 1.02) | 22.30 | 1.01 (1.00, 1.02) | 19.70 | |
| Lag 5 | 1.01 (1.00, 1.02) | 13.15 | 1.00 (0.98, 1.01) | 22.30 | 1.00 (0.99, 1.01) | 19.70 | |
| 18+ years | Lag 0–3 | 1.04 (1.01, 1.06) | 10.69 | 1.06 (1.03, 1.09) | 19.23 | 1.00 (0.98, 1.03) | 15.20 |
| Lag 0 | 1.01 (0.99, 1.03) | 13.00 | 1.04 (1.02, 1.07) | 22.20 | 1.01 (0.99, 1.03) | 19.80 | |
| Lag 1 | 1.01 (0.99, 1.03) | 13.00 | 1.05 (1.02, 1.07) | 22.25 | 1.00 (0.98, 1.02) | 19.80 | |
| Lag 2 | 1.02 (1.00, 1.04) | 13.03 | 1.03 (1.01, 1.06) | 22.30 | 1.01 (0.99, 1.03) | 19.70 | |
| Lag 3 | 1.04 (1.02, 1.06) | 13.05 | 1.02 (1.00, 1.04) | 22.30 | 1.00 (0.98, 1.02) | 19.70 | |
| Lag 4 | 1.02 (1.00, 1.04) | 13.10 | 1.02 (1.00, 1.04) | 22.30 | 1.01 (0.99, 1.03) | 19.70 | |
| Lag 5 | 1.02 (.99, 1.04) | 13.15 | 1.01 (0.99, 1.04) | 22.30 | 1.00 (0.98, 1.02) | 19.70 | |
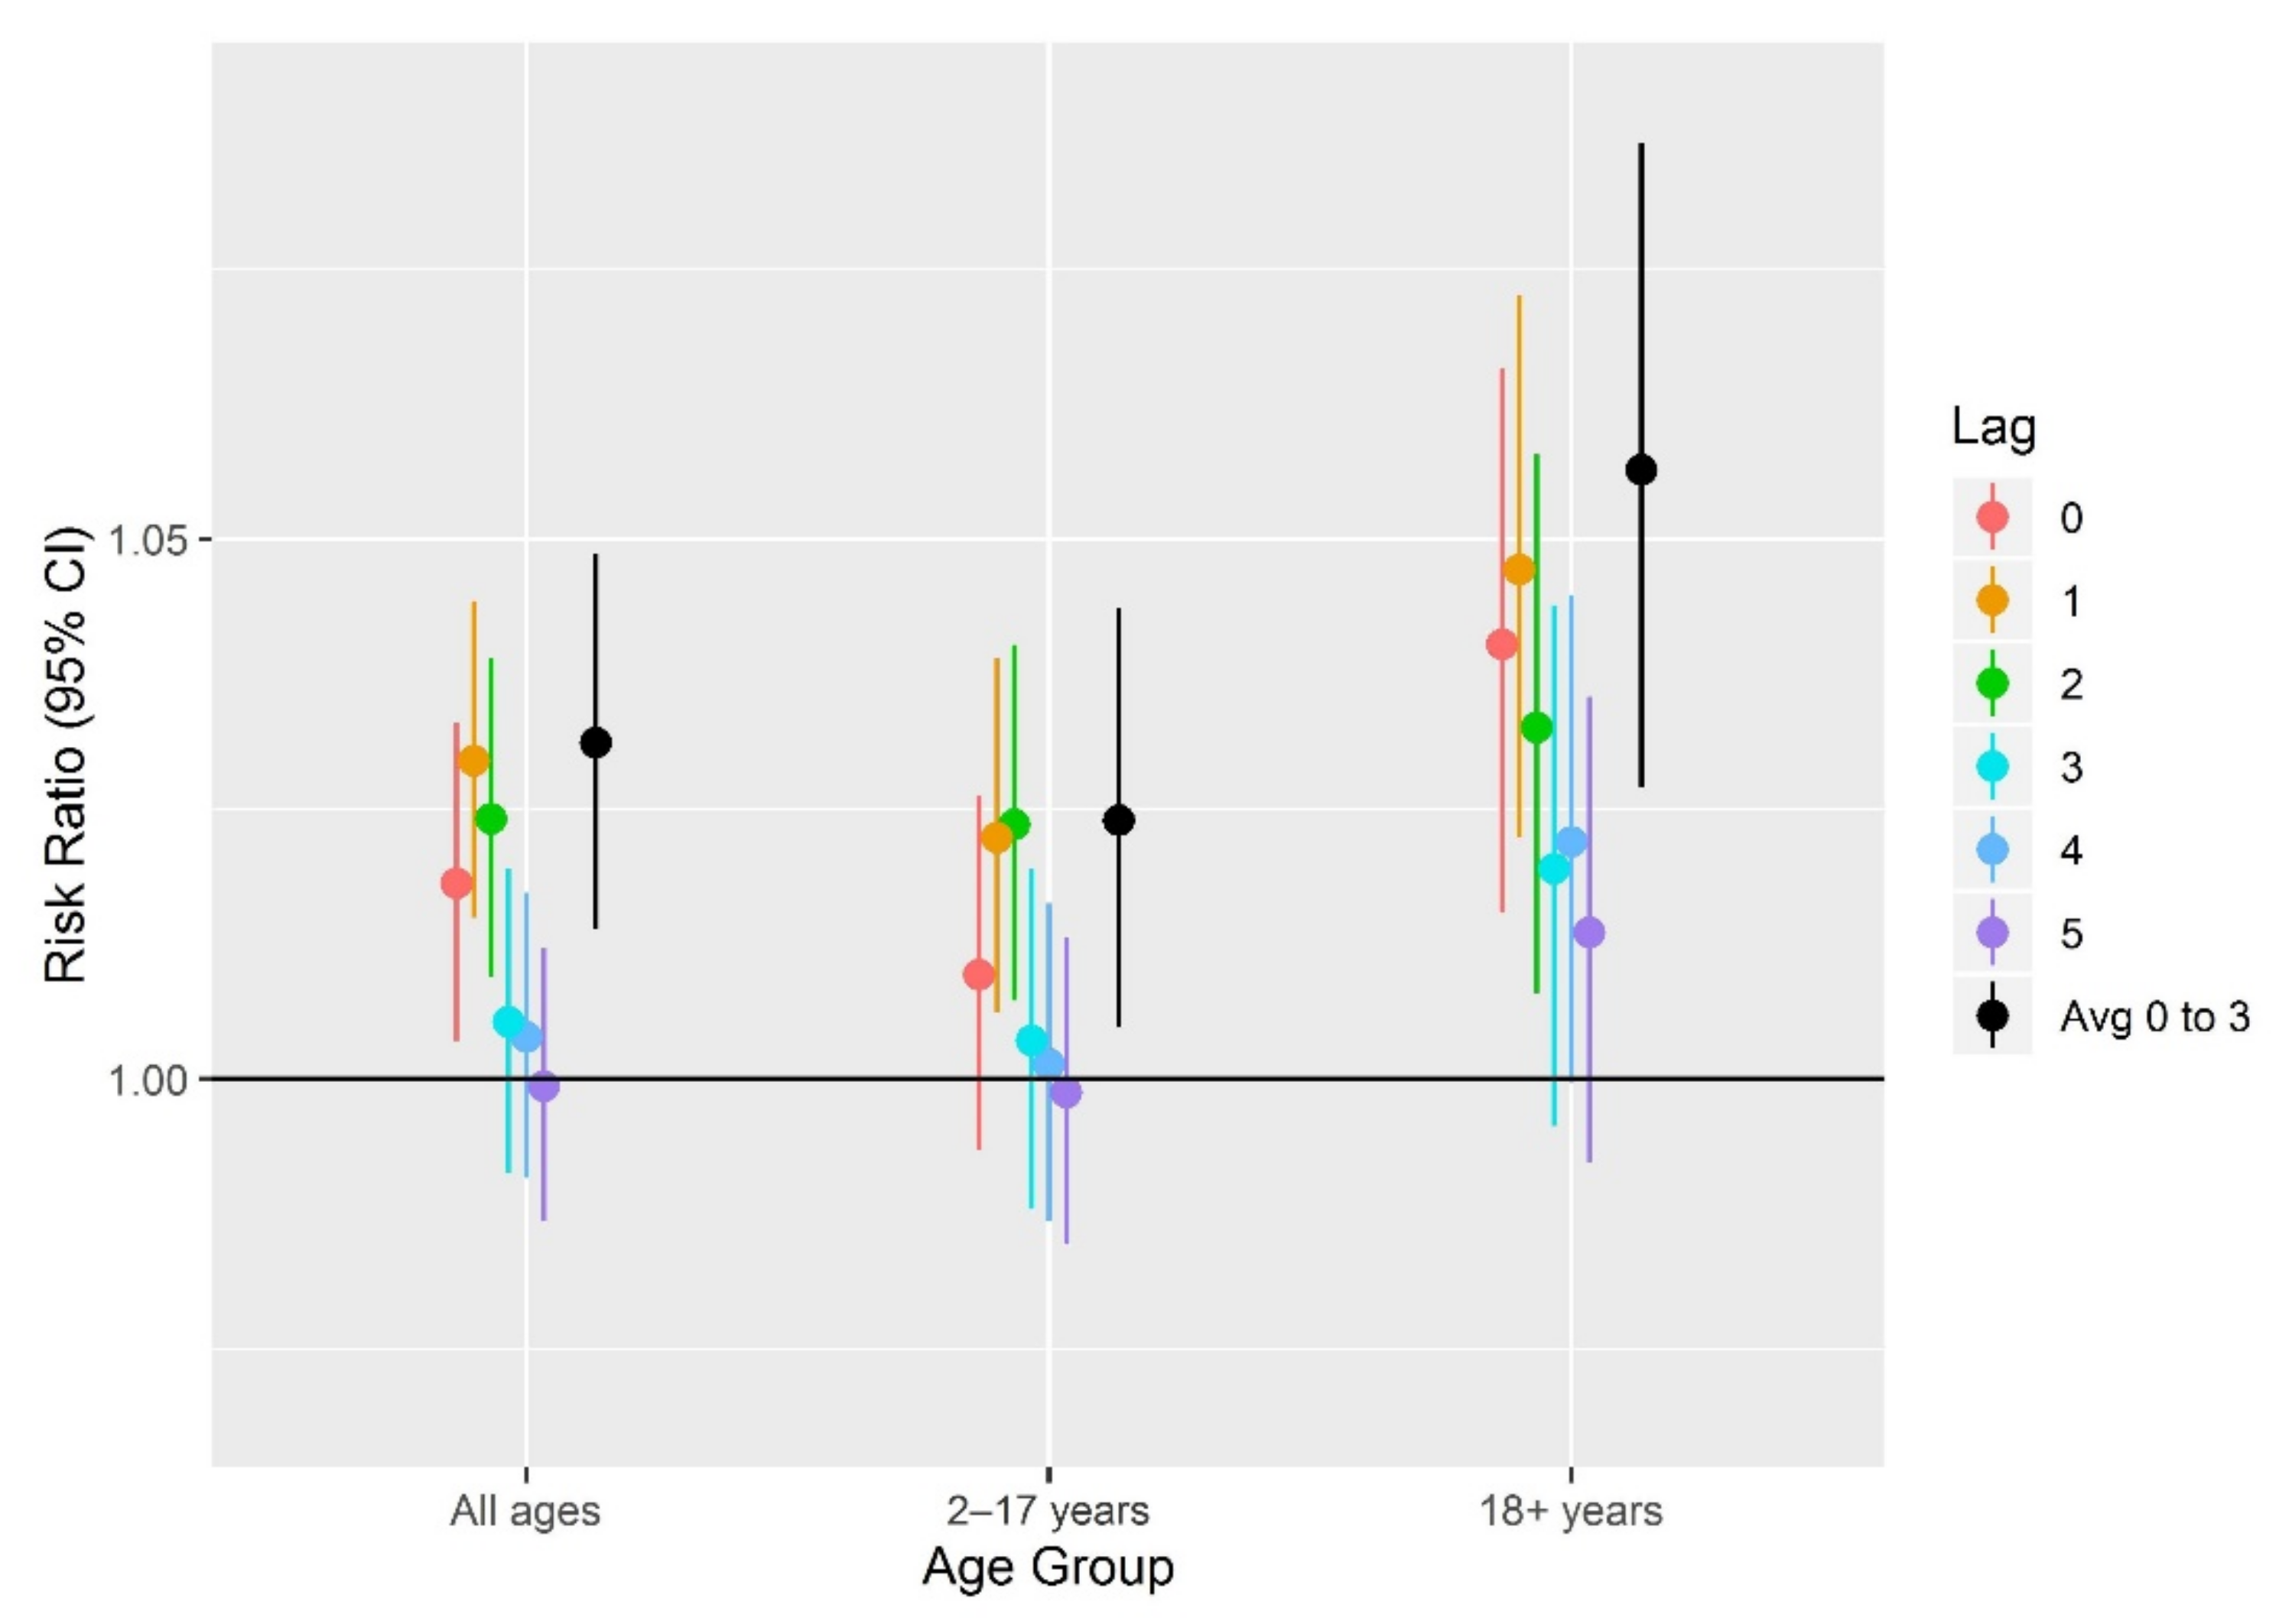
| All ages | Lag 0–3 | 1.03 (1.01, 1.04) | 10.69 | 1.03 (1.01, 1.05) | 19.23 | 1.01 (0.99, 1.02) | 15.20 |
| Lag 0 | 1.00 (0.99, 1.01) | 13.00 | 1.02 (1.00, 1.03) | 22.20 | 1.00 (0.99, 1.01) | 19.80 | |
| Lag 1 | 1.02 (1.01, 1.03) | 13.00 | 1.03 (1.01, 1.04) | 22.25 | 1.01 (1.00, 1.02) | 19.80 | |
| Lag 2 | 1.02 (1.01, 1.04) | 13.03 | 1.02 (1.01, 1.04) | 22.30 | 1.01 (0.99, 1.02) | 19.70 | |
| Lag 3 | 1.02 (1.01, 1.03) | 13.05 | 1.01 (0.99, 1.02) | 22.30 | 1.00 (0.99, 1.01) | 19.70 | |
| Lag 4 | 1.01 (1.00, 1.02) | 13.10 | 1.00 (0.99, 1.02) | 22.30 | 1.01 (0.99, 1.02) | 19.70 | |
| Lag 5 | 1.01 (1.00, 1.02) | 13.15 | 1.00 (0.99, 1.01) | 22.30 | 1.00 (0.99, 1.01) | 19.70 | |
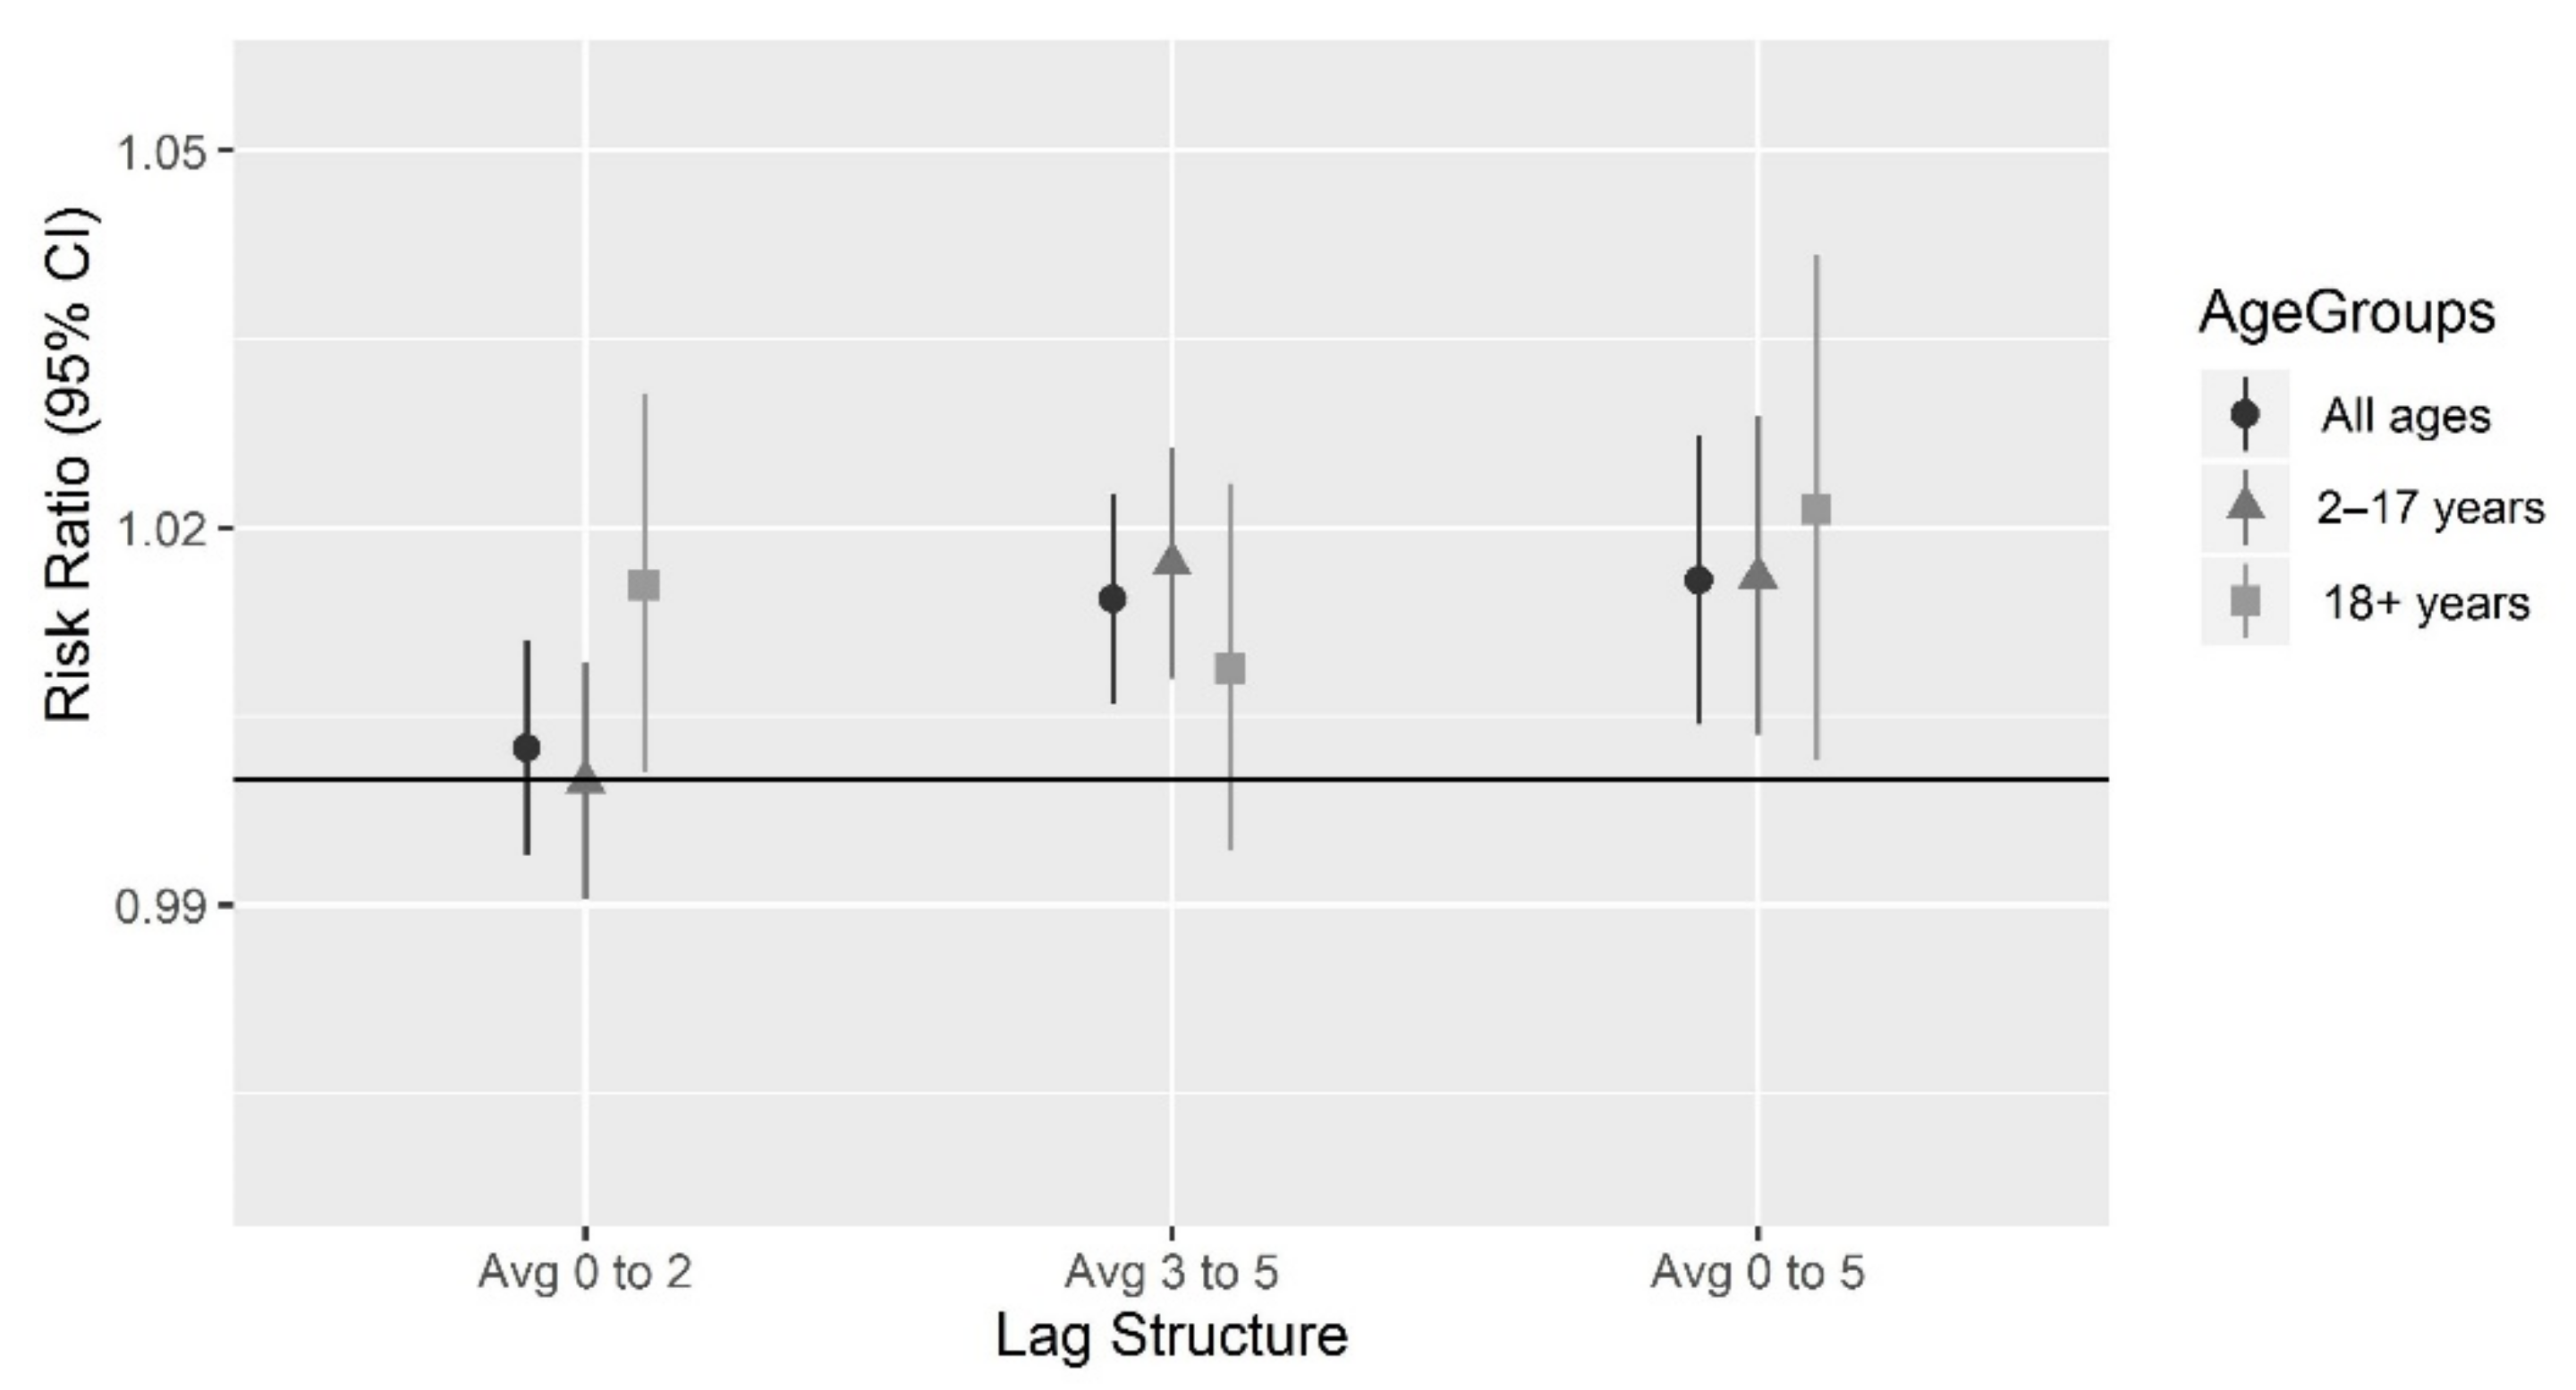
| Age | Health-Based Index Values | ||
|---|---|---|---|
| Risk Ratio (95% CI) | |||
| Lag 0–2 | Lag 3–5 | Lag 0–5 | |
| 2–17 years | 1.00 (0.99, 1.01) | 1.02 (1.01, 1.03) | 1.02 (1.00, 1.03) |
| 18+ years | 1.02 (1.00, 1.03) | 1.01 (0.99, 1.02) | 1.02 (1.00, 1.04) |
| All ages | 1.00 (0.99, 1.01) | 1.01 (1.01, 1.02) | 1.02 (1.00, 1.03) |
Publisher’s Note: MDPI stays neutral with regard to jurisdictional claims in published maps and institutional affiliations. |
© 2021 by the authors. Licensee MDPI, Basel, Switzerland. This article is an open access article distributed under the terms and conditions of the Creative Commons Attribution (CC BY) license (http://creativecommons.org/licenses/by/4.0/).
Share and Cite
Cromar, K.; Gladson, L.; Jaimes Palomera, M.; Perlmutt, L. Development of a Health-Based Index to Identify the Association between Air Pollution and Health Effects in Mexico City. Atmosphere 2021, 12, 372. https://doi.org/10.3390/atmos12030372
Cromar K, Gladson L, Jaimes Palomera M, Perlmutt L. Development of a Health-Based Index to Identify the Association between Air Pollution and Health Effects in Mexico City. Atmosphere. 2021; 12(3):372. https://doi.org/10.3390/atmos12030372
Chicago/Turabian StyleCromar, Kevin, Laura Gladson, Mónica Jaimes Palomera, and Lars Perlmutt. 2021. "Development of a Health-Based Index to Identify the Association between Air Pollution and Health Effects in Mexico City" Atmosphere 12, no. 3: 372. https://doi.org/10.3390/atmos12030372
APA StyleCromar, K., Gladson, L., Jaimes Palomera, M., & Perlmutt, L. (2021). Development of a Health-Based Index to Identify the Association between Air Pollution and Health Effects in Mexico City. Atmosphere, 12(3), 372. https://doi.org/10.3390/atmos12030372


