Article

Quantifying Air Pollutant Variations during COVID-19 Lockdown in a Capital City in Northwest China

1
Department of Environmental Science and Engineering, Xi’an Jiaotong University, Xi’an 710049, China
2
Key Laboratory of Environment and Human Health, Chinese Center for Disease Contro and Prevention, Institute of Environmental Health, Beijing 100021, China
3
SKLLQG, Key Lab of Aerosol Chemistry & Physics, Institute of Earth Environment, Chinese Academy of Sciences, Xi’an 710061, China
4
Key Laboratory of Northwest Resource, Environment and Ecology, MOE, Xi’an University of Architecture and Technology, Xi’an 710055, China
*
Authors to whom correspondence should be addressed.
Atmosphere 2021, 12(6), 788; https://doi.org/10.3390/atmos12060788
Submission received: 21 May 2021 / Revised: 15 June 2021 / Accepted: 15 June 2021 / Published: 19 June 2021

Abstract

:
In the context of the outbreak of coronavirus disease 2019 (COVID-19), strict lockdown policies were implemented to control nonessential human activities in Xi’an, northwest China, which greatly limited the spread of the pandemic and affected air quality. Compared with pre-lockdown, the air quality index and concentrations of PM2.5, PM10, SO2, and CO during the lockdown reduced, but the reductions were not very significant. NO2 levels exhibited the largest decrease (52%) during lockdown, owing to the remarkable decreased motor vehicle emissions. The highest K+ and lowest Ca2+ concentrations in PM2.5 samples could be attributed to the increase in household biomass fuel consumption in suburbs and rural areas around Xi’an and the decrease in human physical activities in Xi’an (e.g., human travel, vehicle emissions, construction activities), respectively, during the lockdown period. Secondary chemical reactions in the atmosphere increased in the lockdown period, as evidenced by the increased O3 level (increased by 160%) and OC/EC ratios in PM2.5 (increased by 26%), compared with pre-lockdown levels. The results, based on a natural experiment in this study, can be used as a reference for studying the formation and source of air pollution in Xi’an and provide evidence for establishing future long-term air pollution control policies.

1. Introduction

Since the Industrial Revolution in the 18th century, industrialization has transformed production patterns and lifestyles in society. However, industrialization and modernization have led to major environmental problems [1,2,3]. Anthropogenic emissions, including vehicle and industrial exhaust emissions, fossil fuel combustion, resident smoking, and household heating, are an important cause of deteriorating air quality [4,5,6].
Ghaffarpasend et al. [7] concluded that motor vehicle emissions accounted for an average of 45% of the air pollutants in Tehran, Iran. Industrial processes contributed 10.7% of particulate matter with aerodynamic diameter equal to or less than 2.5 μm (PM2.5), and fossil fuel combustion contributed 15.8% of particulate matter with aerodynamic diameter equal to or less than 10 μm (PM10) emissions in Shandong Province of China [3]. Moreover, Zhang et al. [2] reported that industrial processes were the main source of organic carbon (OC) emissions in total suspended particulate (TSP), accounting for 23.6% of the total OC emission in Henan Province, China. The emission inventory reported by Zhong et al. [4] proved that the contribution rate of power plants and industrial combustion to SO2 emissions can reach approximately 80% in Guangdong Province, and emissions from on-road mobile sources were the most important contributor to NOx, accounting for 35.5%. Transportation also contributed 88% of the total annual CO in Brunei Darussalam in 2012 [8], and the blast furnaces of iron and steel smelting contributed 38.4% of CO emissions in Beijing and the surrounding five cities of China [1].
In addition to the contribution of primary emission sources, the level of air pollutants is greatly affected by the formation of secondary sources, especially PM2.5, which is largely influenced by secondary organic aerosol (SOA). SO2 and NO2 are important precursor gases in the formation of sulfate and nitrate through gas-to-particle conversion [9,10]. Feng et al. [11] reported that nitrate aerosol was the main contributor to particulate pollution in Beijing, and the mass fraction of nitrate in PM2.5 ranged from 20.1% to 28.9% from 2013 to 2015. Guo et al. [12] observed that the proportion of sulfate in PM2.5 ranged from 28.2% to 50.5% in Nanjing in 2015. The secondary air pollutants generated by the reaction of the primary pollutants also exert considerable effects on regional environmental quality and human health [13,14].
Cases such as major sports events, large-scale international conferences, and pandemic outbreak and control are excellent examples wherein stringent emission control measures to limit human activities significantly improved air quality [15]. For instance, SO2, NOx, and PM10 concentrations in Beijing were reduced by approximately 85%, 46%, and 90% by shutting down factories producing building materials, restricting mobile source emissions, and prohibiting building construction programs during the 2008 Beijing Olympic Games, respectively [16]. Cheng et al. [17] found that traffic restrictions effectively improved air quality and reduced secondary particle emissions during the China-Africa Summit held in Beijing in 2006. The apparent improvement in air quality was observed as a result of control strategies implemented through policies and air quality before, during, and after the Shanghai World Expo in 2010 [18]. The 2014 Asia-Pacific Economic Cooperation (APEC) meeting held in Shanghai, China, reported the effectiveness of government pollution source control measures on air quality; NO2 emissions decreased by 47% during the APEC period in 2014 [19]. These cases indicate the effectiveness of temporary restrictions on anthropogenic sources in reducing air pollution. Thus, the lockdown caused by the COVID-19 pandemic provided a natural experiment for assessing the effect of limiting anthropogenic activities on air pollutant levels.
Around the end of December 2019, Wuhan City, Hubei Province, China, became the first place to report an unexplained pneumonia outbreak, which attracted widespread attention internationally [20]. The World Health Organization (WHO) named the disease caused by the novel coronavirus as COVID-19 on 11 February 2020. In 30 January 2020, the WHO declared that the COVID-19 outbreak was a public health emergency of international concern, which is the highest level of alarm [21]. As of 11 April 2021, there have been 135,446,538 confirmed cases of COVID-19 and 2,927,922 deaths globally [22]. Due to the high infectivity and mortality rate of COVID-19 [23], to prevent the transmission of the virus effectively, strict city lockdown policies were implemented by the Chinese government from 23 January 2020.
Xi’an is the capital city of Shaanxi Province with a permanent population of 10,203,500 in 2020. As the center of the Guanzhong Plain Urban Agglomeration, Xi’an is responsible for important environmental protection and needs more scientific research and attention [24]. In order to avoid the spread of COVID-19, Xi’an had introduced a series of policies and measures for restricting human activities including the closure of attractions and large supermarkets, traffic and travel restrictions, construction site suspension, and temporary control of the opening of enterprises and institutions. At the beginning of 2020, when the epidemic growth rate was the most prominent in China [25], the total industrial output of electric power and heat power production and supply industries in Xi’an declined by 1.2% from January to February in 2020 compared with that in the same period in 2019 [26], implying a reduction in industrial emissions. In January and February 2020, the added value of the city’s industrial enterprises above the designated size decreased by 3.3%, and the output values of light and heavy industries decreased by 23.5% and 13.2%, respectively [24], and the number of construction projects decreased by 16.3% compared with that in the same period in 2019. Among them, industrial construction projects reduced by 31.2% [27].
The lockdown brought about drastic impacts at social and economic fronts [28,29,30,31] as well as impacts on the environment, particularly in the context of air quality, environmental, and noise reduction [32,33,34]. To date, previous data and studies have shown that the emergency measures taken by the government to prevent human activities in the lockdown period of COVID-19 had effectively and significantly reduced ambient air pollution [20,35,36,37,38,39,40,41]. However, no comprehensive investigation has been conducted on the impact of COVID-19 control measures on gaseous and particulate air pollutants in Xi’an. In the present study, offline PM2.5 filters and online air pollutant monitoring records were collected simultaneously in Xi’an from 1 January to 7 March 2020. The main objective of this study was to determine the variation in air pollutants, including PM2.5, OC, elemental carbon (EC), water-soluble ions (WSIs), PM10, and gaseous pollutants (SO2, NO2, CO, and O3) in Xi’an in relation to the restrictive anthropogenic activities before, during, and after the COVID-19 lockdown. Additionally, this study referenced and categorized relevant domestic and international results (also covering previous years and months of the lockdown period) to summarize the characteristics of various air pollutants in several regions and to obtain a more in-depth understanding of air quality improvement and PM2.5 compositions in Xi’an during this event. The lockdown caused by the COVID-19 pandemic provided an opportunity to perform a natural experiment for evaluating air quality responses to drastic emission reduction, and it is helpful to formulating more targeted policies in this heavily polluted area and sustainable development [33,42,43]. In line with this, future awareness campaigns should focus more on a multidisciplinary area in practitioners from all walks of life towards Penta Helix Collaboration [44,45,46] in the post-COVID-19 world [47,48].

2. Materials and Methods

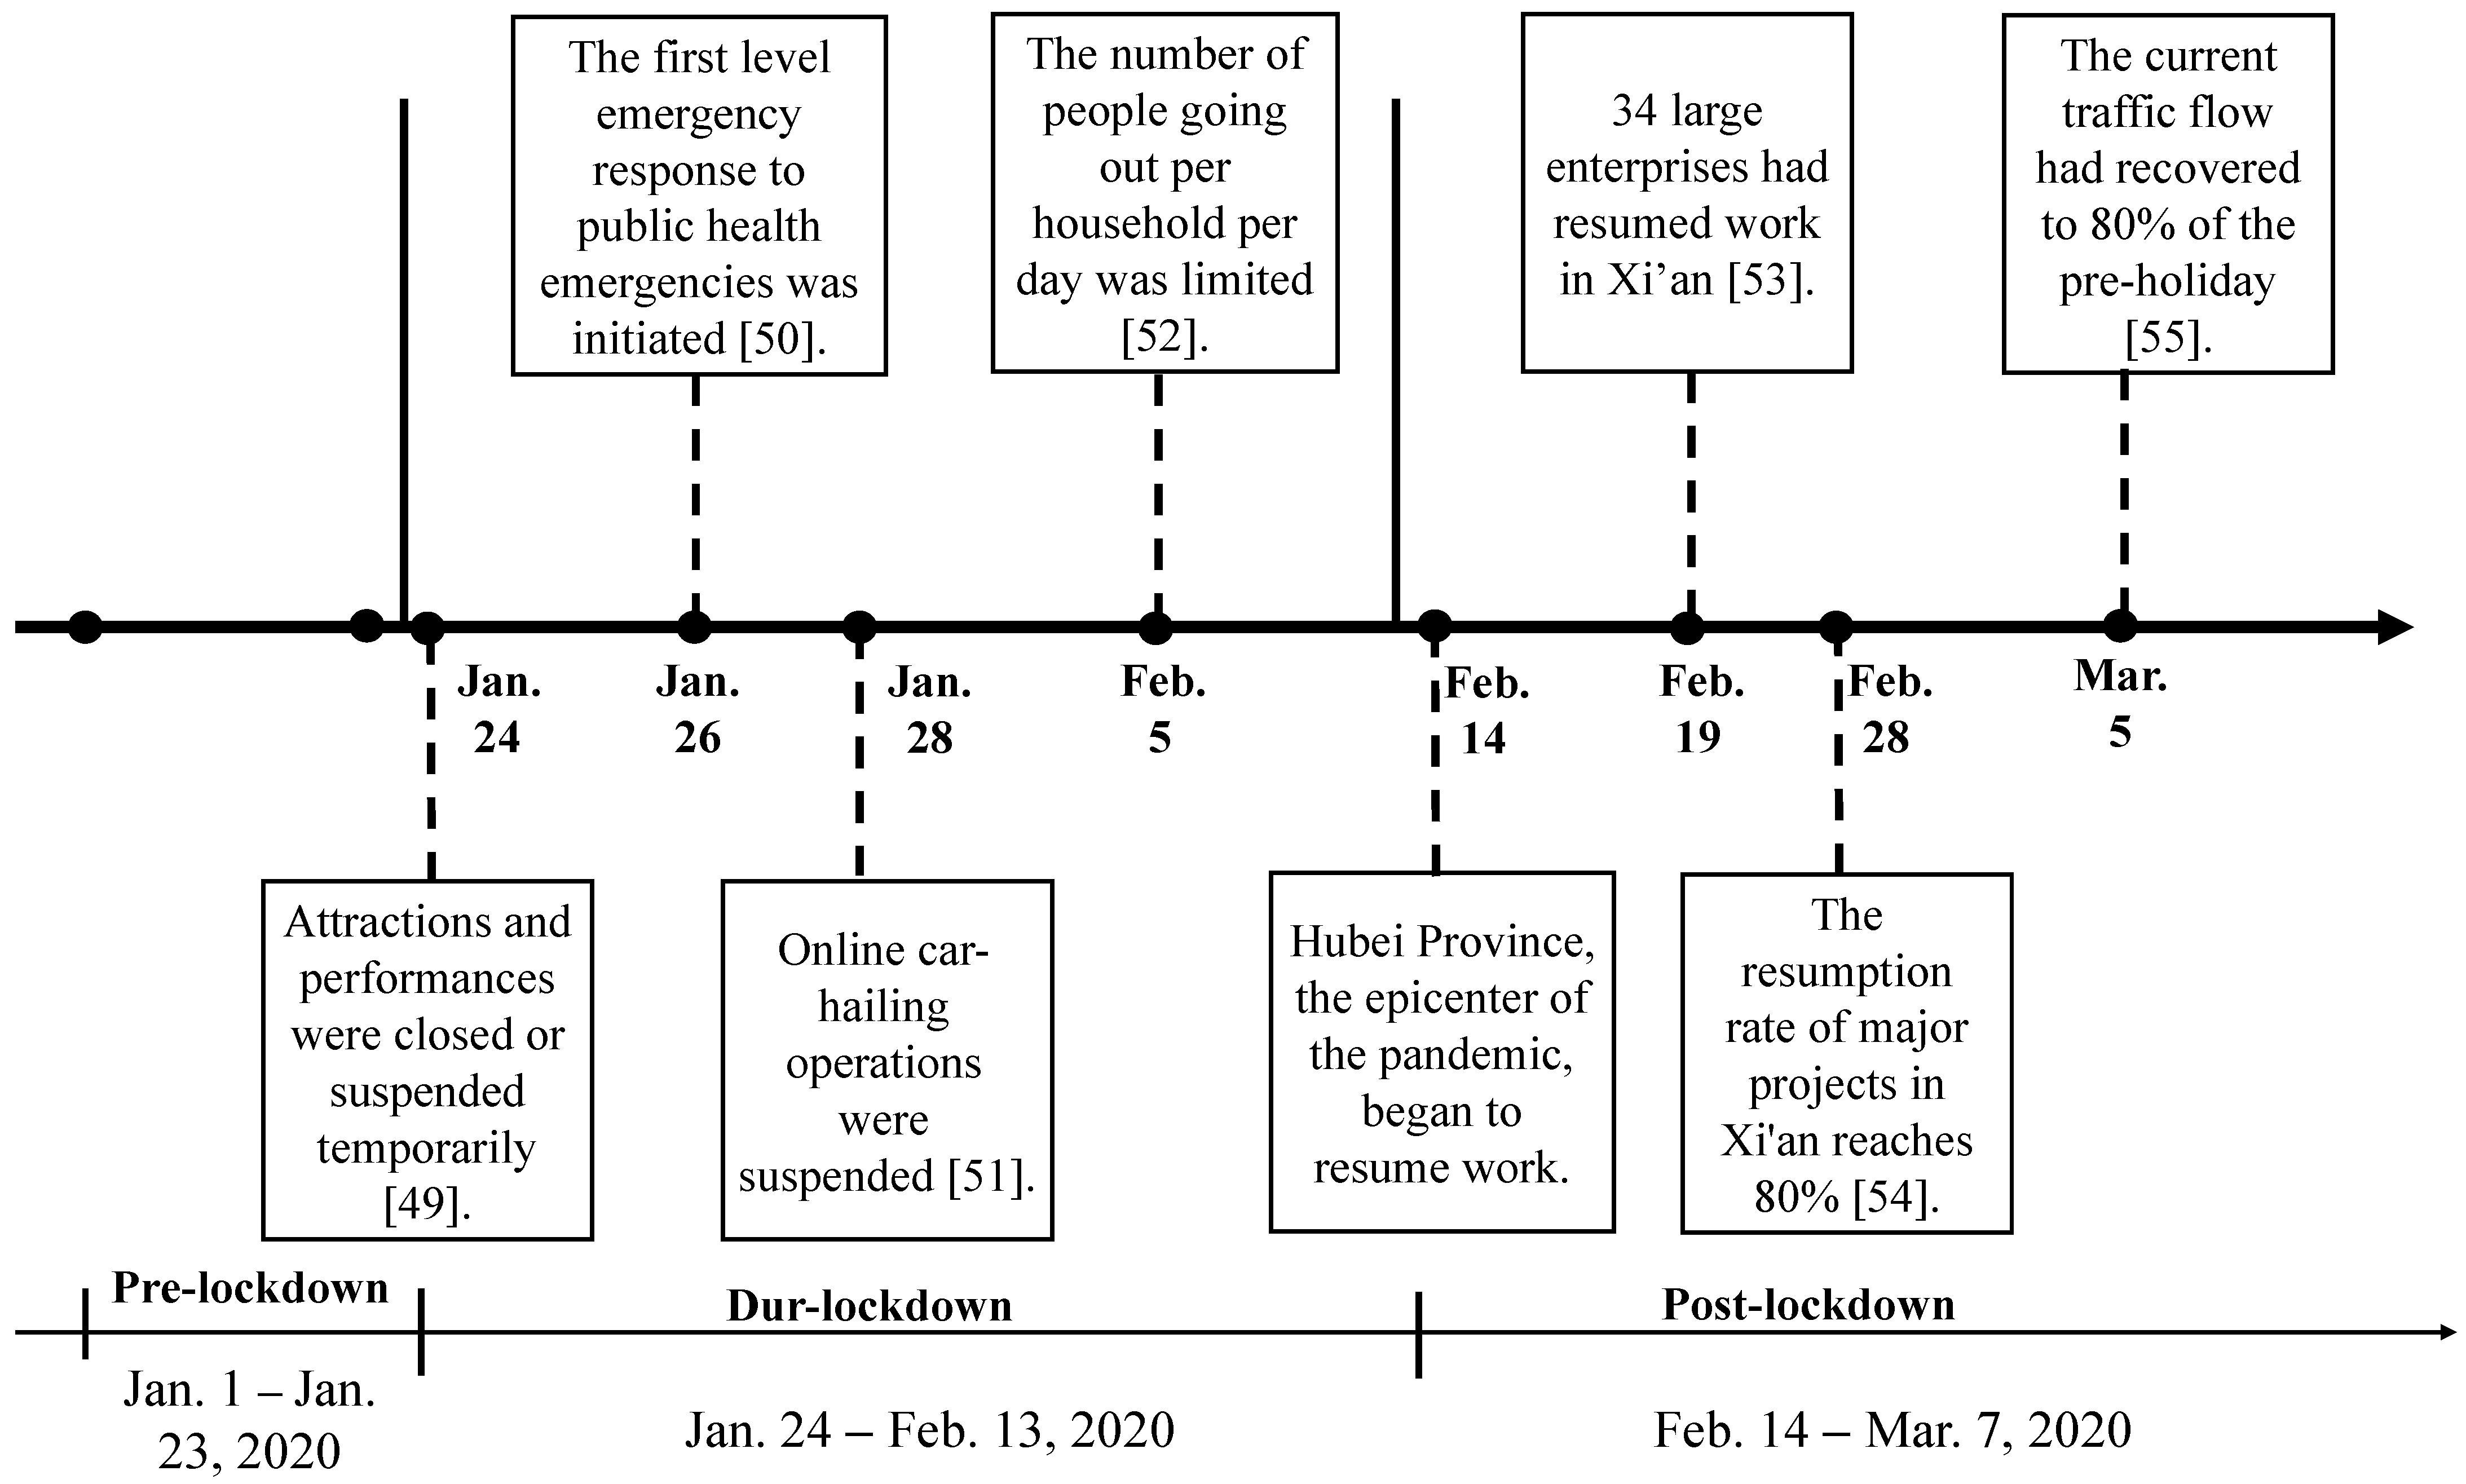
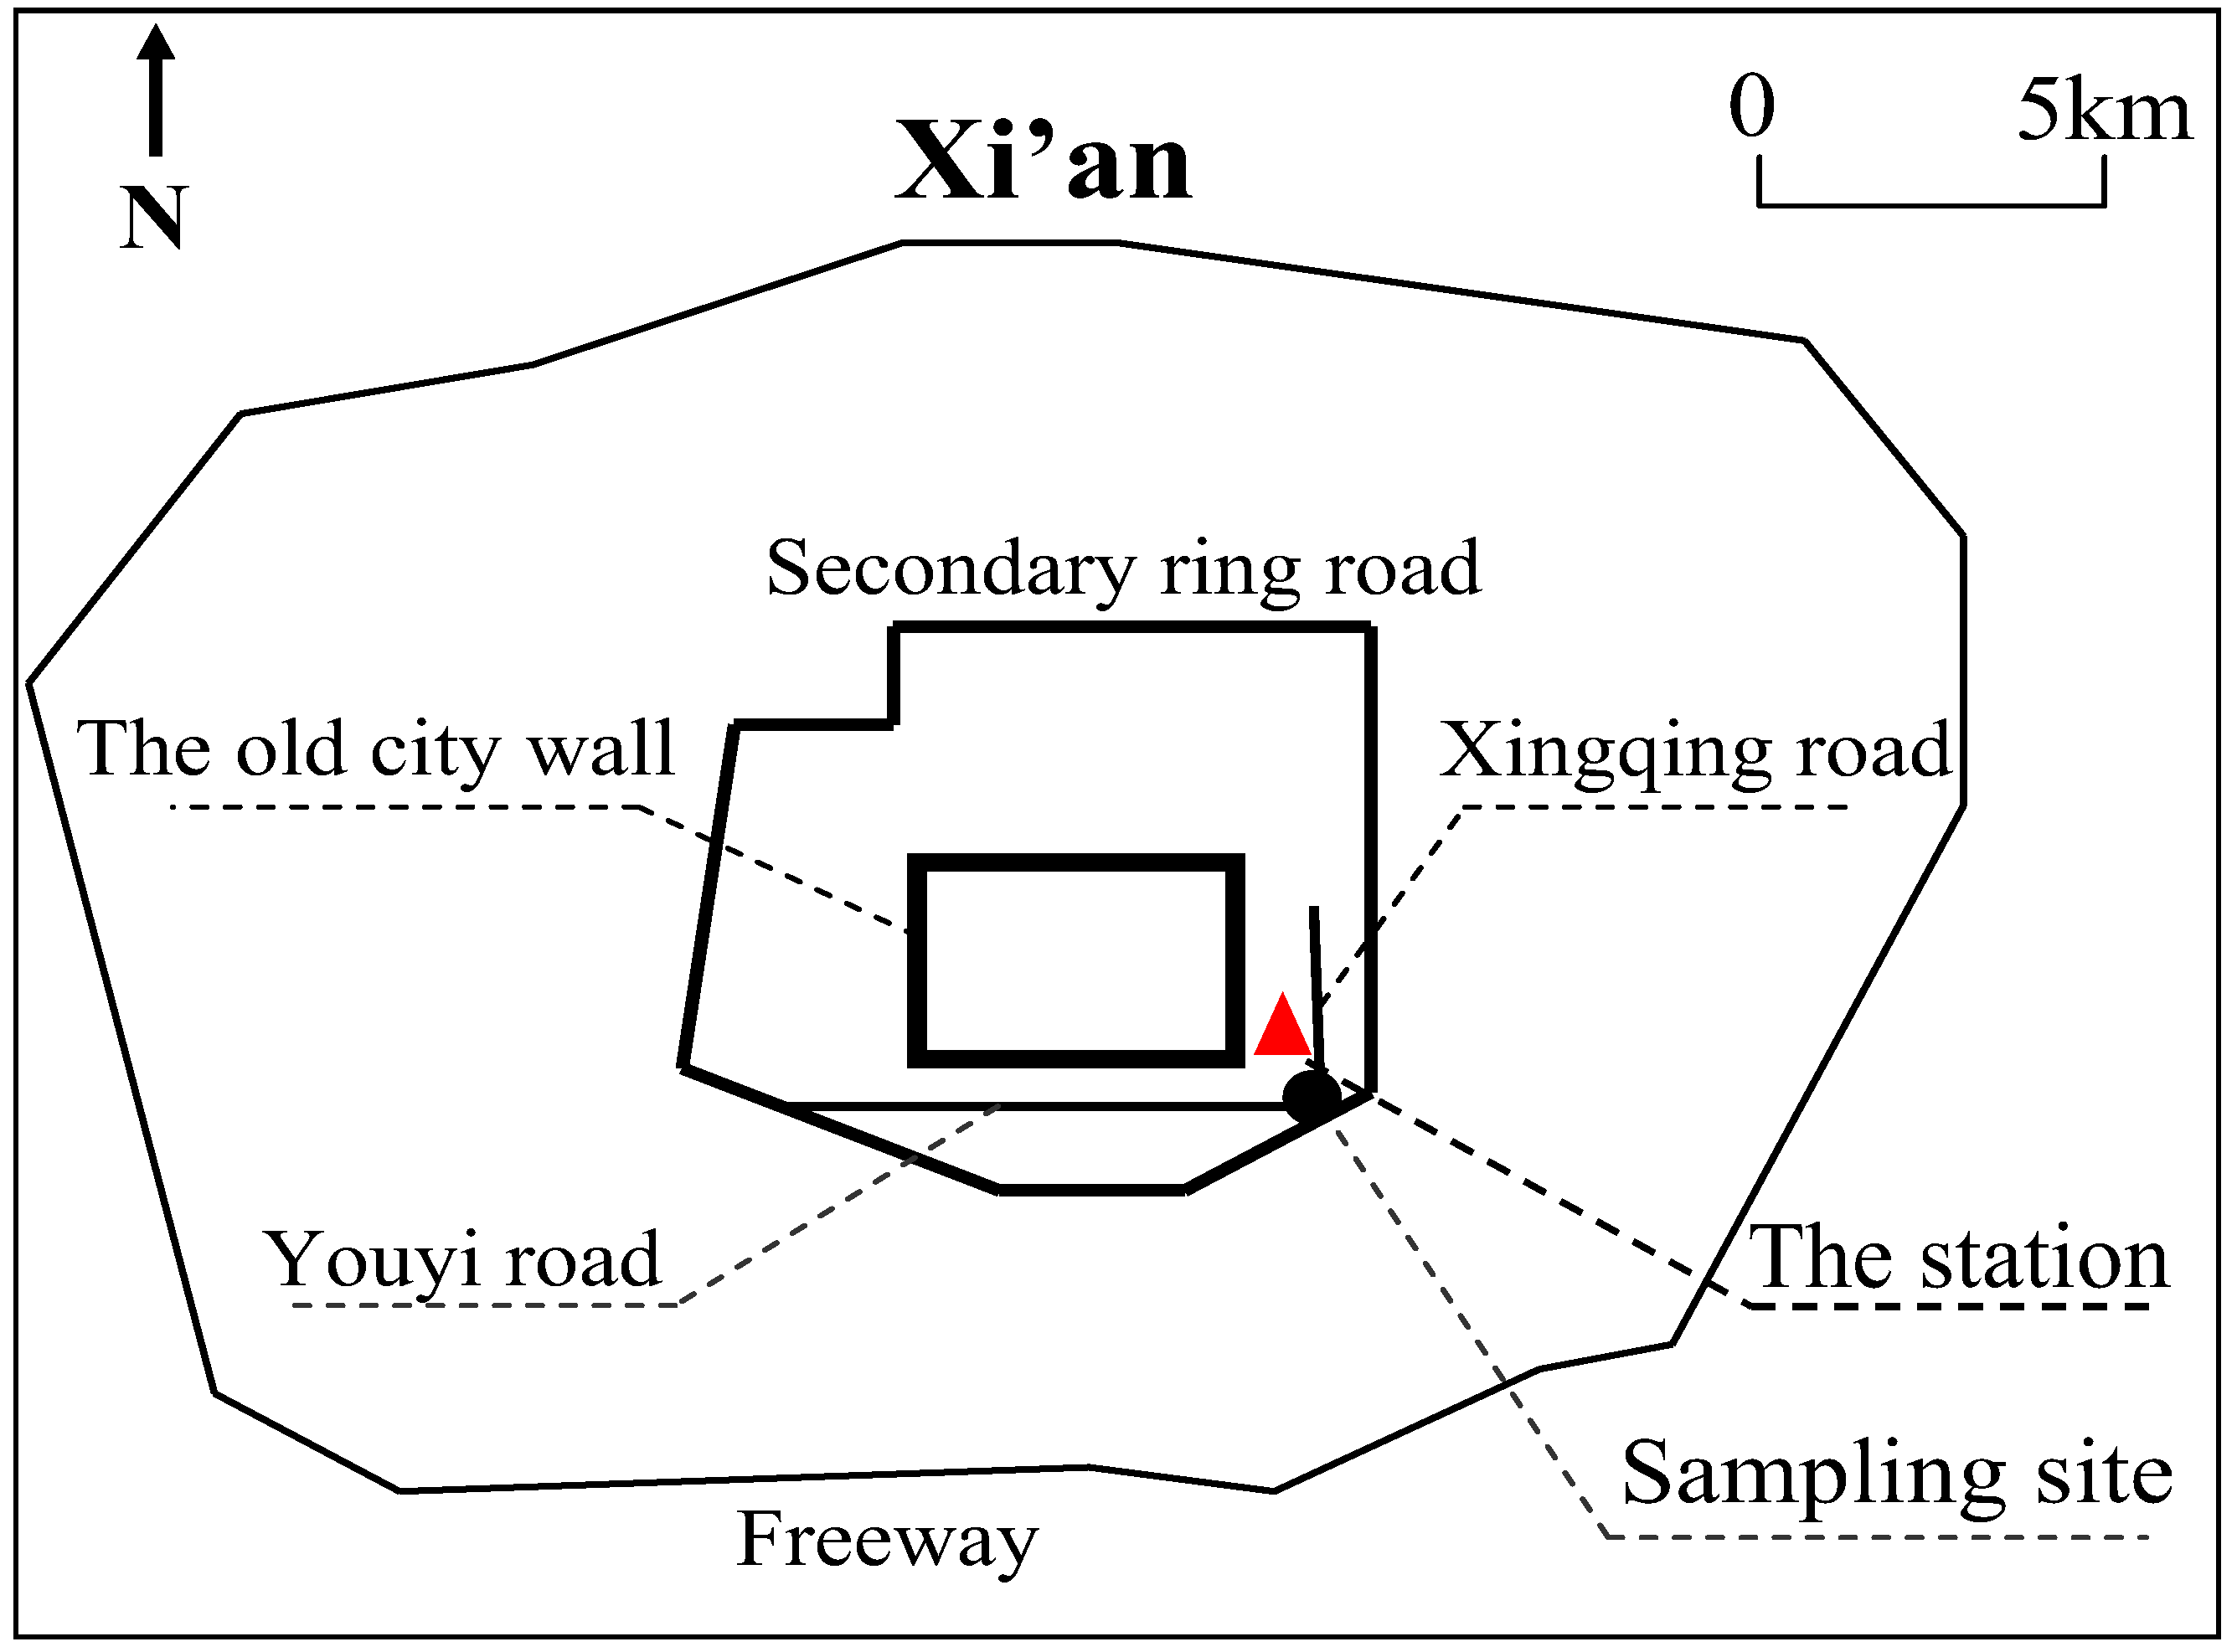
2.1. Experimental Design

Our study focused on air quality variation during the COVID-19 lockdown in the city of Xi’an (the capital of Shaanxi Province), China. The COVID-19 lockdown period in this study was divided into three time intervals, namely pre-lockdown (1 January to 23 January 2020), during lockdown (24 January to 13 February 2020), and post-lockdown (14 February to 7 March 2020). Air quality was expected to improve because a series of policies had been implemented to control human activities (Figure 1). In this study, offline PM2.5 filter samples were collected, and the carbonaceous fraction and WSIs were analyzed. Simultaneously collected online and offline air quality data during the study period were used for comparison. The aforementioned information was processed to study the changes in air pollution sources and the improvement in air quality during the COVID-19 lockdown.

2.2. PM2.5 Sample Collection

Daily PM2.5 samples were collected on the roof top of a five-storied building (16.3 m above the ground) on the campus of Xi’an Jiaotong University (108.990° E, 34.252° N) that is surrounded by residential areas and other campus buildings, and is approximately 200 m away from the Xingqing Road and South Second Ring Road (Figure 2), which have heavy traffic, making it a suitable region with a mixture of mobile emission and stationary emission sources. Twenty-four-hour PM2.5 samples (10:00 am to 10:00 am next day local time) were collected using pre-fired (780 °C, 3 h) 90 mm PALLFLEX TISSUQUARTZ filters (QM/A, PALL, Ann Arbor, MI, USA) with the HY–100SFB high-load PM sampler at a flow rate of 100 L min−1 from 1 January 2020 to 7 March 2020. A total of 67 PM2.5 samples and 3 field blank filters (1 for each period) were collected in this study. The final data were obtained by subtracting all field blanks to avoid any artifacts induced by gas absorption.

2.3. Gravimetric and Chemical Analyses

Gravimetric analysis: The PM2.5 samples required to be equilibrated at 20–23 °C and 35–45% of relative humidity for 24 h. Then, filters were weighed for mass concentration determination using a Sartorius LA 130S-F (Sartorius, Germany) electronic microbalance (sensitivity: 0.1 mg). Each filter was weighted at least four times (two times before sampling and two times after sampling), and the weight of PM2.5 was obtained by subtracting the pre-sampling weights from the post-sampling weights. The mass concentration of PM2.5 was obtained by dividing the weight mass by the sampling volume.
OC and EC analyses: A 0.5 cm2 punch was cut from each filter and placed into the Desert Research Institute Model 2001 Thermal/Optical Carbon Analyzer (Atmoslytic Inc., Calabasas, CA, USA) for the OC and EC analyses in PM2.5 following the IMPROVE_A (Interagency Monitoring of Protected Visual Environment) thermal/optical reflectance protocol. The filter was heated gradually and analyzed first in an oxygen-pure He atmosphere, and OC1, OC2, OC3, and OC4 were obtained at 140, 280, 480, and 580 °C, respectively. Then, OP (carbon formed during the cracking process of OC) and EC were analyzed in a He atmosphere containing 2% oxygen. EC1, EC2, and EC3 were obtained at 580, 740, and 840 °C in a step-by-step manner. The detection limits for OC and EC were 0.82 and 0.20 μg·m−2, respectively. Details of quality assurance and quality control (QA/QC) are provided in Cao et al. [56] and Xu et al. [57].
Water-soluble ions (WSIs) analysis: Nine WSIs (Na+, NH4+, K+, Ca2+, Mg2+, F, Cl, NO3, and SO42−) were detected using an ion chromatograph (IC) analyzer (Dionex–600, Dionex, Sunnyvale, CA, USA). The detection limits of Na+, NH4+, K+, Ca2+, Mg2+, F, Cl, NO3, and SO42− were 4.6, 4.0, 10.0, 10.0, 10.0, 0.5, 0.5, 15, and 20 μg·L−1, respectively. IC was calibrated by measuring varying concentrations of the standard reference materials of the standard agent (National Research Centre for Certified Reference Materials, China) in the external calibration. Details of the IC principle and QA/QC are provided in Shen et al. [58] and Xu et al. [10].

2.4. Online Data Collection

Online air quality index (AQI), PM2.5, PM10, SO2, NO2, CO, and O3_8h data were obtained from the nearest air quality monitoring station; these data were downloaded from the website of China Environmental Monitoring Center [59]. Mann–Whitney U test was performed on online data to determine whether there are significant differences for AQI, and online, six national controlled air pollutants between adjacent time periods, p < 0.05 (*) is considered to be statistically significant. The meteorological data {i.e., air temperature (AT), relative humidity (RH), prevailing wind direction (PWD), and wind speed (WS)) used in this study (Table 1) were derived from the air quality monitoring station [60].

3. Results and Discussion

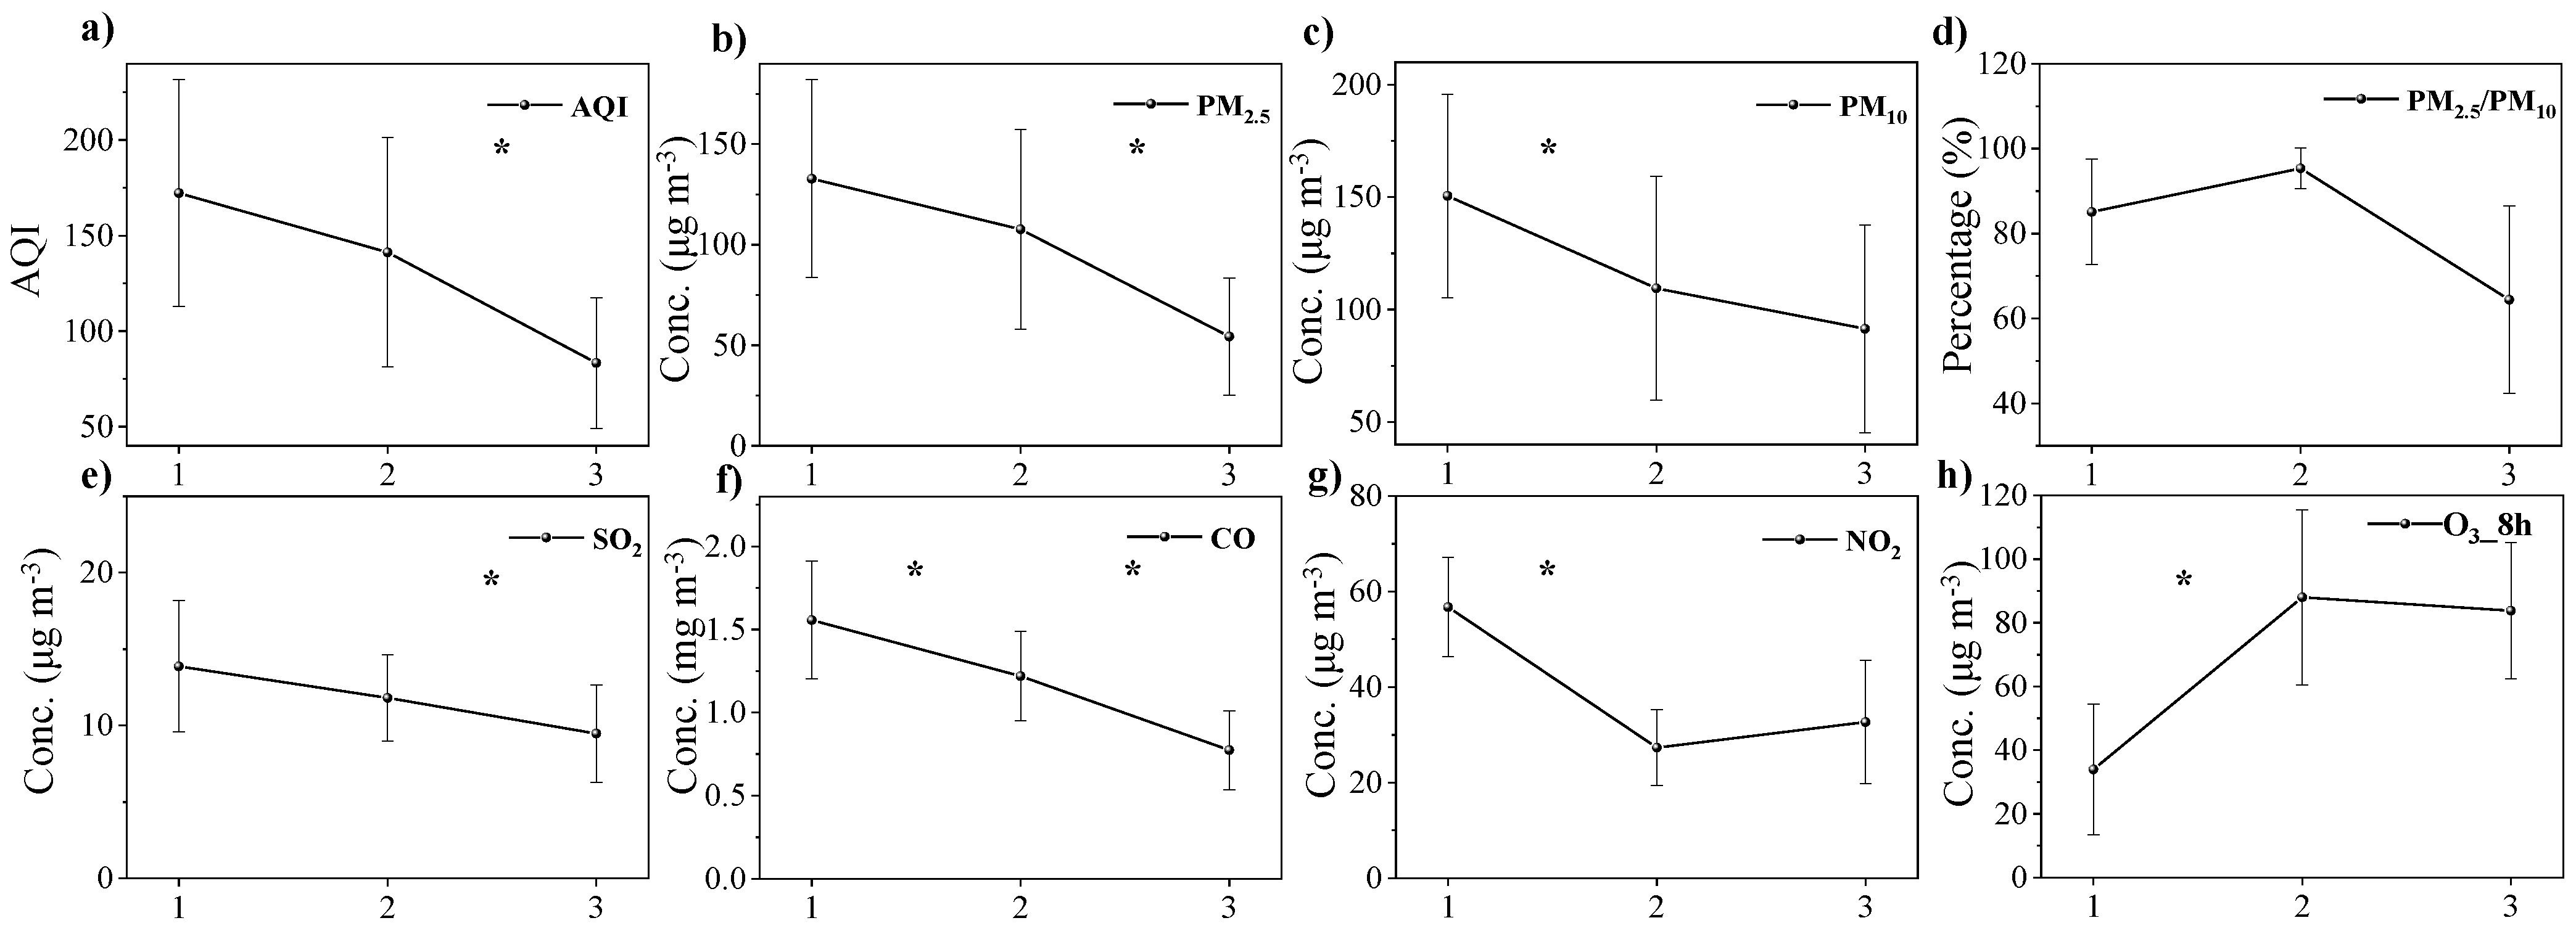
3.1. AQI and Online Six National Controlled Air Pollutants

Comparisons of AQI and six national controlled air pollutants (PM2.5, PM10, SO2, CO, NO2, and O3_8h) in the pre-lockdown, during lockdown, and post-lockdown periods of COVID-19 in Xi’an in 2020 are shown in Figure 3. The AQI decreased in sequence before, during, and after the COVID-19 lockdown with statistical difference between periods of post-lockdown and during lockdown, and air quality gradually improved from moderately polluted (AQI: 151–200) to mildly polluted (AQI: 101–150) and further, to good air quality (AQI: 51–100; Figure 3a). In addition to the AQI, PM2.5, PM10, SO2, and CO exhibited gradually decreasing trends, but surprisingly, they did not present the lowest values during the COVID-19 lockdown (Figure 3b,c,e,f). This may be due to the adverse meteorological factors and the “delayed effect” of pollutant reduction. Different from the trends of the abovementioned air pollutants, NO2 dropped from 56.7 μg m−3 in pre-lockdown to the lowest value in during lockdown (27.3 μg m−3), and then increased to 32.7 μg m−3 in post-lockdown (Figure 3g) due to the most direct relationship with motor vehicle primary emissions. Among all the national controlled air pollutants, NO2 decreased the most during the COVID-19 lockdown to 52% in a statistically significant way. Travel restrictions during the lockdown caused the most significant reduction in NO2, consistent with previous studies [39,40,61,62,63].
PM2.5 was the only one pollutant in this study that exceeded the national ambient air quality standard in China [64], especially in the pre- and during lockdown periods. Compared with PM2.5 in pre-lockdown, the reduction of PM2.5 in the post-lockdown period was the most significant (59%) among all air pollutants in this study, and statistical difference was observed. Moreover, the proportion of PM2.5 in PM10 in pre-, during, and post-lockdown periods of COVID-19 in Xi’an was 85%, 95%, and 64%, respectively (Figure 3d). The proportion of PM2.5 in PM10 was the highest in the during lockdown period, increasing by approximately 10% and 30% respectively from the pre- and post-lockdown periods. We compared the meteorological factors among the pre-, during, and post-lockdown periods of COVID-19 to demonstrate the drastic changes. The PWD in the three periods was northeast. The weather conditions before and during the lockdown were almost the same, whereas the wind speed increased and the RH decreased significantly after the lockdown. Therefore, the significant reduction in PM2.5/PM10 during post-lockdown was owing to the increase in coarse dust mainly from the earth’s crust resulting from the higher wind speed and temperature. Moreover, the 10% higher proportion of PM2.5 in PM10 during lockdown than in pre-lockdown was mainly due to the changes in particle emissions, especially enhanced emission from anthropogenic sources and the secondary formation of PM2.5 (discussion below). The primary emission should be reduced during the lockdown (Figure 1; restriction on travel and temporary suspension of industries, factories, and construction sites); thus, the elevated PM2.5 proportion may attribute to an enhanced secondary reaction during the lockdown, that is, increased oxidation in the atmosphere. This is more evident in an explanation of O3 variations below.
Contrary to the trends of other air pollutants mentioned above, the concentration of O3_8h was the highest in the lockdown period (88.0 μg m−3), which was 2.6 times that in the pre-lockdown period, and the difference was significant. The increase in the O3 concentration during the lockdown can be explained as follows. As mentioned earlier, NOx emissions are closely related to motor vehicle emissions enhanced by transportation activities and human travel. However, there are various sources of volatile organic compounds (VOCs), and their emissions varied during this event. For example, one of the main emission sources of VOCs is the evaporation of industrial solvents; the use of industrial solvents did not decrease as much as transportation did in the lockdown period. Therefore, the reduction in NOx was more significant than that in VOCs. This leads to a weakening of the titration of NOx, which reduces the depletion of ozone [65]; therefore, the concentration of O3 in the atmosphere increased during the lockdown period. Simultaneously, the O3 production and oxidation capacity (Ox) during the day increased in this study, which promoted the concentration of OH radicals during the day and NO3 radicals at night. As a result, the increased oxidation capacity of the atmosphere promoted the formation of secondary air pollutants during the COVID-19 lockdown in Xi’an. The atmospheric Ox was roughly represented by the sum of the concentrations of NO2 and O3 [66], with a higher Ox in the lockdown period (115.3 μg m−3) than before the lockdown (90.7 μg m−3), and Ox was maintained at relatively high levels after the lockdown (116.4 μg m−3). The lower O3 concentration after the lockdown was due to the more favorable weather conditions and the weakening of secondary reactions, which can also explain the variations in PM2.5 in this study.

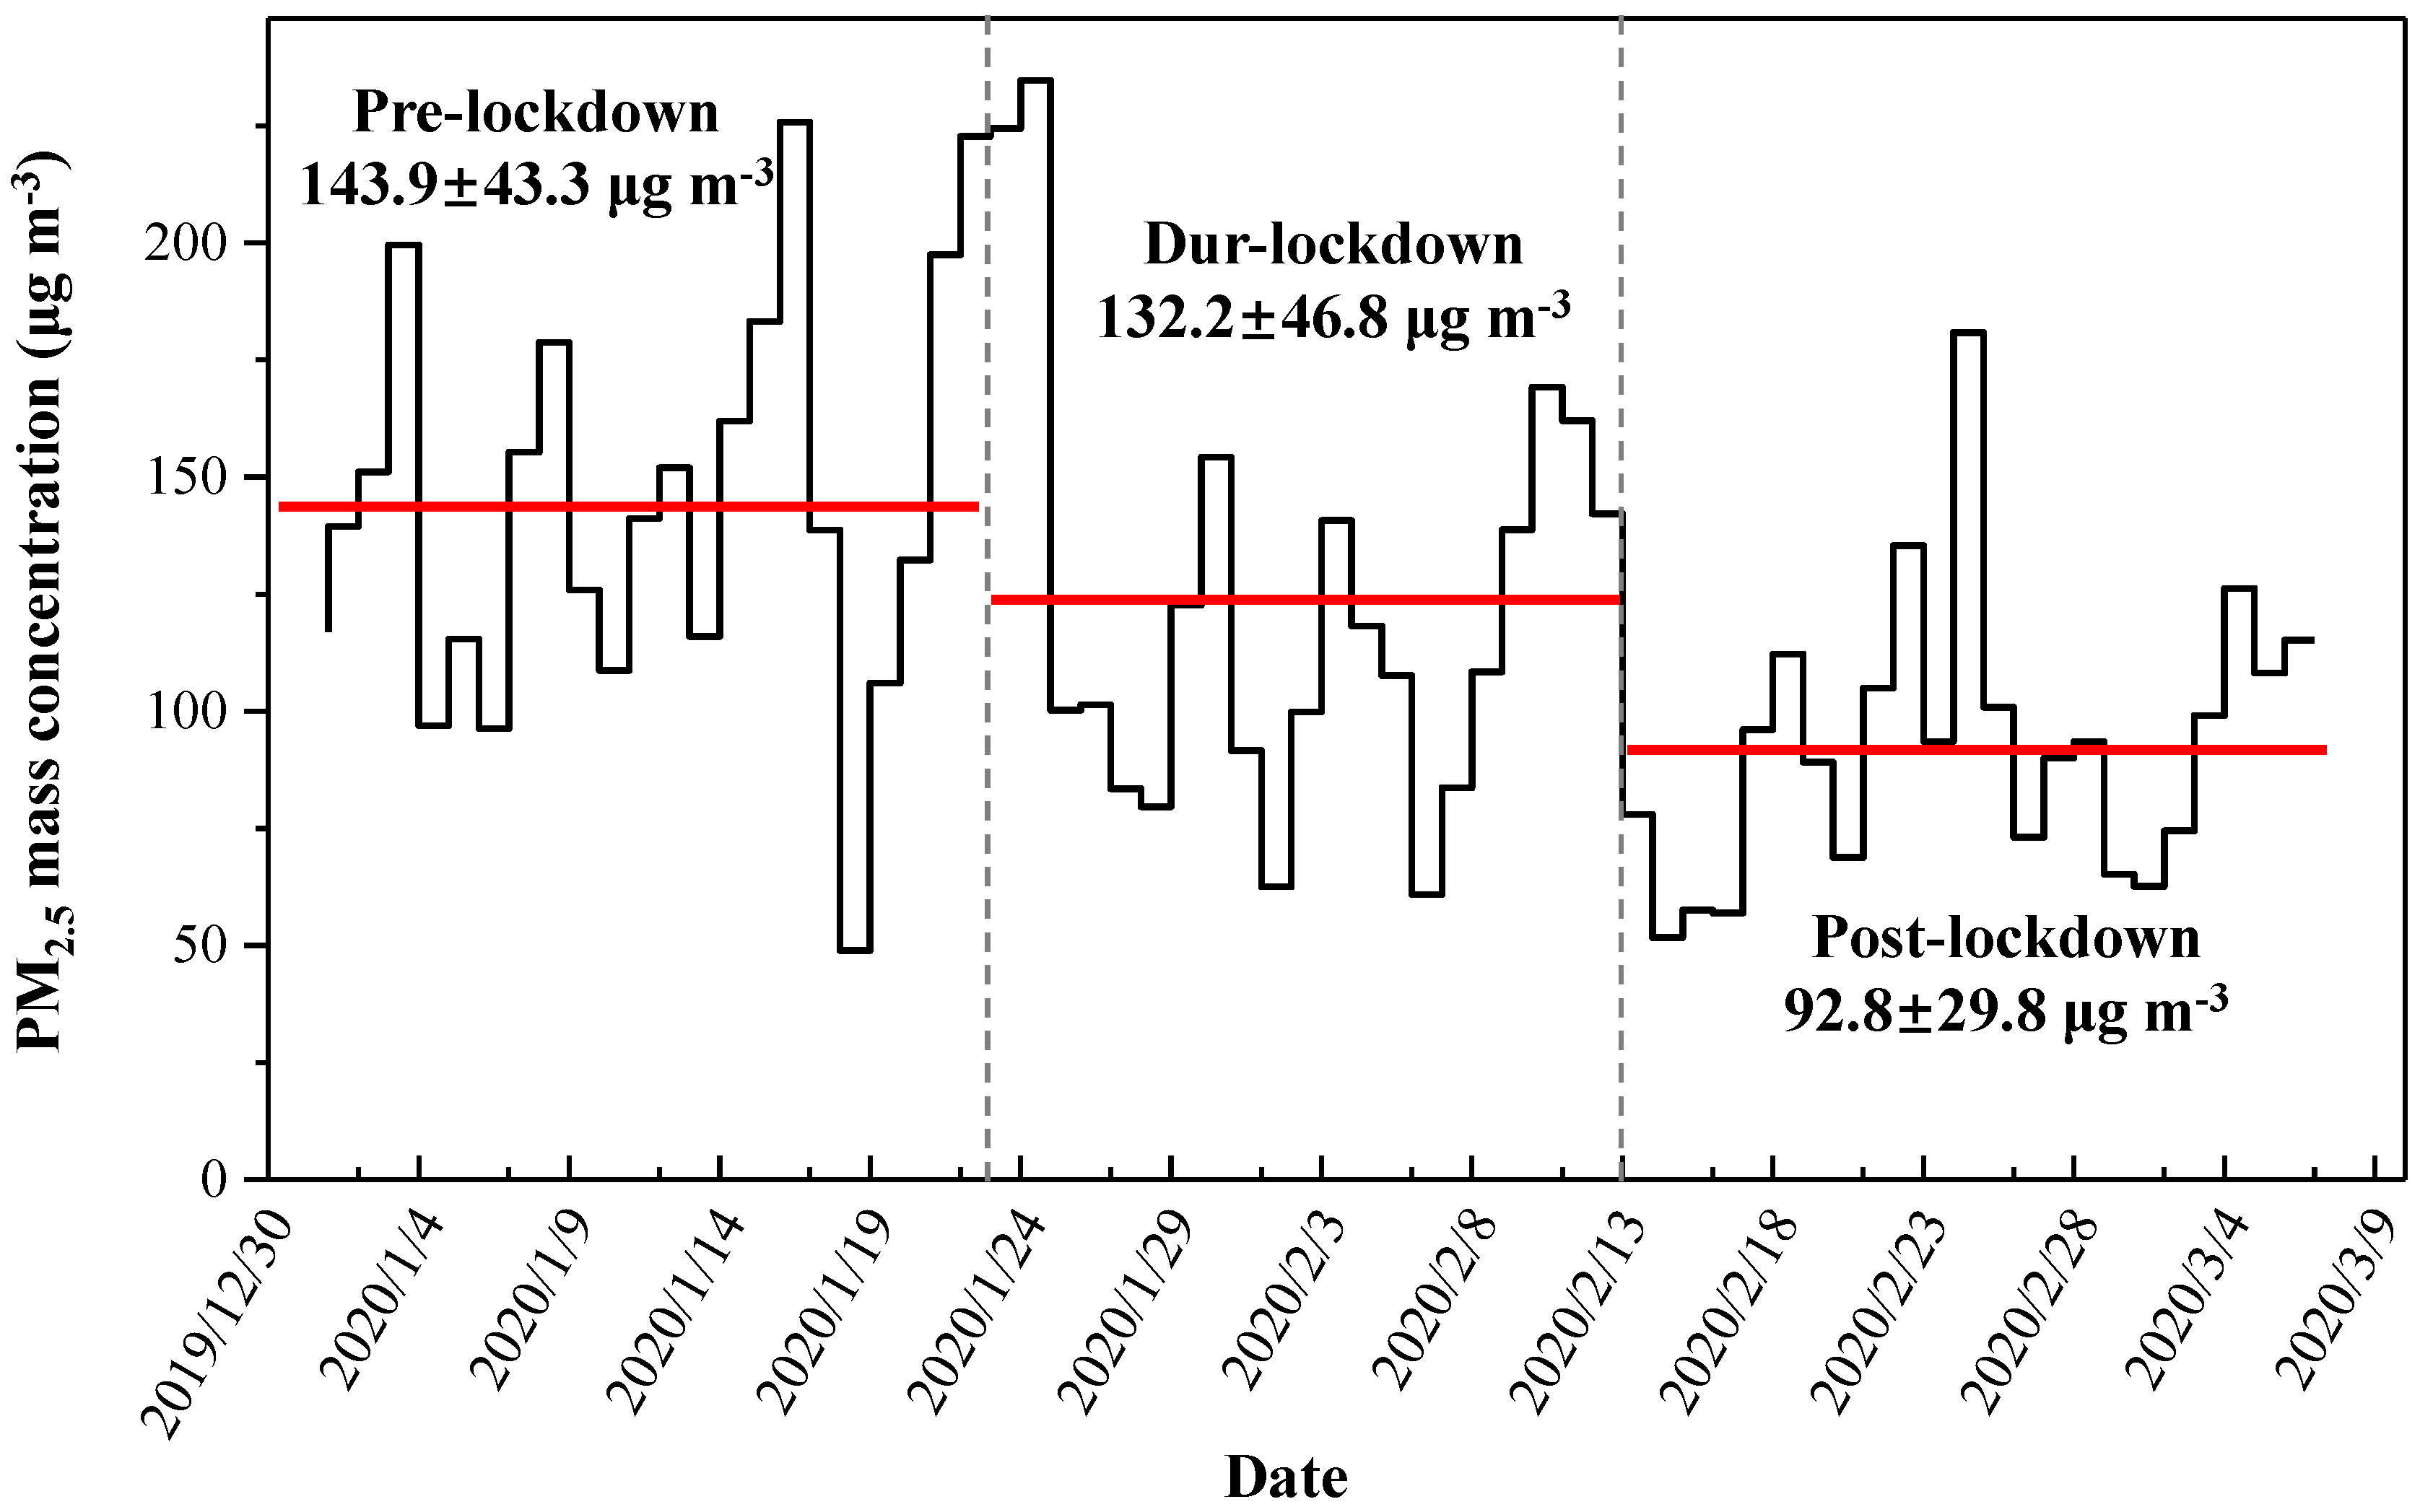
3.2. PM2.5 from Offline Filter Samples

The PM2.5 mass concentrations from the offline filter samples in pre-lockdown, during lockdown, and post-lockdown periods of COVID-19 in Xi’an in 2020 are shown in Figure 4. The PM2.5 mass concentration in offline filters obtained using the gravimetric measurement method (x) was first compared with the online PM2.5 data obtained through automatic monitoring by using the β ray method (y) in Section 3.1. A close correlation was found between them, with the regression equation y = 1.06x−28.6, and a correlation coefficient (R2) of 0.773. The pattern of change in PM2.5 in periods of pre-lockdown, during lockdown, and post-lockdown of COVID-19 was consistent with the variation trend mentioned in Section 3.1, showing a downward trend gradually. As shown in Figure 3, the online concentrations of PM2.5 in the three periods were 132.8, 107.7, and 54.4, respectively, which represent lower values than those in offline PM2.5 filter samples. In comparison, PM2.5 in pre-lockdown was 1.2 and 1.6 times those during lockdown and post-lockdown, respectively, according to the mass weighting (Figure 4), which may be due to the relatively high wind speed (4.5 ± 3.0 m s−1) and low relative humidity (50 ± 5%); after lockdown provided favorable meteorological conditions for the diffusion of air pollutants compared with before and during the lockdown. Similar continuous decrease in PM2.5 concentration in the post-lockdown period were observed in Wuhan, China [67] and Mumbai, India [68]. It is inferred that the lockdown policies have a relatively long-term and lasting effect on reducing the concentration of air pollutants.

3.3. OC and EC Characteristics in PM2.5 Filter Samples

Table 2 summarizes the average concentrations (mean ± standard deviation) and percentages of TC, OC, and EC in PM2.5. TC accounted for 13.3% ± 2.7%, 14.4% ± 4.2%, and 11.5% ± 3.8% of PM2.5 mass in pre-lockdown, during lockdown, and post-lockdown periods of COVID-19, respectively. The proportion of EC in PM2.5 remained almost unchanged (2.2–2.7%) during the different research intervals, whereas the proportion of OC in PM2.5 reached the maximum (11.9%) during the lockdown, and was 1.1 and 1.3 times of those before and after the COVID-19 lockdown in 2020. As mentioned earlier, the weather conditions in Xi’an were basically stable in pre- and during lockdown periods. The reduction in the direct primary emission of PM2.5 sources in the during lockdown period did not lead to a decrease in the concentration and proportion of OC. The OC generated by the secondary conversion during lockdown was the main reason for the increase in OC in this case, which can be also proven by the ratios of OC and EC. The OC/EC ratio can be used to determine the characteristics of carbonaceous aerosols’ emission and transformation; an OC/EC ratio exceeding 2.0 suggests the presence of secondary organic carbon (SOC) [69,70]. All OC/EC values were higher than 2.0 in this study, with the maximum average value of 4.8 ± 0.8 during the lockdown period (Table 2), thus indicating elevated SOC (i.e., secondary reaction) during the lockdown.

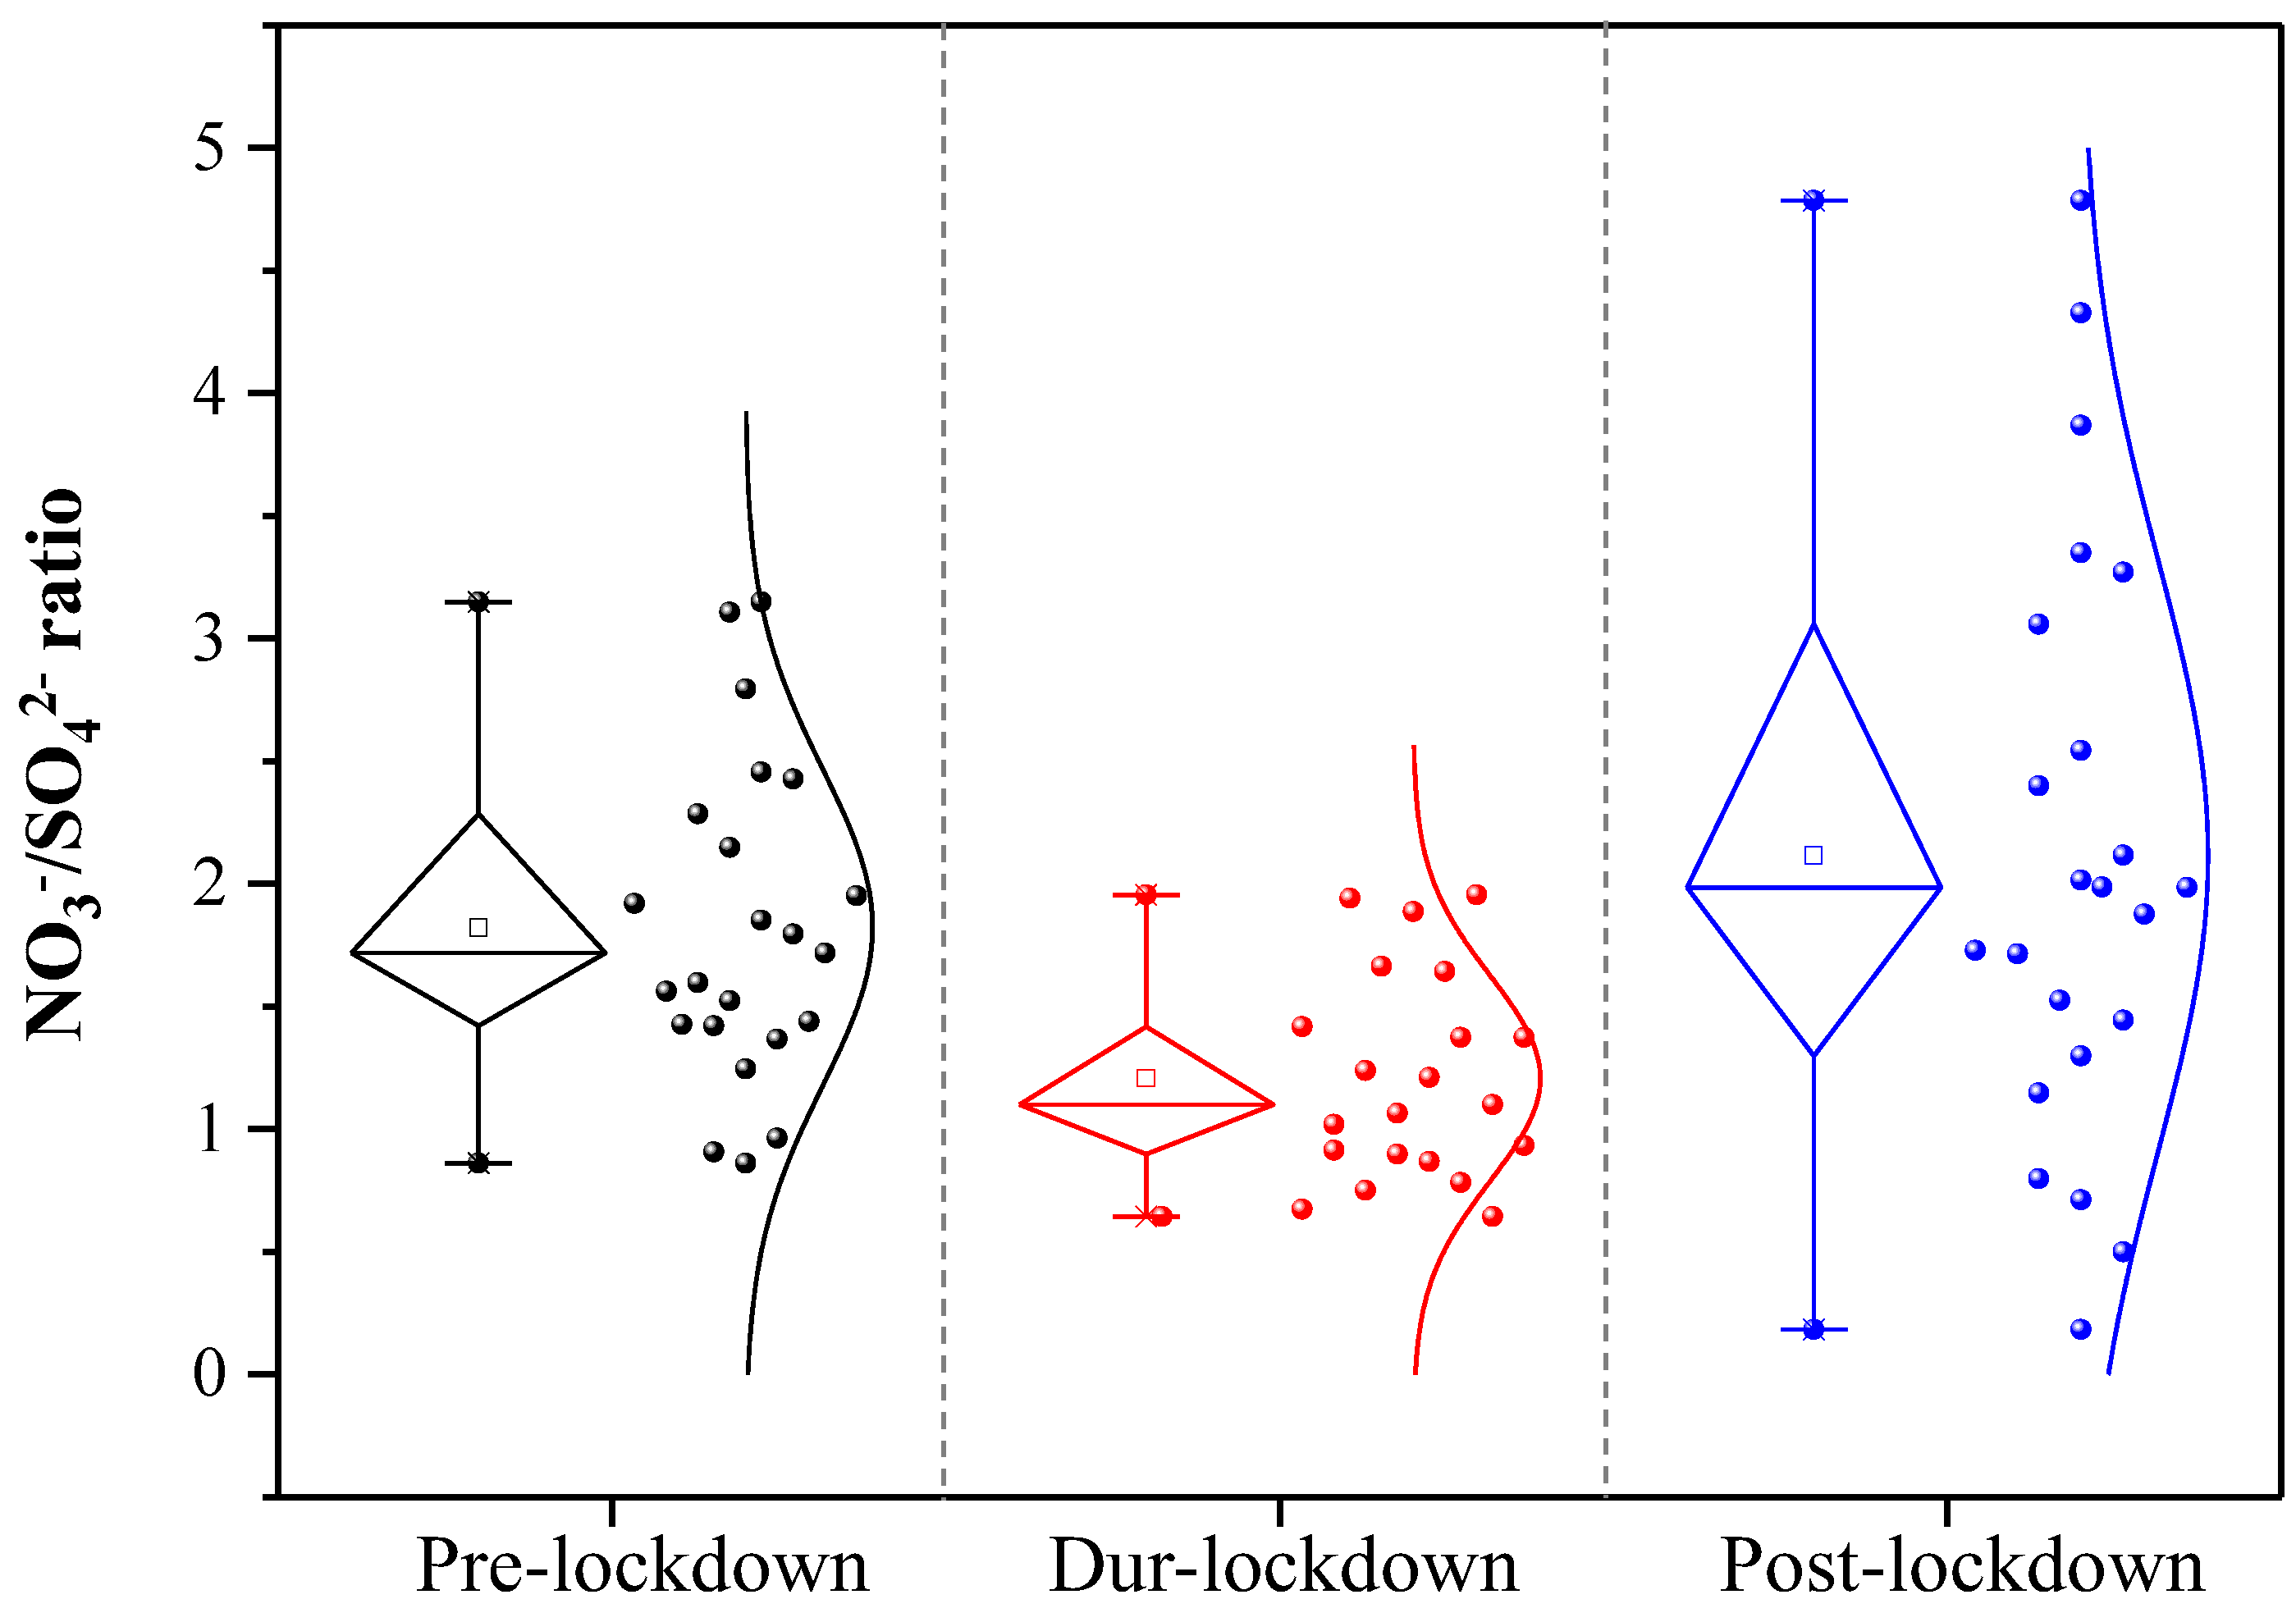
3.4. WSIs in PM2.5 Filter Samples

The average total concentrations of nine WSIs were 46.8 ± 19.4, 38.9 ± 19.0, and 21.0 ± 14.5 μg m−3, accounting for 32.1% ± 8.3%, 31.3% ± 9.5%, and 20.6% ± 8.8% of PM2.5 mass in the periods of pre-, during, and post-lockdown of COVID-19, respectively. SO42−, NO3, and NH4+ were the most abundant ions, accounting for 90–94% of total measured ions and 20–30% of PM2.5 mass concentration. The total ion concentrations were consistent with the change pattern of TC, OC, and EC in the three time intervals. However, the concentration variations of K+ and Ca2+ were not consistent with those of the other WSIs. As a good marker for biomass burning [71,72], K+ exhibited the highest concentration during the lockdown, 1.8 and 2.9 times those in the pre- and post-lockdown periods, which is due to the fact that almost all people stayed at home during the lockdown, and going out was restricted, and then the consumption of household heating and cooking biomass fuels (e.g., corn stalks, wheat stalks, and branches) in rural areas around Xi’an increased [73,74,75]. Ca2+, an indicator of fugitive dust from the earth’s crust and construction, displayed the lowest value during the lockdown [76], 0.8 and 0.4 times those in the pre- and post-lockdown periods, proving that the reduction of going out and construction activities during the pandemic lockdown had a greater impact on the concentration of Ca2+.
From the perspective of the percentage of individual to the total ion concentration, only the percentages of NO3 and SO42− exhibited greater changes in the periods of pre-, during, and post-lockdown. The proportion of NO3 in total WSIs was the lowest during the lockdown, with the value of only 36.7%, which was 15.8% and 24.3% lower than that before and after the lockdown. The proportion of SO42− was the highest during the lockdown, reaching 31.6%, which was 17.5% and 47.6% higher than that before and after the lockdown. NO3/SO42− ratio has been usually used as a relative measure of the importance of motor mobile sources versus stationary emission sources (such as emissions from industrial combustion and residential fuel combustion) in many studies [10,77]. Figure 5 presents the NO3/SO42− ratios in the pre-lockdown, during lockdown, and post-lockdown periods in 2020. The NO3/SO42− ratios during the lockdown (average: 1.2 ± 0.4, range: 0.6–2.0) were considerably lower and less distributed than those in the periods of pre-lockdown (average: 1.8 ± 0.6, range: 0.9–3.1) and post-lockdown (average: 2.1 ± 1.2, range: 0.2–4.8). Elevated NO3/SO42− ratios in the periods of pre- and post-lockdown implied stronger influences from motor vehicles, consistent with the drastic drop in traffic volume and sharp rise of NO2 during the lockdown. The decreased ratio of NO3/SO42− during the lockdown indicated that residential combustion sources (for heating in the cold winter) increased significantly in the context of reduced traffic (mobile source) and industrial combustion sources (coal-fired industrial plants).

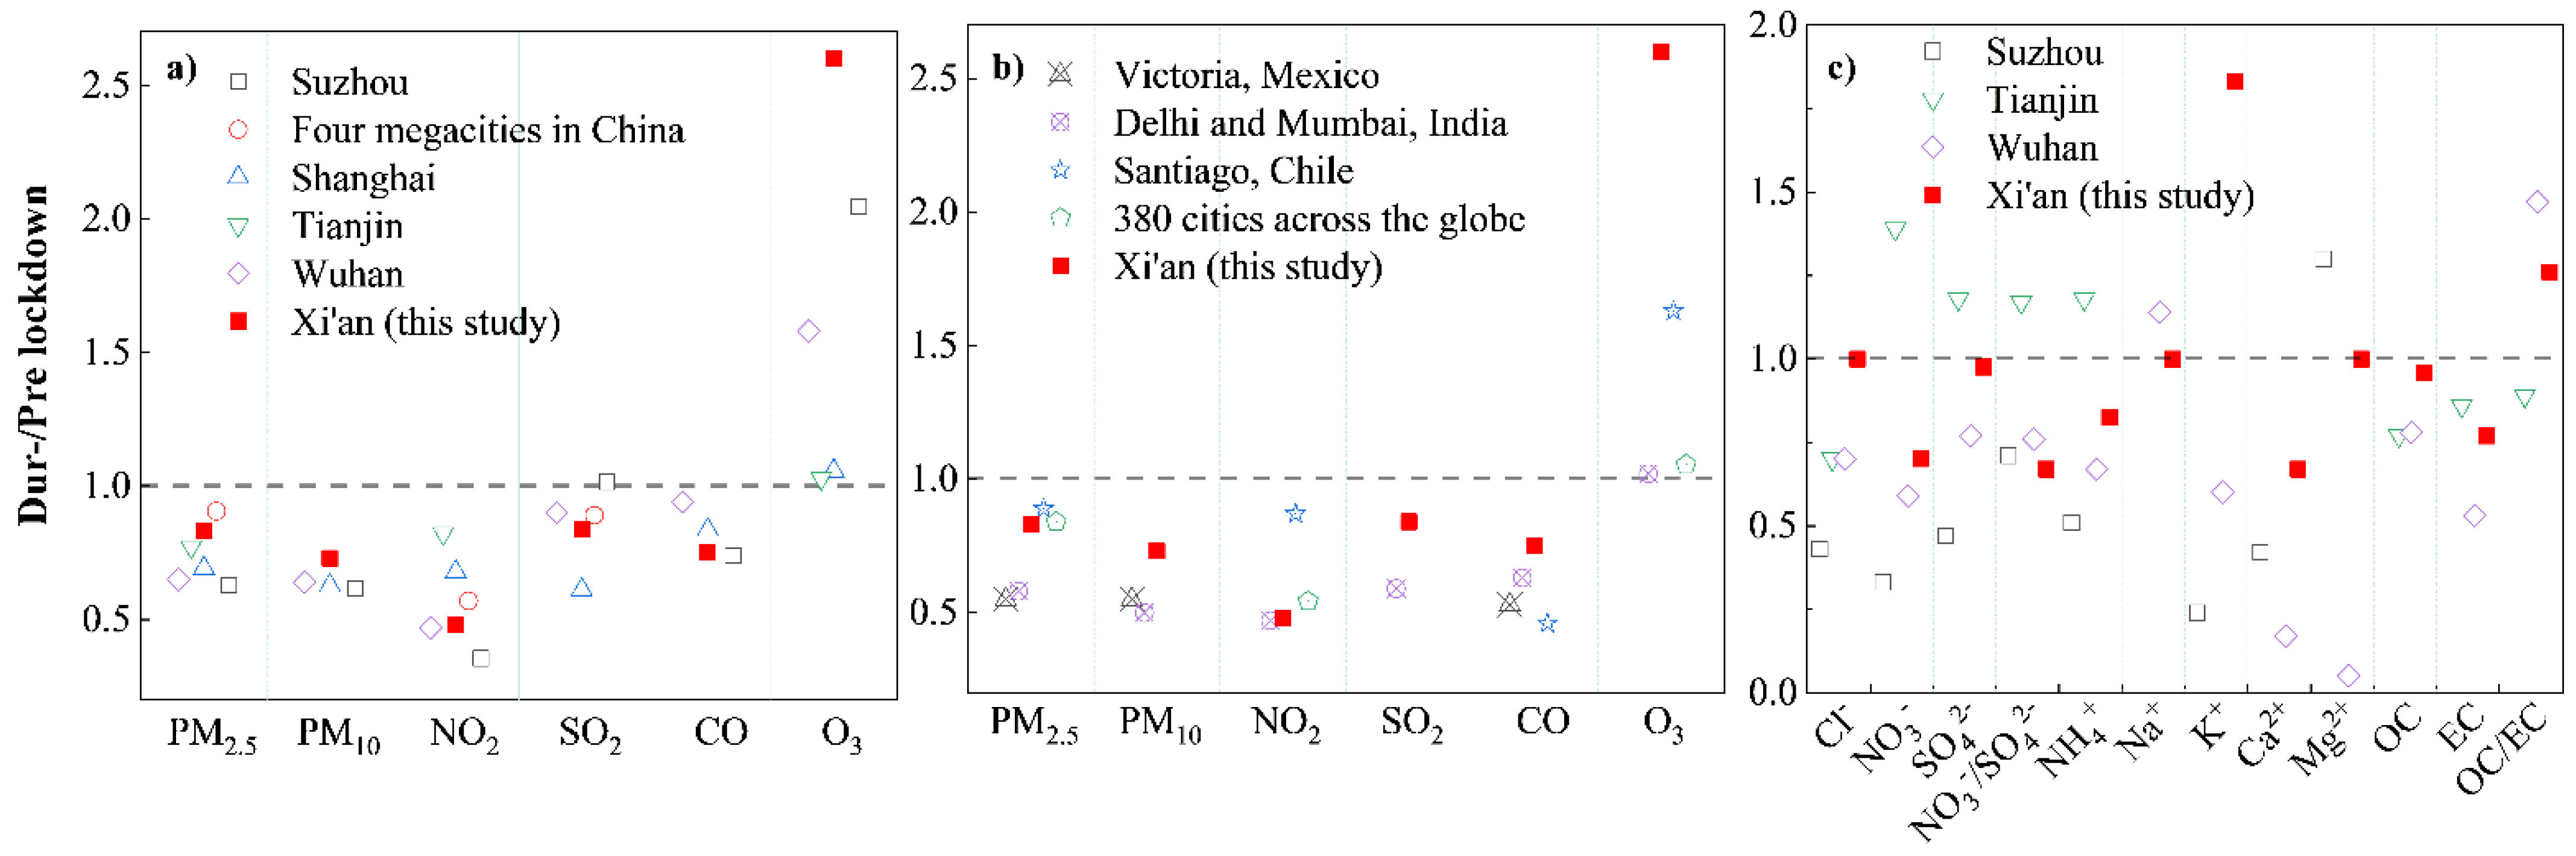
3.5. Comparison of Air Quality during the COVID-19 Lockdown among Studies

Table 3 summarizes previous studies that examined the impact of COVID-19 lockdown measures on local air quality in various regions of the world. The results suggest the positive effects of lockdown policies on air pollutant levels around the world. Compared with the same period in the previous year or the period before the lockdown, almost all pollutants studied exhibited significant declines during the lockdown, except for O3.
To better understand the variation characteristics of air quality in this study, the during lockdown/pre-lockdown air pollutant levels and PM2.5 chemical composition were compared between Xi’an and other cities/regions, as shown in Figure 6. During the pandemic period, studies have revealed that the domestic and international lockdown measures implemented had a positive impact on the levels of PM2.5, PM10, SO2, NO2, and CO, with the ratios of during lockdown/pre-lockdown less than 1.0. The concentrations of the abovementioned five air pollutants had been reduced to varying degrees (except for SO2 in Suzhou, China), whereas O3 concentration showed an upward trend in all cities (Figure 6a,b), consistent with the results in the current study.
The reduction rate of PM2.5 concentration ranged from 9.4% (four megacities in China) to 45% (Victoria, Mexico), which may be related to the specific local lockdown policies and meteorological factors. The maximum drop rates in total average concentrations of PM10, NO2, and CO were observed in Delhi and Mumbai (50%), Suzhou (64.5%), and Santiago (54%), indicating the notable environmental effect of lockdown measures. The minimum declines in PM10, NO2, and CO occurred in Xi’an (27%) in this study, Santiago (13%), and Wuhan (6%), respectively. In comparison, the SO2 concentration exhibited a limited decrease (Figure 6a,b). Emissions from stationary sources, such as coal-fired power plants, were not considerably reduced compared with emissions from mobile sources such as traffic transportation [41,83]. For example, in Xi’an, sufficient electricity and heat were still provided as usual by the thermal power plants to ensure normal supply during the lockdown [91]. The increase in O3 demonstrated a huge discrepancy in each city; the O3 concentration showed a slight increase in Shanghai (5.7%), Tianjin (3.0%), Delhi and Mumbai (2.0%), and 380 cities across the globe (5.4%), but increased more than 50% in Wuhan (58%), Santiago (63%), Suzhou (104.7%), and Xi’an (160%). Specifically, the maximum O3 increase was noticed in Xi’an, which is attributed not only to the emission sources but also directly to the relative high air temperature and low wind speed during the COVID-19 lockdown in 2020 (Table 1). The ozone pollution in Xi’an must be further explored in a future study.
Figure 6c illustrates an irregular discrepancy of the changes in the concentrations of chemical components in PM2.5 among Chinese cities. The most obvious variation of WSIs in Xi’an was the significant increase in K+. The increased biomass combustion in the lockdown period in suburban regions and rural areas of Xi’an may be attributable to this phenomenon. Unlike in other cities, the proportions of Cl, Na+, and Mg2+ in PM2.5 in the lockdown period in Xi’an remained almost unchanged from the pre-lockdown period. However, NO3, SO42−, NO3/SO42−, and NH4+ in Tianjin, China, exhibited the opposite trend of an increase compared with other cities. This may be attributed to the weather conditions, local emissions, and lockdown policies. The highest declines in NO3/SO42− observed in Xi’an may be attributed to the following reasons: (1) as a well-known tourist attraction in China, suspension of tourism and strict traffic control in Xi’an during the pandemic (Figure 1) resulted in a substantial reduction in the flow rate of travelers in Xi’an; (2) except for government designation and pandemic prevention and control needs, the operation of interprovincial and municipal long-distance passenger transport lines and tour chartered buses into and out of Xi’an were suspended, and (3) cruising taxis and online car-hailing operations across provinces and cities were suspended [50]. These measures implemented in Xi’an had effectively reduced emissions from motor vehicle sources; relatively, the restrictions on welfare-related civilian industries, such as thermal power plants, were limited, which explains the maximum NO3/SO42− reduction in Xi’an in this study. Regarding the carbon components, both OC and EC emissions were reduced in all the four cities, with the largest OC reduction occurring in Tianjin, and the highest EC reduction in Wuhan. The elevated OC/EC during the lockdown period was observed in both Wuhan (47%) and Xi’an (26%), indicating a distinct increase in the secondary formation of organic compounds to PM2.5.

4. Conclusions

In this study, the online data of AQI, six national controlled air pollutants, and daily PM2.5 and its bounded chemicals on the filter samples from 1 January to 7 March 2020, were used to investigate the changes in air quality in response to the control measures for the COVID-19 lockdown (pre-lockdown, during lockdown, and post-lockdown) in Xi’an, China. In this study, we found that restricting nonessential human activities could reduce several gaseous pollutants, especially NO2, and the specific components (e.g., Ca2+) in PM2.5 related to the particular anthropogenic sources. The lockdown policies in this study also led to an increase in primary emissions from household heating sources and an increase in secondary formation reactions in the atmosphere. Moreover, air pollution was closely influenced by meteorological factors and atmospheric oxidation. In this case, although the management and control of traffic and some non-livelihood industries improved air quality to a certain extent, the reduction of air pollutants was not significant. Therefore, readjusting the industrial and energy structure is necessary for the fundamental improvement of air quality in Xi’an.

Author Contributions

Conceptualization, H.X. and R.F.; methodology, Z.W. and Z.S.; validation, R.F. and Y.G.; formal analysis, H.X. and R.F.; investigation, Z.L., H.Z. and T.Z.; resources, H.X. and Q.W. (Qin Wang); data curation, R.F. and Q.W. (Qiyuan Wang); writing—original draft preparation, H.X. and R.F.; writing—review and editing, H.X., Q.Z., S.L. and Z.S.; project administration, H.X.; funding acquisition, H.X. All authors have read and agreed to the published version of the manuscript.

Funding

This research was supported by the Key Research and Development Program of Shaanxi Province (2018-ZDXM3-01), the National Key R&D Program of China (2017YFC0212205) and the Postdoctoral Research Project Funding of Shaanxi Province (2018BSHTDZZ05). The National Natural Science Foundation of China (41877376) is also thanked.

Institutional Review Board Statement

Not applicable.

Informed Consent Statement

Not applicable.

Data Availability Statement

Requests for data sets and materials should be addressed to Hongmei Xu ([email protected]).

Acknowledgments

This work was supported by the Key Research and Development Program of Shaanxi Province (2018-ZDXM3-01) grant to H.X. and Q.W., the National Key R&D Program of China (2017YFC0212205) grant to Z.S., the Postdoctoral Research Project Funding of Shaanxi Province (2018BSHTDZZ05) and the National Natural Science Foundation of China (41877376) grant to H.X.

Conflicts of Interest

The authors declare no conflict of interest.

References

  1. Liu, H.; Wu, B.; Liu, S.; Shao, P.; Liu, X.; Zhu, C.; Wang, Y.; Wu, Y.; Xue, Y.; Gao, J.; et al. A regional high-resolution emission inventory of primary air pollutants in 2012 for Beijing and the surrounding five provinces of North China. Atmos. Environ. 2018, 181, 20–33. [Google Scholar] [CrossRef]
  2. Zhang, H.; Yin, S.; Bai, L.; Lu, X.; Wang, C.; Gu, X.; Li, Y. Establishment and evaluation of anthropogenic black and organic carbon emissions over Central Plain, China. Atmos. Environ. 2020, 226. [Google Scholar] [CrossRef]
  3. Jiang, P.; Chen, X.; Li, Q.; Mo, H.; Li, L. High-resolution emission inventory of gaseous and particulate pollutants in Shandong Province, eastern China. J. Clean. Prod. 2020, 259. [Google Scholar] [CrossRef]
  4. Zhong, Z.; Zheng, J.; Zhu, M.; Huang, Z.; Zhang, Z.; Jia, G.; Wang, X.; Bian, Y.; Wang, Y.; Li, N. Recent developments of anthropogenic air pollutant emission inventories in Guangdong province, China. Sci. Total. Environ. 2018, 627, 1080–1092. [Google Scholar] [CrossRef] [PubMed]
  5. Huneeus, N.; Denier van der Gon, H.; Castesana, P.; Menares, C.; Granier, C.; Granier, L.; Alonso, M.; de Fatima Andrade, M.; Dawidowski, L.; Gallardo, L.; et al. Evaluation of anthropogenic air pollutant emission inventories for South America at national and city scale. Atmos. Environ. 2020, 235. [Google Scholar] [CrossRef]
  6. Le, T.; Wang, Y.; Liu, L.; Yang, J.; Yung, Y.L.; Li, G.; Seinfeld, J.H. Unexpected air pollution with marked emission reductions during the COVID-19 outbreak in China. Science 2020, 369, 702–706. [Google Scholar] [CrossRef] [PubMed]
  7. Ghaffarpasand, O.; Nadi, S.; Shalamzari, Z.D. Short-term effects of anthropogenic/natural activities on the Tehran criteria air pollutants: Source apportionment and spatiotemporal variation. Build. Environ. 2020, 186. [Google Scholar] [CrossRef]
  8. Dotse, S.-Q.; Dagar, L.; Petra, M.I.; De Silva, L.C. Evaluation of national emissions inventories of anthropogenic air pollutants for Brunei Darussalam. Atmos. Environ. 2016, 133, 81–92. [Google Scholar] [CrossRef]
  9. Zhang, Y.; Zhu, X.; Slanina, S.; Shao, M.; Zeng, L.; Hu, M.; Bergin, M.; Salmon, L. Aerosol pollution in some Chinese cities (IUPAC Technical Report). Pure Appl. Chem. 2004, 76, 1227–1239. [Google Scholar] [CrossRef]
  10. Xu, H.; Cao, J.; Chow, J.C.; Huang, R.J.; Shen, Z.; Chen, L.W.; Ho, K.F.; Watson, J.G. Inter-annual variability of wintertime PM2.5 chemical composition in Xi’an, China: Evidences of changing source emissions. Sci. Total Environ. 2016, 545–546, 546–555. [Google Scholar] [CrossRef]
  11. Feng, T.; Bei, N.; Zhao, S.; Wu, J.; Liu, S.; Li, X.; Liu, L.; Wang, R.; Zhang, X.; Tie, X.; et al. Nitrate debuts as a dominant contributor to particulate pollution in Beijing: Roles of enhanced atmospheric oxidizing capacity and decreased sulfur dioxide emission. Atmos. Environ. 2021, 244. [Google Scholar] [CrossRef]
  12. Guo, Z.; Guo, Q.; Chen, S.; Zhu, B.; Zhang, Y.; Yu, J.; Guo, Z. Study on pollution behavior and sulfate formation during the typical haze event in Nanjing with water soluble inorganic ions and sulfur isotopes. Atmos. Res. 2019, 217, 198–207. [Google Scholar] [CrossRef]
  13. Singh, A.K.; Srivastava, A. Seasonal Trends of Organic and Elemental Carbon in PM1 Measured over an Industrial Area of Delhi, India. Aerosol Sci. Eng. 2021, 5, 112–125. [Google Scholar] [CrossRef]
  14. Rajput, P. OM/OC Ratio of Polar and Non-Polar Organic Matter during Wintertime from Indo-Gangetic Plain: Implications to Regional-Scale Radiative Forcing. Aerosol Sci. Eng. 2018, 2, 153–164. [Google Scholar] [CrossRef]
  15. Qiao, Q.; Huang, B.; Piper, J.D.A.; Biggin, A.J.; Zhang, C. The characteristics of environmental particulate matter in the urban area of Beijing, China, during the 2008 Olympic Games. Atmos. Pollut. Res. 2017, 8, 141–148. [Google Scholar] [CrossRef] [Green Version]
  16. Wang, S.; Zhao, M.; Xing, J.; Wu, Y.; Zhou, Y.; Lei, Y.; He, K.; Fu, L.; Hao, J. Quantifying the air pollutants emission reduction during the 2008 Olympic Games inBeijing. Environ. Sci. Technol. 2010, 44, 2490–2496. [Google Scholar] [CrossRef]
  17. Cheng, Y.F.; Heintzenberg, J.; Wehner, B.; Wu, Z.J.; Hu, M.; Mao, J.T. Traffic restrictions in Beijing during the Sino-African Summit 2006: Aerosol size distribution and visibility compared to long-term in situ observations. Atmos. Chem. Phys. Discuss. 2008, 8, 12971–12998. [Google Scholar] [CrossRef] [Green Version]
  18. Huang, K.; Zhuang, G.; Lin, Y.; Wang, Q.; Fu, J.S.; Fu, Q.; Liu, T.; Deng, C. How to improve the air quality over mega-cities in China?—Pollution characterization and source analysis in Shanghai before, during, and after the 2010 World Expo. Atmos. Chem. Phys. Discuss. 2013, 13, 3379–3418. [Google Scholar] [CrossRef]
  19. Huang, K.; Zhang, X.; Lin, Y. The “APEC Blue” phenomenon: Regional emission control effects observed from space. Atmos. Res. 2015, 164–165, 65–75. [Google Scholar] [CrossRef]
  20. Wang, P.; Chen, K.; Zhu, S.; Wang, P.; Zhang, H. Severe air pollution events not avoided by reduced anthropogenic activities during COVID-19 outbreak. Resour. Conserv. Recycl. 2020, 158, 104814. [Google Scholar] [CrossRef] [PubMed]
  21. World Health Organization. Available online: https://www.who.int/emergencies/diseases/novel-coronavirus-2019/interactive-timeline (accessed on 29 April 2021).
  22. World Health Organization. Available online: https://covid19.who.int/ (accessed on 11 April 2021).
  23. Sun, Z.; Zhang, H.; Yang, Y.; Wan, H.; Wang, Y. Impacts of geographic factors and population density on the COVID-19 spreading under the lockdown policies of China. Sci. Total. Environ. 2020, 746, 141347. [Google Scholar] [CrossRef] [PubMed]
  24. Xi’an Municipal People’s Government. Available online: http://www.xa.gov.cn/sq/csgk/rkzk/5d4907af65cbd87465a5f024.html (accessed on 29 April 2021).
  25. COVID-19 Global Confirmation/Cure/Death Increase and Growth Trend Graph. Available online: https://www.jisilu.cn/question/347815 (accessed on 29 April 2021).
  26. Xi’an National Aviation Industry Base. Available online: https://baijiahao.baidu.com/s?id=1661600744376930281&wfr=spider&for=pc (accessed on 29 April 2021).
  27. Xi’an Municipal Bureau of Statistics. Available online: http://tjj.xa.gov.cn/tjsj/tjsj/jdsj/2020n/5e8fd8ccfd85080ad1363e5d.html (accessed on 29 April 2021).
  28. Bhat, S.A.; Bashir, O.; Bilal, M.; Ishaq, A.; Din Dar, M.U.; Kumar, R.; Bhat, R.A.; Sher, F. Impact of COVID-related lockdowns on environmental and climate change scenarios. Environ. Res. 2021, 195, 110839. [Google Scholar] [CrossRef]
  29. Fernandes, N. Economic Effects of Coronavirus Outbreak (COVID-19) on the World Economy. SSRN Electron. J. 2020. [Google Scholar] [CrossRef]
  30. Caraka, R.E.; Lee, Y.; Kurniawan, R.; Herliansyah, R.; Kaban, P.A.; Nasution, B.I.; Gio, P.U.; Chen, R.C.; Toharudin, T.; Pardamean, B. Impact of COVID-19 large scale restriction on environment and economy in Indonesia. Glob. J. Environ. Sci. Manag. 2020, 6, 65–82. [Google Scholar]
  31. McKibbin, W.J.; Fernando, R. The Global Macroeconomic Impacts of COVID-19: Seven Scenarios. SSRN Electron. J. 2020. [Google Scholar] [CrossRef] [Green Version]
  32. Díaz, J.; Antonio-López-Bueno, J.; Culqui, D.; Asensio, C.; Sánchez-Martínez, G.; Linares, C. Does exposure to noise pollution influence the incidence and severity of COVID-19? Environ. Res. 2021, 195. [Google Scholar] [CrossRef] [PubMed]
  33. Caraka, R.E.; Yusra, Y.; Toharudin, T.; Chen, R.; Basyuni, M. Did Noise Pollution Really Improve during COVID-19 ? Evidence from Taiwan. Sustainability 2021, 13, 5946. [Google Scholar] [CrossRef]
  34. Lee, P.J.; Jeong, J.H. Attitudes towards outdoor and neighbour noise during the COVID-19 lockdown: A case study in London. Sustain. Cities Soc. 2021, 67, 102768. [Google Scholar] [CrossRef]
  35. Marinello, S.; Butturi, M.A.; Gamberini, R. How changes in human activities during the lockdown impacted air quality parameters: A review. Environ. Prog. Sustain. Energy 2021, e13672. [Google Scholar] [CrossRef]
  36. Kotnala, G.; Mandal, T.K.; Sharma, S.K.; Kotnala, R.K. Emergence of Blue Sky Over Delhi Due to Coronavirus Disease (COVID-19) Lockdown Implications. Aerosol Sci. Eng. 2020, 4, 228–238. [Google Scholar] [CrossRef]
  37. Zhang, J.; Li, H.; Lei, M.; Zhang, L. The impact of the COVID-19 outbreak on the air quality in China: Evidence from a quasi-natural experiment. J. Clean. Prod. 2021, 296, 126475. [Google Scholar] [CrossRef]
  38. Wyche, K.P.; Nichols, M.; Parfitt, H.; Beckett, P.; Gregg, D.J.; Smallbone, K.L.; Monks, P.S. Changes in ambient air quality and atmospheric composition and reactivity in the South East of the UK as a result of the COVID-19 lockdown. Sci. Total. Environ. 2021, 755, 142526. [Google Scholar] [CrossRef] [PubMed]
  39. Shen, L.; Wang, H.; Zhu, B.; Zhao, T.; Liu, A.; Lu, W.; Kang, H.; Wang, Y. Impact of urbanization on air quality in the Yangtze River Delta during the COVID-19 lockdown in China. J. Clean. Prod. 2021, 296. [Google Scholar] [CrossRef]
  40. Saxena, A.; Raj, S. Impact of lockdown during COVID-19 pandemic on the air quality of North Indian cities. Urban. Clim. 2021, 35. [Google Scholar] [CrossRef]
  41. Kumari, P.; Toshniwal, D. Impact of lockdown on air quality over major cities across the globe during COVID-19 pandemic. Urban. Clim. 2020, 34, 100719. [Google Scholar] [CrossRef] [PubMed]
  42. Bhuiyan, M.A.; An, J.; Mikhaylov, A.; Moiseev, N.; Danish, M.S.S. Renewable energy deployment and covid-19 measures for sustainable development. Sustainability 2021, 13, 4418. [Google Scholar] [CrossRef]
  43. Djalante, R.; Nurhidayah, L.; Lassa, J.; Minh, H.V.; Mahendradhata, Y.; Ngoc, N.T.; Trias, L.A.P.; Miller, A.M.; Djalante, S.; Sinapoy, M.S. The ASEAN’s responses to COVID-19: A policy sciences analysis. PsyArXiv 2020, 368. [Google Scholar] [CrossRef]
  44. Wang, W.; Liu, Y.; Zhang, L.; Ran, L.; Xiong, S.; Tan, X. Associations between Indoor Environmental Quality and Infectious Diseases Knowledge, Beliefs and Practices of Hotel Workers in Wuhan, China. Int. J. Environ. Res. Public Health 2021, 18, 6367. [Google Scholar] [CrossRef]
  45. Caraka, R.E.; Noh, M.; Chen, R.C.; Lee, Y.; Gio, P.U.; Pardamean, B. Connecting Climate and Communicable Disease to Penta Helix Using Hierarchical Likelihood Structural Equation Modelling. Symmetry 2021, 13, 657. [Google Scholar] [CrossRef]
  46. Sudiana, K.; Sule, E.T.; Soemaryani, I.; Yunizar, Y. The development and validation of the Penta Helix construct. Bus. Theory Pract. 2020, 21, 136–145. [Google Scholar] [CrossRef] [Green Version]
  47. Kabli, A.; Rizzello, A.; Trotta, A. Roadmapping new impact bonds in a post-covid world: Insights from case studies in the education sector. Sustainability 2021, 13, 4121. [Google Scholar] [CrossRef]
  48. Tomé, E.; Gromova, E. Development of emergent knowledge strategies and new dynamic capabilities for business education in a time of crisis. Sustainability 2021, 13, 4518. [Google Scholar] [CrossRef]
  49. 2020 Lunar New Year Xi’an Fireworks Prohibited and Restricted Area. Available online: http://xa.bendibao.com/news/2015210/50338.shtm (accessed on 29 April 2021).
  50. Health Commission of Shaanxi Province. Available online: https://mp.weixin.qq.com/s/7fH1fxka692Gxf9JUbbwyQ (accessed on 8 May 2021).
  51. Xi’an Transportation Bureau. Available online: https://www.sohu.com/a/369486225_70728 (accessed on 29 April 2021).
  52. Shaanxi Satellite TV. Available online: https://www.sohu.com/a/369486225_70728 (accessed on 8 May 2021).
  53. Shaanxi Satellite TV News. Available online: https://www.sohu.com/a/374197753_355338 (accessed on 29 April 2021).
  54. Xi’an National Aviation Industry Base. Available online: https://baijiahao.baidu.com/s?id=1659761830266859533&wfr=spider&for=pc (accessed on 8 May 2021).
  55. Summary of the Latest Information on the City’s Resumption of Work and Production. Available online: https://www.sohu.com/a/378414652_120214191 (accessed on 8 May 2021).
  56. Cao, J.J.; Wu, F.; Chow, J.C.; Lee, S.C.; Li, Y.; Chen, S.W.; An, Z.S.; Fung, K.K.; Watson, J.G.; Zhu, C.S.; et al. Characterization and source apportionment of atmospheric organic and elemental carbon during fall and winter of 2003 in Xi’an, China. Atmos. Chem. Phys. 2005, 5, 3127–3137. [Google Scholar] [CrossRef] [Green Version]
  57. Xu, H.; Guinot, B.; Shen, Z.; Ho, K.; Niu, X.; Xiao, S.; Huang, R.-J.; Cao, J. Characteristics of Organic and Elemental Carbon in PM2.5 and PM0.25 in Indoor and Outdoor Environments of a Middle School: Secondary Formation of Organic Carbon and Sources Identification. Atmosphere 2015, 6, 361–379. [Google Scholar] [CrossRef] [Green Version]
  58. Shen, Z.; Cao, J.; Liu, S.; Zhu, C.; Wang, X.; Zhang, T.; Xu, H.; Hu, T. Chemical composition of PM10 and PM2.5 collected at ground level and 100 meters during a strong winter-time pollution episode in Xi’an, China. J. Air. Waste. Manag. Assoc. 2011, 61, 1150–1159. [Google Scholar] [CrossRef] [Green Version]
  59. China National Environmental Monitoring Centre. Available online: http://www.cnemc.cn (accessed on 29 April 2021).
  60. Air Quality Online Monitoring and Analysis Platform. Available online: https://www.aqistudy.cn/historydata/monthdata (accessed on 29 April 2021).
  61. Huang, C.; Wang, T.; Niu, T.; Li, M.; Liu, H.; Ma, C. Study on the variation of air pollutant concentration and its formation mechanism during the COVID-19 period in Wuhan. Atmos. Environ. 2021, 251, 118276. [Google Scholar] [CrossRef]
  62. Marinello, S.; Lolli, F.; Gamberini, R. The Impact of the COVID-19 Emergency on Local Vehicular Traffic and Its Consequences for the Environment: The Case of the City of Reggio Emilia (Italy). Sustainability 2020, 13, 118. [Google Scholar] [CrossRef]
  63. Zambrano-Monserrate, M.A.; Ruano, M.A.; Sanchez-Alcalde, L. Indirect effects of COVID-19 on the environment. Sci. Total Environ. 2020, 728, 138813. [Google Scholar] [CrossRef]
  64. Ministry of Ecology and Environment of the People’s Republic of China. GB 3095-2012. Ambient Air Quality Standard; China Environmental Science Press: Beijing, China, 2018; p. 3. [Google Scholar]
  65. Xu, H.; Li, Y.; Feng, R.; He, K.; Ho, S.S.H.; Wang, Z.; Ho, K.F.; Sun, J.; Chen, J.; Wang, Y.; et al. Comprehensive characterization and health assessment of occupational exposures to volatile organic compounds (VOCs) in Xi’an, a major city of northwestern China. Atmos. Environ. 2021, 246, 118085. [Google Scholar] [CrossRef]
  66. Yang, L.; Shen, Z.; Wang, D.; Wei, J.; Wang, X.; Sun, J.; Xu, H.; Cao, J. Diurnal variations of size-resolved bioaerosols during autumn and winter over a semi-arid megacity in northwest China. GeoHealth 2021, 5. [Google Scholar] [CrossRef] [PubMed]
  67. Sulaymon, I.D.; Zhang, Y.; Hopke, P.K.; Zhang, Y.; Hua, J.; Mei, X. COVID-19 pandemic in Wuhan: Ambient air quality and the relationships between criteria air pollutants and meteorological variables before, during, and after lockdown. Atmos. Res. 2021, 250, 105362. [Google Scholar] [CrossRef]
  68. Shehzad, K.; Xiaoxing, L.; Ahmad, M.; Majeed, A.; Tariq, F.; Wahab, S. Does air pollution upsurge in megacities after Covid-19 lockdown? A spatial approach. Environ. Res. 2021, 197, 111052. [Google Scholar] [CrossRef]
  69. Gray, H.A.; Cass, G.R. Characteristics of atmospheric organic and elemental carbon particle concentrations in Los Angeles. Environ. Sci. Technol. 1986, 20, 580–589. [Google Scholar] [CrossRef] [Green Version]
  70. Xu, H.; Guinot, B.; Cao, J.; Li, Y.; Niu, X.; Ho, K.F.; Shen, Z.; Liu, S.; Zhang, T.; Lei, Y.; et al. Source, health risk and composition impact of outdoor very fine particles (VFPs) to school indoor environment in Xi’an, Northwestern China. Sci. Total. Environ. 2018, 612, 238–246. [Google Scholar] [CrossRef]
  71. Cao, J.J.; Chow, J.C.; Watson, J.G.; Wu, F.; Han, Y.M.; Jin, Z.D.; Shen, Z.X.; An, Z.S. Size-differentiated source profiles for fugitive dust in the Chinese Loess Plateau. Atmos. Environ. 2008, 42, 2261–2275. [Google Scholar] [CrossRef]
  72. Zhang, T.; Cao, J.J.; Chow, J.C.; Shen, Z.X.; Ho, K.F.; Ho, S.S.; Liu, S.X.; Han, Y.M.; Watson, J.G.; Wang, G.H.; et al. Characterization and seasonal variations of levoglucosan in fine particulate matter in Xi’an, China. J. Air. Waste. Manag. Assoc. 2014, 64, 1317–1327. [Google Scholar] [CrossRef] [PubMed] [Green Version]
  73. Shen, Z.; Cao, J.; Arimoto, R.; Han, Z.; Zhang, R.; Han, Y.; Liu, S.; Okuda, T.; Nakao, S.; Tanaka, S. Ionic composition of TSP and PM2.5 during dust storms and air pollution episodes at Xi’an, China. Atmos. Environ. 2009, 43, 2911–2918. [Google Scholar] [CrossRef]
  74. Feng, R.; Xu, H.; He, K.; Wang, Z.; Han, B.; Lei, R.; Ho, K.F.; Niu, X.; Sun, J.; Zhang, B.; et al. Effects of domestic solid fuel combustion emissions on the biomarkers of homemakers in rural areas of the Fenwei Plain, China. Ecotox. Environ. Safe. 2021, 214, 112104. [Google Scholar] [CrossRef] [PubMed]
  75. He, K.; Xu, H.; Feng, R.; Shen, Z.; Li, Y.; Zhang, Y.; Sun, J.; Zhang, Q.; Zhang, T.; Yang, L.; et al. Characteristics of indoor and personal exposure to particulate organic compounds emitted from domestic solid fuel combustion in rural areas of northwest China. Atmos. Res. 2021, 248. [Google Scholar] [CrossRef]
  76. Zhang, Q.; Shen, Z.; Cao, J.; Ho, K.; Zhang, R.; Bie, Z.; Chang, H.; Liu, S. Chemical profiles of urban fugitive dust over Xi’an in the south margin of the Loess Plateau, China. Atmos. Pollut. Res. 2014, 5, 421–430. [Google Scholar] [CrossRef] [Green Version]
  77. Shen, Z.; Arimoto, R.; Cao, J.; Zhang, R.; Li, X.; Du, N.; Okuda, T.; Nakao, S.; Tanaka, S. Seasonal variations and evidence for the effectiveness of pollution controls on water-soluble inorganic species in total suspended particulates and fine particulate matter from Xi’an, China. J. Air. Waste. Manage. Assoc. 2008, 58, 1560–1570. [Google Scholar] [CrossRef]
  78. Wang, H.; Miao, Q.; Shen, L.; Yang, Q.; Wu, Y.; Wei, H.; Yin, Y.; Zhao, T.; Zhu, B.; Lu, W. Characterization of the aerosol chemical composition during the COVID-19 lockdown period in Suzhou in the Yangtze River Delta, China. J. Environ. Sci. 2021, 102, 110–122. [Google Scholar] [CrossRef] [PubMed]
  79. Gao, C.; Li, S.; Liu, M.; Zhang, F.; Achal, V.; Tu, Y.; Zhang, S.; Cai, C. Impact of the COVID-19 pandemic on air pollution in Chinese megacities from the perspective of traffic volume and meteorological factors. Sci. Total. Environ. 2021, 773. [Google Scholar] [CrossRef] [PubMed]
  80. Tello-Leal, E.; Macias-Hernandez, B.A. Association of environmental and meteorological factors on the spread of COVID-19 in Victoria, Mexico, and air quality during the lockdown. Environ. Res. 2020, 110442. [Google Scholar] [CrossRef]
  81. Wu, C.L.; Wang, H.W.; Cai, W.J.; He, H.D.; Ni, A.N.; Peng, Z.R. Impact of the COVID-19 lockdown on roadside traffic-related air pollution in Shanghai, China. Build. Environ. 2021, 194, 107718. [Google Scholar] [CrossRef] [PubMed]
  82. Ding, J.; Dai, Q.; Li, Y.; Han, S.; Zhang, Y.; Feng, Y. Impact of meteorological condition changes on air quality and particulate chemical composition during the COVID-19 lockdown. J. Environ. Sci. 2021, 109, 45–56. [Google Scholar] [CrossRef]
  83. Chu, B.; Zhang, S.; Liu, J.; Ma, Q.; He, H. Significant concurrent decrease in PM2.5 and NO2 concentrations in China during COVID-19 epidemic. J. Environ. Sci. 2021, 99, 346–353. [Google Scholar] [CrossRef]
  84. Wang, J.; Lei, Y.; Chen, Y.; Wu, Y.; Ge, X.; Shen, F.; Zhang, J.; Ye, J.; Nie, D.; Zhao, X.; et al. Comparison of air pollutants and their health effects in two developed regions in China during the COVID-19 pandemic. J. Environ. Manage. 2021, 287, 112296. [Google Scholar] [CrossRef]
  85. Bai, H.; Gao, W.; Zhang, Y.; Wang, L. Assessment of health benefit of PM2.5 reduction during COVID-19 lockdown in China and separating contributions from anthropogenic emissions and meteorology. J. Environ. Sci. 2021. [Google Scholar] [CrossRef]
  86. Chatterjee, A.; Mukherjee, S.; Dutta, M.; Ghosh, A.; Ghosh, S.K.; Roy, A. High rise in carbonaceous aerosols under very low anthropogenic emissions over eastern Himalaya, India: Impact of lockdown for COVID-19 outbreak. Atmos. Environ. 2021, 244, 117947. [Google Scholar] [CrossRef]
  87. Toro, A.R.; Catalan, F.; Urdanivia, F.R.; Rojas, J.P.; Manzano, C.A.; Seguel, R.; Gallardo, L.; Osses, M.; Pantoja, N.; Leiva-Guzman, M.A. Air pollution and COVID-19 lockdown in a large South American city: Santiago Metropolitan Area, Chile. Urban. Clim. 2021, 36, 100803. [Google Scholar] [CrossRef]
  88. Orak, N.H.; Ozdemir, O. The impacts of COVID-19 lockdown on PM10 and SO2 concentrations and association with human mobility across Turkey. Environ. Res. 2021, 197, 111018. [Google Scholar] [CrossRef] [PubMed]
  89. He, C.; Hong, S.; Zhang, L.; Mu, H.; Xin, A.; Zhou, Y.; Liu, J.; Liu, N.; Su, Y.; Tian, Y.; et al. Global, continental, and national variation in PM2.5, O3, and NO2 concentrations during the early 2020 COVID-19 lockdown. Atmos. Pollut. Res. 2021, 12, 136–145. [Google Scholar] [CrossRef] [PubMed]
  90. Yadav, R.; Korhale, N.; Anand, V.; Rathod, A.; Bano, S.; Shinde, R.; Latha, R.; Sahu, S.K.; Murthy, B.S.; Beig, G. COVID-19 lockdown and air quality of SAFAR-India metro cities. Urban. Clim. 2020, 34. [Google Scholar] [CrossRef]
  91. Xi’an Thermal Power Plant: Build A strong Fortress against the Epidemic with the Spirit of Responsibility. Available online: http://www.sanqin.com/2020-02/06/content_8427449.html (accessed on 8 May 2021).
Figure 1. Timeline of COVID-19 lockdown policy in Xi’an [49,50,51,52,53,54,55].
Atmosphere 12 00788 g001
Figure 2. Location of PM2.5 filter sampling site (black dot) and the nearest air quality monitoring station (red triangle).
Atmosphere 12 00788 g002
Figure 3. Variations in (a) AQI; (b) PM2.5 concentration; (c) PM10 concentration; (d) ratios of PM2.5/PM10; (e) SO2 concentration; (f) CO concentration; (g) NO2 concentration; (h) O3_8h concentration in different periods of COVID-19 lockdown (1: pre-lockdown, 2: during lockdown, 3: post-lockdown. The asterisk (*) represents the difference was statistically significant).
Atmosphere 12 00788 g003
Figure 4. Time series of PM2.5 mass concentrations in offline samples during the different periods of COVID-19 lockdown. The red lines represent the average values of PM2.5 mass concentration.
Atmosphere 12 00788 g004
Figure 5. Distribution of NO3/SO42− ratio in the periods of pre-lockdown, during lockdown, and post-lockdown (The box plot indicates the median values and the min, 1st, 25th, 50th, 75th, 99th and max percentiles. Square (□) represents the average value of this ratio).
Atmosphere 12 00788 g005
Figure 6. Comparison of during lockdown/pre-lockdown of national controlled air pollutants (a) between Xi’an and domestic cities; (b) between Xi’an and foreign cities, and (c) during lockdown/pre-lockdown of PM2.5 chemical species between Xi’an and domestic cities.
Atmosphere 12 00788 g006
Table 1. Meteorological data in three different periods.
Temperature
(T, °C)
Relative Humidity
(RH)
Prevailing Wind Direction
(PWD)
Wind Speed
(WS, m s−1)
Pre-lockdown1.7 ± 1.462 ± 5%Northeast2.4 ± 1.7
Dur-lockdown4.4 ± 2.159 ± 4%Northeast2.3 ± 1.6
Post-lockdown7.6 ± 3.650 ± 5%Northeast4.5 ± 3.0
Table 2. Characteristics of OC and EC concentrations during the different periods of COVID-19 lockdown.
TC (μg m−3)OC (μg m−3)EC (μg m−3)OC/EC
(TC/PM2.5)(OC/PM2.5)(EC/PM2.5)
Pre-lockdown19.1 ± 7.0
(13.3% ± 2.7%)
15.2 ± 5.8
(10.6% ± 2.4%)
3.9 ± 1.3
(2.7% ± 0.4%)
3.8 ± 0.6
Dur-lockdown17.6 ± 7.6
(14.4% ± 4.2%)
14.6 ± 6.4
(11.9% ± 3.7%)
3.0 ± 1.3
(2.5% ± 0.6%)
4.8 ± 0.8
Post-lockdown10.8 ± 5.5
(11.5% ± 3.8%)
8.7 ± 4.5
(9.3% ± 3.2%)
2.1 ± 1.1
(2.2% ± 0.7%)
4.4 ± 0.9
Table 3. The impact of COVID-19 lockdown on air quality in different regions over the world. Increasing values were indicated in bold font.
ReferenceStudy Location Air Pollutants
PM2.5PM10NO2SO2COO3Others
This studyXi’an, China−17%−27%−52%−16%−25%+160%WSIs (−16%)
Wang et al., 2021 [78]Suzhou, China−37.2%−38.3%−64.5%+1.5%−26.1%+104.7%WSIs (−58%)
Gao et al., 2021 [79]Wuhan, Beijing, Shanghai, and Guangzhou, China−9.4% −43.0%−10.9%
Tello-Leal et al., 2020 [80]Victoria, Mexico−45%−45% −47%
Wu et al., 2021 [81]Shanghai, China−(30–40%)−(16.4–28.8%)+(5.7–30.2%)
Ding et al., 2021 [82]Tianjin, China−22.7% −17.7% +3.0%
Chu et al., 2021 [83]Wuhan, China−35%−36%−53%−10%−6%+58%
Wang et al., 2021 [84]Beijing-Tianjin-Hebei (BTH) and Yangtze River Delta (YRD), China
Bai et al., 2021 [85]1388 Monitoring stations nationwide in China−(30–60%)
Shehzad et al., 2021 [68]Delhi and Mumbai, India−42%−50%−53%−41%−37%+2.0%NH3 (−21%)
Chatterjee et al., 2021 [86]Eastern Himalaya, India NO
OC, EC, OC/EC, TC, SOC
A et al., 2021 [87]Eastern Himalaya, India
Santiago, Chile
Orak et al., 2021 [88]All 81 cities of Turkey −67% −59%
He et al., 2021 [89]380 cities across the globe−16.1% −45.8% +5.4%
Yadav et al., 2020 [90]Four megacities, India−(25–50%)−(36–50%)−(60–65%)
Publisher’s Note: MDPI stays neutral with regard to jurisdictional claims in published maps and institutional affiliations.

