1. Introduction
Drought is a natural hazard that can cause a wide range of impacts affecting the environment, society and the economy [
1]. Since the beginning of the 21st century, different parts of Europe faced several extreme droughts: among others, the drought (accompanied by the heatwave) in 2003 that hit Western and Central Europe; the 2011/2012 drought that affected SE Europe [
2]; the extreme drought in 2015 that affected the Central and Eastern parts of Europe [
3]; the summer in 2017 that was extremely dry in the Western Balkan Peninsula, particularly in Croatia [
4], and Western Europe was affected by severe drought during a whole period from the summer of 2016 to the summer of 2017 [
5]. In Croatia, in 2017, there were more than 100 consecutive dry days with a large precipitation deficit and extremely high air temperature during the summer months [
6]. These facts become one of the main motivations to investigate dry spells in Croatia, where there are significant spatial differences in the average precipitation amounts and frequency of occurrence between continental, mountainous and coastal areas [
7]. The region of Croatia belongs to the transitional area between Northern Europe with an observed general increase in average precipitation and the drying Mediterranean [
8,
9]. This region is also characterized by large seasonal variability. The maritime annual cycle of precipitation is a characteristic of the coastal and mountainous region along the Adriatic coast, with the rainiest period in the winter and minima in the summer. On the other hand, the continental annual cycle of precipitation is a characteristic of the inland, with the rainiest period in the early summer with a secondary maximum in November as a consequence of the maritime influence, whereas the minimum occurs in the winter months [
7].
A spatial and temporal analysis of the precipitation amounts and the indices of extremes in Croatia have been investigated in several studies. Gajić-Čapka et al. [
10] analysed the trends in extreme precipitation indices during the 1961–2010 period. The results revealed a decreasing trend in annual precipitation amounts in the mountainous and central hinterland, whereas a significant positive trend was found in the eastern mainland. A negative annual trend is mainly caused by a decrease in the frequency of very wet days and their contribution to the total precipitation. A tendency of the increasing annual frequency of dry days was encountered all over the country, particularly in the northern Adriatic region, including the mountainous littoral.
In meteorological practice, drought monitoring usually relies on the cumulative precipitation amount on the different time scale (month or season), which may sometimes lead to incorrect conclusions on dryness (or wetness) of a particular month or season [
11]. However, dry spell monitoring provides insight into the spatiotemporal distribution of the daily precipitation [
12] and, thus, enables the identification of spatial patterns of drought risk [
13]. Dry spells may have an impact on many sectors in different ways, but agriculture and water management are mostly affected by long dry spell durations [
12,
14]. Dry spells are generally defined as consecutive sequences of days with daily precipitation less than a given precipitation-per-day threshold (
Rd, in mm). The most commonly used
Rd values in practice and the scientific papers are those of 0.1, 1, 5 and 10 mm (e.g., [
15,
16,
17,
18]. In particular, the maximum duration of dry spells corresponding to the 1-mm threshold was widely analysed across Europe in the context of climate change, since they belong to the core set of indices of extremes recommended by the WMO [
19]. There is a large body of studies dealing with long-term trends of dry spells on the local and regional levels (e.g., [
17,
20,
21,
22]) or pan-European level [
23] but, also, at the global level (e.g., [
14]), employing datasets starting from the middle of the 20th century. Zolina et al. [
23] found a rising trend of dry periods (but, also, of wet periods) over the Netherlands and Eastern Europe, especially in the cold season, suggesting a regrouping of the wet/dry days into more prolonged wet/dry episodes. Over France and Central-Southern Europe (including the Balkan states, Romania and Bulgaria) during both (warm and cold) halves of the year, the tendencies in the durations of wet and dry periods have opposite signs. Recently, the trend analysis of extreme dry (and wet) periods by Breinl et al. [
14] revealed a shorter DS duration in Scandinavia; a N–S gradient in trends in Western Europe with longer DS lengths was experienced in Central and Southern France, whereas DS have become shorter in the West. Eastern Europe has been facing a general trend toward longer DS durations. From Figure 3c in [
14] there are indications for longer DS lengths in continental Croatia and Southern Adriatic and shorter durations along the Middle Adriatic.
Cindrić et al. [
11] analysed trends of dry spells for 25 stations in Croatia based on the data from the second half of the 20th century (1961–2000). They analysed the mean and maximum dry spell durations and time trends on seasonal and annual scales, defining the four categories of dry spells according to daily precipitation threshold (0.1, 1, 5 and 10 mm). The results revealed a positive trend of both mean and maximal durations during the winter and spring seasons and a negative trend in the autumn, for all thresholds.
The present study focuses on the mean and maximum dry spells associated with the 5-mm threshold (
DS5) with two goals in mind. The first one is to extend the previous trend analysis of Cindrić et al. [
11] by increasing the station density and extending the time series to the period 1961–2015. The second goal is to analyse the expected changes of the dry spells pattern over Croatia in two future periods (2011–2040 and 2041–2070) with the respect to the 1971–2000 period. For this purpose, three regional climate models, RegCM4 [
24], CCLM4 [
25] and RCA4 [
26], that cover the EURO-CORDEX [
27] domain at the 12.5-km horizontal resolution and are forced at the lateral boundaries using four CMIP5 global climate models [
28] are employed. The application of the regional climate models with a horizontal resolution higher than the forcing global climate models provides more realistic information on the local process, especially over the complex terrain areas. For future periods, the RCP4.5 and RCP8.5 scenarios [
29] are considered.
The overall objective of the study was to make a systematic dry spell analysis in the context of climate change, both for the present and the future. The study was primarily aimed at climate change adaptation in Croatia, particularly in agriculture, as well as in other economic sectors (tourism, water management and energy), but, also, to meet the general framework of the current and expected climate changes in Europe.
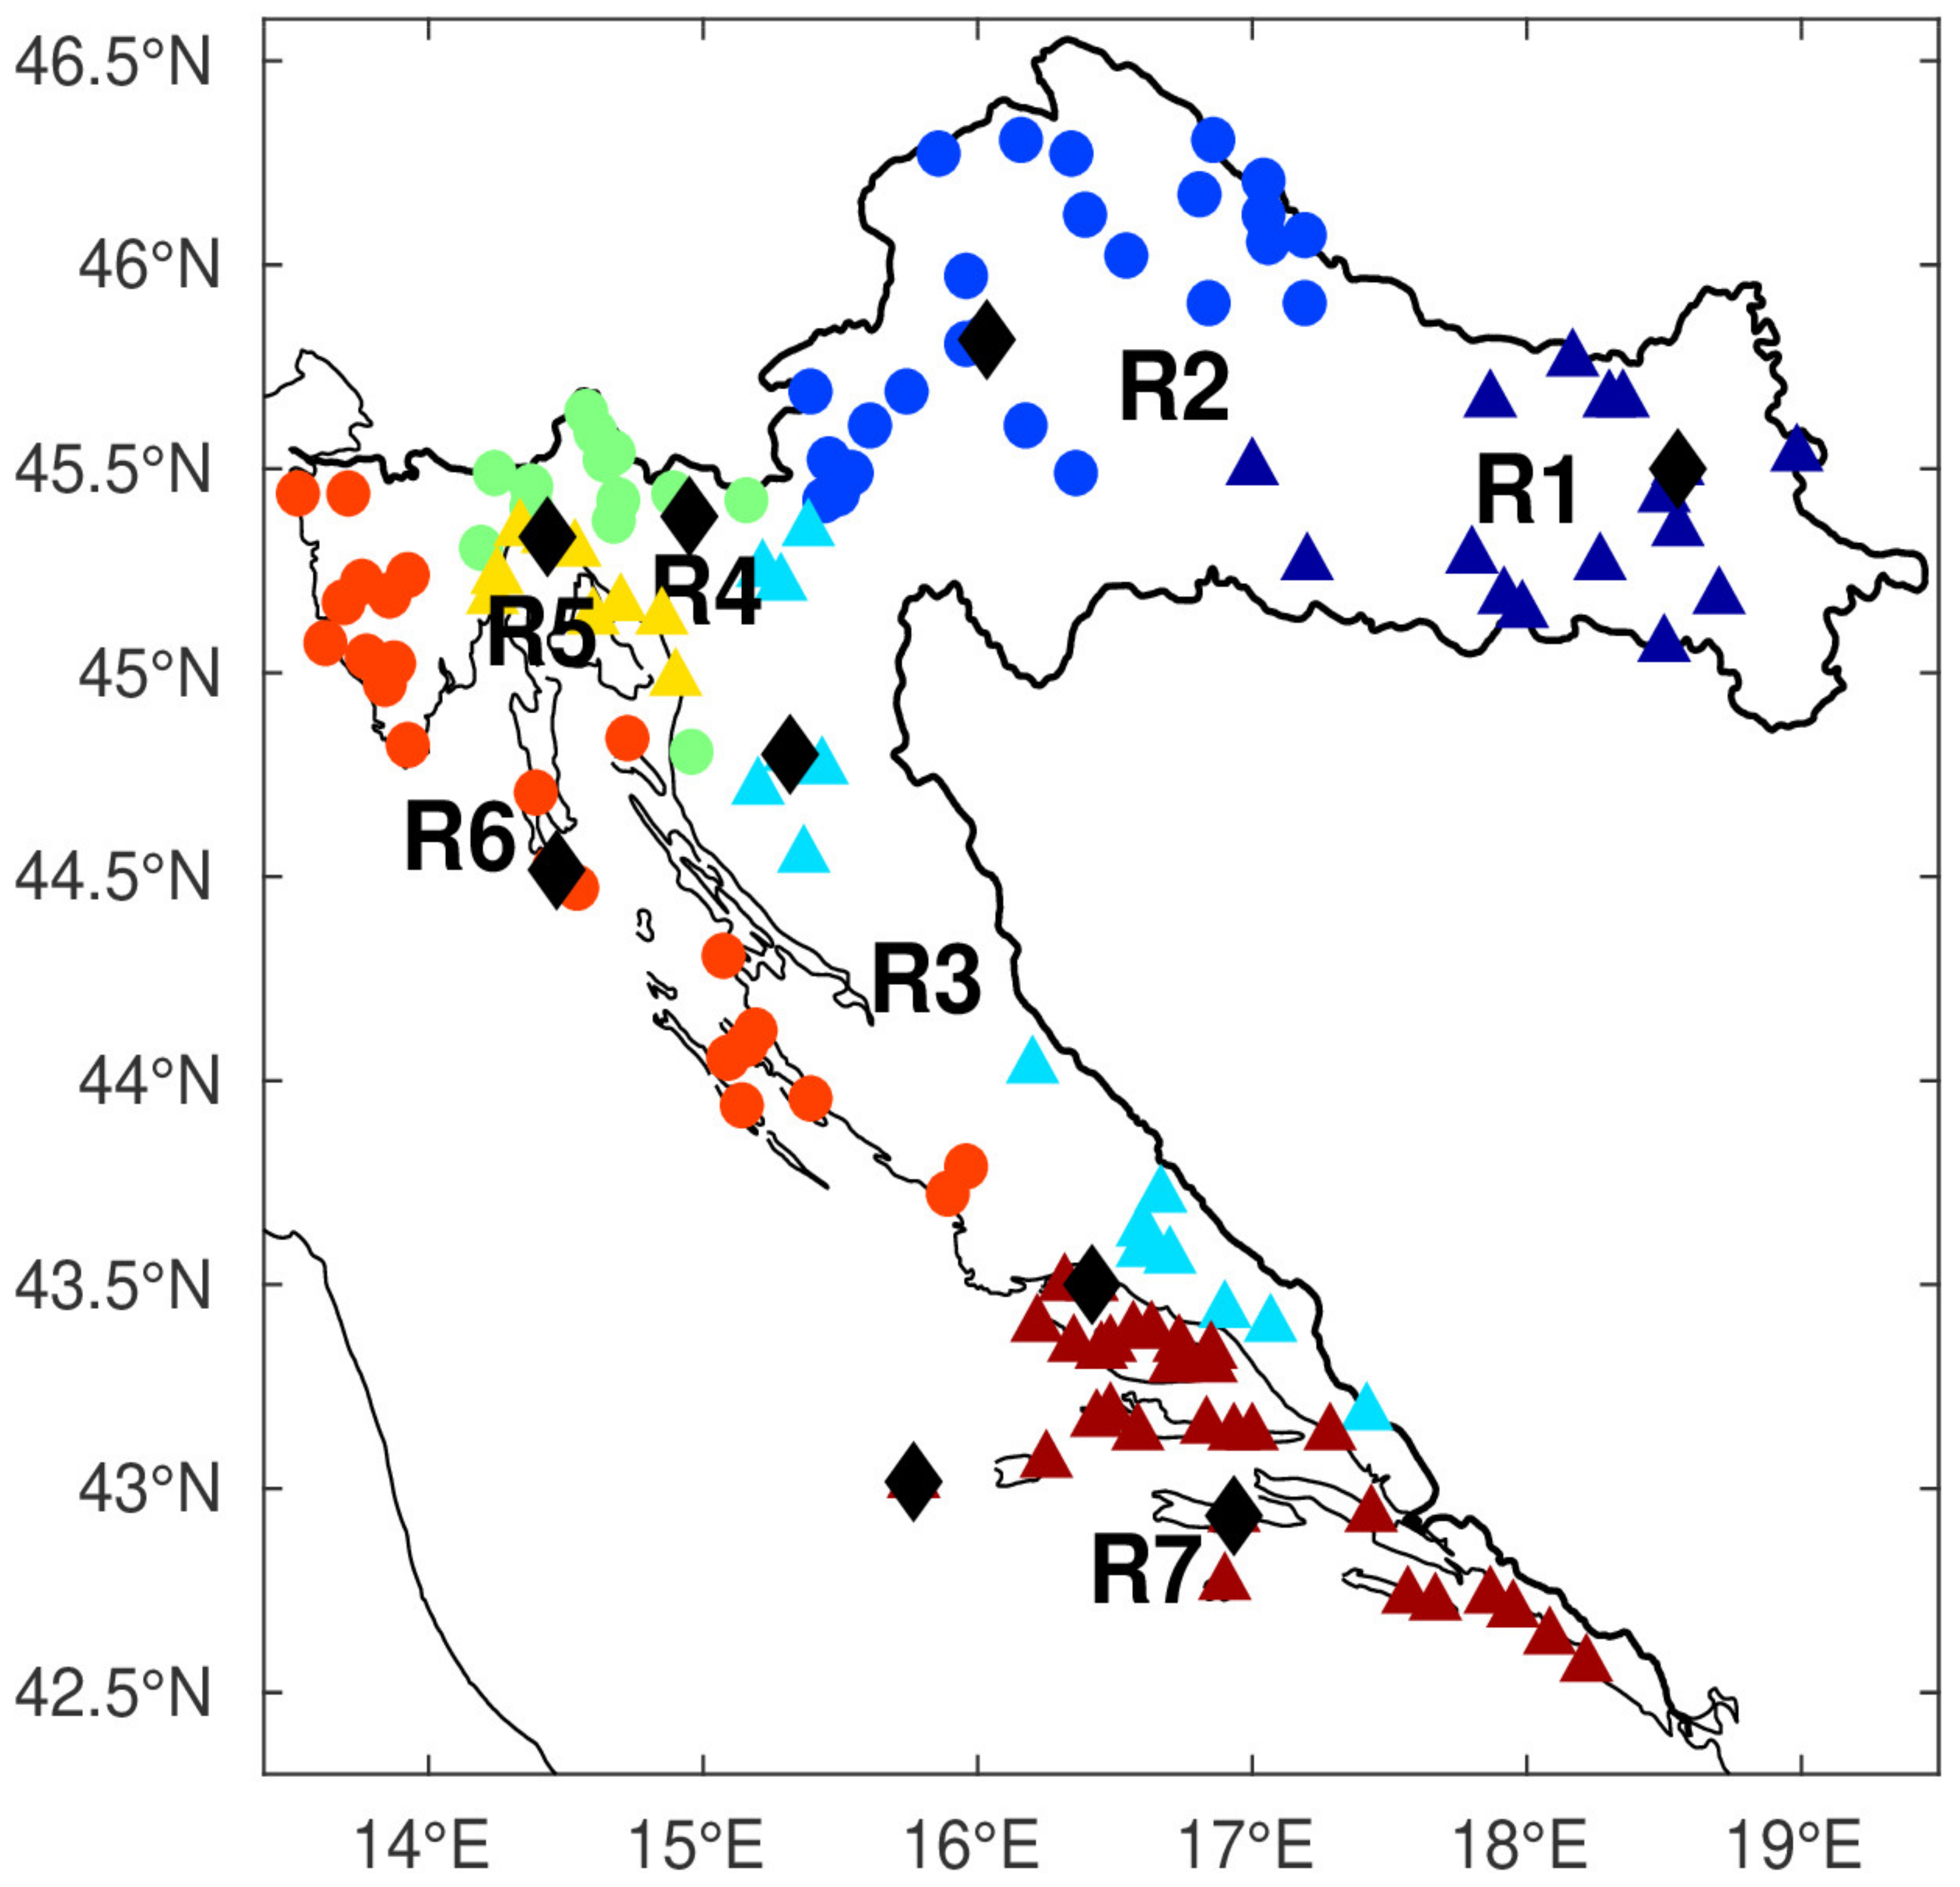
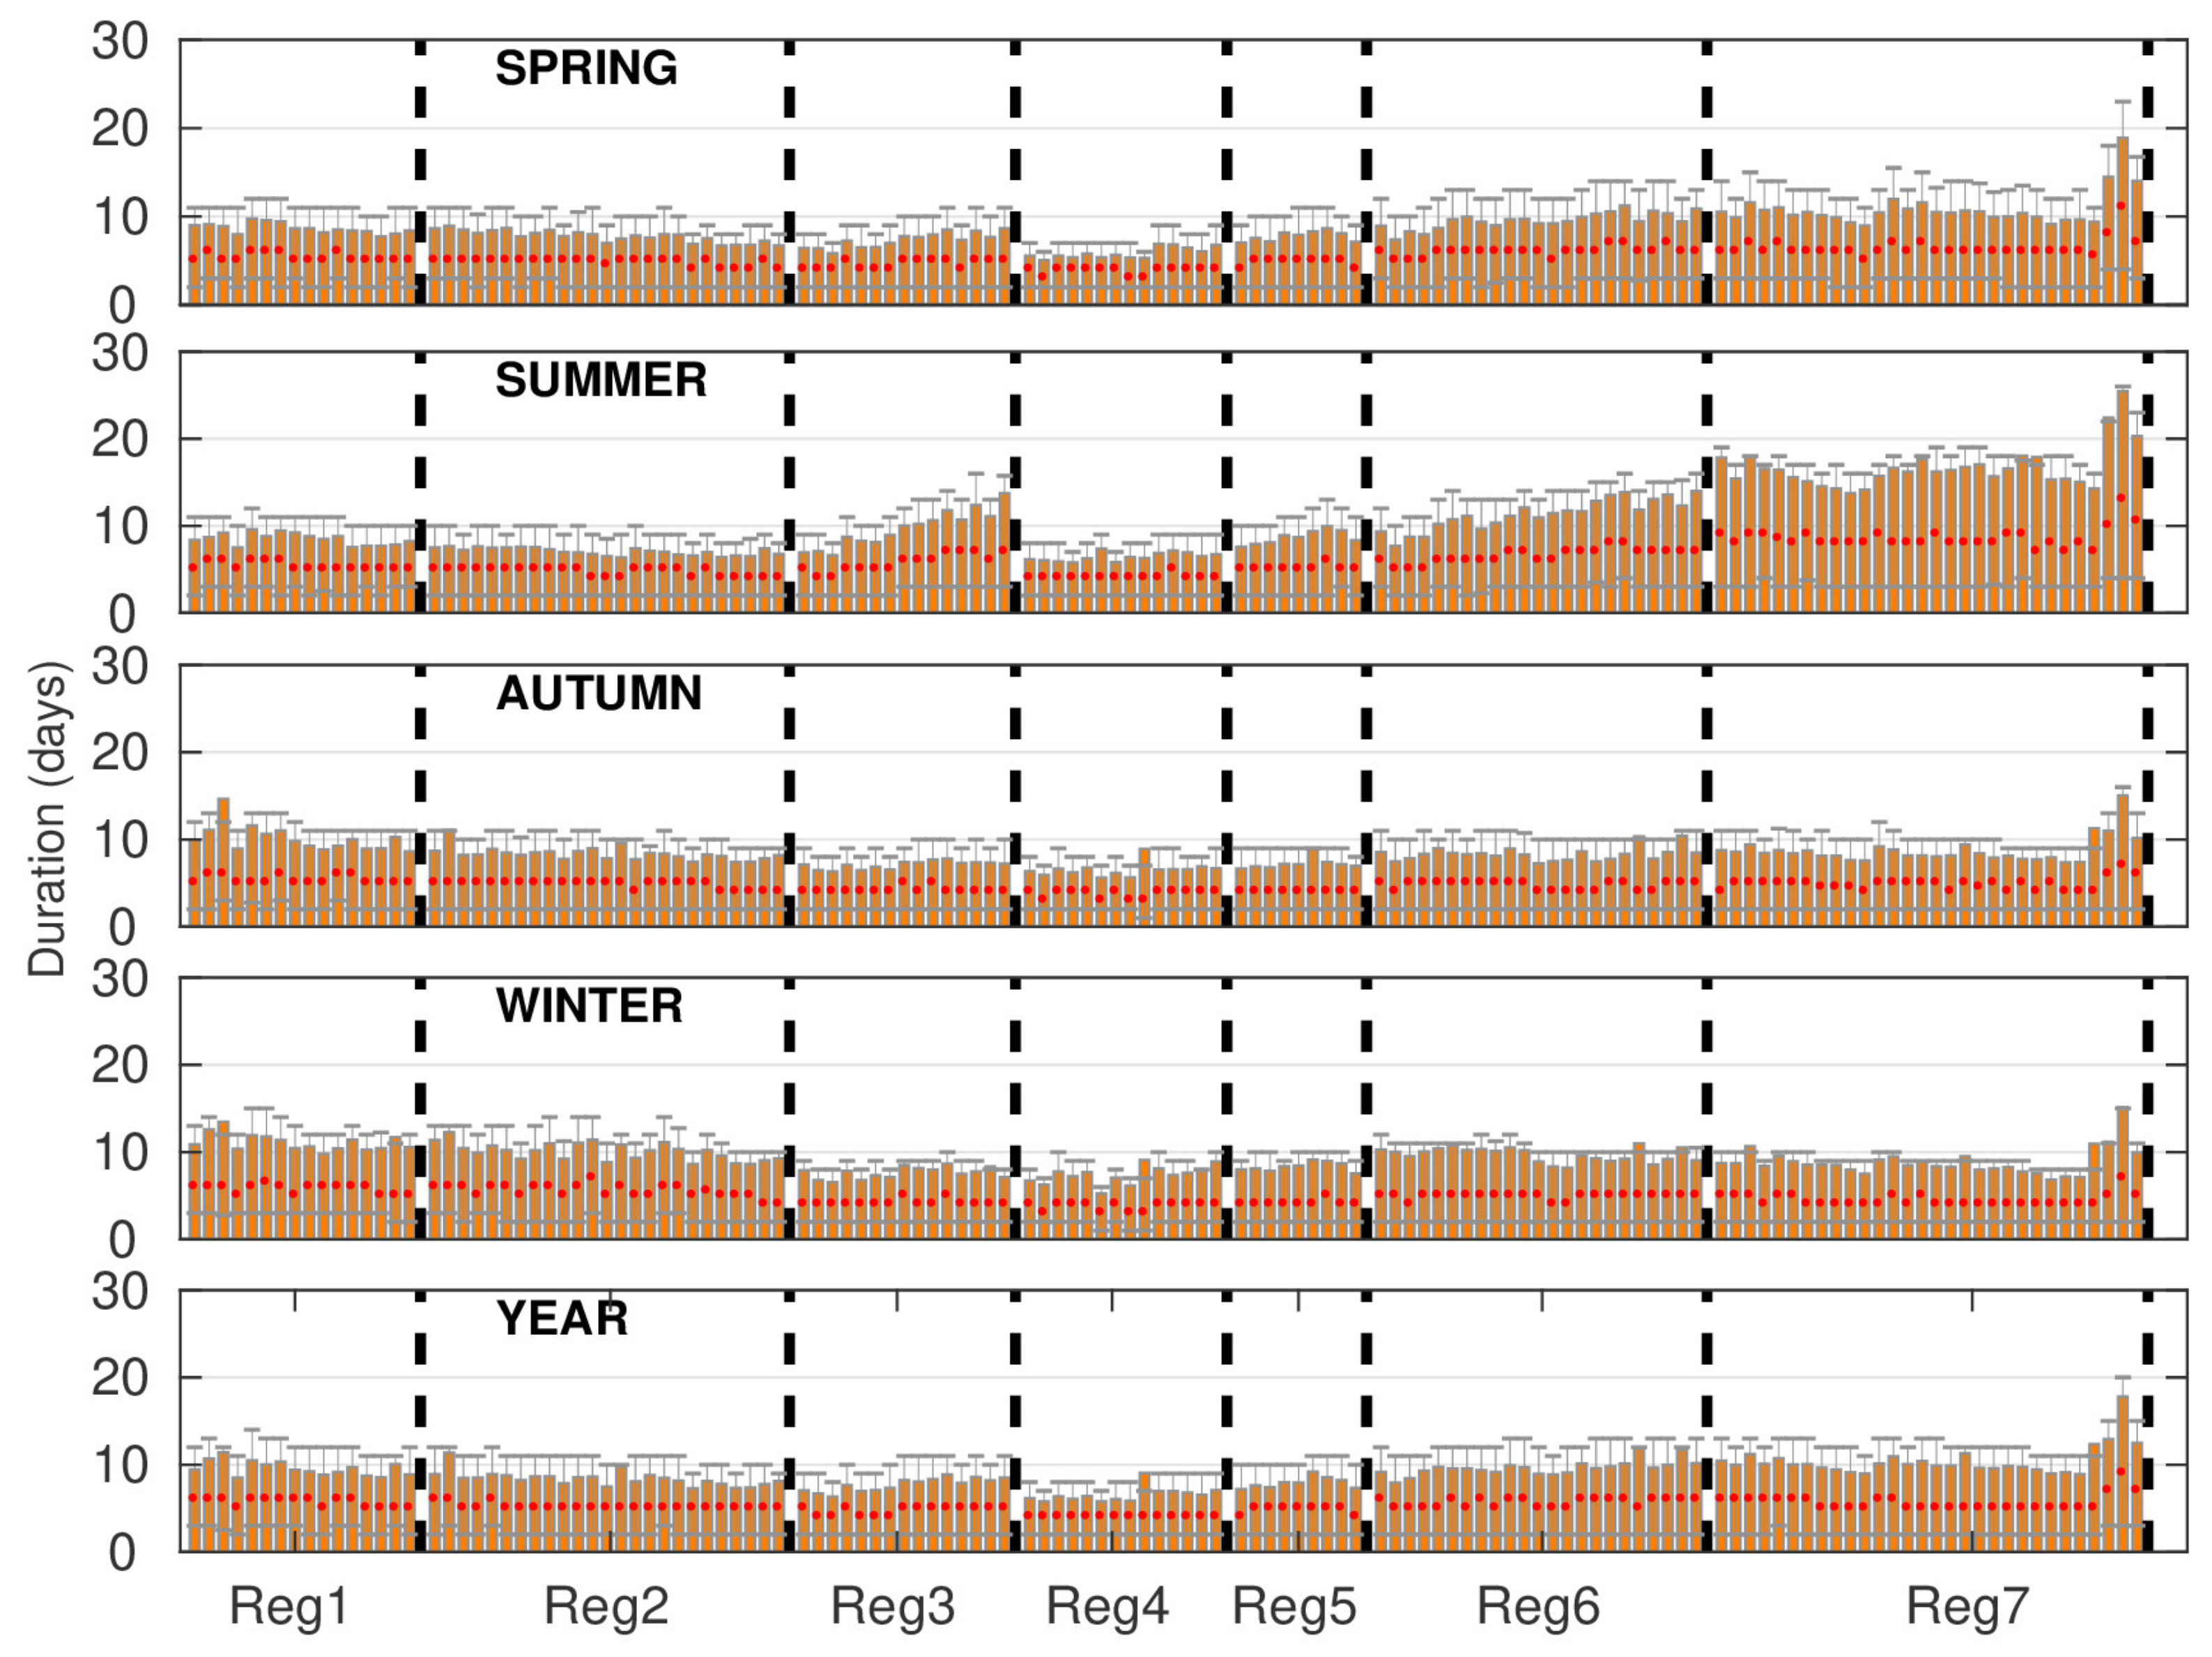
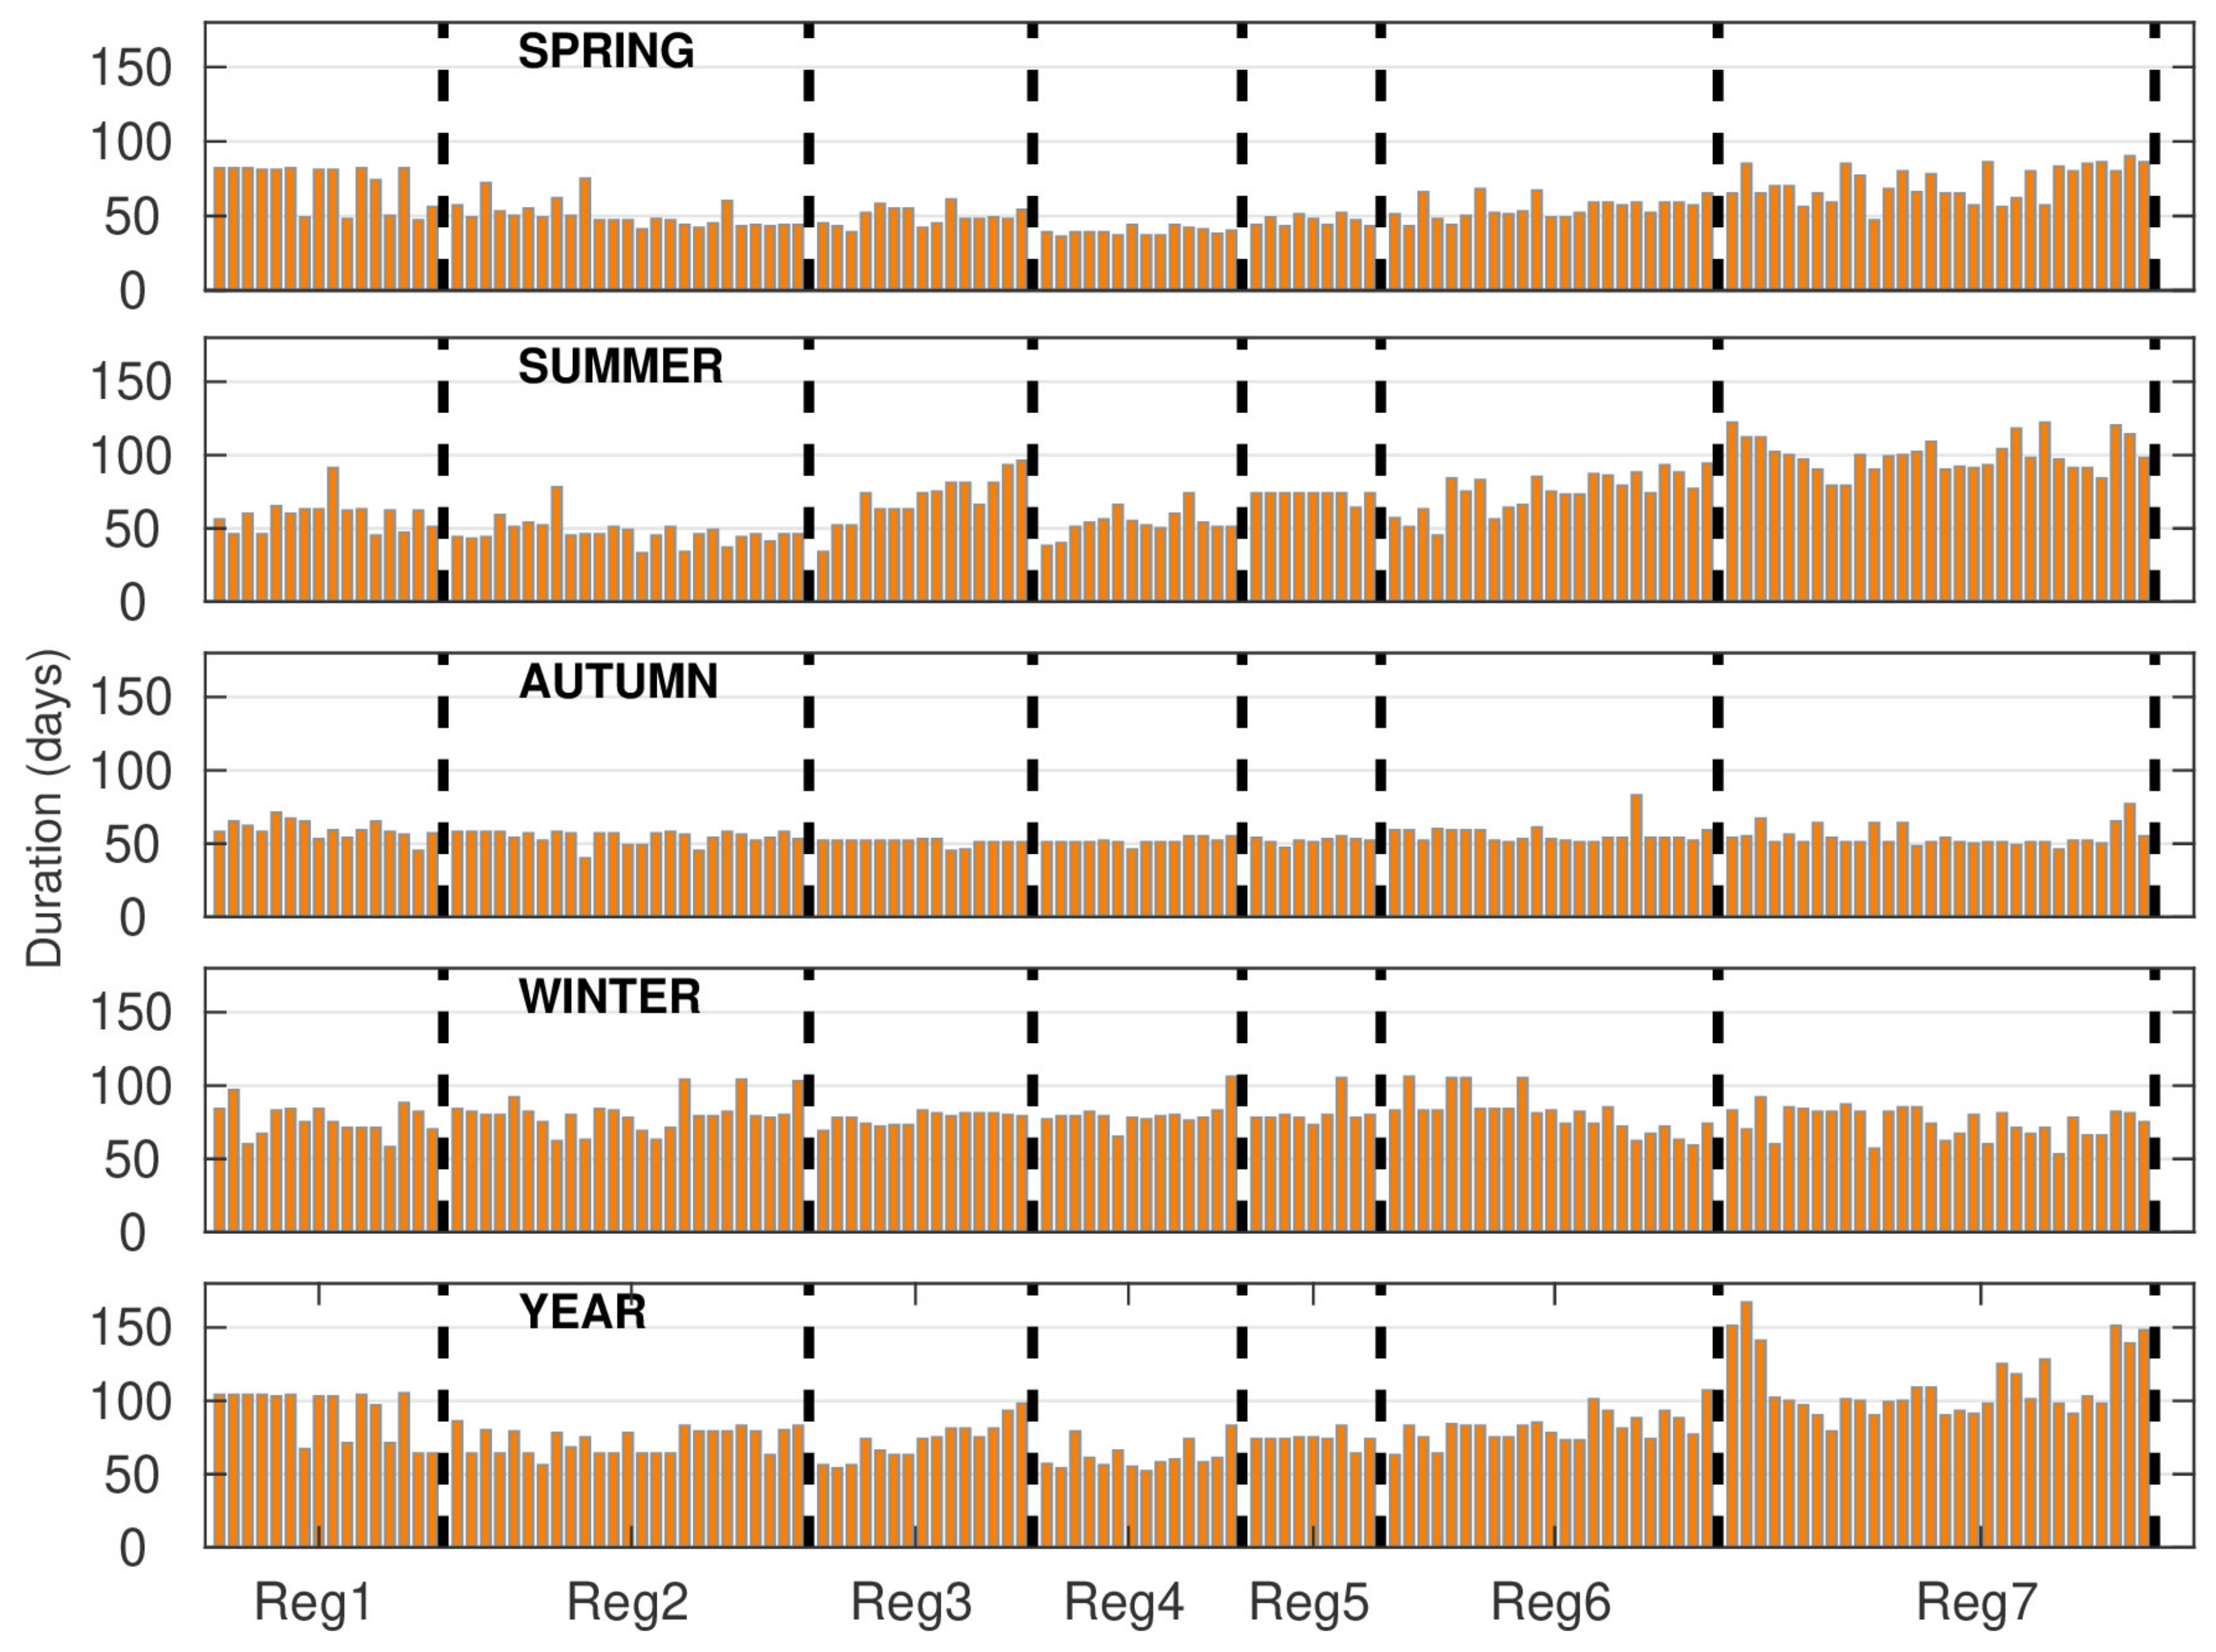
3. Results
3.1. Mean and Maximum Dry Spell Duration
The mean (
MDS5) and maximum (
MxDS5) dry spell durations with the 5-mm per-day-threshold are depicted with bars in
Figure 2 and
Figure 3, respectively. The corresponding regional mean values of
MDS5 and MxDS5 are given in
Table 3. In
Figure 2, the empirical frequency distribution is presented by the median (red dots) and interquartile (25th and 75th percentile) ranges for each station. It can be seen that the mean values are much higher than the corresponding median values, implying a positive skewness of the DS distribution. In
Table 4, the corresponding
MDS5 for the representative stations of each region are given for the same observed period of 1961–2015. The values are very close to the associated regional mean values.
The regional distribution of MDS5 reflects the prevailing continental and maritime precipitation regimes in Croatia, as well as mountainous climate in the transition region (Reg 4). Generally, in all seasons, MDS5 are the shortest in the mountainous region (Reg 4), while the easternmost and southernmost regions (Reg 1 and Reg 7) have the longest MDS5. On an annual scale, in the continental (Reg 1 and Reg 2) and Adriatic regions (Reg 6 and Reg 7), MDS5 are of similar durations. However, in the warm part of the year (spring and summer), the Middle and Southern Adriatic experience the longest sequences of dry days, whereas, in the cold part of the year (autumn and winter), the longest MDS5 occur in the continental regions. Nevertheless, it can be seen that the three southernmost stations situated at distinct Adriatic islands are exceptions, having the longest MDS5 durations in all the seasons.
On the other hand, MxDS5 did not reveal such a distinctive spatiotemporal pattern as MDS5 (
Figure 2). Nevertheless, the shortest MxDS5 durations are still found in the mountainous region (Reg 4), while the longest MxDS5 are the most common in the Central and Southern Adriatic regions (Reg 7). The MxDS5 pattern in Reg 1 closely follows the one of Reg 7, with annual mean durations of 92 and 110 days, respectively. In the spring, the mean MxDS5 in those two regions is 72 days. The Adriatic coastal regions and the hinterland are the driest in the summer, with the average MxDS5 ranging between 70 and 75 days (Reg 3, Reg 5 and Reg 6) and 100 days (Reg 7). In the autumn, the durations of the MxDS5 are pretty similar in all the regions, ranging from 51 to 59 days (
Table 3).
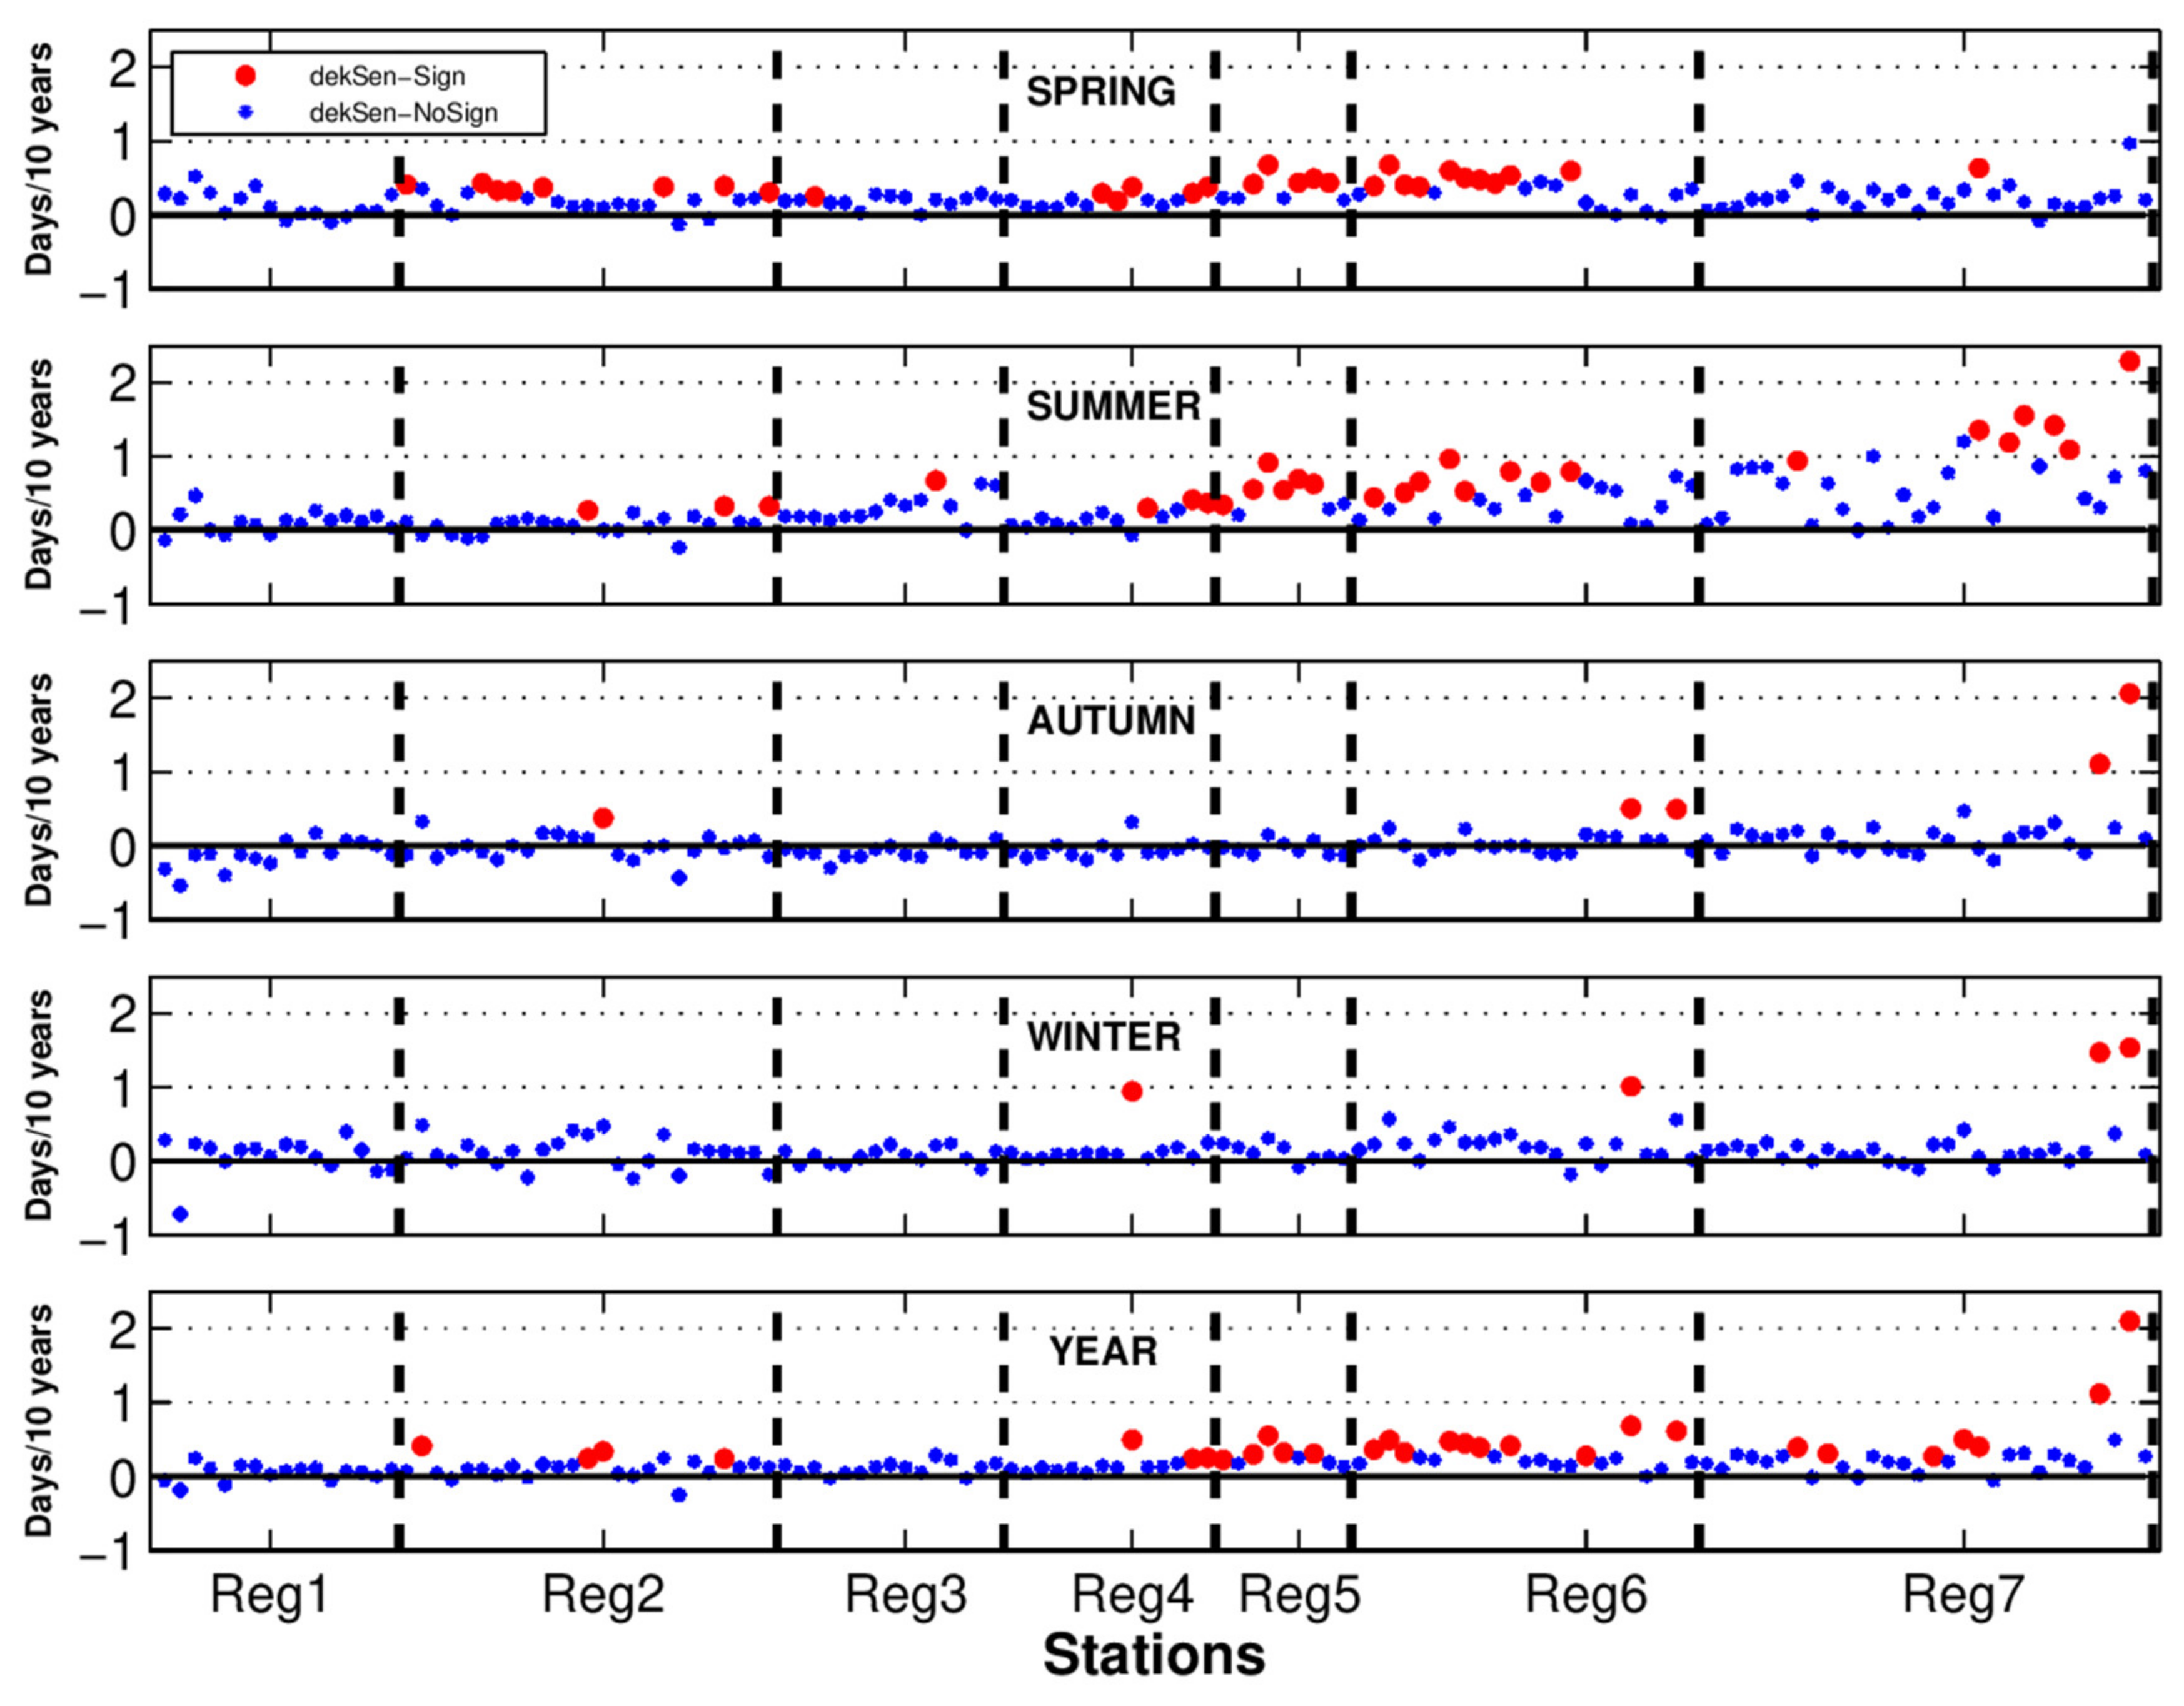
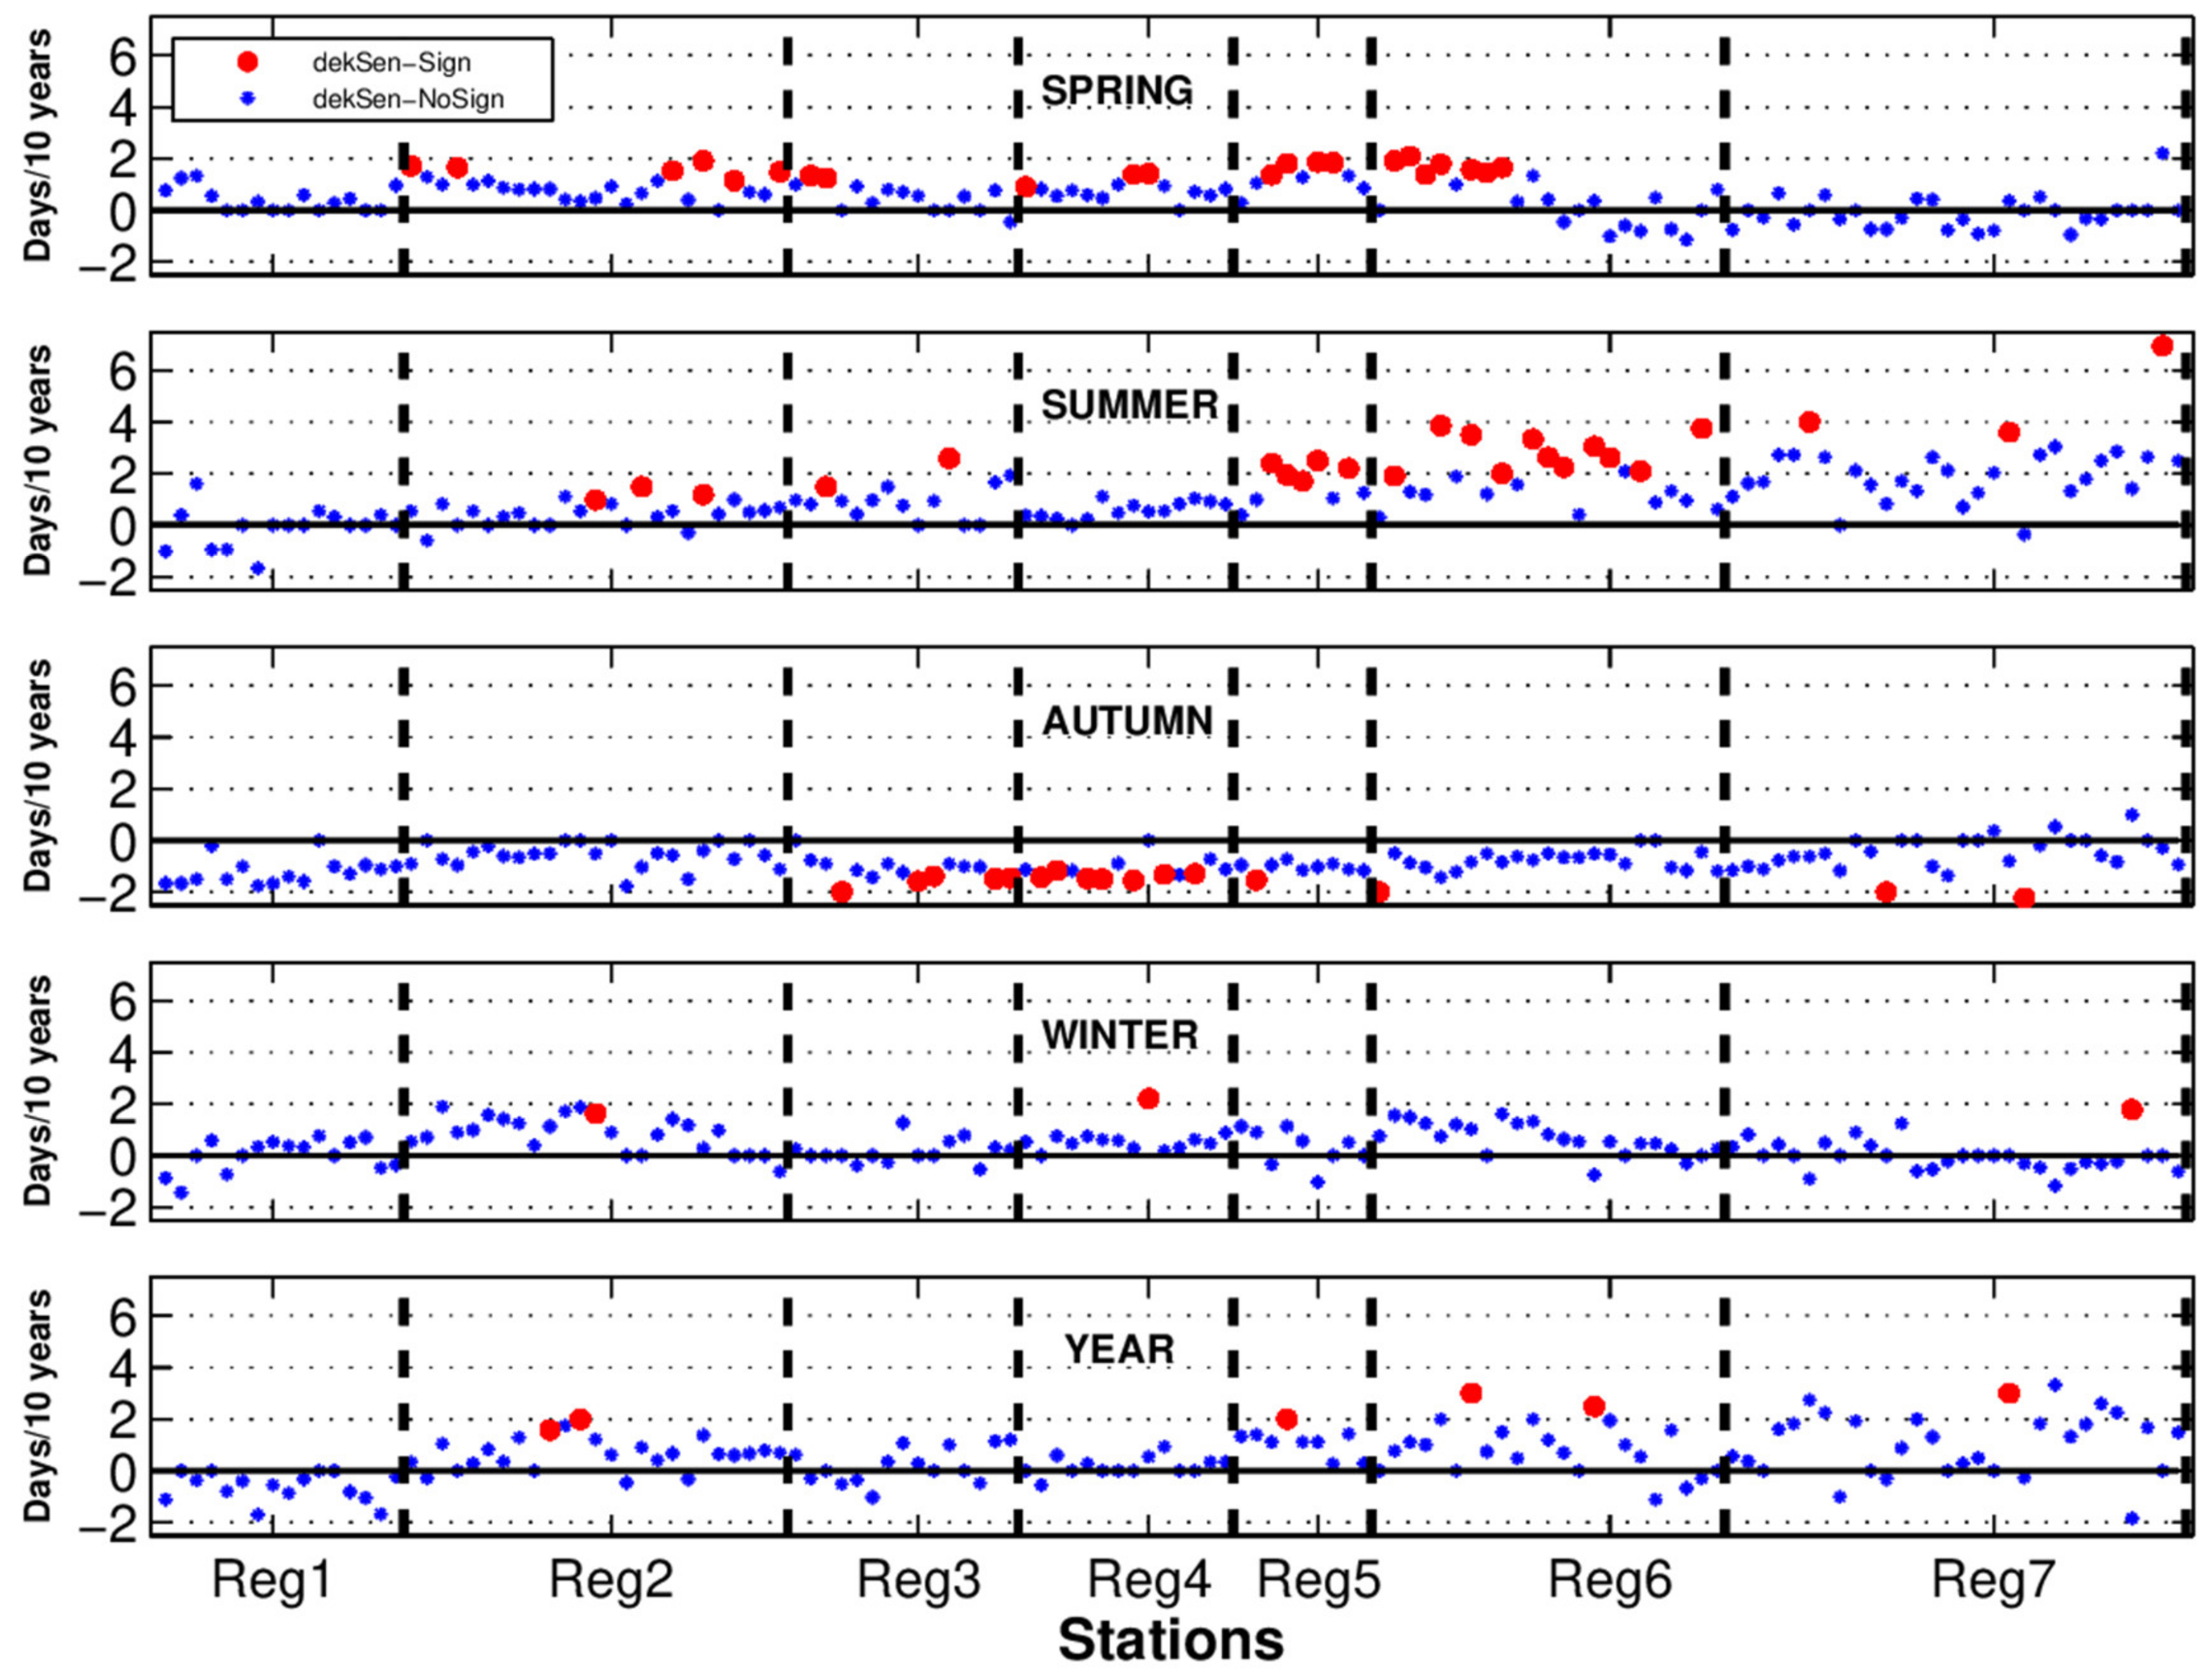
3.2. Trends
The trends in the seasonal and annual
MDS5 and
MxDS5 durations are shown in
Figure 4 and
Figure 5, respectively. The values of Sen’s slope are expressed in days per 10 years.
The results revealed a generally increasing trend in MDS5 durations in the warm part of the year (spring and summer). In the mountainous littoral (Reg 5), and along the Adriatic regions (Reg 6 and 7), the trend is statistically significant, with a prevailing significant increase also in Reg 2 during the spring. The largest and, also, the most significant trend is found in the summer at the Southern Adriatic region (Reg 7), particularly at the southernmost islands, showing an increase in MDS5 duration from one to 2.5 days in 10 years. On the other hand, in the cold part of the year (autumn and winter), there is no clear sign in the trend values for the majority of the stations. Though, a few stations in Reg 6 and Reg 7 pointed out a positive and significant trend (up to two days in 10 years). Consequently, an increasing trend in the annual MDS5 durations was found that was statistically significant along Adriatic regions (Reg 6 and 7) and in the mountainous littoral (Reg 5).
The trend results in
MxDS5 durations for the spring revealed a consistently increasing trend in all the regions from Reg 1 to Reg 5. The trend is also positive (and statistically significant) at half of the stations in Reg 6 (
Figure 5), which are located on the Istrian Peninsula, while, at the second half of the stations in Reg 6 (mostly island stations) and the whole of Reg 7, there is no clear sign in the trend values. In the summer, an increasing trend prevailed: at the mountainous littoral and in the Northern Adriatic (Regs 5 and 6), it is statistically significant. An overall decreasing trend is found in the autumn, and it is statistically significant in the mountainous region (Reg 4). In the winter, an increasing trend prevailed in Reg 2 and Reg 6, but generally, it is not pronounced over Croatian territory. A prevailing positive trend is apparent in Reg 2, and in regions 5–7 for the annual
MxDS, though only at a few stations is the trend significant.
It can be noticed that no trend is detected in Reg 1, neither for MDS5 nor for MxDS5. On the other hand, most stations with a significant trend are found along the mountainous littoral and Northern Adriatic (Regs 5 and 6) in the warm part of the year. They contributed to the prevailing significant trend on an annual scale. The least number of stations with a significant trend is found in the cold part of the year for MDS5 and in the winter for MxDS5.
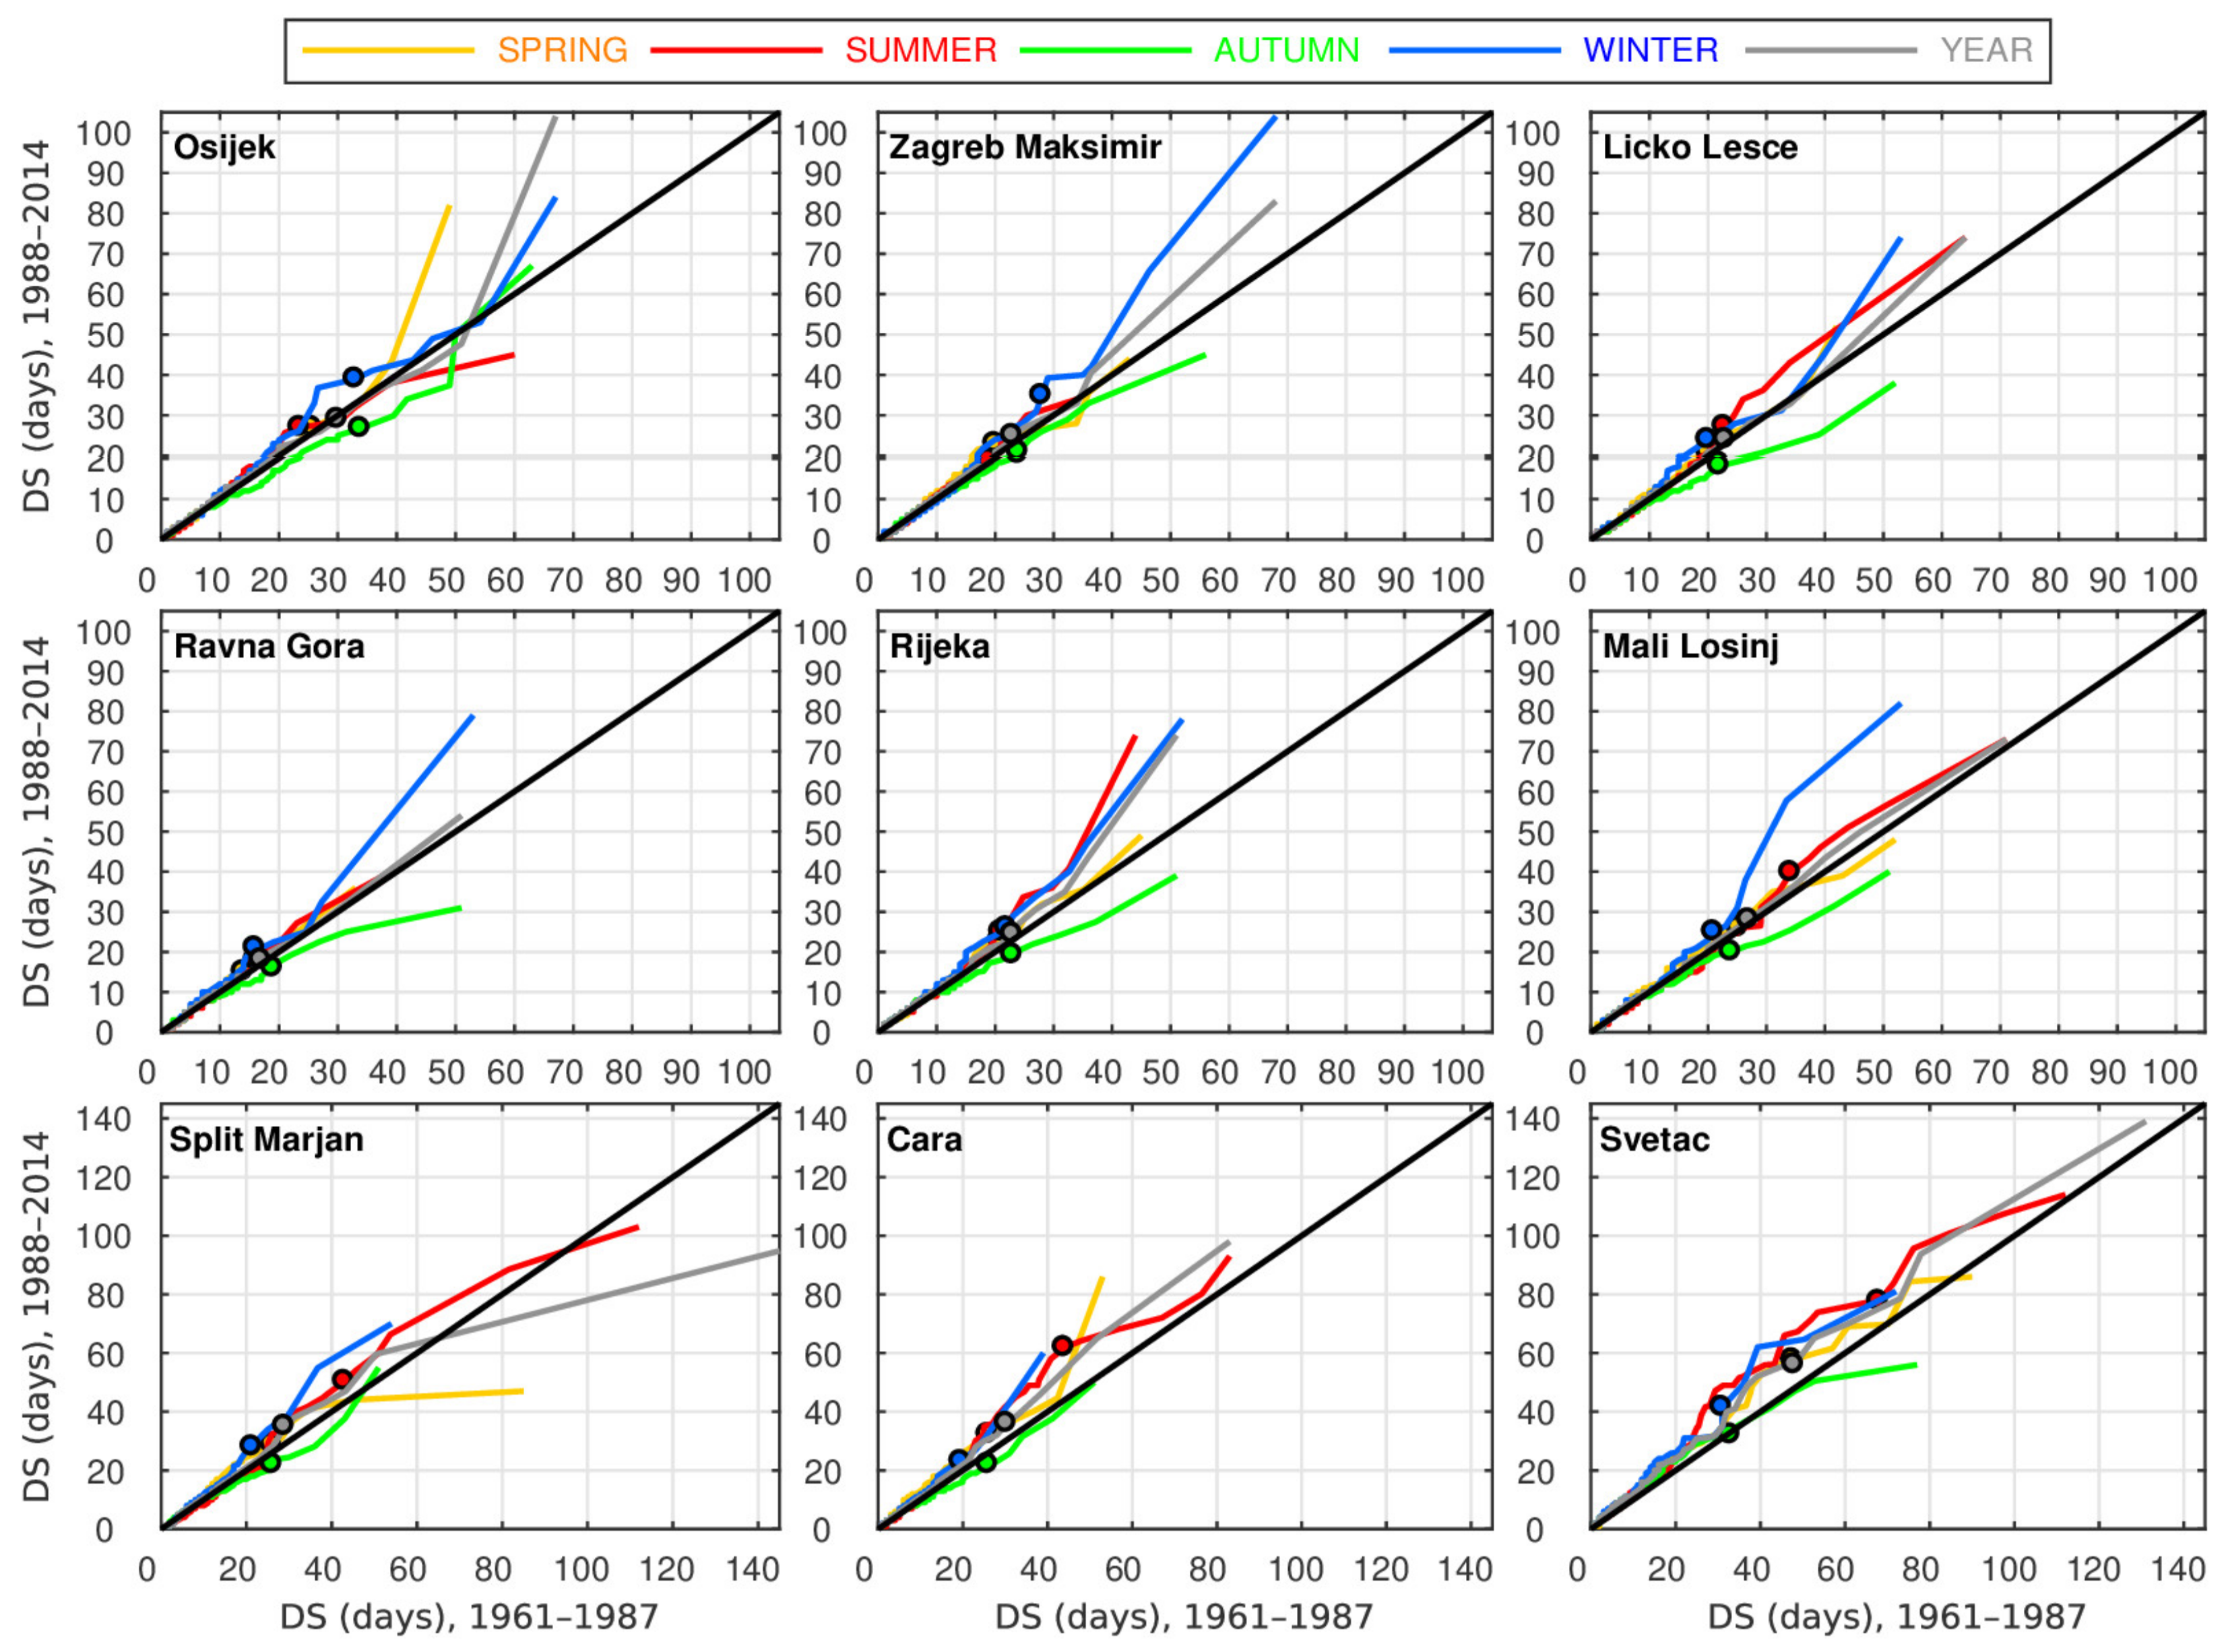
Partial trends for DS5 for a selected nine stations are presented in
Figure 6. The first seven stations are mentioned earlier (
Table 1) as the representatives of each region. Additional Southern Adriatic stations Čara (Stat 8) and Svetac (Stat 9) are included, since they revealed a prevailing significant trend in nearly all seasons. The DS5 in the recent period (1988–2014) are plotted on the vertical axis against the DS5 from the older period (1961–1987), which are plotted on the horizontal axis. In fact, the percentile values of DS5 are employed (curves of different colours) and not the DS5 themselves, because the DS series was not recorded with constant sampling intervals, as is needed to produce partial trend plots. The corresponding 95th percentile values representing long DS5 durations are indicated by dots in
Figure 6. It can be seen that, for short, dry spells, scatter diagrams are close to 45° line at all the selected stations and for all seasons, thus indicating no trend, while, for long, dry spells, the differences between the seasons and between the two selected periods increased. It should be noted here that, for some stations, the percentile values of the annual DS may overlap with one of the seasons, so not all circles in
Figure 6 are clearly distinguished (e.g., the summer 95th percentile at Svetac).
Comparing the 1961–1987 and the 1988–2014 periods, it can be seen that generally the duration of the longest DS5 was prolonged in the recent period in all seasons, except in the autumn, where a dominantly negative trend is found. On the other hand, changes in short and medium DS5 duration are not particularly expressed. However, if one looks at the extreme DS5 values (longer than 95th percentile), the summer maxima in the easternmost region (Osijek station) and maxima in the warm part of the year at the Southern Adriatic coast (Split Marjan Station) were recorded in the earlier period.
3.3. Simulations of Dry Spell Durations in Historical and Future Climate
3.3.1. Evaluation of Regional Climate Models: General Overview
Regional climate model simulations of the dry spell durations depend on the specific combination of the global and regional climate model, the chosen historical and future period and the selection of the greenhouse gas concentration scenarios. Therefore, the seasonal and annual
MDS5 durations are calculated from the three regional climate models forced at their boundaries by the four global climate models, for three different time periods and two different scenarios, as described in
Section 2.2.
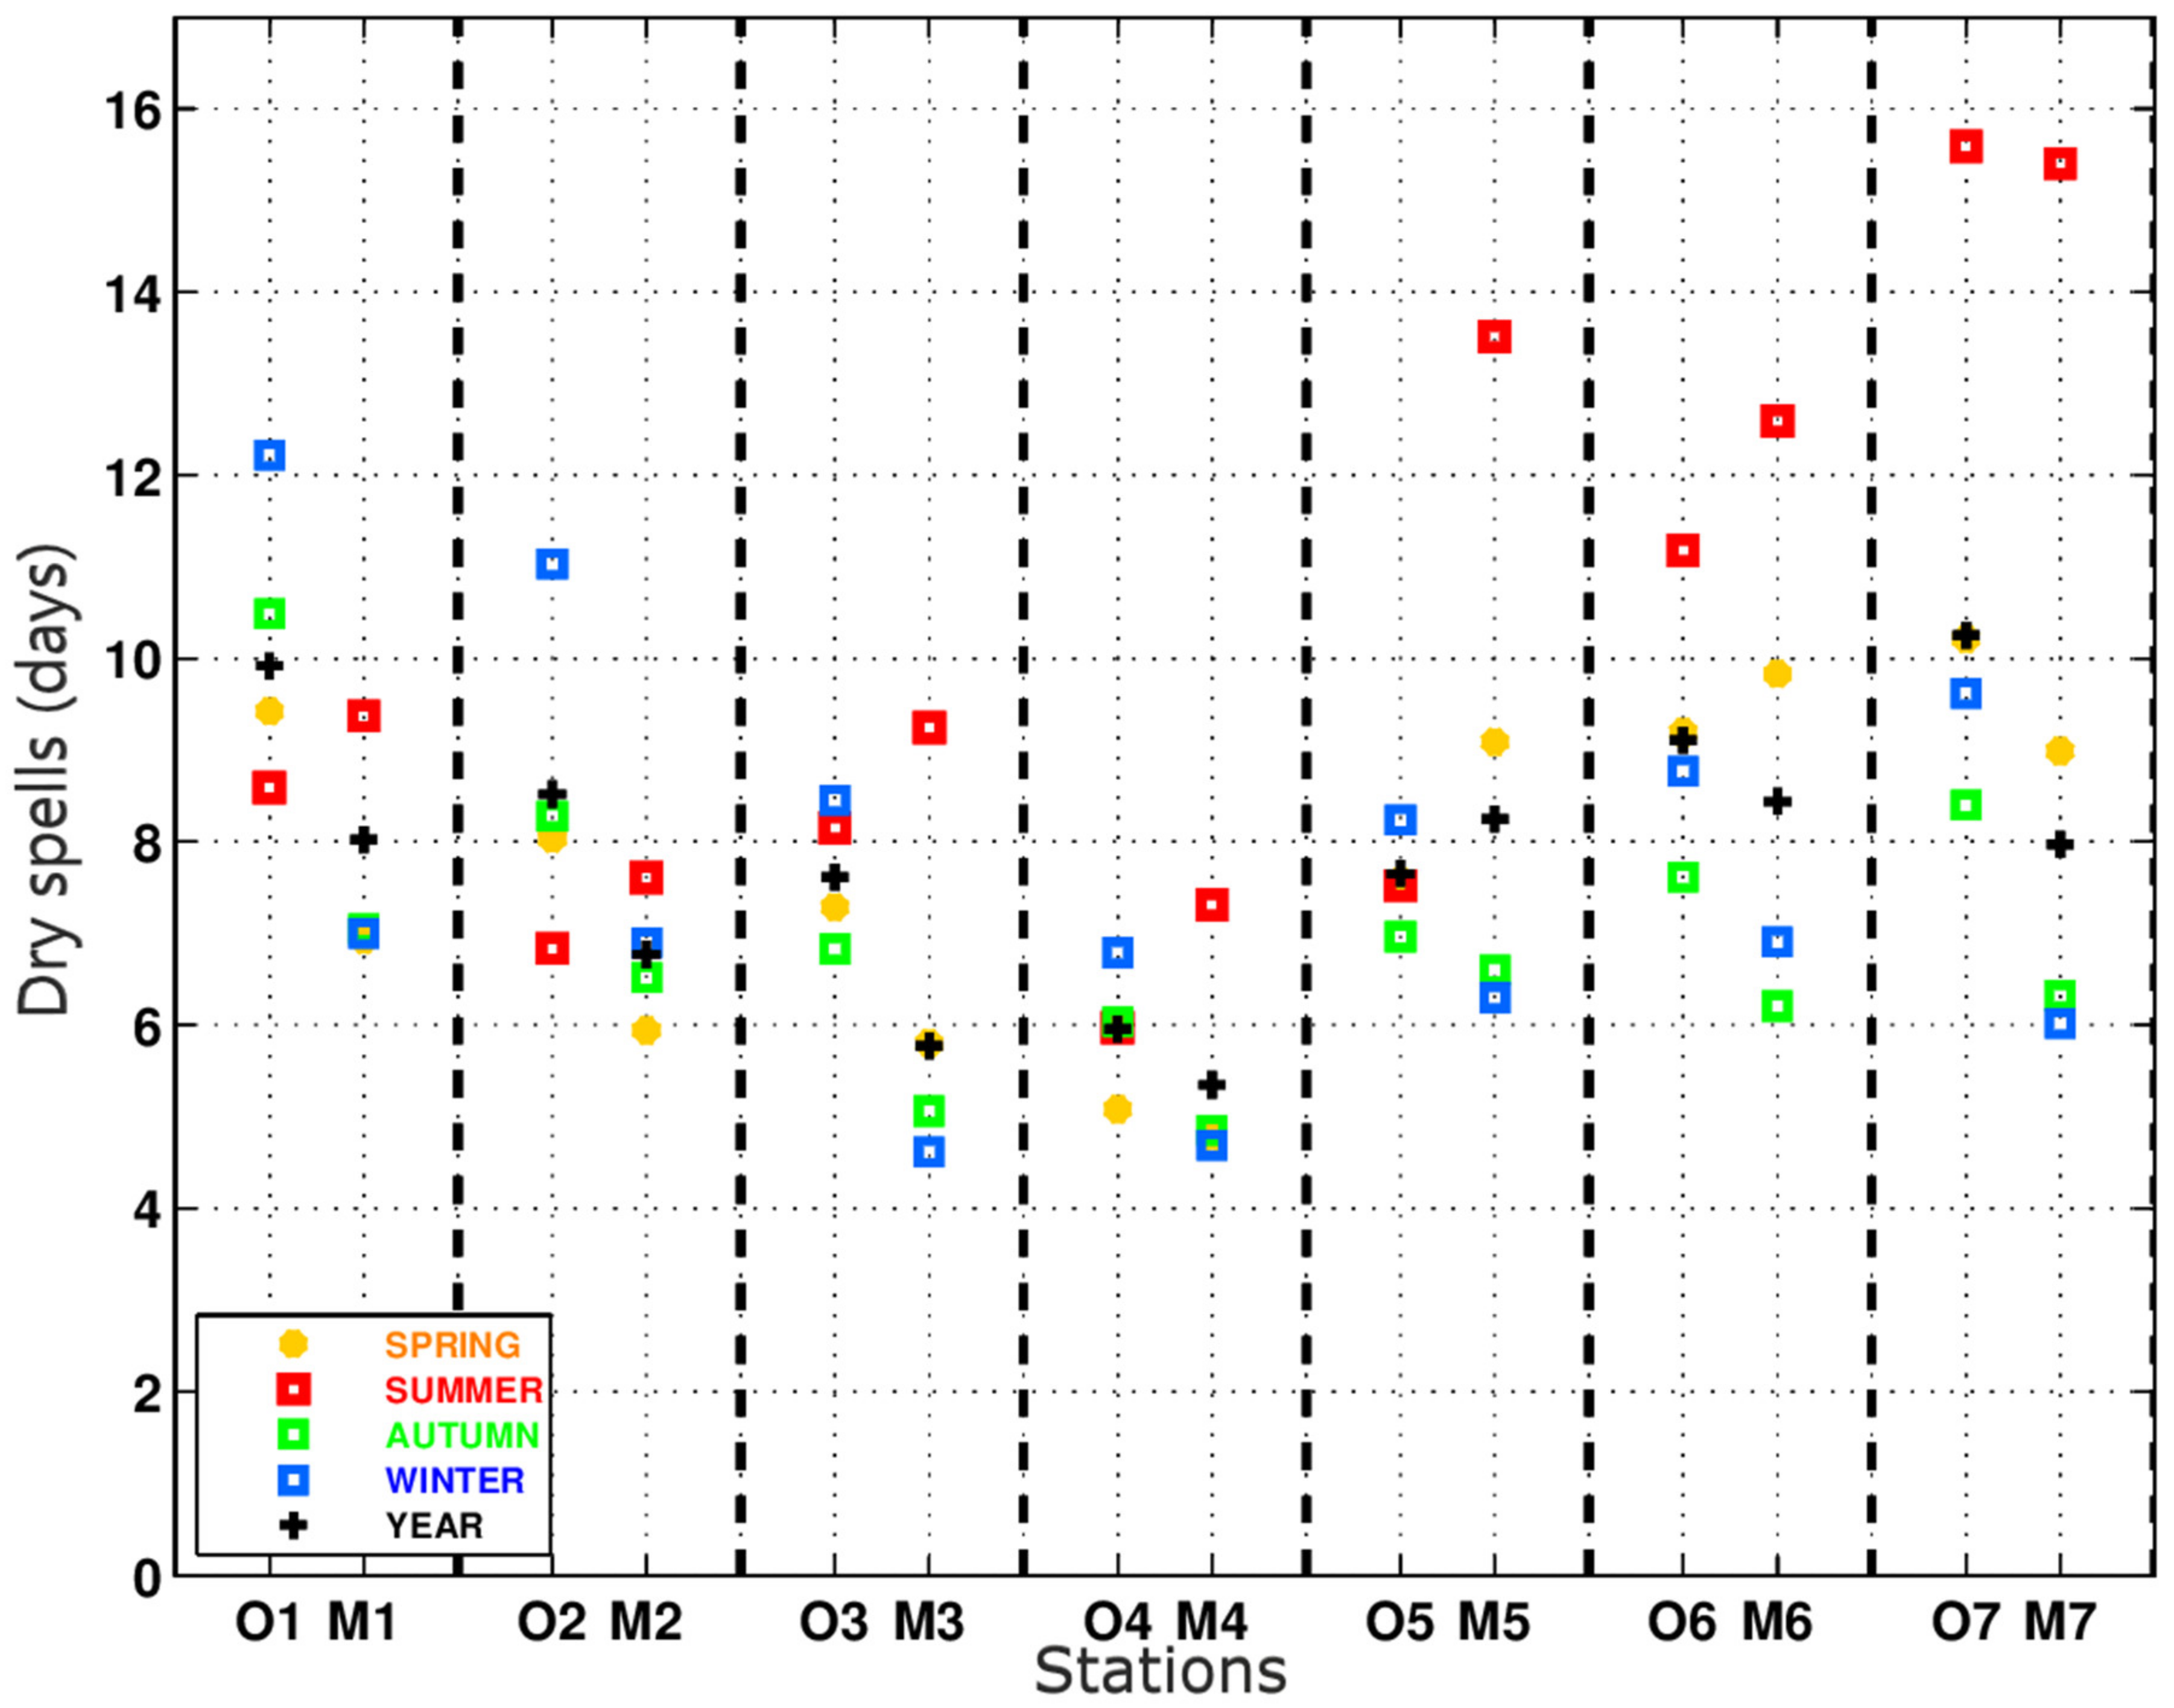
The mean duration of dry spells for the historical period 1971–2000 obtained from observations and the RCMs are compared (
Figure 7 and
Table 5). Observed values present 30-year average values of
MDS5, while the model values refer to the median of twelve different model combinations in total (four global and three regional models) of 30-year average values of
MDS5 in each specific RCM run. The median of all model combinations is used to limit the impact of the outliers in the ensemble of the twelve model simulations (these values are given in Ensemble in
Table 5), while the mean value for each RCM is equivalent in computation to approach applied in the analysis of the observed values. The observed values (O) can be compared with the model ensembles of the simulated
MDS5 for the simulated historical period (M) with respect to the seasons (
Figure 7) or with the results of an individual model (
Table 5). For the latter, the comparison can be done regarding seasons or regarding the different model combinations. In the following, the difference between the
MDS5 of three RCMs forced by each GCM is discussed.
3.3.2. Evaluation of Regional Climate Models: Seasonal Variability
In the spring, the observed
MDS5 duration is close to the simulated one at the mountainous station (Stat 4) and is well-simulated in all model combinations (
Table 5). At Stat 5 and Stat 6, the
MDS5 are overestimated by one and two days, respectively, while at the rest of the stations,
MDS5 are underestimated by one to almost three days (
Figure 7). According to the individual model results, the best estimation of
MDS5 at all stations is found for the model combination HA-CCLM4. The largest underestimation (4 days) is found at the continental Stat 1 for CN-RCA4, while the largest overestimation (9 days) is found at Stat 5 (which is located within the very complex topography) for the HA-RegCM4 combination (
Table 5).
For the summer, models overestimated the observed
MDS5 at all stations, except at the Southern Adriatic Station (Stat 7), where
MDS5s are almost the same. The largest overestimation of
MDS5 reaches six days at mountainous littoral (Stat 5), while, for the rest of the stations, an overestimation of one day is found (
Figure 7). The longest/shortest
MDS5 are simulated by regional climate models forced by HA/CN, while the most successful simulation was performed by EC-CCLM4. The largest overestimated values of
MDS5 are found in the mountainous littoral (Stat 5) for all RCA4 and RegCM4 combinations (up to 27 days), and the largest underestimation is found at the South Adriatic station (Stat 7) for all CCLM4 combinations (up to six days) (
Table 5).
In the autumn, the
MDS5 durations are generally underestimated with model simulations, most at the continental Stat 1 (by three days), while the best estimation is found at the Stat 5 (
Figure 7). Regarding the GCM–RCM combination, the largest underestimation is also found at Stat 1 (up to five days) for HA/EC/CN-RegCM4 and CN-CCLM4. However, an overestimation is found only at Stat 5, with the largest deviations obtained by HA-RegCM4 (4 days) (
Table 5).
Finally, the largest differences between the models and observations are found for the winter season, with the simulated ensemble
MDS5 underestimation ranging from two (Stat 4–6) to five days (Stat 1) (
Figure 7 and
Table 5). The smallest deviations are found for HA-RCA4, and the largest are found for all RegCM4 combinations (for Stat 1 about six days) (
Table 5).
Annual
MDS5s are underestimated by the models by up to two days at all selected stations, except at the station of Rijeka (Stat 5) where, in total,
MDS5 are only slightly overestimated (
Figure 7). The smallest deviations are found for the EC-RCA4 combination. Further, the best estimation is simulated for Stat 4, while the worst simulation is obtained for Stat 5 (6 days overestimation for HA-RegCM4 combination) (
Table 5).
Focusing only on the model results, it can be seen that the driest season at all stations is summer (red symbols in
Figure 7) with the longest
MDS5 duration along the Adriatic coast (Stat 6 and 7) and mountainous littoral (Stat 5). On the other side, the autumn and winter are the wettest seasons at all stations. At the continental and mountainous stations (Stat 1, 2 and 4), the
MDS5 in the spring and in the cold part of the year are of similar duration (
Figure 7). Although models show limitations in reproducing the details of the local dry spell duration characteristics when compared to the observations, they do reproduce the main seasonal and spatial differences over the domain.
3.3.3. Evaluation of Regional Climate Models: The Effects of the RCM and GCM Combination
In this subsection, we will briefly discuss the behaviour of specific regional models (RC4, CCLM4 and RegCM4) and the impact of boundary forcing by the CMIP5 global models (HA, EC, MP and CN).
Generally, the smallest deviation in the spring and a year are simulated by CCLM4, and in the autumn and winter by RCA4. However, in the summer, continental stations (Stat 1 and 2) are better simulated by RCA4 and Adriatic stations (Stat 5–7) by CCLM4. The smallest deviation and the smallest differences between RCM simulations are found at Stat 4, while the largest are at Stat 5 (
Table 5).
The smallest deviation for most of the stations is simulated by CCLM4 in the summer, and by RCA4 in the autumn, winter and for a year. In the spring, half of the stations are better simulated by CCLM4 and half with the RCA4, though the CCLM4 slightly underestimates the
MDS5. The smallest deviation and the smallest differences between RCM simulations are found at Stat 4 in the spring, at Stat 2 in the summer and at Stat 6 in the cold seasons and a year, while the largest are found at Stat 5 (
Table 5).
RCMs forced by MP show a similar simulation pattern to one simulated by RCMs forced by EC, though deviation values are generally lower. While CCLM4 underestimates the
MDS5 in all seasons and at all stations, RCA4 and RegCM4 overestimate them at most stations in the warm part of the year, and at Stat 5 in the autumn and a year (
Table 5).
CCLM4 and RegCM4 show similar simulation patterns of underestimation of
MDS5 in all seasons and at all stations, except at Stat 5, where RegCM4 shows overestimation. In the cold part of the year and for a year, RCA4 also shows underestimation at all stations but with a smaller amplitude than the other two RCMs. However, in the warm part of the year, no clear pattern of the errors was found. The smallest deviations and the differences between RCM simulations are generally found at Stat 4 and 6 in all seasons. Furthermore,
MDS5 at continental stations (Stat 1 and 2) in summer are very well-simulated by CCLM4 and RegCM4 (
Table 5).
In summary, we document that the quality of the RCM results depends on several factors: (1) the selection of the RCM with its specific parameterizations and dynamical core implementations, (2) the selection of GCM boundary condition and underlying strength in the climate change signals, (3) season within the year and (4) the location in space within our domain of analysis with its specific topographic setup and distance from the coast and sea impacts. In this analysis, no single RCM-GCM combination was superior in terms of low systematic errors in all cases, and the use of the ensemble is supported as the appropriate approach when estimating the local historical climate from the regional climate models.
3.3.4. Future Climate: General Overview
After examining the model systematic errors during the historical period, the climate change signal in
MDS5 duration is presented. It is determined as the differences in
MDS5 duration between the first future period, P1 (2011–2040), the second future period, P2 (2041–2070) and the historical period, P0 (1971–2000). The results are presented as a median difference between the two mentioned periods for twelve different GCM–RCM combinations of 30-year mean values of
MDS for the two emission scenarios separately (
Figure 8).
The climate change signal of the simulated MDS5 is analysed in two ways. In the first subsection, the focus is on the difference in MDS5 duration between the first future period and historical period (P1–P0) and between the second and first future period (P2–P1) for each scenario, while in the second subsection, the focus is on the difference in MDS5 duration between two scenarios (RCP8.5–RCP4.5) for each future period. The differences between −0.5 and 0.5 are considered very low in both cases.
3.3.5. Future Climate: The Amplitude of the Climate Change Signal in Different Future Periods
The difference in
MDS5 duration between P1 and P0 in spring is very small, mostly around 0, and slightly negative for both scenarios at Stat 5 and 6 (
Figure 8).
MDS5 duration increase for summer is very pronounced in simulations for all stations and is around one day for RCP4.5 and up to 2.5 days for RCP8.5 scenario (
Figure 8,
Table 6). The largest increase in
MDS5 for RCP4.5 is simulated by HA-RegCM4, around six days, and for RCP8.5 by MP-RegCM4, almost nine days. Nevertheless, a negative signal is found for RCP4.5 simulated by HA-RCA4 at Stat 5–7 for up to three days (
Table 6). On the other hand, no signal is found in autumn for neither scenario. Decreasing signal in
MDS5 duration for the winter is generally weak but slightly more negative for RCP4.5 scenario. On an annual time scale, the results are similar as for the autumn (
Figure 8).
In the spring, the largest prolongation in
MDS5 duration of almost one day is found at Stat 5 and 7 for the RCP4.5 scenario.
MDS5 durations at the rest of the stations are expected to be similar in both periods and scenarios (
Figure 8). An increase in
MDS5 duration for the summer is very pronounced for all stations. The difference between P1 and P2 for RCP4.5 is from one to two days for all stations except at the continental Stat 2, where it is lower. For RCP8.5 the prolongation is around one day at Stat 1, 3 and 5, while at other stations it is close to 0. Generally, the largest
MDS5 prolongation in P2 compared to P1 is simulated by HA for all stations, and by HA-RegCM4 combination the difference reaches 10 days at Stat 5 for RCP4.5 and seven days at Stat 6 for RCP8.5. Nevertheless, the largest shortening of
MDS5 is found at Stat 5 (by around five days) for RCP8.5 and HA-RCA4 (
Table 6). On the other hand, in autumn and winter (except at Stat 5–7 for RCP4.5), and as well on the annual basis, there are no significant differences in
MDS5 duration between two future periods for neither station nor scenario (
Figure 8).
In general, there is no clear signal in the change of
MDS5 duration in the future for spring and autumn, for summer an increasing signal is substantial, while for winter it is slightly negative. As a result, the signal for the whole year is neutral on the level of the RCM ensemble. The tendency of the dry spell duration increases during the summer season and duration decrease during the winter season is generally consistent with the mean summer precipitation decrease over southern Europe in climate model projections [
27].
3.3.6. Future Climate: The Impacts of the RCP Scenario Selection
The results of the ensemble for spring show that there is no significant difference between the two scenarios for neither future period (
Figure 8). The situation in summer is not straightforward and it differs for each period. For the first period (P1),
MDS5 duration is around one day longer for RCP8.5 than RCP4.5 at the Adriatic coastal stations (Stat 6 and 7), while for other stations no significant changes were detected. In the second period (P2),
MDS5 duration is from one (Stat 5 and 6) to two days (Stat 7) shorter for RCP8.5 than RCP4.5 (
Figure 8,
Table 6). The largest difference is found for Stat 5 and HA-RCA4 for which the
MDS5 duration is expected to be nine days longer for RCP8.5 than RCP4.5 in the first period, and around 12 days shorter in the second period compared to the historical period. The smallest differences in
MDS5 duration between P1/P2 and P0, as well as between scenarios are simulated by CN (
Table 6). The difference between scenarios in autumn is not significant for neither period. In winter, an increase of around one day is marked for the first period at Stat 5. Besides that, no notable difference is recorded. Generally, on the annual basis, no significant differences in
MDS5 durations between the two scenarios period is found in the future (
Figure 8).
4. Discussion and Conclusions
The analysis of mean and maximum dry spells defined with the 5 mm daily precipitation threshold was performed on a seasonal and annual basis for seven regions in Croatia during the period 1961–2015. Generally, the shortest
MDS5 occur in the mountainous region (Reg 4), and the longest
MDS5 in the continental region in the cold part of the year (autumn, winter), and in the Adriatic region in the warm part of the year (spring, summer). While the distribution of
MDS5 is generally uniform within each region, for
MxDS5, the larger differences between stations within each region are apparent, emphasizing the spatial and temporal variability of precipitation pattern. The reason for that lies mostly in the prevailing circulation patterns which pose a different influence on the dry spell’s duration [
7,
36].
An increasing trend in the observed
MDS5 was found in the warm part of the year (spring and summer), which is significant in the mountainous littoral (Reg 5) and North Adriatic coastal region (Reg 6). On the other hand, no clear trend in
MDS5 was found in the cold part of the year. Consequently, on the annual basis, an increase of
MDS5 prevailed, being statistically significant in Reg 5 and Reg 6. These results suggest that positive trends in
MDS5 found in spring for the period 1961–2000 by Cindrić et al. [
11] continued in the following 15 years. However, the pronounced summer increase of
MDS5 along the Adriatic coast detected here was not observed in the previous period. It confirms drying tendencies in the Mediterranean region [
9,
37].
An increasing trend in
MxDS5 was also found in the warm part of the year, and it was particularly pronounced along the Adriatic coast (Reg 5–7). A coherent negative trend pattern of
MxDS5 during autumn was found here similarly as in Cindrić et al. [
11]. In the recent period, the autumn negative trend is significant in the mountainous region (Reg 4) suggesting an increase in the frequency of wet days with cumulative precipitation reaching 5 mm. A negative trend in
MxDS in autumn was also found at 98% of the stations in the Rhine basin with a large number of significant trends [
38]. In winter there was no clear trend. Overall, the obtained results support the estimates of Heinrich and Gobiet [
39] that southern Europe is most probably facing an increased risk of longer, more frequent, severe and, also, widespread droughts.
Breinl et al. [
14] analysed the trends in annual extreme dry (and wet) spells with a daily precipitation threshold of 0.1 mm on a global scale. From their results for Europe, there is no clear sign in the trend of DS in Croatia but there are indications of longer DS along Adriatic and shorter durations in the continental region, which is in accordance with our results, even though the definitions of DS are different.
The results of partial trend methodology revealed an increase in the very long
DS5 (above 90th percentile) in the recent half of the analysed 55-year period in all seasons, except in autumn. The largest prolongation is found in winter at continental stations (Stat 1, 2, 4 and 5) and in summer along the Adriatic coast (Stat 6–9) and the Central hinterland (Stat 3), while the largest shortening is found in autumn. One can also notice that
DS5 duration tend to be generally longer at Southern Adriatic stations (Stat 7–9). On the other hand, large differences in short and medium
DS5 duration between the two analysed periods were not detected. These prolongations and shortening in a particular season are in line with the trend results for
MDS5 and
MxDS5 for the whole 55-year period, pointing that the pronounced trends are mainly affected by the longest
DS5 duration. Since the station of Svetac is located on a small, isolated island Svetac in the Middle Adriatic, it reflects a typical decreasing precipitation trend found in the Mediterranean basin [
37]. Furthermore, a positive trend of the maximum
DS5 implies a long absence of precipitation which leads to an increase in atmospheric evaporation and soil water demand causing an increase in drought severity and its impact on various environmental systems ([
9] and reference therein).
MDS5 simulated by the RCM ensemble is the closest to the observations at the mountainous station (Stat 4) in spring and a year, at Southern Adriatic station (Stat 7) in summer, at the mountainous littoral (Stat 5) in autumn and Northern Adriatic station (Stat 6) in winter. Although the seasonality of each region is apparent in the observations, the climate model simulations present summer as the driest season at all stations with the longest MDS5 duration along the Adriatic coast (Stat 6 and 7) and mountainous littoral (Stat 5). On the other side, autumn and winter in models are the wettest seasons at coastal stations, confirming the level of realism in applied models.
The most successful model combination depends on season and location, and no RCM-GCM combination outperforms in all cases. The smallest differences between RCMs are found for central hinterland and mountainous region (Stat 3 and 4) for all seasons and a year, while for the mountainous littoral (Stat 5) results vary the most. One of the reasons for that is the fact that mountainous littoral (Stat 5), and as well Adriatic coastal region (Stat 6 and 7) are directly connected to the Adriatic Sea. Since the model resolution is 12.5 km, the models’ results are definitely influenced by the complex orography and land-sea contrast.
The projected summer increase of
MDS5 duration is pronounced for all stations (
Figure 8), especially in the simulations of the HA-CCLM4 and HA-RegCM4 model combinations, with the largest increase in
MDS5 being six and seven days in the first future period (P1–P0) and ten and seven days in the second future period (P2–P1;
Table 6). The longest
MDS5 are in both cases simulated by HA, which is one of the generally dry and warm CMIP5 models in terms of the systematic errors during summer [
40,
41]. The increase in
MDS5 in summer between two 30 years periods (1961–1990 and 2070–2099) for the entire southern part of Europe and much of central Europe as well as the fact that the length of hot and dry spells is particularly strong and statistically significant for southern Europe is also found in Kundzewicz et al. [
42]. An increase in
MDS5 durations in summer is also in agreement with the general reduction of the summer total precipitation amount in projections in these regional models [
27]. However, it can be noticed that the summer increase depends more on the selection of future periods than on the scenario at the selected locations. Decreasing signal in
MDS5 duration for winter is weak (
Figure 8), but it is likely connected with an increase in the total mean daily precipitation projections for winter (e.g., [
43]). For spring, autumn and year there is no clear climate change signal during the two analysed future periods, although results generally show a small increase in
MDS5 duration for the second period (
Figure 8).
One of the key issues of simulating precipitation in climate models is the representation of cloud and precipitation processes since they occur at scales smaller than the resolution of current GCMs and RCMs and therefore are very difficult to simulate [
44]. Differences between observations and different GCM–RCM simulations are larger in the warm part than in the cold part of the year (
Table 5). Differences in future periods between simulations of a single RCM (forced by different GCMs) are smaller in summer than in winter when the smaller differences are found between RCMs forced by a single GCM choice (not shown). This suggests that the RCM’s formulation and parameterizations of small-scale processes are more important in the warm part of the year, especially in summer, while the large-scale processes in GCMs are more dominant in the cold part of the year, especially in winter [
43]. In some regions, e.g., in the Alps, a connection between a decreasing trend in the length of very long (above 95th percentile) DS and the increasing number of all DS was found [
27]. On the other hand, in the Mediterranean, some regions (e.g., Iberian Peninsula) are affected by an increase both in the number and the duration of the very long dry spell events by the end of the twenty-first century, while other sub-regions (e.g., Balkans) are affected by an increase in the number of the very long dry spell events, but not in their duration [
12].
These results motivate and encourage us to further analyse a connection between changes in the length and frequency of DS in Croatia. In future studies, an analysis of a connection between governing weather types and the length of dry spells would also be of great interest.


