Abstract
The air quality of Handan, a typical industrial city in China, has been significantly improved through atmospheric pollution control, except for ozone (O3) pollution. We found that, in summer, emissions of anthropogenic volatile organic compounds (VOCs) and NOx decreased yearly in Handan, but the O3 concentration significantly declined yearly during 2013–2015, whereas it experienced worsening O3 pollution after 2015. Therefore, we used the Weather Research and Forecasting Community Multiscale Air Quality (WRF–CMAQ) modeling system to simulate the influence of the meteorological conditions and emission changes in Handan during the typical period (June) of O3 pollution in 2013–2018. For benchmarked June 2013, the results showed that the reduction of the O3 concentration in June of 2014–2016 was mainly caused by emission reduction, while in June of 2017–2018, the combined effect of changes in emissions and meteorological conditions led to aggravated O3 pollution. Sensitivity analysis indicated that combined VOCs and NOx emission controls would effectively reduce incremental O3 formation when the abatement ratio of VOCs/NOx should be no less than 0.84, and we found that VOCs reduction would continusouly bring about O3 decreases under various NOx reductions, but its positive sensitivity to O3 would become smaller with NOx reduction. However, the positive influence of NOx reduction on O3 would happen until NOx reduction exceeding 45–60%. The findings will be helpful in formulating emission control strategies for coping with O3 pollution in an industrial city.
1. Introduction
With the accelerated pace of economic globalization and regional economic integration, urbanization and industrialization in China have substantially progressed, which has led to an increase in anthropogenic emissions and atmospheric contamination from economically developed regions; in particular, regional complex air pollution characterized by fine particulate matter (PM2.5) and ozone (O3) has become increasingly prominent [1]. Since 2013, in order to improve the air quality in Chinese cities and weaken the consequences of air pollution on climate and the environment, the “Action plan for the prevention and control of air pollution” of the State Department has continuously improved the ambient air quality. These measures have achieved significant success; the annual average PM2.5 declined 30–50% across China during 2013–2018 [2]. In contrast, during the same period, surface O3 was the only pollutant with a continuously increasing annual average concentration [3,4]. According to the China Environmental Status Bulletin, the 90th percentile daily maximum 8 h average ozone concentration increased from 139 μg·m−3 in 2013 to 151 μg·m−3 in 2018, and approximately 1000 stations in China experienced serious O3 pollution in the summer of 2013–2017 [5]. The O3 concentration not only in China, but also in the United States [6], Europe [7], and many parts of the world, has shown consecutive growth in the last few years [8]. Surface O3 has a detrimental effect on human health [9] and the ecosystem [10,11]. At present, the annual mortality caused by surface O3 pollution is more than 50,000 deaths in China [12]. In addition, O3 is a greenhouse gas that has a detrimental effect on the global climate [13]. Therefore, effective reduction of O3 pollution is a new challenge for air pollution control.
Surface O3 is an important secondary air pollutant, serious O3 pollution has been associated with a large amount of precursor emissions, and is formed by a series of chemical reactions involving nitrogen oxides (NOx), volatile organic compounds (VOCs), and carbon monoxide (CO) in the presence of sunlight [14]. Meanwhile, meteorological conditions play an important role in modulating O3 concentrations, not only through transport but also by affecting natural emissions and chemical rates [15], which are an important factor to influence O3 concentration. Photochemical production of O3 shows a highly non-linear chemical response with VOCs and NOx, which makes the O3 formation in the atmosphere more complicated [16,17]. Wang et al. [17] indicated that the ratio of the rates of decrease of VOCs and NOx (about 1.1) is inefficient in reducing O3 production in Beijing; Zhang et al. [18] suggesting that the minimum abatement ratio of VOCs/NOx should be higher than 0.72 to prevent the increase in maximum O3 concentration in Shanghai. The O3 concentration may even increase if there is an improper ratio of VOC to NOx emission reduction [19,20]. Therefore, it is crucial to understand the chemical properties of photochemical O3 before formulating effective O3 control strategies.
The Beijing–Tianjin–Hebei (BTH) urban agglomeration is an important core area of the economic development of northern China. In summer there is strong generation of O3 in the BTH region, and the northern and western mountain areas of BTH generate and store high O3 concentration [21]. The BTH region has the highest anthropogenic emissions in China, in which the regional and complex air pollution characteristics have emerged by superposition of high concentrations of O3 and PM2.5 [22]. In particular, the daily maximum 8 h average ozone (MDA8 O3) concentration reached up to 199 μg·m−3 in 2018, which was 24.4% higher than the State Ambient Air Quality Secondary Standard for Ozone (160 μg·m−3) in China. Handan is a typical industrial city in China located in the southernmost part of the BTH region. Energy-intensive and highly polluting iron and steel industries are the major industrial structures, and coal is the main energy source in this region. The total emissions of O3 precursors (VOCs and NOx) in Handan are large [23]. Among the 13 cities in the BTH, Handan ranks in the top three in terms of precursor emissions, accounting for approximately 20% of those in the BTH. From 2013 to 2018, Handan strictly implemented emission reduction policies, and the pollutant emissions decreased over these years. From 2014 to 2015, the 90th percentile MDA8 O3 concentration in downtown Handan was significantly reduced, but in 2016, the 90th percentile MDA8 O3 concentration in downtown Handan increased significantly, reaching 161 μg·m−3. Since then, the 90th percentile MDA8 O3 concentration has increased annually, reaching 201 μg·m−3 in 2018. The comprehensive management of O3 pollution in Handan is facing serious difficulties and challenges.
Regional O3 generation is affected by the combined effects of meteorological conditions and precursor emissions [24,25]. Some research has indicated that precursor emissions were the main cause of the increase of O3 concentration in China from 2013 to 2017 [15]. However, meteorological and pollutant emissions have regional characteristics, in this study, based on the high spatial and temporal resolution emission inventory in the BTH region and the Weather Research and Forecasting Community Multiscale Air Quality (WRF-CMAQ) modeling system, the meteorological conditions and emission changes in downtown Handan during the typical period (June) of O3 pollution in 2013–2018 were quantitatively evaluated, and the key factors influencing the O3 concentration evolution and O3 formation sensitivity in downtown Handan were determined based on the model simulation method. Meanwhile we designed 36 precursors reduction scenarios based on 2018 emissions and further simulated O3 over downtown Handan under these reduction scenarios, to understand the sensitivity of precursors and determine the suitable proportion of VOC and NOx emission reduction in downtown Handan.
2. Data and Methods
2.1. Observation Data
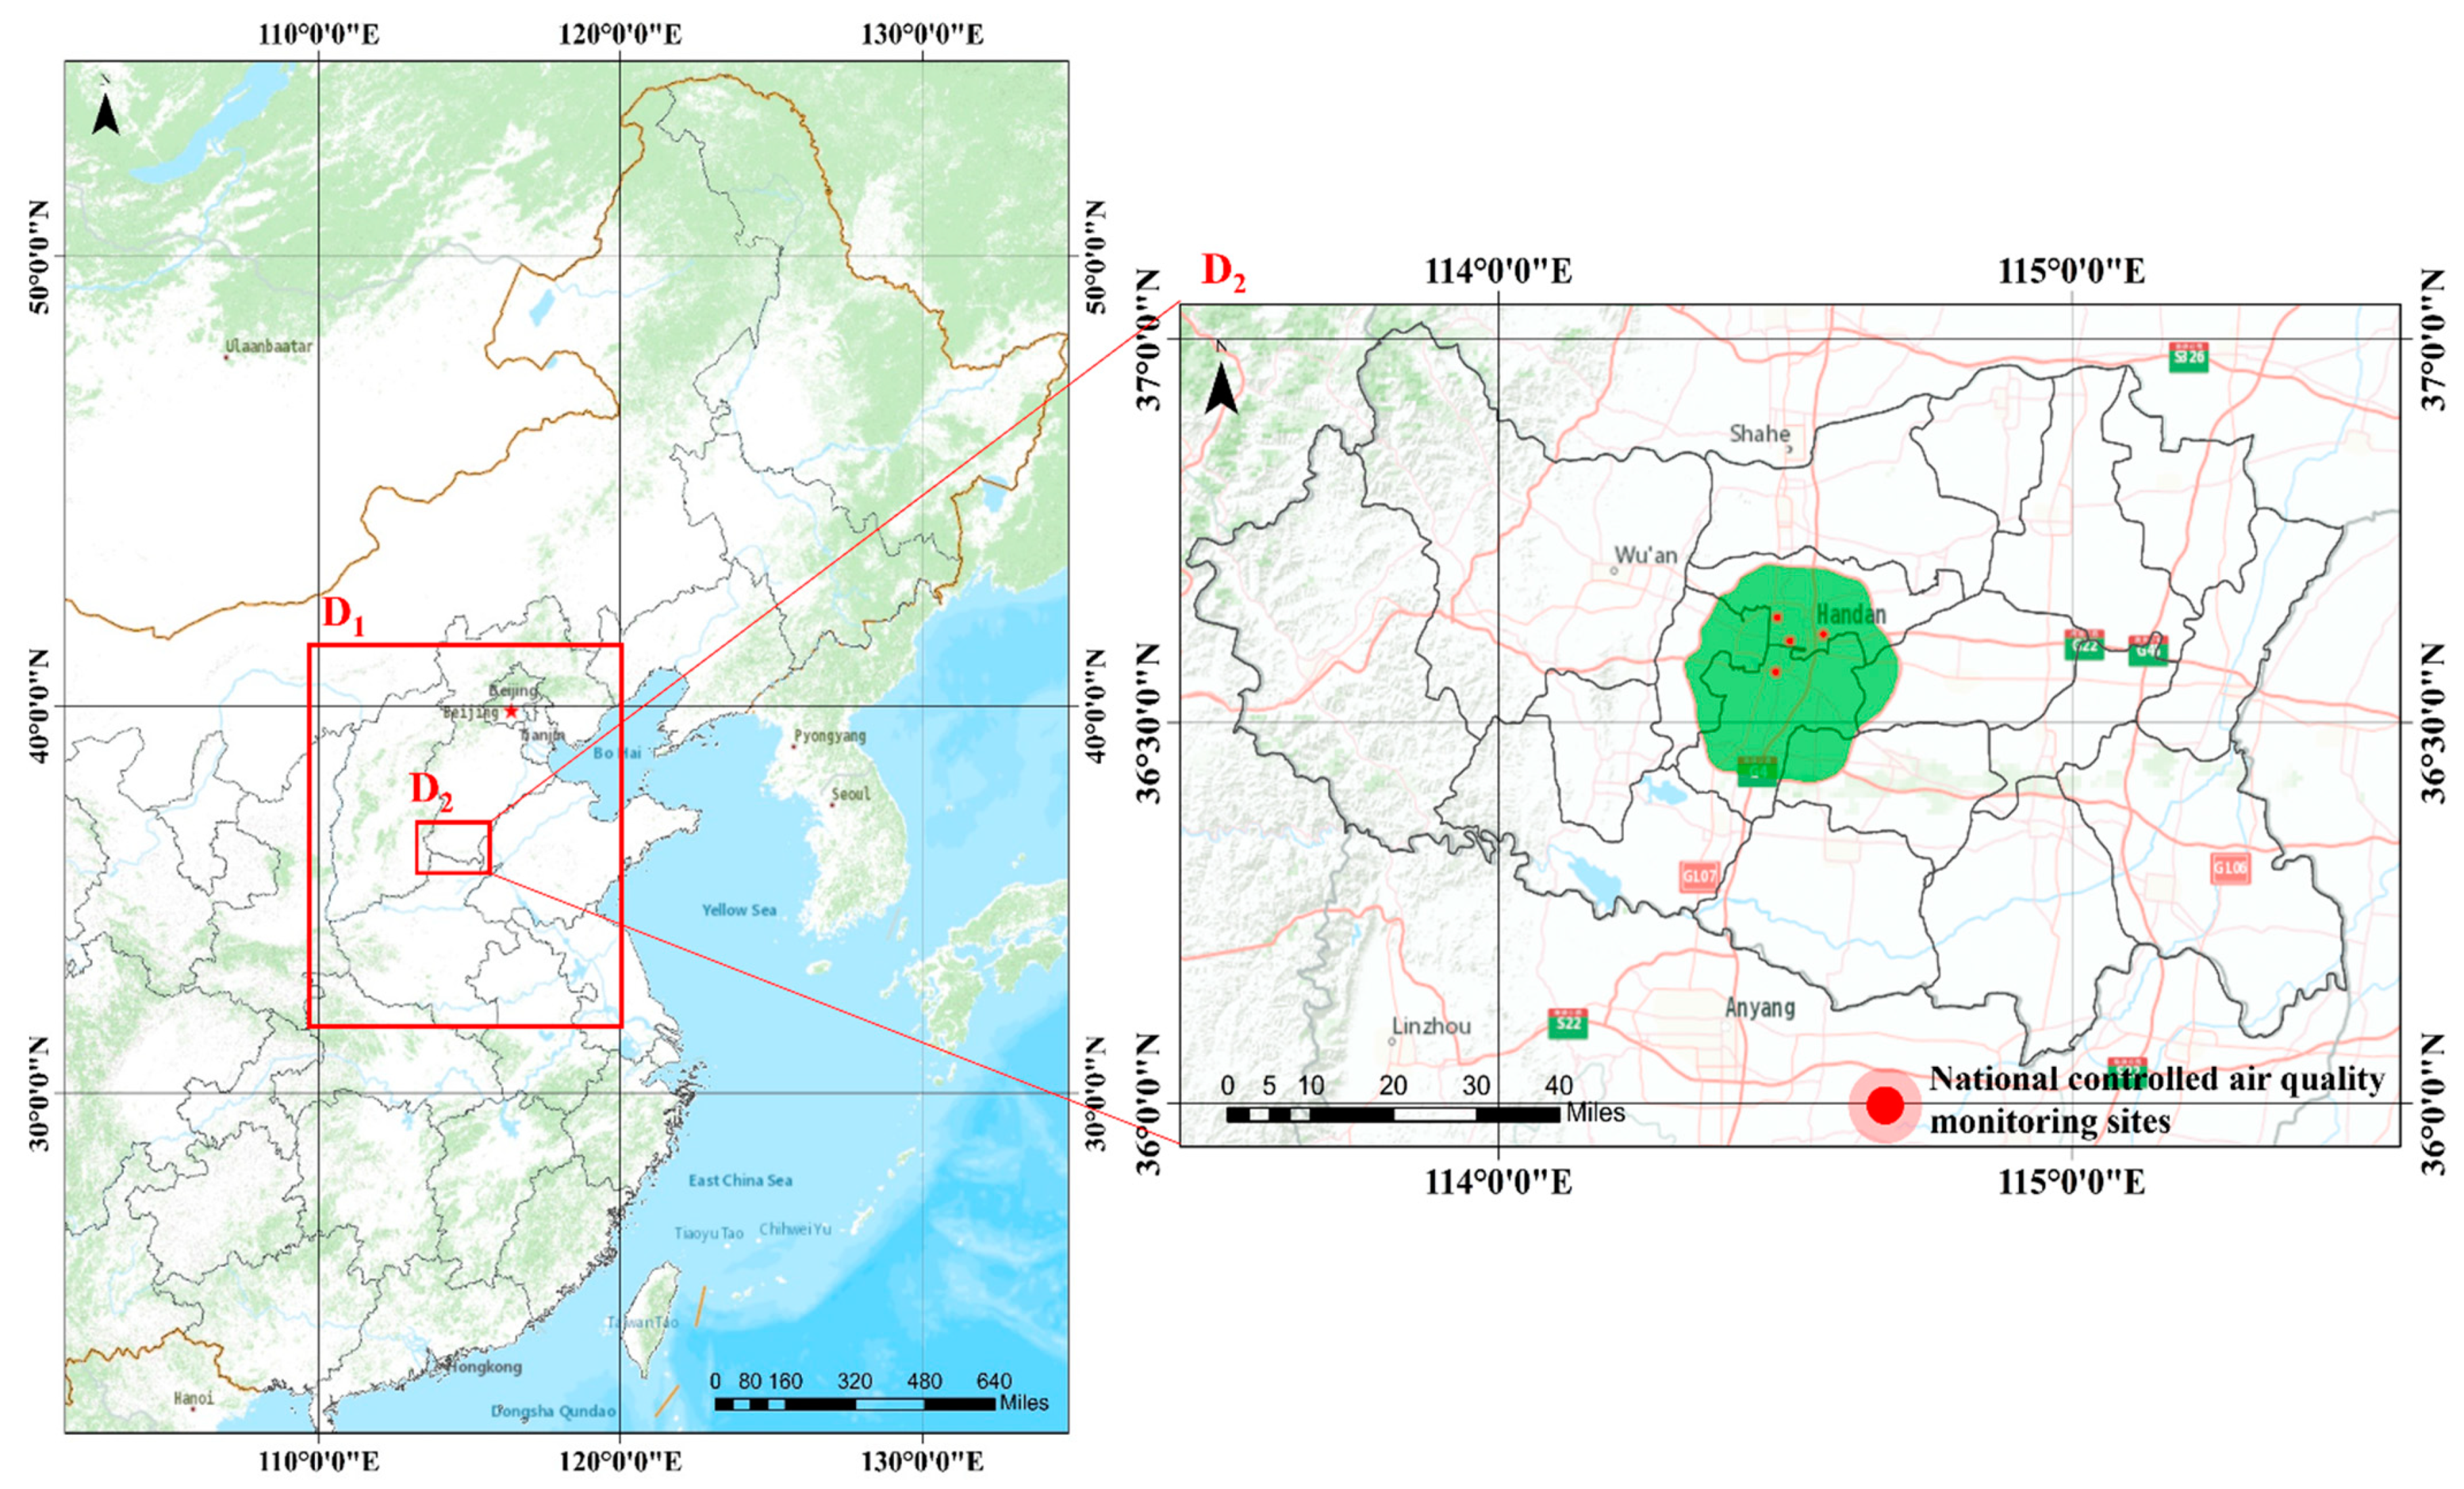
In this study, pollutant observation data with a temporal resolution of 1 h were obtained in 2013–2018 from the observed urban air quality data released in real time by the China National Environmental Monitoring Center (http://106.37.208.233:20035, accessed on 16 February 2021) [26], which is composed of the average values of 4 national controlled air quality monitoring sites in the Handan (Figure 1) and average values of 14 national controlled air quality monitoring sites in the Beijing. Every 3 h of observation data from the Handan Meteorological Station (meteorological station 53892) were adopted based on the Meteorological Information Comprehensive Analysis and Processing System, including parameters such as temperature and wind speed.
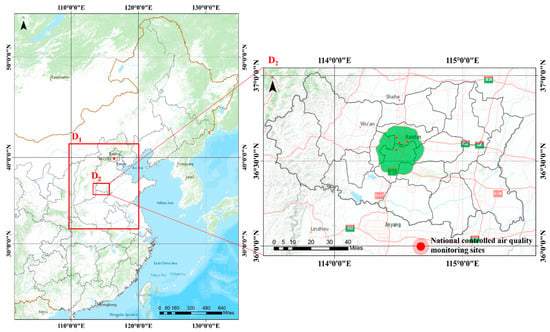
Figure 1.
Two nested simulation domains of Community Multiscale Air Quality (CMAQ) model and distribution of national controlled air quality monitoring sites in Handan. Black contour lines show the political boundaries of Handan (D2), green areas are downtown Handan (D2).
2.2. Model Configuration
In this study, an integrated WRF-CMAQ modeling system was used to quantify the impact of meteorological conditions and precursor emissions on O3 pollution and assess the O3 formation sensitivity. The air quality model, including North China, was established by CMAQ v5.0.1, which is a widely used O3 simulation tool. The CMAQ simulation was performed over two nested domains (Figure 1). The outermost domain (D1) covers most areas of the BTH urban agglomeration and surrounding areas (including most areas of Shanxi, Shandong, Henan, Inner Mongolia, and other provinces) at a 9 km × 9 km grid resolution. The innermost domain (D2) covers the entire Handan region and its surrounding areas at a 3 km × 3 km grid resolution. The meteorological input data files of CMAQ were provided by the WRFv3.5.1. The National Center for Environmental Prediction (NCEP)’s Final Operational Global Analysis (FNL) data with a horizontal resolution of 1° × 1° at every 6 h were used to drive the WRF model. The output files of the WRF model were processed for the CMAQ adopted Meteorology Chemistry Interface Processor program. In addition, the domains of the WRF model were slightly greater than those of CMAQ. A detailed parameterization scheme is described in Appendix A (Table A1).
Moreover, downtown Handan was selected as the receptor area for analysis and discussion. The anthropogenic emission data of gaseous pollutants (SO2, NOx, CH4, CO, NH3 and VOCs groups) and particulate matter (organic carbon, elemental carbon, PM2.5 and PM10) of the BTH region for 2013–2018 were based on the research results of this research group, and biogenic emission were calculated from the Model of Emission of Gases and Aerosols from Nature (MEGAN) [27]. The high-resolution emission inventory of the BTH region specific establishment method can refer to the previous research results of the research team [28,29], which was established based on the county level, and the evaluation of Zhou et al. [30] of this emission inventory had relatively satisfactory performance. The emission inventory of the rest of the region was taken from MEIC emission inventory dataset (http://www.meicmodel.org/, accessed on 10 November 2020). This was updated according to relevant policies released by the local government. The WRF-CMAQ model startup time was advanced by 72 h to eliminate the influence of clean initial conditions and the default clean profiles are used as the initial boundary chemical conditions. The model validation results show that WRF-CMAQ model exhibited an acceptable performance for O3. More details about model verification can see Appendix A (Table A2 and Table A3).
2.3. Quantitative Assessment Method of Meteorological and Emission Impacts
The WRF-CMAQ model simulation system and emission inventory of Handan and its surrounding areas from June of 2013–2018 were used as the input file to establish a quantitative assessment method for the impact of emissions and meteorology on the evolution of O3 pollution. The critical factor leading to the change in O3 pollution in the typical period of O3 pollution during June of 2013–2018 in downtown Handan was identified to quantify the contribution of O3 precursors and meteorological factors to the evolution of O3 pollution in downtown Handan and finally to provide scientific support for regional O3 pollution control.
2.3.1. Simulation Scenarios Settings
In this study, the typical period of O3 pollution during June of 2013–2018 in downtown Handan was selected as the simulation period. Two sets of simulation scenarios were set up to quantitatively evaluate the impact of meteorological conditions and emissions. Simulation scenarios A were used as the base scenario, and the corresponding meteorological conditions and emissions from June 2013 to 2018 were used as the input variables of the model. Scenarios A results were evaluated using observed data to estimate the performance of our model simulation. In scenarios B, June 2013 was selected as a constant meteorological field, and the corresponding emissions from June 2013 to 2018 were adopted as the input variables of the model (in order to ensure that the simulation results better reflect the impact of meteorological conditions on the evolution of O3 pollution, the wind speed and temperature change from June of 2013–2018 were comprehensively considered). June 2013, which had a weak impact of meteorological conditions on O3 pollution, was selected as the constant meteorological field of scenarios B. Table 1 shows the specific scheme settings for the simulation scenarios.

Table 1.
Model simulation scheme.
2.3.2. Quantitative Calculation Method of Meteorology and Emission Impacts
In this study, the evolution trend line of O3 pollution in downtown Handan under two groups of simulation scenarios was obtained by Formulas (1) and (2), and the MDA8 O3 concentration was selected as the quantitative evaluation index to quantify the impact of simultaneous and single emission changes in meteorology and emissions on the evolution of O3 pollution.
where M represents the quantification result of meteorological conditions change on the interannual variation in the MDA8 O3 concentration, E represents the quantification result of emission change on the interannual variation in the MDA8 O3 concentration, SA represents the MDA8 O3 concentration in downtown Handan under simulation scenario A, SB represents the MDA8 O3 concentration in downtown Handan under simulation scenario B, and i represents one year of 2013–2018.
2.4. Sensitivity Experimentation
In this study, the brute force method was used to evaluate the O3 formation sensitivity in downtown Handan [25,31]. Based on June 2018 emissions condition, two scenarios of 30% VOC and 30% NOx emission reduction were designed and additionally simulated for O3 of June 2018, to determine VOCs-NOx-O3 sensitivity over downtown Handan. The net increment of MDA8 O3 concentration of the two simulated scenarios was calculated by making difference with the benchmark scenario, marked them as ΔOVOC and ΔONOx, respectively. According to the net increment of MDA8 O3 concentration in the simulated scenarios, the basis for sensitivity analysis of O3 formation in downtown Handan was determined as follows: ΔONOx ≤ −4 μg·m−3 and ΔONOx < 2 × ΔOVOC is an NOx-sensitive regime ΔOVOC ≤ −4 μg·m−3 and ΔOVOC < 2 × ΔONOx is a VOC-sensitive regime; ΔONOx ≤ −4 μg·m−3 and ΔOVOC ≤ −4 μg·m−3, while the difference between them is less than 2 times, is an NOx and VOC-sensitive regime; −4 μg·m−3 < ΔONOx < 4 μg·m−3 or −4 μg·m−3 < ΔOVOC < 4 μg·m−3 is an insensitive regime; and ΔONOx ≥ 4 μg·m−3 and 0 ≥ ΔOVOC > −4 μg·m−3 is an NOx-titration regime. A positive number indicates an increase in the MDA8 O3 concentration and a negative number indicates a decrease in the MDA8 O3 concentration.
3. Results and Discussion
3.1. Temporal Trends of Ozone Pollution in Downtown Handan
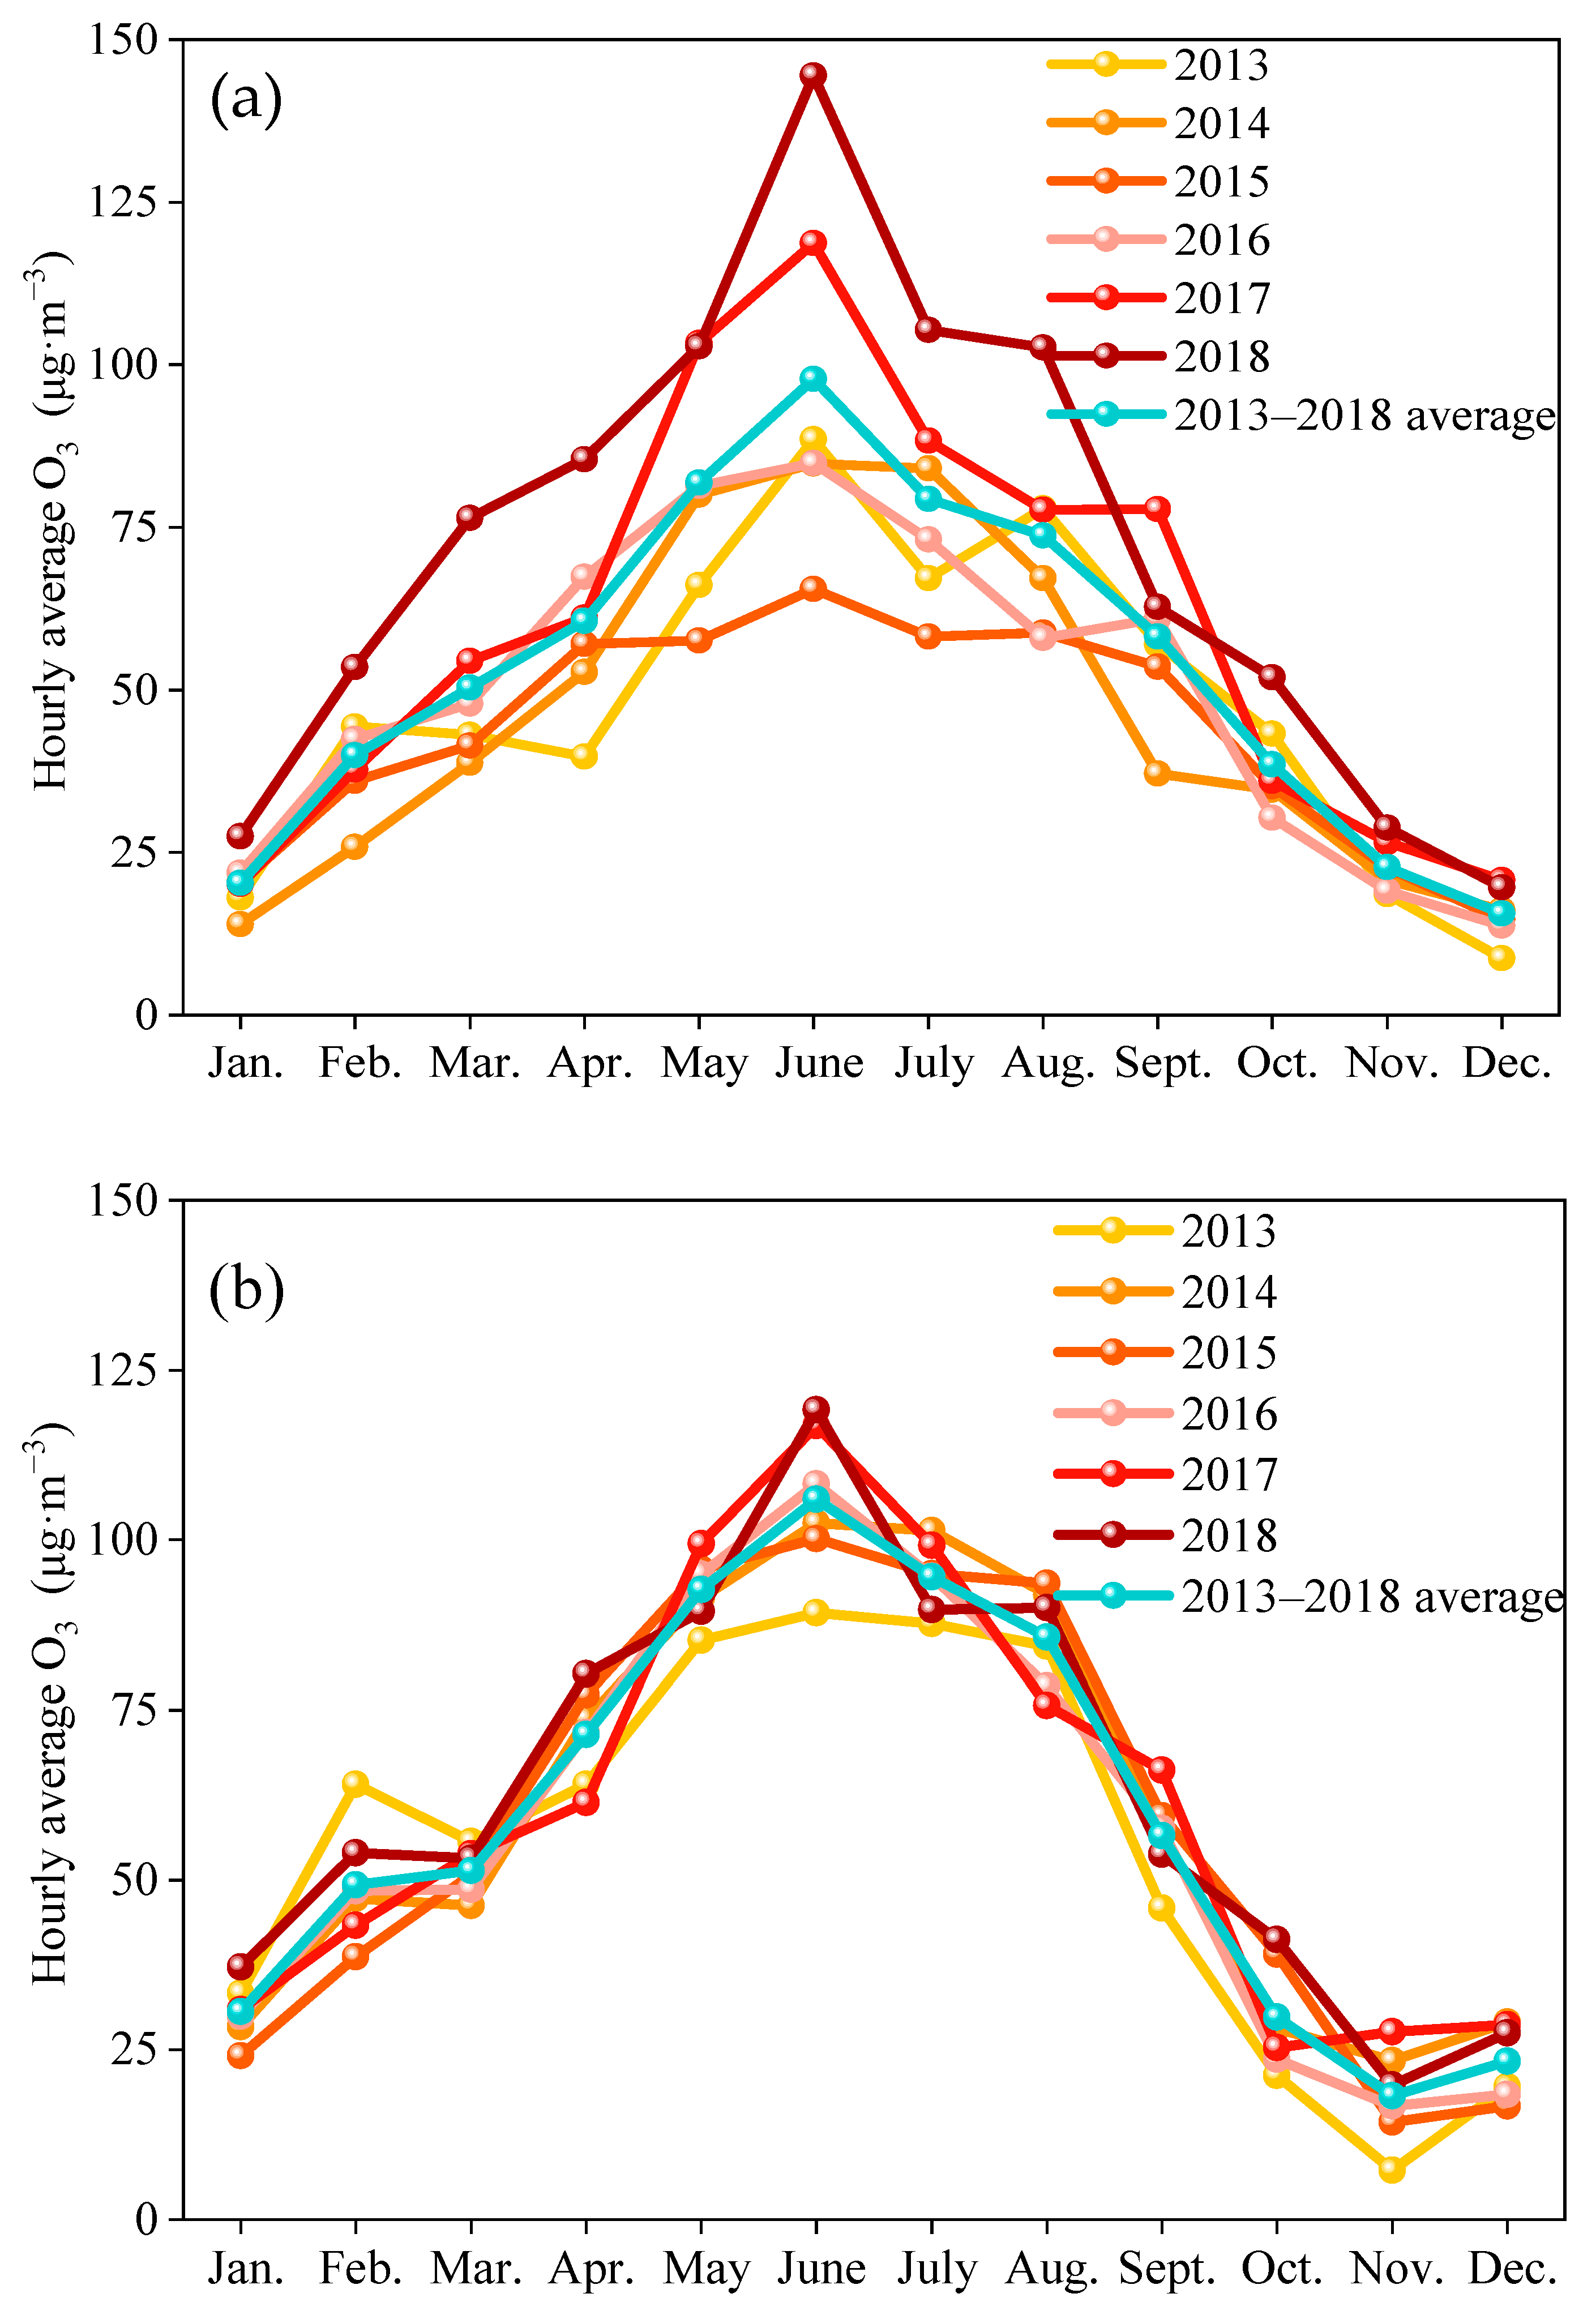
In Figure 2, temporal characteristics of O3 concentrations in the Handan and Beijing downtown during 2013–2018 showed an inverted V curve that O3 pollution from May to August was the highest. The monthly peak in the average O3 concentration in both cities appeared in June during 2013–2018, while the lowest O3 concentration in downtown Handan was in December, and in Beijing was in November. Generally, the seasonal variation in O3 has a summer (June–August) maximum and winter (November–December–February) minimum in downtown Handan and Beijing. However, the changes of O3 concentration in downtown Handan from 2013 to 2018 were more obvious than that in Beijing downtown, especially the monthly hourly average O3 concentration from January to December in 2018 were all higher than those in the same months from 2013 to 2016 in downtown Handan. We regarded the characteristics and causes of O3 concentration changes in downtown Handan during 2013–2018 were more worthy of further discussion. Thus, our analysis focused on the vulnerable month (June) of summer as a typical period and selected Handan as the research target city to conduct the following research work.
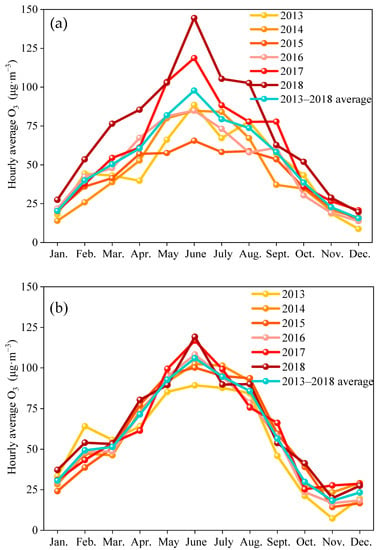
Figure 2.
Temporal characteristics of O3 concentrations in (a) downtown Handan and (b) downtown Beijing during 2013–2018.
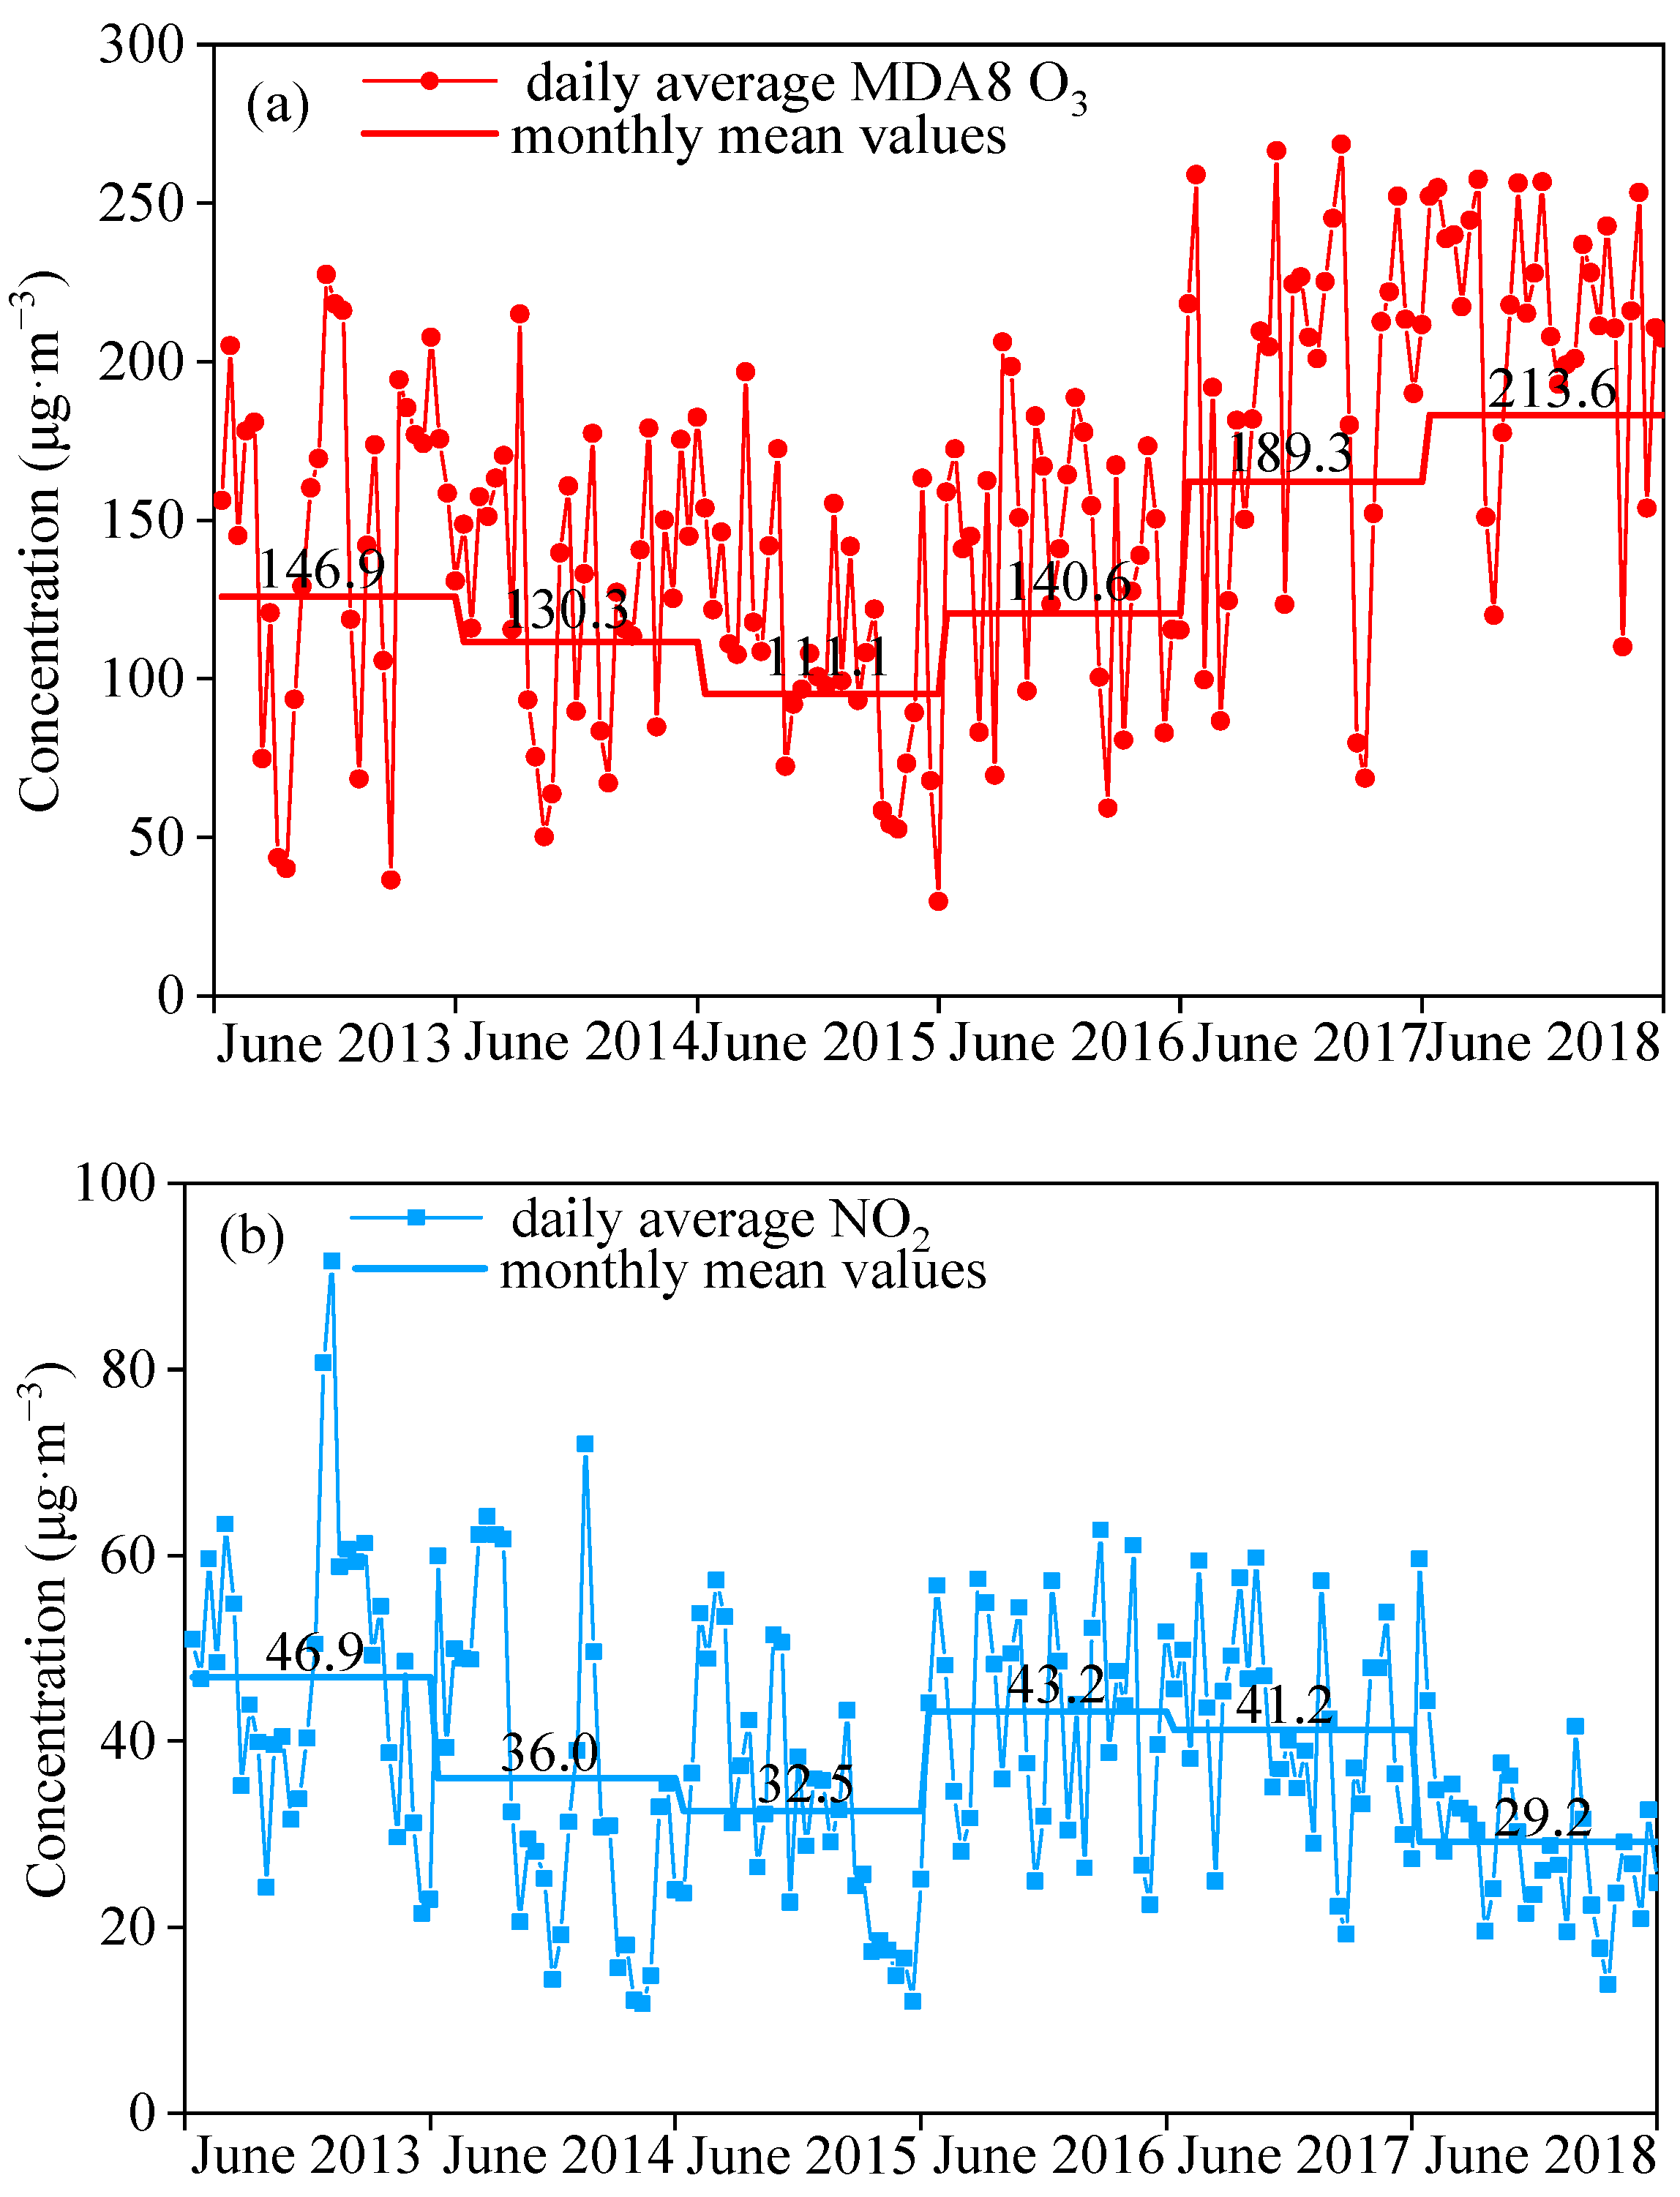
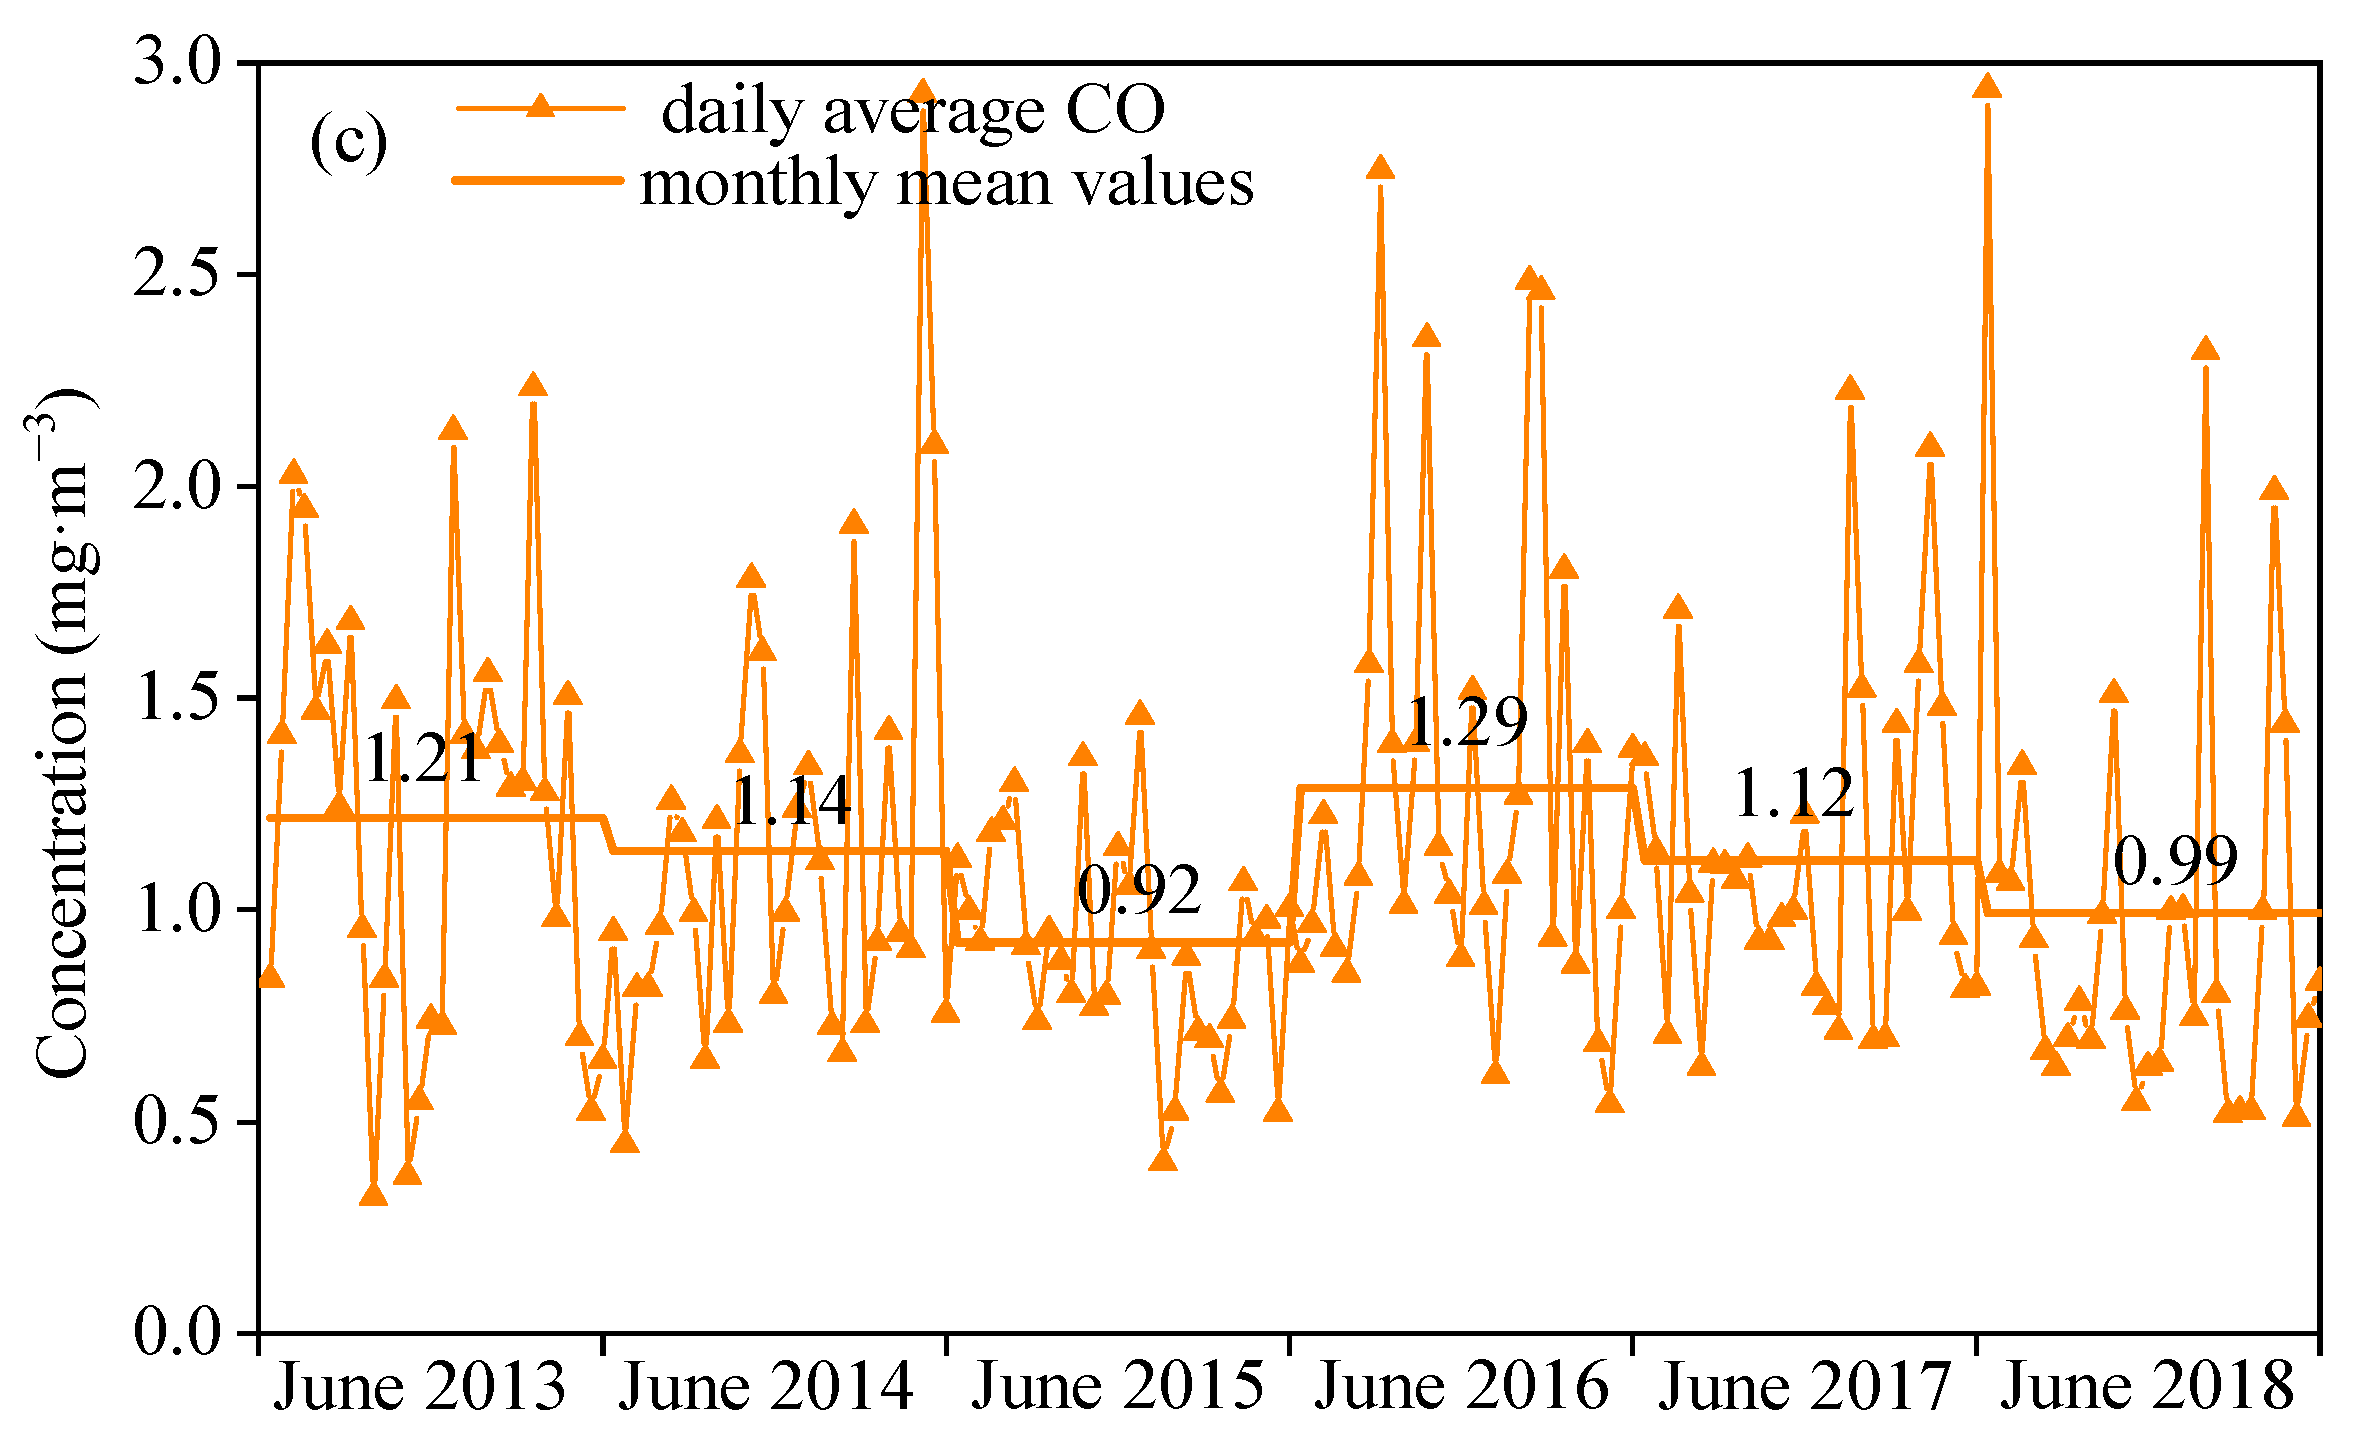
In 2013, in an effort to ease mounting public concern over air quality, the “Action plan for preventing and controlling air pollution” was promulgated by the Chinese government. Because of this policy, China’s air pollution improved significantly after 2013. Figure 3 shows the change in the June average ambient concentrations of O3, nitrogen dioxide (NO2), and CO across downtown Handan from 2013 to 2018. The large reduction from 2013 to approximately 2015 in the MDA8 O3 concentration was concurrent with large decreases in the levels and variability of NO2 and CO. The MDA8 O3 concentration decreased by approximately 24.4% and those of NO2 and CO decreased by 30.7% and 24.1%, respectively. However, the MDA8 O3 concentration increased yearly after 2015. The MDA8 O3 increased from 111.1 μg·m−3 in 2015 to 146.9 μg·m−3 in 2016, and its precursors also increased significantly in 2016 (Figure 3a). After 2016, the NO2 and CO levels showed a downward trend (Figure 3b,c). At the same time, the MDA8 O3 concentration still increased significantly, and the MDA8 O3 concentration in 2018 was 51.9% higher than that in 2016. The changes in the O3 levels from 2013 to approximately 2018 were likely driven by the change in the emissions of O3 precursors as a result of aggressive emission control policies.
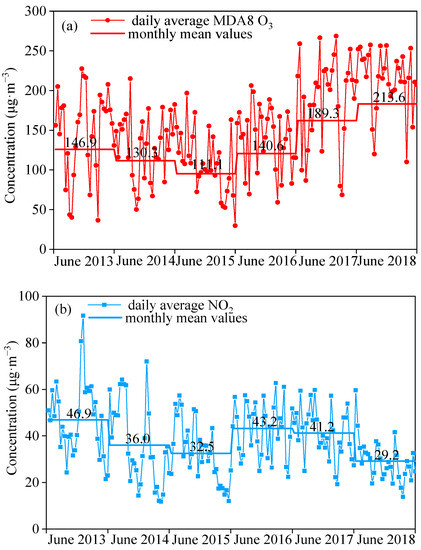
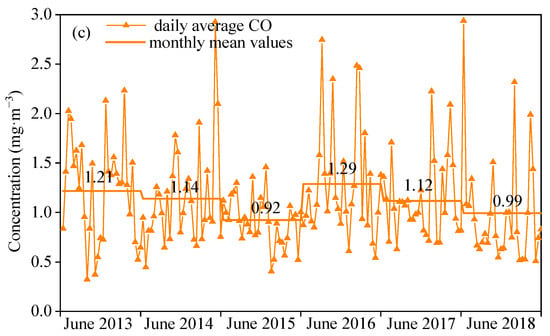
Figure 3.
Change in the June average ambient concentrations of (a) O3, (b) NO2, and (c) CO across downtown Handan from June 2013–2018.
3.2. Emission Trends of Ozone Precursors during June 2013–2018
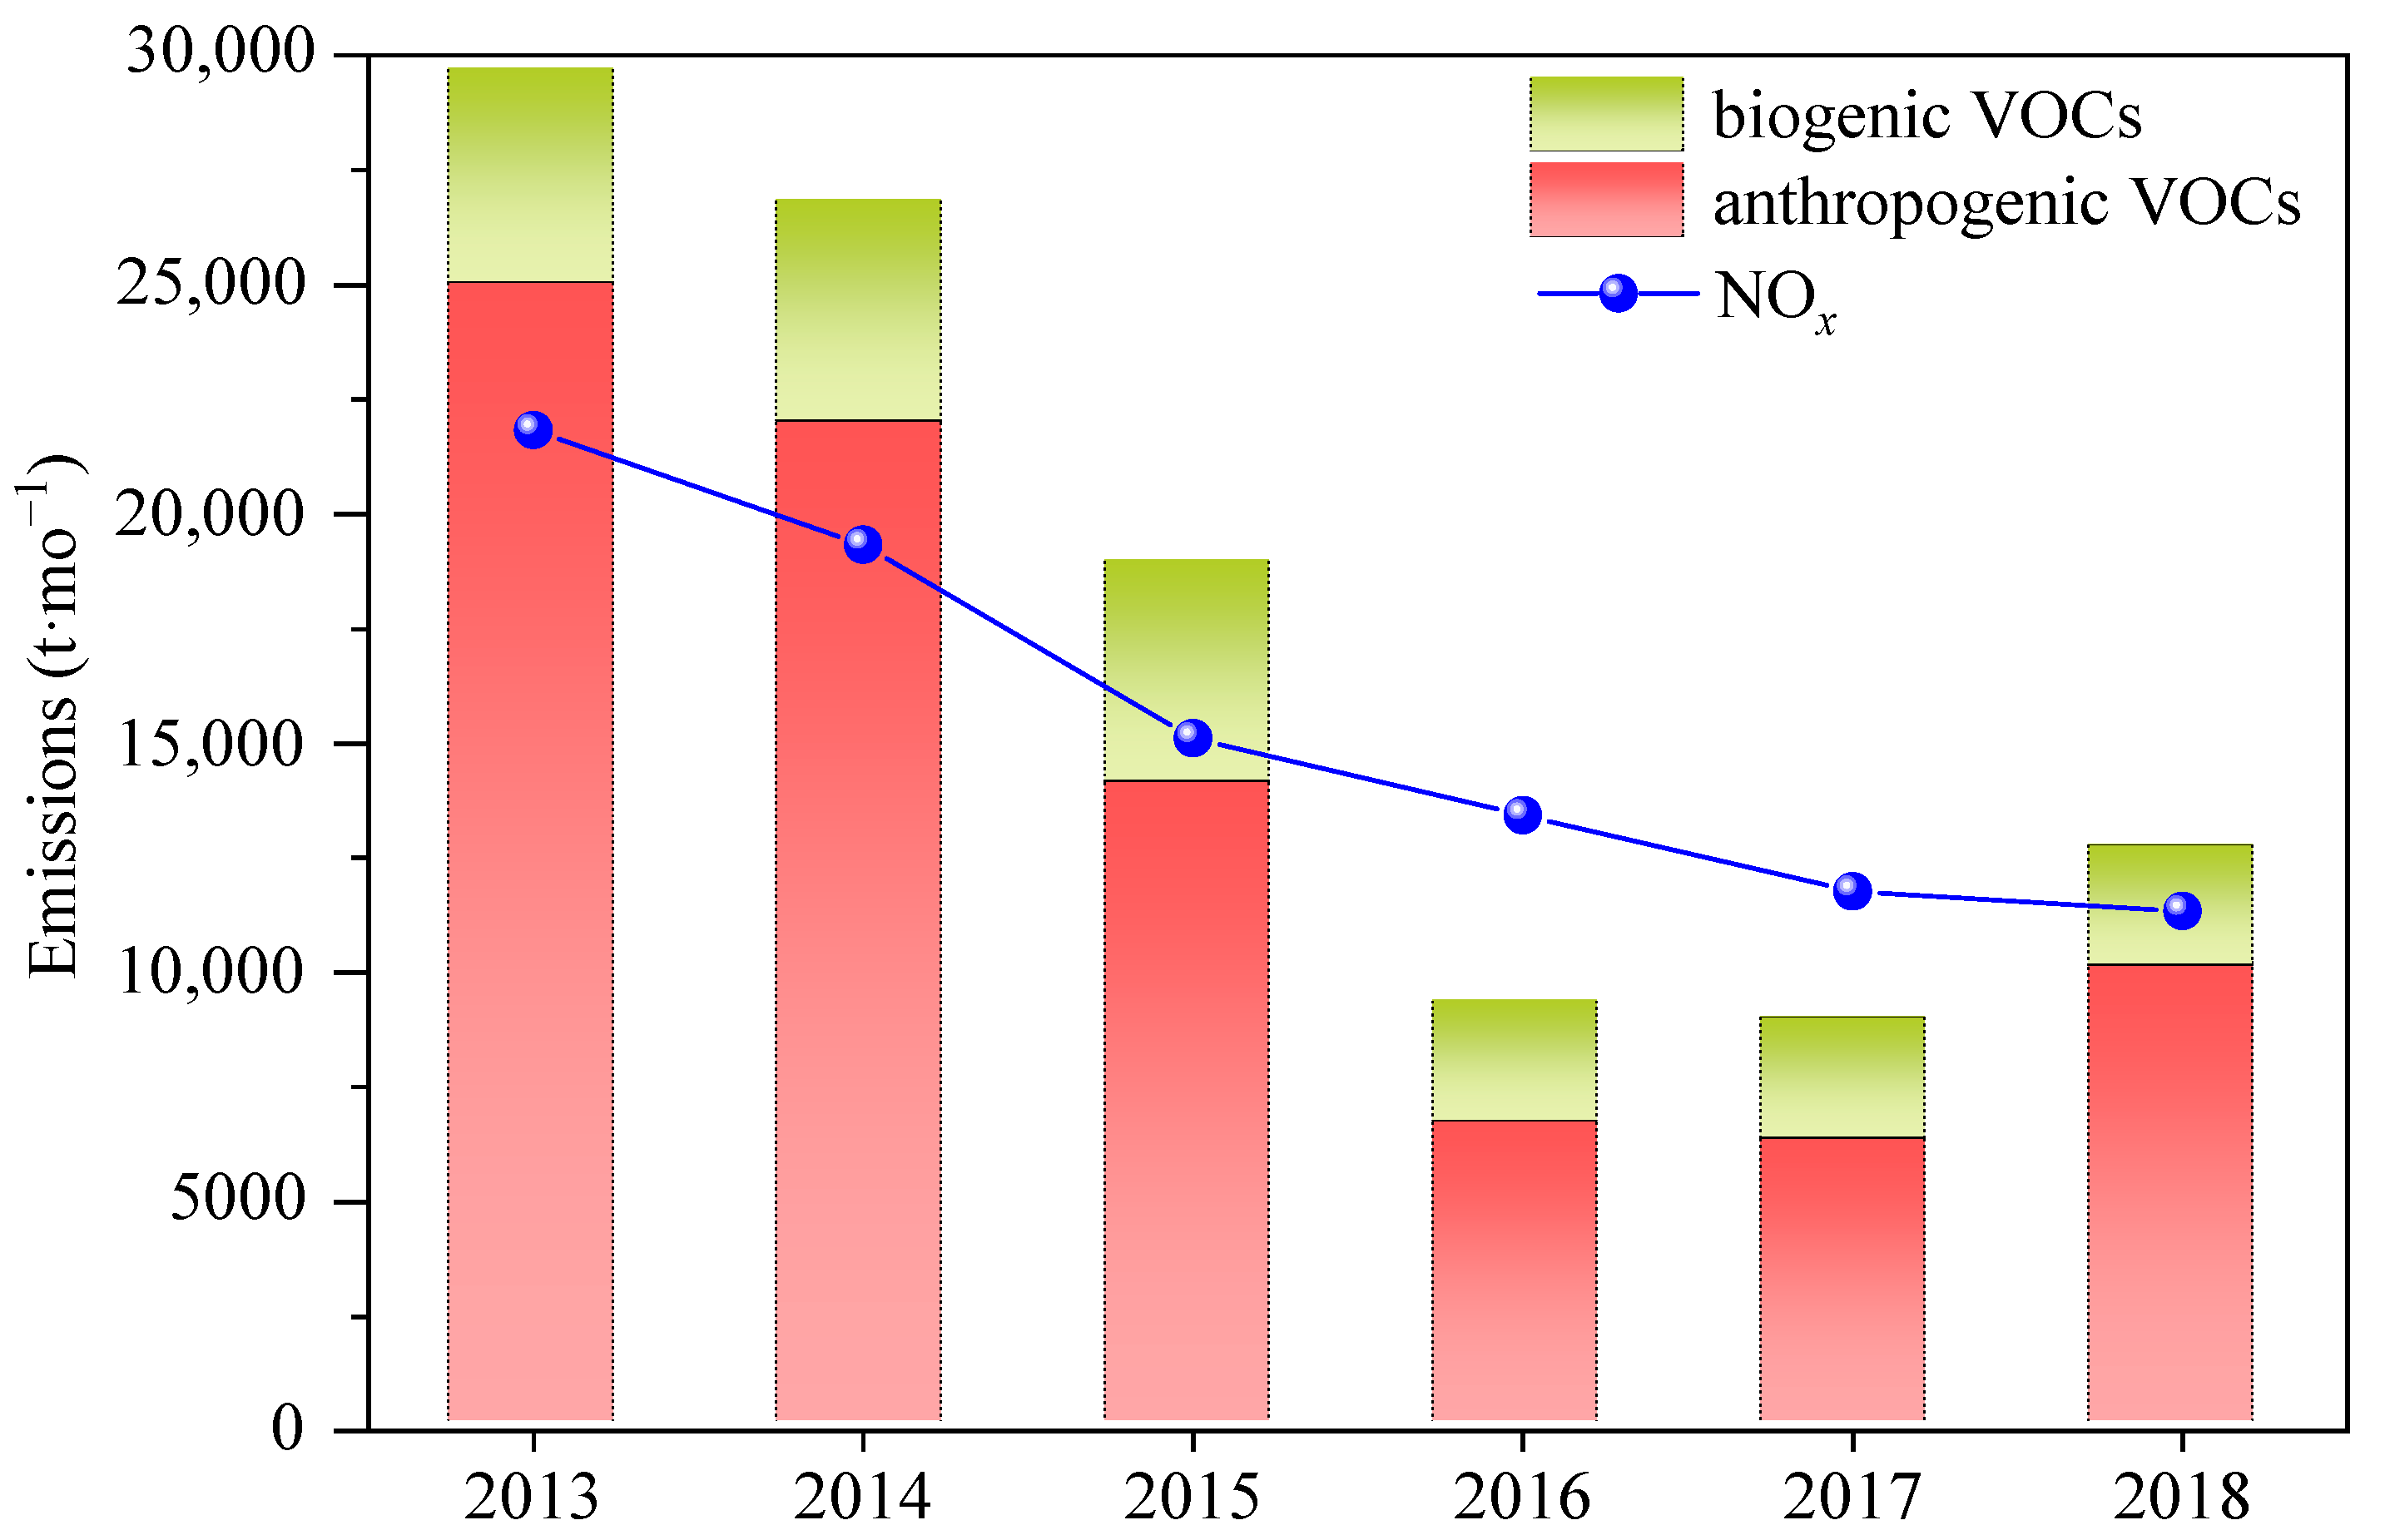
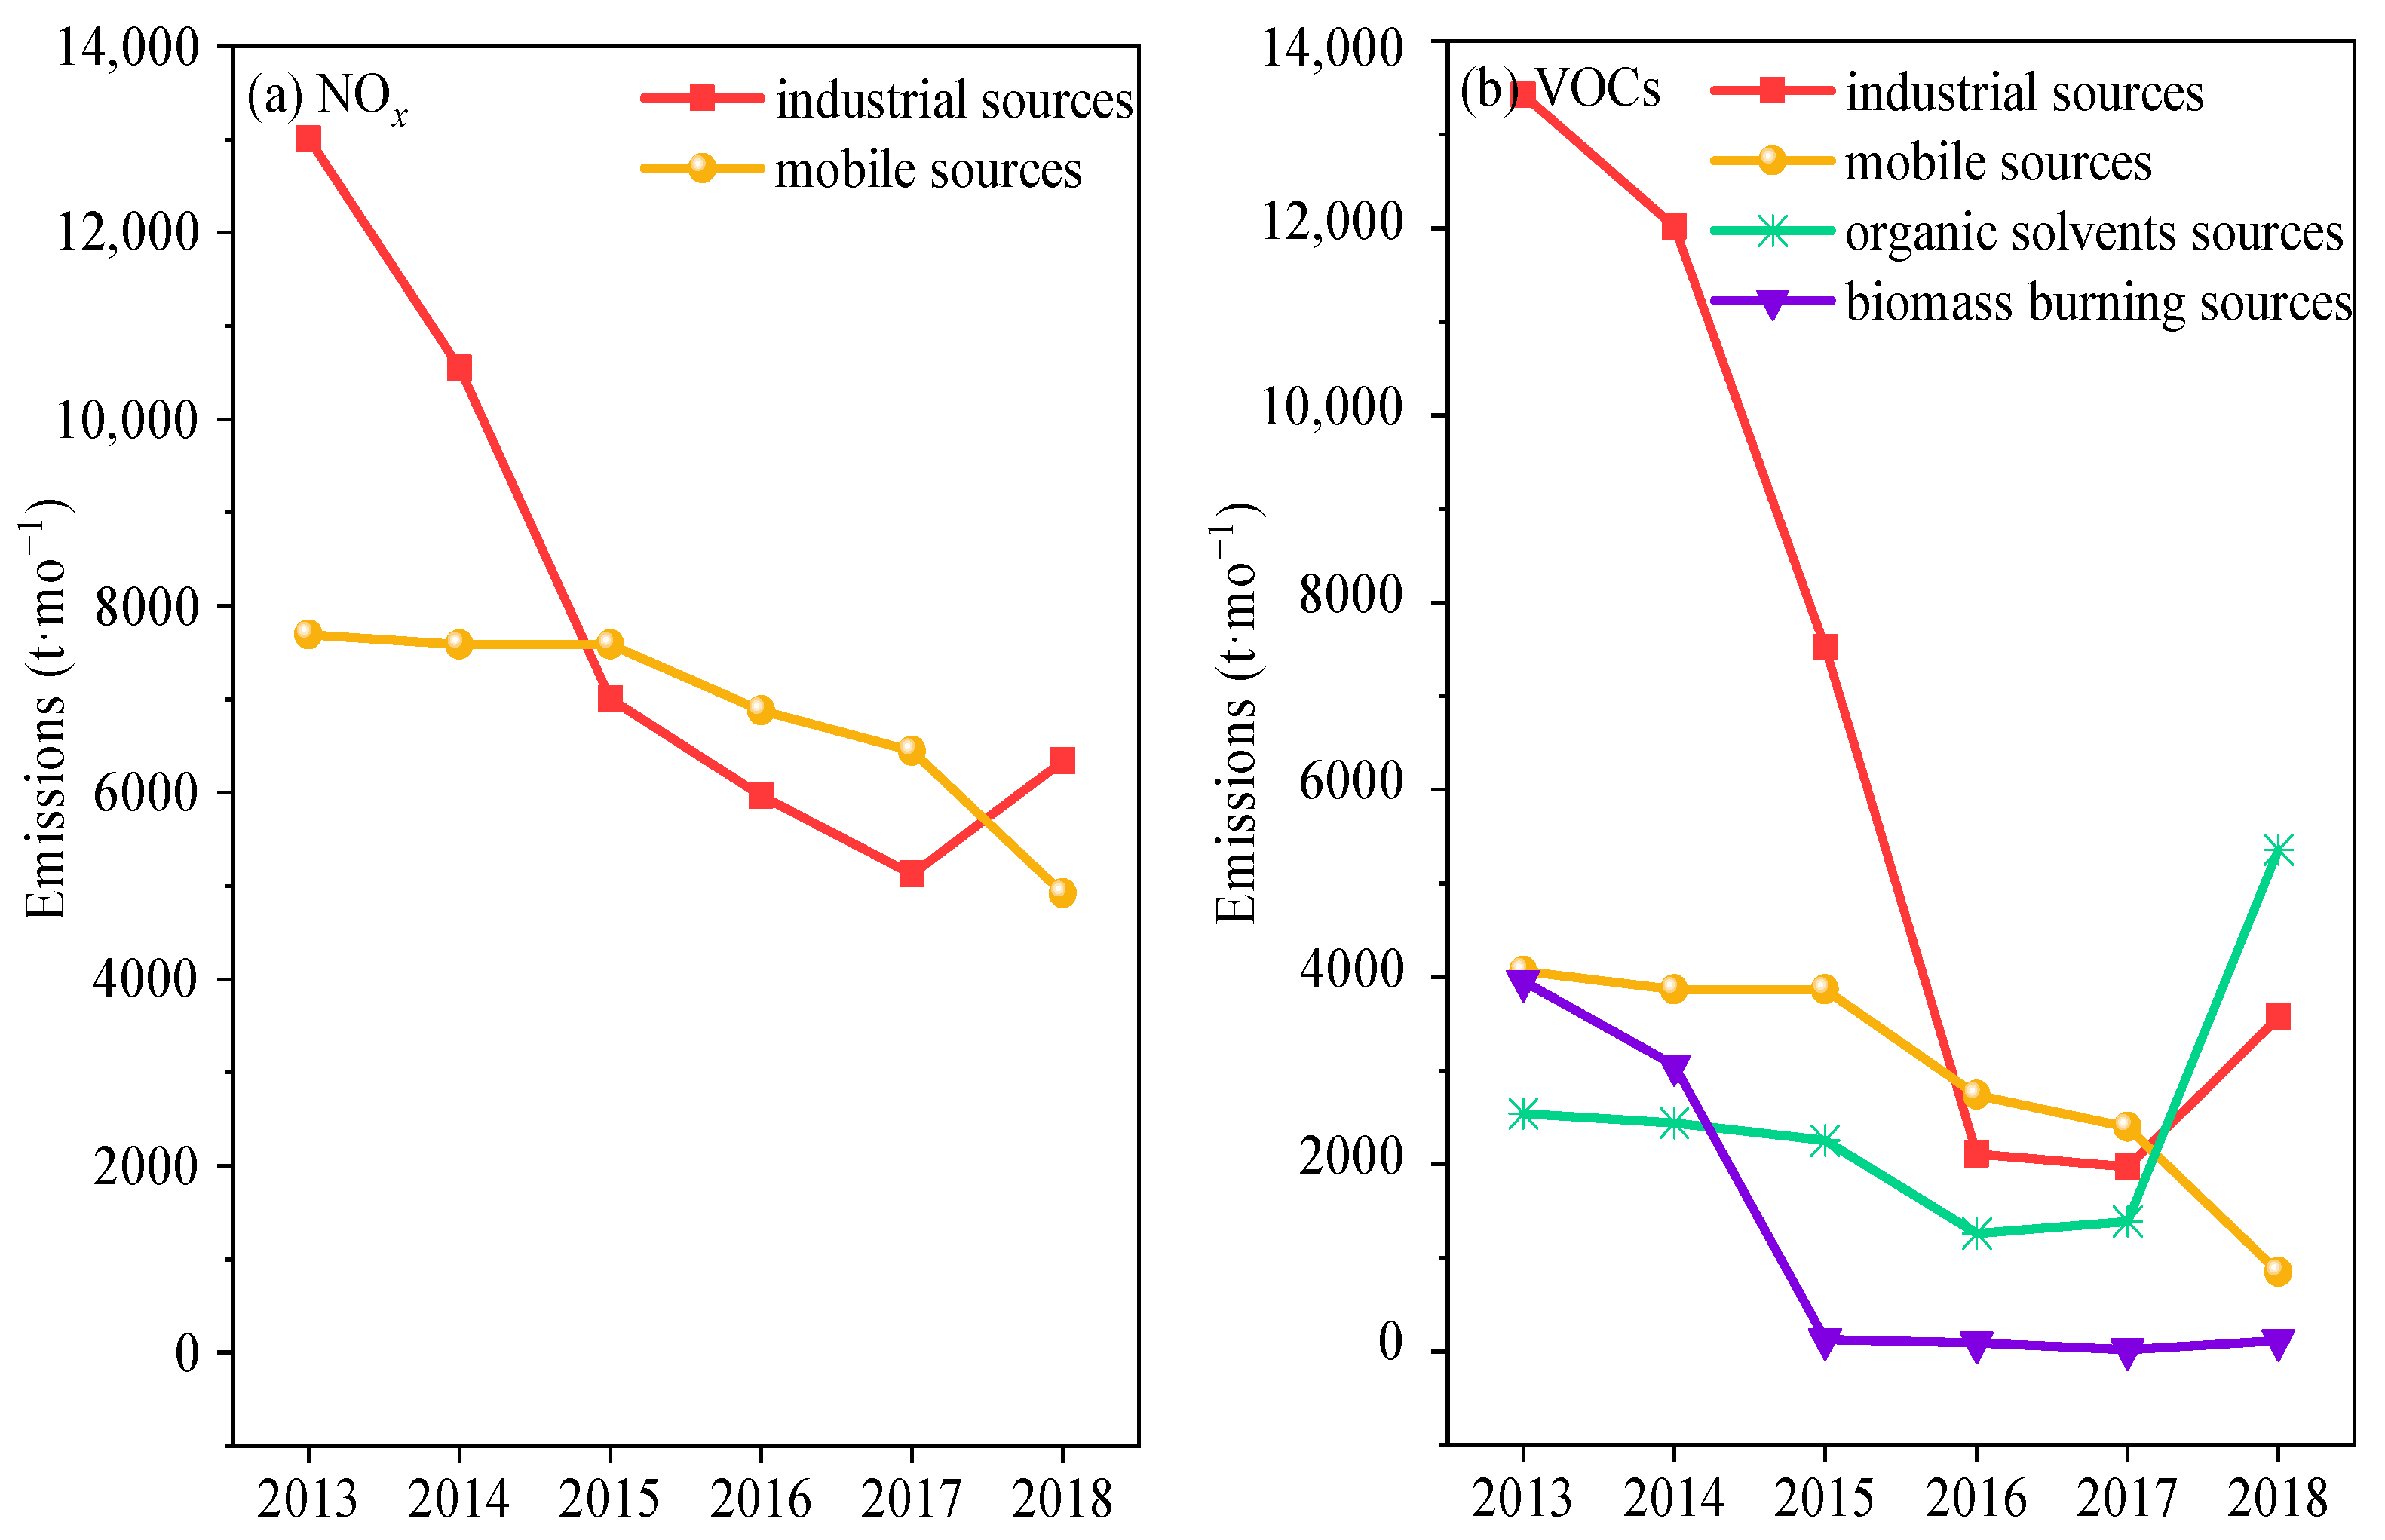
NOx and VOCs are important precursors of O3 formation. Handan implemented a strict total pollutant control system, which significantly reduced the anthropogenic emissions of NOx and VOCs from 2013 to 2018. Figure 4 shows that anthropogenic NOx emissions in Handan reached approximately 21,829.5 t in June 2013, and then the NOx emissions continued decreasing yearly. The NOx emissions were reduced to 11,341.6 t in June 2018. The NOx emissions mainly originated from industrial sources (including the steel industry, building materials industry, fossil fuel combustion in industrial boilers, and petrochemical and chemical industry) and mobile sources (including road vehicles and non-road engines) with contributions of 43.6–59.6% and 35.2–54.8% in our study period, respectively. From June of 2013–2018, the Handan NOx emissions decreased by 10,487.9 t, which was mainly from industrial sources (by 6675.5 t) and mobile sources (by 2772.6 t), as shown in Figure 5.
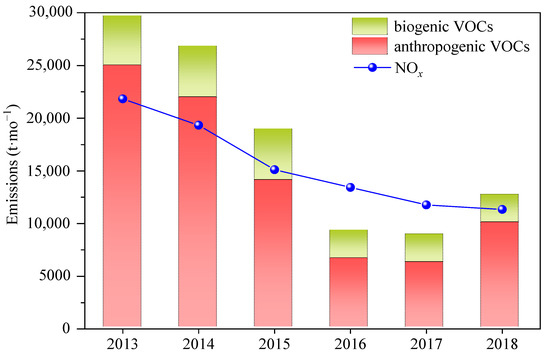
Figure 4.
Changes in emissions of volatile organic compounds (VOCs) and NOx in Handan during June of 2013–2018.
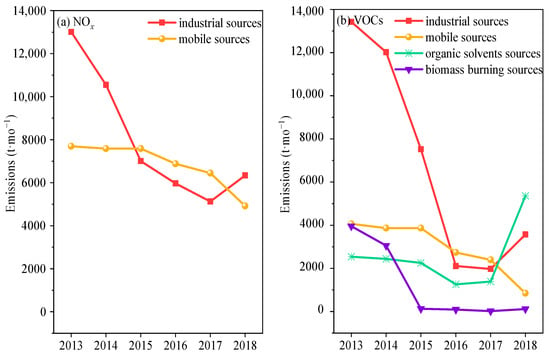
Figure 5.
Changes in emissions from the main sources of anthropogenic (a) NOx and (b) VOCs in Handan during June of 2013–2018.
At the end of 2015, the major VOC emission industries completed the task of fully meeting the emission standards; this caused the anthropogenic VOC emissions with a noticeable reduction of 73.7% during June 2013–2016. The VOC emissions in 2017 decreased slightly compared with those in the previous year, while the VOC emissions presented an increasing trend in June 2018 (Figure 4). The significant VOC emissions were attributed to industrial sources (31.7–54.7%), mobile sources (8.4–41.5%), organic solvent sources (10.2–53.6%), and biomass burning sources (0.3–15.8%) in our studied period. From June 2013 to June 2017, the reduction in anthropogenic VOC emissions was contributed mainly by industrial sources (Figure 5). In June 2018, the VOC emissions of mobile sources had decreased by 64.8% from the previous year. In addition, through the precise control of PM2.5 pollution, the daily average PM2.5 concentration from June 2015 to June 2017 reached the State Ambient Air Quality Secondary Standard for PM2.5 (75 μg·m−3) in downtown Handan. Therefore, in order to promote economic growth in the city, the control of industry was relaxed [32], which made the VOC emissions from organic solvent sources and industrial sources present a slightly increasing trend, especially the VOC emissions from organic solvent sources, which increased by 3972.5 t compared with that in the previous year.
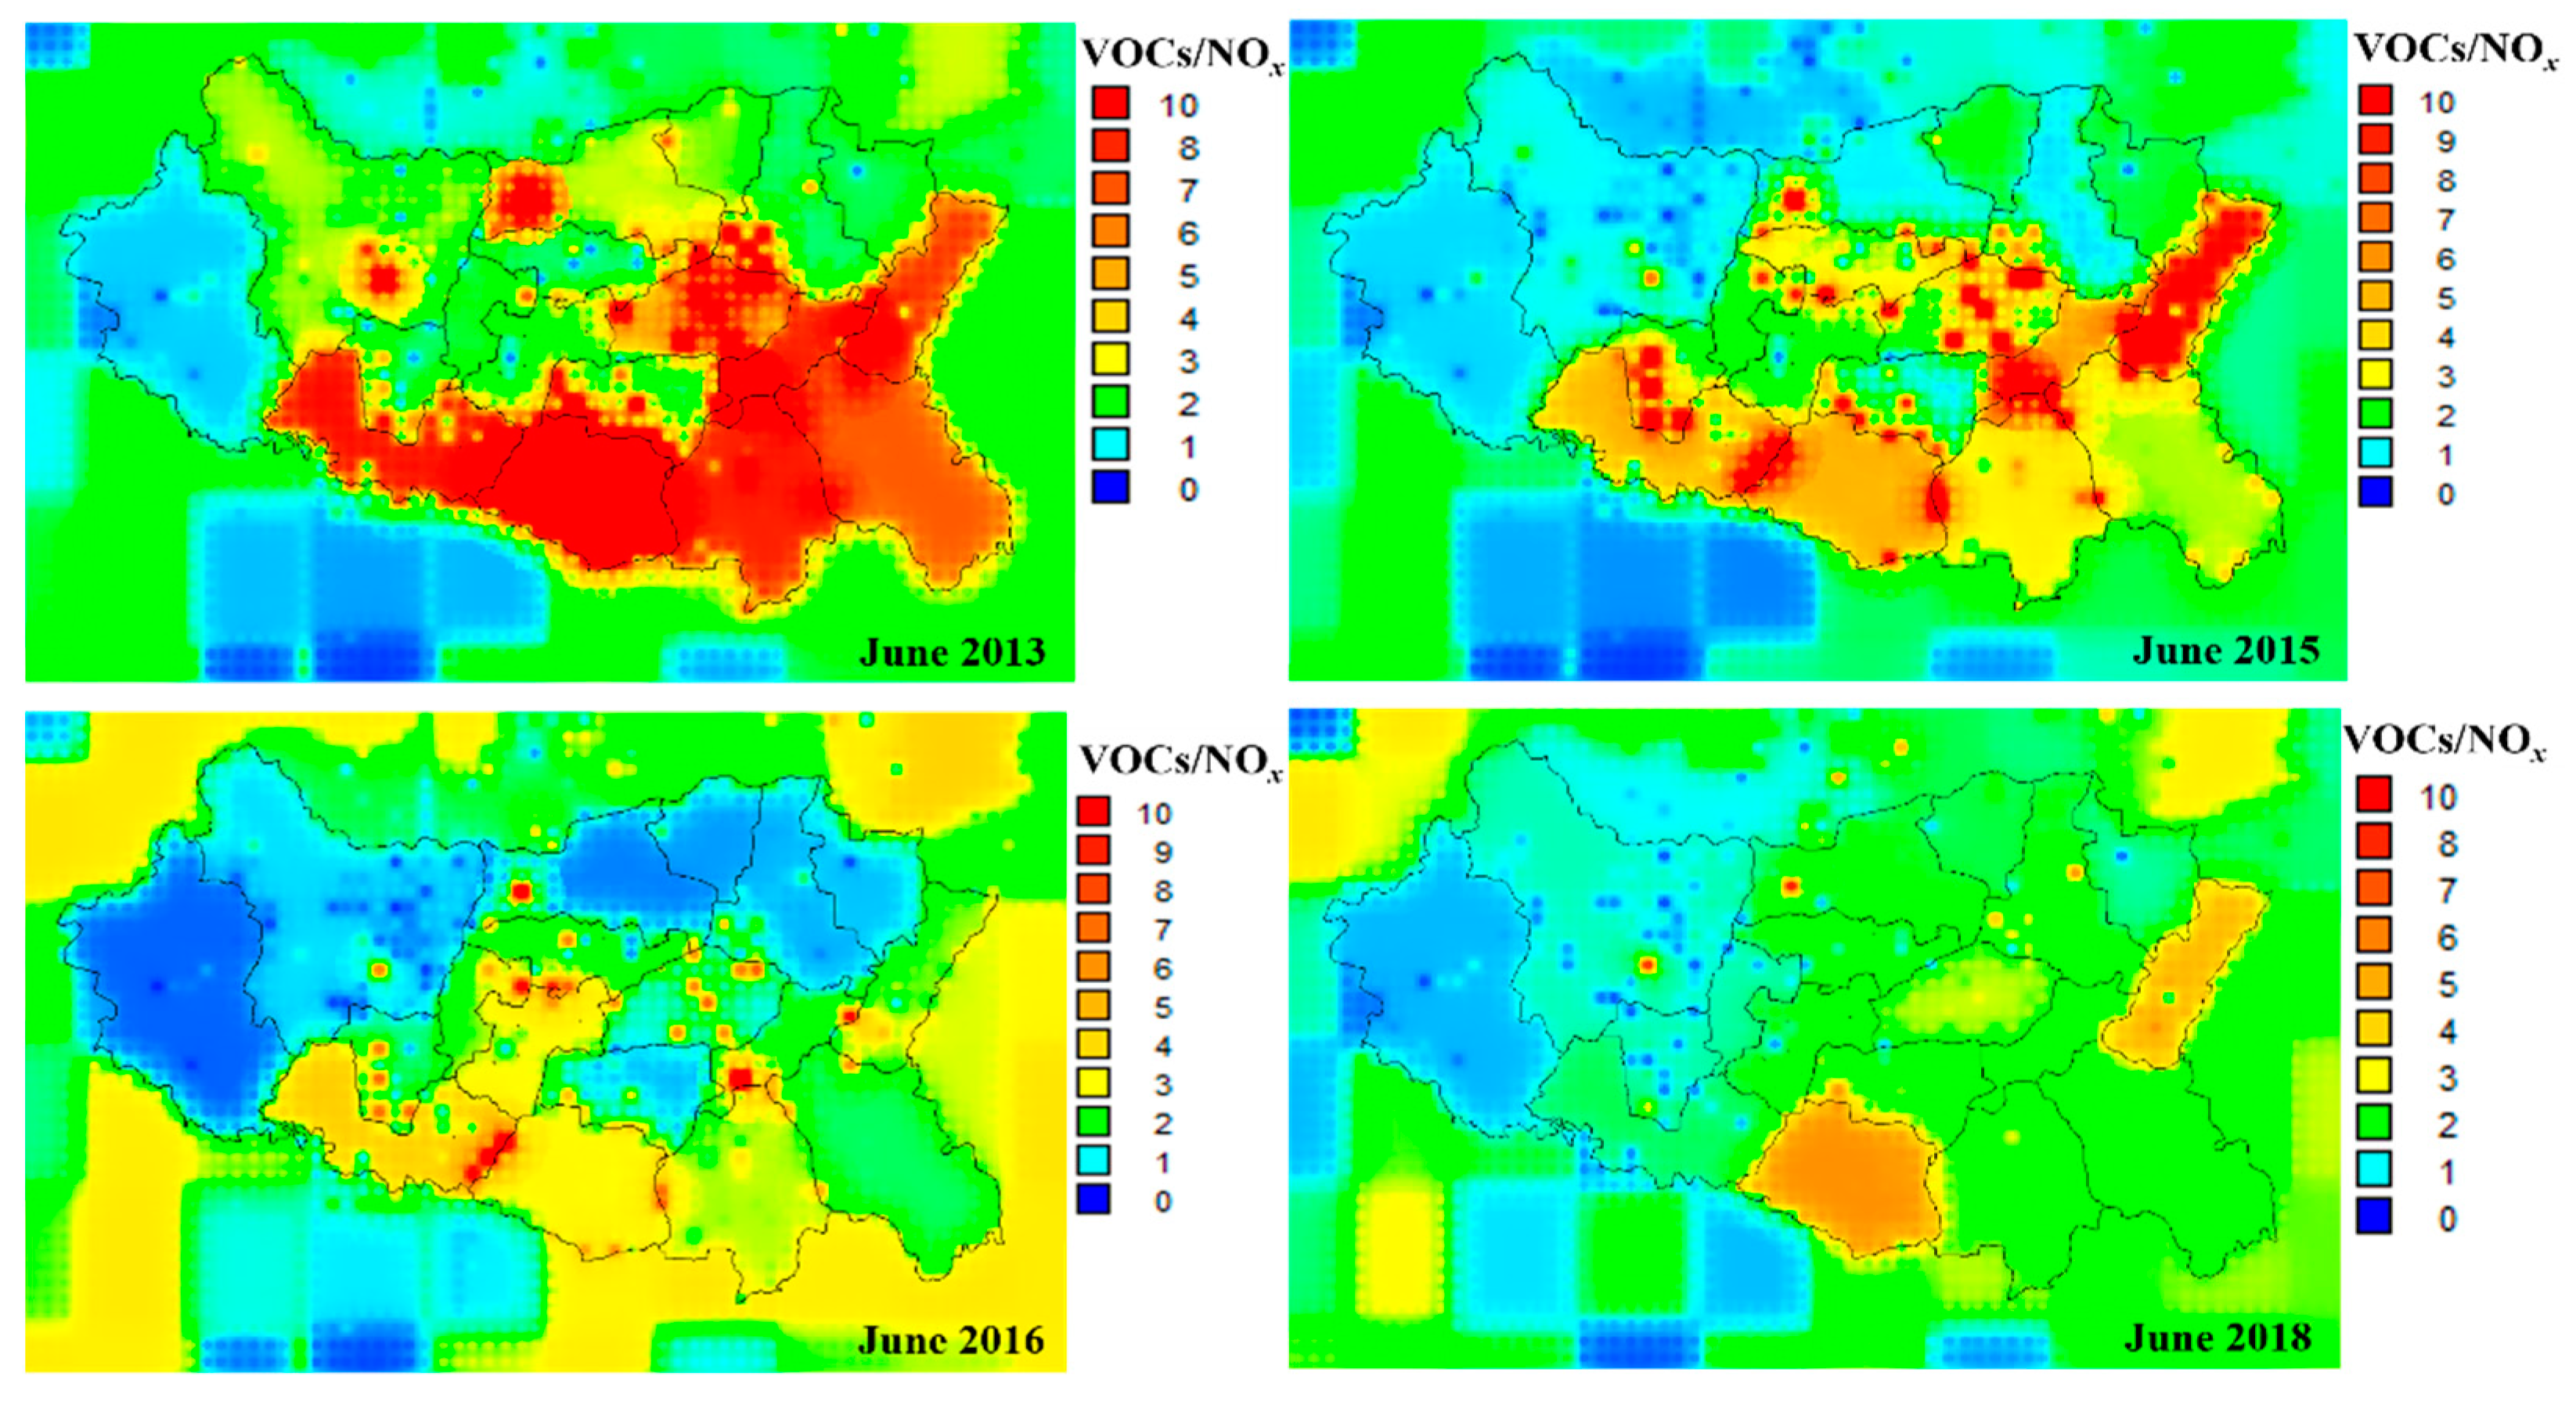
As VOCs and NOx are primary pollutants, the pollutant emission is linearly related to the concentration level, it is considered that the ratio of precursor concentration to emission is similar. The decrease in the emission of O3 precursors in Handan during June 2013–2018 was notable, but the MDA8 O3 concentration in downtown Handan showed a yearly decreasing from June 2014 to June 2015, and then showed a rapid increasing trend after 2015. It was probably whether precursor reduction brings about O3 increase of downtown Handan, for the change of VOCs-NOx-O3 formation sensitivity. The ratio of VOCs/NOx can be used to qualitatively analyze the relationship between ambient O3 concentration and VOCs and NOx. In the conditions with relatively low ratios of VOCs/NOx, the reaction of OH radicals and NOx was dominant, and O3 production was more sensitive to VOCs concentration; while in the conditions with relatively high ratios of VOCs/NOx, the reaction of OH radicals and VOCs was dominant, and O3 production was more sensitive to NOx concentration [33]. The ratio of VOCs emissions (anthropogenic VOCs and biogenic VOCs) to NOx emissions was calculated, as shown in Figure 6. During 2013–2018, the change of VOCs/NOx was obvious in eastern and southern suburban areas, and in June 2013 the high VOCs/NOx ratio of >7.0 occurred in eastern and southern suburban areas, while these suburban areas seemed to move towards a lower VOCs/NOx condition in the next five years as the anthropogenic emissions changed. Low ratios of VOCs/NOx ranging from 2.0 to 3.0, continuously occurred in downtown Handan during 2013–2018, which excluded the possibility that the change of ozone concentration in downtown Handan in recent years was caused by the change of VOCs-NOx-O3 formation sensitivity.
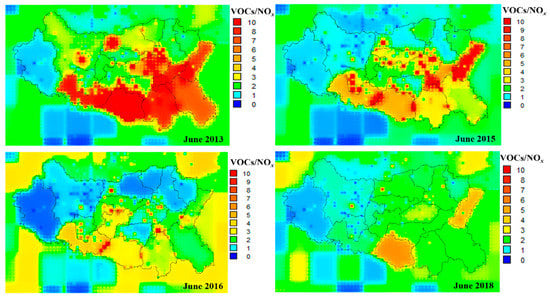
Figure 6.
Spatial distribution of the ratio of VOCs emissions (anthropogenic VOCs and biogenic VOCs) to NOx emissions (VOCs/NOx) over Handan and its surrounding areas in June 2013, June 2015, June 2016 and June 2018.
3.3. Contribution of Meteorology and Emissions to Ozone Trends
The evolution of O3 pollution has a highly non-linear relationship between NOx and VOC emissions. In addition, the concentration of O3 is closely related to meteorological conditions [34]. Therefore, calculating the correct quantitative contribution of interannual variations in O3 precursor emissions and meteorology conditions to O3 pollution evolution is the key to identifying the main influencing factors of O3 pollution evolution in Handan in recent years.
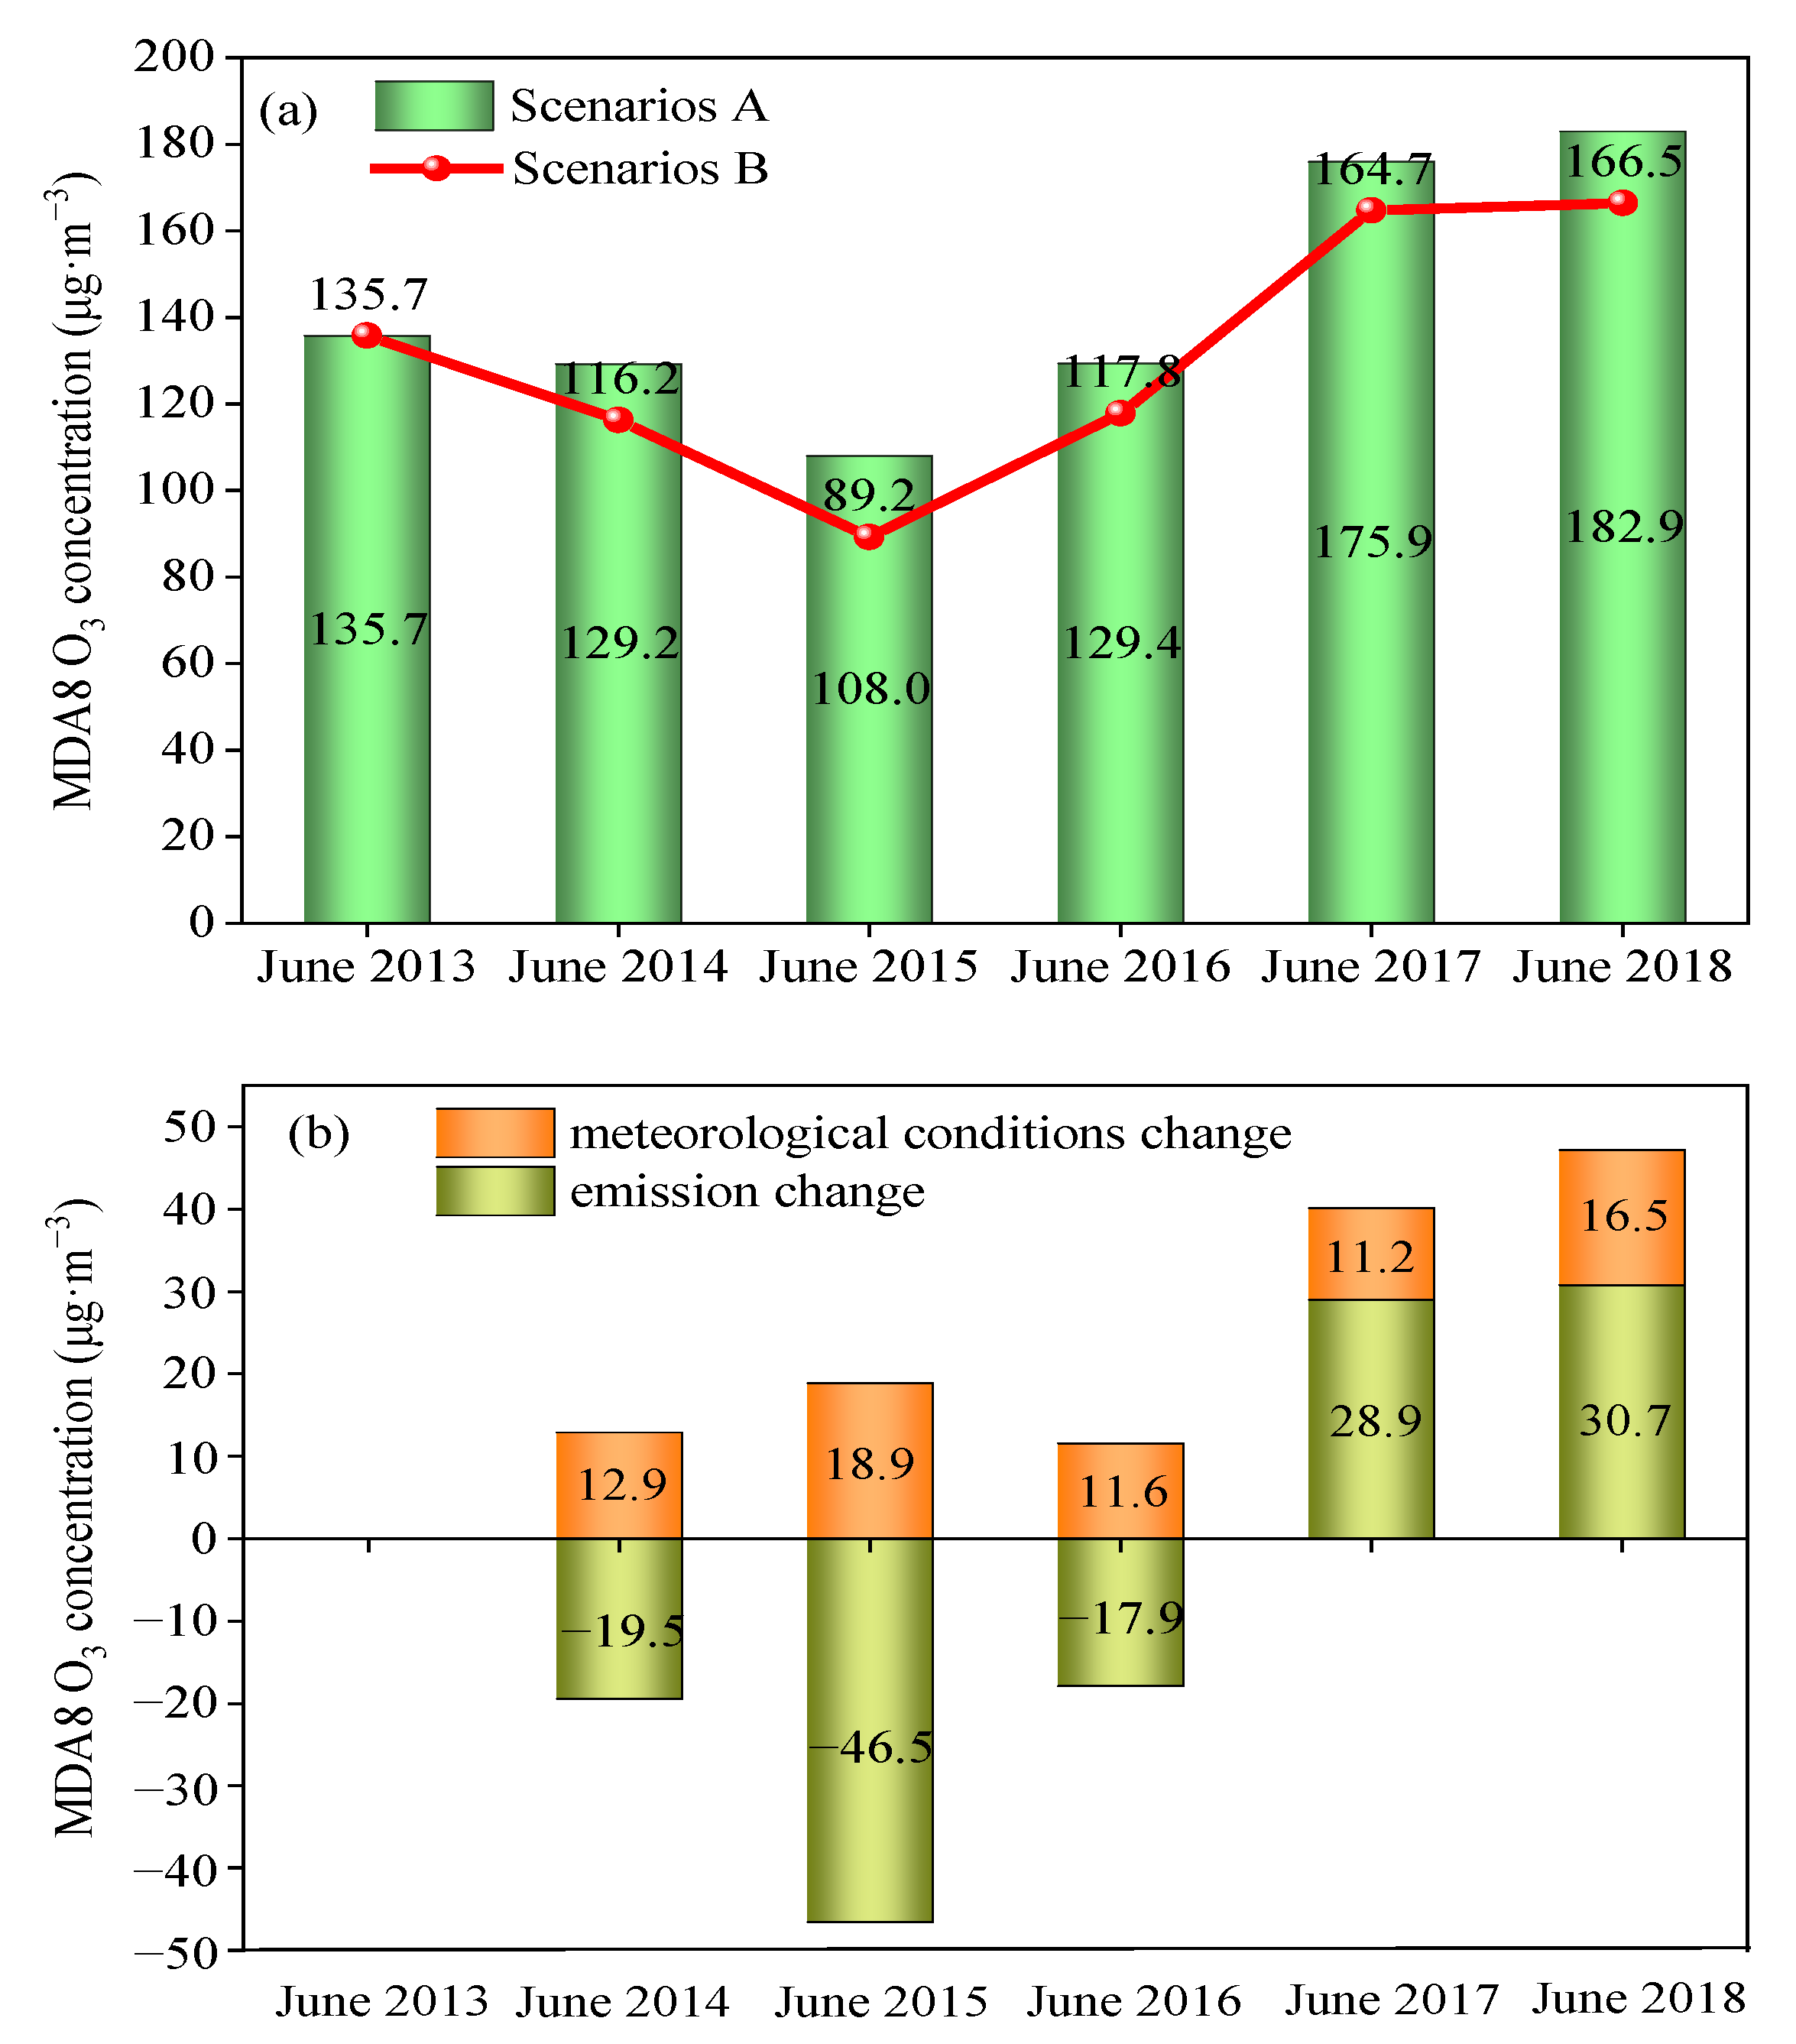
Downtown Handan was selected as the receptor area, and the typical period of O3 pollution (June) in 2013–2018 was selected as the simulation period for simulation scenario cases (for specific case settings, see Section 2.3.1). Figure 7a shows the sequence diagram of the change in the simulated MDA8 O3 concentration in downtown Handan in June 2013–2018. Simulation scenario B showed a downward trend from June 2013 to June 2016, MDA8 O3 concentration in 2014, 2015 and 2016 were 19.5 μg·m−3, 46.5 μg·m−3 and 17.9 μg·m−3 lower than those in 2013, respectively, which indicated that the change in emissions inhibited the increase in O3 pollution in downtown Handan during this period. After 2016, the emission change promoted the trend of the increase in the MDA8 O3 concentration. Figure 7b shows the quantitative assessment results of the impact of meteorological conditions and emission changes on the evolution of O3 pollution in downtown Handan. Compared with the meteorological conditions in June 2013, the contributions of meteorological conditions to the MDA8 O3 concentration in June 2014–2018 were 12.9 μg·m−3, 18.9 μg·m−3, 11.6 μg·m−3, 11.2 μg·m−3, 16.9 μg·m−3 had promotional effects; in particular, the contribution of meteorological conditions in June 2015 to the MDA8 O3 concentration had a big effect. The annual variation in the absolute value of O3 concentration caused by emissions was greater than that caused by meteorological conditions. For June 2013–2018, the total contribution of changes in meteorology and emissions to the absolute value of O3 were 71.1 μg·m−3 and 143.6 μg·m−3 (decreasing and increasing the O3 concentration by 83.9 μg·m−3 and 59.7 μg·m−3, respectively) accounting for 33.1% and 66.9%, respectively.
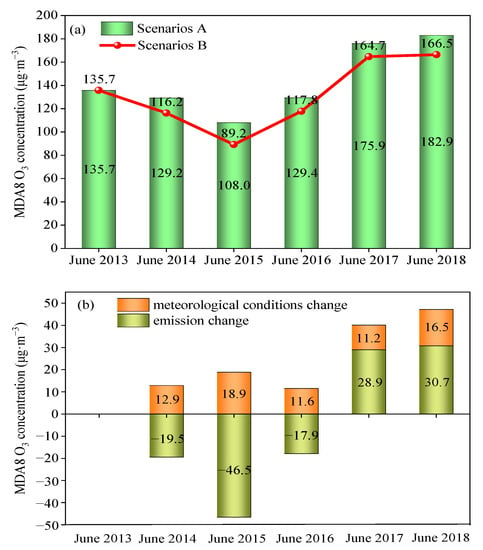
Figure 7.
(a) Trend of the variation in O3 under different simulation scenarios in downtown Handan from 2013 to 2018; (b) The impact of meteorology and emissions on the evolution of O3 pollution in downtown Handan from 2013 to 2018.
It can be seen that in Figure 7b, by contrast with the impact of meteorological conditions, the change in emissions in downtown Handan from June of 2014–2016 caused the MDA8 O3 concentration to decline in these years. The concentrations of MDA8 O3 in 2014–2016 were −19.5 μg·m−3, −46.5 μg·m−3, −17.9 μg·m−3. This indicated that the emission reduction strategy of O3 precursors in June 2013–2016 had a significant effect on reducing O3 pollution. However, the change in emissions from June 2017–2018 promoted the rapid increase in the MDA8 O3 concentration, and the contribution of emissions to O3 was as high as 28.9 μg·m−3 and 30.7 μg·m−3 accounting for 72.0% and 65.1% of the total MDA8 O3 concentration growth in the same year, respectively. It is worth noting that the increase in MDA8 O3 concentration in 2016 and 2017 compared to 2015 when both precursors emissions continued to decrease, and this may have been related to an improper ratio of VOC to NOx emission reduction.
In brief, the decrease in the MDA8 O3 concentration in June 2014–2016 was mainly caused by the change in emissions. During June 2017–2018, the joint action of emissions and meteorological conditions aggravated the O3 pollution in downtown Handan, and the emission factor played a leading role in the increase in O3. The contribution of the change in emissions to the MDA8 O3 concentration during June 2014–2018 was significantly greater than that caused by meteorological conditions in downtown Handan.
3.4. The Sensitivity of Ozone to Precursors’ Reductions at Downtown Handan
3.4.1. Sensitivity Regime Identification
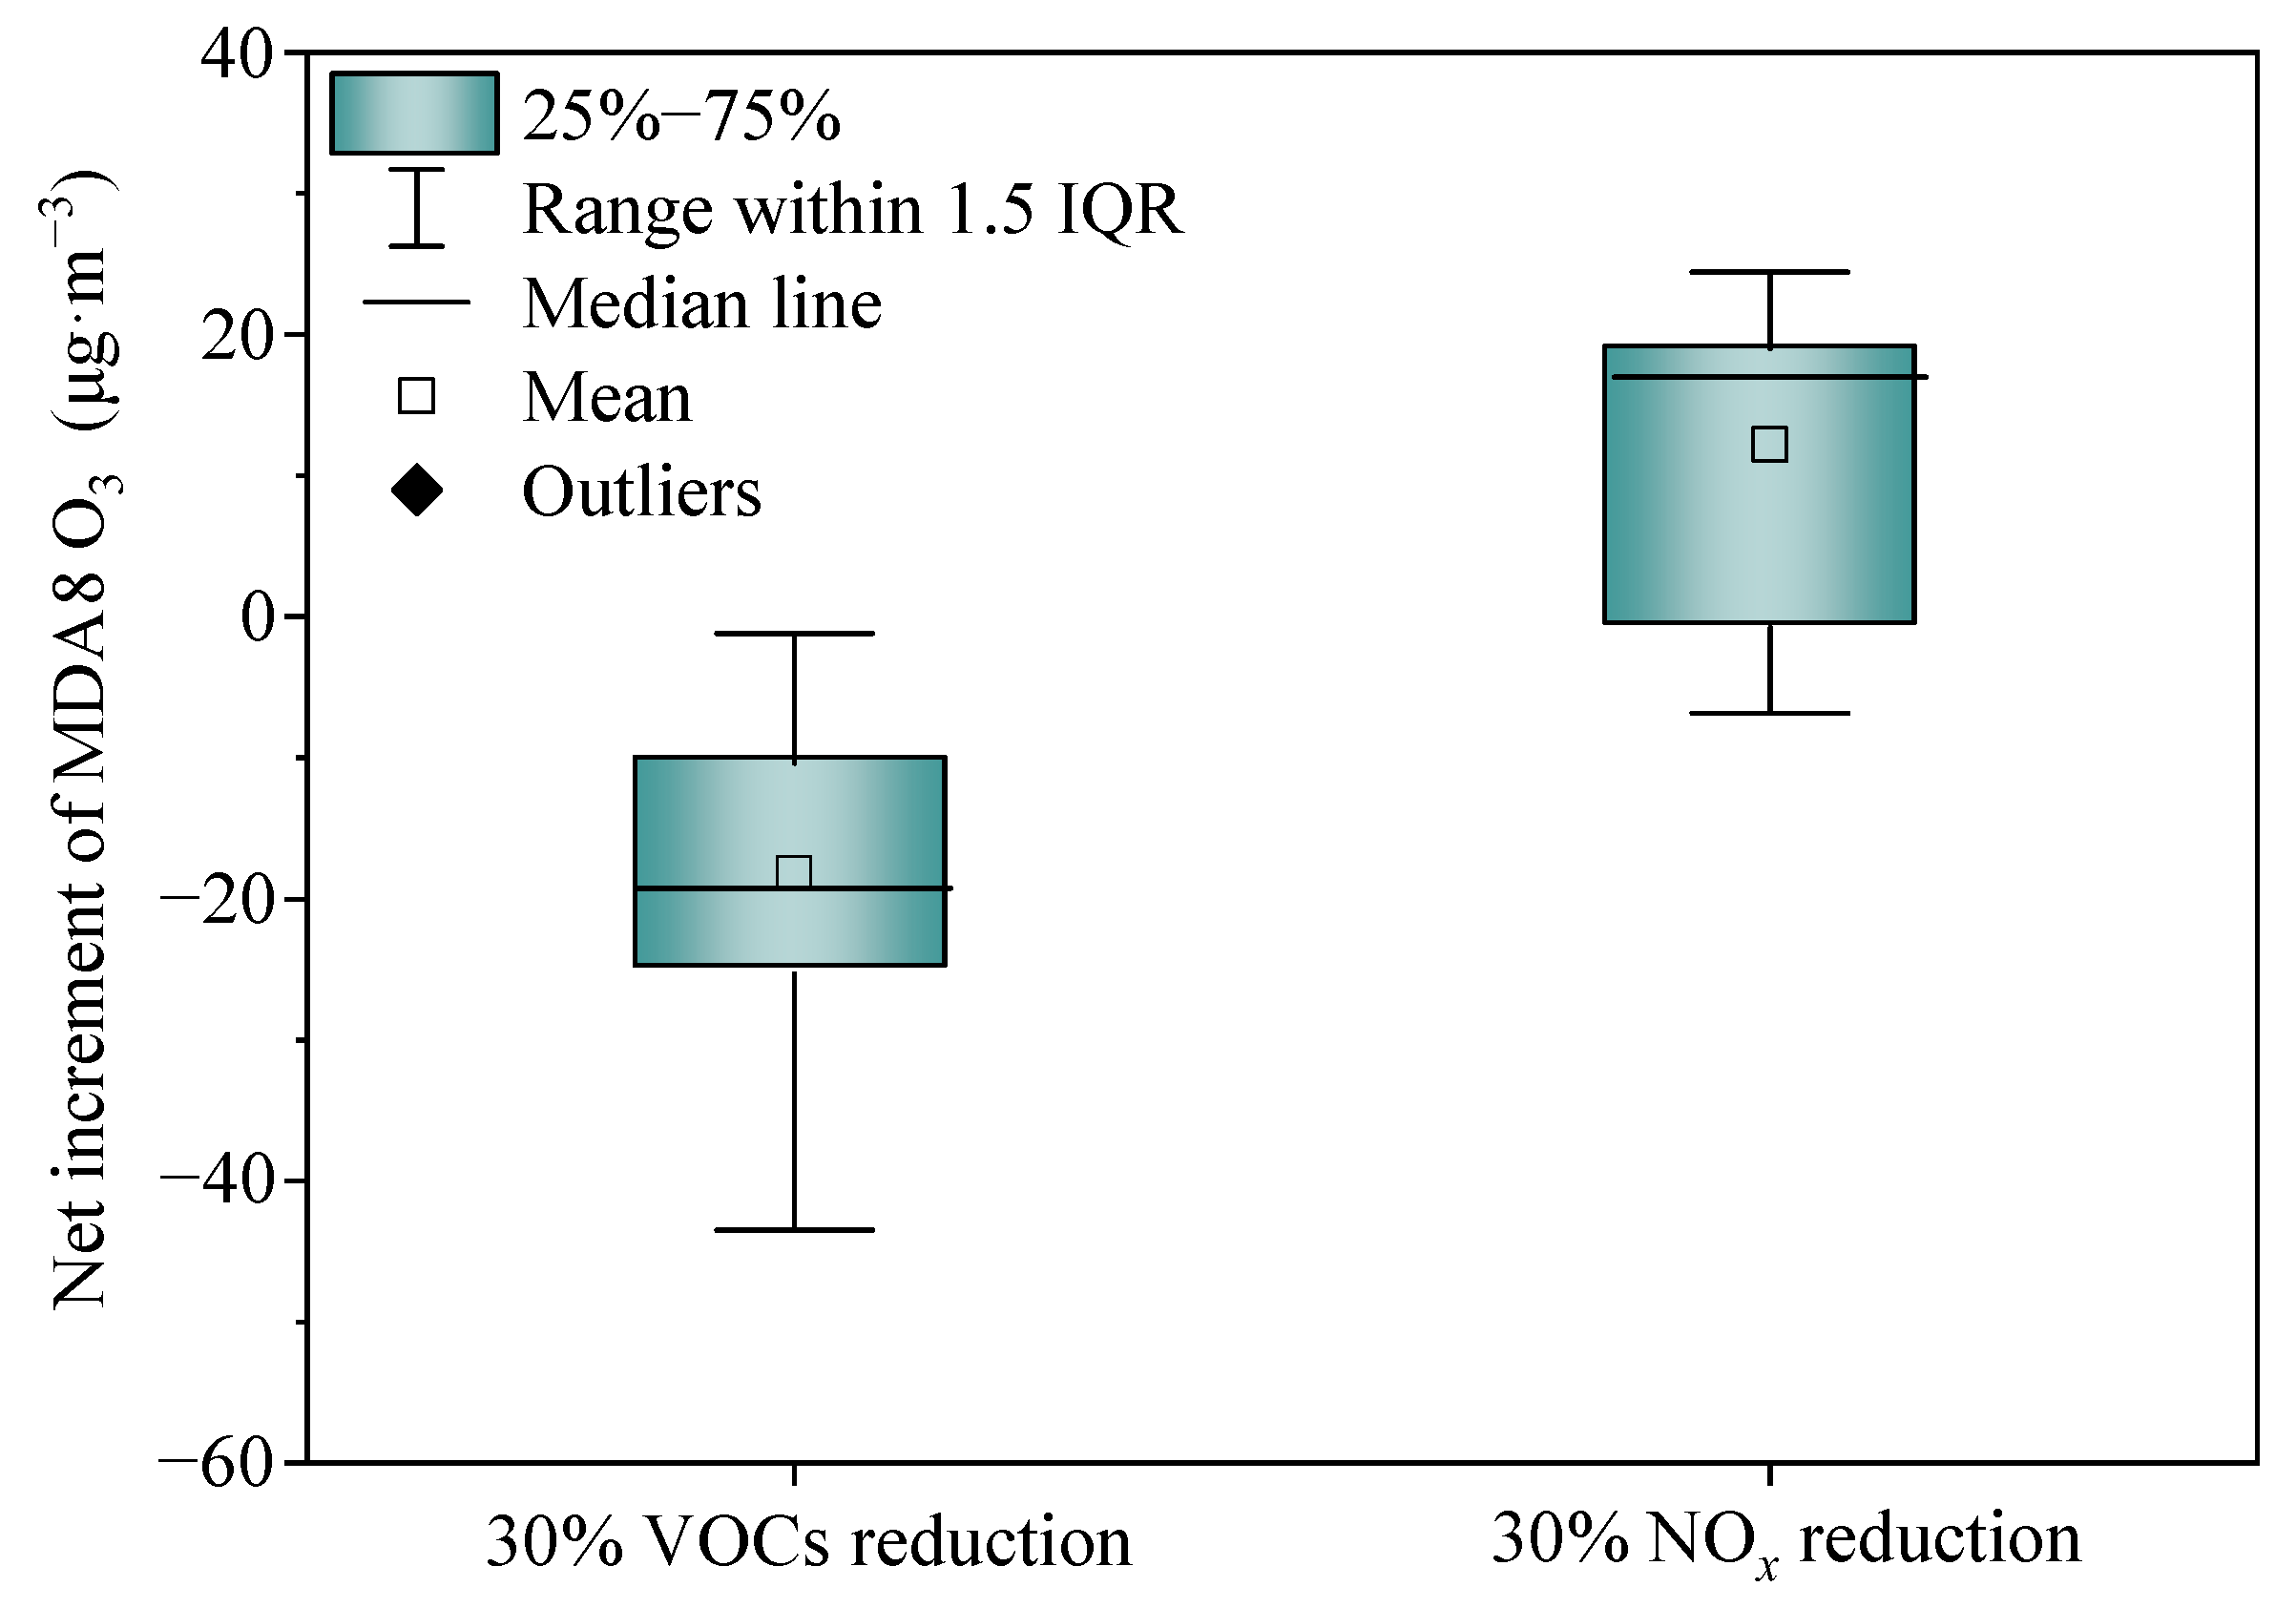
Changes in VOC and NOx concentrations will affect their ambient concentrations and change the O3 formation sensitivity, thereby leading to considerable variation in the O3 concentration [35]. Therefore, it is crucial to clarify the O3 formation sensitivity before formulating effective O3 control strategies. Figure 6 shows that the ratios of VOCs/NOx in downtown Handan were similar from June 2013 to 2018, which indicated that the O3 formation sensitivity had not changed much in downtown Handan. The CMAQ model was adopted to analyze the sensitivity of O3 formation in downtown Handan during June 2018 for Handan to formulate prevention and control strategies after 2018. As shown in Figure 8, the ΔOVOC concentration was within −43.5 to −1.2 μg·m−3, with an average of −18.2 μg·m−3, 30% VOC emission reduction caused a decrease in the MDA8 O3 concentration. The ΔONOx concentration was within −6.8 to 24.4 μg·m−3, 30% NOx emission reduction caused the daily average ΔONOx concentration to rise or decrease, in terms of the monthly average value of ΔONOx was 12.2 μg·m−3, that is, the reduction in 30% NOx emissions will cause the MDA8 O3 concentration to increase. According to the definition Section 2.4, the O3 formation sensitivity in downtown Handan was a VOC-sensitive regime during June 2018. The implication is that cutting VOC emissions can effectively control the concentration of O3 in downtown Handan.
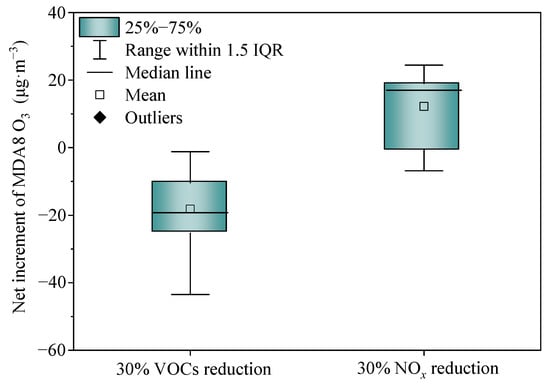
Figure 8.
Net increment of MDA8 O3 concentration for a 30% reduction in VOCs and NOx in downtown Handan during June 2018.
3.4.2. Development of Control Strategies on Both VOCs and NOx
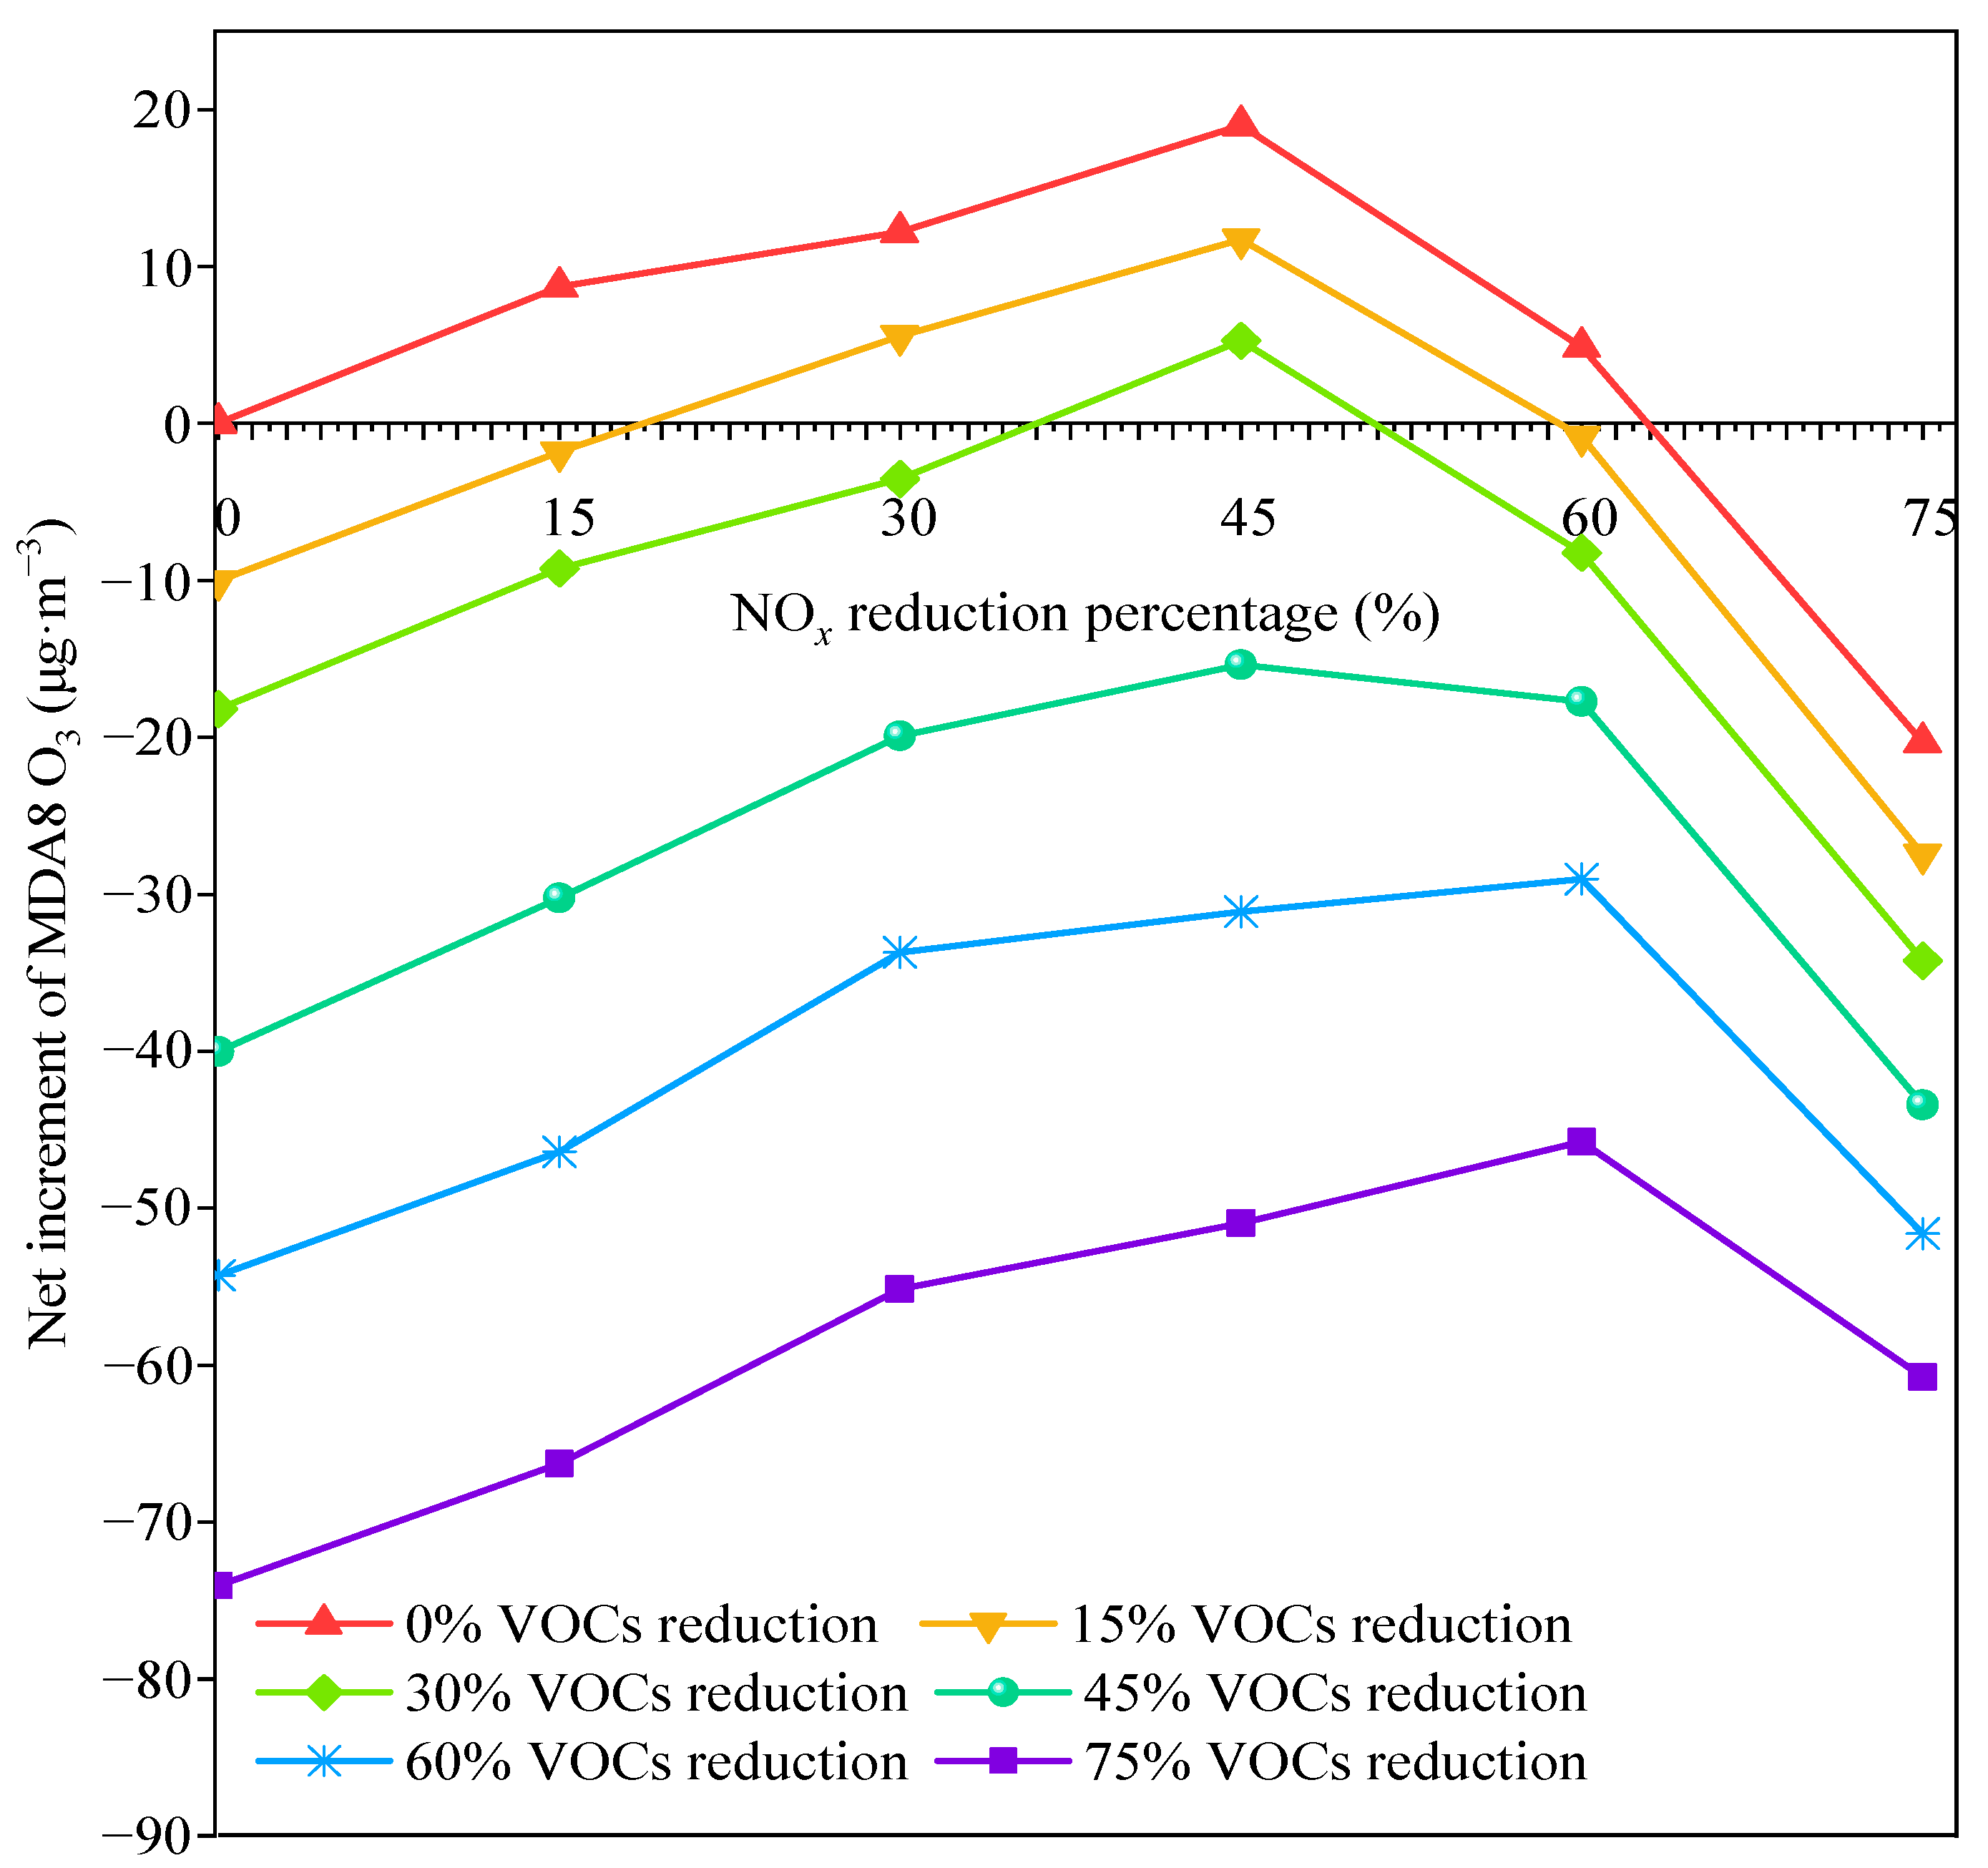
The above discussion based on single species (VOCs or NOx) emission reduction demonstrated that O3 formation was quite sensitive to VOCs in downtown Handan, and only reducing VOC emissions can decrease the concentration of O3. However, in reality, the control strategy of just reducing VOC emissions is difficult to achieve, as society tends to control VOCs and NOx simultaneously. Owing to the non-linear response of O3 to changes in emissions of its precursors, an improper abatement ratio of VOCs/NOx was applied, and the O3 concentration could actually increase [35]. It is unclear how much VOC and NOx emissions should be controlled to achieve an efficient O3 decrease. To address this question, based on the atmospheric pollutant emission inventory of Handan and FNL data in June 2018, we used the WRF-CMAQ model simulation to obtain the MDA8 O3 concentration by adjusting the input anthropogenic VOC and NOx ratios, and the difference between the results of the MDA8 O3 concentration and that of the benchmark scenario (VOC and NOx emissions are not reduced) was used to acquire the net increment in the MDA8 O3 concentration in downtown Handan. Figure 9 illustrates that the net increment in the MDA8 O3 concentration increased as the abatement ratio of NOx increased from 0% to 45% regardless of the decrease in the abatement ratio of VOC emissions from 0% to 75%, whereas the net increment in the MDA8 O3 concentration declined gradually when the abatement ratio of NOx reduction was greater than 60%.
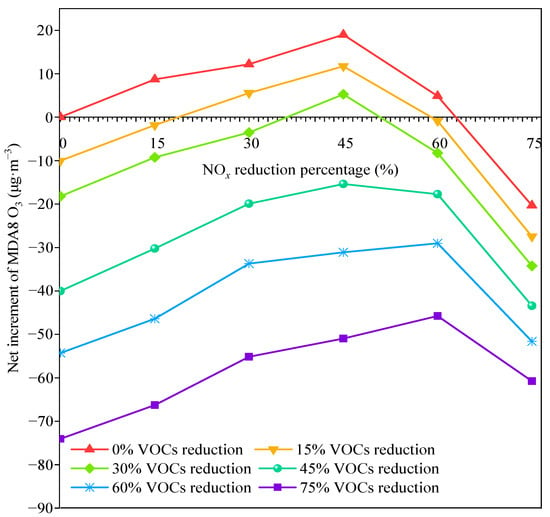
Figure 9.
Net increment of MDA8 O3 as a function of the reduction percentages of NOx and VOCs in downtown Handan during June 2018.
Under the same abatement ratio of NOx emissions, a higher cutdown abatement ratio of VOC emissions always causes a greater decrease in the net increment in the MDA8 O3 concentration. In particular, with the abatement ratio of VOCs >30%, the net increment in the MDA8 O3 concentration declined obviously. Under the same VOC emission reduction rate, the net increment of MDA8 O3 concentration increased with the abatement ratio of NOx emissions from 0% to 45% (or 60%), indicating that VOCs reduction positive sensitivity to O3 would become smaller with NOx emission reduction. Therefore, the increase in O3 concentration in 2016 compared to 2015 when the VOC and NOx emissions continue to decrease by 51.1% and 11.2% respectively as suggested in Figure 4, which may be caused by improper NOx emission reduction. In addition, the “inflection point” that occurred in the abatement ratio of NOx reduction was 45% when the reduction range was 0–30% for VOC emissions, while the “inflection point” that occurred in 60% of the abatement ratio of NOx reduction was when the abatement ratio of VOC reduction was ≥45%. He et al. [35] found similar results in the Pearl River Delta region. This might be due to the weaker atmospheric oxidizing capacity under an excessive abatement ratio of VOC (45–75%) conditions than under the reduction range of 0–30% for VOC emissions, which weakened the NO2 removal through NO2 + hydroxyl radical (OH)→HNO3. Relatively abundant NO2 generated more nitric oxide (NO) via photolysis reaction that would promote the titration reaction between NO and O3. In other words, the excessive abatement ratio of VOC would enlarge the effect range of the NO titration reaction, under this scenario continued to reduce NOx emissions, would reduce the effect of O3 concentration reduction. It means co-reduction of VOC and NOx is essential, and VOC emission reduction rate ranges from 30% to 45%, resulting in the O3 improvement.
The development of VOC and NOx emission reduction strategies must ensure continuous reduction or at least no increase in O3 concentration, and the adoption of an unreasonable abatement ratio of VOCs/NOx would cause an increase in the O3 concentration. The net increment in the MDA8 O3 concentration decreased as the abatement ratio of VOCs was reduced by ≥45% regardless of the abatement ratio of NOx or when the abatement ratio of NOx was ≥75%. Considering the policy feasibility, it was still challenging to achieve the emission targets in the current stage. Accordingly, we focused on the reduction range of 0–50% for NOx and 0–45% for VOCs to devise optimal control measures of VOC and NOx emissions. It was determined that when the abatement ratio of NOx was 0% to 60%, the minimum abatement ratio of VOCs/NOx for a zero MDA8 O3 increment changed from 0.59 to 0.84 (the abatement ratios of VOCs/NOx at the intersections of the curves and the horizontal axis). This indicated that the abatement ratio of VOCs/NOx should be greater than at least 0.84 to prevent an increase in the O3 concentration in downtown Handan. Similar results showed that the abatement ratio of VOCs/NOx should be no less than 0.72 in Shanghai [18], in the Heshan site of the Pearl River Delta region it should be higher than 1.10 to prevent the increase in the O3 levels [35], and that in Wuhan it was 1.1 [36], thereby suggesting that different cities should try to control the increase in O3 and they will need to formulate a localized abatement ratio of VOCs and NOx emissions.
4. Conclusions
Handan as a typical industrial city in China has been experiencing worsening summer O3 pollution recently. We found that emissions of anthropogenic VOC and NOx decreased during June 2013–2018 (VOC emissions increased slightly in June 2018). Whereas the MDA8 O3 concentration decreased yearly from June of 2013 to 2015, showed an increasing tendency after 2015, and the MDA8 O3 concentration in 2018 was 72.9% higher than that in 2015. Through the WRF-CMAQ simulation system, we identified that the reduction of O3 concentration in June 2014–2016 was mainly caused by emission change. However, the meteorological conditions and emission changes drove the June 2017–2018 ozone trend and meteorological conditions were not negligible but emissions were dominant.
We found that downtown Handan is a typical VOC-sensitive, O3-polluted region, and the reduction in VOC could lead to a monotonous decrease in the MDA8 O3 concentration. Therefore, controlling VOC emissions can effectively reduce the formation of O3. Afterwards, we designed 36 precursor reduction scenarios based on 2018 emissions and further simulated O3 over downtown Handan under these reduction scenarios to find that VOCs reduction would continuously bring about O3 decreases under various NOx reductions, but its positive sensitivity to O3 would become smaller with NOx reduction. However, the positive influence of NOx reduction on O3 would happen until NOx reduction exceeding 45–60%. Thus, considering that the control strategy of only reducing VOC emissions is difficult to achieve, so the abatement ratio of VOCs/NOx should be no less than 0.84 to prevent net O3 increment in downtown Handan. Overall, this study will help local government policymakers to put forward effective control measures for O3 pollution in Handan or other regions of China.
Author Contributions
Writing—original draft preparation, writing and editing: S.Y. Writing—review and editing, supervision: W.W. and S.C. Data curation: Y.N. and P.G. All the authors contribute to interpretation, discussion, review and editing the manuscript. All authors have read and agreed to the published version of the manuscript.
Funding
This research was funded by the National Natural Science Foundation of China (No. 91544232 & 51638001) and the National Key Research and Development Program of China (No. 2018YFC0213206).
Conflicts of Interest
The authors declare no conflict of interest.
Appendix A

Table A1.
Model configurations and components.
Table A1.
Model configurations and components.
| Option | Parameterization Scheme | |
|---|---|---|
| Domain 1 (9 km) | Domain 2 (3 km) | |
| Map projection | Lambert | Lambert |
| Integral time step | 60 | 20 |
| Microphysics | Lin microphysics | Lin microphysics |
| Cumulus Convection | Kain-Fritsch | none for the 3 km resolution run |
| Longwave radiation | Rapid Radiative Transfer Model (RRTM) | RRTM |
| Shortwave radiation | Dudhia | Dudhia |
| Land surface | Noah | Noah |
| Planetary boundary layer | Yonsei University (YSU) | YSU |
| Longitude and latitude of grid center | 37.48° N,114.5° E | 37.48° N,114.5° E |
| Horizontal advection/Vertical advection | Piecewise Parabolic Method (PPM) | PPM |
| Vertical diffusion | Crank-Nicholson | Crank-Nicholson |
| Gas-phase chemistry | Carbon Bond mechanism (CB05) | CB05 |
| Aerosol chemistry | Aero6 | Aero6 |
Based on the observed data of meteorological and pollutants parameters from June 2013–2018 in Handan (the observed data are detailed in Section 2.1), the performance of our model simulation was evaluated. The normalized mean bias (NMB), the normalized mean error (NME) and the correlation coefficient (R) were used to evaluate the performance in simulating horizontal distribution of the WRF and CMAQ simulation results.
Table A2 shows the performance statistics for hourly-averaged temperature (T), relative humidity (RH) at 2 m and wind speed (WS) at 10 m during June 2013–2018 in Handan. T, RH and WS were widely applied and extensively discussed for the verification of the WRF model [37]. T with an NMB range of −4.0–3.0% and an R range of 0.74–0.89, the results were better than those of Wang et al. [38], but slightly worse than those of Sun et al. [39]. RH with NMB varying from −2.1–11.1% and an R range of 0.82–0.89. WS simulation results were all higher than the observations, and there was a clear overestimation, while the results basically are consistent with a previous study [40]. In general, the WRF model simulation could be used for the CMAQ model.
The performance of the CMAQ model was assessed by comparing the observations and the simulation results for MDA8 O3 concentration. Table A3 shows that MDA8 O3 concentration with an NMB range of −11.7% to −0.8% and an R range of 0.68–0.78, and that the MDA8 O3 simulation results were underestimated to a certain extent. All NMBs and Rs are within the threshold for satisfactory performance proposed by recommended benchmarks for photochemical model performance statistics [41]. Overall, the WRF-CMAQ model exhibited an acceptable performance for O3.

Table A2.
Performance statistics of meteorological variables simulation results.
Table A2.
Performance statistics of meteorological variables simulation results.
| Variables | Performance Metric | Year | |||||
|---|---|---|---|---|---|---|---|
| 2013 | 2014 | 2015 | 2016 | 2017 | 2018 | ||
| T | NMB (%) | −4.0 | −1.0 | −2.0 | 0.0 | 1.3 | 3.0 |
| NME (%) | 7.9 | 7.5 | 6.5 | 7.7 | 6.0 | 8.7 | |
| R | 0.81 | 0.74 | 0.84 | 0.80 | 0.89 | 0.82 | |
| RH | NMB (%) | 11.1 | 2.4 | 8.2 | 3.4 | −2.1 | 1.7 |
| NME (%) | 13.5 | 9.7 | 22.9 | 18.7 | 12.1 | 14.4 | |
| R | 0.88 | 0.89 | 0.85 | 0.82 | 0.89 | 0.86 | |
| WS | NMB (%) | 26.9 | 26.8 | 32.1 | 54.0 | 60.4 | 31.1 |
| NME (%) | 54.0 | 45.7 | 56.3 | 72.1 | 80.1 | 51.6 | |
| R | 0.53 | 0.54 | 0.56 | 0.53 | 0.48 | 0.53 | |

Table A3.
Performance statistics of MDA8 ozone concentration simulation results.
Table A3.
Performance statistics of MDA8 ozone concentration simulation results.
| Variables | Performance Metric | Year | |||||
|---|---|---|---|---|---|---|---|
| 2013 | 2014 | 2015 | 2016 | 2017 | 2018 | ||
| MDA8 ozone data | NMB (%) | −6.1 | −0.8 | −4.0 | −10.8 | −6.9 | −11.7 |
| NME (%) | 23.6 | 19.4 | 22.6 | 19.1 | 16.7 | 14.4 | |
| R | 0.68 | 0.71 | 0.73 | 0.76 | 0.75 | 0.78 | |
References
- Ou, J.; Zheng, J.; Li, R.; Huang, X.; Zhong, Z.; Zhong, L.; Lin, H. Speciated OVOC and VOC emission inventories and their implications for reactivity-based ozone control strategy in the Pearl River Delta region, China. Sci. Total Environ. 2015, 530–531, 393–402. [Google Scholar] [CrossRef]
- Zhai, S.X.; Jacob, D.J.; Wang, X.; Shen, L.; Li, K.; Zhang, Y.Z.; Gui, K.; Zhao, T.L.; Liao, H. Fine particulate matter (PM2.5) trends in China, 2013–2018: Separating contributions from anthropogenic emissions and meteorology. Atmos. Chem. Phys. 2019, 19, 11031–11041. [Google Scholar] [CrossRef]
- Li, K.; Jacob, D.J.; Liao, H.; Zhu, J.; Shah, V.; Shen, L.; Bates, K.H.; Zhang, Q.; Zhai, S.X. A two-pollutant strategy for improving ozone and particulate air quality in China. Nat. Geosci. 2019, 12, 906–910. [Google Scholar] [CrossRef]
- Lu, X.; Hong, J.Y.; Zhang, L.; Cooper, O.R.; Schultz, M.G.; Xu, X.B.; Wang, T.; Gao, M.; Zhao, Y.H.; Zhang, Y.H. Severe Surface Ozone Pollution in China: A Global Perspective. Environ. Sci. Technol. Lett. 2018, 5, 487–494. [Google Scholar] [CrossRef]
- Li, K.; Jacob, D.J.; Liao, H.; Shen, L.; Zhang, Q.; Bates, K.H. Anthropogenic drivers of 2013–2017 trends in summer surface ozone in China. Proc. Natl. Acad. Sci. USA 2019, 116, 422–427. [Google Scholar] [CrossRef] [PubMed]
- Yan, Y.Y.; Lin, J.T.; He, C.L. Ozone trends over the United States at different times of day. Atmos. Chem. Phys. 2018, 18, 1185–1202. [Google Scholar] [CrossRef]
- Yan, Y.Y.; Lin, J.T.; Pozzer, A.; Kong, S.F.; Lelieveld, J. Trend reversal from high-to-low and from rural-to-urban ozone concentrations over Europe. Atmos. Environ. 2019, 213, 25–36. [Google Scholar] [CrossRef]
- Zavala, M.; Brune, W.H.; Velasco, E.; Retama, A.; Cruz-Alavez, L.A.; Molina, L.T. Changes in ozone production and VOC reactivity in the atmosphere of the Mexico City Metropolitan Area. Atmos. Environ. 2020, 238, 117747. [Google Scholar] [CrossRef]
- Malley, C.S.; Henze, D.K.; Kuylenstierna, J.C.I.; Vallack, H.W.; Davila, Y.; Anenberg, S.C.; Turner, M.C.; Ashmore, M.R. Updated Global Estimates of Respiratory Mortality in Adults ≥30 Years of Age Attributable to Long-Term Ozone Exposure. Environ. Health Perspect. 2017, 125. [Google Scholar] [CrossRef]
- Avnery, S.; Mauzerall, D.L.; Liu, J.F.; Horowitz, L.W. Global crop yield reductions due to surface ozone exposure: 2. Year 2030 potential crop production losses and economic damage under two scenarios of O3 pollution. Atmos. Environ. 2011, 45, 2297–2309. [Google Scholar] [CrossRef]
- Yue, X.; Unger, N.; Harper, K.; Xia, X.G.; Liao, H.; Zhu, T.; Xiao, J.F.; Feng, Z.Z.; Li, J. Ozone and haze pollution weakens net primary productivity in China. Atmos. Chem. Phys. 2017, 17, 6073–6089. [Google Scholar] [CrossRef]
- Liu, H.; Liu, S.; Xue, B.R.; Lv, Z.F.; Meng, Z.H.; Yang, X.F.; Xue, T.; Yu, Q.; He, K.B. Ground-level ozone pollution and its health impacts in China. Atmos. Environ. 2018, 173, 223–230. [Google Scholar] [CrossRef]
- Li, Q.Y.; Zhang, L.; Wang, T.; Wang, Z.; Fu, X.; Zhang, Q. “New” Reactive Nitrogen Chemistry Reshapes the Relationship of Ozone to Its Precursors. Environ. Sci. Technol. 2018, 52, 2810–2818. [Google Scholar] [CrossRef]
- Li, Y.; Lau, A.K.H.; Fung, J.C.H.; Zheng, J.Y.; Zhong, L.J.; Louie, P.K.K. Ozone source apportionment (OSAT) to differentiate local regional and super-regional source contributions in the Pearl River Delta region, China. J. Geophys. Res.-Atmos. 2012, 117. [Google Scholar] [CrossRef]
- Li, K.; Jacob, D.J.; Shen, L.; Lu, X.; De Smedt, I.; Liao, H. Increases in surface ozone pollution in China from 2013 to 2019: Anthropogenic and meteorological influences. Atmos. Chem. Phys. 2020, 20, 11423–11433. [Google Scholar] [CrossRef]
- Fiore, A.M.; Naik, V.; Spracklen, D.V.; Steiner, A.; Unger, N.; Prather, M.; Bergmann, D.; Cameron-Smith, P.J.; Cionni, I.; Collins, W.J.; et al. Global air quality and climate. Chem. Soc. Rev. 2012, 41, 6663–6683. [Google Scholar] [CrossRef]
- Wang, T.; Xue, L.K.; Brimblecombe, P.; Lam, Y.F.; Li, L.; Zhang, L. Ozone pollution in China: A review of concentrations, meteorological influences, chemical precursors, and effects. Sci. Total Environ. 2017, 575, 1582–1596. [Google Scholar] [CrossRef]
- Zhang, K.; Li, L.; Huang, L.; Wang, Y.; Huo, J.; Duan, Y.; Wang, Y.; Fu, Q. The impact of volatile organic compounds on ozone formation in the suburban area of Shanghai. Atmos. Environ. 2020, 232. [Google Scholar] [CrossRef]
- Souri, A.H.; Nowlan, C.R.; Abad, G.G.; Zhu, L.; Blake, D.R.; Fried, A.; Weinheimer, A.J.; Wisthaler, A.; Woo, J.H.; Zhang, Q.; et al. An inversion of NOx and non-methane volatile organic compound (NMVOC) emissions using satellite observations during the KORUS-AQ campaign and implications for surface ozone over East Asia. Atmos. Chem. Phys. 2020, 20, 9837–9854. [Google Scholar] [CrossRef]
- Wang, M.Y.; Yim, S.H.L.; Wong, D.C.; Ho, K.F. Source contributions of surface ozone in China using an adjoint sensitivity analysis. Sci. Total Environ. 2019, 662, 385–392. [Google Scholar] [CrossRef]
- Wang, Z.B.; Li, J.X.; Liang, L.W. Spatio-temporal evolution of ozone pollution and its influencing factors in the Beijing-Tianjin-Hebei Urban Agglomeration. Environ. Pollut. 2020, 256, 113419. [Google Scholar] [CrossRef] [PubMed]
- Li, L.; Xie, S.; Zeng, L.; Wu, R.; Li, J. Characteristics of volatile organic compounds and their role in ground-level ozone formation in the Beijing-Tianjin-Hebei region, China. Atmos. Environ. 2015, 113, 247–254. [Google Scholar] [CrossRef]
- Yang, S.; Ma, Y.L.; Duan, F.K.; He, K.B.; Wang, L.T.; Wei, Z.; Zhu, L.D.; Ma, T.; Li, H.; Ye, S.Q. Characteristics and formation of typical winter haze in Handan, one of the most polluted cities in China. Sci. Total Environ. 2018, 613, 1367–1375. [Google Scholar] [CrossRef]
- Li, L.; Chen, C.H.; Huang, C.; Huang, H.Y.; Zhang, G.F.; Wang, Y.J.; Wang, H.L.; Lou, S.R.; Qiao, L.P.; Zhou, M.; et al. Process analysis of regional ozone formation over the Yangtze River Delta, China using the Community Multi-scale Air Quality modeling system. Atmos. Chem. Phys. 2012, 12, 10971–10987. [Google Scholar] [CrossRef]
- Wang, X.; Zhang, Y.; Hu, Y.; Zhou, W.; Lu, K.; Zhong, L.; Zeng, L.; Shao, M.; Hu, M.; Russell, A.G. Process analysis and sensitivity study of regional ozone formation over the Pearl River Delta, China, during the PRIDE-PRD2004 campaign using the Community Multiscale Air Quality modeling system. Atmos. Chem. Phys. 2010, 10, 4423–4437. [Google Scholar] [CrossRef]
- Zhao, S.; Yu, Y.; Yin, D.; He, J.; Liu, N.; Qu, J.; Xiao, J. Annual and diurnal variations of gaseous and particulate pollutants in 31 provincial capital cities based on in situ air quality monitoring data from China National Environmental Monitoring Center. Environ. Int. 2016, 86, 92–106. [Google Scholar] [CrossRef]
- Guenther, A.; Karl, T.; Harley, P.; Wiedinmyer, C.; Palmer, P.I.; Geron, C. Estimates of global terrestrial isoprene emissions using MEGAN (Model of Emissions of Gases and Aerosols from Nature). Atmos. Chem. Phys. 2006, 6, 3181–3210. [Google Scholar] [CrossRef]
- Lang, J.; Tian, J.; Zhou, Y.; Li, K.; Chen, D.; Huang, Q.; Xing, X.; Zhang, Y.; Cheng, S. A high temporal-spatial resolution air pollutant emission inventory for agricultural machinery in China. J. Clean. Prod. 2018, 183, 1110–1121. [Google Scholar] [CrossRef]
- Zhou, Y.; Cheng, S.; Li, J.; Lang, J.; Li, L.; Chen, D. A new statistical modeling and optimization framework for establishing high-resolution PM10 emission inventory—II. Integrated air quality simulation and optimization for performance improvement. Atmos. Environ. 2012, 60, 623–631. [Google Scholar] [CrossRef]
- Zhou, Y.; Cheng, S.; Chen, D.; Lang, J.; Zhao, B.; Wei, W. A new statistical approach for establishing high-resolution emission inventory of primary gaseous air pollutants. Atmos. Environ. 2014, 94, 392–401. [Google Scholar] [CrossRef]
- Dunker, A.M.; Yarwood, G.; Ortmann, J.P.; Wilson, G.M. Comparison of source apportionment and source sensitivity of ozone in a three-dimensional air quality model. Environ. Sci. Technol. 2002, 36, 2953–2964. [Google Scholar] [CrossRef]
- National Bureau of Statistics Handan Investigation Team. Handan Statistical Bulletin of National Economic and Social Development 2018. Available online: https://www.cnstats.org/tjgb/201905/hdshds-2018-pjl_2.html (accessed on 16 February 2021).
- Wei, W.; Li, Y.; Ren, Y.T.; Cheng, S.Y.; Han, L.H. Sensitivity of summer ozone to precursor emission change over Beijing during 2010–2015: A WRF-Chem modeling study. Atmos. Environ. 2019, 218, 116984. [Google Scholar] [CrossRef]
- Yang, X.Y.; Wu, K.; Wang, H.L.; Liu, Y.M.; Gu, S.; Lu, Y.Q.; Zhang, X.L.; Hu, Y.S.; Ou, Y.H.; Wang, S.G.; et al. Summertime ozone pollution in Sichuan Basin, China: Meteorological conditions, sources and process analysis. Atmos. Environ. 2020, 226, 117392. [Google Scholar] [CrossRef]
- He, Z.R.; Wang, X.M.; Ling, Z.H.; Zhao, J.; Guo, H.; Shao, M.; Wang, Z. Contributions of different anthropogenic volatile organic compound sources to ozone formation at a receptor site in the Pearl River Delta region and its policy implications. Atmos. Chem. Phys. 2019, 19, 8801–8816. [Google Scholar] [CrossRef]
- Lyu, X.P.; Chen, N.; Guo, H.; Zhang, W.H.; Wang, N.; Wang, Y.; Liu, M. Corrigendum to “Ambient volatile organic compounds and their effect on ozone production in Wuhan, central China” [Sci. Total Environ. 541 (2016) 200–209]. Sci. Total Environ. 2016, 548–549, 483. [Google Scholar] [CrossRef]
- Wang, L.T.; Zhang, Y.; Wang, K.; Zheng, B.; Zhang, Q.; Wei, W. Application of Weather Research and Forecasting Model with Chemistry (WRF/Chem) over northern China: Sensitivity study, comparative evaluation, and policy implications. Atmos. Environ. 2016, 124, 337–350. [Google Scholar] [CrossRef]
- Wang, L.T.; Wei, Z.; Wei, W.; Fu, J.S.; Meng, C.C.; Ma, S.M. Source apportionment of PM 2.5 in top polluted cities in Hebei, China using the CMAQ model. Atmos. Environ. 2015, 122, 723–736. [Google Scholar] [CrossRef]
- Sun, X.W.; Cheng, S.Y.; Lang, J.L.; Ren, Z.H.; Sun, C. Development of emissions inventory and identification of sources for priority control in the middle reaches of Yangtze River Urban Agglomerations. Sci. Total Environ. 2018, 625, 155–167. [Google Scholar] [CrossRef]
- Hong, C.P.; Zhang, Q.; Zhang, Y.; Tang, Y.H.; Tong, D.; He, K.B. Multi-year downscaling application of two-way coupled WRF v3.4 and CMAQ v5.0.2 over east Asia for regional climate and air quality modeling: Model evaluation and aerosol direct effects. Geosci. Model Dev. 2017, 10, 2447–2470. [Google Scholar] [CrossRef]
- Emery, C.; Liu, Z.; Russell, A.G.; Odman, M.T.; Yarwood, G.; Kumar, N. Recommendations on statistics and benchmarks to assess photochemical model performance. J. Air Waste Manag. Assoc. 2017, 67, 582–598. [Google Scholar] [CrossRef]
Publisher’s Note: MDPI stays neutral with regard to jurisdictional claims in published maps and institutional affiliations. |
© 2021 by the authors. Licensee MDPI, Basel, Switzerland. This article is an open access article distributed under the terms and conditions of the Creative Commons Attribution (CC BY) license (https://creativecommons.org/licenses/by/4.0/).

