
Annual and Seasonal Precipitation and Their Extremes over the Tibetan Plateau and Its Surroundings in 1963–2015


Abstract
1. Introduction
2. Methods
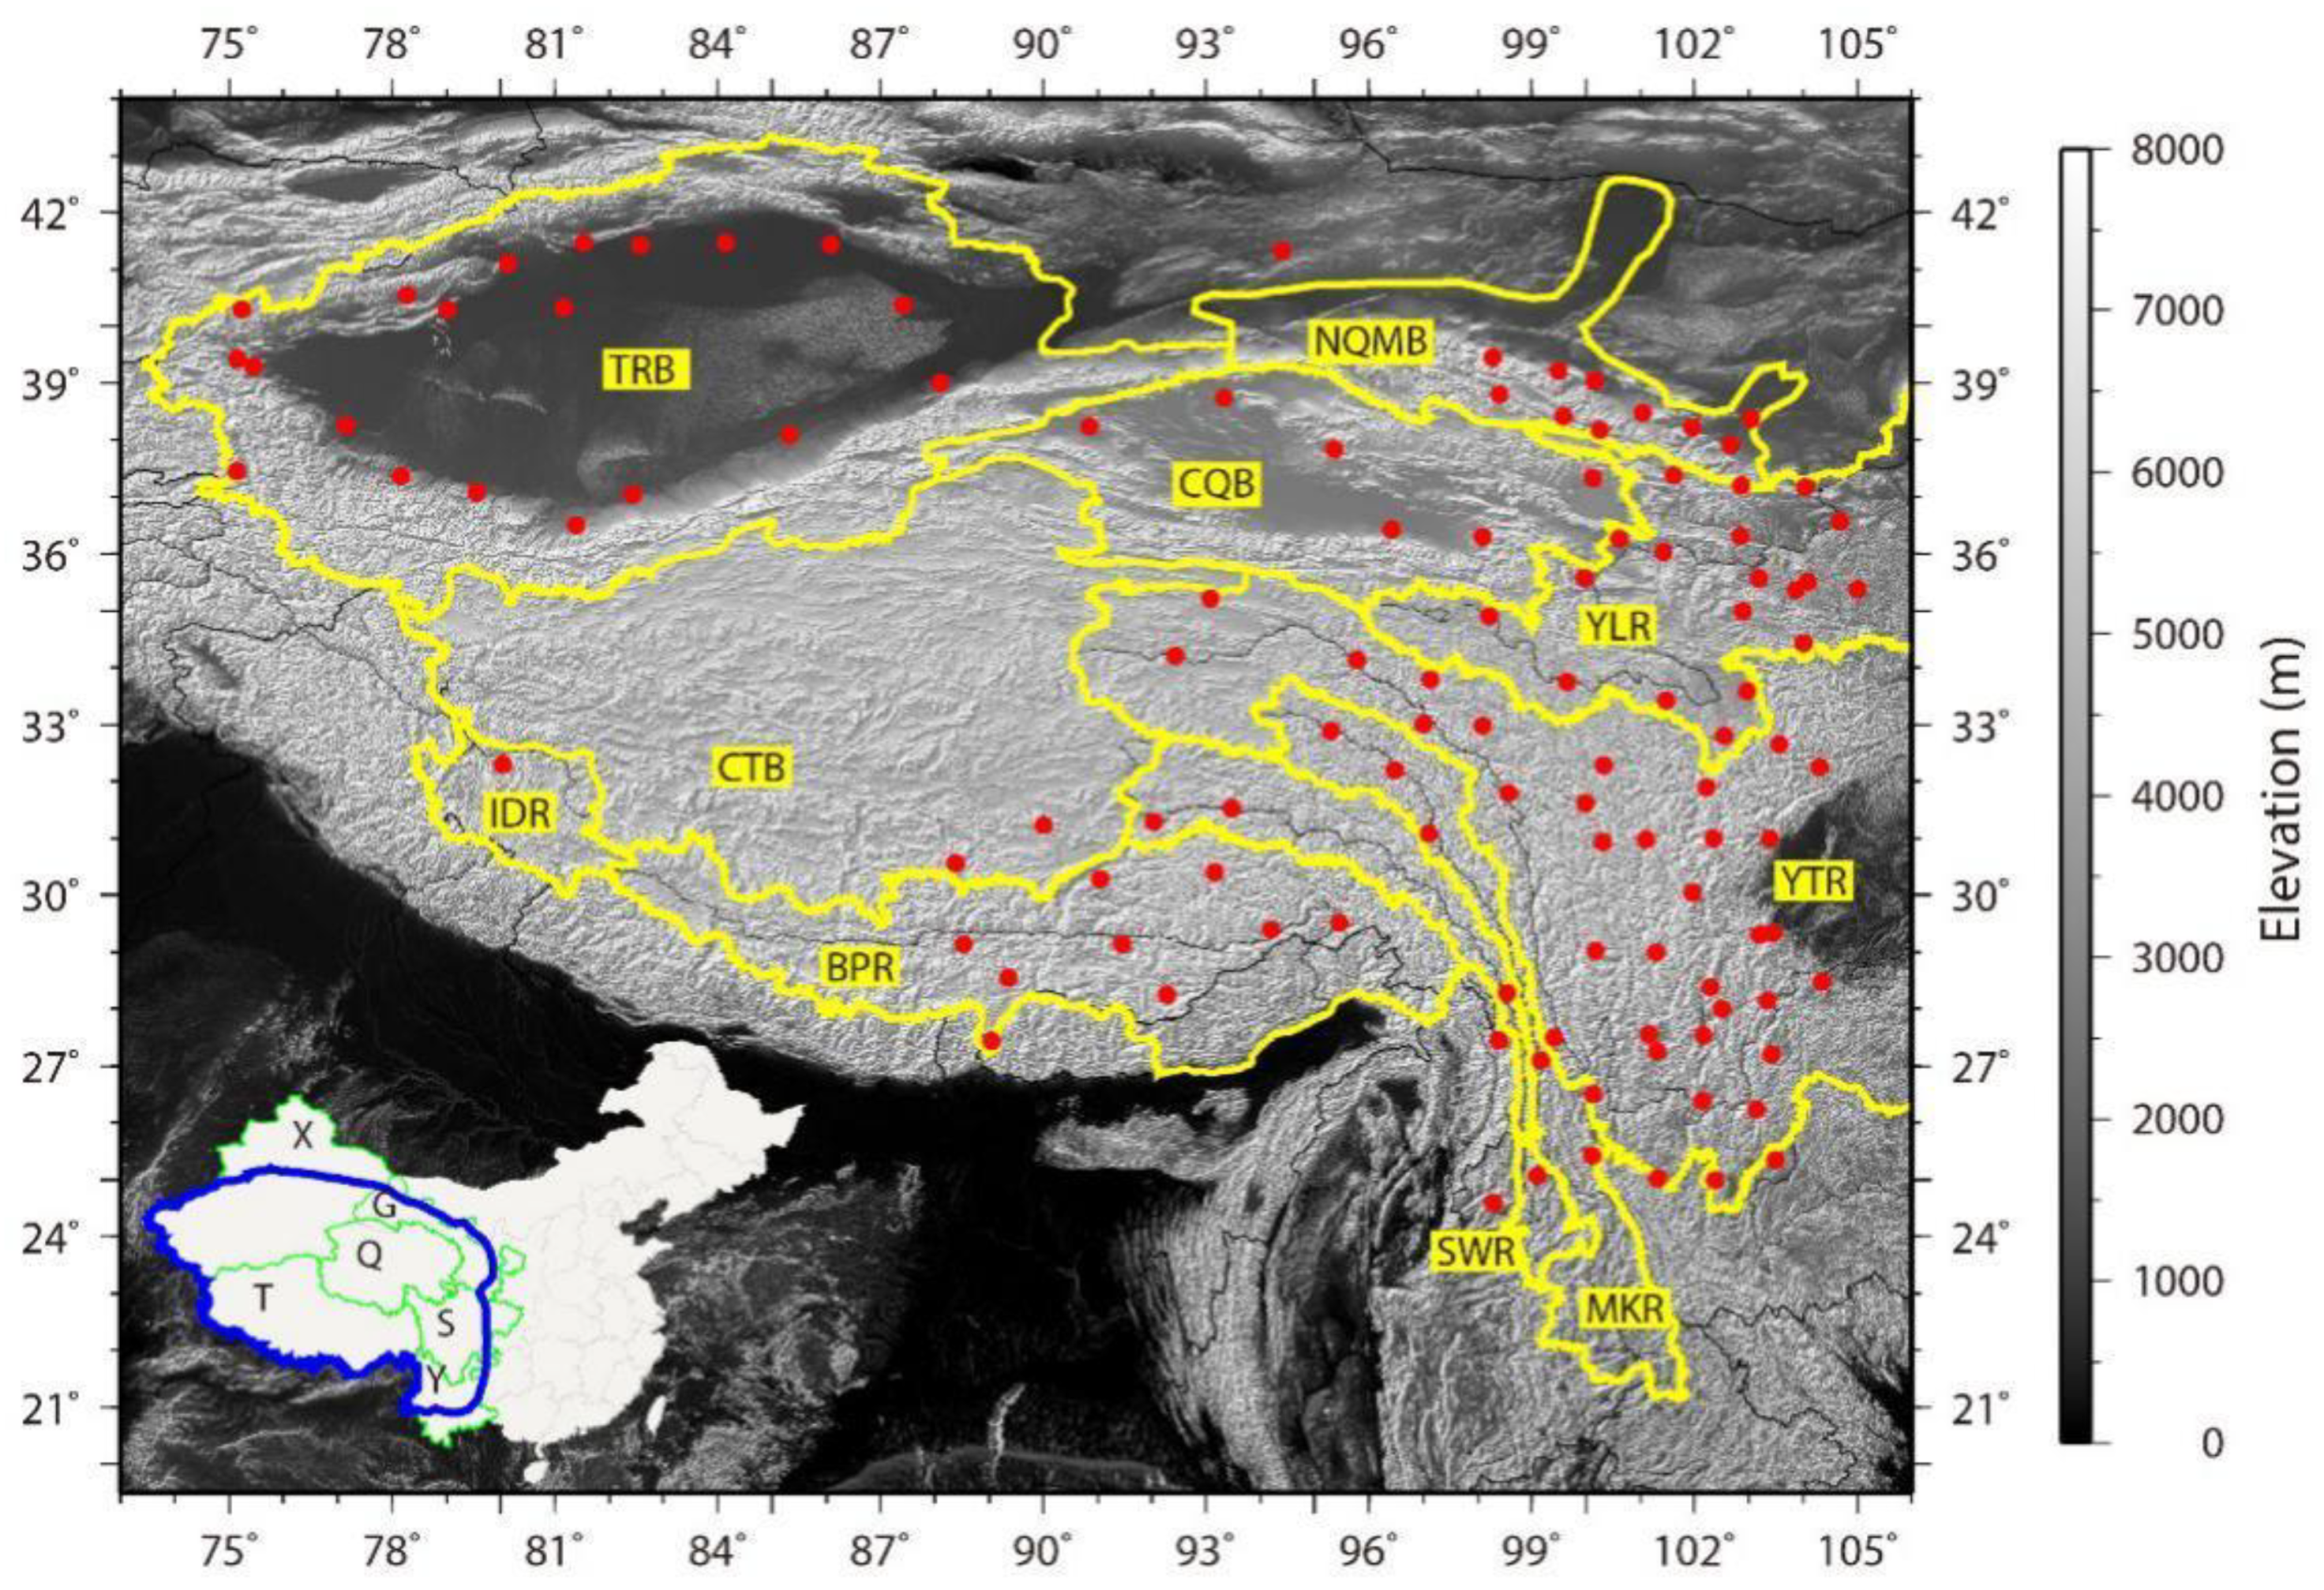
2.1. Study Domain
2.2. Data
2.3. Methods
2.3.1. Trend Test
2.3.2. Gumbel Distribution
2.3.3. Goodness of Fit Test for Recurrence Period
2.3.4. Maximum Length of Dry Spell—CDD
3. Results
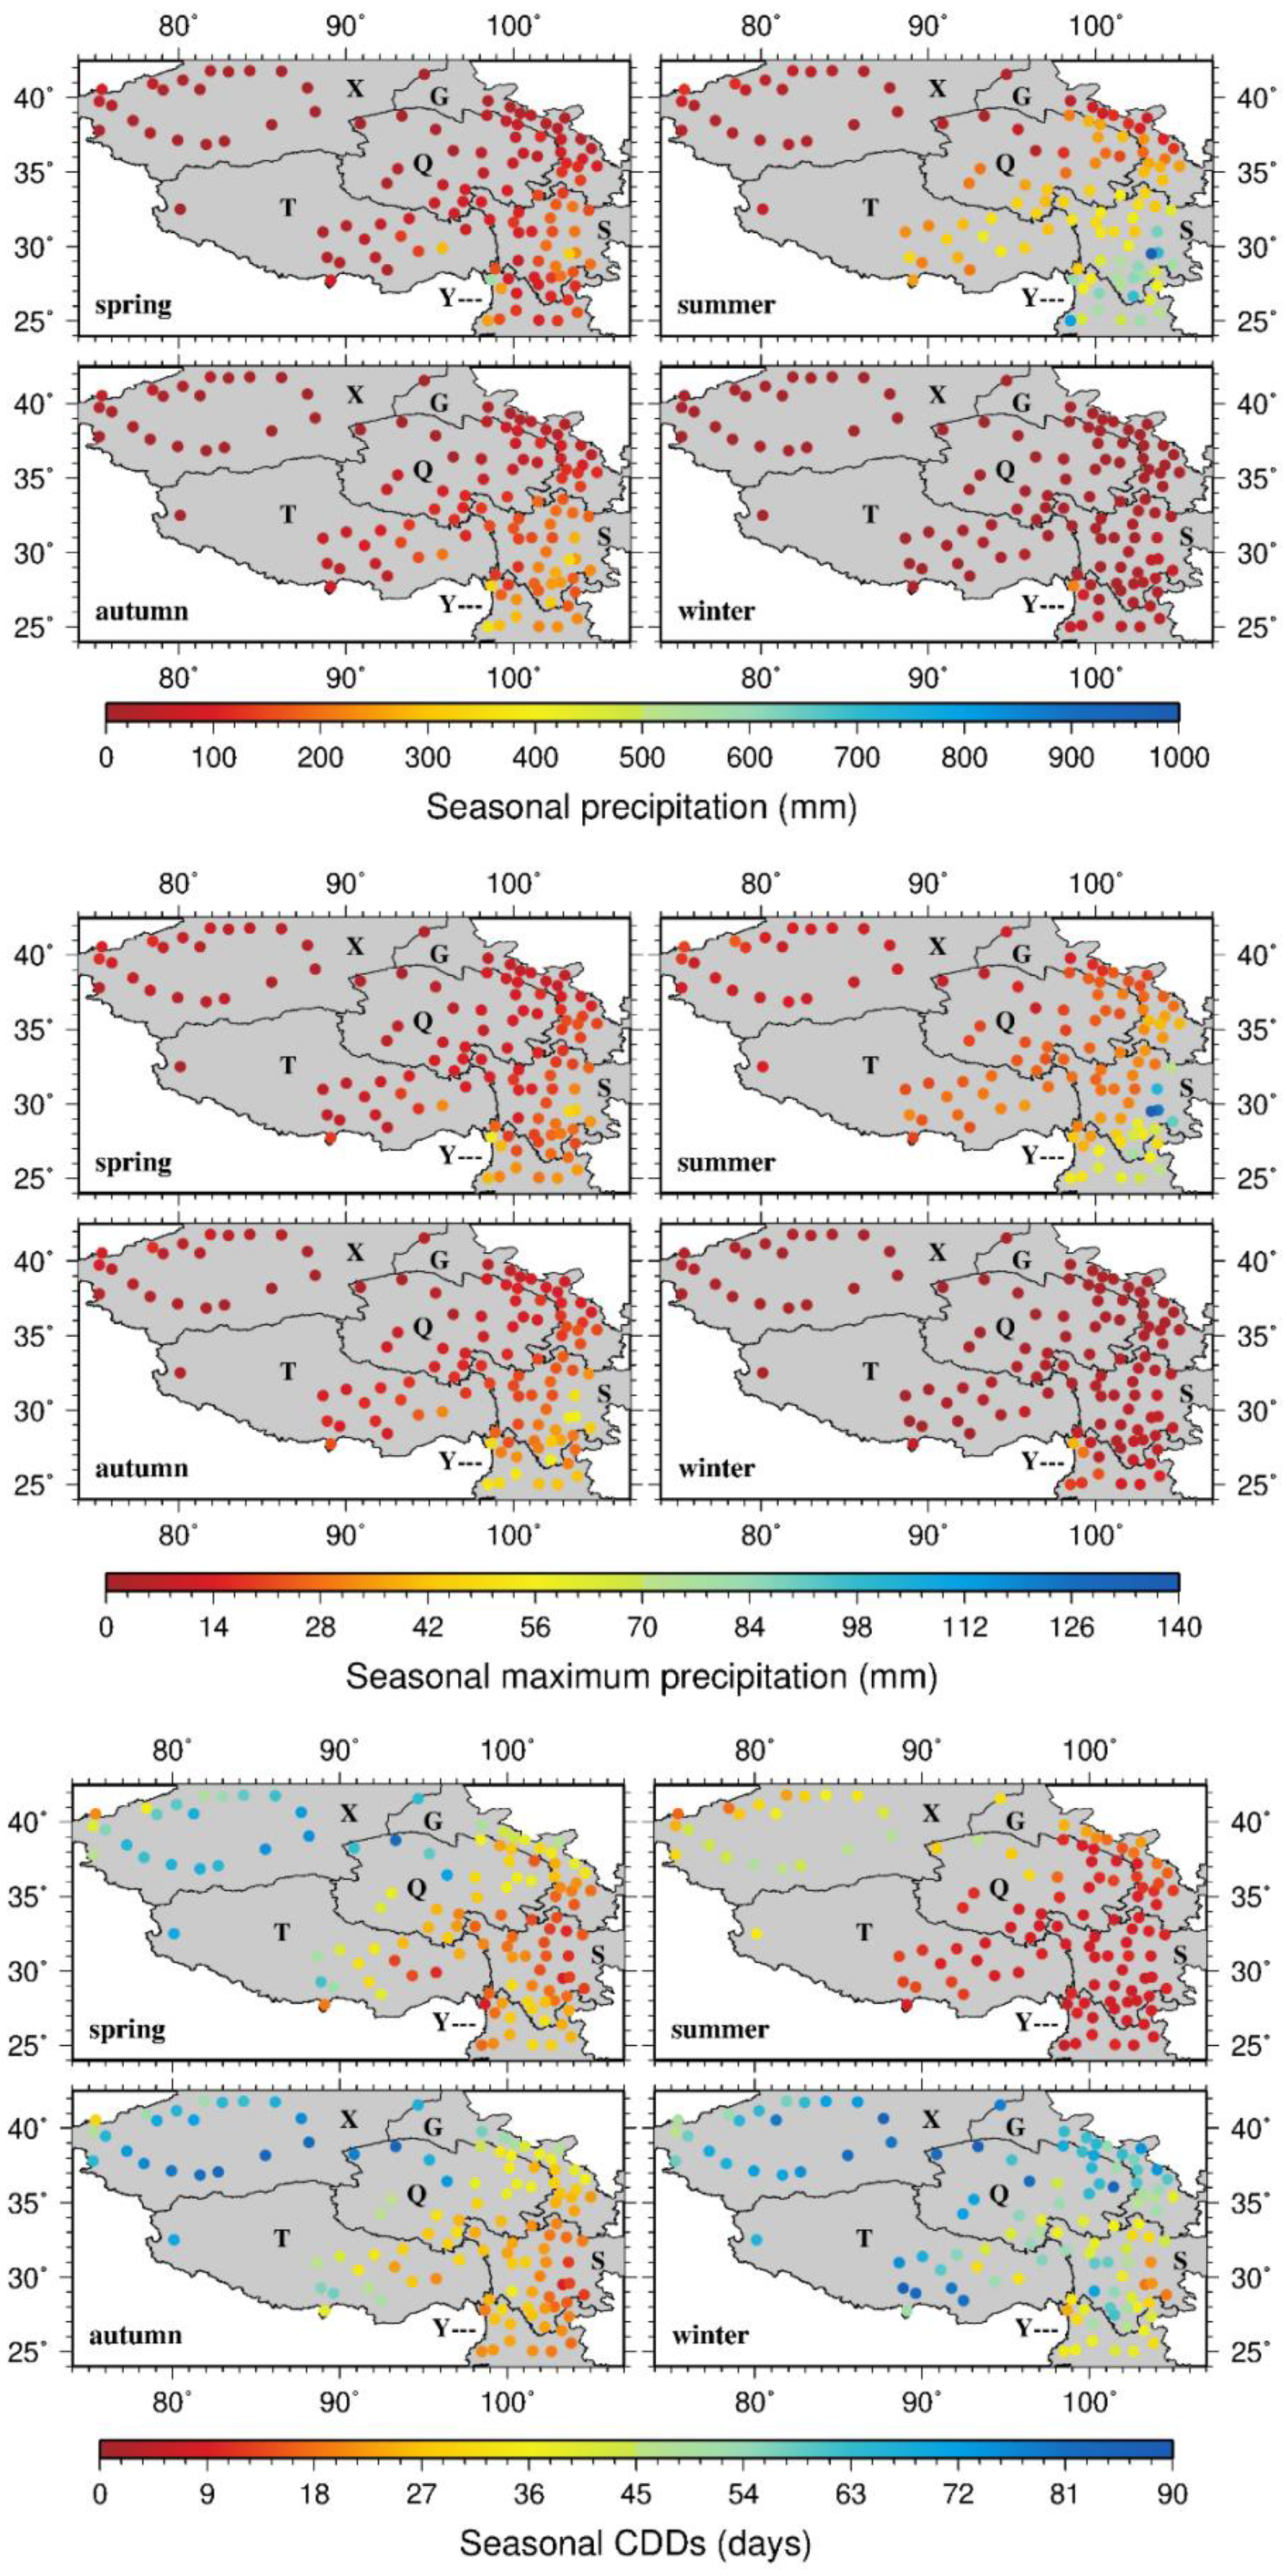
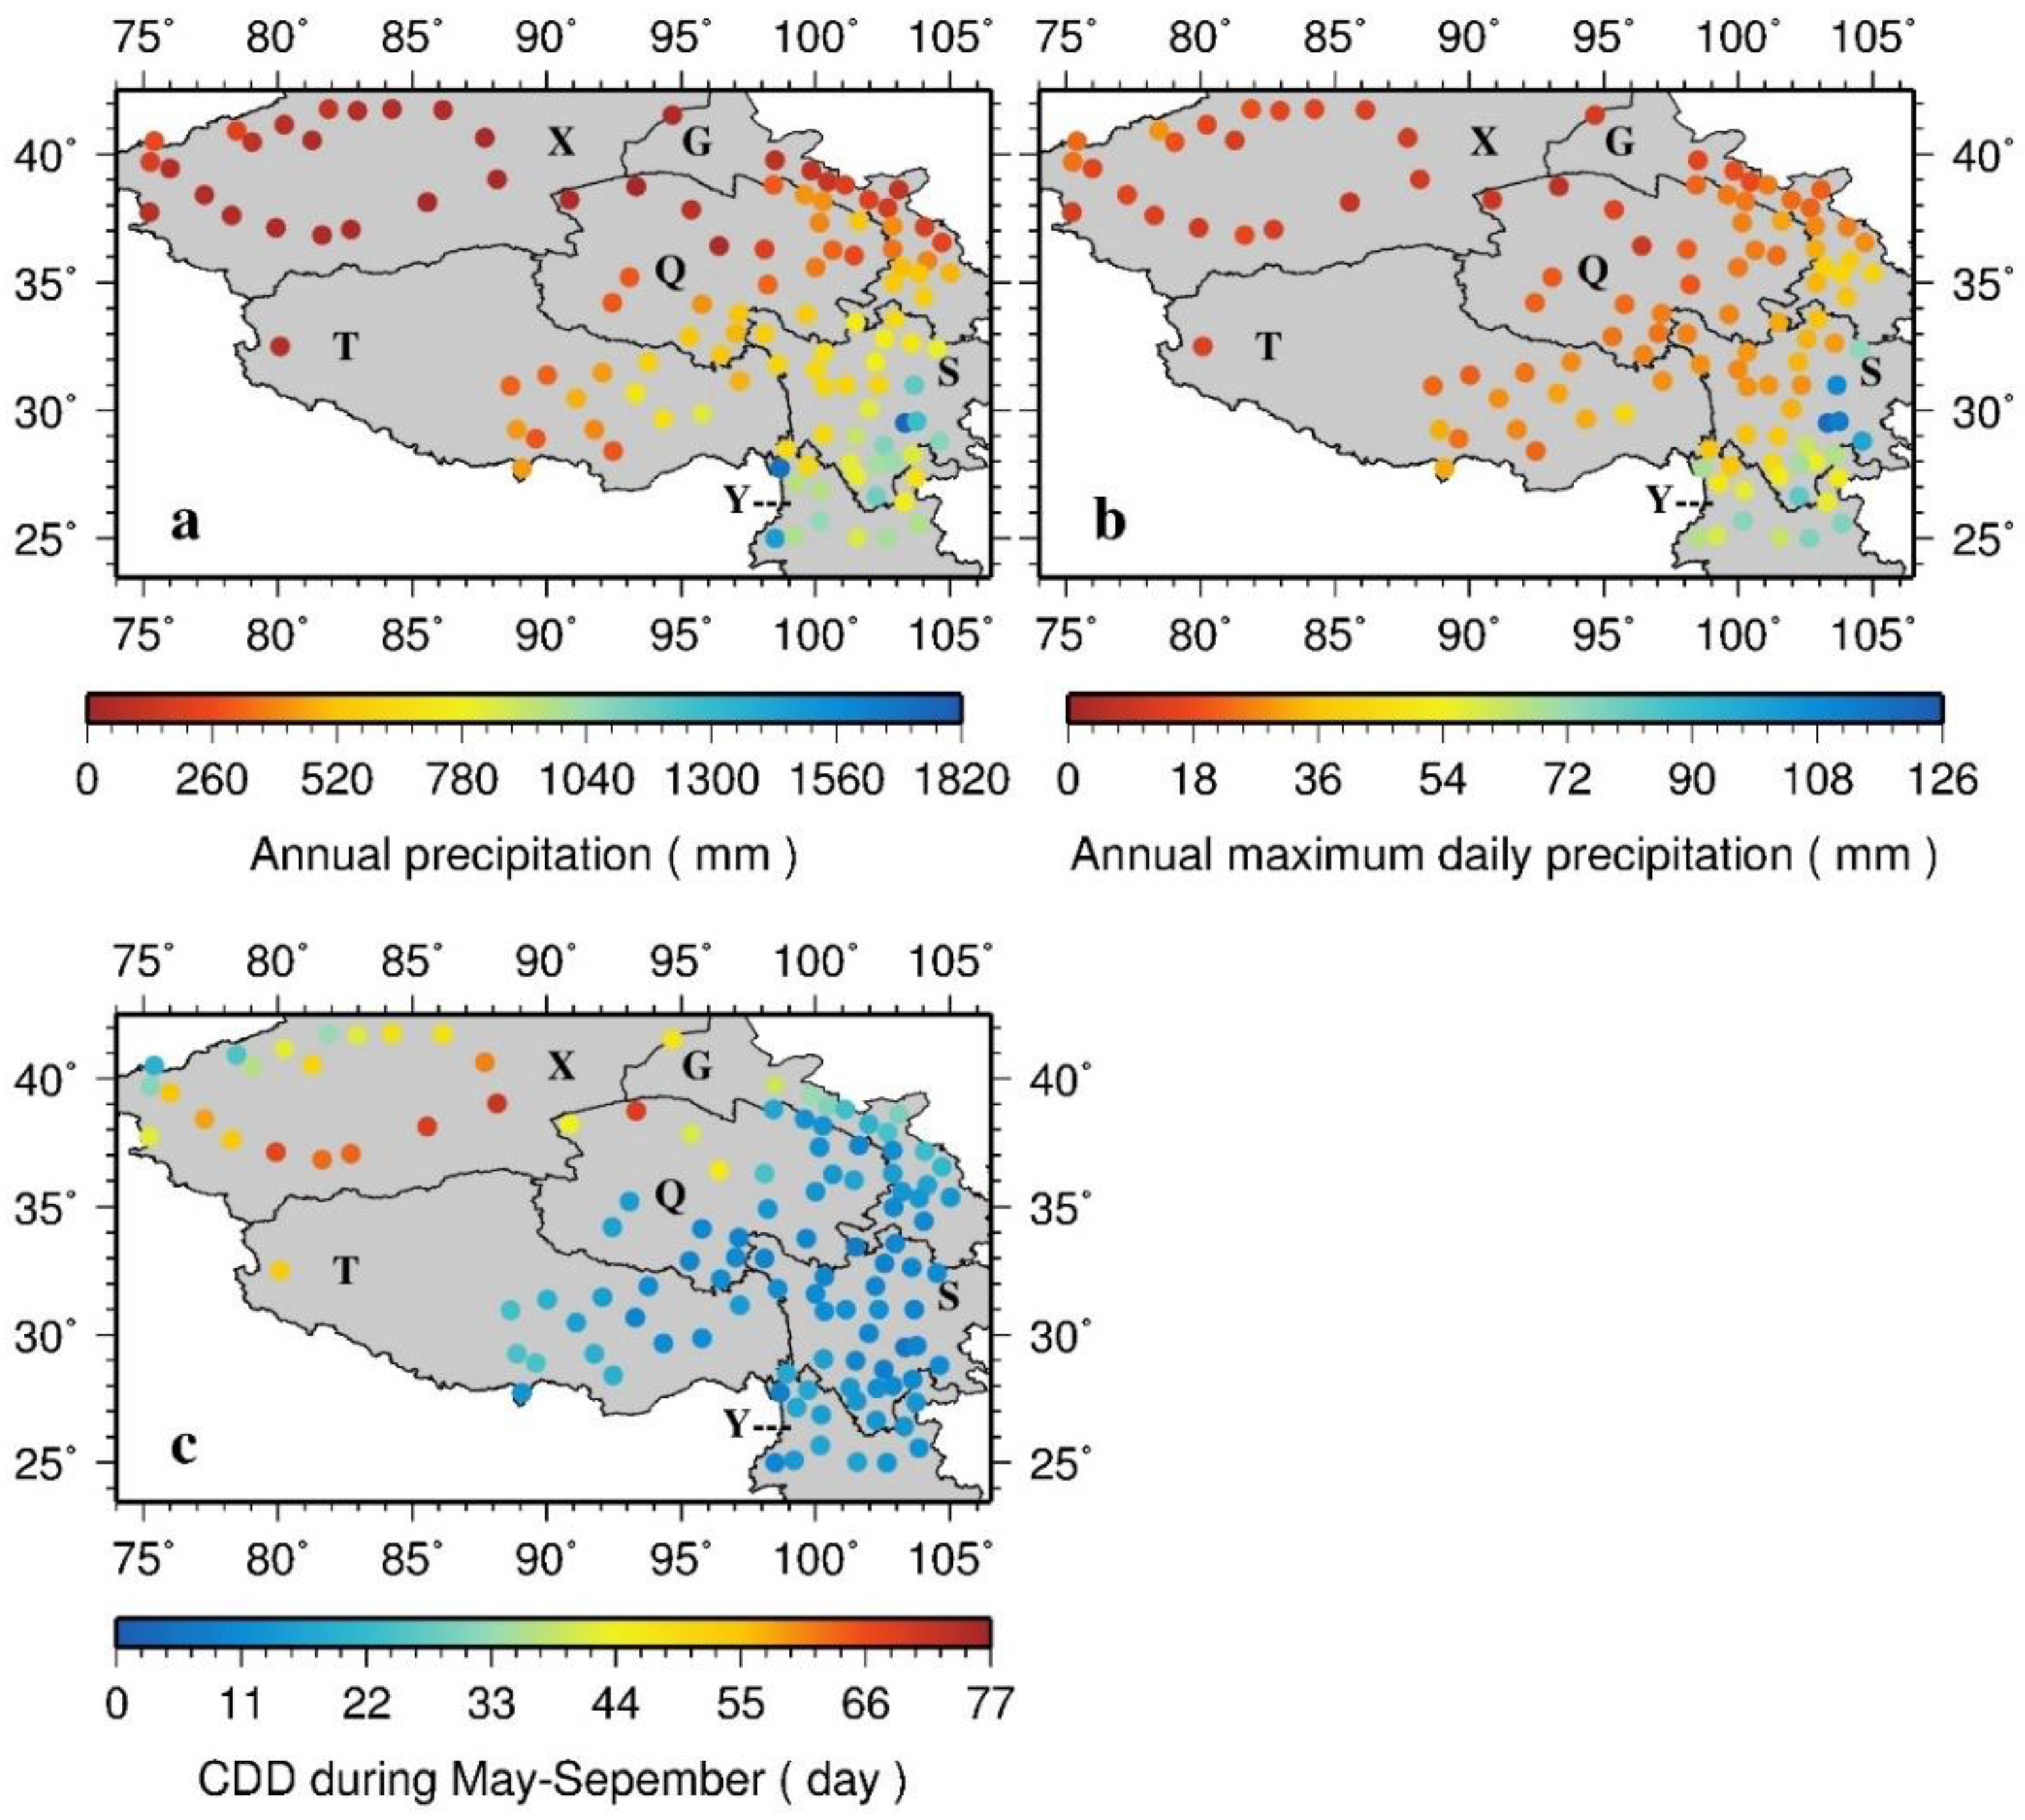
3.1. Temporal and Spatial Distributions of Precipitation
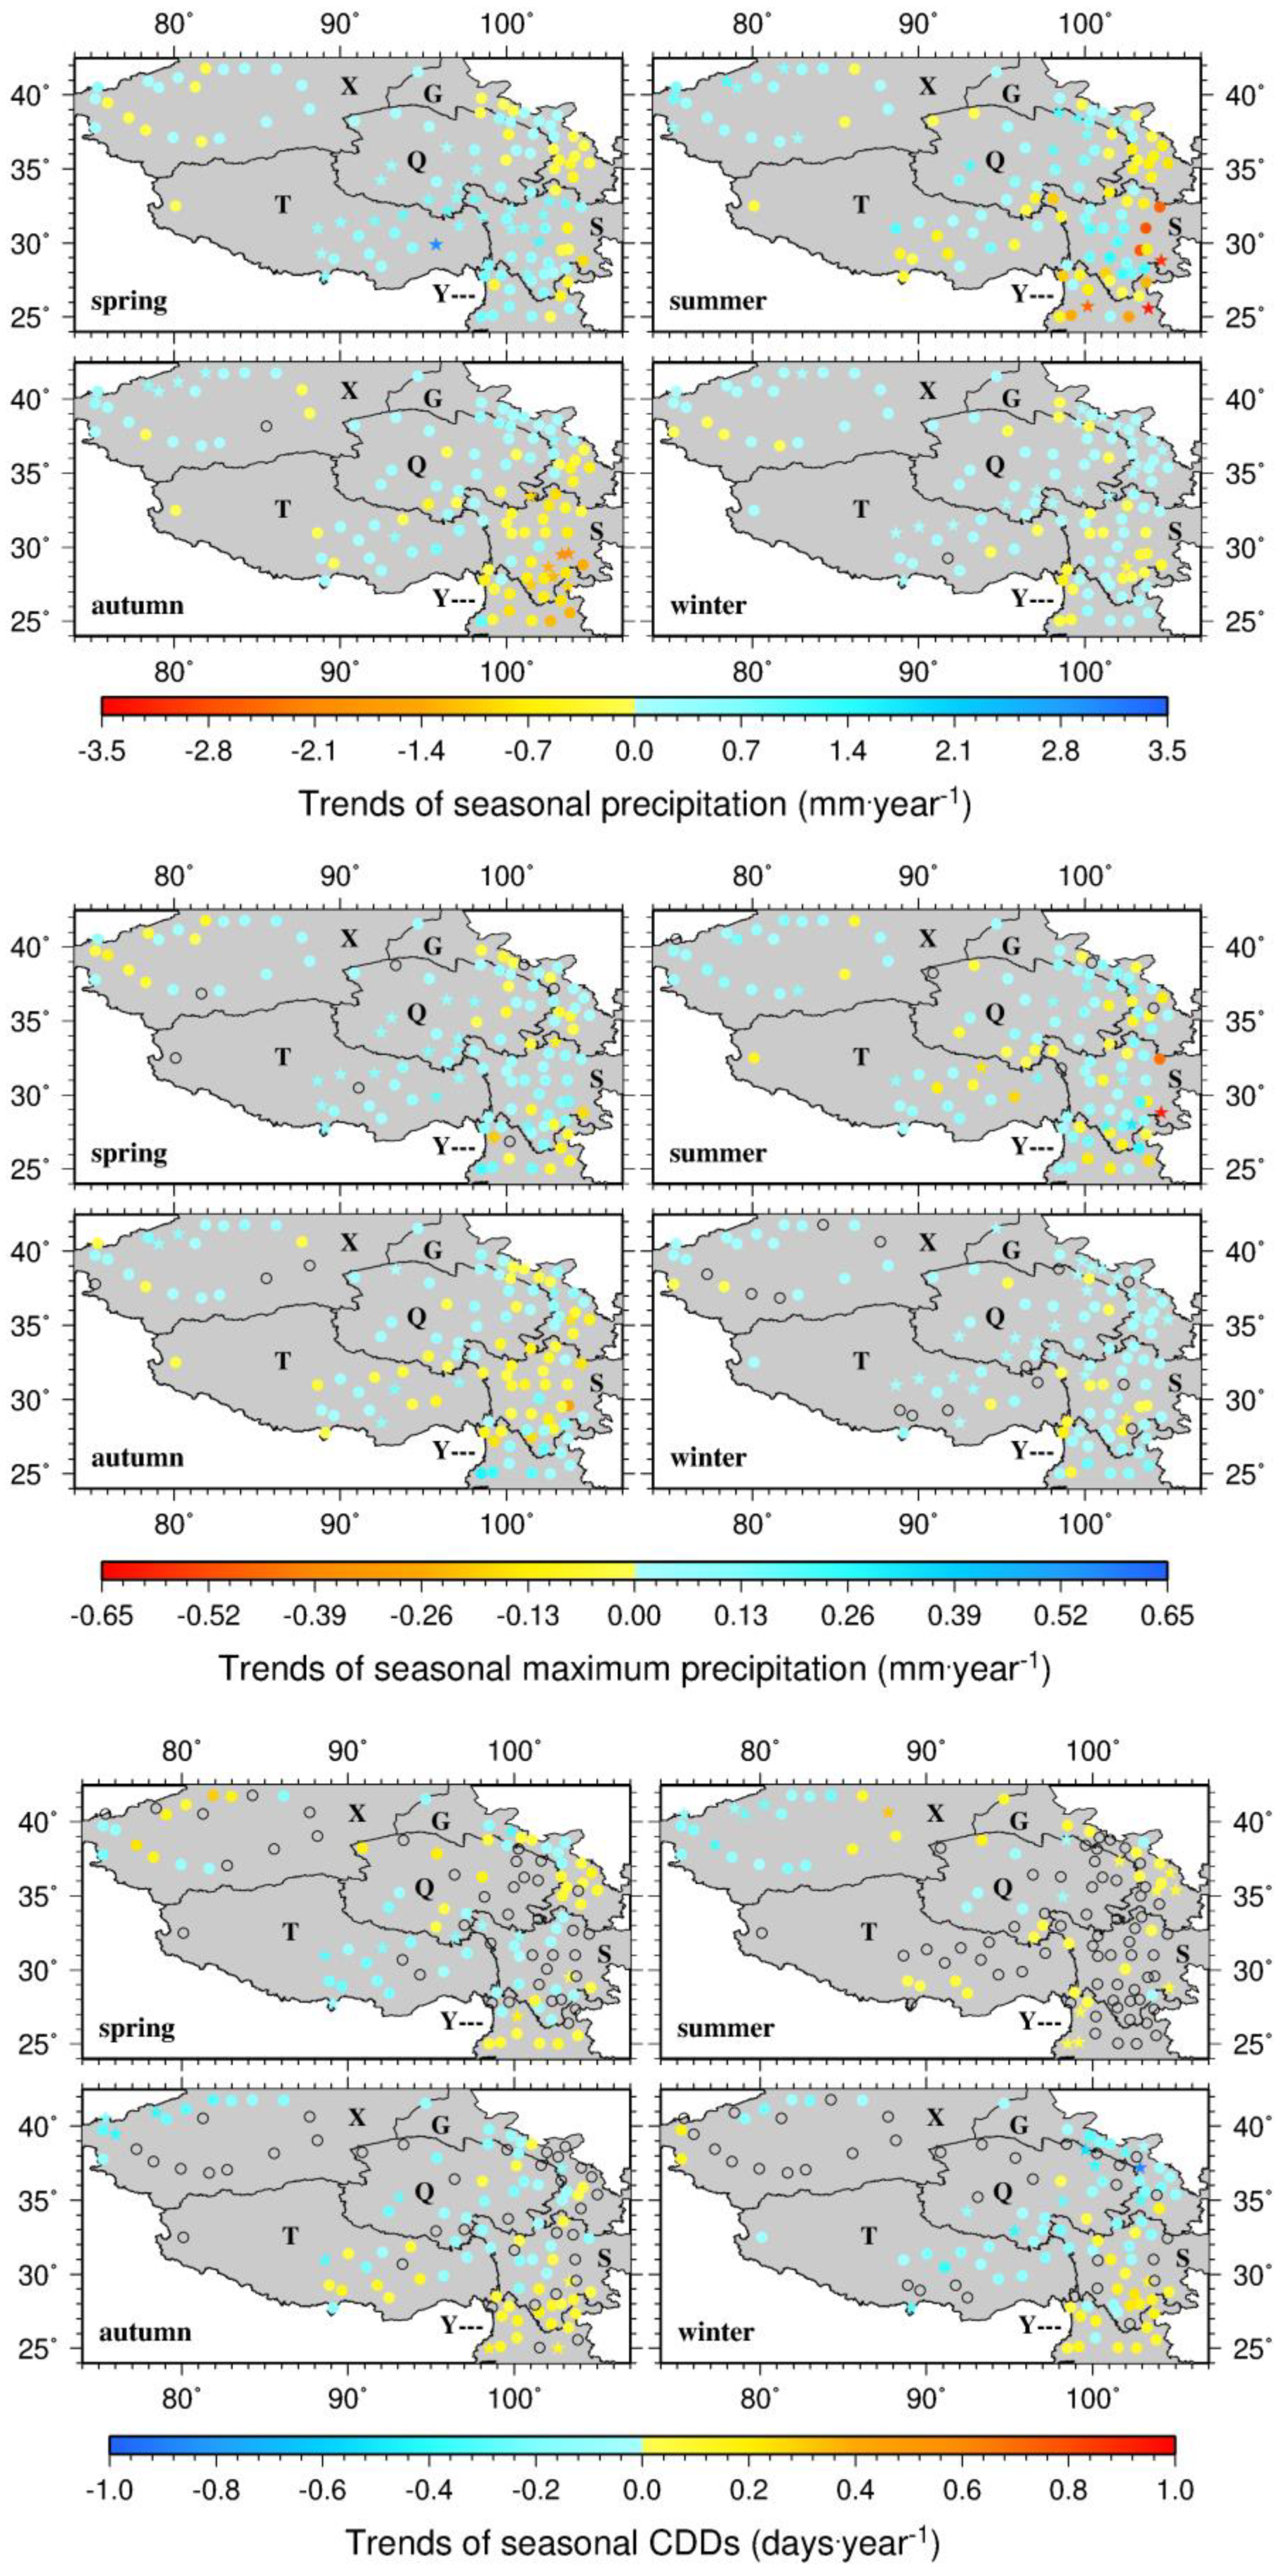
3.2. Seasonal and Annual Trends
3.3. Precipitation and Its Trends in the River Basins
3.4. Recurrence Intervals of Extreme Daily Precipitation
4. Discussions
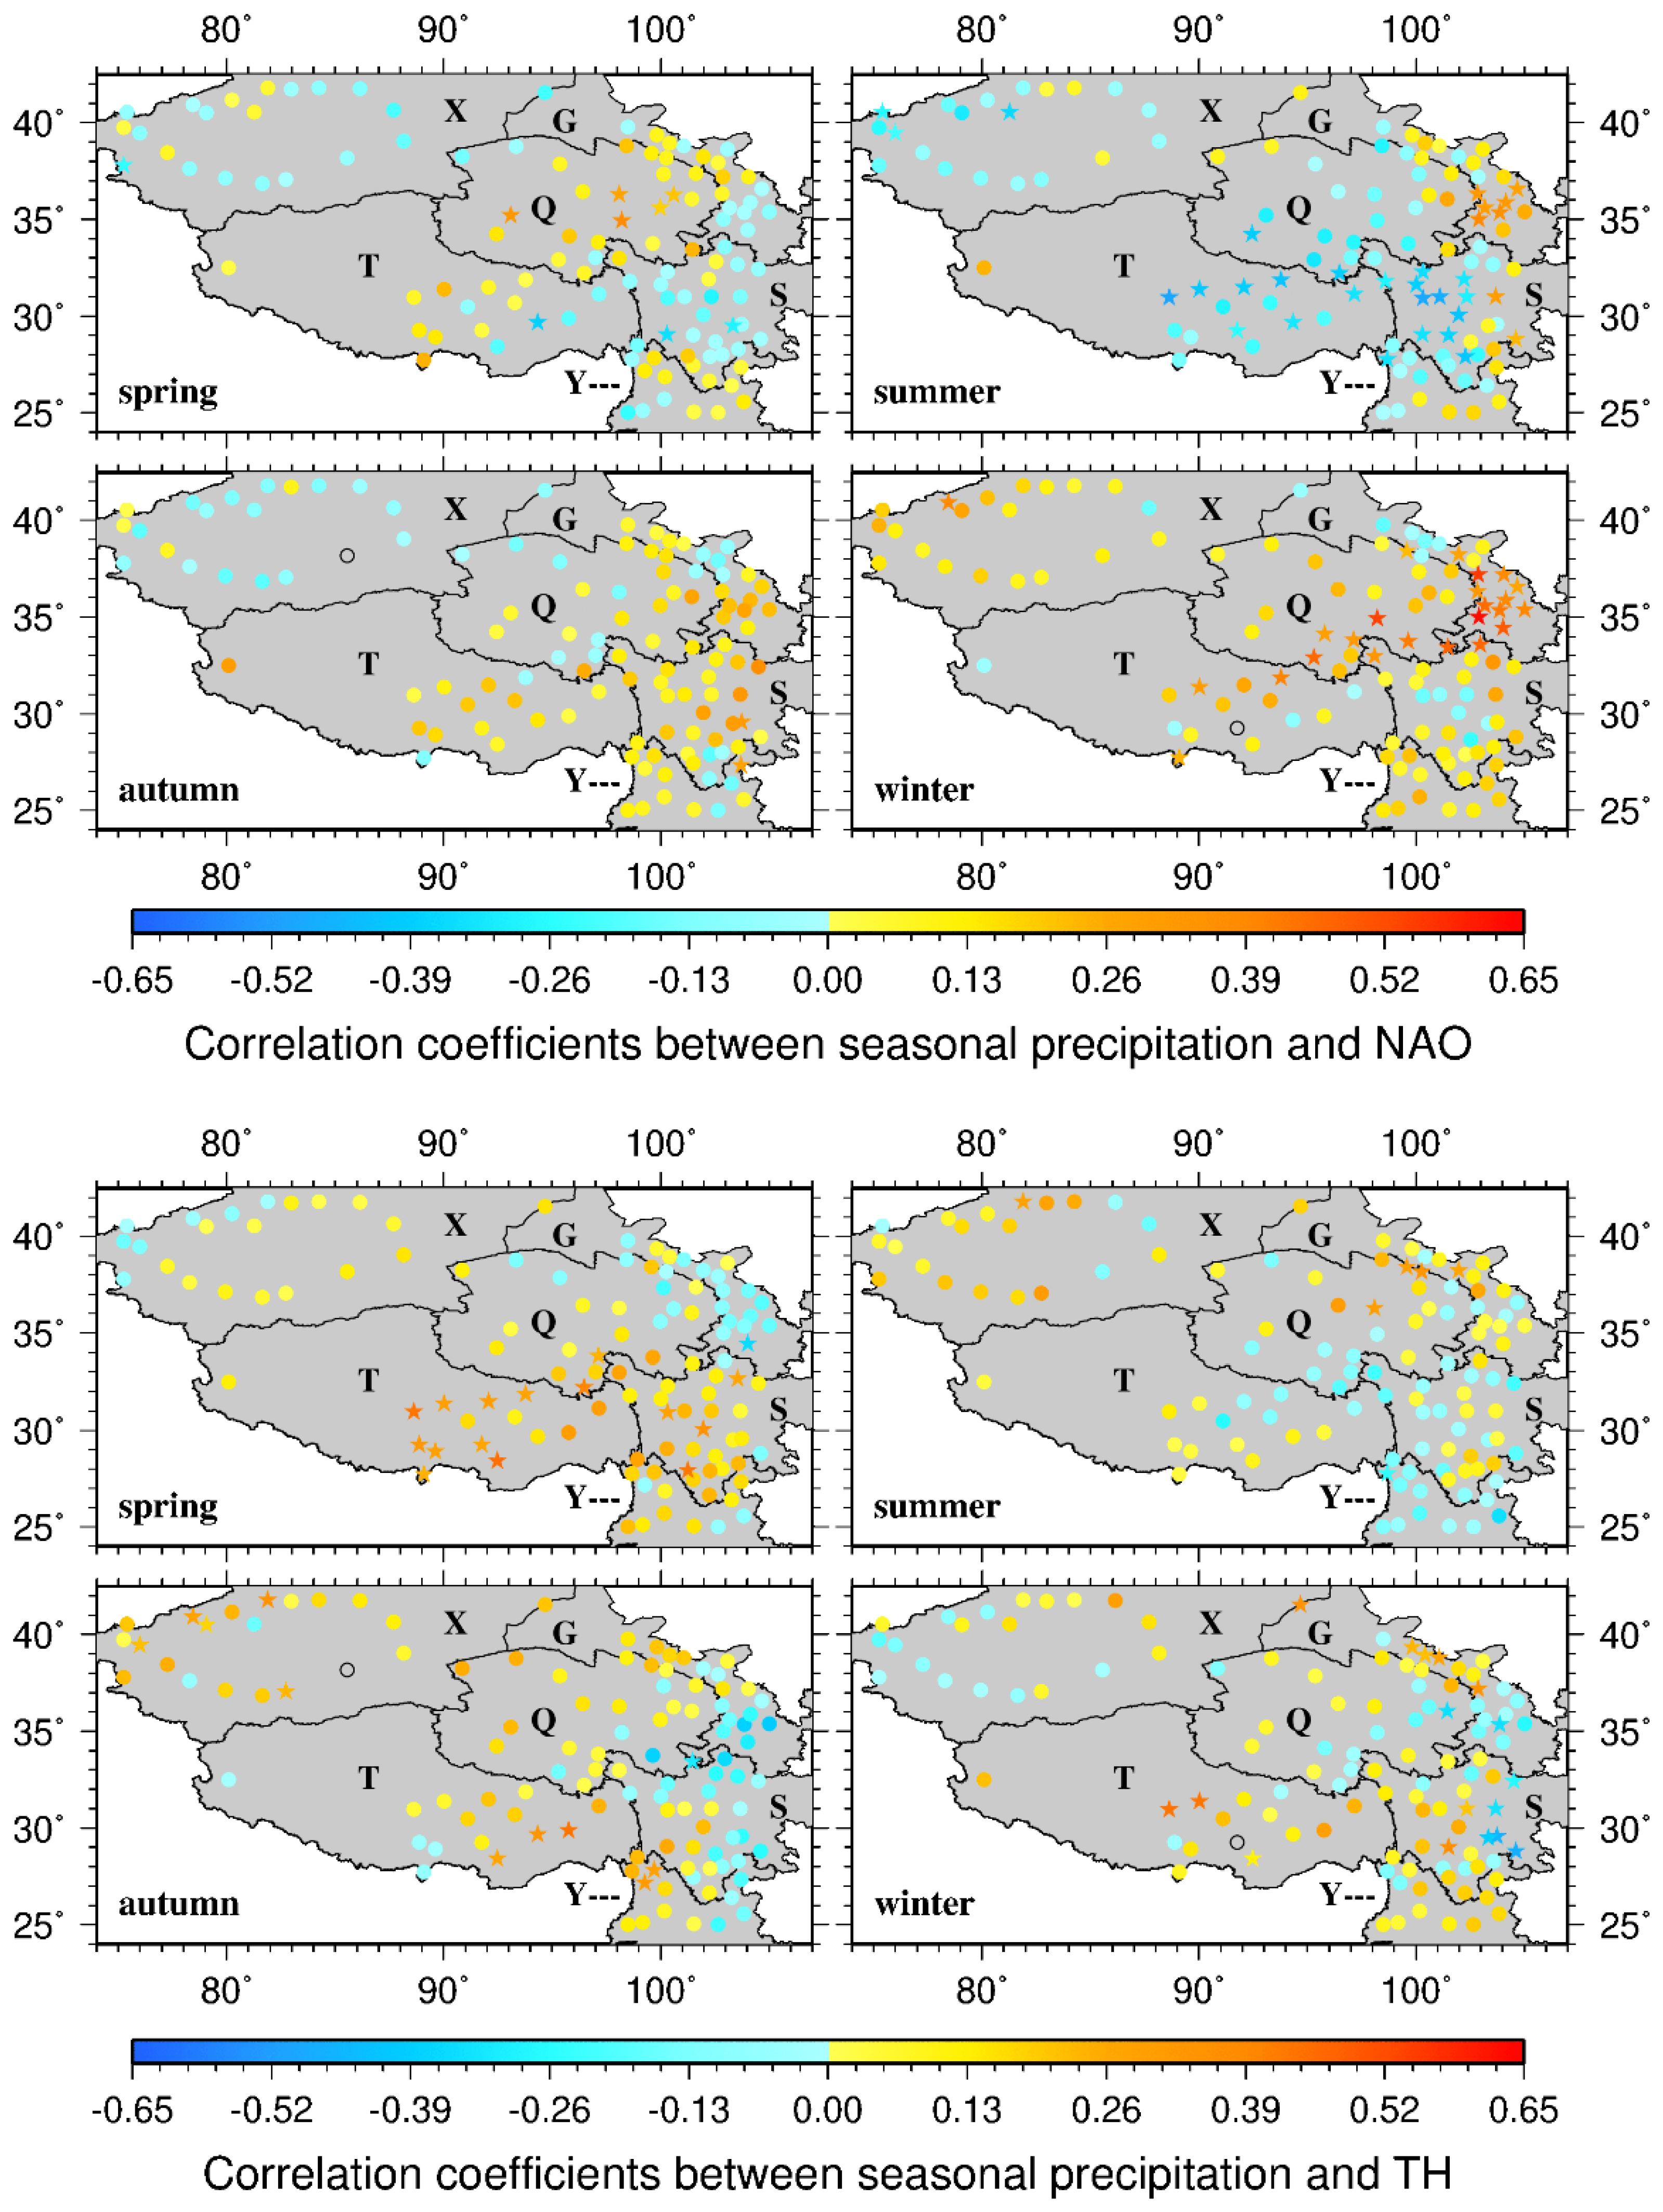
4.1. Correlations of Precipitation with Climate Systems
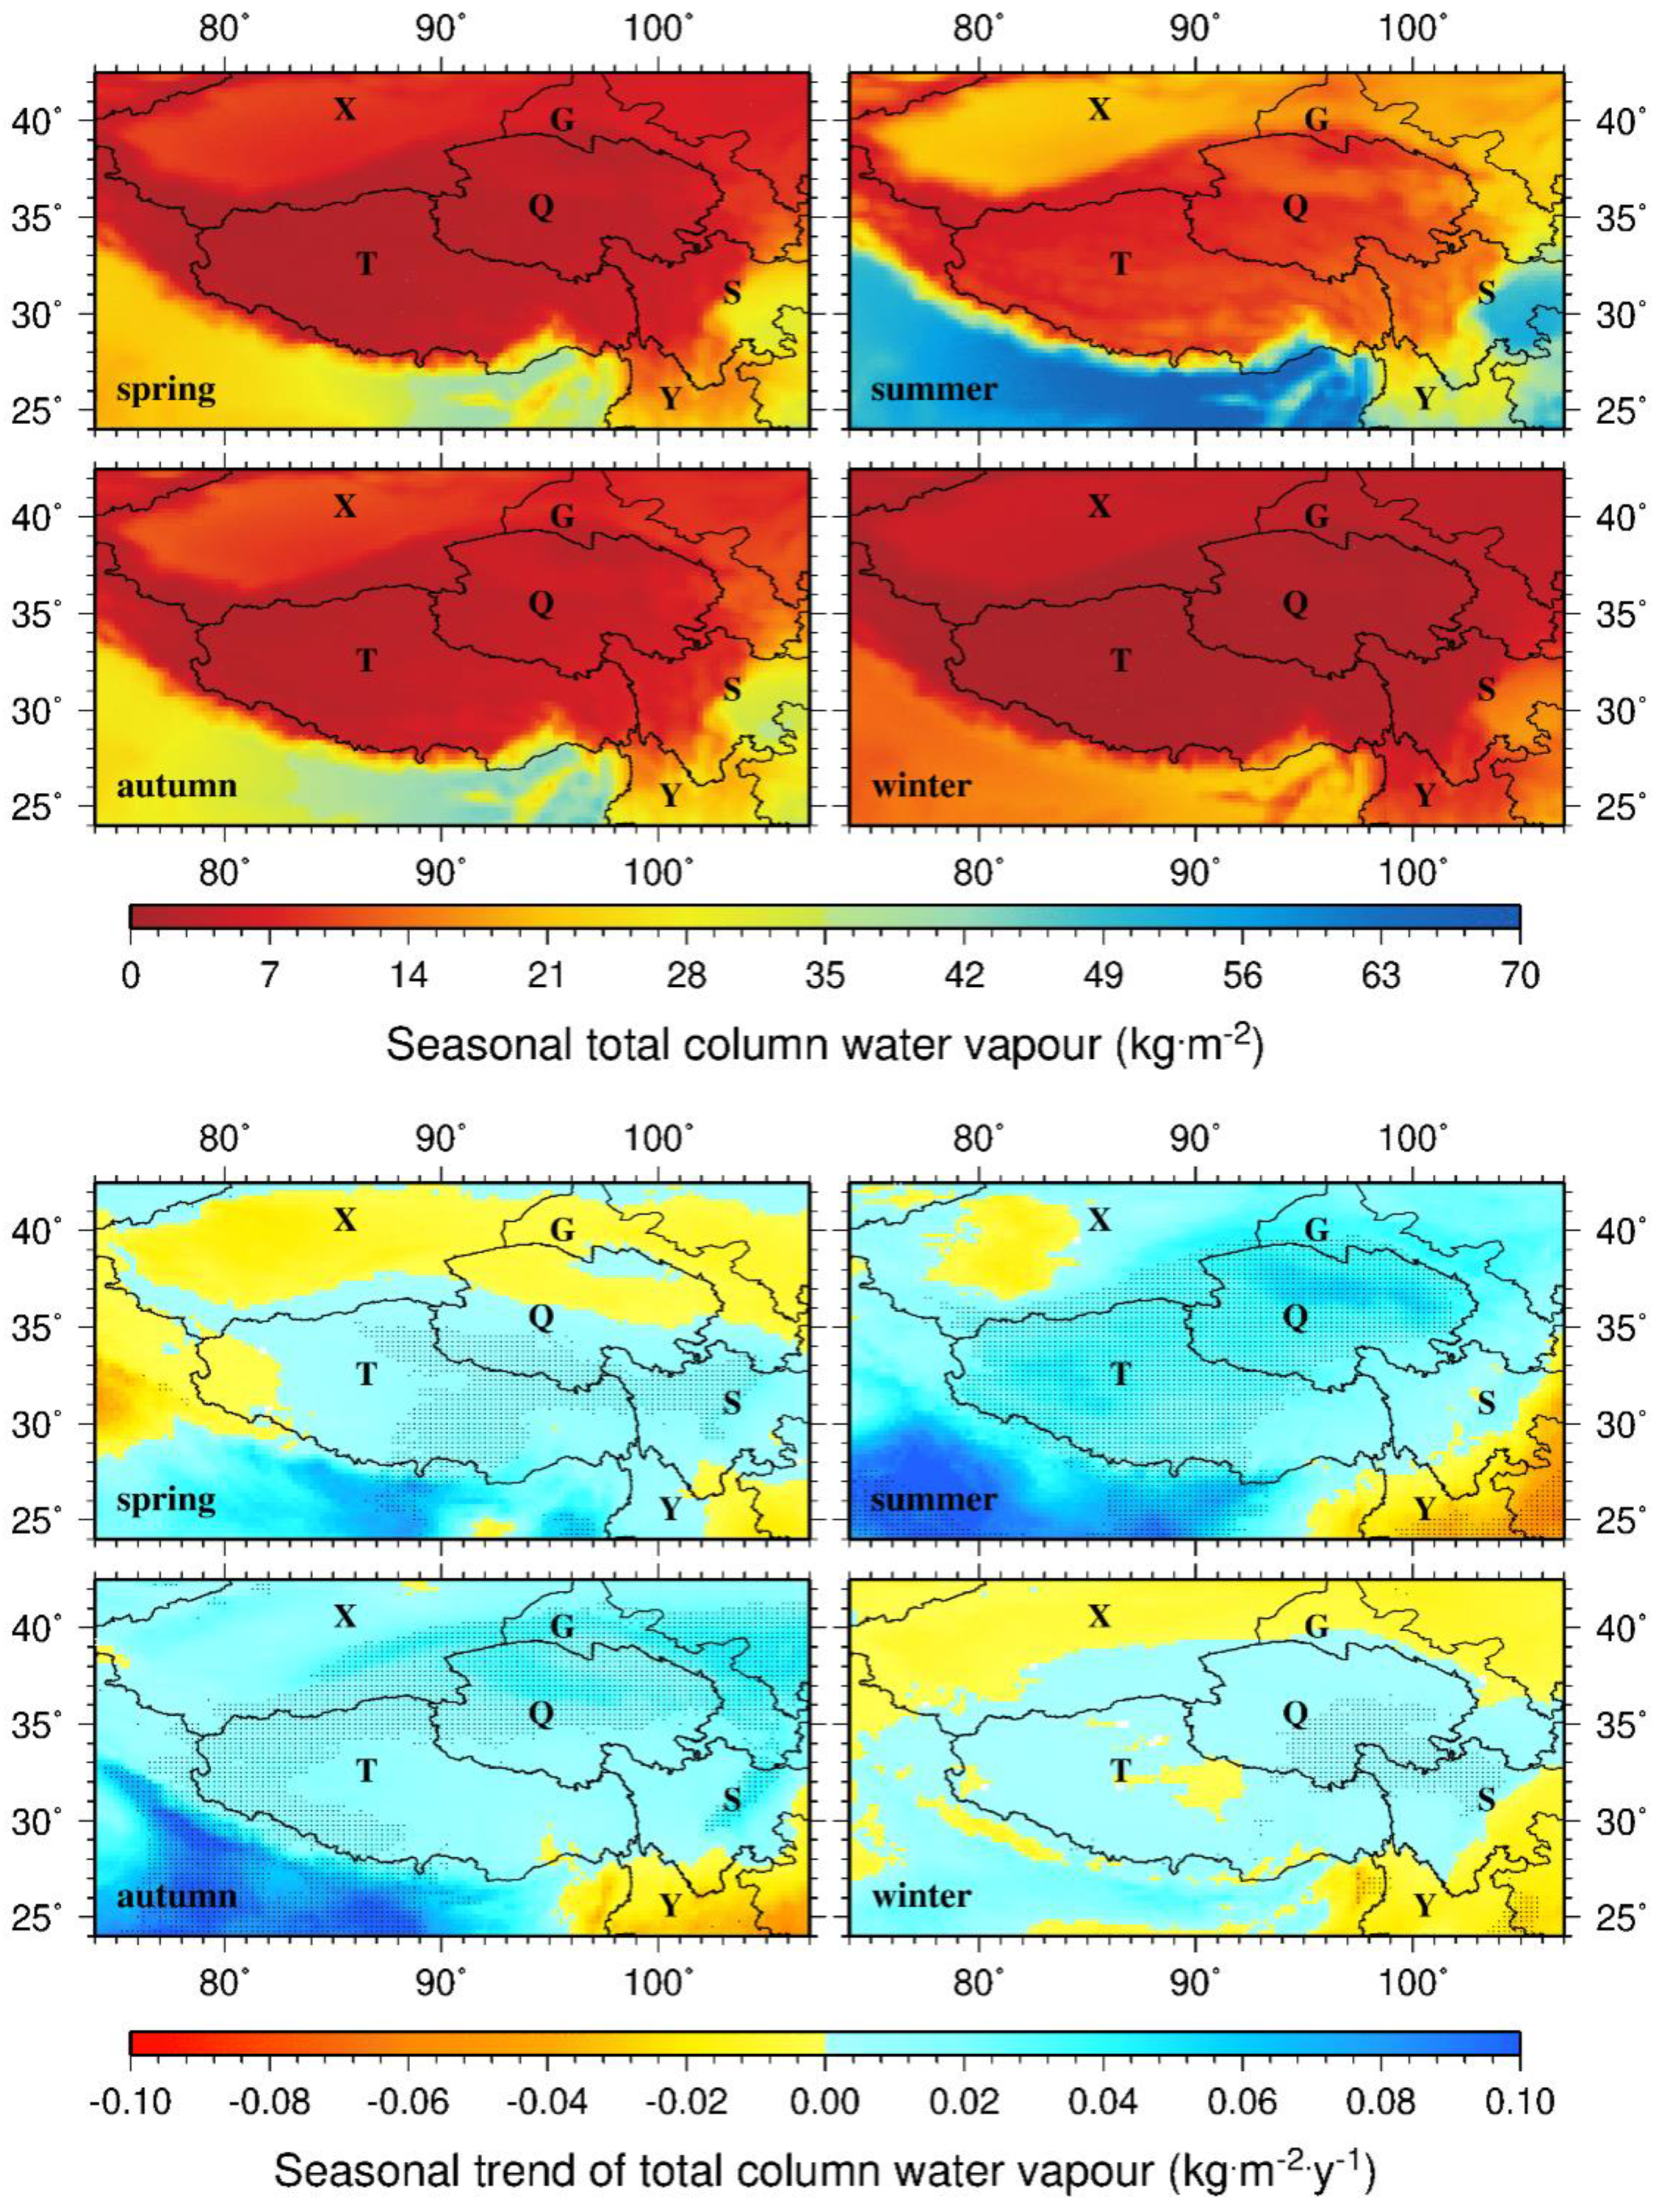
4.2. Patterns and Changes of Water Vapor
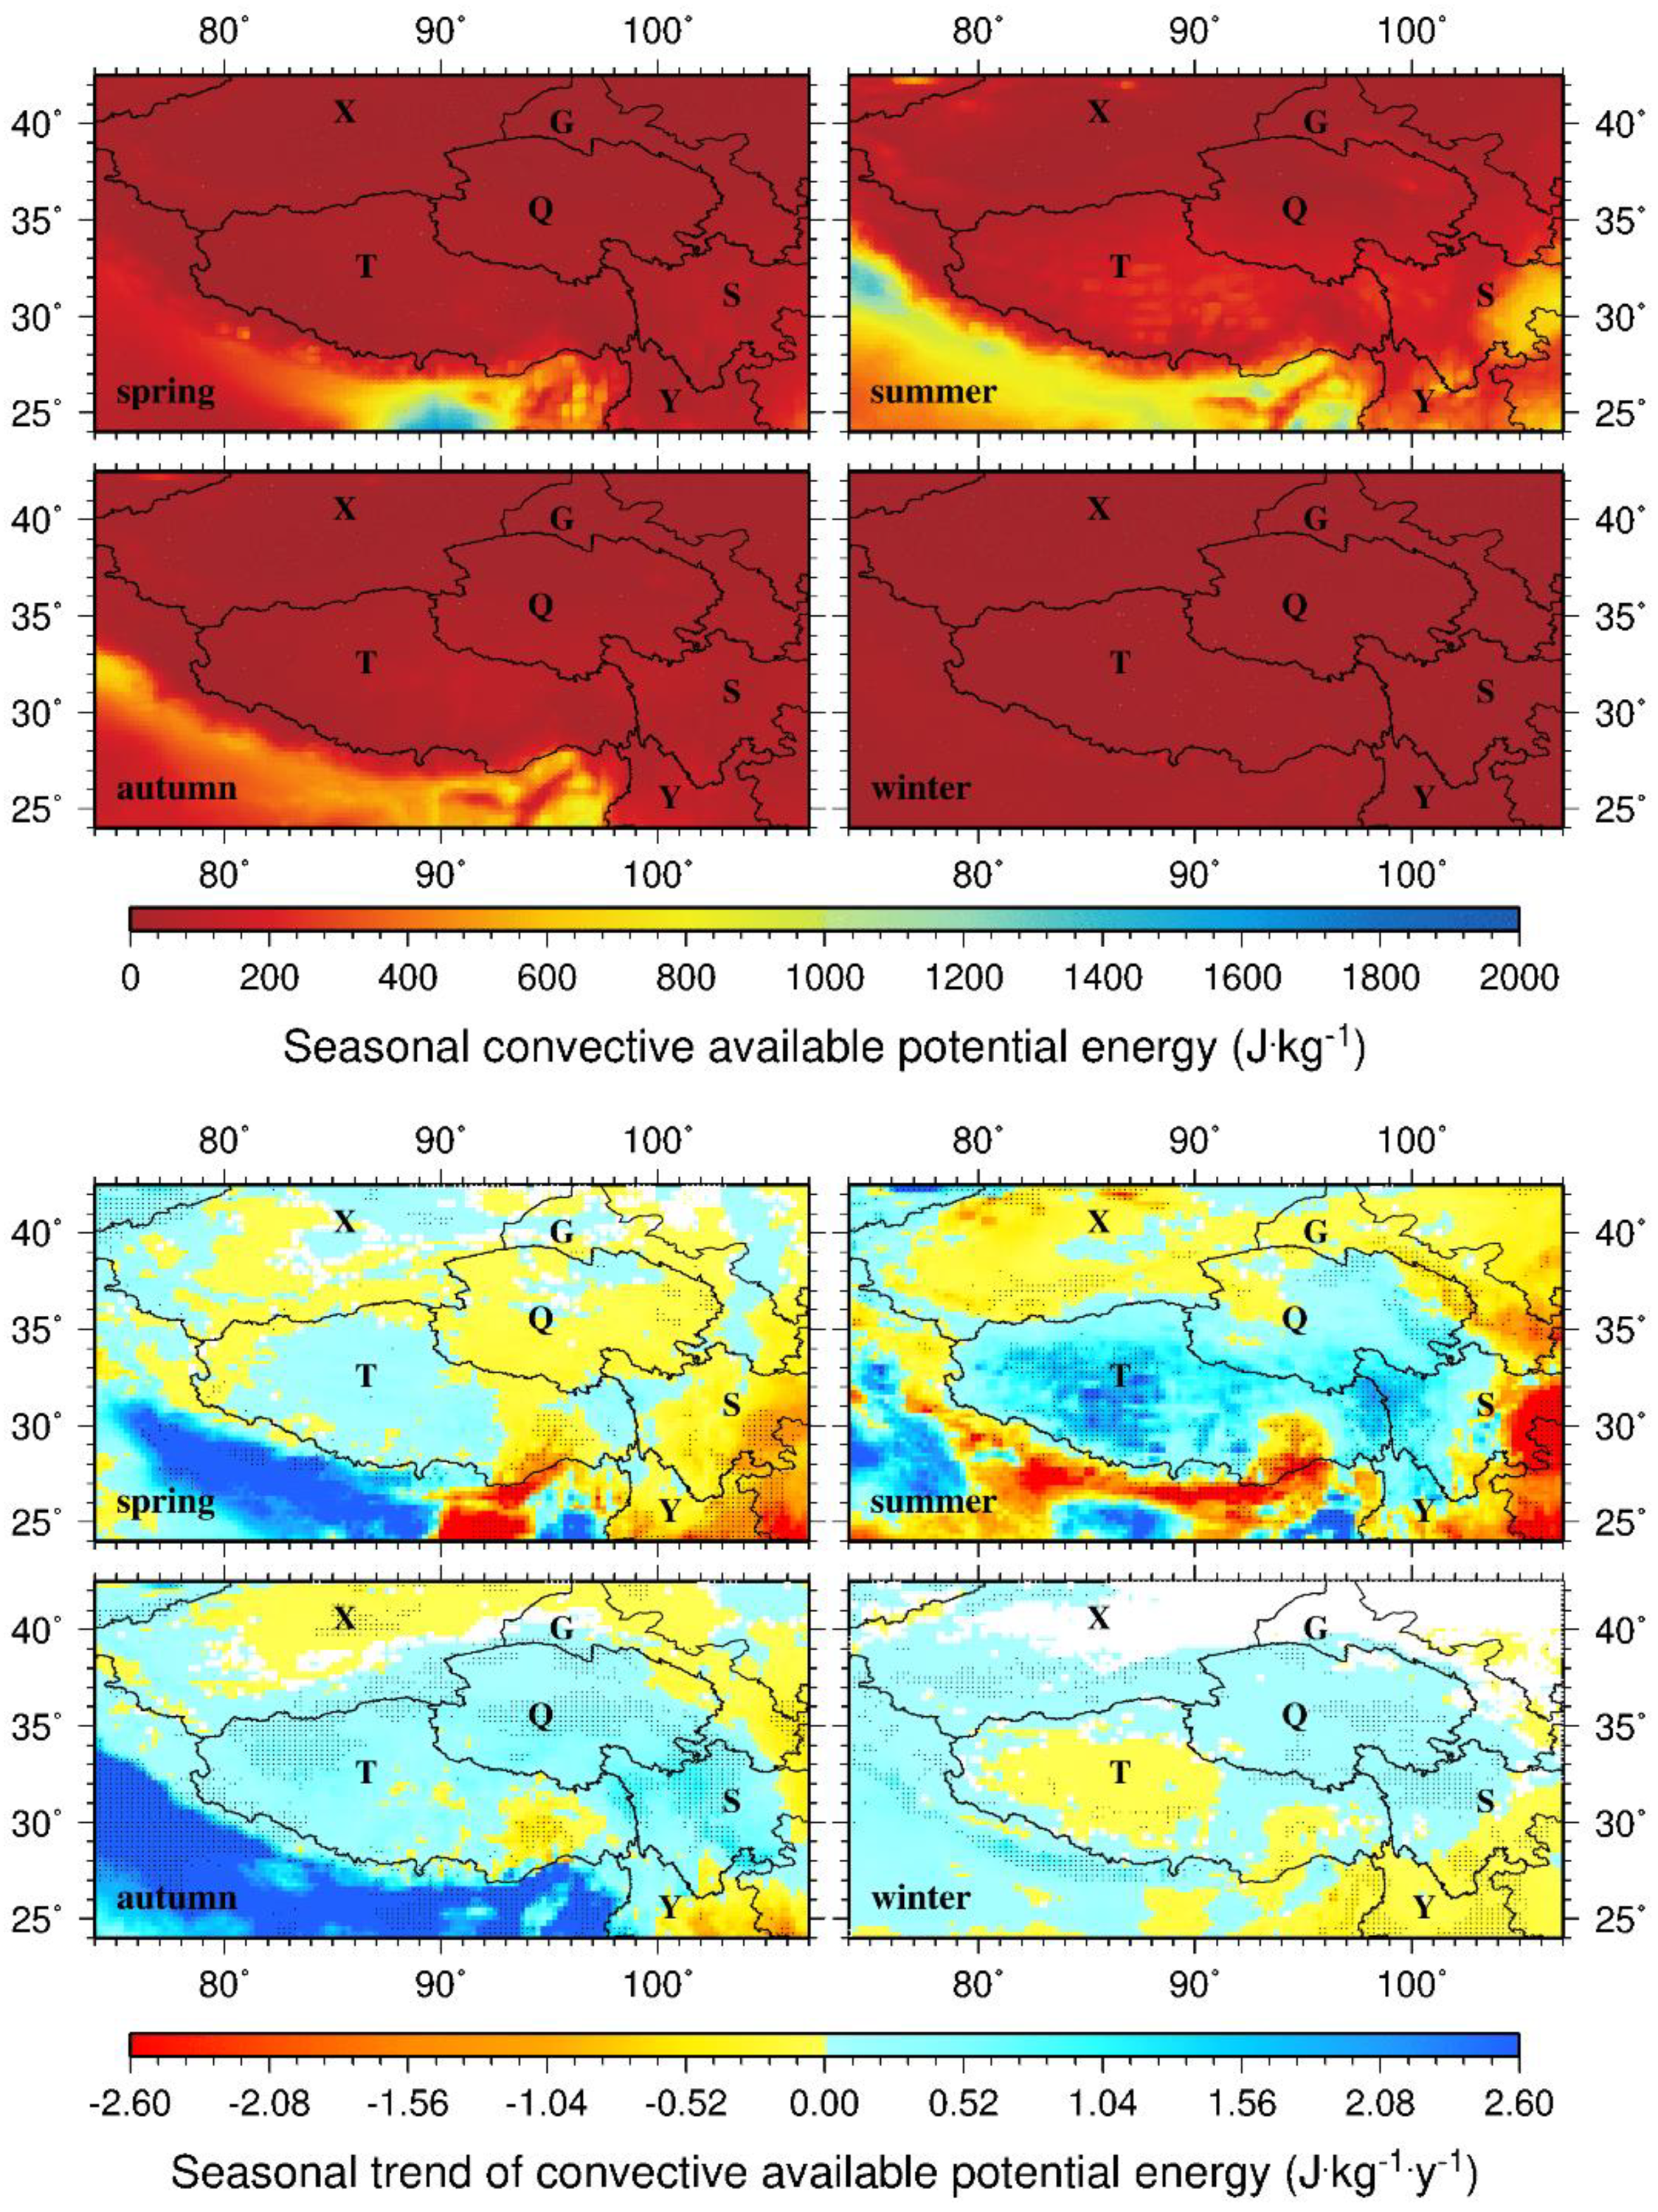
4.3. Patterns and Changes of Atmospheric Instability
5. Conclusions
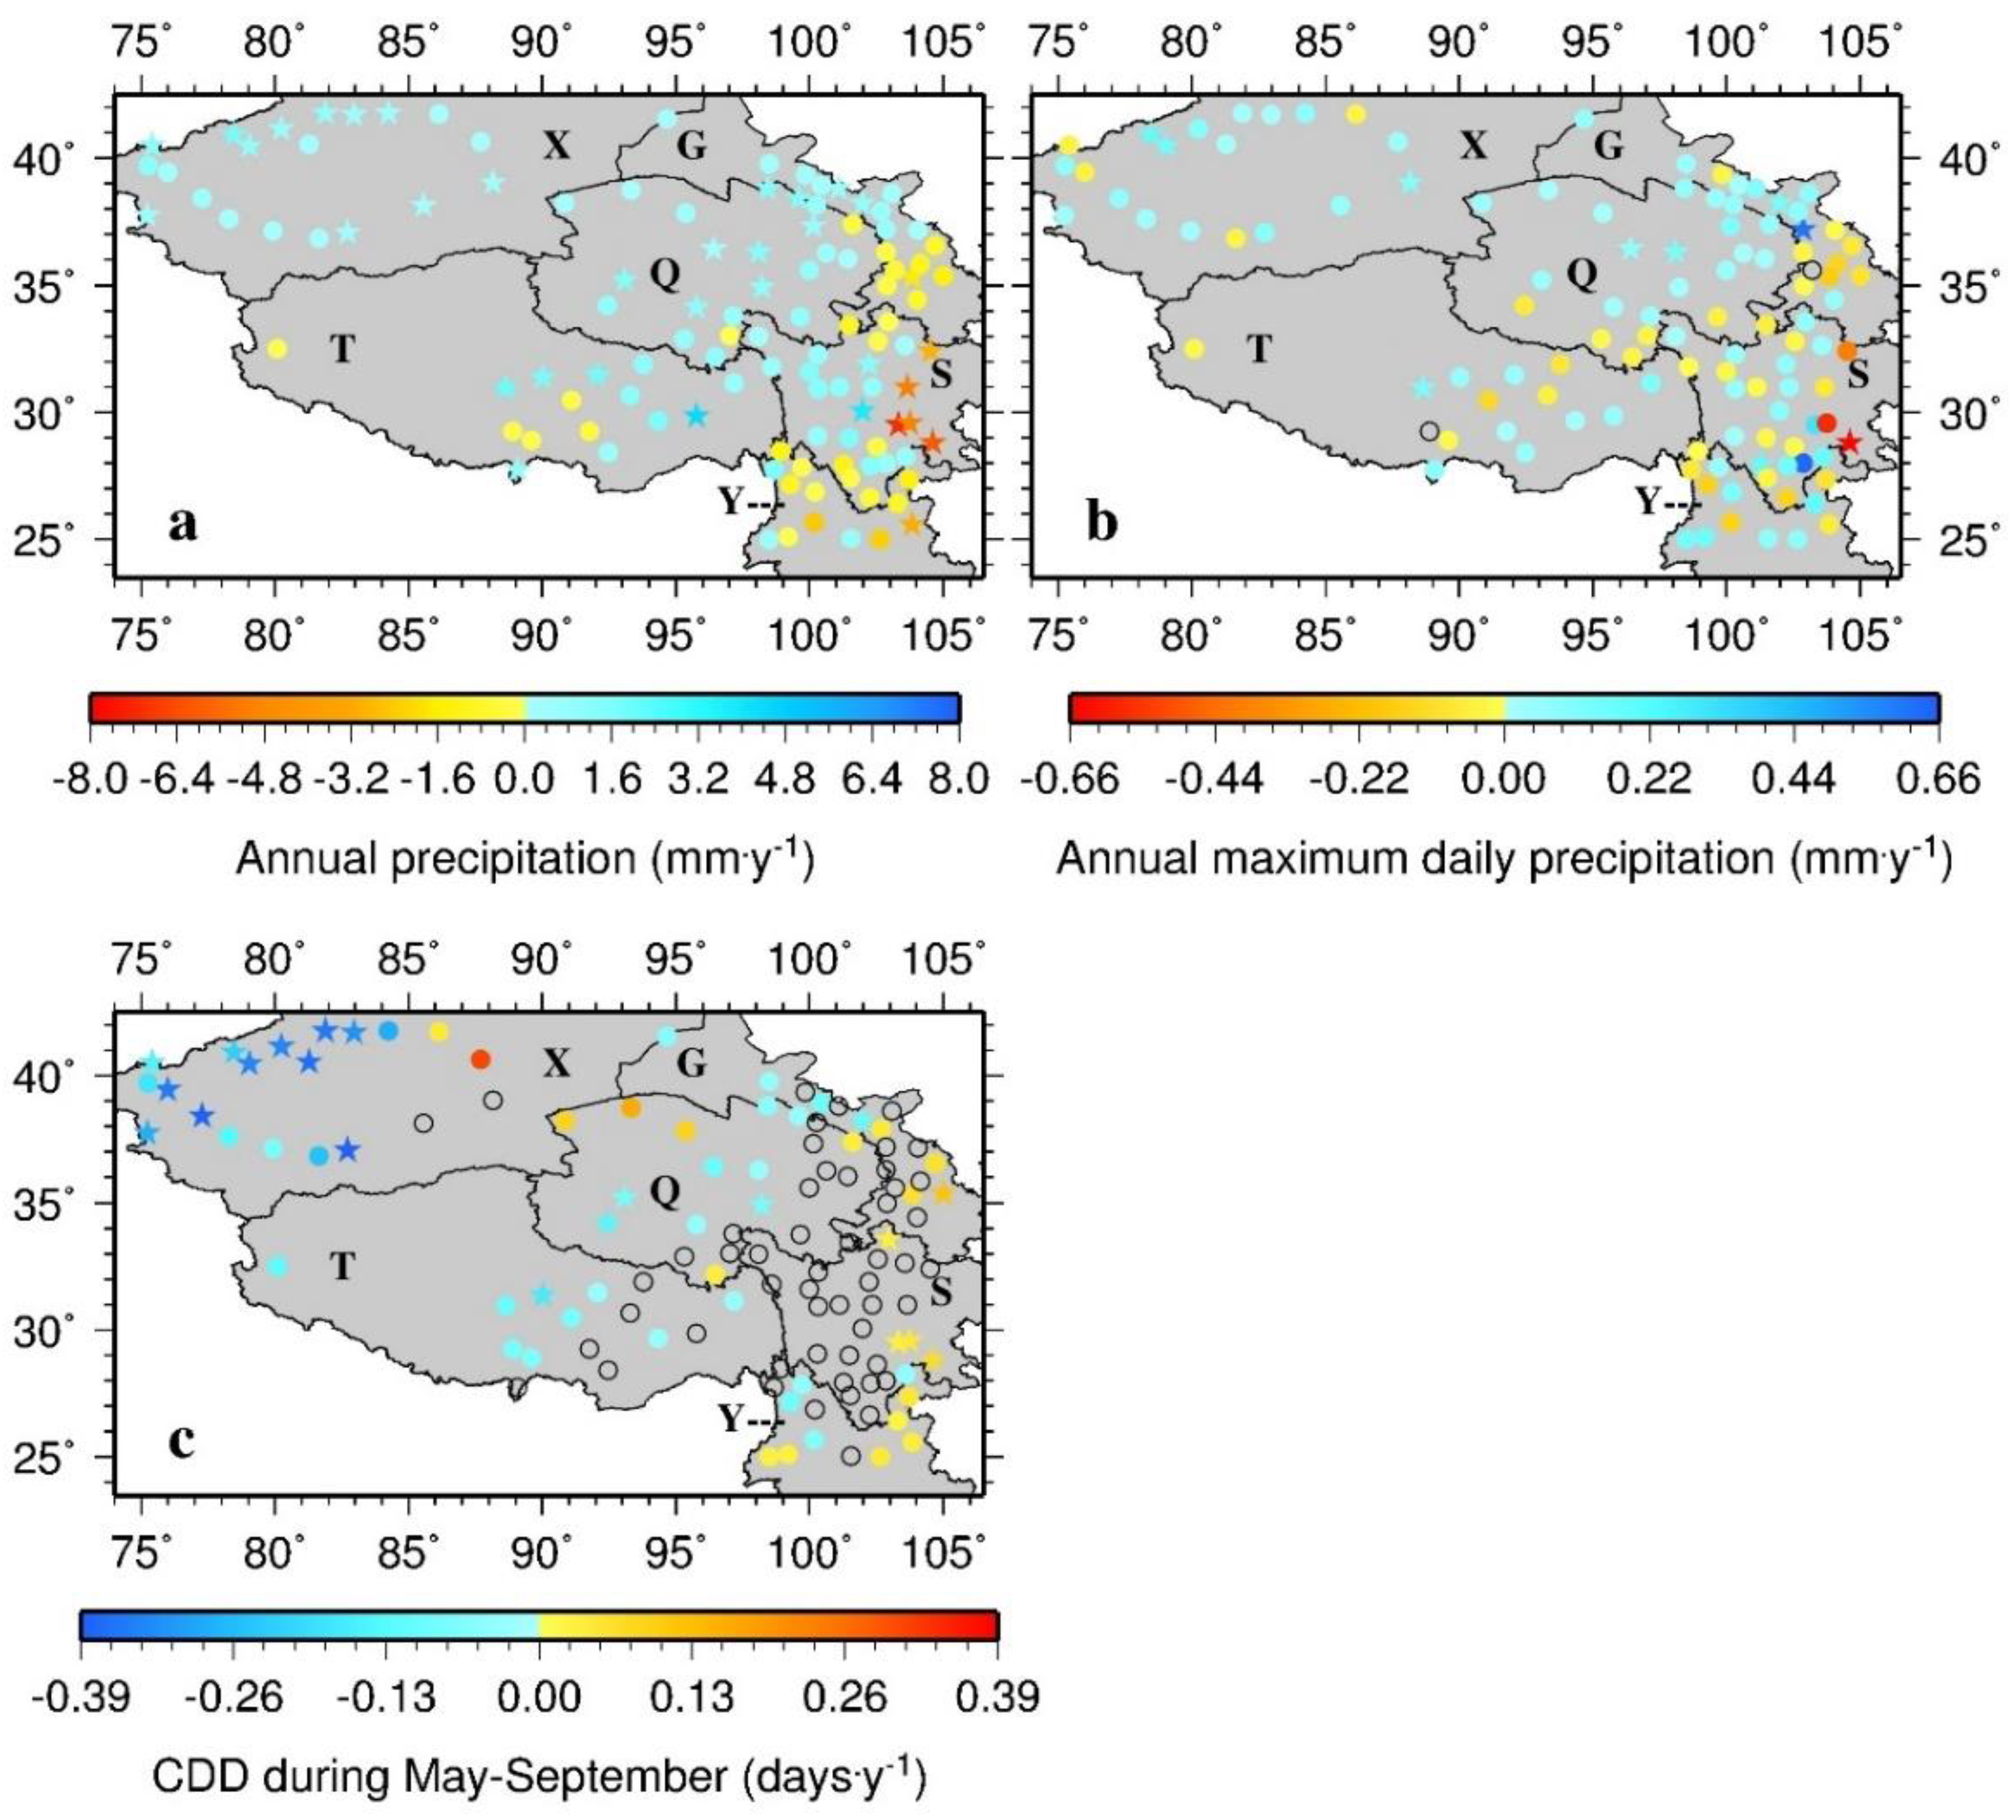
- There exists a clear southeast-northwest precipitation gradient in the TPS. The wettest and driest stations on the TPS are Emeishan in S and Lenghu in Q, respectively. Maximum daily precipitation shows a similar pattern to that of precipitation at seasonal and annual time scales, while the consecutive dry days (CDDs) exhibit a nearly opposite pattern to that of precipitation.
- The wet southeastern TPS generally corresponds to little or small positive trends in CDDs and negative trends in precipitation and maximum daily precipitation during most of the seasons and at annual time scale while the opposite is true for the dry central and northwestern TPS. This suggests that the wet southeast is trending dry while the dry center and northwest are trending wet in 1963–2015. Also, increases (decreases) in precipitation tend to correspond to increases (decreases) in maximum daily precipitation but decreases (increases) in CDDs, which suggest that it is the extremes daily precipitation that matter the most.
- The drying tendency over the wet basins in the southeast in the wet season and wetting tendency over the dry and semi-dry basins in the center and northwest could have some implications for water resources in the region. The drying tendency in the wet basins would reduce the supply of fresh water in the wet season when water is especially needed while the wetting tendency in the dry and semi-dry basins would benefit the watersheds.
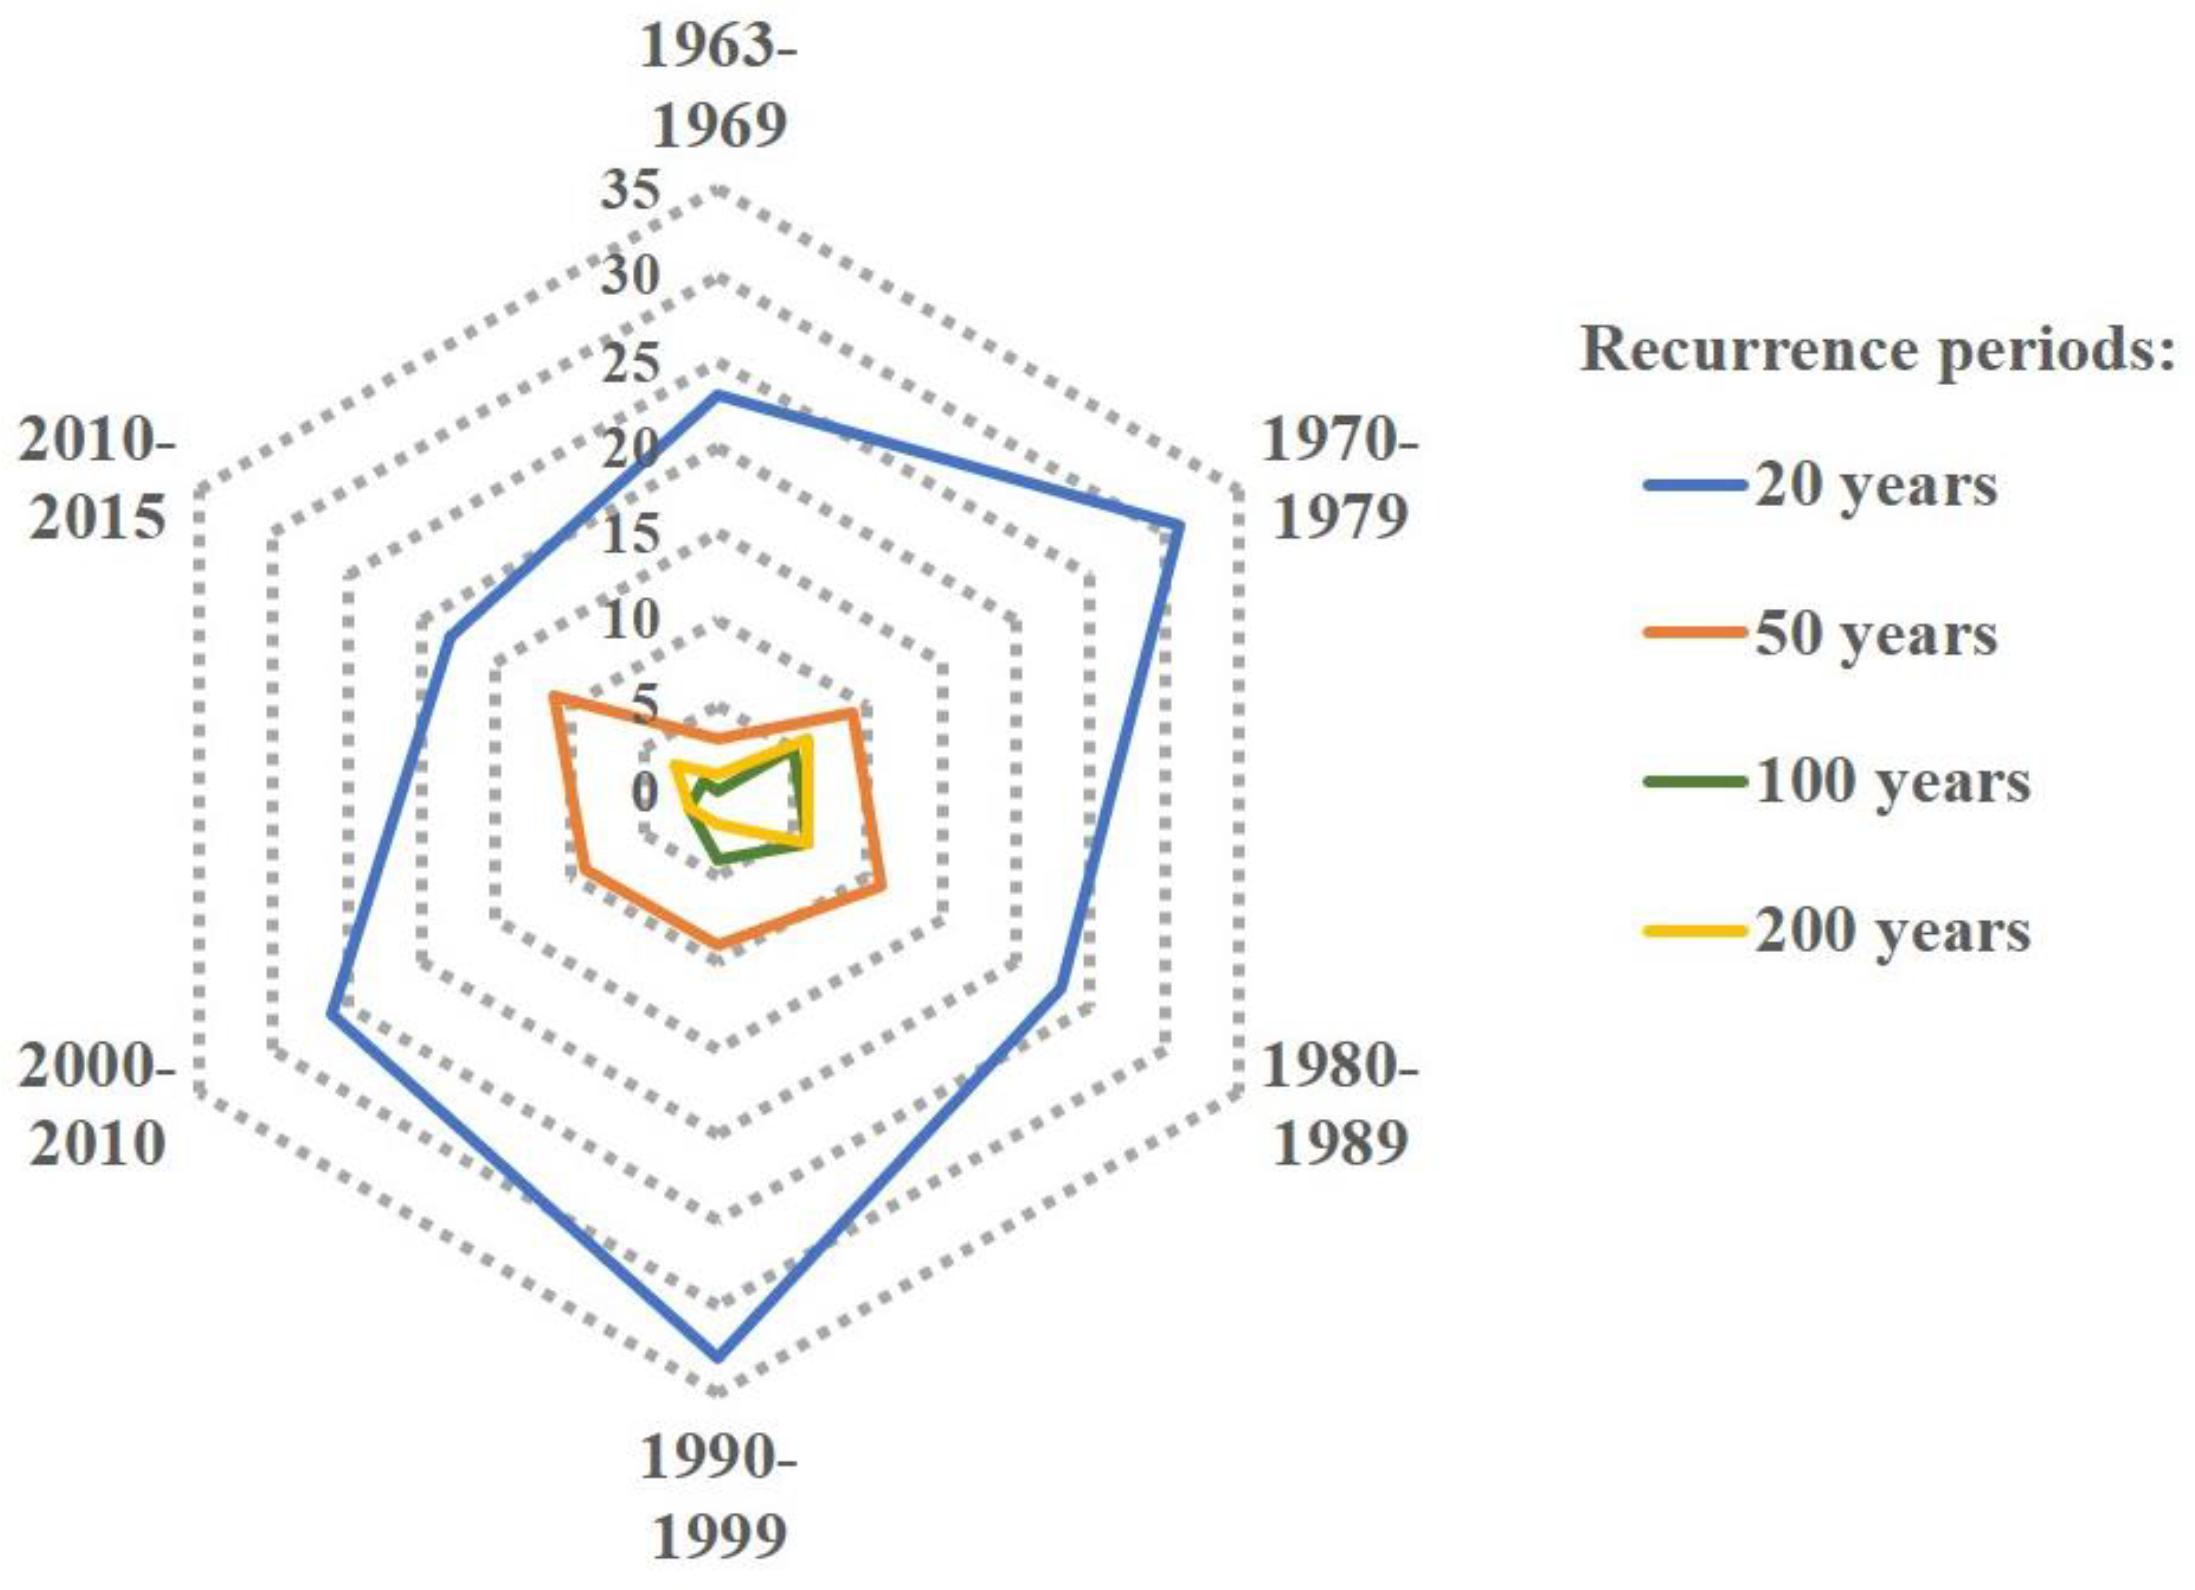
- The thresholds for the 20-year, 50-year, 100-year, and 200-year recurrence periods decrease from the southeast to the northwest, consistent with the spatial patterns of annual precipitation and annual maximum daily precipitation. The highest thresholds for all recurrence periods occur at Leshan, one of the wettest stations, whereas the lowest thresholds appear at Lenghu, one of the driest stations. The greatest extreme precipitation events tend to occur after the late 1990s and in the southeastern TPS.
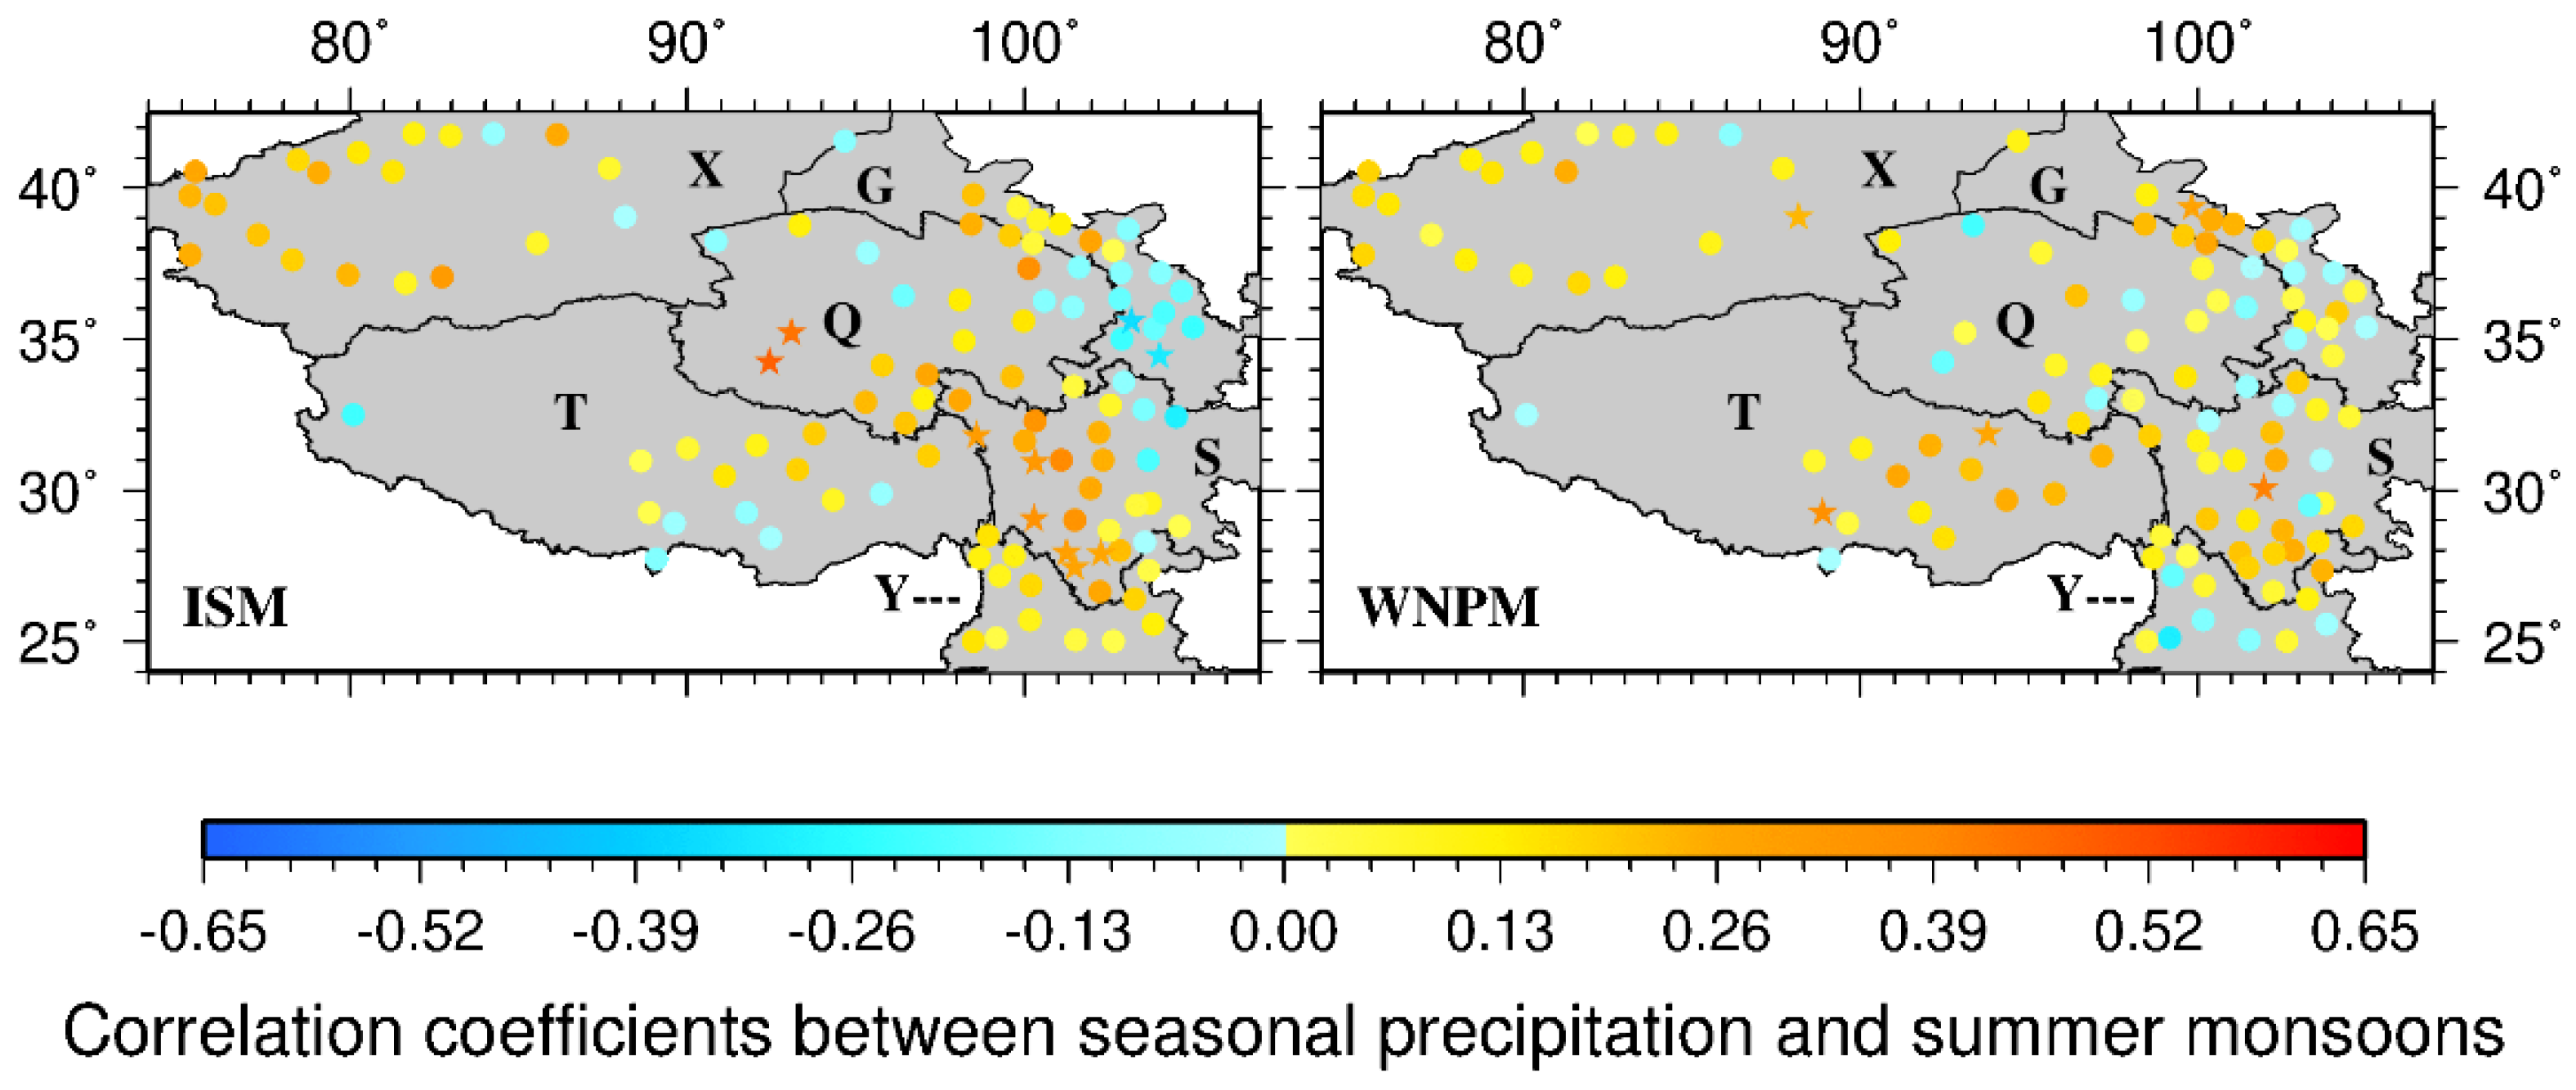
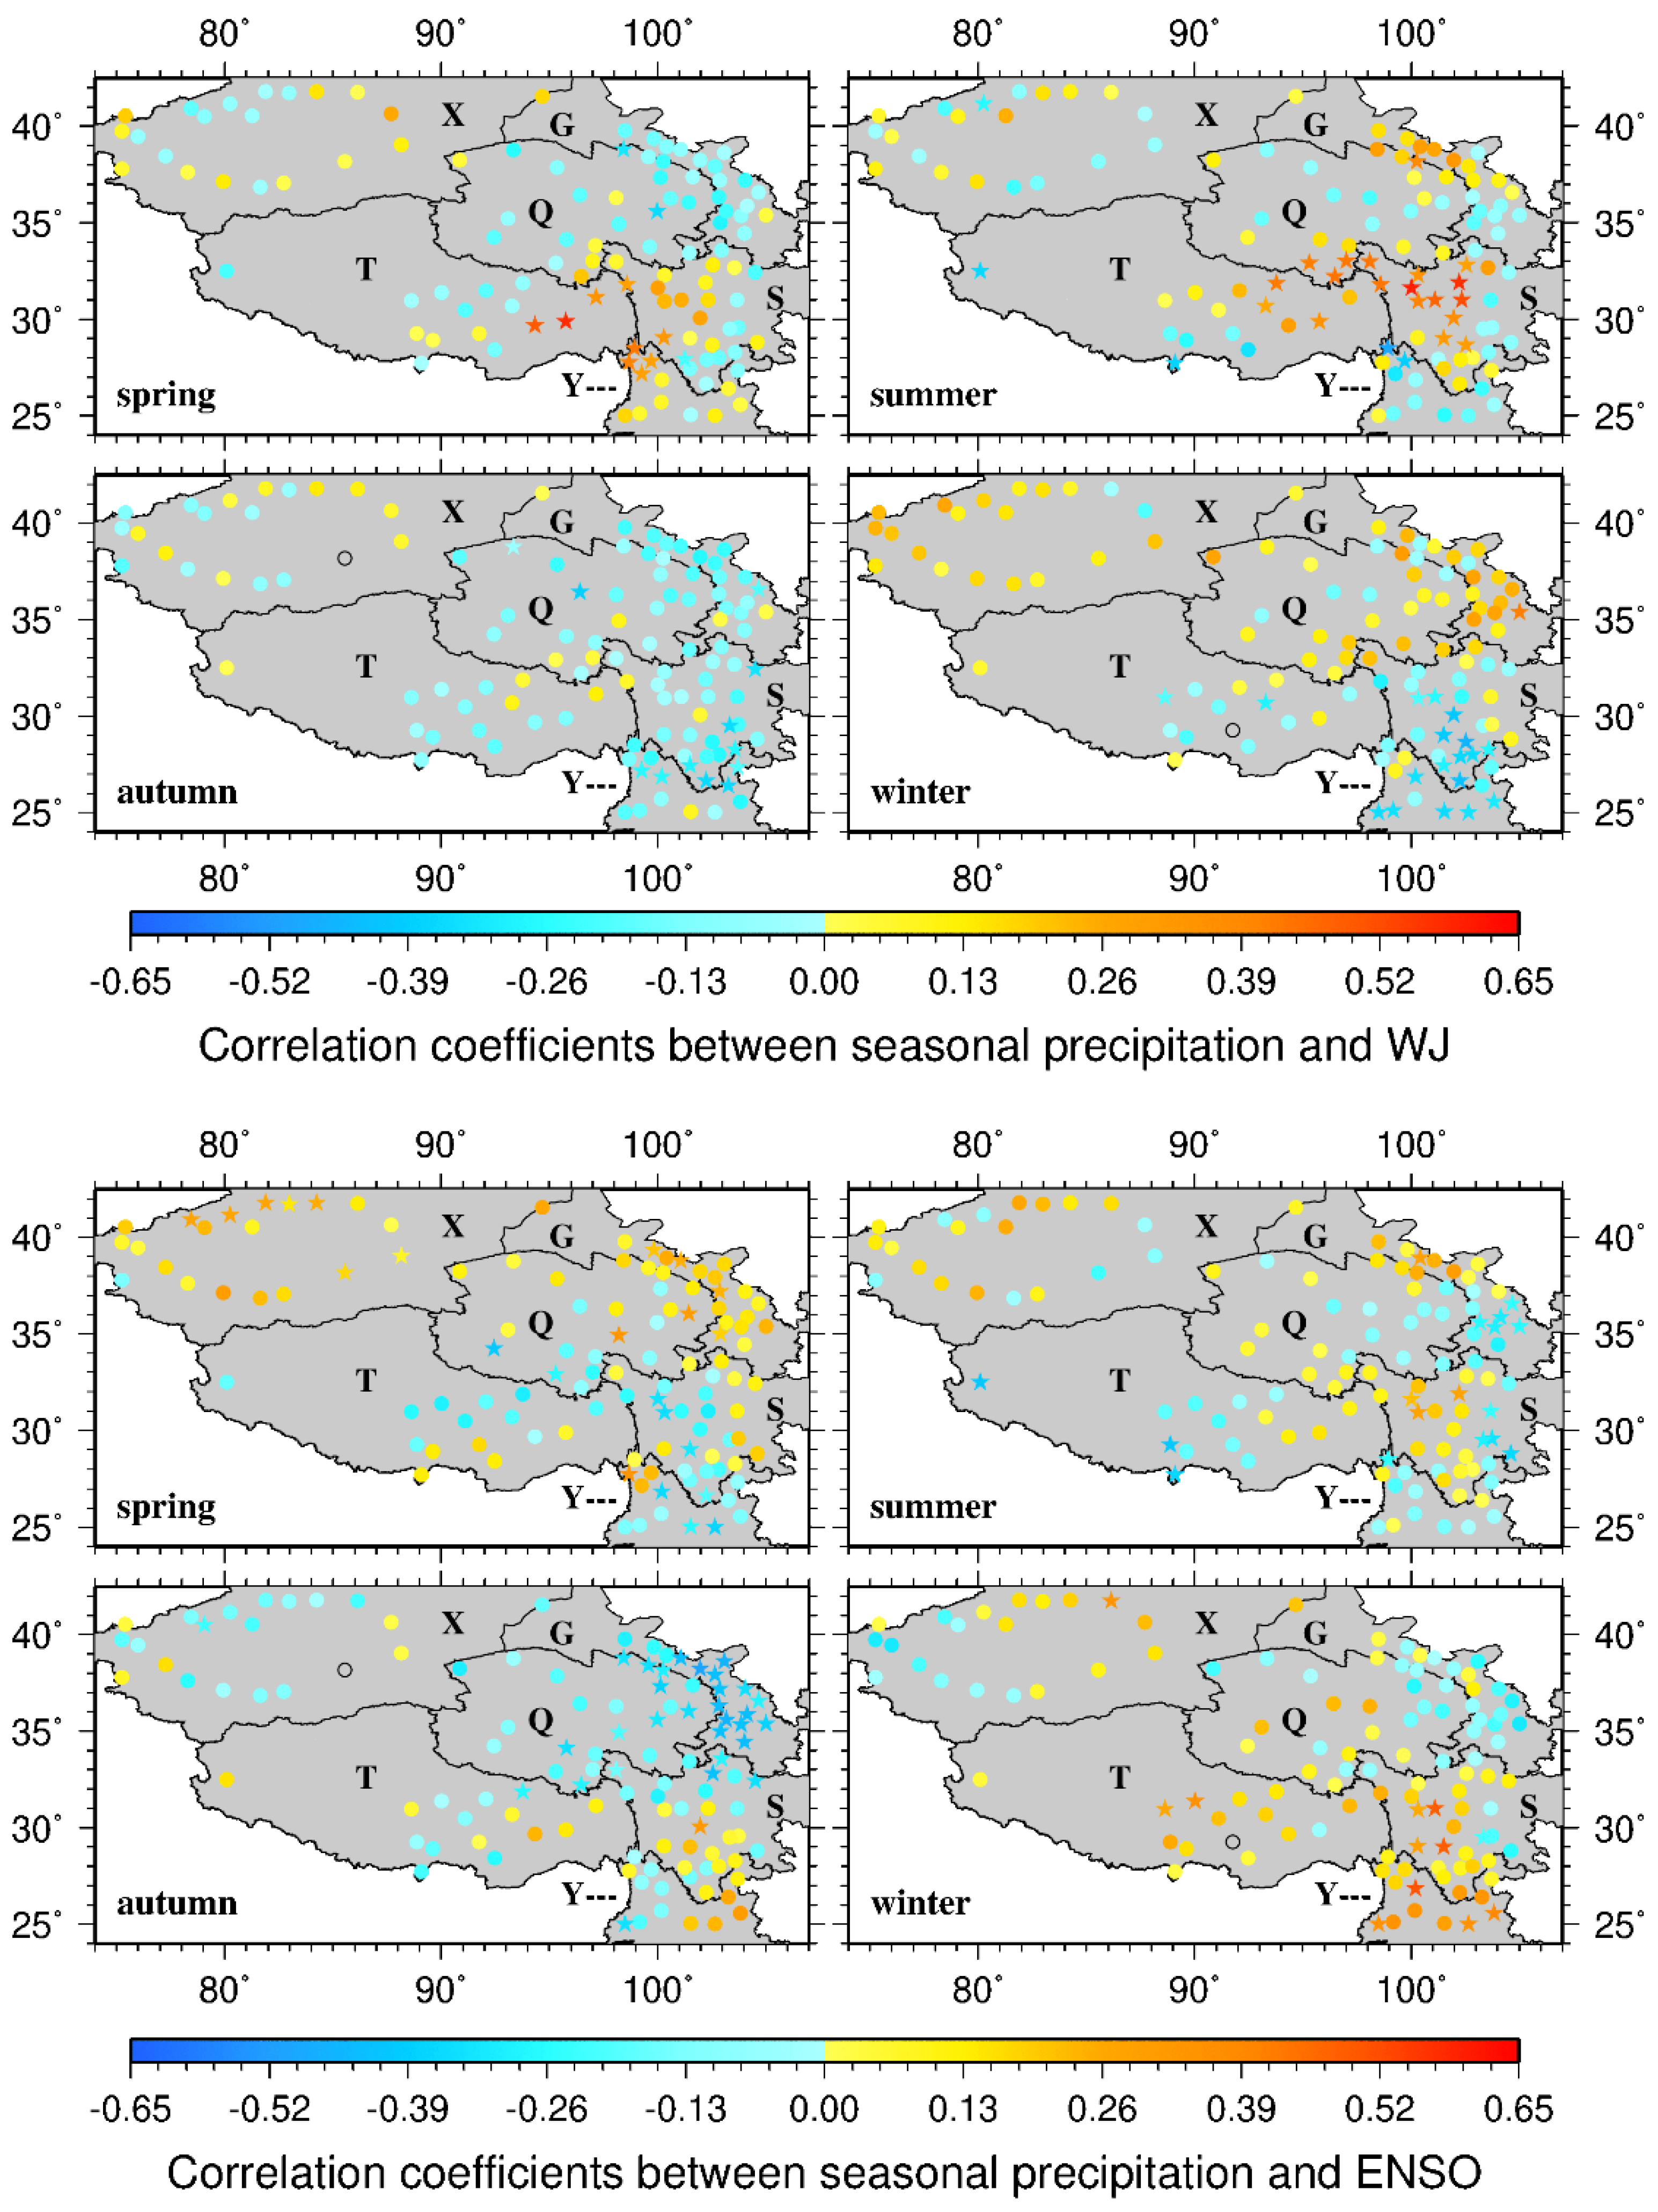
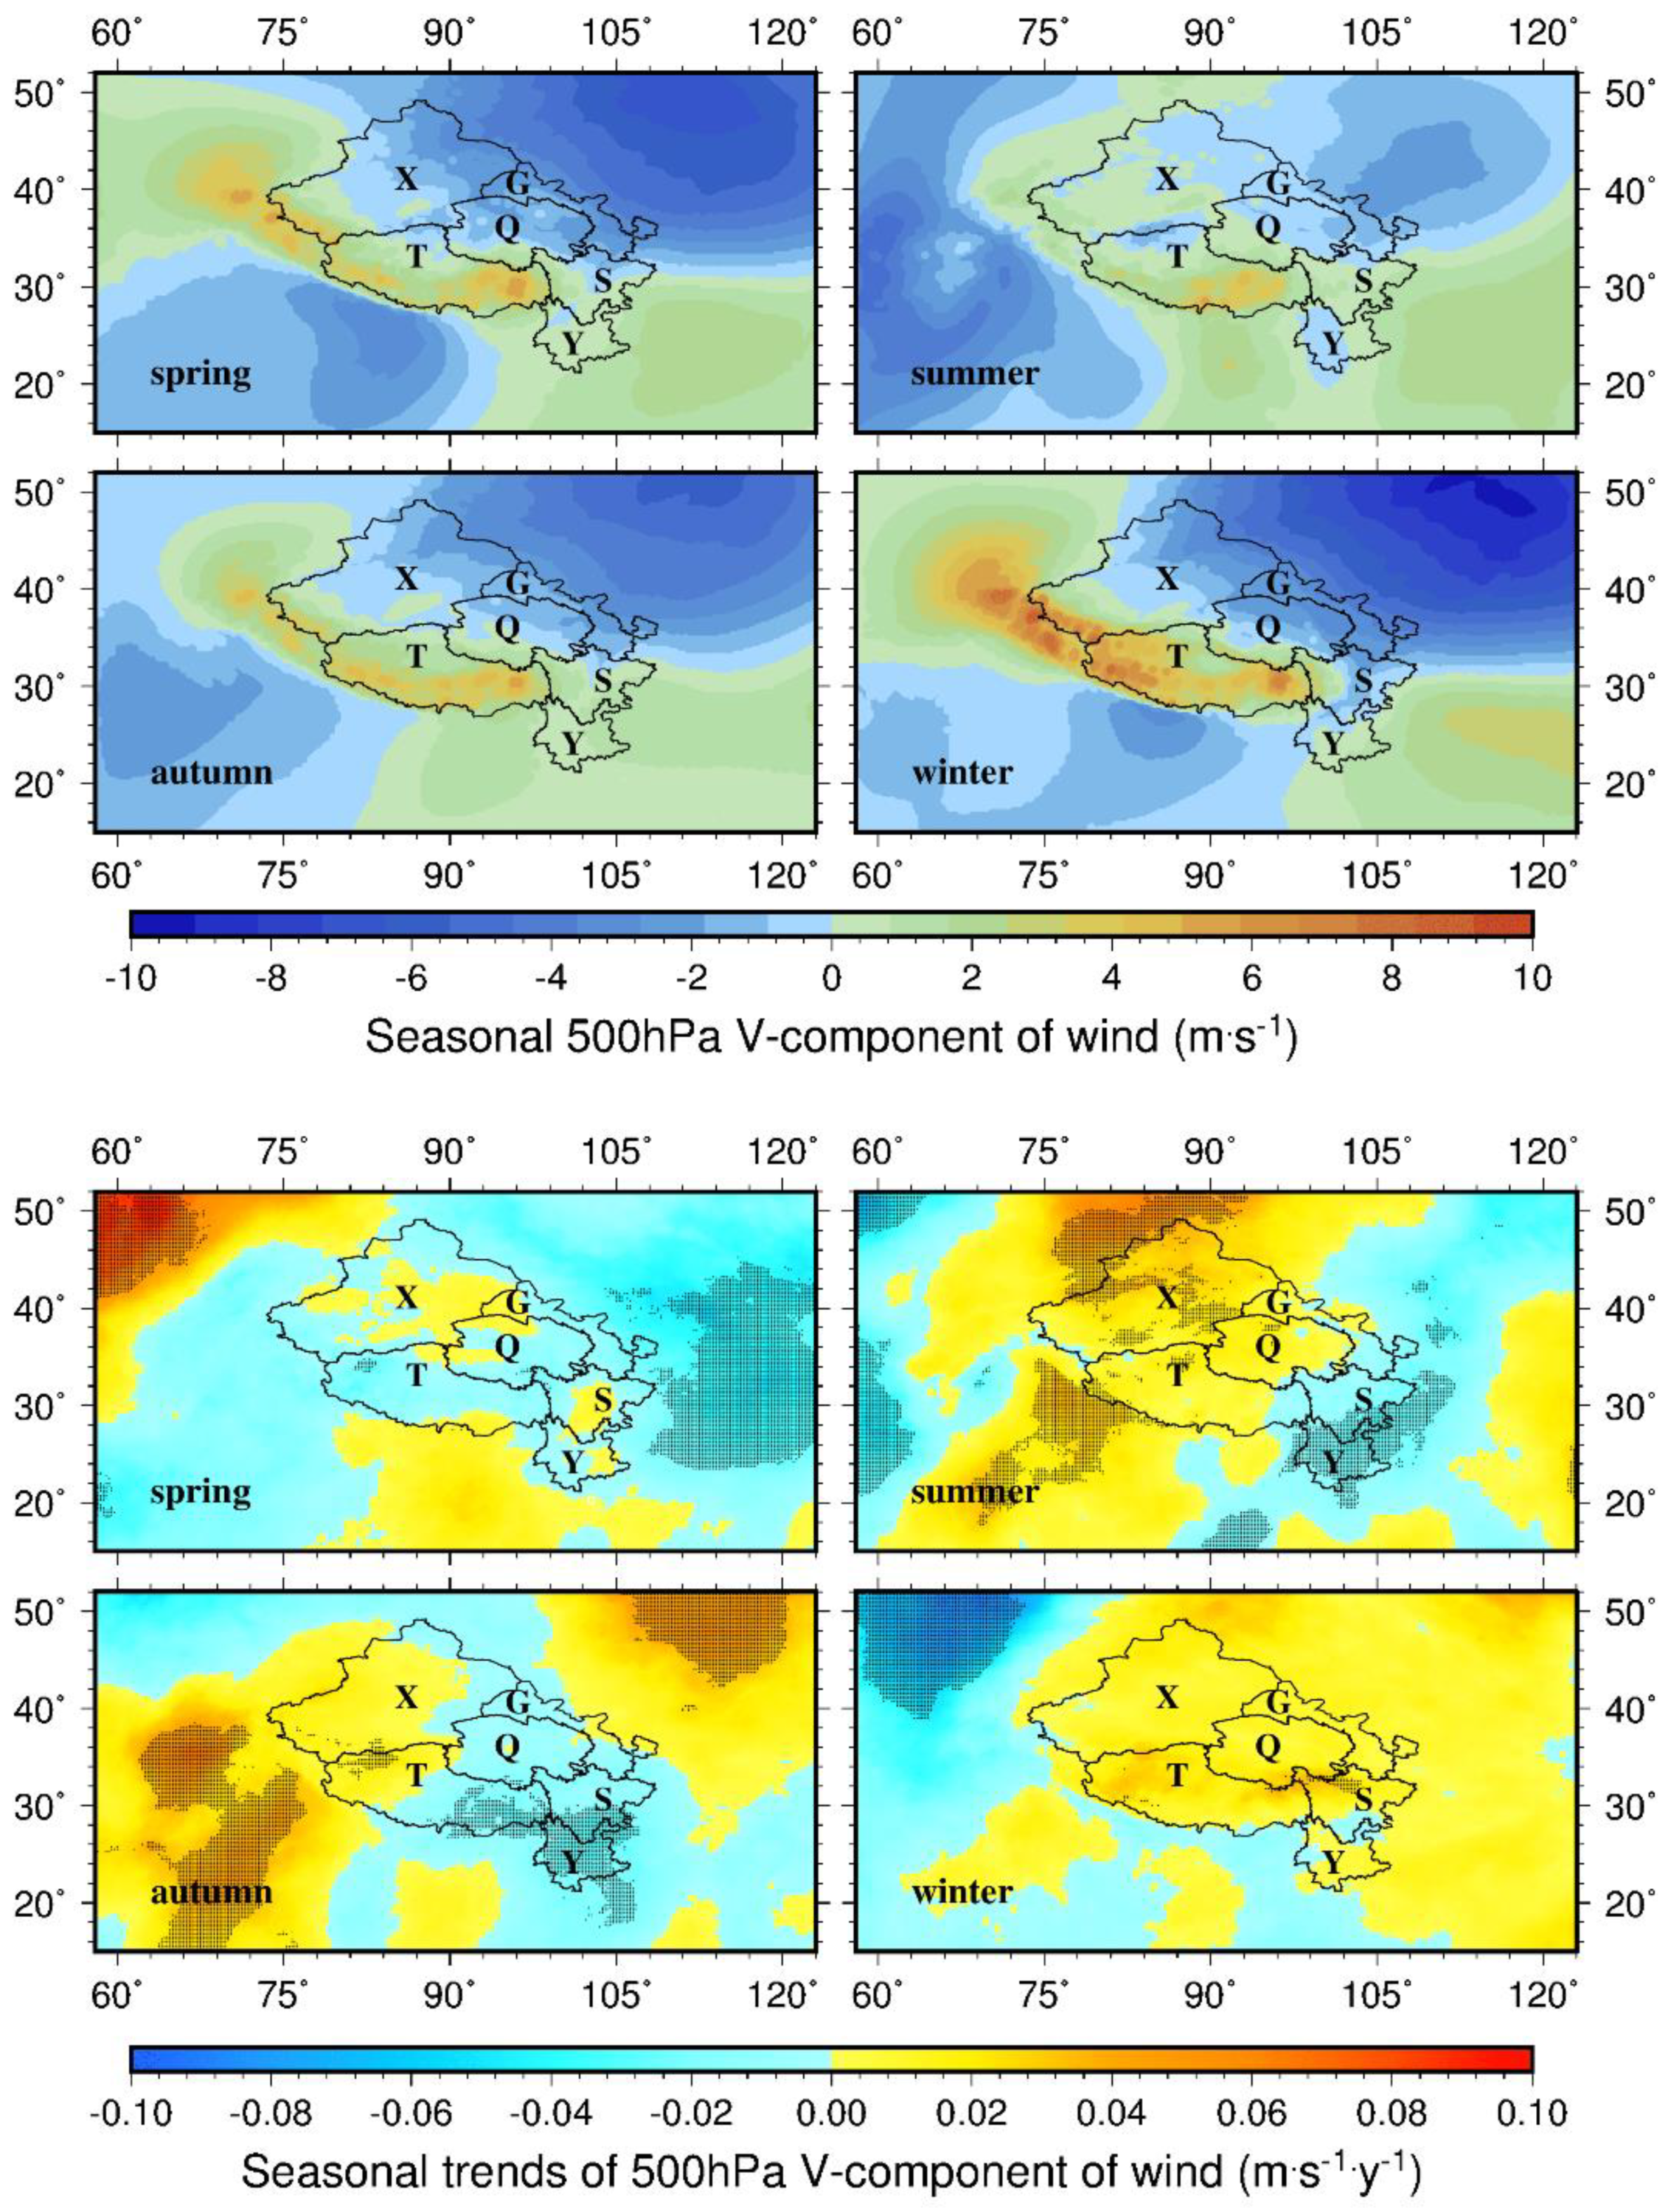
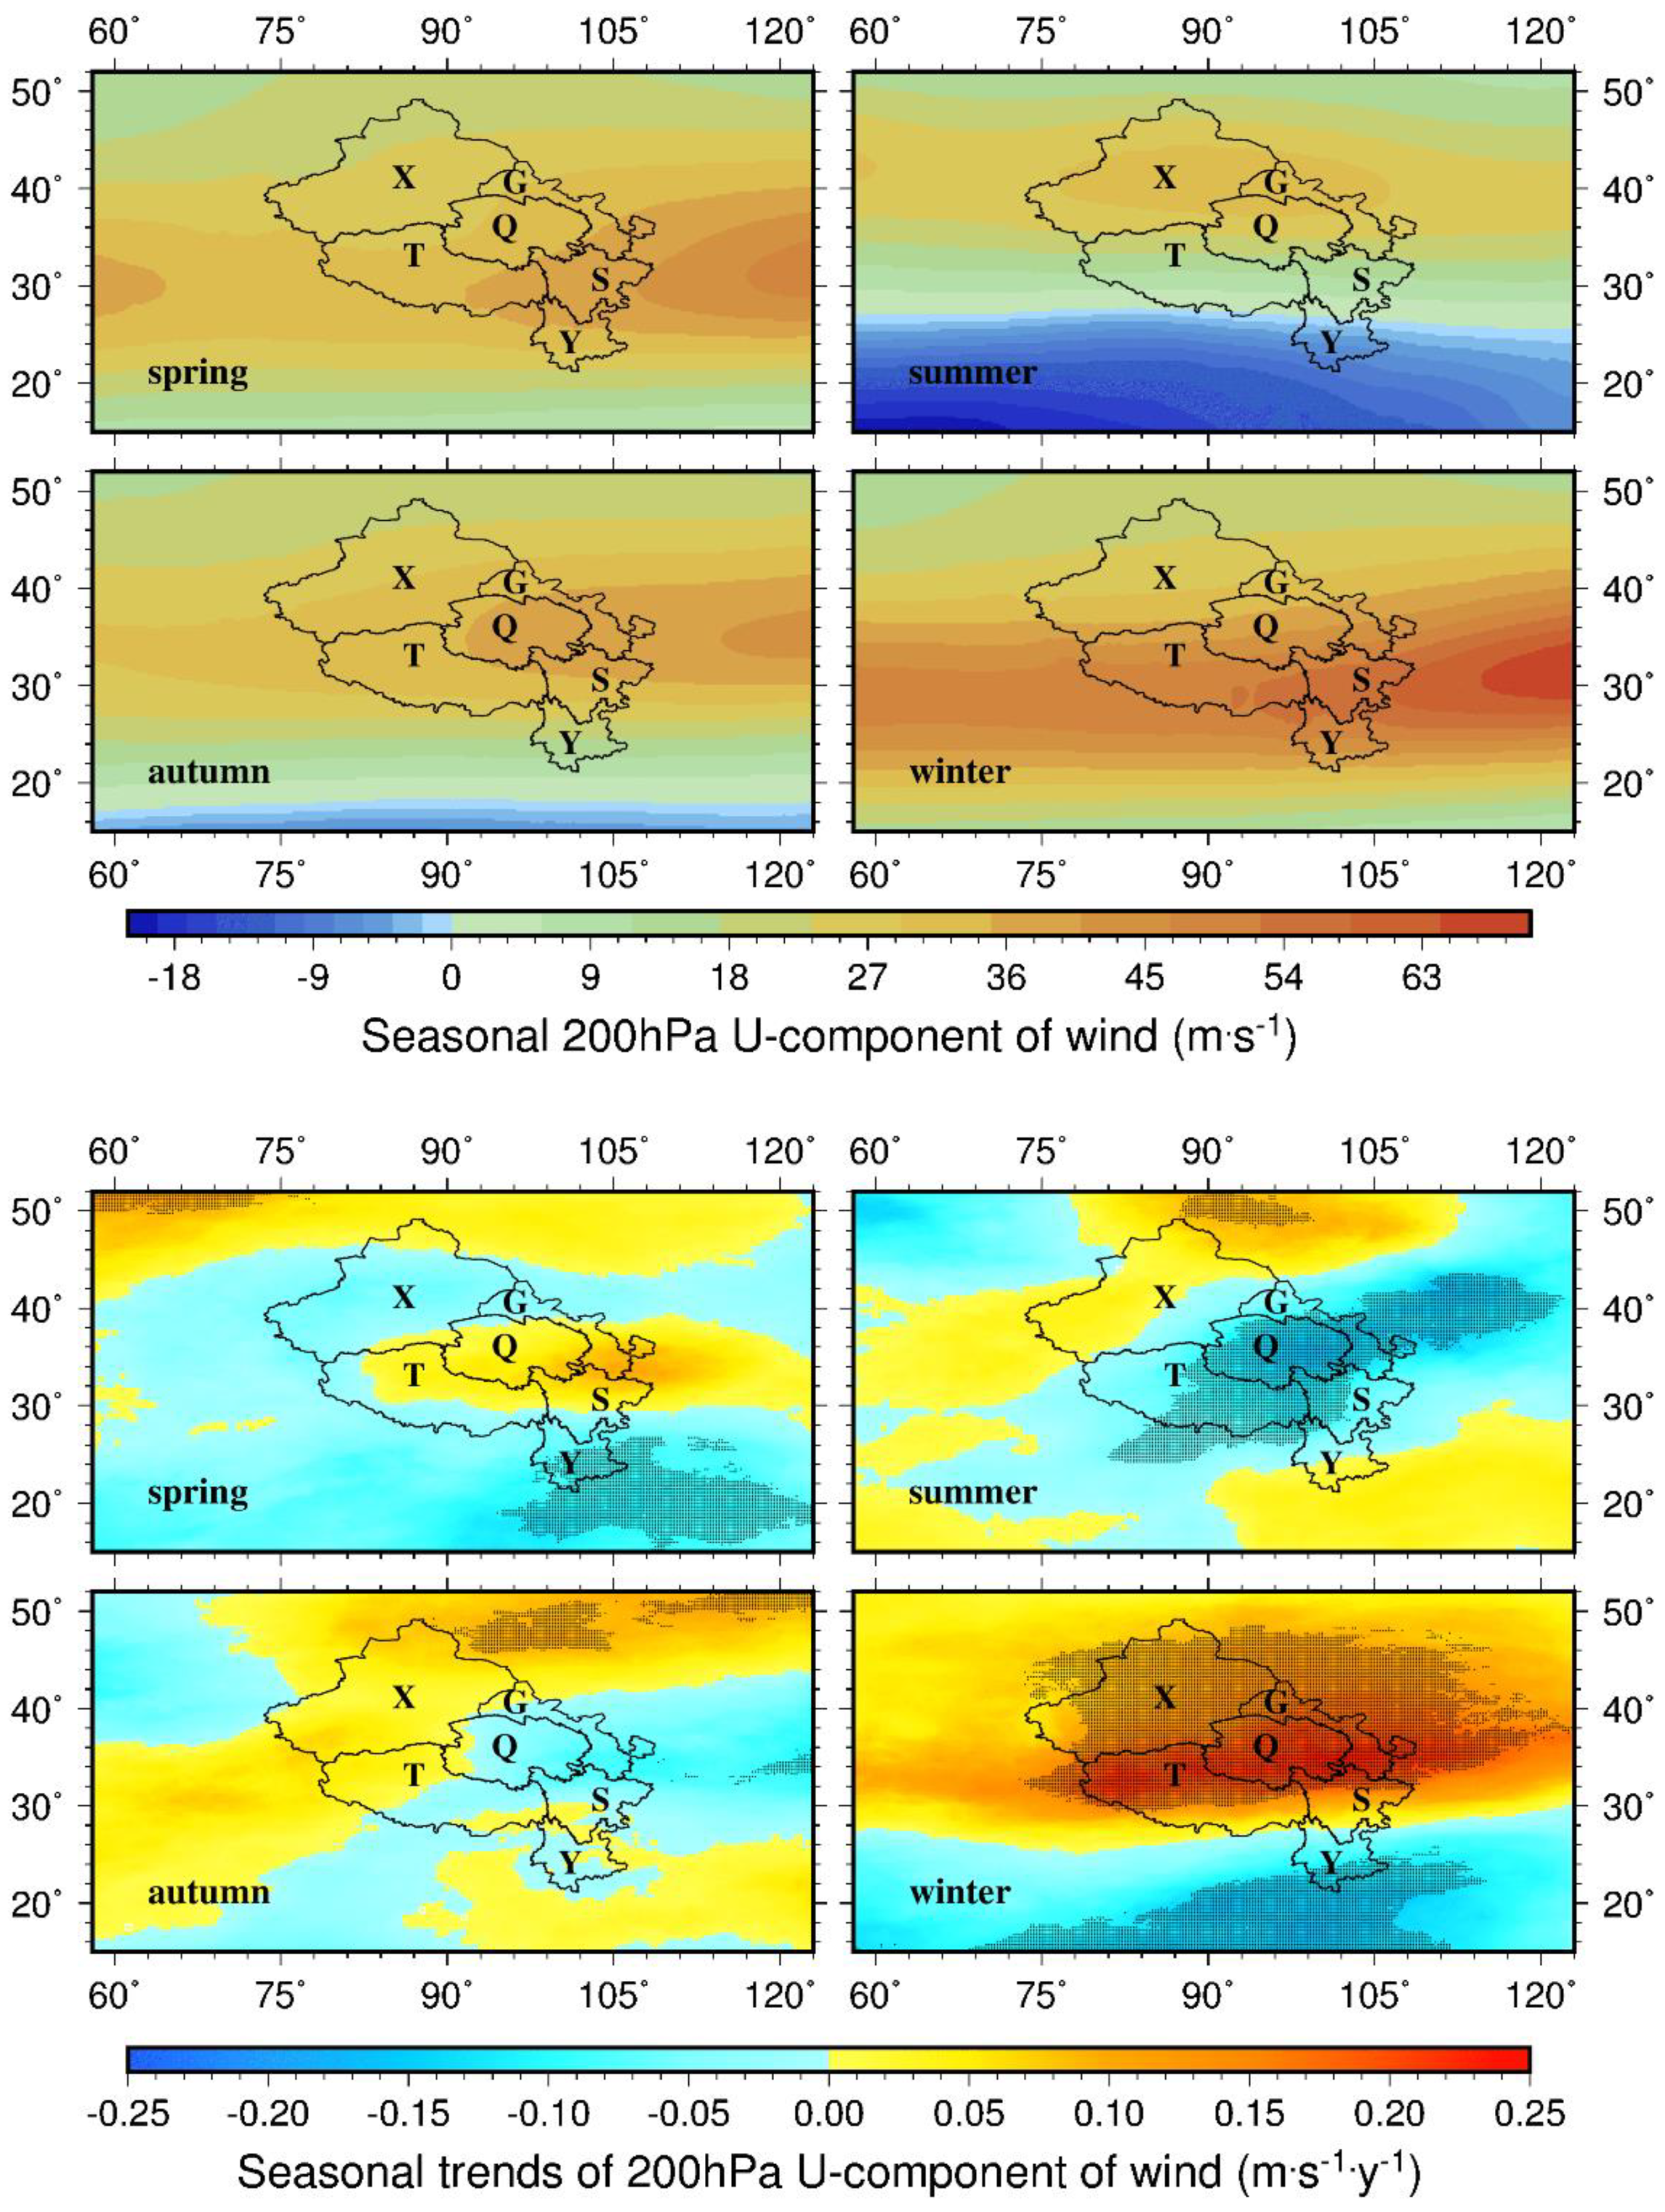
- The climate systems that directly and indirectly impact the TPS appear to work collectively in a dynamic way and precipitation changes on the TPS cannot be fully attributed to one climate system. What seems clear is that (1) moisture transports to the southeast from the south and the west are weakened in summer due to the weakening of the southerly/westerly as related to the weakening of the summer monsoons/the westerly jet; (2) moisture transports to the center are strengthened in winter due to the strengthening of the westerly jet and NAO; and (3) decreased instability over the southeast and increased instability over the center are conducive to the drying trends in the southeast and the wetting trends in the center. NAO and topography also seem to play some roles in precipitation changes over the TPS.
Supplementary Materials
Author Contributions
Funding
Institutional Review Board Statement
Informed Consent Statement
Data Availability Statement
Acknowledgments
Conflicts of Interest
References
- Li, X.; Jin, R.; Pan, X.; Zhang, T.; Guo, J. Changes in the near-surface soil freeze–thaw cycle on the Qinghai-Tibetan Plateau. Int. J. Appl. Earth Obs. Geoinf. 2012, 17, 33–42. [Google Scholar] [CrossRef]
- Cuo, L.; Zhang, Y.; Gao, Y.; Hao, Z.; Cairang, L. The impacts of climate change and land cover/use transition on the hydrology in the upper Yellow River Basin, China. J. Hydrol. 2013, 502, 37–52. [Google Scholar] [CrossRef]
- Cuo, L.; Zhang, Y.; Wang, Q.; Zhang, L.; Zhou, B.; Hao, Z.; Su, F. Climate Change on the Northern Tibetan Plateau during 1957–2009: Spatial Patterns and Possible Mechanisms. J. Clim. 2013, 26, 85–109. [Google Scholar] [CrossRef]
- Cuo, L.; Zhang, Y.; Zhu, F.; Liang, L. Characteristics and changes of streamflow on the Tibetan Plateau: A review. J. Hydrol. Reg. Stud. 2014, 2, 49–68. [Google Scholar] [CrossRef]
- Shen, W.; Zou, C.; Liu, D.; Ouyang, Y.; Zhang, H.; Yang, C.; Bai, S.; Lin, N. Climate-forced ecological changes over the Tibetan Plateau. Cold Reg. Sci. Technol. 2015, 114, 27–35. [Google Scholar] [CrossRef]
- Yan, L.; Zheng, M. The response of lake variations to climate change in the past forty years: A case study of the northeastern Tibetan Plateau and adjacent areas, China. Quat. Int. 2015, 371, 31–48. [Google Scholar] [CrossRef]
- Zheng, Z.; Zhu, W.; Chen, G.; Jiang, N.; Fan, D.; Zhang, D. Continuous but diverse advancement of spring-summer phenology in response to climate warming across the Qinghai-Tibetan Plateau. Agric. For. Meteorol. 2016, 223, 194–202. [Google Scholar] [CrossRef]
- Zhu, F.; Cuo, L.; Zhang, Y.; Luo, J.-J.; Lettenmaier, D.P.; Lin, Y.; Liu, Z. Spatiotemporal variations of annual shallow soil temperature on the Tibetan Plateau during 1983–2013. Clim. Dyn. 2017, 51, 2209–2227. [Google Scholar] [CrossRef]
- Tian, L.; Masson-Delmotte, V.; Stievenard, M.; Yao, T.; Jouzel, J. Tibetan Plateau summer monsoon northward extent revealed by measurements of water stable isotopes. J. Geophys. Res. Space Phys. 2001, 106, 28081–28088. [Google Scholar] [CrossRef]
- Zhang, Y.; Enomoto, H.; Ohata, T.; Kitabata, H.; Kadota, T.; Hirabayashi, Y. Glacier mass balance and its potential impacts in the Altai Mountains over the period 1990–2011. J. Hydrol. 2017, 553, 662–677. [Google Scholar] [CrossRef]
- Cuo, L.; Zhang, Y. Spatial patterns of wet season precipitation vertical gradients on the Tibetan Plateau and the surroundings. Sci. Rep. 2017, 7, 1–10. [Google Scholar] [CrossRef]
- Ding, J.; Cuo, L.; Zhang, Y.; Zhu, F. Monthly and annual temperature extremes and their changes on the Tibetan Plateau and its surroundings during 1963–2015. Sci. Rep. 2018, 8, 1–23. [Google Scholar] [CrossRef]
- Lin, Z.; Zhao, X. Spatial characteristics of changes in temperature and precipitation of the Qinghai-Xizang (Tibet) plateau. Sci. China Earth Sci. 1996, 39, 442–448. [Google Scholar] [CrossRef]
- You, Q.; Kang, S.; Aguilar, E.; Yan, Y. Changes in daily climate extremes in the eastern and central Tibetan Plateau during 1961–2005. J. Geophys. Res. Space Phys. 2008, 113, 1639–1647. [Google Scholar] [CrossRef]
- Ge, G.; Shi, Z.; Yang, X.; Hao, Y.; Guo, H.; Kossi, F.; Xin, Z.; Wei, W.; Zhang, Z.; Zhang, X.; et al. Analysis of Precipitation Extremes in the Qinghai-Tibetan Plateau, China: Spatio-Temporal Characteristics and Topography Effects. Atmosphere 2017, 8, 127. [Google Scholar] [CrossRef]
- Wang, Y.; Liao, W.; Ding, Y.; Wang, X.; Jiang, Y.; Song, X.; Lei, X. Water resource spatiotemporal pattern evaluation of the upstream Yangtze River corresponding to climate changes. Quat. Int. 2015, 380–381, 187–196. [Google Scholar] [CrossRef]
- Tian, Q.; Prange, M.; Merkel, U. Precipitation and temperature changes in the major Chinese river basins during 1957–2013 and links to sea surface temperature. J. Hydrol. 2016, 536, 208–221. [Google Scholar] [CrossRef]
- Jiang, C.; Zhang, L.; Tang, Z. Multi-temporal scale changes of streamflow and sediment discharge in the headwaters of Yellow River and Yangtze River on the Tibetan Plateau, China. Ecol. Eng. 2017, 102, 240–254. [Google Scholar] [CrossRef]
- Wu, F.; Wang, X.; Cai, Y.; Li, C. Spatiotemporal analysis of precipitation trends under climate change in the upper reach of Mekong River basin. Quat. Int. 2016, 392, 137–146. [Google Scholar] [CrossRef]
- Yang, Y.; Jun, D.U.; Luo, S.X.; Shi, L. On extreme precipitation events in the Nujiang river basin in Tibet in recent 40 years. Arid Zone Res. 2013, 30, 315–321. (In Chinese) [Google Scholar] [CrossRef]
- Deng, H.; Chen, Y. Influences of recent climate change and human activities on water storage variations in Central Asia. J. Hydrol. 2017, 544, 46–57. [Google Scholar] [CrossRef]
- Song, C.; Huang, B.; Ke, L.; Ye, Q. Precipitation variability in High Mountain Asia from multiple datasets and implication for water balance analysis in large lake basins. Glob. Planet. Chang. 2016, 145, 20–29. [Google Scholar] [CrossRef]
- Wu, C.; Hu, B.X.; Huang, G.; Zhang, H. Effects of climate and terrestrial storage on temporal variability of actual evapotranspiration. J. Hydrol. 2017, 549, 388–403. [Google Scholar] [CrossRef]
- Sun, H.; Su, F.; Huang, J.; Yao, T.; Luo, Y.; Chen, D. Contrasting precipitation gradient characteristics between westerlies and monsoon dominated upstream river basins in the Third Pole. Chin. Sci. Bull. 2019, 65, 91–104. (In Chinese) [Google Scholar] [CrossRef]
- Liu, X.; Yin, Z.-Y. Spatial and Temporal Variation of Summer Precipitation over the Eastern Tibetan Plateau and the North Atlantic Oscillation. J. Clim. 2001, 14, 2896–2909. [Google Scholar] [CrossRef]
- Zhang, Y.; Li, T.; Wang, B. Decadal Change of the Spring Snow Depth over the Tibetan Plateau: The Associated Circulation and Influence on the East Asian Summer Monsoon. J. Clim. 2004, 17, 2780–2793. [Google Scholar] [CrossRef]
- Tian, L.; Yao, T.; MacClune, K.; White, J.W.C.; Schilla, A.; Vaughn, B.; Vachon, R.; Ichiyanagi, K. Stable isotopic variations in west China: A consideration of moisture sources. J. Geophys. Res. Space Phys. 2007, 112. [Google Scholar] [CrossRef]
- Zhang, Q.; Xu, C.-Y.; Jiang, T.; Wu, Y. Possible influence of ENSO on annual maximum streamflow of the Yangtze River, China. J. Hydrol. 2007, 333, 265–274. [Google Scholar] [CrossRef]
- Wu, Z.; Li, J.; Jiang, Z.; Ma, T. Modulation of the Tibetan Plateau Snow Cover on the ENSO Teleconnections: From the East Asian Summer Monsoon Perspective. J. Clim. 2012, 25, 2481–2489. [Google Scholar] [CrossRef]
- Wang, H.; Chen, Y.; Li, W. Characteristics in streamflow and extremes in the Tarim River, China: Trends, distribution and climate linkage. Int. J. Clim. 2014, 35, 761–776. [Google Scholar] [CrossRef]
- Wang, H.; Chen, Y.; Pan, Y. Characteristics of drought in the arid region of northwestern China. Clim. Res. 2015, 62, 99–113. [Google Scholar] [CrossRef]
- Li, B.; Chen, Y.; Chen, Z.; Xiong, H.; Lian, L. Why does precipitation in northwest China show a significant increasing trend from 1960 to 2010? Atmos. Res. 2016, 167, 275–284. [Google Scholar] [CrossRef]
- Jiang, X.; Ting, M. A Dipole Pattern of Summertime Rainfall across the Indian Subcontinent and the Tibetan Plateau. J. Clim. 2017, 30, 9607–9620. [Google Scholar] [CrossRef]
- Wang, B.; Fan, Z. Choice of South Asian Summer Monsoon Indices. Bull. Am. Meteorol. Soc. 1999, 80, 629–638. [Google Scholar] [CrossRef]
- Wang, B.; Wu, R.; Lau, K.-M. Interannual variability of asian summer monsoon: Contrast between the indian and western north pacific-east asian monsoons. J. Clim. 2001, 14, 4073–4090. [Google Scholar] [CrossRef]
- Duan, A.; Wu, G. Weakening Trend in the Atmospheric Heat Source over the Tibetan Plateau during Recent Decades. Part II: Connection with Climate Warming. J. Clim. 2009, 22, 4197–4212. [Google Scholar] [CrossRef]
- Hersbach, H.; Dee, D. “ERA-5 Reanalysis in Production”, ECMWF Newsletter, Number 147. Spring 2016. Available online: https://www.ecmwf.int/en/newsletter/147/news/era5-reanalysis-production (accessed on 11 May 2021).
- Dee, D.P.; Uppala, S.M.; Simmons, A.J.; Berrisford, P.; Poli, P.; Kobayashi, S.; Andrae, U.; Balmaseda, M.A.; Balsamo, G.; Bauer, P.; et al. The ERA-Interim reanalysis: Configuration and performance of the data assimilation system. Q. J. R. Meteorol. Soc. 2011, 137, 553–597. [Google Scholar] [CrossRef]
- Albergel, C.; Dutra, E.; Munier, S.; Calvert, J.-C.; Munoz-Sabater, J.; de Rosnay, P.; Balsamo, G. ERA-5 and ERA-Interim driven ISBA land surface model simulations: Which one performs better? Hydrol. Earth Syst. Sci. 2018, 22, 3515–3532. [Google Scholar] [CrossRef]
- Mann, H.B. Nonparametric tests against trend. Econometrica 1945, 13, 245–259. [Google Scholar] [CrossRef]
- Kendall, M.G. Rank Correlation Methods; Griffin: London, UK, 1975. [Google Scholar]
- Cannarozzo, M.; Noto, L.; Viola, F. Spatial distribution of rainfall trends in Sicily (1921–2000). Phys. Chem. Earth, Parts A/B/C 2006, 31, 1201–1211. [Google Scholar] [CrossRef]
- Guhathakurta, P.; Sreejith, O.P.; A Menon, P. Impact of climate change on extreme rainfall events and flood risk in India. J. Earth Syst. Sci. 2011, 120, 359–373. [Google Scholar] [CrossRef]
- Tabari, H.; Talaee, P.H. Temporal variability of precipitation over Iran: 1966–2005. J. Hydrol. 2011, 396, 313–320. [Google Scholar] [CrossRef]
- Sen, P.K. Estimates of the regression coefficient based on Kendall’s Tau. J. Am. Stat. Assoc. 1968, 63, 1379–1389. [Google Scholar] [CrossRef]
- Gumbel, E.J. Statistics of Extremes; Columbia University Press: New York, NY, USA, 1958. [Google Scholar]
- Waylen, P.; Woo, M.-K. Prediction of annual floods generated by mixed processes. Water Resour. Res. 1982, 18, 1283–1286. [Google Scholar] [CrossRef]
- Caporali, E.; Cavigli, E.; Petrucci, A. The index rainfall in the regional frequency analysis of extreme events in Tuscany (Italy). Environmetrics 2008, 19, 714–724. [Google Scholar] [CrossRef]
- Strupczewski, W.G.; Kochanek, K.; Bogdanowicz, E.; Markiewicz, I. On seasonal approach to flood frequency modelling. Part I: Two-component distribution revisited. Hydrol. Process. 2011, 26, 705–716. [Google Scholar] [CrossRef]
- Gu, X.; Zhang, Q.; Singh, V.P.; Shi, P. Non-stationarities in the occurrence rate of heavy precipitation across China and its relationship to climate teleconnection patterns. Int. J. Clim. 2017, 37, 4186–4198. [Google Scholar] [CrossRef]
- Rahimzadeh, F.; Asgari, A.; Fattahi, E. Variability of extreme temperature and precipitation in Iran during recent decades. Int. J. Clim. 2009, 29, 329–343. [Google Scholar] [CrossRef]
- Zhang, X.; Alexander, L.V.; Hegerl, G.C.; Jones, P.; Tank, A.K.; Peterson, T.C.; Trewin, B.; Zwiers, F.W. Indices for monitoring changes in extremes based on daily temperature and precipitation data. Wiley Interdiscip. Rev. Clim. Chang. 2011, 2, 851–870. [Google Scholar] [CrossRef]
- Hu, Z.; Li, Q.; Chen, X.; Teng, Z.; Chen, C.; Yin, G.; Zhang, Y. Climate changes in temperature and precipitation extremes in an alpine grassland of Central Asia. Theor. Appl. Clim. 2016, 126, 519–531. [Google Scholar] [CrossRef]
- Dosio, A. Projections of climate change indices of temperature and precipitation from an ensemble of bias-adjusted high-resolution EURO-CORDEX regional climate models. J. Geophys. Res. Atmos. 2016, 121, 5488–5511. [Google Scholar] [CrossRef]
- Limsakul, A.; Singhruck, P. Long-term trends and variability of total and extreme precipitation in Thailand. Atmos. Res. 2016, 169, 301–317. [Google Scholar] [CrossRef]
- Feng, L.; Zhou, T. Water vapor transport for summer precipitation over the Tibetan Plateau: Multidata set analysis. J. Geophys. Res. Space Phys. 2012, 117. [Google Scholar] [CrossRef]
- Lehmann, E.L. Nonparametrics: Statistical Methods Based on Ranks; Holden-Day: Clear Spring, MD, USA, 1975. [Google Scholar]
- Sneyers, R. On the Statistical Analysis of Series of Observations; Technical Note No. 143, WMO No. 415; World Meteorological Organization: Geneva, Switzerland, 1990. [Google Scholar]
- Yao, T.; Zhou, H.; Yang, X. Indian monsoon influences altitude effect of δ18O in precipitation/river water on the Tibetan Plateau. Sci. Bull. 2009, 54, 2724–2731. [Google Scholar] [CrossRef]
- Schiemann, R.; Lüthi, D.; Schär, C. Seasonality and Interannual Variability of the Westerly Jet in the Tibetan Plateau Region. J. Clim. 2009, 22, 2940–2957. [Google Scholar] [CrossRef]
- Duan, X.; Tao, Y.; Mei-Ling, X.U.; Ya-Bin, L.U.; Liang, H.L. Influence of south branch trough of westerlies on weather of Yunnan province. Plateau Meteorol. 2012, 31, 1059–1065. (In Chinese) [Google Scholar]
- Yao, T.; Thompson, L.; Yang, W.; Yu, W.; Gao, Y.; Guo, X.; Yang, X.; Duan, K.; Zhao, H.; Xu, B.; et al. Different glacier status with atmospheric circulations in Tibetan Plateau and surroundings. Nat. Clim. Chang. 2012, 2, 663–667. [Google Scholar] [CrossRef]
- Maussion, F.; Scherer, D.; Mölg, T.; Collier, E.; Curio, J.; Finkelnburg, R. Precipitation Seasonality and Variability over the Tibetan Plateau as Resolved by the High Asia Reanalysis. J. Clim. 2014, 27, 1910–1927. [Google Scholar] [CrossRef]
- Sun, B.; Wang, H. Interannual Variation of the Spring and Summer Precipitation over the Three River Source Region in China and the Associated Regimes. J. Clim. 2018, 31, 7441–7457. [Google Scholar] [CrossRef]
- Zhou, T.; Gao, J.; Zhao, Y.; Zhang, L.; Zhang, W. Water Vapor Transport Processes on Asian Water Tower. Bull. Chin. Acad. Sci. 2019, 34, 1210–1219. (In Chinese) [Google Scholar] [CrossRef]
- Lin, C.; Chen, D.; Yang, K.; Ou, T. Impact of model resolution on simulating the water vapor transport through the central Himalayas: Implication for models’ wet bias over the Tibetan Plateau. Clim. Dyn. 2018, 51, 3195–3207. [Google Scholar] [CrossRef]


| BPR(9) | CQB(6) | CTB(2) | IDR(1) | MKR(5) | NQMB(10) | SWR(4) | TRB(20) | YLR(18) | YTR(37) | |
|---|---|---|---|---|---|---|---|---|---|---|
| Seasonal and annual precipitation | ||||||||||
| spring | 96.6 | 22.8 | 25.0 | 5.0 | 119.4 | 34.3 | 111.5 | 20.9 | 119.4 | 133.8 |
| summer | 316.4 | 84.7 | 225.3 | 53.3 | 390.3 | 130.7 | 360.6 | 44.2 | 279.3 | 463.7 |
| autumn | 106.3 | 20.5 | 60.6 | 8.2 | 160.4 | 40.2 | 157.8 | 13.4 | 122.9 | 185.1 |
| winter | 11.5 | 4.2 | 4.1 | 4.1 | 34.9 | 4.7 | 25.1 | 5.8 | 20.4 | 21.2 |
| annual | 530.8 | 131.9 | 315.2 | 70.6 | 708.2 | 209.8 | 658.3 | 84.3 | 543.6 | 803.2 |
| Trends of seasonal and annual precipitation | ||||||||||
| spring | 0.2167 | 0.0087 | 0.1280 | −0.0047 | 0.1194 | 0.0233 | 0.1937 | 0.0112 | 0.0627 | 0.1065 |
| summer | −0.0407 | 0.1281 | 0.1614 | −0.0522 | −0.1753 | 0.1226 | −0.1416 | 0.0835 | −0.0927 | −0.1534 |
| autumn | 0.0791 | 0.0092 | 0.0574 | −0.0024 | 0.1273 | 0.0487 | 0.0643 | 0.0254 | 0.0015 | −0.0909 |
| winter | 0.0154 | 0.0013 | 0.0084 | −0.0015 | −0.0115 | 0.0041 | −0.0298 | 0.0009 | −0.0041 | −0.0131 |
| annual | 0.9860 | 0.3610 | 1.9022 | −0.0200 | −0.1686 | 0.6970 | 0.4503 | 0.5420 | −0.1273 | −0.4120 |
| Climate System Index | Abbreviation | Definition/Reference | Data Source | Available for Months |
|---|---|---|---|---|
| Indian Summer Monsoon Index | ISM | Wang and Fan [34], Wang et al. [35] | Asia-Pacific Data-Research Center (APDRC; http://apdrc.soest.hawaii.edu/projects/monsoon/seasonal-monidx.html, last accessed on 12 May 2021) | 6–9 |
| Western North Pacific Monsoon Index | WNPM | Wang and Fan [34], Wang et al. [35] | Asia-Pacific Data-Research Center (APDRC; http://apdrc.soest.hawaii.edu/projects/monsoon/seasonal-monidx.html, last accessed on 12 May 2021) | 6–9 |
| East Asian Westerly Jet Index | WJ | Duan and Wu [36] | Duan and Wu (2009) | 1–12 |
| ENSO | ENSO | Multivariate El Niño/Southern Oscillation (ENSO) index is the time series of the leading combined EOF of 5 different variables over the tropical Pacific basin, 30 S–30° N, 100 E–70° W | National Oceanic and Atmospheric Administration (NOAA; https://www.esrl.noaa.gov/psd/enso/mei/, last accessed on 12 May 2021) | 1–12 |
| North Atlantic Oscillation | NAO | NAO index is based on the surface sea-level pressure difference between the Subtropical (Azores) High and the Subpolar Low | National Oceanic and Atmospheric Administration (NOAA; https://www.ncdc.noaa.gov/teleconnections/nao/, last accessed on 12 May 2021) | 1–12 |
| Tibet Plateau High Index | TH | At 500 hPa pressure level, the accumulated value of cell area multiplied by the difference between cell geopotential height (GPM) and 5000 GPM in 30 N–40° N, 75 E–105° E | China Meteorological Administration (CMA) | 1–12 |
| ISM | WNPM | WJ | ENSO | NAO | TH | |
|---|---|---|---|---|---|---|
| spring | 0.0185 | 0.0114 | 0.0064 | 2.2503 | ||
| summer | −0.0090 | −0.0006 | −0.0059 | 0.0137 | −0.0186 | 2.4487 |
| autumn | 0.0111 | 0.0034 | −0.0055 | 2.9216 | ||
| winter | 0.0539 | −0.0008 | 0.0241 | 2.6635 |
Publisher’s Note: MDPI stays neutral with regard to jurisdictional claims in published maps and institutional affiliations. |
© 2021 by the authors. Licensee MDPI, Basel, Switzerland. This article is an open access article distributed under the terms and conditions of the Creative Commons Attribution (CC BY) license (https://creativecommons.org/licenses/by/4.0/).
Share and Cite
Ding, J.; Cuo, L.; Zhang, Y.; Zhang, C.; Liang, L.; Liu, Z. Annual and Seasonal Precipitation and Their Extremes over the Tibetan Plateau and Its Surroundings in 1963–2015. Atmosphere 2021, 12, 620. https://doi.org/10.3390/atmos12050620
Ding J, Cuo L, Zhang Y, Zhang C, Liang L, Liu Z. Annual and Seasonal Precipitation and Their Extremes over the Tibetan Plateau and Its Surroundings in 1963–2015. Atmosphere. 2021; 12(5):620. https://doi.org/10.3390/atmos12050620
Chicago/Turabian StyleDing, Jin, Lan Cuo, Yongxin Zhang, Cunjie Zhang, Liqiao Liang, and Zhe Liu. 2021. "Annual and Seasonal Precipitation and Their Extremes over the Tibetan Plateau and Its Surroundings in 1963–2015" Atmosphere 12, no. 5: 620. https://doi.org/10.3390/atmos12050620
APA StyleDing, J., Cuo, L., Zhang, Y., Zhang, C., Liang, L., & Liu, Z. (2021). Annual and Seasonal Precipitation and Their Extremes over the Tibetan Plateau and Its Surroundings in 1963–2015. Atmosphere, 12(5), 620. https://doi.org/10.3390/atmos12050620