Article

The Combined Effect of Ozone and Aerosols on Erythemal Irradiance in an Extremely Low Ozone Event during May 2020

by
Ioannis-Panagiotis Raptis
1,*,
Kostas Eleftheratos
2,3,
Stelios Kazadzis
4,
Panagiotis Kosmopoulos
1,
Kyriakoula Papachristopoulou
2,5 and
Stavros Solomos
6
1
Institute for Environmental Research and Sustainable Development, National Observatory of Athens, GR15236 Athens, Greece
2
Faculty of Geology and Geoenvironment, National and Kapodistrian University of Athens, GR15236 Athens, Greece
3
Biomedical Research Foundation, Academy of Athens, GR11527 Athens, Greece
4
Physicalisch-Meteorologisches Observatorium Davos, World Radiation Center, CH-7260 Davos, Switzerland
5
Institute for Astronomy, Astrophysics, Space Applications and Remote Sensing (IAASARS), National Observatory of Athens, GR15236 Athens, Greece
6
Research Centre for Atmospheric Physics and Climatology, Academy of Athens, GR15236 Athens, Greece
*
Author to whom correspondence should be addressed.
Atmosphere 2021, 12(2), 145; https://doi.org/10.3390/atmos12020145
Submission received: 20 October 2020 / Revised: 27 November 2020 / Accepted: 19 January 2021 / Published: 24 January 2021
(This article belongs to the Special Issue Changes in the Composition of the Atmosphere)

Abstract

:
In this study we focus on measurements and modeled UV index in the region of Athens, Greece, during a low ozone event. During the period of 12–19 May 2020, total ozone column (TOC) showed extremely low values, 35–55 Dobson Units (up to 15%) decrease from the climatic mean (being lower than the −2σ). This condition favors the increase of UV erythemal irradiance, since stratospheric ozone is the most important attenuator at the UVB spectral region. Simultaneously, an intrusion of Saharan dust aerosols in the region has masked a large part of the low ozone effect on UV irradiance. In order to investigate the event, we have used spectral solar irradiance measurements from the Precision Solar Radiometer (PSR), TOC from the Brewer spectrophotometer, and Radiative Transfer Model (RTM) calculations. Model calculations of the UV Index (UVI) showed an increase of ~30% compared to the long-term normal UVI due to the low TOC while at the same time and for particular days, aerosols masked this effect by ~20%. The RTM has been used to investigate the response in the UV spectral region of these variations at different solar zenith angles (SZAs). Spectra simulated with the RTM have been compared to measured ones and an average difference of ~2% was found. The study points out the importance of accurate measurements or forecasts of both ozone and aerosols when deriving UVI under unusual low ozone–high aerosol conditions.

1. Introduction

Ultraviolet (UV) radiation is a small part (~3% [1]) of the incoming solar radiation at Earth’s surface but has a number of biological effects when absorbed by human skin, which can be either harmful or beneficial [2,3]. Harmful effects, linked to UV overexposure, include skin erythema, the increased risk of skin cancer, and multiple eye diseases (snow blindness, cataract). On the other hand, UVB radiation is extremely important for the human body, as it is crucial for synthesizing Vitamin D [4,5]. The effect of UV radiation on living cells is estimated by biological effective irradiances and doses [6]. Effective irradiances are retrieved by weighting actual spectral irradiances using the relative action spectrum. Doses are derived afterwards, when weight functions are integrated by time. UV Index (UVI) is a unitless variable that was introduced by the World Meteorological Organization (WMO) in 1994, aiming to better inform the general public about the dangers of UV radiation [7]. UVI is a scaled version of erythemally weighted UV, which is interpreted in an easily understandable scale of 0–20 and characterizes the safe exposure according to skin type [8,9]. There is a growing concern in the scientific community on the variation of UV radiation in response to climate change [10,11,12]. Bais et al. [11] showed that higher values of UV are expected by the end of the 21st century in tropical areas and a decrease in mid-latitudes, but these estimations still hold high uncertainties. Eleftheratos et al. [13] showed that solar UVB irradiance that produces deoxyribonucleic acid (DNA) damage would increase after the year 2050. Such change is driven by a significant decrease in cloud cover due to the evolution of greenhouse gases in the future, suggesting that the process of climate change will overwhelm the effect of ozone recovery on UVB irradiance in the mid-latitudes.
UV irradiance reaching Earth’s ground level is related to a number of factors and it is crucial to investigate them in order to monitor and predict it. In the UVB region, O3 and SO2 are the main absorbers, while NO2 is the dominant absorber in the UVA [14]. Significant UV increase had been reported in the past decades due to ozone depletion [15]. Signs of recovering ozone, since the Montreal Protocol was applied, has been recorded [16,17]. Nevertheless, extremely low values, which result in high UV, are measured occasionally.
Aerosols in the atmosphere also play a crucial role in UV irradiance reaching Earth’s surface. Aerosol optical depth (AOD) is a parameter that quantifies the attenuation of irradiance when passing from an aerosol layer and is wavelength dependent [18]. Different aerosol types have various effects in the UV, causing a spectral dependence of the extinction. Dust of desert origin has been reported as having the most significant extinction in the UV spectral region, which could have a major influence on the received UV irradiance, even eliminating the influence of low ozone, during severe events [19]. Additionally, Roman [20] has reported that desert dust could add an attenuation of up to 50% in direct UV irradiance, while diffuse irradiance could increase up to 40%. Other aerosol types that have a significant role in the UV spectral region are black [21] and brown carbon [22]. Dust intrusions in the Eastern Mediterranean, including the Athens area, have been presented in several studies [23,24,25].
The attenuators described above are less important when clouds are present, since clouds strongly attenuate all radiation, including UV. The increase of sun elevation proportionally increases the UV intensity. Two other factors that influence the UVI are the solar zenith angle (SZA) [26] and the altitude [27]. SZA is the most common parametrization of the sun elevation, which is defined by astronomical calculations, indicating the air mass the light passes through [26].
A number of studies have focused on the UV trends over the last decades which are affected by trends in gases (O3, NO2), aerosols, and cloud coverage. Increase of UV has been reported in south and central Europe and decrease at higher latitudes [28]. Zerefos et al. [17] showed that the increase of total O3 over the 1995–2006 period at mid-latitudes was not sufficient to reverse UVB increase, which was masked by decreasing aerosols, while Eleftheratos et al. [29] showed that at high latitudes, stratospheric ozone increase and UVB decrease were in agreement in the absence of large aerosol variations.
UVI is also routinely forecasted by a number of services and the output is provided to the general public for protection from harmful UV doses. For example, the Tropospheric Emission Monitoring Internet Service (TEMIS), by the Royal Netherlands Meteorological Institute, provides a daily clear sky UVI forecast for Europe, for eight days ahead, using the algorithm of Allart et al. [30], which takes into account total ozone column (TOC) and SZA and uses an empirical aerosol correction, which leads to overestimations when high aerosol loads are present [31].
In this study, we focus on measurements and modeled UV index in the region of Athens, Greece, during a period of an extremely low ozone event. During this period, TOC was much lower than the long-term mean (in the range of 35–55 Dobson Units, DU), reaching values as low as the −2σ values of the climatological average. A co-occurring invasion of Saharan dust in the region counteracted a large part of the low ozone effect on the UV irradiance. In order to investigate the event, we have used the measurements from the Precision Solar Radiometer (PSR) and Brewer spectrophotometer (BRS) along with the Radiative Transfer Model (RTM) simulations of the atmospheric conditions. The coincidence of increased aerosols and extremely low ozone during the week of 12–19 May 2020 motivated us to study this peculiar event and to better quantify the roles of dust aerosols and ozone in UVB irradiance.
Besides the description of the observed extremely low ozone–high UVI–high aerosol Saharan dust event which we target in this study, it is important to highlight the motivation of this study and its difference from other works. The observed low ozone concentrations that occurred during May 2020 in Athens is a rare phenomenon, as May is largely characterized by high amounts of ozone transported from the tropics to higher latitudes by the Brewer–Dobson circulation. These low ozone amounts contributed to high amounts of UVB irradiance in May, the magnitude of which is typically measured during July under cloudless conditions [32]. It might be that such low ozone events become more frequent in the future during spring [10,11]. In this respect it is important to know how much change in UVB radiation can be caused so that we can use this information to evaluate future calculations of UVB variability. While UVB models predicted high levels of ultraviolet radiation in Athens during the low ozone week, the measured UVI levels were lower than expected. The reason for this was the increased dust aerosols that attenuated the incoming solar radiation reaching the ground. Model calculations for forecasting UVI currently used to inform the authorities and the general public do not take into account the nature of aerosols and the expected loads (e.g., TEMIS). It is shown that the occurrence of increased aerosols during the study period balanced the effect of low ozone amounts on UVB irradiance, thus mitigating the enhanced UVB levels.
The paper is organized as follows. The data sources (ground-based instruments, satellite data, modeling) and methodology are described in Section 2. The abnormal ozone, UVI, and AOD measurements during the exceptional week of May 2020 in Athens and the respective climatological values are presented in Section 3, alongside some modeled examples for spectral sensitivity in the UV region. Finally, Section 4 summarizes the main results.

2. Instruments and Methods

Data used in this study were recorded at two different locations in Athens, Greece, by PSR and BRS instruments. The two locations are 5 km apart. The BRS is installed at the roof of Biomedical Research Foundation of the Academy of Athens, which is located in a green area at a distance of about 4 km from the city center and is partly influenced by urban emissions. The PSR is installed at the Actinometric Station of National Observatory of Athens, in a green area in the city center. Aerosols in Athens can consist of sea-salt aerosols, dust from the Sahara Desert, smoke particles from forest fires, and small particles typical of urban and industrialized environments [33,34].
UVI is currently monitored by about 160 stations from 25 countries around Europe [35]. Instruments operating at these stations are separated into three types, according to the technique of measurement, as broadband, narrow-band filter, and narrow-band spectral radiometers. The estimated relative uncertainty for these UV irradiance radiometric measurements is 4.6% [36], which propagates an uncertainty of 0.61 (at 1σ) for retrieved UVI [37]. Additionally, UV is monitored through satellite retrievals, which are covering the whole globe [38]. Satellite measurements are usually used for climatological studies [39] and for monitoring UV irradiance in areas with no ground-based measurements. For this study we use spectral measurements of irradiance in the UV spectrum to retrieve UVI.

2.1. PSR

The Precision Solar Spectroradiometer has been designed and manufactured by Physicalisch-Meteorologisches Observatorium Davos, World Radiation Center (PMOD/WRC), Davos, Switzerland, for high precision and accuracy of solar spectral measurements. It measures irradiance at 1024 channels in the spectral range of 300–1020 nm with an average step of ~0.7 nm, spectral resolution in the range of 1.5–6 nm (depending on the measured wavelength) [40,41]. PSR 007 is installed in Athens (37.9 N, 23.7 E, 130 m above sea level) and it was last calibrated on June 2019 at the World Radiation Center using a calibrated standard 1000 W tungsten–halogen FEL lamp. Uncertainty of the measurements has been estimated in the range of 1.7–2.0% in the UVA with higher uncertainties recorded at the UVB spectral region, due to lower signal and stray light [42]. PSR 007 has a global sensor mounted on the auxiliary port and by using the built-in shutter of the instrument, global horizontal irradiance (GHI) and direct irradiance can be measured by the same spectrometer. Thus, the same calibration and uncertainty budget is applied. The spectral measurement frequency is 1 min, when five spectral measurements are averaged and saved.
UVI is the parameter retrieved from the PSR measurements, used in this study. The formula for the calculation is:
UVI   =   k er λ 1 λ 2 E   ( λ ) s er ( λ ) d λ
where ker is a constant equal to 40 W/m2, Ε(λ) is the recorded solar spectral irradiance at wavelength λ in W/m2/nm, Ser(λ) is the erythema action spectrum [43], and λ1 and λ2 are the limits of the UV spectral region. For our case, the integrated spectral region is 300 to 400 nm. This approach has an advantage, compared to broadband-based measured UVIs, since the whole spectrum of the region 300–400 nm is recorded, and no additional corrections are needed [32].

2.2. The Brewer Spectrophotometer

In this study we analyze TOC and AOD retrievals from a BRD MkIV spectrophotometer (number #001) operating at the roof of the Biomedical Research Foundation of the Academy of Athens in Greece (38.0 N, 23.8 E, 180 m a.s.l) since 2004. The BRS is an automated, diffraction-grating spectrometer that provides observations of the sun’s intensity in the near UV range. The instrument measures the intensity of radiation in the UV absorption spectrum of ozone at five wavelengths (306.3, 310.1, 313.5, 316.8, and 320.1 nm) with a resolution of 0.5 nm. These data are used to derive columnar ozone and sulfur dioxide amounts and the aerosol optical depth [44].
Measurements with the BRS #001 have been exploited in several studies analyzing columnar ozone, sulfur dioxide, and aerosol optical depth [45,46,47,48]. TOC analyzed in this study is calculated from a combination of the direct sun (DS) measurements at UV wavelengths that experience different absorption by ozone passing through the atmosphere (310.1, 313.5, 316.8, and 320.1 nm), weighted with a predefined set of constants chosen to minimize the influence of SO2 and linearly varying absorption features from, for example, clouds or aerosols [49]. TOC was retrieved using the differential absorption method [50].
The BRS #001 was regularly recalibrated against the traveling standard BRS instrument #017 in 2002 in Thessaloniki and in 2004, 2007, 2010, 2013, and 2019 on site in Athens. Internal standard lamp tests are performed on a daily basis to detect possible instrumental drifts. Ozone data were recalculated after standard lamp test corrections and were analyzed using the O3BREWER data management software [51].
Finally, the AOD analyzed in this study was retrieved from the direct sun (DS) measurements at five standard wavelengths (306.3, 310.1, 313.5, 316.8, 320.1 nm) using the O3baod software package developed by Martin Stanek (http://www.o3soft.eu/o3baod.html). The setup of the software for the Athens BRS was done with the assistance of M. Stanek (private communication). AOD at 320.1 nm is reported here.

2.3. Satellite Data

Satellite data have been used in order to provide further evidence on the range of TOC. The Ozone Monitoring Instrument (OMI), which is a nadir-viewing UV/visible backscatter spectrometer on board NASA’s satellite Aura, the ozone product algorithm, and the TOC retrieving process are described in Bhartia and Wellemeyer [52]. The main procedures include a fitting of ozone absorption cross-section to the measured spectrum, an estimation of air mass factor, and corrections for cloud effects. Data processing and quality assurance of the TOC product were analytically outlined by Veefkind et al. [53]. Different studies [54,55] had found average biases less than 3% when comparing TOC retrievals from BRS and OMI, while McPeters et al. [56] showed that in mid-latitudes, the biases are SZA dependent. Satellite-retrieved UVI has large uncertainties, while aerosol loads have been recognized as a major source of errors, causing differences of up to 25% [57]. Comparison of OMI surface UV irradiance estimates with ground-based measurements [31] showed that OMI irradiances overestimate surface observations for UVB wavelengths from ~1.5% to 13.5% in contrast to underestimated satellite values for UVA wavelengths.
OMI TOC retrieval has one overpass above Athens per day in a distance of less than 50 km since 2002, which could be used to create an almost two-decade-long timeseries. Copernicus Atmospheric Service (CAMS) provides a reanalysis database of TOC, which we also used to detect the general ozone circulation at the area at the time of the event. This database is assimilating data from different satellites (Solar Backscatter Ultraviolet Radiometer—SBUV/2, OMI, Scanning Imaging Absorption Spectrometer for Atmospheric Chartography—SCIAMACHY, Global Ozone Monitoring Experiment—GOME and GOME2) alongside chemical transport modeling to provide TOC at 0.4° × 0.4° spatial grid [53]. In [45] authors have compared the Athens BRS and OMI satellite TOC and reported a good agreement between the BRS and the satellite total ozone, which is of the order of 2.7% with a standard deviation of 4%. Analyzing OMI and BRS data for 2017–2020, we found a difference of 4.6% with a standard deviation of 5%.

2.4. Radiative Transfer Model

Radiative transfer calculations using the LibRadtran package [58,59] have been performed, aiming to simulate the atmospheric conditions and evaluate forecasts using different input variables. Using the pseudospherical disort radiative transfer equation solver [60], radiative transfer calculations every 1 nm were performed at 300–400 nm, for cloud-free conditions and including the absorption cross-sections of various species of this spectral region. The extraterrestrial solar spectrum with resolution of 1.0 nm provided by [61] was used as input, with summer mid-latitude standard atmospheric profiles [62] and the default aerosol model [63]. A triangular slit function with FWHM of 2.0 nm was used. Also, a correction for the sun–earth distance and the altitude of the instrument was included in order for the atmospheric parameters to be scaled accordingly. Finally, a climatological value of 0.03 for surface albedo at the UV spectral region was used. The single-scattering albedo (SSA) was set to the climatological value of 0.9, but during the dust event, the SSA was set to the more representative value of 0.86 for this type of aerosol in the UV spectral region based on the results of previous publications for the area under study [64,65]. The Ängström exponent was set to the climatological value of 1.2 [34] and for the period of the dust intrusion, it was set to 0.5. SZA was determined by astronomical calculations. Corresponding UVI was calculated by applying the erythema action spectrum to the output spectra using Equation (1).

3. Results and Discussion

Figure 1 shows the long-term variability of TOC in Athens, as retrieved from the BRS instrument for the period 2004–2019. Ranges of 1 and 2 σ around the mean daily value are highlighted. TOC measurements for 2020 are also shown and the period of the extremely low ozone event is found between 12 and 19 May. The mean TOC for the region for May is 346 ± 16 DU, while for this week in 2020, it dropped down to 280–295 DU. The seasonal TOC variation in Athens follows the mid-latitude behavior of stratospheric ozone, having maximum values during late winter–early spring and lower values at the end of summer and in autumn. As a threshold to characterize an extreme event, we have used the 2σ of the TOC climatology. In a theoretical normal distribution, 95.5% of the values would have been in this range. This corresponds to ~1 day per month outside these limits. Thus, a period of 9 consecutive days below the limit has a very low possibility of occurring. Although the actual distribution of the values has some deviation from a theoretical normal distribution, it is safe to characterize this period as a very rare low ozone event for the region.
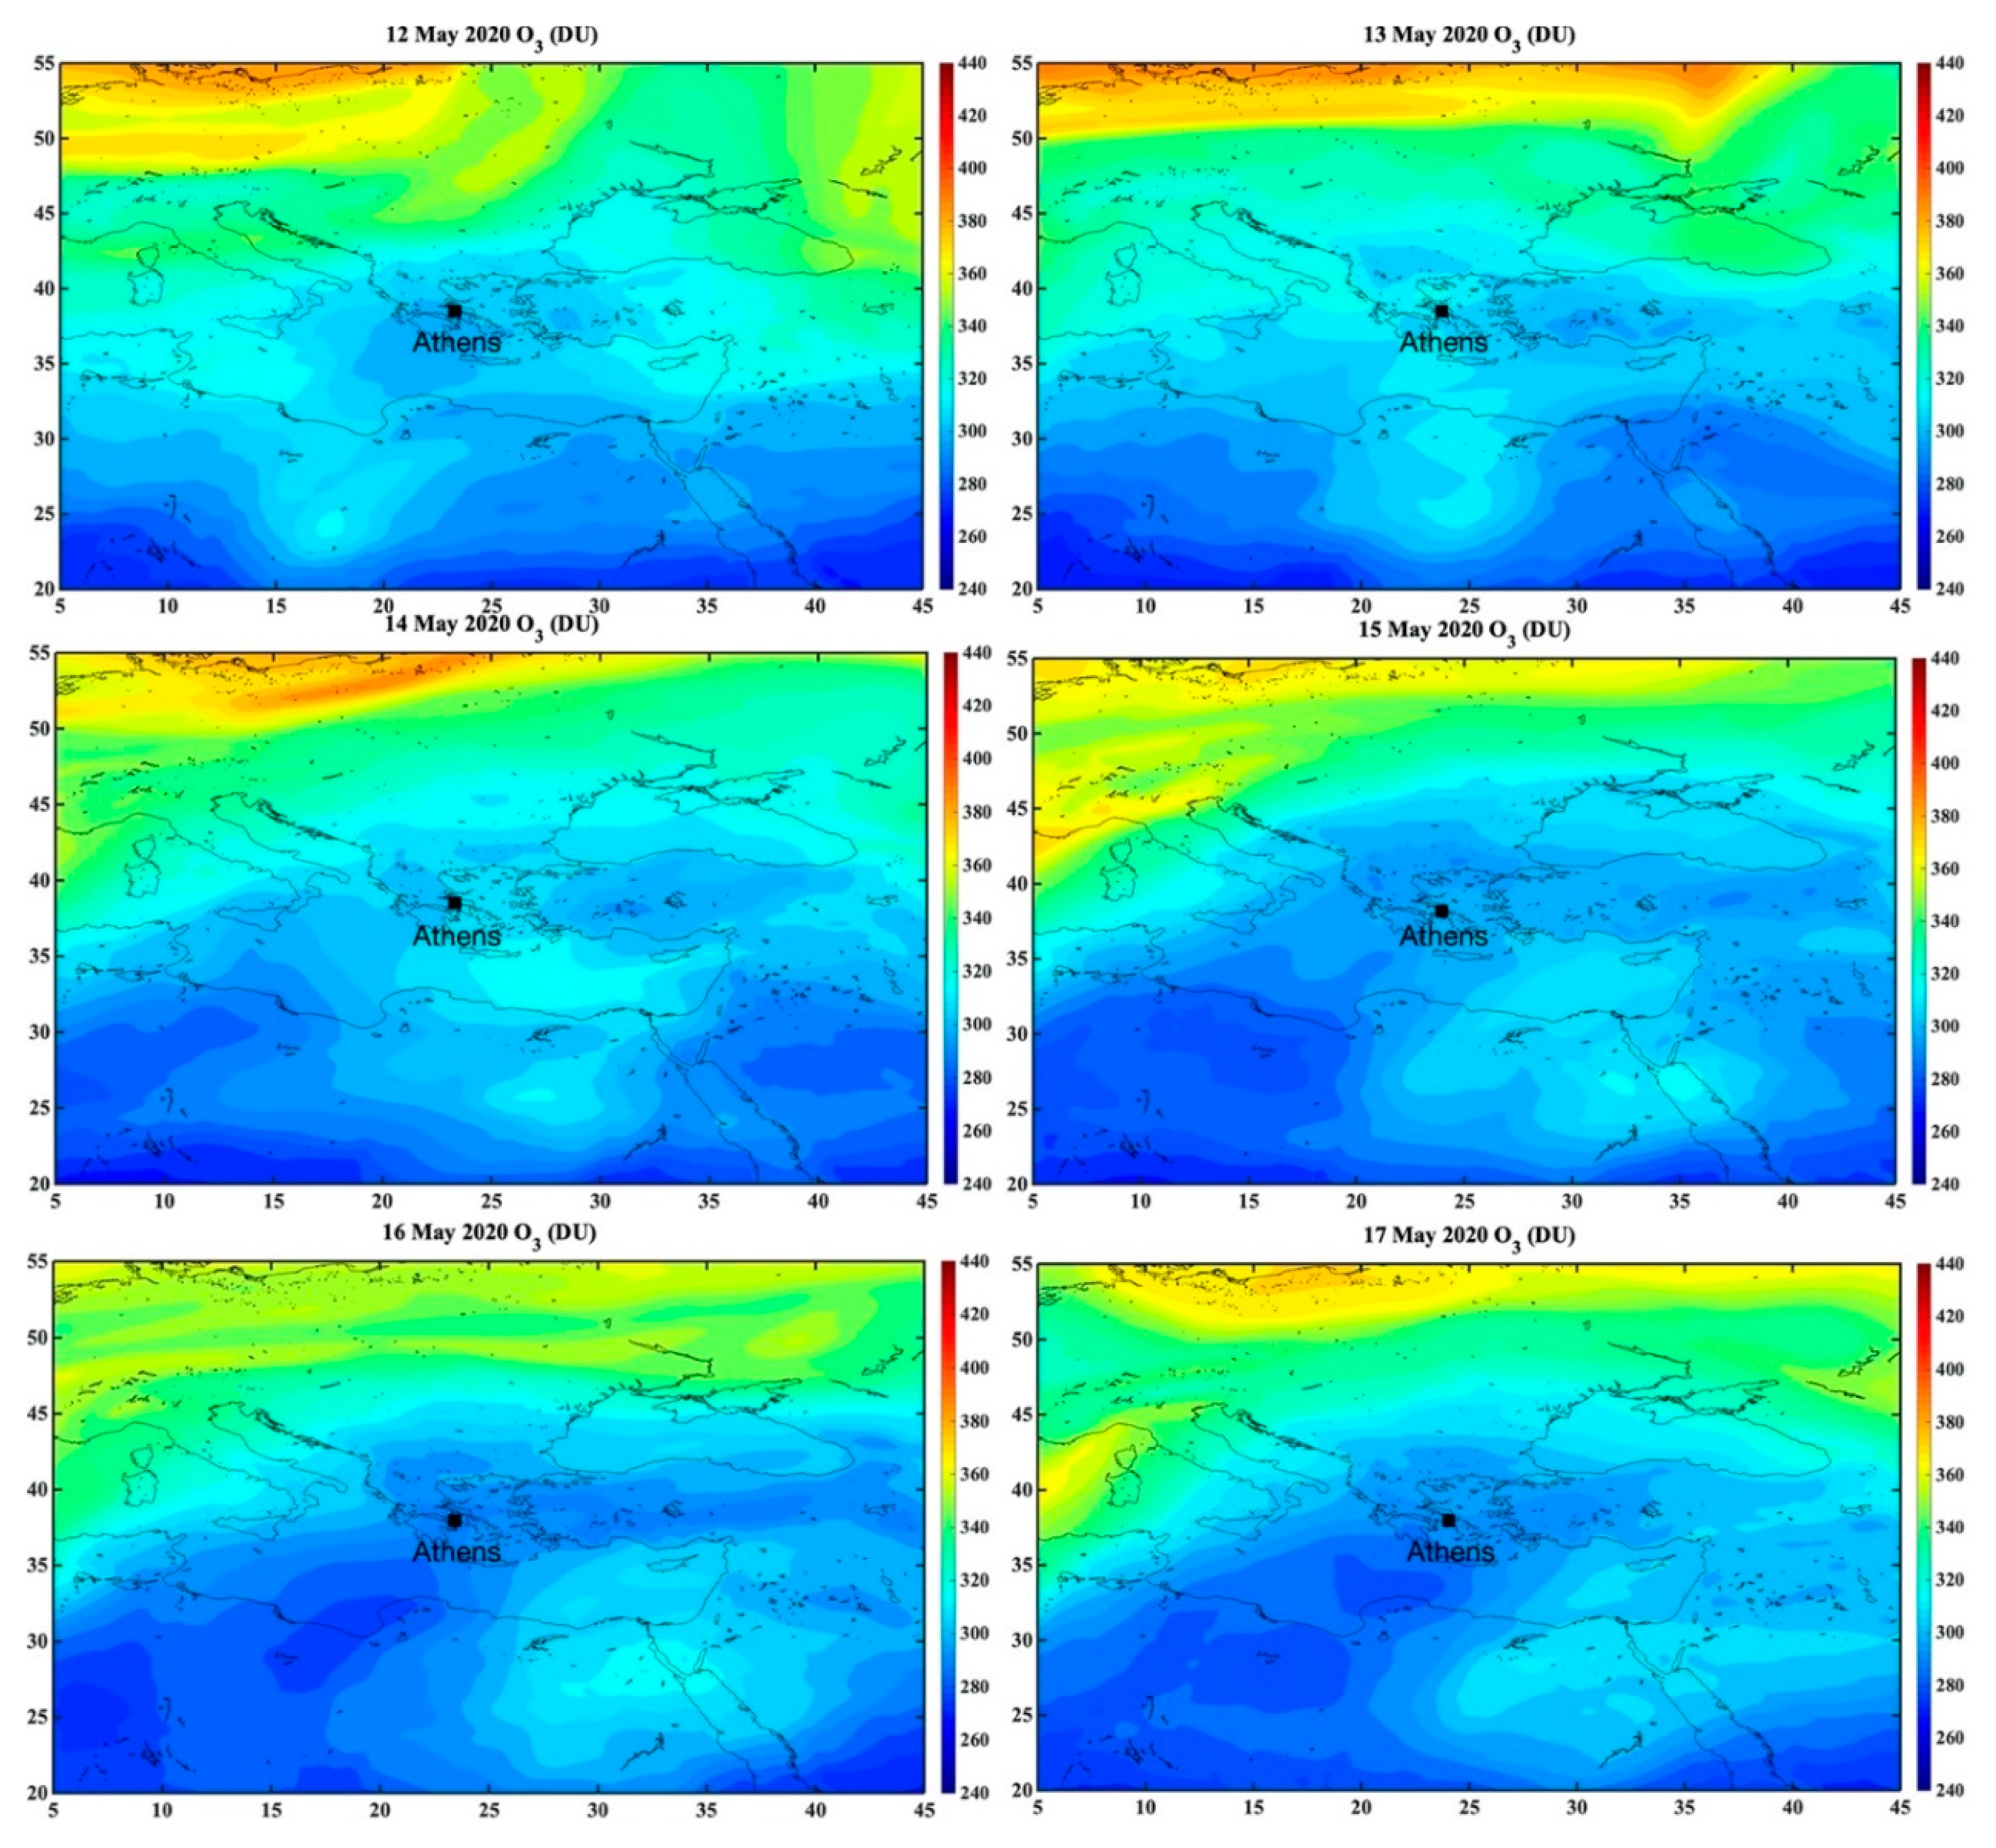
In order to understand the negative anomaly of TOC, maps of the Eastern Mediterranean, for 12–17 May, are presented in Figure 2. The anomaly could be triggered either by a local tropospheric air mass ascending in the stratosphere or the intrusion of a tropical stratospheric air mass. The picture of TOC in the area, during the event, shows that the zonal spatial distribution scheme [66] is broken by an intrusion from lower latitudes, which makes the transport of tropical air the most probable cause. These intrusions are mainly generated by gravitational and Rossby waves [67,68].
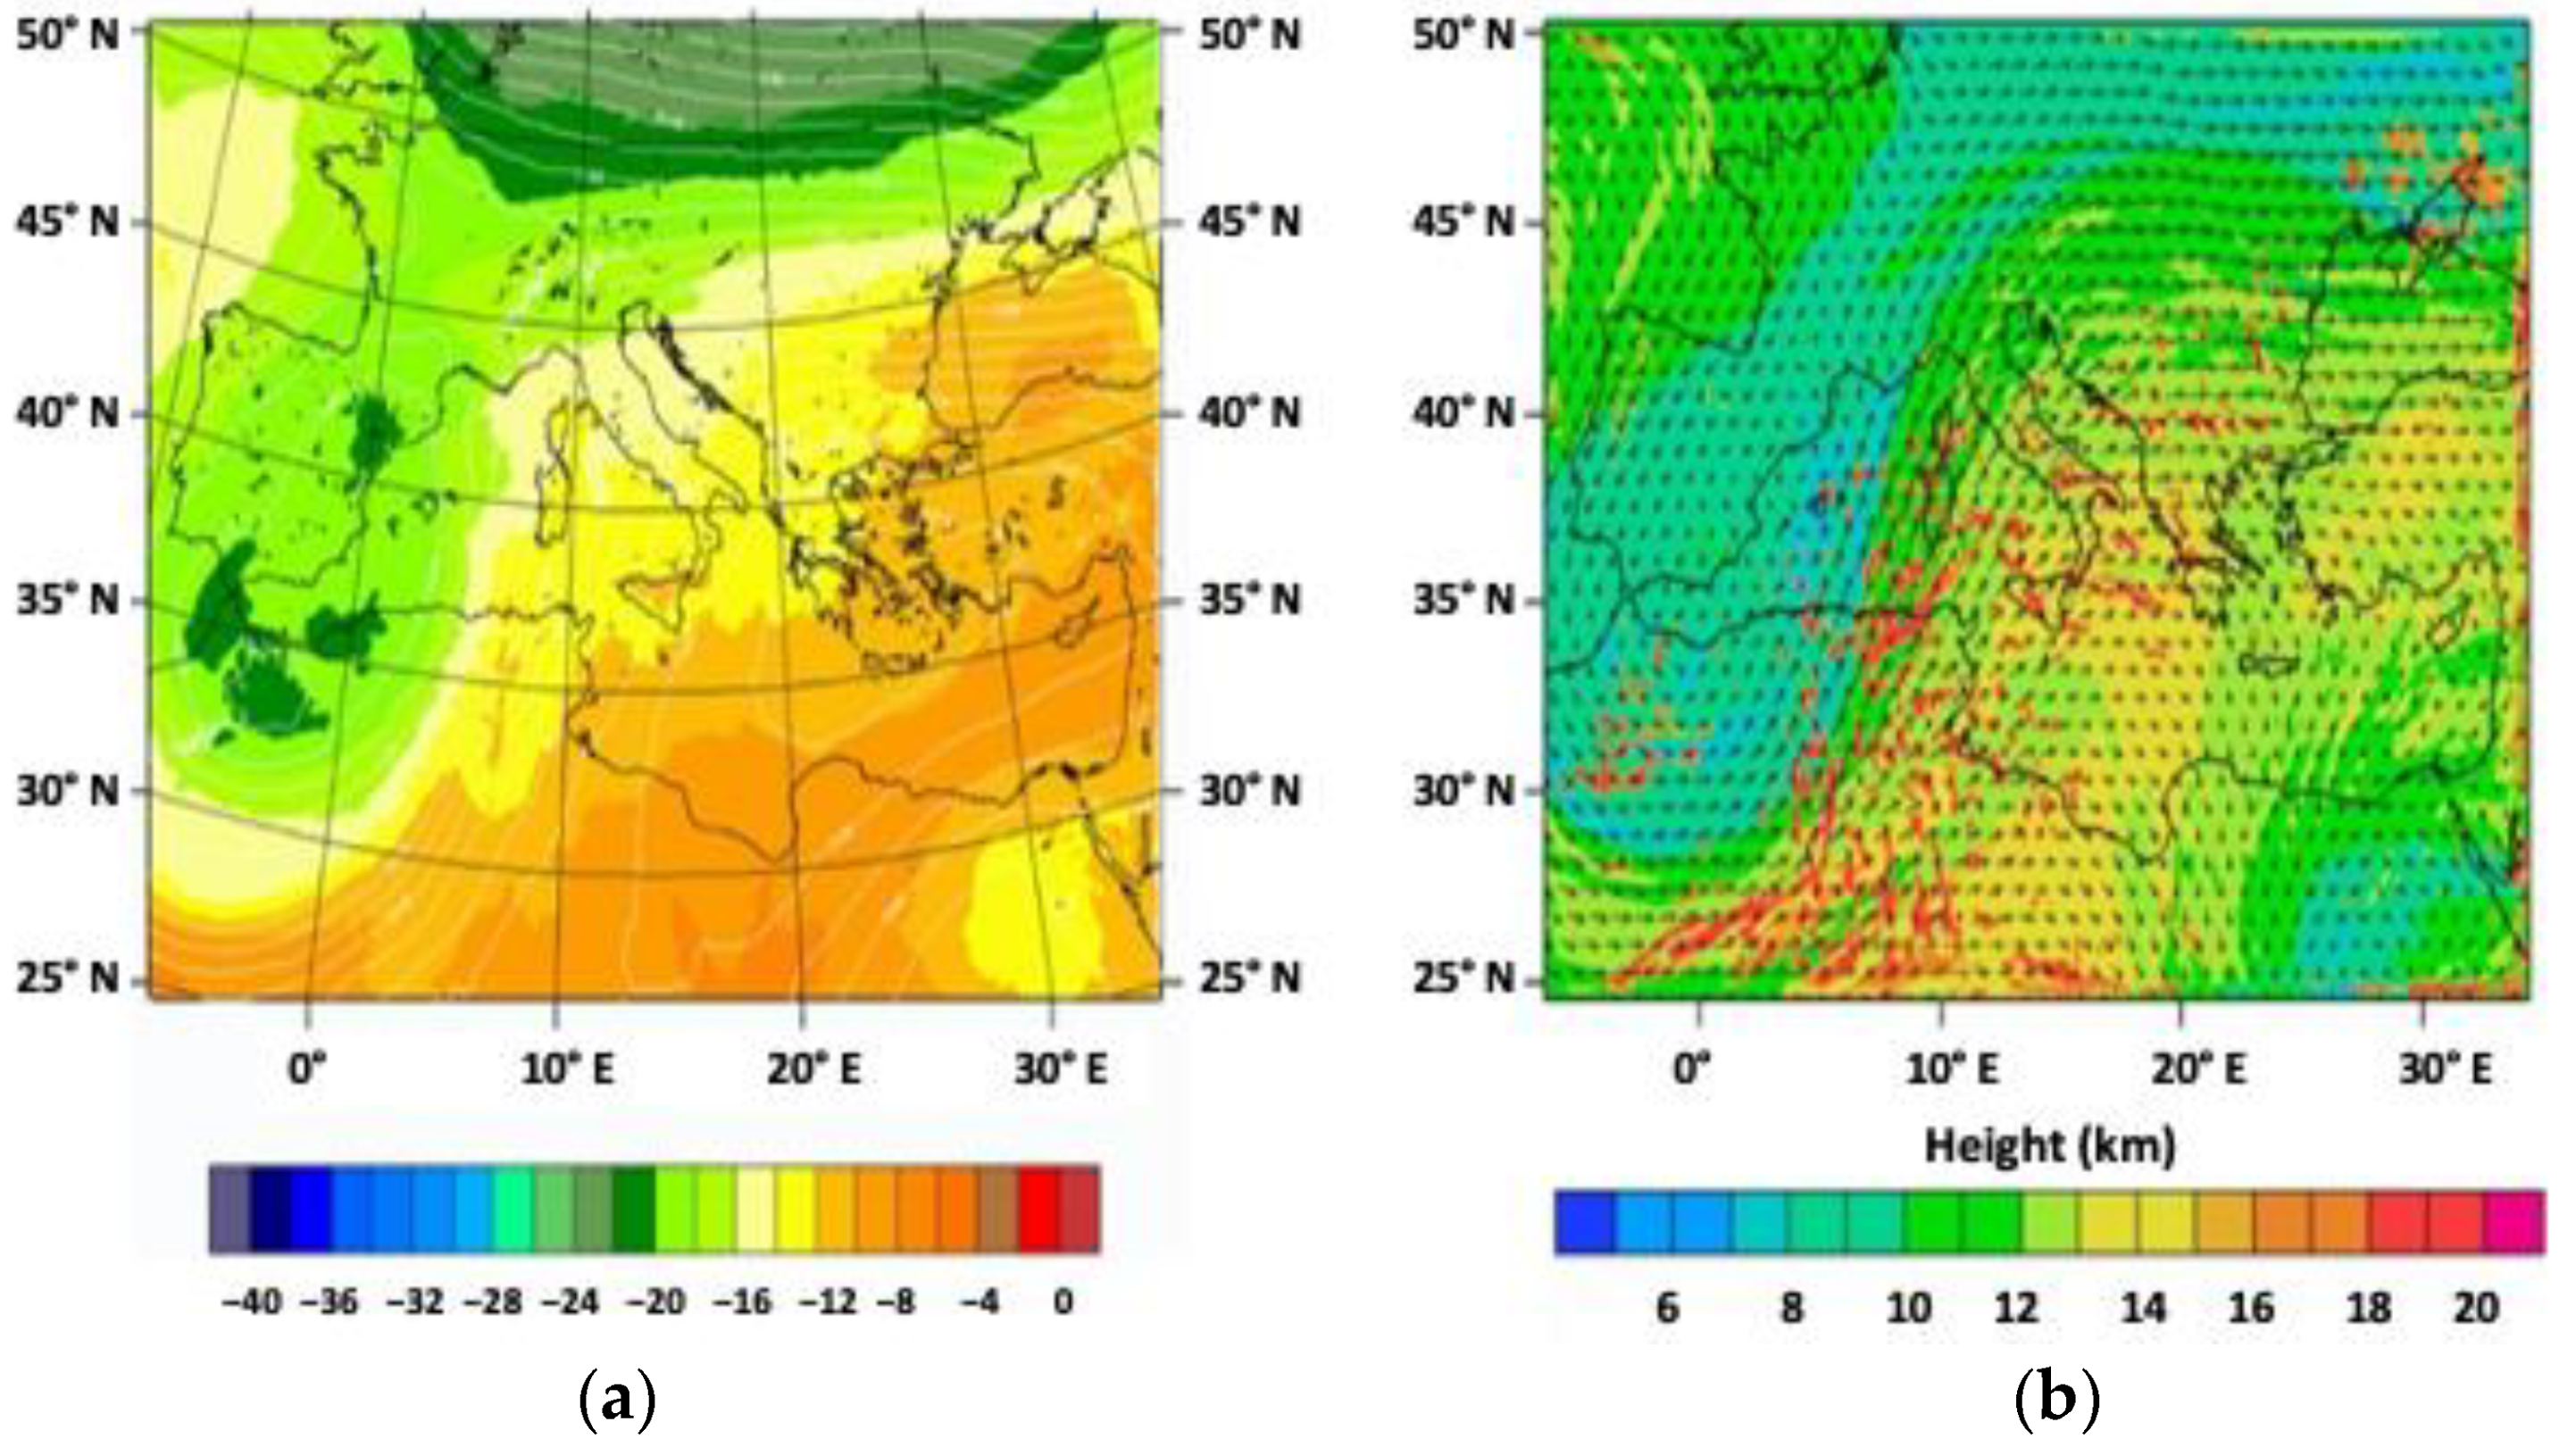
A synoptic analysis is performed with the use of Weather Research and Forecasting (WRF) model simulations at 12 km × 12 km, driven by the National Centers for Environmental Prediction (NCEP) GFS global data. The regional atmospheric circulation during the reporting period is governed by the combination of a cut-off low over the western parts of Europe and a high-pressure ridge extending from the Sahara towards the eastern parts of Europe (Figure 3a). This type of weather favors the transport of dusty air masses from Africa towards Italy and the Balkans. The meridional intrusion of warmer air masses and the associated upwelling are evident from the increase in tropopause heights as shown, for example, in Figure 3b for 16 May 2020, explaining also the depletion of ozone in these areas that is evident in Figure 2.
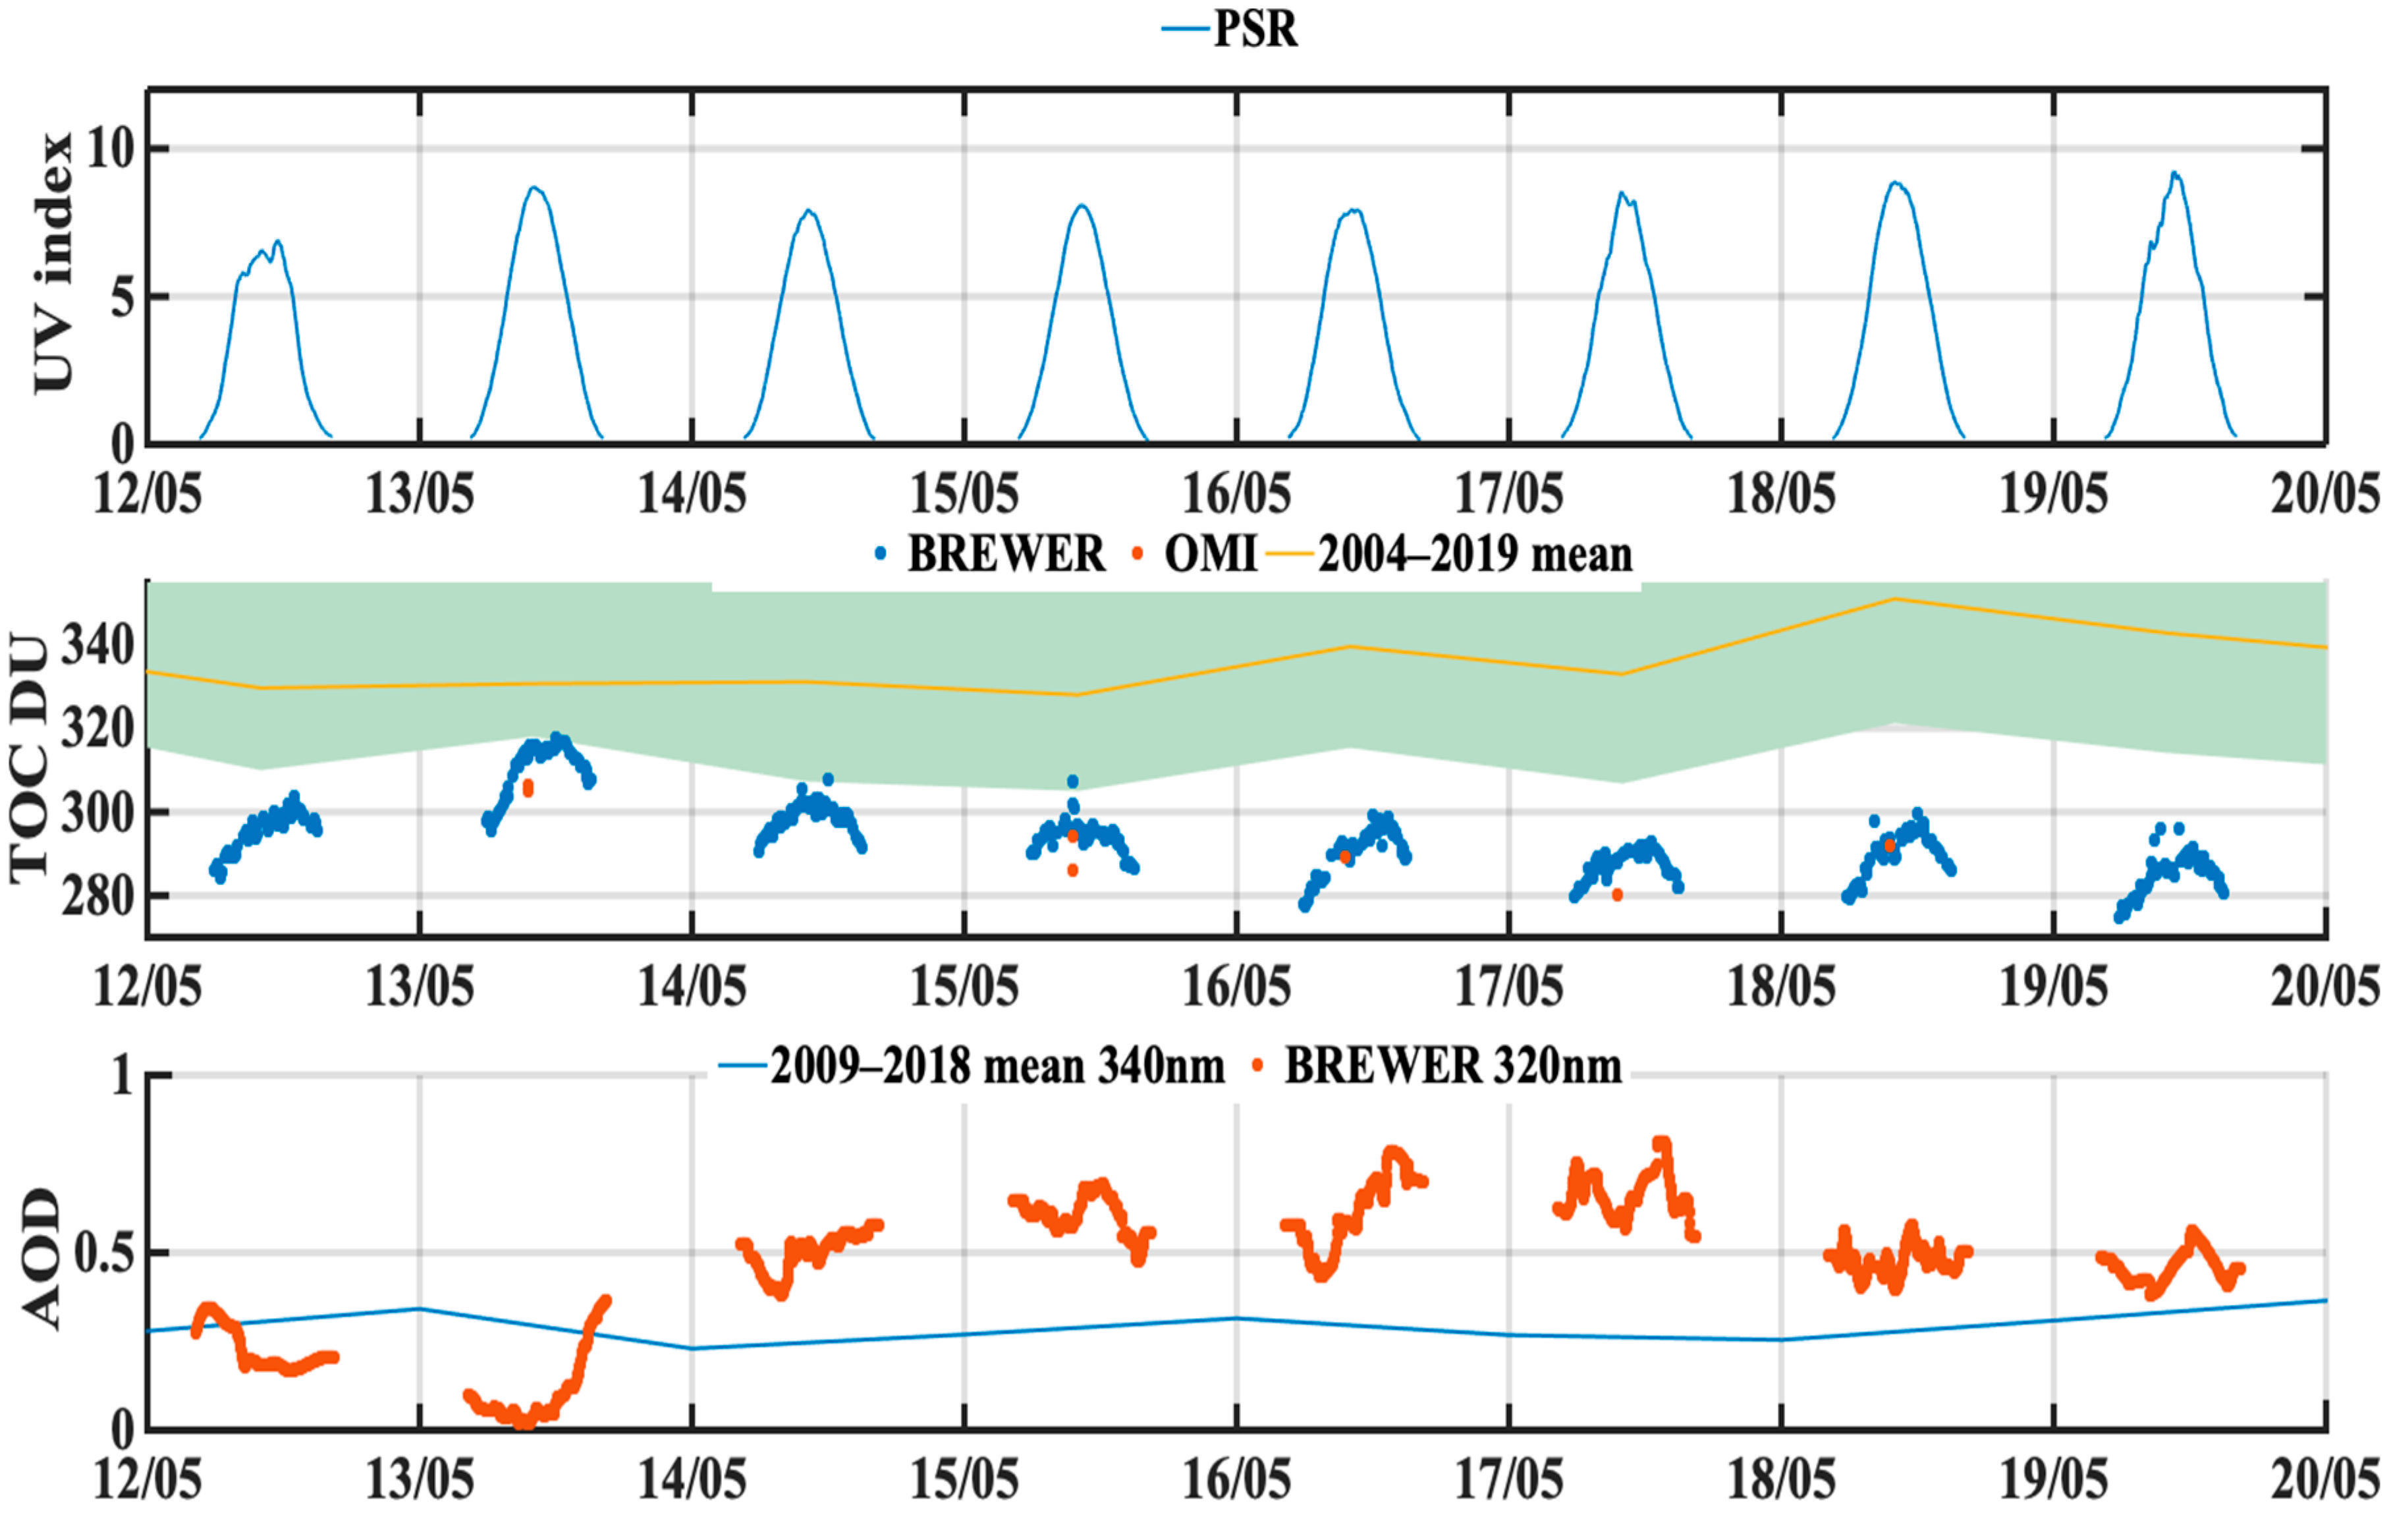
Figure 4 shows the variation of UVI, TOC, and AOD during 12–19 May, 2020, as retrieved by the corresponding instruments. UVI was retrieved from the PSR measurements. The higher UVI was recorded on the 19th of May, when the maximum value was 9.2. All the days after the 13th of May had a maximum UVI higher than 7.9. On the 12th of May, there were frequent overcast cloud conditions, which appear in the form of broken curves in the UVI. TOC from both BRS and OMI was constantly below the 2σ of the climatological mean during the whole period. The lowest values were reported on the 16th and the 17th of May. AOD was well below the climatological mean on the 13th of May. Starting that evening, an intrusion of Saharan dust reached Athens and very high values were recorded from the 14th to the 17th of May. On the last days, AOD was reduced and approached the mean climatological values. For 16–19 May, the UVI time series were sporadically affected by the presence of cirrus clouds. To avoid the effects of clouds, we selected to study further days that were strictly cloud-free based on PSR observations. Such cloudless conditions appear on May 13, 14, and 15. Based on all the above conditions, the days 13 and 15 of May were selected to be more intensively studied, as representative of cloudless days of low ozone and low aerosol (13/5), and low ozone and high aerosol (15/5). Data from 14/5 are later used to simulate the effects of low ozone and high AOD on the UV spectra.
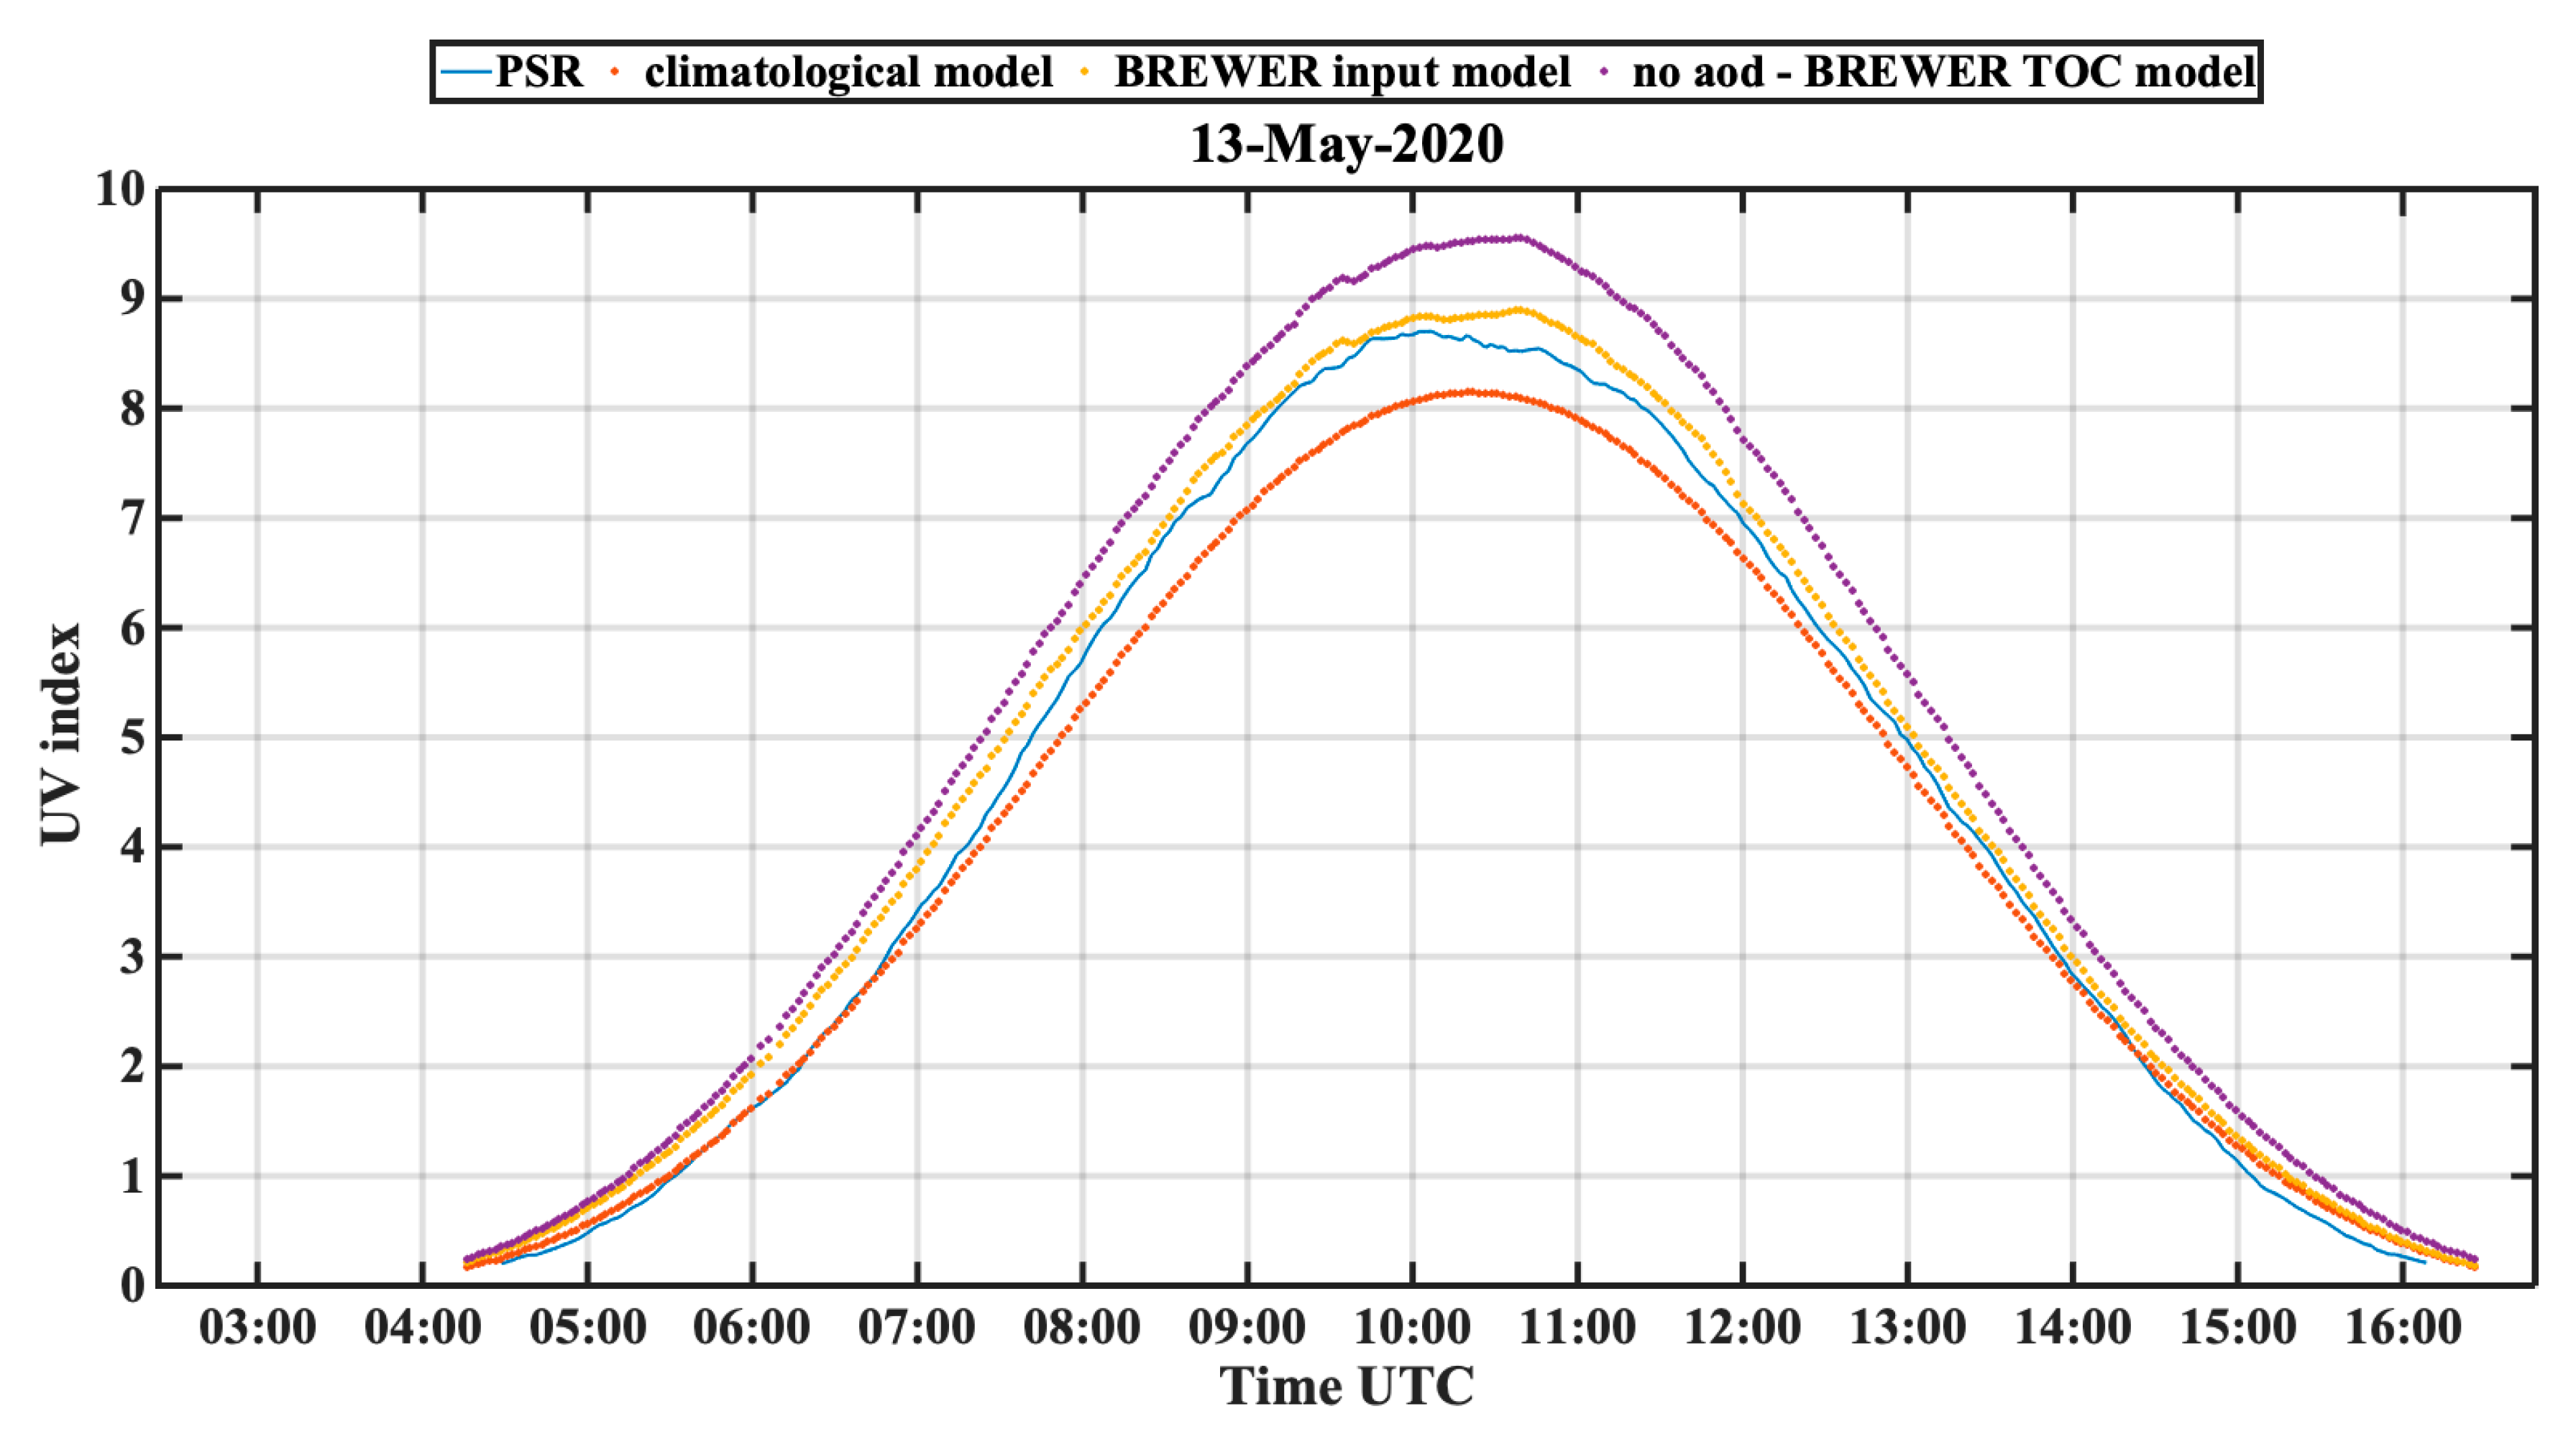
Figure 5 shows UVI retrieved from PSR on 13 May 2020, along with RTM simulations of UVI estimated with climatological TOC and AOD and BRS’s AOD and TOC values. PSR-retrieved UVI was up to 11.2% (0.92 UVI) higher than the theoretical simulated with climatological TOC and AOD inputs. Using measured AOD and TOC, the agreement with the PSR has an R2 = 0.98 and a mean bias error MBE = 0.11. Hence, the observed deviation from the theoretical climatological UVI can be explained by the variation of TOC and AOD. Mean AOD for the day was 0.22 (33.2%) lower than the climatological value and mean TOC was 32 DU lower (9.4%). Both these factors were contributing to higher UVI. Larger differences were observed around local noon, when UVI had the maximum value. For a large part of the day, absolute UVI differences were small and they started to differentiate when UVI became higher than 5. The following days, later in the week, had even lower ozone values, but not all of them were cloud-free and none of them had low AOD values. The maximum values of UVI are the ones usually reported to the general public and are the ones with the largest differences. Modeled UVI assuming zero value for AOD show an overestimation of 8–12% (up to 0.9 UVI).
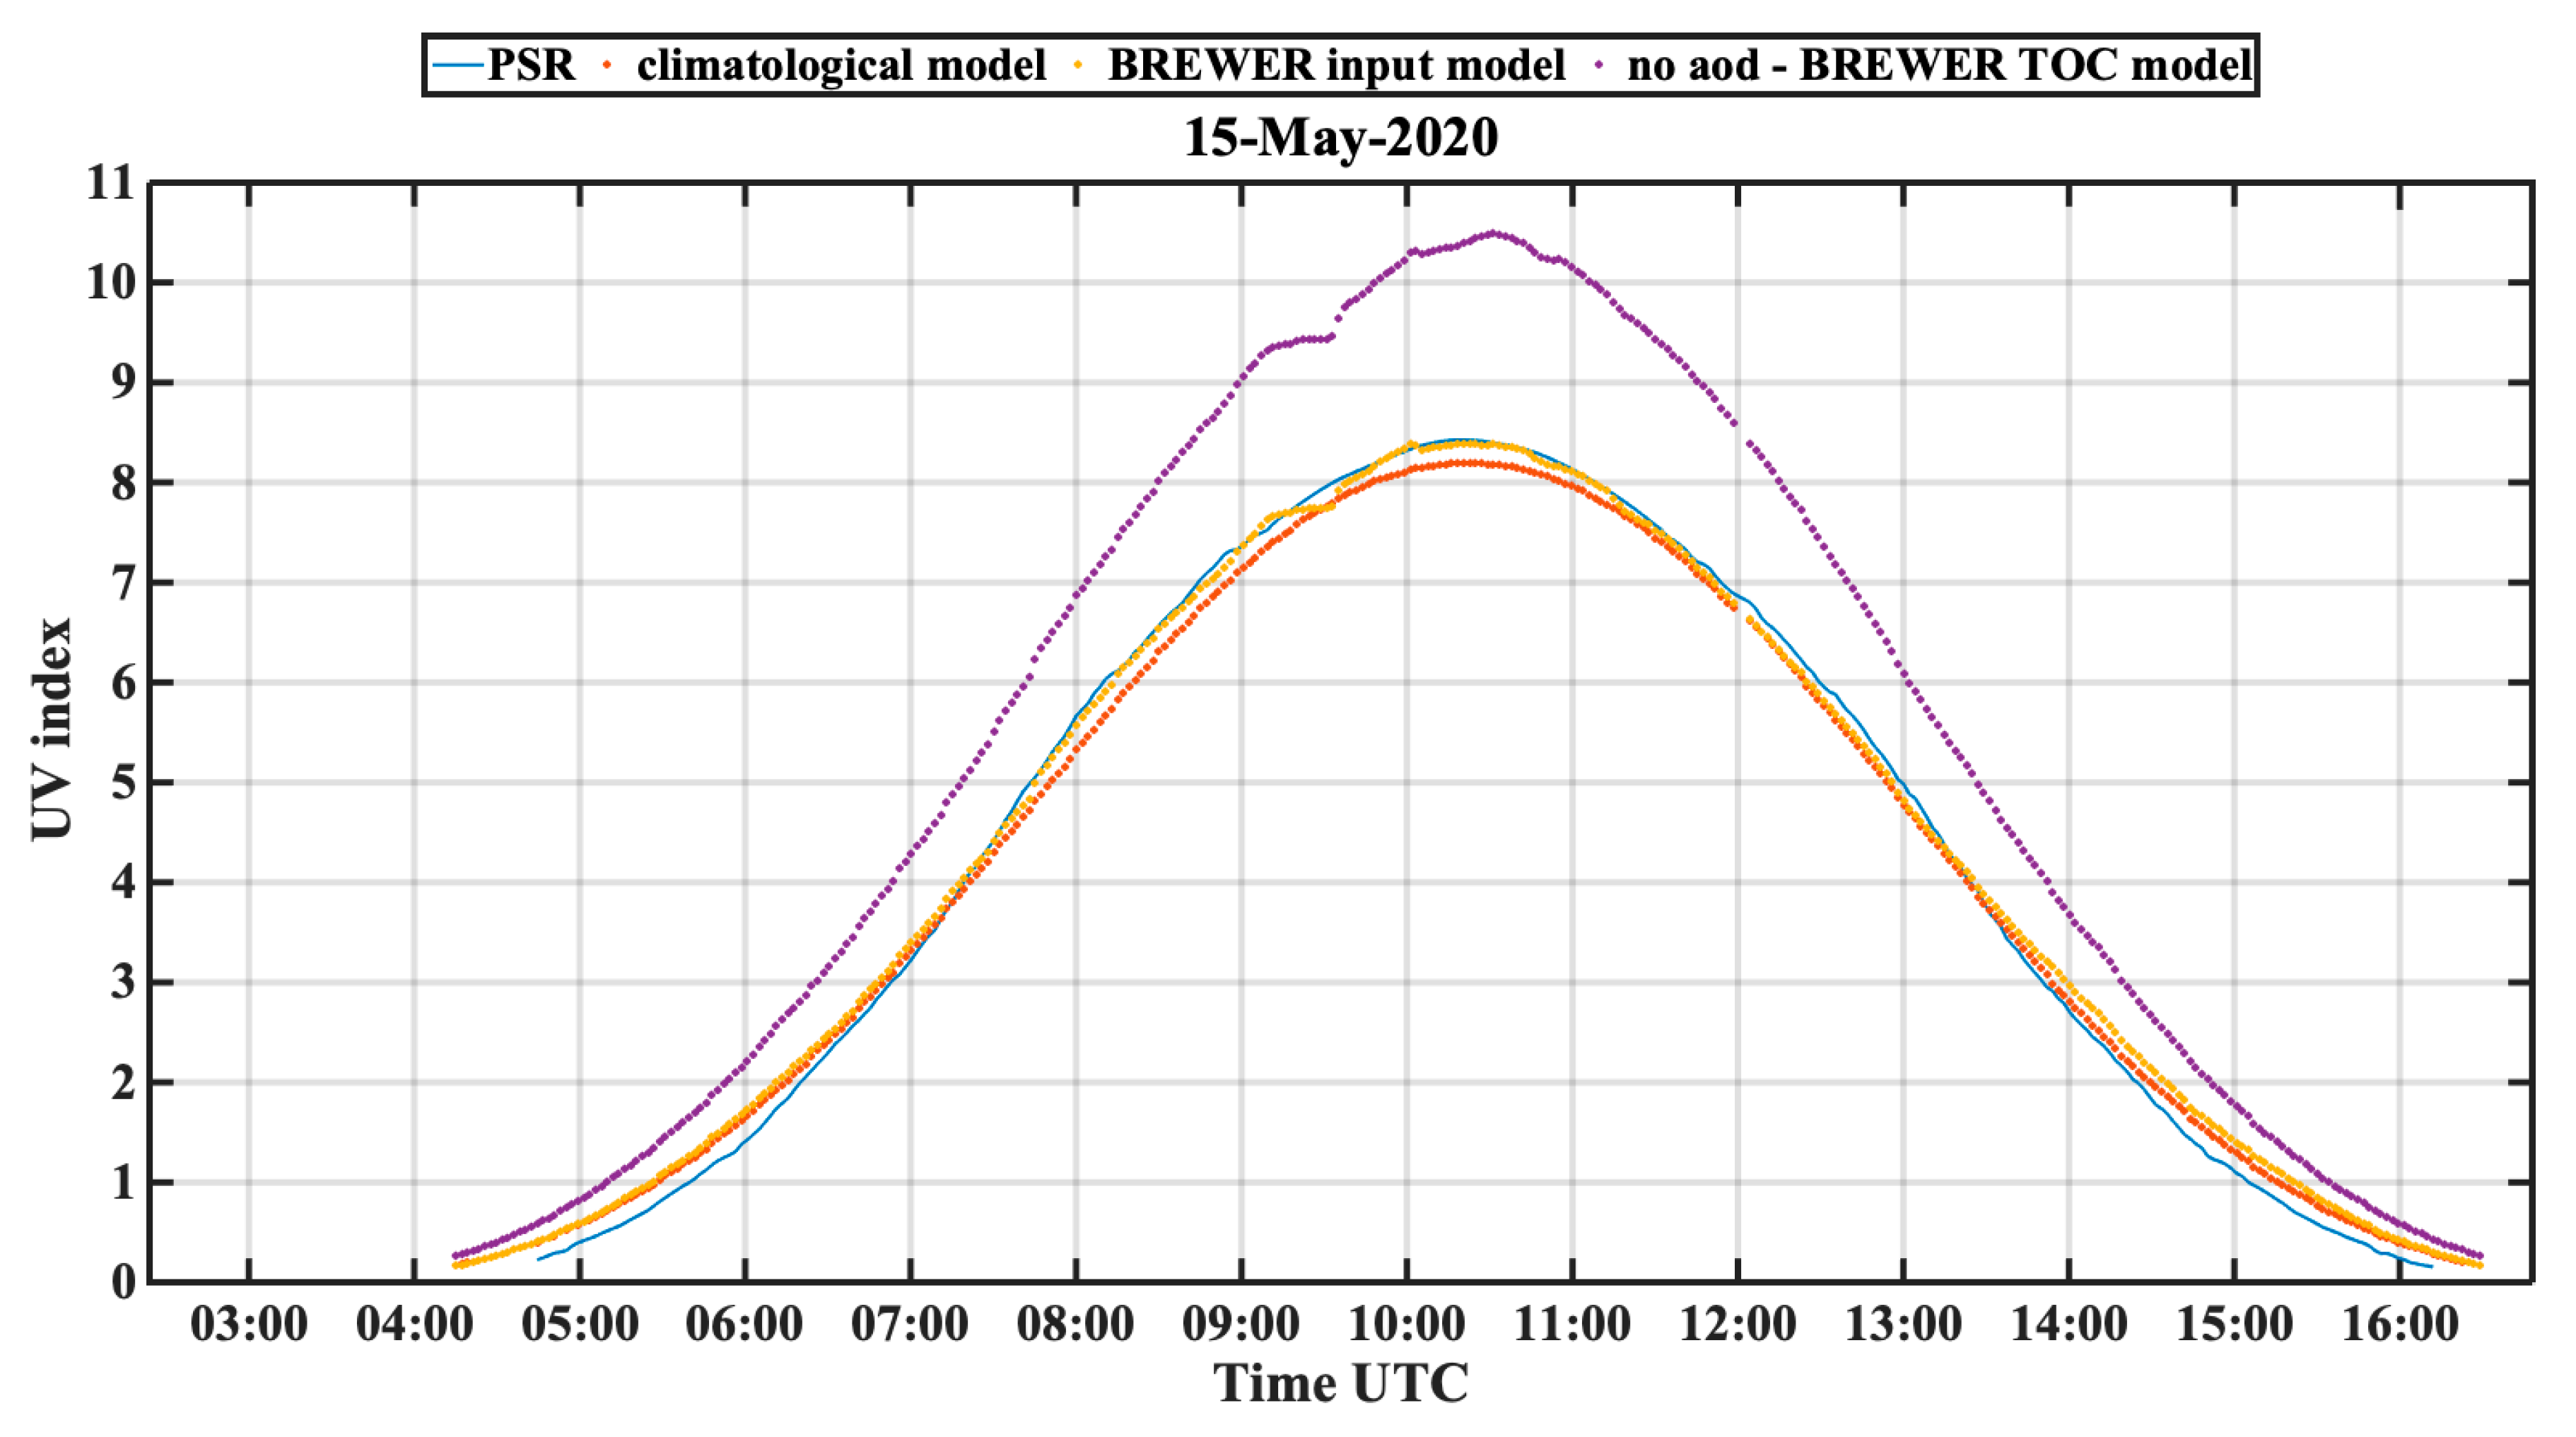
On 15 May 2020, mean ozone was 43 DU lower than the climatological value. The purple curve in Figure 6 shows the theoretical UVI calculated with this TOC and without aerosols. Ozone at so low a range could lead to an increase of up to 28.5% of UVI (2.1 UVI), compared to the climatological estimations. On the other hand, mean AOD on this day was 0.31 (46.7%) higher than the climatological mean, which led to a decrease of UVI. As shown in Figure 7, simulation of UVI with climatological and measured TOC and AOD values were almost identical (R2 = 0.99 and MBE = 0.04). PSR-retrieved UVI also agrees with these simulations (R2 = 0.99 and MBE = 0.06). Hence, the two events had opposite effects on UVI, eliminating each other, leading to conditions similar to the climatological situation. We should conclude here that neglecting either effect of ozone or aerosols could lead to significant misestimation of UVI and erroneous recommendations to the general public.
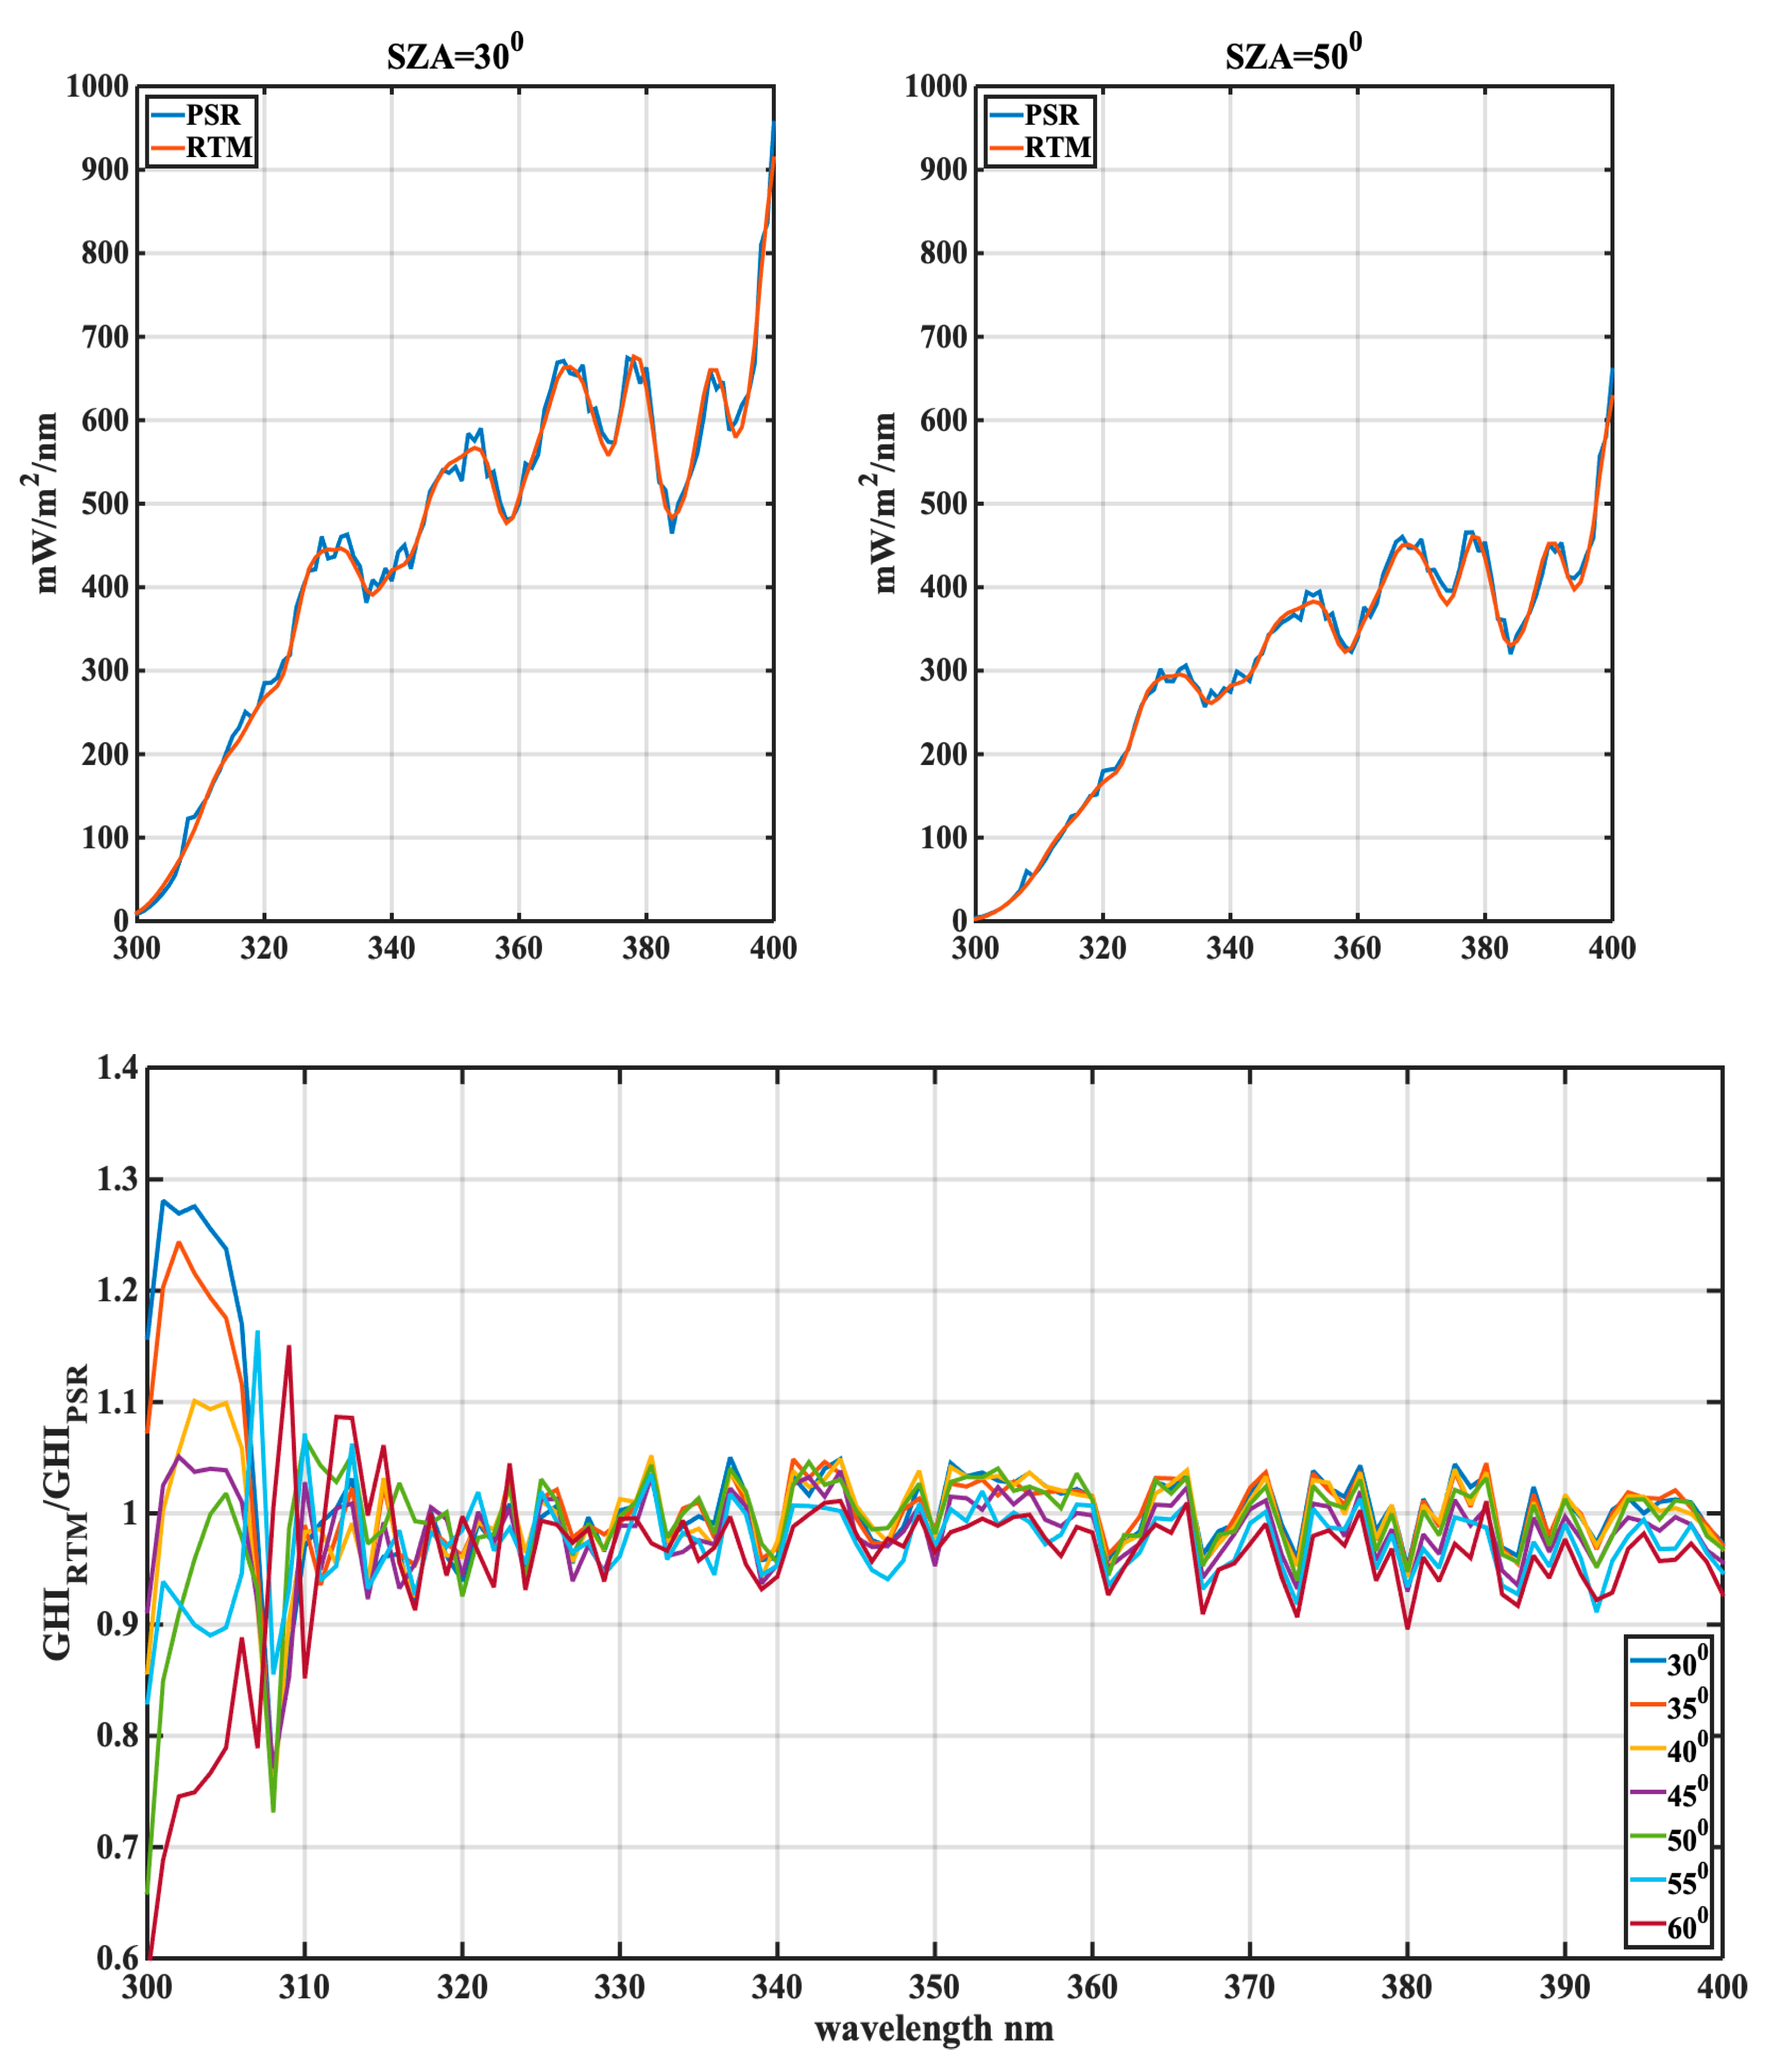
In order to compare the spectral performance of the PSR and the model, UV spectra and their spectral ratio are shown in Figure 7 for May 15th. For this purpose, the RTM runs were set to SSA = 0.86 and Ångström exponent equal to 0.7. Model runs were performed for SZA in the range of 30° to 60° at 5° step, using AOD at 320 nm and TOC that corresponded to these SZAs. PSR measurements at these SZAs were averaged in a range of ± 0.5°. In Figure 7, the upper plots show the modeled and measured spectra that show a good agreement without any obvious absolute or spectral shifts. In Figure 7, the lower plot shows the ratio between the modeled and the measured spectra at seven different SZAs. The average ratio is 0.98 with σ = 0.11. This mean agreement of ~2% shows the relatively accurate use of the model inputs that simulate very well the synchronous measurements. The lowest mean ratio is observed at 60°, which is 0.94. The most variable spectral ratios are reported in the region below 305 nm, where the measured PSR irradiances are very low, including the highest uncertainties [41,42]. In this area, average ratios are from 0.76 (SZA = 60°) to 1.12 (SZA = 30°) with a σ = 0.23.
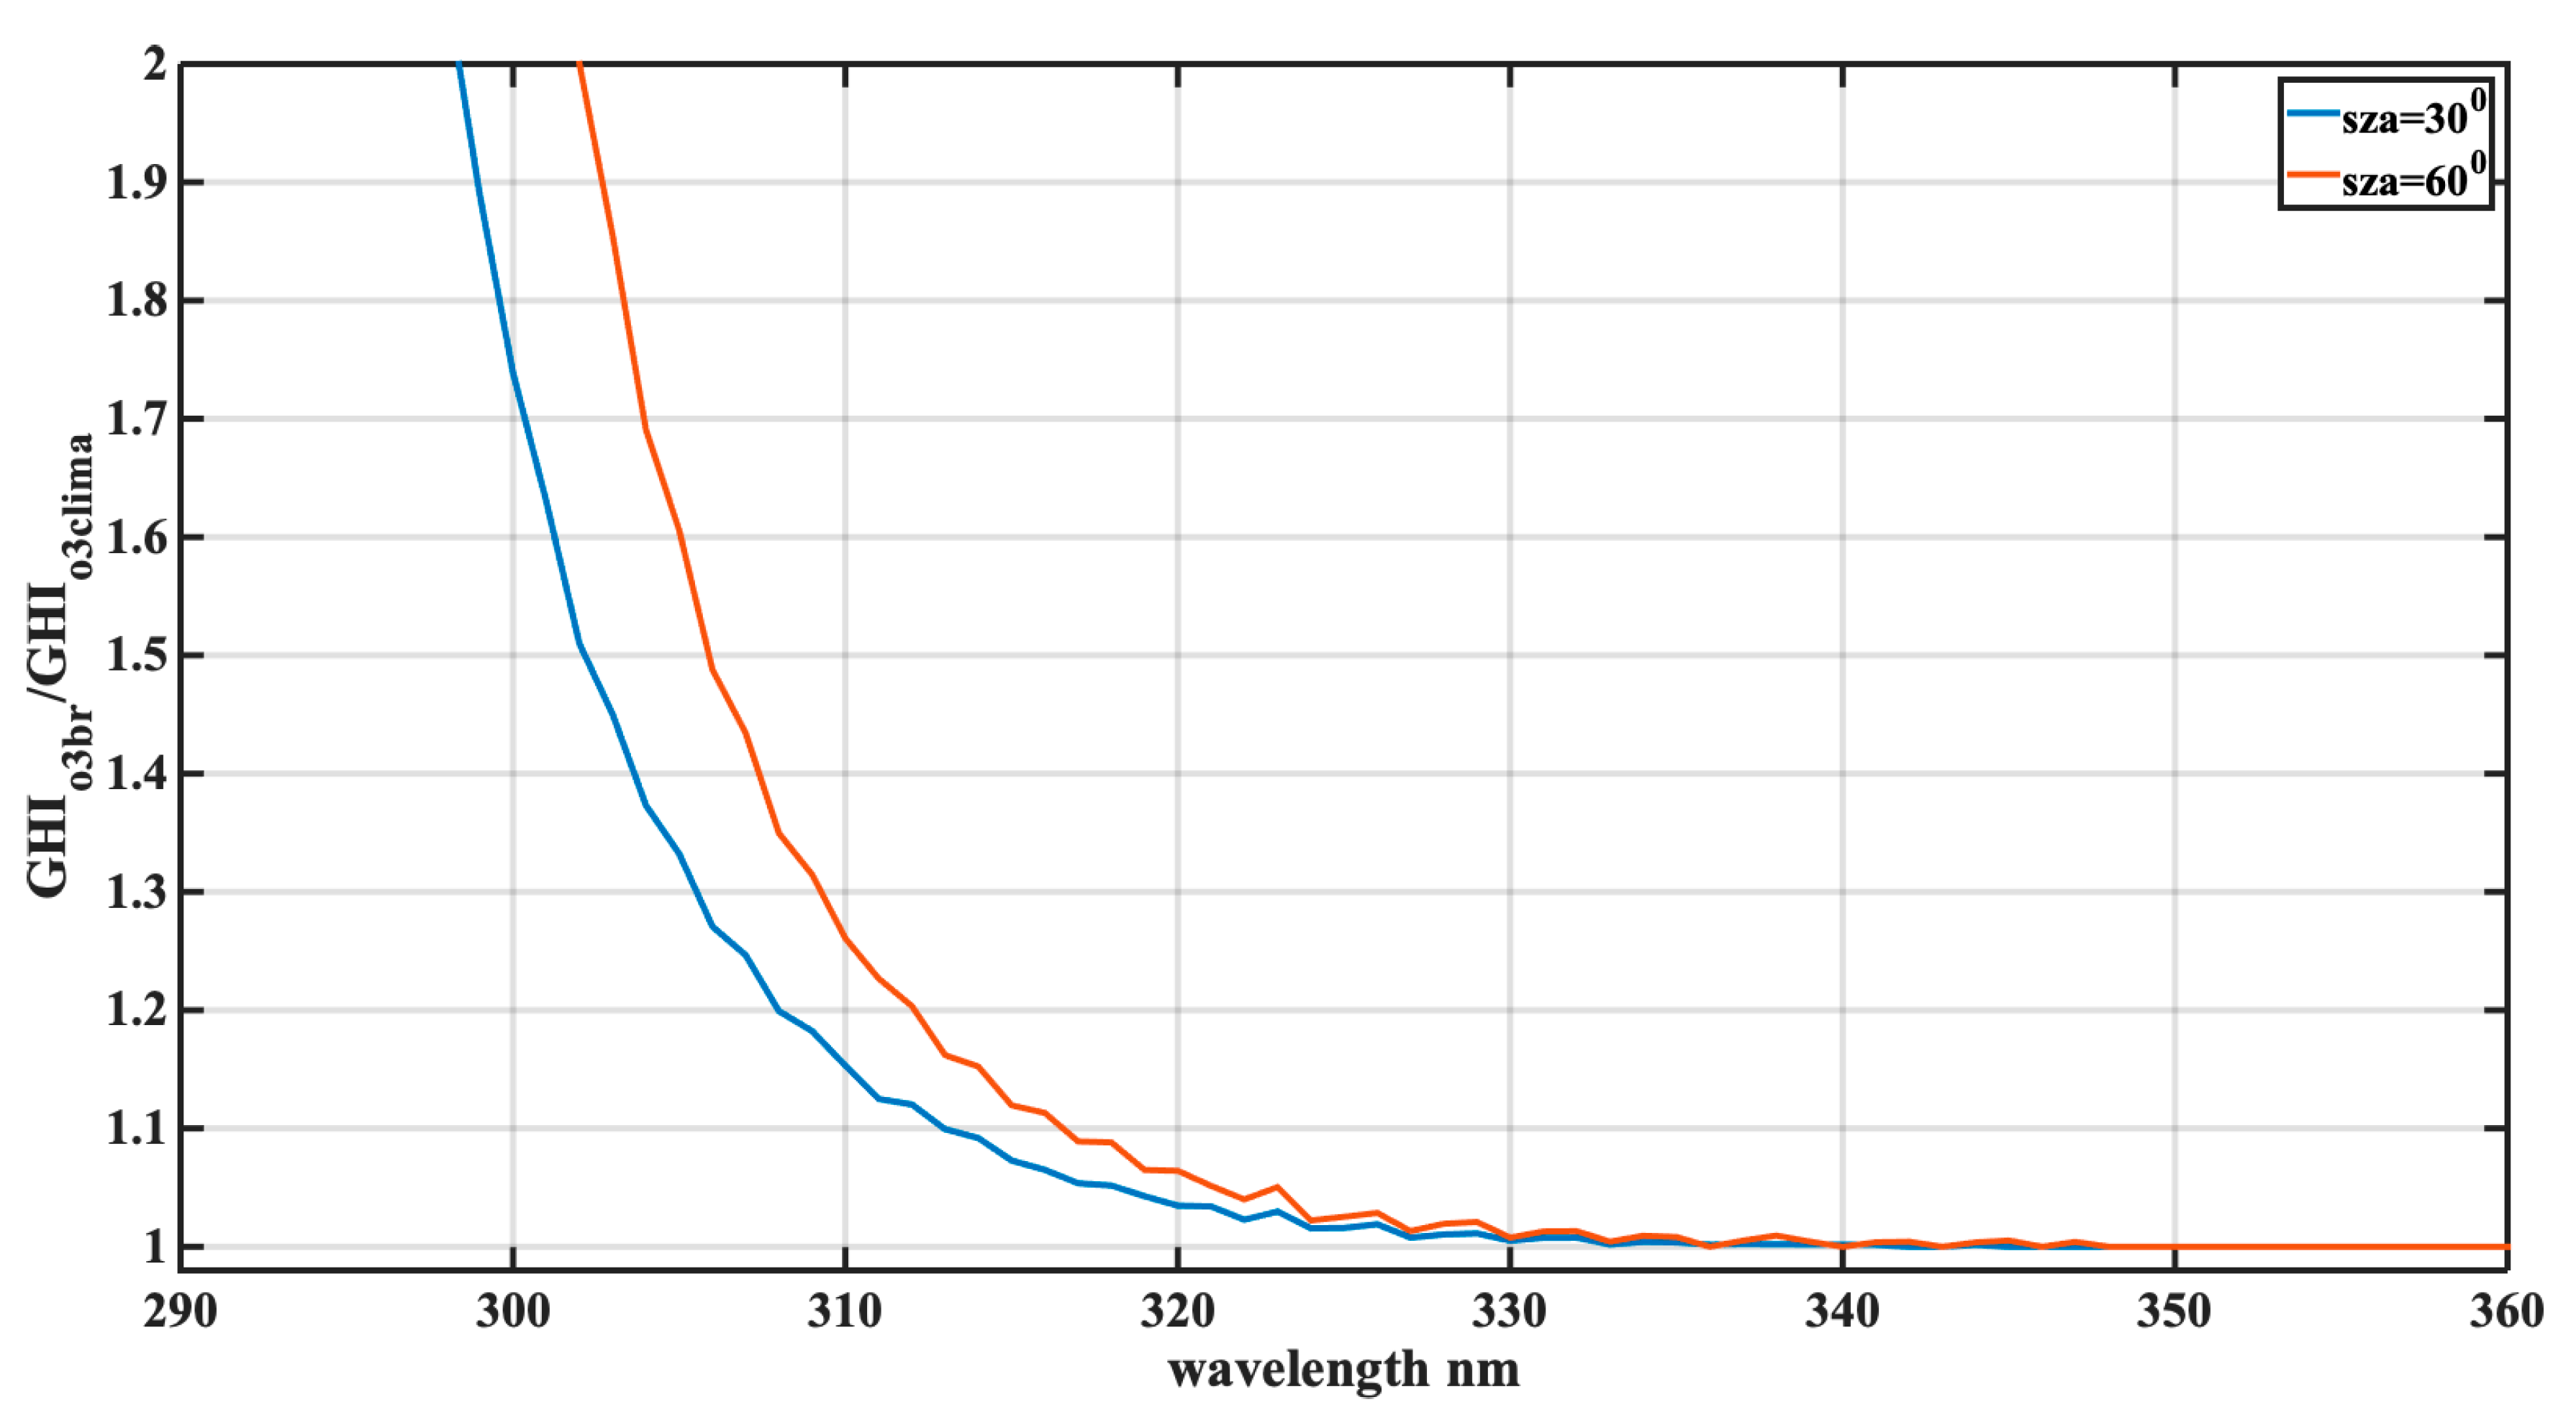
In Figure 8, modeled spectra at SZA of 30° and 60° are divided, from two separate RTM runs, using a constant climatological AOD (0.3) and different TOC, climatological (335 DU) and measured (292 DU as average for the 15th of May). At wavelengths higher than 330 nm, the ratio is constantly 1, where ozone has almost zero influence. At lower spectral regions, the ratio becomes ~1.5 at 305 nm and towards the lower wavelength regions, the ratios become higher exponentially. It is clear from this figure that the UVA region is practically insensitive to TOC changes and UVB is highly sensitive and affects more the UVI. The average effect in the UVB region is a 32% increase in irradiance. This could lead to a 29% increase in the estimated UVI. The ratios depend on the SZA, as higher SZAs correspond to higher ozone attenuation.
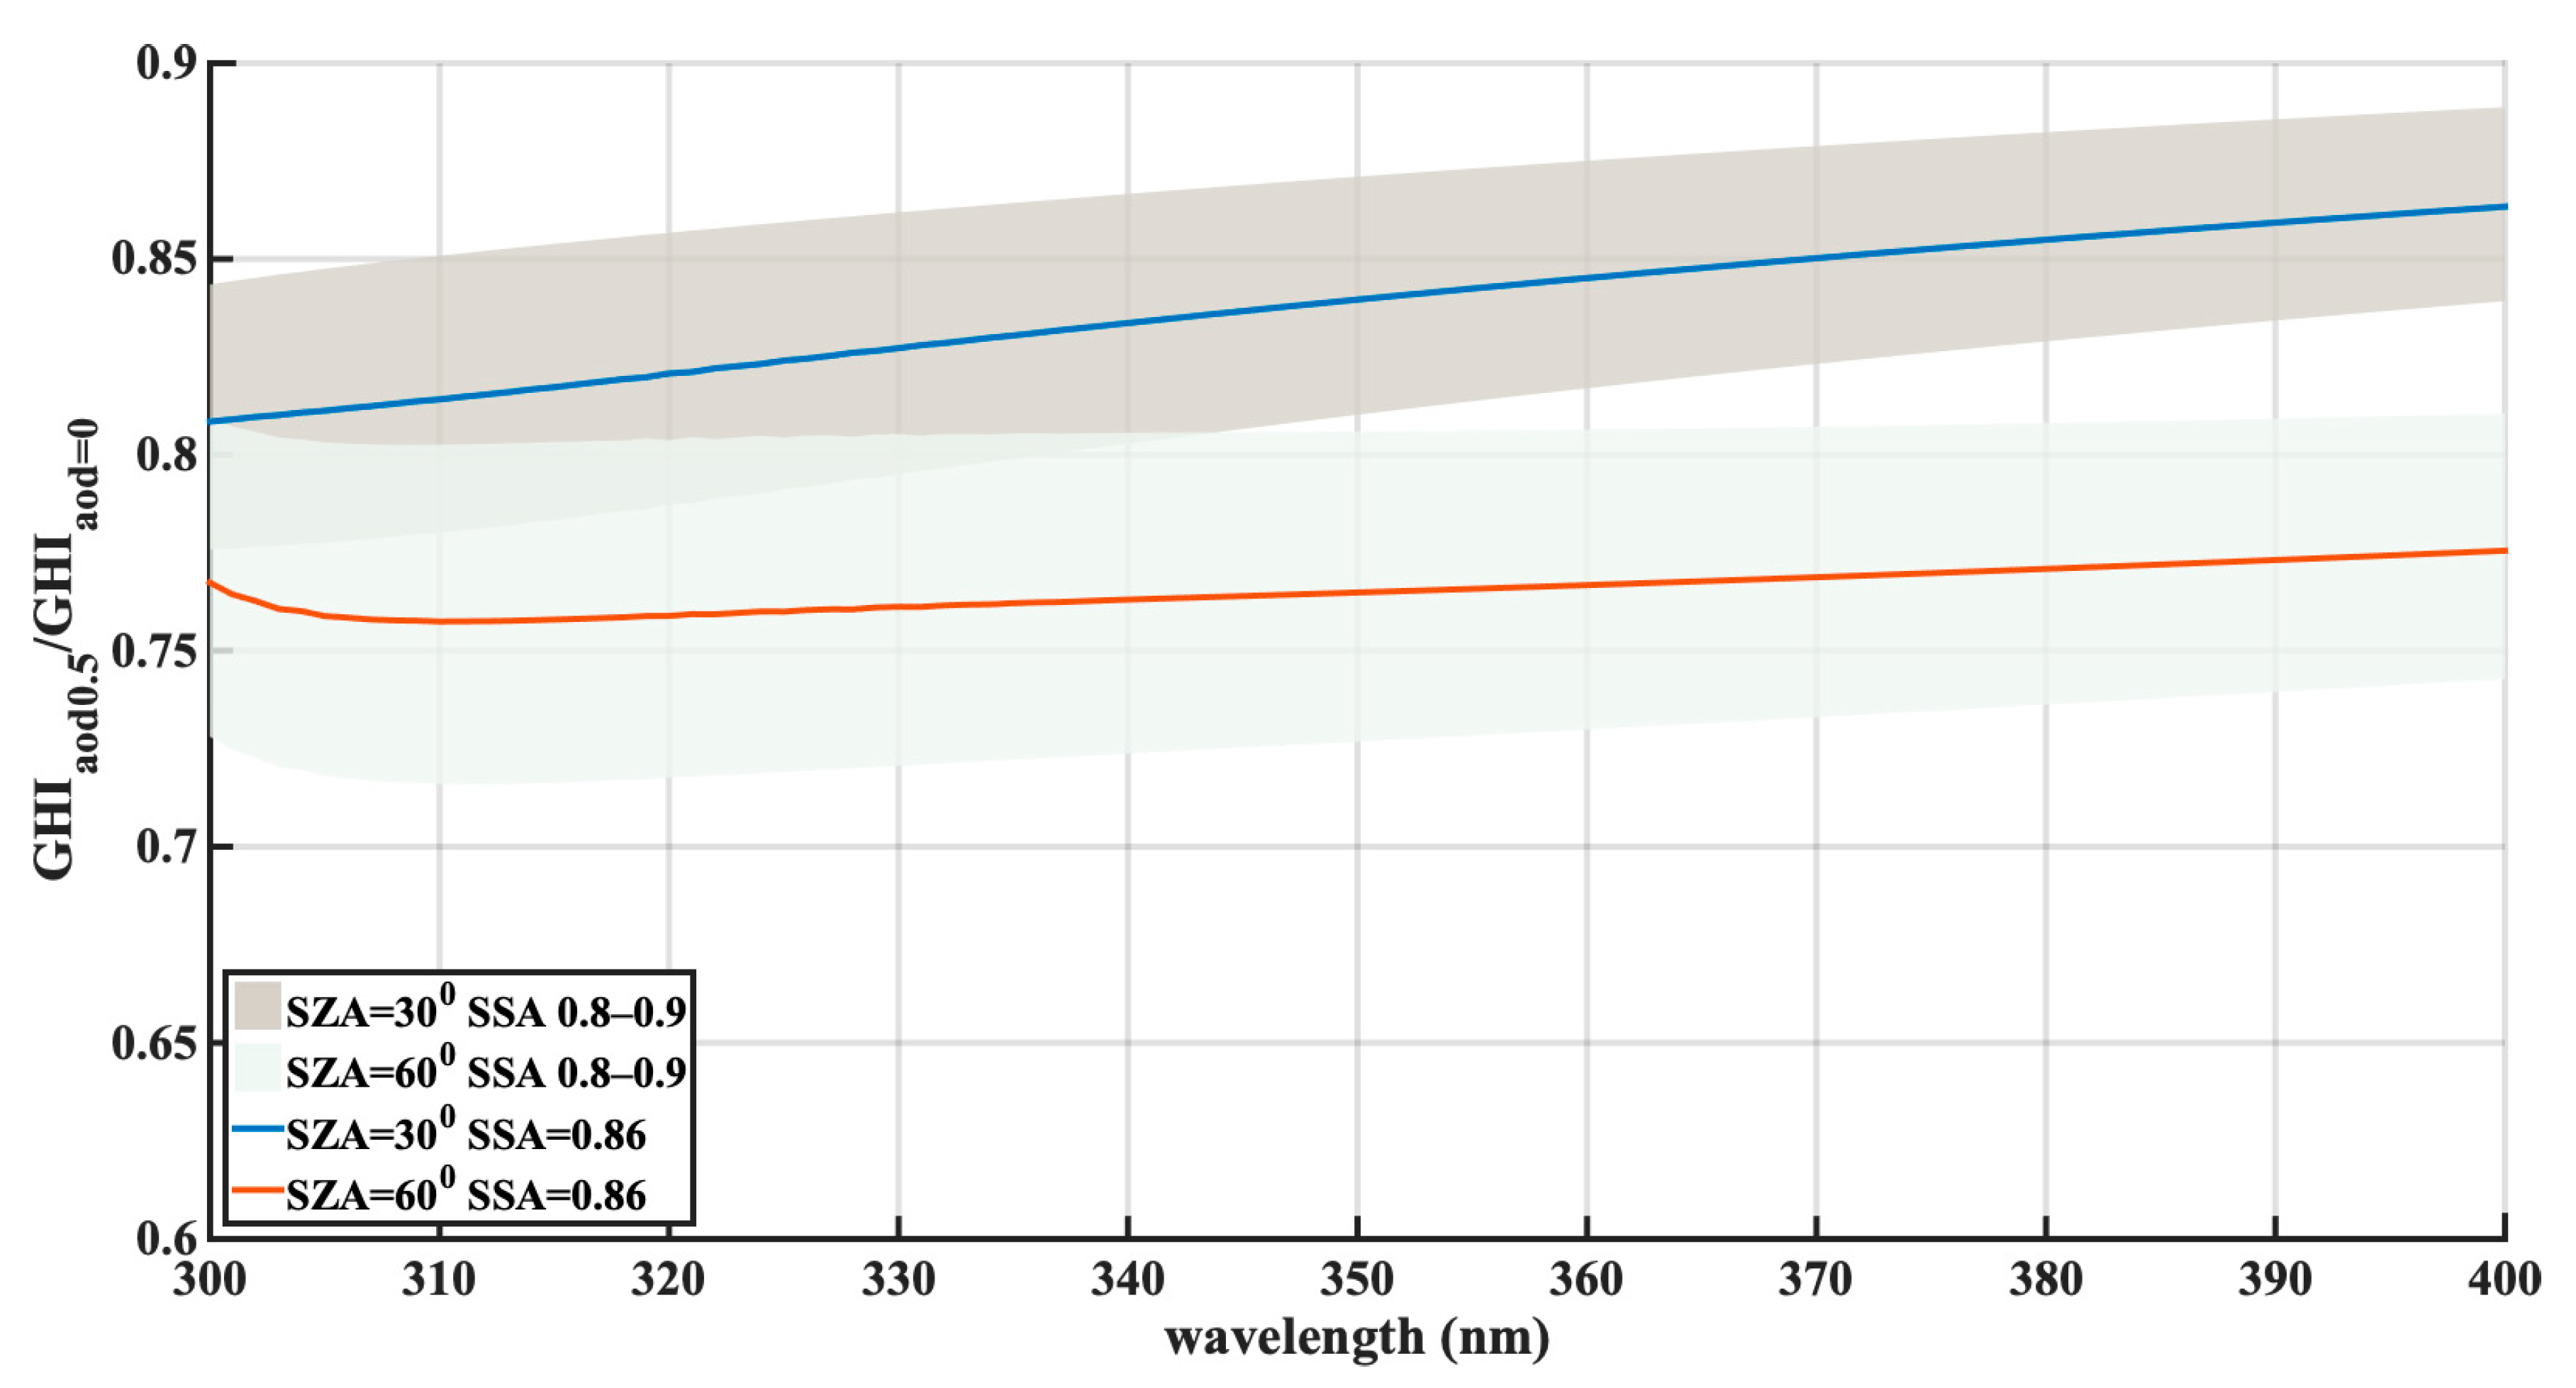
In Figure 9, in order to show the AOD effect, modeled spectral ratios of GHI simulated with AOD = 0.5 and AOD = 0 at SZA = 30° and 60° are presented. In all the above runs, TOC was set to the same climatological values (335 DU). These ratios are less spectral dependent and their absolute value depends on the AOD while their spectral change depends on the spectral characteristics of the aerosol attenuation (Ängström exponent). For these runs, an Ängström exponent of 0.7 was used, which is a representative value during dust intrusions in this area [60]. A different selection would alter the slope of the curves, as higher values result in a steeper increase of AOD with wavelength. Variation of the ratio, when SZA is 30°, is between 0.81 and 0.86 in the spectral region 300–400 nm. When SZA is higher, the attenuation due to aerosols is higher, resulting in a ratio between 0.75 and 0.77 for 60° SZA. Thus, the difference due to aerosols is very similar in UVA and UVB regions. AOD at 0.5 causes about 24% drop to the solar UV irradiance, which leads to a decrease of 28% of UVI. We should also highlight the importance of SSA in the calculations, since the type of the aerosols affects significantly the scattering/absorption characteristics of the radiative transfer simulations. The hypothesis for the UVI simulations shown earlier was that SSA during the dust event was 0.86 [64]. We also show in Figure 9 the range of the abovementioned ratios for SSA between 0.8 and 0.9. Lower limits of the range correspond to 0.8 SSA. Hence, in cases when the aerosol mixture is more absorbing, the influence of aerosol would be more effective. An erroneous assumption about the SSA could lead to deviations of the spectral ratio of ±5%, propagating an uncertainty of 6% at UVI estimation. Also, in cases of higher AOD during dust events, the aerosol effect would be even more prominent. Finally, there is a small increase of the 60° related ratio for wavelengths below 305 nm. This is due to the fact that aerosol increase affects mainly direct irradiance so that for the specific wavelength range and solar angle, its contribution to the GHI is negligible, as diffuse irradiance is dominant. In this case, a small increase of the diffuse irradiance for higher aerosol load leads to the small increase of the ratio.

4. Summary

During 12–19 May 2020, an extreme low TOC event was observed over the Athens area. TOC was lower than the climatological average (−2σ) for the whole week period. In addition, during some days AOD values were lower than the climatological average, while on others a dust aerosol intrusion was linked with AOD values almost double the May average for the area. Our analysis is confined to days that were strictly cloud-free in order to avoid the effect of cloudiness and study the effects of ozone and aerosols on the UV spectra and UVI.
On the 15th of May, which was a day with very low TOC and the highest AOD, theoretical calculations showed that TOC variation alone could cause an increase of ~30% in the UVI compared with the one retrieved using TOC climatological average. However, the aerosol presence masked this effect, contributing to a ~20% decrease during the dust intrusion.
Through RTM calculations, we have estimated that at 305 nm, when SZA is 30°, GHI, compared to the one with average AOD and TOC, will be 26% lower due to aerosols and 34% higher due to TOC decrease, while at 60° SZA, aerosols will attenuate GHI by 31% and ozone will increase it by 59%. Accordingly, at 325 nm, aerosols will cause 18% and 24% drop of GHI at 30° and 60° SZA, respectively, while ozone will increase it by 2% at both SZAs. We highlight that these estimates were derived using the measurements on the 14th of May 2020, a cloud-free day with AOD of 0.5 and mean daily ozone of 292 DU.
This study is investigating the parallel effects of factors affecting a health-related parameter such as the UVI. When studying the UVI dependence of TOC and AOD, it is important to focus on the different spectral regions, as ozone acts mainly in the UVB region, which also determines the largest part of UVI. Aerosols act more uniformly in the whole UV region and their spectral effect on solar irradiance is determined by the Ångström exponent. It should also be highlighted that ignoring intraday or day-to-day changes in either O3 or aerosols when estimating UVI could lead to very high errors. Simultaneously occurring events (high/low TOC and AOD) that could mutually eliminate their effects are happening occasionally and having better knowledge on all these parameters will lead to better forecasting of UVI.
The case presented here is a demonstration of the combined effects of TOC and aerosols on a period with extremely low TOC. Changes in UVI under very low TOC events can be masked by high aerosol loads. Even if TOC is the major parameter affecting UVI, in this event, we saw that a moderate to high dust intrusion eliminated completely the very low TOC effect on the incoming UVI. Our findings demonstrate that aerosols and their optical properties (especially in the UVB) have a high impact on solar irradiance at UVB and have to be accurately known in order to simulate the UVI and inform the public objectively in the absence of accurate UV measurements.
Low ozone events might become more frequent in the future during spring, affecting UVB radiation at ground level. Butchart et al. [68] have analyzed different models and measurements for the meridional variation of ozone and concluded that under expected climatic changes, this kind of event will be more frequent. Hence, large TOC negative anomalies could be a major issue at mid-latitudes in the near future. Analyses of UVB radiation changes under extreme ozone conditions in combination with other natural events can contribute to better design of model simulations for future UVB projections.

Author Contributions

Conceptualization, I.-P.R., S.K.; Methodology, I.-P.R., S.K., K.E., S.S., K.P.; Software, P.K., I.-P.R., K.P., S.S.; Formal Analysis, I.-P.R., S.S.; Investigation, S.K., K.E., Data Curation, I.-P.R., K.E.; Writing—Original Draft Preparation, I.-P.R., K.E.; Writing—Review & Editing, S.K., S.S., K.P.; Visualization, I.-P.R., K.E., S.S.; Funding Acquisition, S.K., K.E. All authors have read and agreed to the published version of the manuscript.

Funding

The research work was partially funded by the Hellenic Foundation for Research and Innovation (H.F.R.I.) under the “First Call for H.F.R.I. Research Projects to support Faculty members and Researchers and the procurement of high-cost research equipment grant” (Project Number: 300).

Institutional Review Board Statement

Not applicable.

Informed Consent Statement

Not applicable.

Data Availability Statement

PSR data are available on request from IPR. Brewer data are available on request from KE.

Acknowledgments

We acknowledge support and funding of this work by the project “Panhellenic Infrastructure for Atmospheric Composition and Climate Change” (MIS 5021516) which is implemented under the action “Reinforcement of the Research and Innovation Infrastructure”, funded by the Operational Program “Competitiveness, Entrepreneurship and Innovation” (NSRF 2014–2020) and co-financed by Greece and the European Union (European Regional Development Fund). S.K. and K.P. would like to acknowledge the European Commission project EuroGEO e-shape (grant agreement No 820852).

Conflicts of Interest

The authors declare no conflict of interest.

References

  1. Solar Spectra by National Renewable Energy Laboratory of United States. Available online: https://www.nrel.gov/grid/solar-resource/spectra.html (accessed on 2 September 2020).
  2. Juzeniene, A.; Brekke, P.; Dahlback, A.; Andersson-Engels, S.; Reichrath, J.; Moan, K.; Holick, M.F.; Grant, W.B.; Moan, J. Solar radiation and human health. Rep. Prog. Phys. 2011, 74, 66701. [Google Scholar] [CrossRef] [Green Version]
  3. Lucas, R.; McMichael, T.; Smith, W.; Armstrong, B. Solar ultraviolet radiation: Global burden of disease from solar ultraviolet radiation. Environ. Burd. Dis. Ser. 2006, 13, 1–250. [Google Scholar]
  4. Webb, A.R.; Kift, R.; Berry, J.L.; Rhodes, L.E. The vitamin D debate: Translating controlled experiments into reality for human sun exposure times. Photochem. Photobiol. 2011, 87, 741–745. [Google Scholar] [CrossRef]
  5. Webb, A.R.; Engelsen, O. Calculated ultraviolet exposure levels for a healthy vitamin D status. Photochem. Photobiol. 2006, 82, 1697. [Google Scholar] [CrossRef] [PubMed]
  6. McKenzie, R.; Blumthaler, M.; Diaz, S.; Fioletov, V.E.; Herman, J.R.; Seckmeyer, G.; Smedley, A.R.D.; Webb, A.R. Rationalizing Nomenclature for UV Doses and Effects on Humans; Report No. CIE 209:2014; CIE and WMO-GAW Joint Report: Geneva, Switzerland, 2014. [Google Scholar]
  7. WMO Meeting of Experts on UV-B Measurements. Data Quality and Standardization of UV Indices, 1994; WMO: Geneva, Switzerland, 1995. [Google Scholar]
  8. WHO and International Commision on Non-Ionizing Radiation Protection. Global Solar UV Index: A Pratical Guide. Available online: https://apps.who.int/iris/handle/10665/42459 (accessed on 23 January 2021).
  9. Fioletov, V.; Kerr, J.B.; Fergusson, A. The UV index: Definition, distribution and factors affecting it. Can. J. Public Health 2010, 101, I5–I9. [Google Scholar] [CrossRef]
  10. Bais, A.F.; Lucas, R.M.; Bornman, J.F.; Williamson, C.E.; Sulzberger, B.; Austin, A.T.; Wilson, S.R.; Andrady, A.L.; Bernhard, G.; McKenzie, R.L.; et al. Environmental effects of ozone depletion, UV radiation and interactions with climate change: UNEP Environmental Effects Assessment Panel, update 2017. Photochem. Photobiol. Sci. 2018, 17, 127–179. [Google Scholar] [CrossRef]
  11. Bais, A.F.; Bernhard, G.; McKenzie, R.L.; Aucamp, P.J.; Young, P.J.; Ilyas, M.; Jöckel, P.; Deushi, M. Ozone-climate interactions and effects on solar ultraviolet radiation. Photochem. Photobiol. Sci. 2019, 18, 602–640. [Google Scholar] [CrossRef] [Green Version]
  12. McKenzie, R.L.; Aucamp, P.J.; Bais, A.F.; Björn, L.O.; Ilyas, M.; Madronich, S. Ozone depletion and climate change: Impacts on UV radiation. Photochem. Photobiol. Sci. 2011, 10, 182. [Google Scholar] [CrossRef]
  13. Eleftheratos, K.; Kapsomenakis, J.; Zerefos, C.S.; Bais, A.F.; Fountoulakis, I.; Dameris, M.; Jöckel, P.; Haslerud, A.S.; Godin-Beekmann, S.; Steinbrecht, W.; et al. Possible effects of greenhouse gases to ozone profiles and DNA active UV-B irradiance at ground level. Atmosphere 2020, 11, 228. [Google Scholar] [CrossRef] [Green Version]
  14. Bais, A.F.; Zerefos, C.S.; Meleti, C.; Ziomas, I.C.; Tourpali, K. Spectral measurements of solar UVB radiation and its relations to total ozone, SO2, and clouds. J. Geophys. Res. 1993, 98, 5199–5204. [Google Scholar] [CrossRef]
  15. Kerr, J.B.; McElroy, C.T. Evidence for large upward trends of ultraviolet-B radiation linked to ozone depletion. Science 1993, 262, 1032–1034. [Google Scholar] [CrossRef] [PubMed]
  16. Kuttippurath, J.; Nair, P.J. The signs of Antarctic ozone hole recovery. Sci. Rep. 2017, 7, 1–8. [Google Scholar] [CrossRef] [PubMed]
  17. Zerefos, C.S.; Tourpali, K.; Eleftheratos, K.; Kazadzis, S.; Meleti, C.; Feister, U.; Koskela, T.; Heikkilä, A. Evidence of a possible turning point in solar UV-B over Canada, Europe and Japan. Atmos. Chem. Phys. 2012, 12, 2469–2477. [Google Scholar] [CrossRef] [Green Version]
  18. Kazadzis, S.; Kouremeti, N.; Bais, A.; Kazantzidis, A.; Meleti, C. Aerosol forcing efficiency in the UVA region from spectral solar irradiance measurements. Ann. Geophys. 2009, 27, 2515–2522. [Google Scholar] [CrossRef] [Green Version]
  19. Di Sarra, A.; Cacciani, M.; Chamard, P.; Cornwall, C.; DeLuisi, J.J.; Di Iorio, T.; Disterhoft, P.; Fiocco, G.; Fua, D.; Monteleone, F. Effects of desert dust and ozone on the ultraviolet irradiance at the Mediterranean island of Lampedusa during PAUR II. J. Geophys. Res. Atmos. 2002, 107, PAU 2-1–PAU 2-14. [Google Scholar] [CrossRef]
  20. Román, R.; Antón, M.; Valenzuela, A.; Gil, J.E.; Lyamani, H.; De Miguel, A.; Olmo, F.J.; Bilbao, J.; Alados-Arboledas, L. Evaluation of the desert dust effects on global, direct and diffuse spectral ultraviolet irradiance. Tellus B Chem. Phys. Meteorol. 2013, 65, 19578. [Google Scholar] [CrossRef]
  21. Barnard, W.F.; Saxena, V.K.; Wenny, B.N.; DeLuisi, J.J. Daily surface UV exposure and its relationship to surface pollutant measurements. J. Air Waste Manag. Assoc. 2003, 53, 237–245. [Google Scholar] [CrossRef] [Green Version]
  22. Mok, J.; Krotkov, N.A.; Torres, O.; Jethva, H.; Li, Z.; Kim, J.; Koo, J.H.; Go, S.; Irie, H.; Labow, G.; et al. Comparisons of spectral aerosol single scattering albedo in Seoul, South Korea. Atmos. Meas. Tech. 2018, 11, 2295–2311. [Google Scholar] [CrossRef] [Green Version]
  23. Papayannis, A.; Mamouri, R.E.; Amiridis, V.; Kazadzis, S.; Pérez, G.; Tsaknakis, G.; Kokkalis, P. Systematic lidar observations of Saharan dust layers over Athens, Greece in the frame of EARLINET project (2004–2006). Ann. Geophys. 2009, 27, 3611–3620. [Google Scholar] [CrossRef]
  24. Kosmopoulos, P.G.; Kazadzis, S.; Taylor, M.; Athanasopoulou, E.; Speyer, O.; Raptis, P.I.; Marinou, E.; Proestakis, E.; Solomos, S.; Gerasopoulos, E.; et al. Dust impact on surface solar irradiance assessed with model simulations, satellite observations and ground-based measurements. Atmos. Meas. Tech. 2017, 10, 2435–2453. [Google Scholar] [CrossRef] [Green Version]
  25. Solomos, S.; Kalivitis, N.; Mihalopoulos, N.; Amiridis, V.; Kouvarakis, G.; Gkikas, A.; Binietoglou, I.; Tsekeri, A.; Kazadzis, S.; Kottas, M.; et al. From tropospheric folding to khamsin and foehn winds: How atmospheric dynamics advanced a record-breaking dust episode in crete. Atmosphere 2018, 9, 240. [Google Scholar] [CrossRef] [Green Version]
  26. Seckmeyer, G.; Pissulla, D.; Glandorf, M.; Henriques, D.; Johnsen, B.; Webb, A.; Siani, A.M.; Bais, A.; Kjeldstad, B.; Brogniez, C.; et al. Variability of UV irradiance in Europe. Photochem. Photobiol. 2008, 84, 172–179. [Google Scholar] [CrossRef] [PubMed]
  27. Blumthaler, M.; Ambach, W.; Ellinger, R. Increase in solar UV radiation with altitude. J. Photochem. Photobiol. B Biol. 1997, 39, 130–134. [Google Scholar] [CrossRef]
  28. Fountoulakis, I.; Diémoz, H.; Siani, A.M.; Laschewski, G.; Filippa, G.; Arola, A.; Bais, A.F.; De Backer, H.; Lakkala, K.; Webb, A.R.; et al. Solar UV irradiance in a changing climate: Trends in Europe and the significance of spectral monitoring in Italy. Environments 2020, 7, 1. [Google Scholar] [CrossRef] [Green Version]
  29. Eleftheratos, K.; Kazadzis, S.; Zerefos, C.S.; Tourpali, K.; Meleti, C.; Balis, D.; Zyrichidou, I.; Lakkala, K.; Feister, U.; Koskela, T.; et al. Ozone and spectroradiometric UV changes in the past 20 years over high latitudes. Atmos. Ocean 2015, 53, 117–125. [Google Scholar] [CrossRef]
  30. Allaart, M.; van Weele, M.; Fortuin, P.; Kelder, H. An empirical model to predict the UV-index based on solar zenith angles and total ozone. Meteorol. Appl. 2004, 11, 59–65. [Google Scholar] [CrossRef] [Green Version]
  31. Zempila, M.M.; Koukouli, M.E.; Bais, A.; Fountoulakis, I.; Arola, A.; Kouremeti, N.; Balis, D. OMI/Aura UV product validation using NILU-UV ground-based measurements in Thessaloniki, Greece. Atmos. Environ. 2016, 140, 283–297. [Google Scholar] [CrossRef]
  32. Gerasopoulos, E.; Kokkalis, P.; Amiridis, V.; Liakakou, E.; Perez, C.; Haustein, K.; Eleftheratos, K.; Andreae, M.O.; Andreae, T.W.; Zerefos, C.S. Dust specific extinction cross-sections over the Eastern Mediterranean using the BSC-DREAM model and sun photometer data: The case of urban environments. Ann. Geophys. 2009, 27, 2903–2912. [Google Scholar] [CrossRef] [Green Version]
  33. Amiridis, V.; Zerefos, C.; Kazadzis, S.; Gerasopoulos, E.; Eleftheratos, K.; Vrekoussis, M.; Stohl, A.; Mamouri, R.; Kokkalis, P.; Papayannis, A. Impact of the 2009 Attica wild fires on the air quality in urban Athens. Atmos. Environ. 2012, 46, 536–544. [Google Scholar] [CrossRef]
  34. Raptis, I.P.; Kazadzis, S.; Amiridis, V.; Gkikas, A.; Gerasopoulos, E.; Mihalopoulos, N. A decade of aerosol optical properties measurements over Athens, Greece. Atmosphere 2020, 11, 154. [Google Scholar] [CrossRef] [Green Version]
  35. Schmalwieser, A.W.; Gröbner, J.; Blumthaler, M.; Klotz, B.; De Backer, H.; Bolsée, D.; Werner, R.; Tomsic, D.; Metelka, L.; Eriksen, P.; et al. UV Index monitoring in Europe. Photochem. Photobiol. Sci. 2017, 16, 1349–1370. [Google Scholar] [CrossRef] [PubMed] [Green Version]
  36. Gröbner, J.; Sperfeld, P. Direct traceability of the portable QASUME irradiance scale to the primary irradiance standard of the PTB. Metrologia 2005, 42, 134. [Google Scholar] [CrossRef]
  37. Hülsen, G.; Gröbner, J.; Bais, A.; Blumthaler, M.; Diémoz, H.; Bolsée, D.; Diaz, A.; Fountoulakis, I.; Naranen, E.; Schreder, J.; et al. Second solar ultraviolet radiometer comparison campaign UVC-II. Metrologia 2020, 57, 035001. [Google Scholar] [CrossRef]
  38. Verdebout, J. A European satellite-derived UV climatology available for impact studies. Radiat. Prot. Dosimetry 2004, 111, 407–411. [Google Scholar] [CrossRef] [PubMed]
  39. Herman, J.R. Global increase in UV irradiance during the past 30 years (1979–2008) estimated from satellite data. J. Geophys. Res. Atmos. 2010, 115. [Google Scholar] [CrossRef] [Green Version]
  40. Gröbner, J.; Kouremeti, N. The Precision Solar Spectroradiometer (PSR) for direct solar irradiance measurements. Sol. Energy 2019, 185, 199–210. [Google Scholar] [CrossRef]
  41. Raptis, P.I.; Kazadzis, S.; Gröbner, J.; Kouremeti, N.; Doppler, L.; Becker, R.; Helmis, C. Water vapour retrieval using the Precision Solar Spectroradiometer. Atmos. Meas. Tech. 2018, 11, 1143–1157. [Google Scholar] [CrossRef]
  42. Webb, A.R. Who, what, where and when—Influences on cutaneous vitamin D synthesis. Prog. Biophys. Mol. Biol. 2006, 92, 17–25. [Google Scholar] [CrossRef]
  43. Kerr, J.B.; McElroy, C.T.; Olafson, R.A. Measurements of ozone with the Brewer ozone spectrophotometer. In Proceedings of the Quadrennial Ozone Symposium, Boulder, CO, USA, 4–9 August 1981; London, J., Ed.; National Center for Atmospheric Research: Boulder, CO, USA; pp. 74–79. [Google Scholar]
  44. Kazantzidis, A.; Bais, A.F.; Zempila, M.M.; Meleti, C.; Eleftheratos, K.; Zerefos, C. Evaluation of ozone column measurements over Greece with NILU-UV multi-channel radiometers. Int. J. Remote Sens. 2009, 30, 4273–4281. [Google Scholar] [CrossRef]
  45. Raptis, P.; Kazadzis, S.; Eleftheratos, K.; Kosmopoulos, P.; Amiridis, V.; Helmis, C.; Zerefos, C. Total ozone column measurements using an ultraviolet multifilter radiometer. International J. Remote Sens. 2015, 36, 4469–4482. [Google Scholar] [CrossRef]
  46. Diémoz, H.; Eleftheratos, K.; Kazadzis, S.; Amiridis, V.; Zerefos, C.S. Retrieval of aerosol optical depth in the visible range with a Brewer spectrophotometer in Athens. Atmos. Meas. Tech. 2016, 9, 1871–1888. [Google Scholar] [CrossRef] [Green Version]
  47. Zerefos, C.S.; Eleftheratos, K.; Kapsomenakis, J.; Solomos, S.; Inness, A.; Balis, D.; Redondas, A.; Eskes, H.; Allaart, M.; Amiridis, V.; et al. Detecting volcanic sulfur dioxide plumes in the Northern Hemisphere using the Brewer spectrophotometers, other networks, and satellite observations. Atmos. Chem. Phys. 2017, 17, 551–574. [Google Scholar] [CrossRef] [Green Version]
  48. Gröbner, J.; Meleti, C. Aerosol optical depth in the UVB and visible wavelength range from Brewer spectrophotometer direct irradiance measurements: 1991–2002. J. Geophys. Res. 2004, 109, D09202. [Google Scholar] [CrossRef]
  49. Staehelin, J.; Kerr, J.; Evans, R.; Vanicek, K. Comparison of Total Ozone Measurements of Dobson and Brewer Spectrophotometers and Recommended Transfer Functions; World Meteorological Organization: Geneva, Switzerland, 2003. [Google Scholar]
  50. Available online: http://www.o3soft.eu/o3Brewer.html (accessed on 10 August 2020).
  51. Bhartia, P.K.; Wellemeyer, C. TOMS-V8 total O3 algorithm. OMI Algorithm Theor. Basis Doc. 2002, 2, 15–31. [Google Scholar]
  52. Veefkind, J.P.; de Haan, J.F.; Brinksma, E.J.; Kroon, M.; Levelt, P.F. Total ozone from the Ozone Monitoring Instrument (OMI) using the DOAS technique. IEEE Trans. Geosci. Remote. Sens. 2006, 44, 1239–1244. [Google Scholar] [CrossRef]
  53. Huijnen, V.; Miyazaki, K.; Flemming, J.; Inness, A.; Sekiya, T.; Schultz, M.G. An intercomparison of tropospheric ozone reanalysis products from CAMS, CAMS interim, TCR-1, and TCR-2. Geosci. Model Dev. 2020, 13, 1513–1544. [Google Scholar] [CrossRef] [Green Version]
  54. Balis, D.; Kroon, M.; Koukouli, M.E.; Brinksma, E.J.; Labow, G.; Veefkind, J.P.; McPeters, R.D. Validation of Ozone Monitoring Instrument total ozone column measurements using Brewer and Dobson spectrophotometer ground-based observations. J. Geophys. Res. Atmos. 2007, 112, D24. [Google Scholar] [CrossRef] [Green Version]
  55. Fioletov, V.E.; Labow, G.; Evans, R.; Hare, E.W.; Köhler, U.; McElroy, C.T.; Miyagawa, K.; Redondas, A.; Savastiouk, V.; Shalamyansky, A.M.; et al. Performance of the ground-based total ozone network assessed using satellite data. J. Geophys. Res. Atmos. 2008, 113, D14. [Google Scholar] [CrossRef]
  56. McPeters, R.; Kroon, M.; Labow, G.; Brinksma, E.; Balis, D.; Petropavlovskikh, I.; Veefkind, J.P.; Bhartia, P.K.; Levelt, P.F. Validation of the Aura Ozone Monitoring Instrument total column ozone product. J. Geophys. Res. 2008, 113, D15S14. [Google Scholar] [CrossRef] [Green Version]
  57. Meloni, D.; Di Sarra, A.; Herman, J.R.; Monteleone, F.; Piacentino, S. Comparison of ground-based and Total Ozone Mapping Spectrometer erythemal UV doses at the island of Lampedusa in the period 1998–2003: Role of tropospheric aerosols. J. Geophys. Res. Atmos. 2005, 110. [Google Scholar] [CrossRef] [Green Version]
  58. Mayer, B.; Kylling, A. Technical note: The libRadtran software package for radiative transfer calculations—Description and examples of use. Atmos. Chem. Phys. 2005, 5, 1855–1877. [Google Scholar] [CrossRef] [Green Version]
  59. Emde, C.; Buras-Schnell, R.; Kylling, A.; Mayer, B.; Gasteiger, J.; Hamann, U.; Kylling, J.; Richter, B.; Pause, C.; Dowling, T.; et al. The libradtran software package for radiative transfer calculations (version 2.0.1). Geosci. Model Dev. 2016, 9, 1647–1672. [Google Scholar] [CrossRef] [Green Version]
  60. Dahlback, A.; Stamnes, K. A new spherical model for computing the radiation field vailable for photolysis and heating at twilight. Planet. Space Sci. 1991, 39, 671–683. [Google Scholar] [CrossRef]
  61. Kurucz, R.L.; Rabin, D.M.; Jefferies, J.T. Synthetic infrared spectra. In Proceedings of the IAU Symposium on Infrared Solar Physics, Kluwer Academic Norwell, MA, USA, 2–5 March 1992. [Google Scholar]
  62. Anderson, G.; Clough, S.; Kneizys, F.; Chetwynd, J.; Shettle, E. AFGL Atmospheric Constituent Profiles (0–120 km); Tech. Rep. AFGL-TR-86-0110; Air Force Geophysical Laboratory, Hanscom Air Force Base: Bedford, MA, USA, 1986. [Google Scholar]
  63. Shettle, E. Models of aerosols, clouds and precipitation for atmospheric propagation studies. In Proceedings of the Atmospheric Propagation in the UV, Visible, IR and MM Wave Regionand Related Systems and Aspects, Copenhagen, Denmark, 9–13 October 1989. [Google Scholar]
  64. Raptis, P.-I.; Kazadzis, S.; Eleftheratos, K.; Amiridis, V.; Fountoulakis, I. Single scattering Albedo’s spectral dependence effect on UV irradiance. Atmosphere 2018, 9, 364. [Google Scholar] [CrossRef] [Green Version]
  65. Kazadzis, S.; Raptis, P.; Kouremeti, N.; Amiridis, V.; Arola, A.; Gerasopoulos, E.; Schuster, G.L. Aerosol absorption retrieval at ultraviolet wavelengths in a complex environment. Atmos. Meas. Tech. 2016, 9, 5997. [Google Scholar] [CrossRef] [Green Version]
  66. Plumb, R.A.; Eluszkiewicz, J. The Brewer–Dobson circulation: Dynamics of the tropical upwelling. J. Atmos. Sci. 1999, 56, 868–890. [Google Scholar] [CrossRef]
  67. Sato, K.; Hirano, S. The climatology of the Brewer–Dobson circulation and the contribution of gravity waves. Atmos. Chem. Phys. 2019, 19, 4517–4539. [Google Scholar] [CrossRef] [Green Version]
  68. Butchart, N.; Scaife, A.A.; Bourqui, M.; De Grandpré, J.; Hare, S.H.E.; Kettleborough, J.; Langematz, U.; Manzini, E.; Sassi, F.; Shibata, K.; et al. Simulations of anthropogenic change in the strength of the Brewer-Dobson circulation. Clim. Dyn. 2006, 27, 727–741. [Google Scholar] [CrossRef]
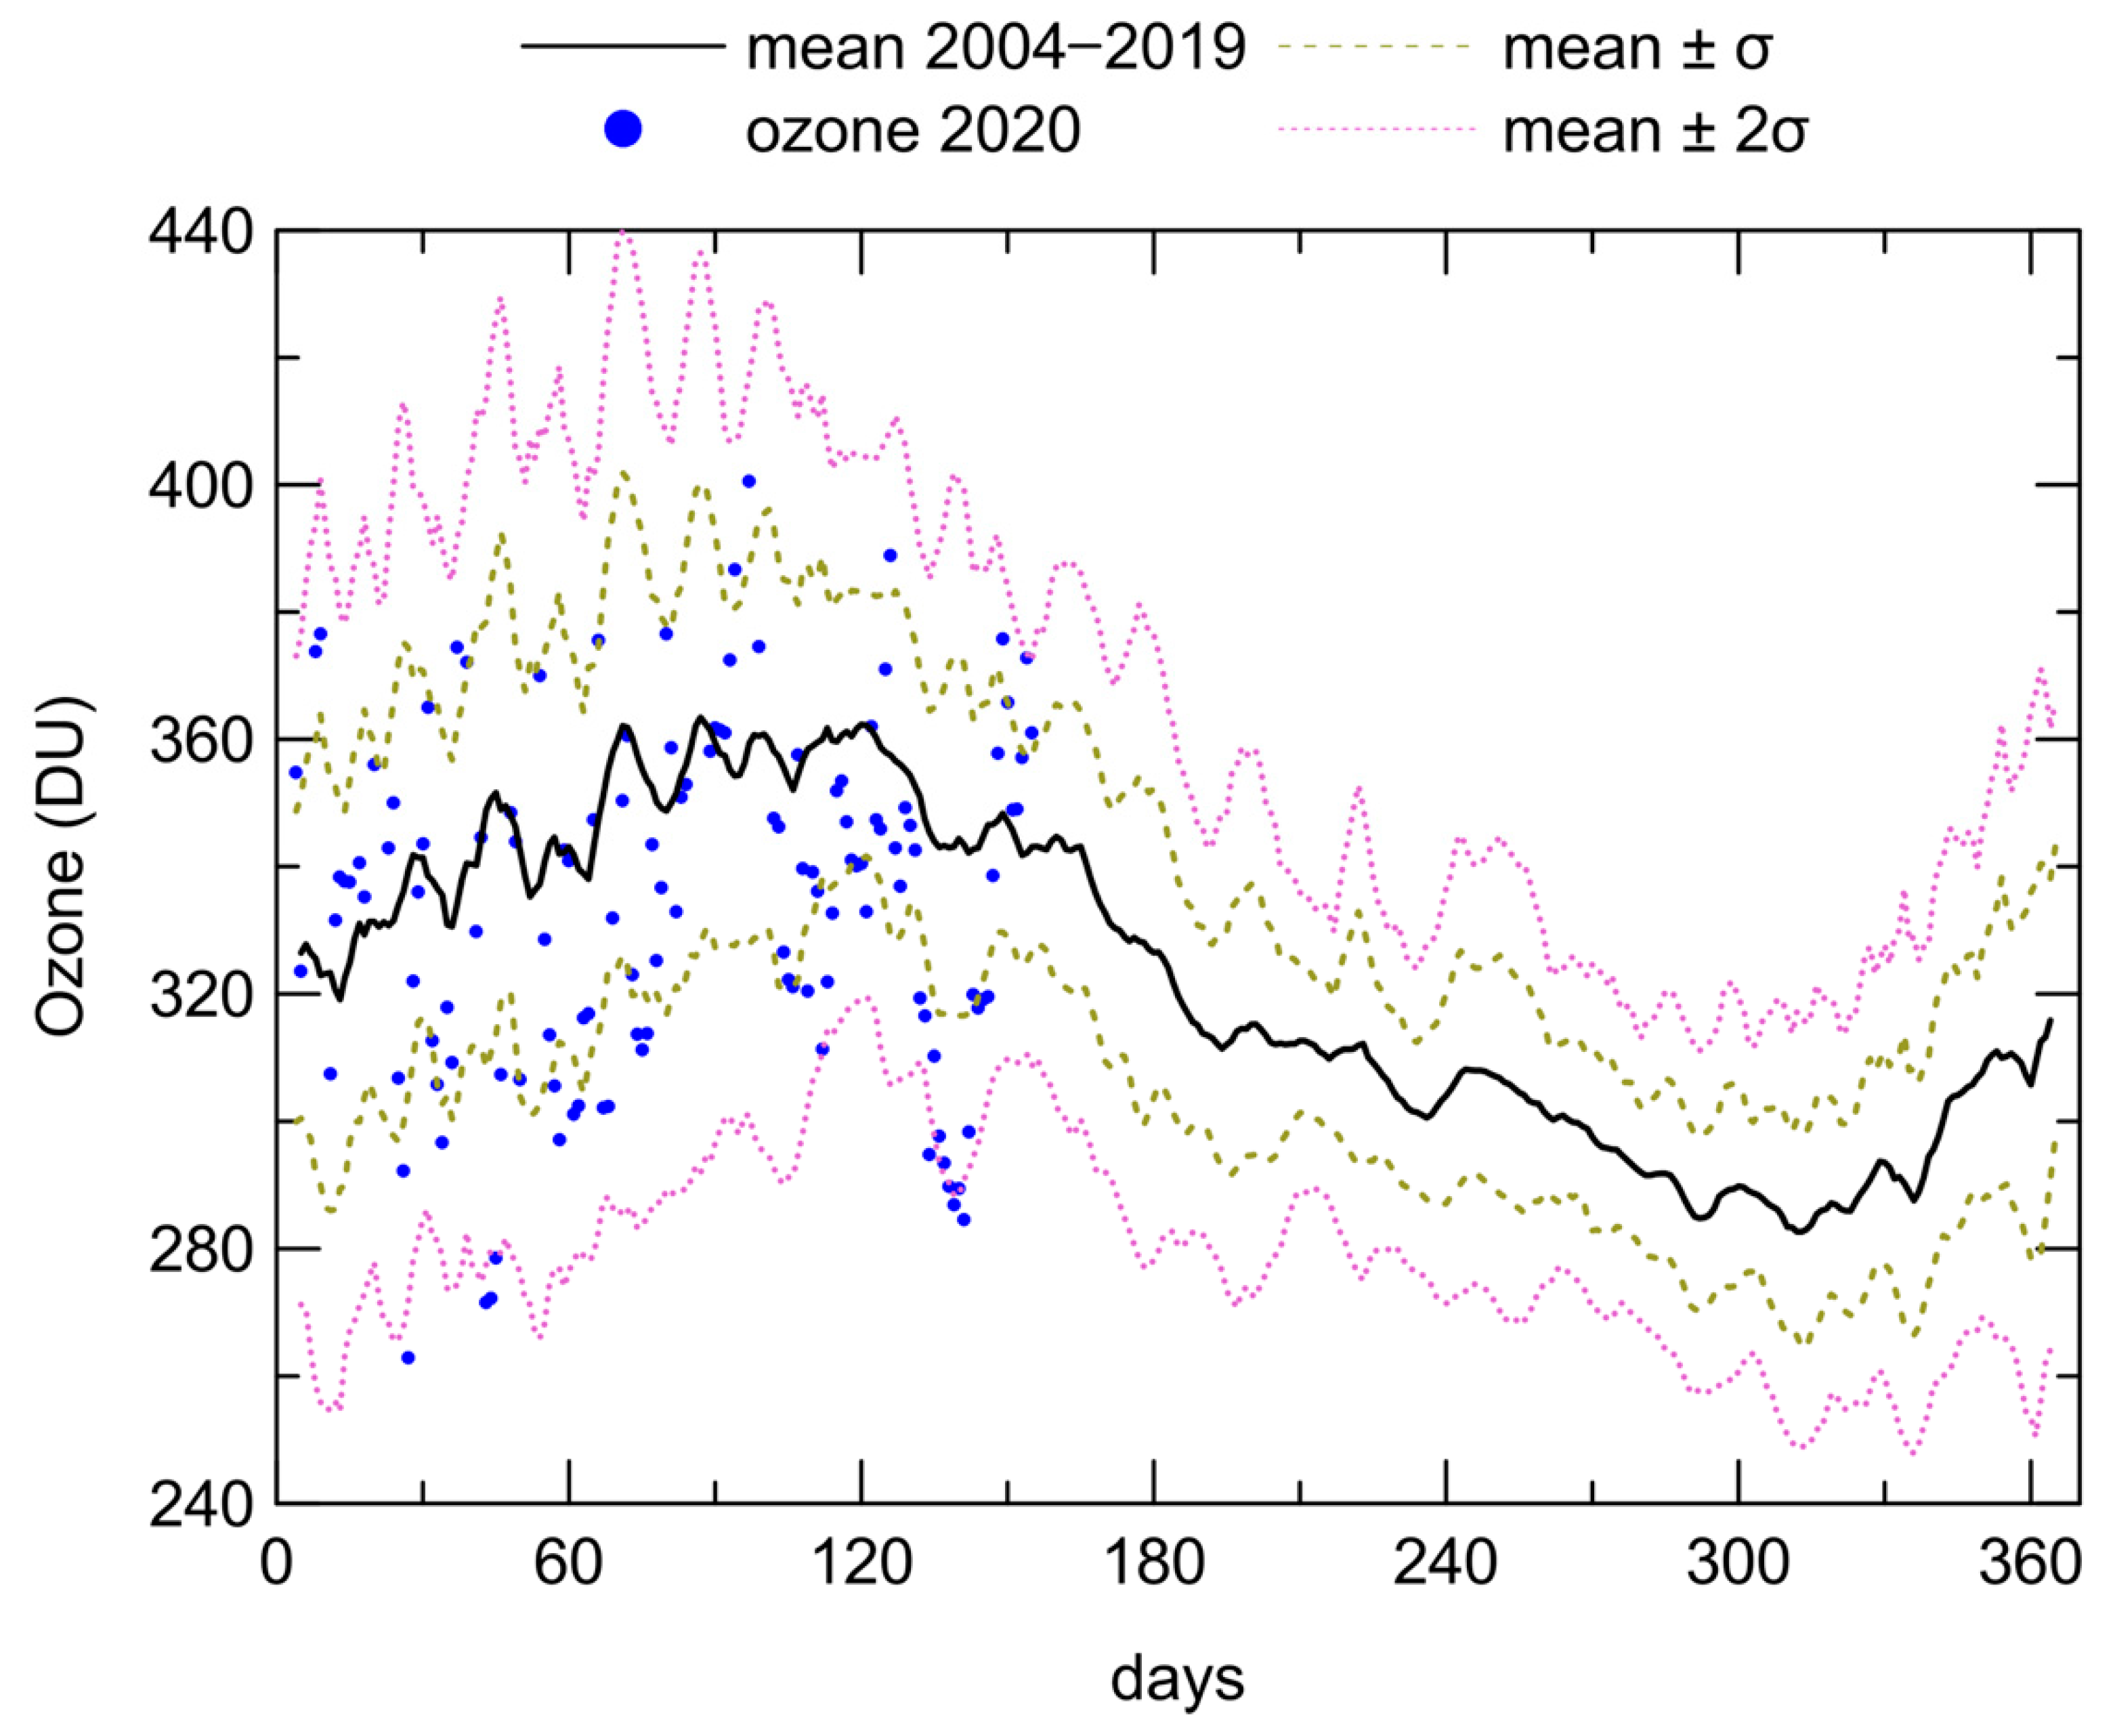
Figure 1. Daily average TOC at Athens, retrieved by BRS, for the period 2004–2019; 1 and 2σ variations along with 2020 measured TOC values are also shown.
Atmosphere 12 00145 g001
Figure 2. Spatial variability of TOC in the Eastern Mediterranean for 12–17 May 2020, as retrieved by the Copernicus Atmospheric Monitoring Service (CAMS).
Atmosphere 12 00145 g002
Figure 3. (a) Temperature and geopotential height at 500 mb on 16 May 2020, 12:00 UTC, by WRF. (b) Geopotential height and wind at tropopause on 16 May 2020, 18:00 UTC, by WRF.
Atmosphere 12 00145 g003
Figure 4. Variation of UVI as retrieved from the PSR measurements (upper plot). Variation of TOC as retrieved from BRS compared to OMI and average ± 2σ for the period, derived from BRS 2004–2019 data (middle plot). AOD at 320 nm as retrieved from BRS along with climatological average AOD at 340 nm as retrieved from AERONET for the period 2009–2018 (lower plot).
Atmosphere 12 00145 g004
Figure 5. Diurnal variation of UVI on 13th of May 2020 as retrieved from the PSR measurements (blue curve), in comparison with modeled UVI predicted using RTM with climatological TOC and AOD inputs (orange dots) and modeled UVI using BRS AOD and TOC as input and modeled UVI using BRS TOC but zero aerosols.
Atmosphere 12 00145 g005
Figure 6. Diurnal variation of UVI on 15 May 2020 as retrieved from the PSR measurements, in comparison with modeled UVI predicted using: RTM with climatological TOC and AOD inputs, BRS AOD and TOC, BRS TOC without aerosols.
Atmosphere 12 00145 g006
Figure 7. Upper plot modeled and measured with PSR GHI at SZA 30° and 50°. Lower plot, ratio of modeled to measured GHI, at seven different SZAs in the region 30°–60°.
Atmosphere 12 00145 g007
Figure 8. Ratio of modeled spectra in the UV region, as derived from RTM, with mean TOC measured by BRS on 15 May 2020, and climatological TOC, at two solar zenith angles.
Atmosphere 12 00145 g008
Figure 9. Ratio of modeled spectra in the UV region, as derived from RTM, with mean AOD measured by BRS on 14 May 2020 and no aerosols, at two solar zenith angles. The range of the ratios for different runs with SSA between 0.9 and 0.8 is shown.
Atmosphere 12 00145 g009
Publisher’s Note: MDPI stays neutral with regard to jurisdictional claims in published maps and institutional affiliations.