Abstract
Gasoline evaporation is a potential source of ambient non-methane hydrocarbons (NMHCs) during summer, and thus the policy of encouraging vehicles to refuel at night has been implemented to control ground-level ozone (O3) and NMHCs. In this study, NMHCs and trace gases were observed online at an urban site of Ji’nan during May–July in 2019 and 2020 to assess the impact of this policy. After the implementation of this policy, the average concentration of daily maximum 8 h moving average O3 decreased from 198 μg/m3 to 181 μg/m3. Meanwhile, the average mixing ratio of NMHCs decreased from 19.89 ppbv to 18.02 ppbv. Sources of NMHCs were then apportioned using the positive matrix factorization model. Four factors were resolved and identified, including vehicle exhaust, paint and solvents usage, gasoline evaporation, and biogenic emission. Relative contributions of these four sources were 52.5%, 20.6%, 18.3%, and 8.6%, respectively. After the implementation of this policy, relative contributions of gasoline evaporation in 1:00–4:00 increased from 20.2–22.7% to 25.4–28.2%, while those for 16:00–18:00 decreased from 16.8–18.7% to 13.9–15.7%. The non-linear relationship of O3 with NMHCs and NOx was investigated using a box model based on observations. Results suggest that O3 production was mainly controlled by NMHCs. Aromatics and alkenes were the key NMHC species in O3 formation. Furthermore, two scenarios of encouraging vehicles to refuel at night were designed to evaluate their impact on O3. The relative decreases of O3 peak concentrations were lower than 1%, indicating that this policy had a limited impact on O3 during the observation period.
1. Introduction
Ground-level ozone (O3) is a typical secondary pollutant that is formed by a series of photochemical reactions of non-methane hydrocarbons (NMHCs) and nitrogen oxides (NOx) under solar radiation [1,2]. Therefore, O3 usually displays higher concentrations at noon and early afternoon and lower values at night and in the morning [3,4]. A lot of studies reported that O3 production shows a highly non-linear relationship with NMHCs and NOx [5,6,7]. Due to the abundant NOx emission from vehicular exhaust, O3 formation tends to be mainly controlled by NMHCs (i.e., in the NMHCs-limited regime) in urban regions, which means that reduction of NMHCs emissions is more effective to control O3 pollution [5,6,7].
Ambient NMHCs can be emitted from biogenic sources and anthropogenic processes, such as vehicular exhaust, paint and solvents use, petrochemical and chemical industry, coal combustion, etc. [8,9]. Gasoline evaporation has been considered an important source of NMHCs in urban regions [10,11,12]. Alkanes and alkenes with 4 and 5 carbon atoms (C4–C5 alkanes and alkenes), especially pentanes, were reported to be the main components of NMHCs emitted from gasoline evaporation [11,12,13], and their evaporation rate would be promoted by high temperature [10,12]. In some cities of China, contributions of gasoline evaporation to ambient NMHCs can reach 10% [14,15]. The process of automobile refueling during the daytime would result in NMHCs evaporation and further accelerate O3 production. To control O3 pollution, many cities of China introduced price incentives to encourage the public to refuel vehicles at night. However, few studies have evaluated the effectiveness of this policy to reduce O3 until now.
In this study, we assessed the impact of the policy encouraging vehicles refueling at night on O3 and NMHCs based on online measurements of NMHCs, NOx, and O3 during 1 May–31 July in 2019 and 2020 at an urban site of Ji’nan, Shandong Province. According to the Brief Report on Environmental Quality issued by the Ji’nan Municipal Bureau of Ecology and Environment (http://jnepb.jinan.gov.cn/col/col10451/index.html, accessed on 1 March 2021), the annual 90th percentiles of daily maximum 8 h moving average O3 concentrations (DMA-8h O3) ranged from 184 μg/m3 to 203 μg/m3 during 2015–2019, exceeding the second grade national ambient air quality standard (160 μg/m3). The days with O3 as the primary air pollutant accounted for 24.7–39.2% of total monitoring days. To control O3 and NMHCs pollution in summer, the Department of Ecological Environment of Shandong Province suggested petrol stations adopt preferential measures to encourage the public to refuel vehicles at night (20:00–23:00 and 0:00–6:00) on 11 June 2020 (http://xxgk.sdein.gov.cn/zfwj/lhh/202006/t20200612_3127944.html, accessed on 1 March 2021). Subsequently, some petrol stations belonging to China Petroleum and Chemical Corporation (Sinopec) and China National Petroleum Corporation (CNPC) began to adopt the price incentives for nighttime refueling from 16 June 2020. According to the statistics of 2019, Sinopec and CNPC accounted for about one-third of the number of petrol stations and about two-thirds of the total sale amount of oil in Jinan. The average refueling volumes at night in Ji’nan increased to 1.14 × 10⁵ L during 17–23 June 2020, which was about 30% higher than the result for the week before the implementation of this policy (http://jinan.iqilu.com/jnms/2020/0806/4612917.shtml, accessed on 15 February 2021). Changes in ambient levels and diurnal variation patterns for O3 and NMHCs before and after the implementation of this policy were analyzed based on measurement data. NMHCs source apportionment and O3 formation sensitivity were then conducted using a receptor model and a box model based on observations (OBM), respectively. Furthermore, the impact of this policy on O3 concentrations was investigated by comparing the OBM-simulated O3 concentrations between the base scenario and two gasoline evaporation control scenarios.
2. Methodology
2.1. Online Measurements of O3 and Its Precursors
Ambient levels of O3, NMHCs, NOx, carbon monoxide (CO), and meteorological parameters were online measured during 1 May–31 July in 2019 and 2020 at an urban site in Ji’nan (36.67° N, 117.06° E) (Figure 1). This site is located in the downtown area of Ji’nan city, which is surrounded by a campus, business district, and residential areas. The two nearest main roads are about 1.5 km and 1.7 km distant from this site in the east and south, respectively. Major gasoline stations in Jinan are shown by stars in Figure 1. The distances between this site and surrounding petrol stations are about 1–2 km.
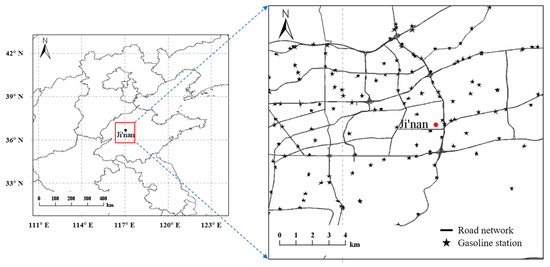
Figure 1.
Locations of the measurement site and gasoline stations in Ji’nan.
Ambient NMHCs were pre-concentrated by two capillary columns filled with absorbents (enrichment trap and focus trap) at room temperature (about 25 °C), and then were vaporized and injected into a gas chromatography (GC) system equipped with a flame ionization detector (FID) and a mass spectrometer detector (MSD) (GCMS-QP2020, Shimadzu Cooperation, Kyoto City, Japan) for separation and detection. Except for the three species with two carbon atoms, the other target NMHCs were separated on a DB-1 column (0.25 mm × 60 m × 1 μm, Agilent Inc., Santa Clara, CA, USA). The oven temperatures for the GC-MS/FID system initiated at 35 °C which was held for 10 min, then increased from 35 °C to 100 °C at 10 °C/min and was held for 5 min at 100 °C, then increased to 220 °C at 10 °C/min and was then held for 3 min at 220 °C, followed by an increase to 240 °C at 10 °C/min, which was then held for 3.5 min. Fifty-seven NMHC species were quantified by using this GC-MS/FID system, including 29 alkanes, 11 alkenes, acetylene, and 16 aromatics. The mixed 1-ppm standard gas for 57 NMHCs (Spectra gasses Inc., Branchburg, NJ, USA) was diluted to 6 calibration standards with mixing ratios of 0.5 ppbv, 2 ppbv, 3 ppbv, 4 ppbv, 8 ppbv, and 10 ppbv. Correlation coefficient (r) values of calibration curves ranged from 0.99 to 1.00. The method detection limits (MDL) for these NMHC species were in the range of 0.009–0.161 ppbv.
Ambient concentrations of O3, NOx, and CO were online measured using an ultraviolet (UV) absorption spectrometer (Model T400, Teledyne API Inc., San Diego, CA, USA), a chemiluminescence NO-NO2-NOx analyzer (Model T200, Teledyne API Inc., USA), and an infrared absorption spectrometer (Model T300, Teledyne API Inc., USA), respectively. Meteorological parameters were measured using a weather station (Met One Instruments Inc., Grants Pass, OR, USA), including wind speed and direction, temperature, and relative humidity.
2.2. Models
2.2.1. Observation-Based Model (OBM)
In this study, the relationship of O3 formation with its precursors was analyzed using a 0-dimension observations-based chemical transport box model that was developed by Cardelino and Chameides (1995) [16]. The 1 h average measurement data for NMHCs, NOx, O3, CO, temperature, and relative humidity were inputted into the OBM to simulate the net production potential of O3 (PO3−NO) during the daytime (07:00–19:00). The following Equation (1) was used to calculate relative incremental reactivity (RIR) values for individual precursors (X):
where ΔX represents the change of concentration for X. S(X) and ΔS(X) represent the source function of X and its change attributed to ΔX, respectively. ΔS(X)/S(X) was set as 10% in this study.
2.2.2. Positive Matrix Factorization (PMF) Model
The positive matrix factorization (PMF) model version 5.0 (PMF 5.0) that was developed by the U.S. Environmental Protection Agency (EPA) was applied in this study for NMHCs source apportionment. More details about the principles of PMF 5.0 were introduced in the user guide [17]. Briefly, the speciated NMHCs measurement data matrix (x) can be decomposed into two matrices, i.e., factor contributions (g) and factor profiles (f) (Equation (2)).
where xij means the concentration of j species measured in i sample. gik and fkj represent the contribution of the k source to i sample and percentage of j species in the k source, respectively. eij represents residual for j species in i sample; p represents the number of factors.
3. Results and Discussion
3.1. Meteorological Conditions during May–July of 2019 and 2020
Meteorological parameters can influence the formation and removal processes of O3 [18]. Figure 2 shows wind roses during 1 May–15 June and 16 June–31 July of 2019 and 2020. The dominant wind direction was southeast through the whole two months of 2020. Similarly, the wind was also mainly from the southeast during 16 June–31 July, 2019. However, wind directions during 1 May–15 June 2019 showed a significant difference from the other three periods, which were mainly from southeast, northwest, and southwest. The average wind speeds during 16 June–31 July of 2019 and 2020 were both 2.0 m/s, slightly lower than the results for 1 May–15 June of 2019 and 2020 (2.3–2.5 m/s). This means that wind direction and speed during 1 May–15 June 2019 were different from results for the other three periods, which could result in a discrepancy of concentrations for O3 and its precursors.
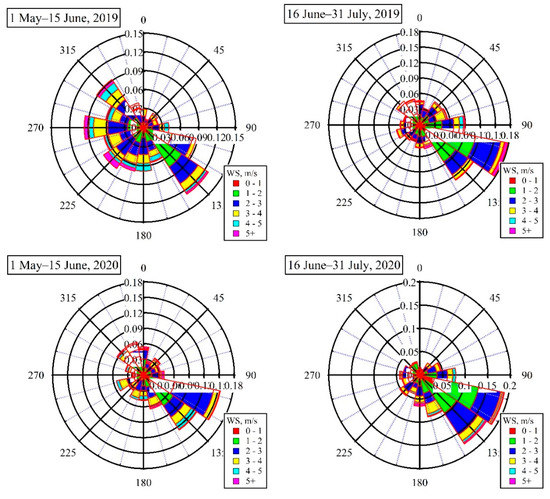
Figure 2.
Comparison of wind rose plots during 1 May–15 June and 16 June–31 July of 2019 and 2020.
To avoid meteorological influences on ambient levels of O3 and its precursors, those observation data under some meteorological conditions that are not beneficial for O3 local production were eliminated, mainly including those days with precipitation or daily average wind speed ≥3.4 m/s. There were 24, 30, 28, and 25 days left during 1 May–15 June and 16 June–31 July of 2019 and 2020, respectively. Measurement data for meteorological parameters and mixing ratios of O3 and its precursors on these days were used to further discuss differences of meteorological conditions among these periods and evaluate the impact of this price incentives policy for nighttime refueling on O3 and NMHCs.
As shown in Figure 3, the average daily temperature during 1 May–15 June and 16 June–31 July, 2020 was 25 °C and 26 °C, respectively. There were 16 and 18 days with the daily maximum temperature (DMT) exceeding 30 °C during these two periods. The cumulative hours of temperature exceeding 30 °C were 129 and 122 during these two periods, respectively. In 2019, the average daily temperature during 1 May–15 June and 16 June–31 July was 24 °C and 29 °C, respectively. There were 11 days (90 h) and 27 days (281 h) with DMT exceeding 30 °C during these two periods, respectively. Overall, the meteorological conditions in the two periods of 2020 were similar but showed significant differences to 2019. The average temperature and days and hours with temperature exceeding 30 °C during 16 June–31 July, 2019 were significantly higher than the results for the other three periods, which could be beneficial for O3 formation. However, days and cumulative hours with temperature exceeding 30 °C for 1 May–15 June 2019 were lower than the other three periods. Based on the above results, it can be found that meteorological conditions, including wind direction and speed, and temperature, were similar between the two periods in 2020, but showed differences to those for 2019.
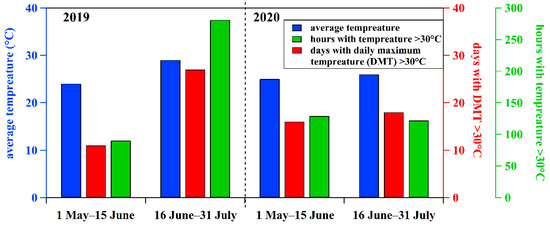
Figure 3.
Comparisons of average temperature, hours with temperatures greater than 30 °C, and days with daily maximum temperature (DMT) greater than 30 °C among four periods (i.e., 1 May–15 June and 16 June–31 July 2019 and 2020) excluding those days with precipitation and wind speed larger than 3.4 m/s.
3.2. Ambient Levels of O3 and Non-Methane Hydrocarbons (NMHCs) during 2019 and 2020
3.2.1. Comparison of O3 Concentrations
As shown in Figure 4, the average value of DMA-8h O3 concentrations at the Ji’nan site during 1 May–15 June and 16 June–31 July 2020 was 198 μg/m3 and 181 μg/m3, respectively. There were 21 days and 18 days with DMA-8h O3 concentrations exceeding 160 μg/m3 during these two periods, respectively. It seems that the average DMA-8h O3 concentration decreased by 8.6% and non-attainment days were reduced by 3 after the implementation of the price incentives policy for nighttime refueling from 16 June 2020.
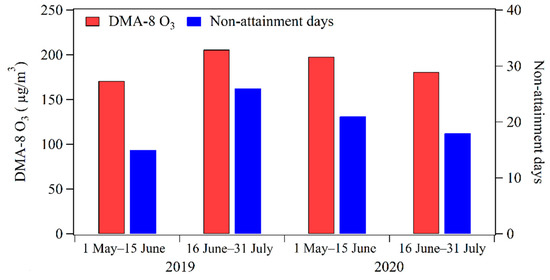
Figure 4.
Comparison of DMA-8 h O3 concentrations and O3 non-attainment days during 1 May–15 June and 16 June–31 July in 2019 and 2020.
The average DMA-8h O3 concentration during 1 May–15 June 2020 was 27 μg/m3 higher than that for the same period in 2019, while the value for 16 June–31 July 2020 was 20 μg/m3 lower. The differences in meteorological conditions were possible causes for the discrepancy of O3 concentrations between 2019 and 2020. The average temperature showed the lowest value during 1 May–15 June 2019 but the highest value for 16 June–31 July 2019 (Figure 3). To avoid influences from meteorological conditions, further analysis of O3 and NMHCs mainly focused on the two periods before and after the implementation of this policy in 2020.
3.2.2. Variations of NMHCs Mixing Ratios
Average NMHCs mixing ratios at the Ji’nan site during 1 May–15 June and 16 June–31 July in 2019 and 2020 were compared in Figure 5. In general, the average mixing ratio of NMHCs during May–July 2020 was 18.95 ppbv, which was 17.8% higher than the result (16.09 ppbv) for 2019. For the two periods in 2020, the average NMHCs mixing ratio during 16 June–31 July was 18.02 ppbv, which was slightly lower than the result (19.89 ppbv) during 1 May–15 June.
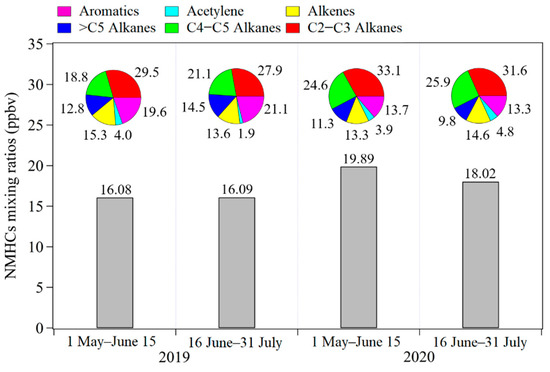
Figure 5.
Comparison of average mixing ratios for non-methane hydrocarbons (NMHCs) during 1 May–15 June and 16 June–31 July in 2019 and 2020.
As shown in Figure 5, the chemical compositions of NMHCs showed differences between 2019 and 2020. Relative contributions of aromatics decreased from 19.6–21.1% in 2019 to 13.3–13.7% in 2020; meanwhile, relative contributions from C4–C5 alkanes increased from 18.8–21.1% to 24.6–25.9%. For the two periods during 2020, the difference in NMHCs chemical composition was lower than that for 2019 versus 2020. During 1 May–15 June 2020, alkanes with 2 and 3 carbon atoms (i.e., C2–C3 alkanes) contributed 33.1% of total mixing ratios of NMHCs, followed by C4–C5 alkanes (24.6%), aromatics (13.7%), alkenes (13.3%), alkanes with carbon atoms more than 5 (i.e., >C5 alkanes) (11.3%), and acetylene (3.9%). After implementing the price incentives policy for nighttime refueling, relative contributions from C2–C3 alkanes, >C5 alkanes, and aromatics decreased to 31.6%, 9.8%, and 13.3%, respectively. Meanwhile, relative contributions from C4–C5 alkanes, alkenes, and acetylene increased to 25.9%, 14.6%, and 4.8%, respectively.
3.2.3. Diurnal Variations of O3 and NMHCs Levels
To further analyze the impact of this price incentives policy for nighttime refueling, the average diurnal variation patterns of O3 and NMHCs levels during 1 May–15 June and 16 June–31 July 2020 were compared in Figure 6. Mixing ratios of NMHCs in two periods both showed the maximum value in the morning rush hour (7:00–9:00), and then decreased gradually to the minimum value in the afternoon (13:00–15:00). This was probably due to the expansion of the boundary layer and the strong photochemical removal during noon and early afternoon [19]. Contrary to NMHCs mixing ratios, O3 concentrations showed a maximum value around 15:00 and then decreased gradually to low values during nighttime. This indicates that O3 at this site was mainly from secondary production.
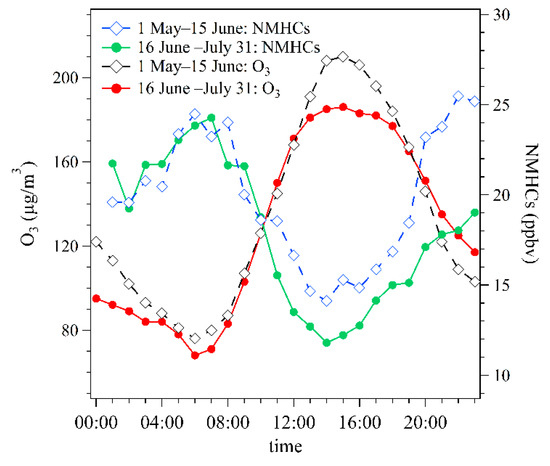
Figure 6.
Average diurnal variation patterns of hourly average O3 concentrations and NMHCs mixing ratios during 1 May–15 June and 16 June–31 July of 2020.
During 1 May–15 June 2020, the average mixing ratios of NMHCs during daytime (06:00–20:00) and nighttime (20:00–06:00) were 18.25 ppbv and 22.27 ppbv, respectively. The ratio of NMHCs mixing ratios during nighttime versus daytime of 1.22. After the implementation of this policy, the average mixing ratios of NMHCs during daytime and nighttime decreased to 16.75 ppbv and 20.28 ppbv, respectively. The ratio of NMHCs mixing ratios during nighttime versus daytime was 1.21, close to the value for 1 May–15 June 2020. It should be noted that the relative decrease of NMHCs levels during 13:00–17:00 between these two periods was 15%, larger than that for nighttime (9%). For O3, its hourly average concentrations during 13:00–17:00 decreased from 191–208 μg/m3 during 1 May–15 June 2020 to 181–186 μg/m3 during 16 June–31 July 2020.
3.2.4. Variations of Pentanes Mixing Ratios
Pentanes (i.e., the sum of i-pentane and n-pentane) are important components of gasoline and, therefore, they are often used as tracers for gasoline evaporation [10,12]. Figure 7 compares average mixing ratios of pentanes and their percentages in total NMHCs during the daytime (06:00–20:00) and nighttime (20:00–06:00) of 1 May–15 June and 16 June–31 July 2020. Before the implementation of this policy, the average mixing ratios of pentanes during nighttime and daytime were 2.29 ppbv and 1.66 ppbv, respectively. The ratio of daytime average level for pentanes versus nighttime was 1.38. During 16 June–31 July 2020, average mixing ratios of pentanes during nighttime and daytime decreased to 2.11 ppbv and 1.56 ppbv, respectively. The ratio of daytime average level for pentanes versus nighttime was 1.35, close to the value for 1 May–15 June 2020. From the perspective of percentages of pentanes in total NMHCs, its values during nighttime and daytime of 16 June–31 July, 2020 were 10.7% and 9.6%, higher than results for 1 May–15 June 2020 (9.8% for the daytime; 8.9% for the nighttime), respectively. The ratio of average percentage for pentanes in total NMHCs during nighttime versus daytime increased from 1.12 to 1.15 after the implementation of this policy. This finding indicates that this policy possibly resulted in a slight increase of contributions from gasoline evaporation on ambient NMHCs during nighttime.
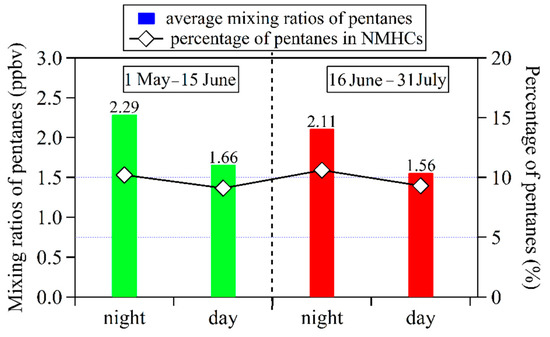
Figure 7.
Average mixing ratios and percentages of pentanes during daytime (06:00–20:00) and nighttime (20:00–06:00) during 1 May–15 June and 16 June–31 July of 2020.
3.3. NMHCs Sources Apportionment during May–July of 2020
3.3.1. Identification of PMF-Resolved Factors
Values of signal versus noise (i.e., S/N > 5), indications for sources, and high ambient mixing ratios were considered when selecting these NMHC species as inputs of the PMF model [17]. In this study, measurement data for 19 NMHC species were selected and inputted into the PMF model for source apportionment, including 8 alkanes, 6 aromatics, 4 alkenes, and acetylene (Figure 8). The PMF solutions with 3–8 factors were resolved and compared with each other. When factors were more than 4, the PMF-resolved solutions were hardly explained by individual sources. Therefore, the 4-factor PMF solution was used for source apportionment. Chemical profiles of these factors are shown in Figure 8a–d.
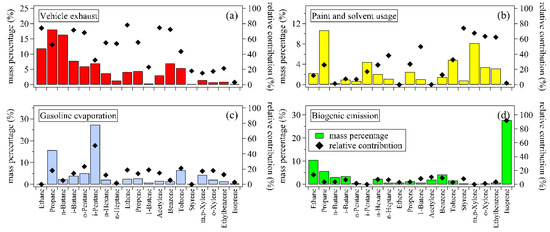
Figure 8.
Chemical profiles of 4 factors resolved by the positive matrix factorization (PMF) model. (a) vehicle exhaust (red), (b) paint and solvent usage (yellow), (c) gasoline evaporation (blue), and (d) biogenic emission (green). The bars mean percentages of individual species in the summed mass concentrations of 19 NMHCs for each factor. The filled diamonds represent the relative contributions of each factor to the total measured mass concentrations for individual NMHC species.
Factor 1 was characterized by the high abundances of C2–C4 alkanes, C6–C7 alkanes, ethylene, acetylene, and benzene, with relative contributions of 52.5–90.1%, 53.8–54.9%, 78.1%, 72.3%, and 74.6%, respectively. These species were reported to be important components of NMHCs emitted from vehicle exhaust [11,20,21,22], and thus this factor was considered vehicle exhaust. For factor 2, its relative contributions to C7–C8 aromatics, including toluene, ethylbenzene, xylenes, and styrene, showed high values of 32.6–73.9%. Aromatics are important components of paint and solvents, which are widely used in industrial processes, painting, coating, and household products, etc. [23,24]. Therefore, this factor was identified as paint and solvent usage. Factor 3 was characterized by its high relative contribution (50.7%) to i-pentane, which was an important component of gasoline [13,21]. Therefore, this factor was identified as gasoline evaporation. Factor 4 was characterized by its high relative contribution (91.9%) to isoprene, which is the most important NMHC species from biogenic emissions [25]. In the daytime of summer, the biogenic source was usually considered as the largest contributor to isoprene [26], and thus factor 4 was identified as biogenic emission.
3.3.2. Relative Contributions of Individual Sources to NMHCs Levels and Ozone Formation Potential (OFP) during May–July of 2020
The average relative contributions of 4 sources to the summed mass concentrations of 19 NMHC species during May–July 2020 are shown in Figure 9a. Vehicle exhaust was the dominant source of NMHCs, with a relative contribution of 52.5%, followed by paint and solvent usage (20.6%), gasoline evaporation (18.3%), and biogenic emission (8.6%). Figure 9b,c compare the sources of NMHCs before and after the implementation of this policy. Relative contributions of vehicle exhaust were close between these two periods. Gasoline evaporation contributed 18.7% and 17.9% of NMHCs before and after the implementation of this policy. Meanwhile, relative contributions of biogenic emission increased from 7.5% during 1 May–15 June to 10.1% during 16 June–31 July, while relative contributions of paint and solvent usage decreased from 22.2% to 18.6%.
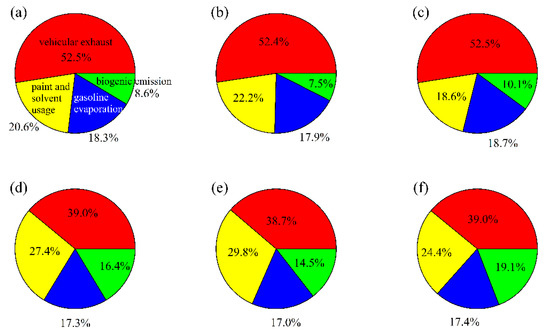
Figure 9.
Relative contributions of 4 sources to total mass concentrations and ozone formation potential (OFP) of 19 NMHC species. (a) NMHCs mass concentrations for 1 May–31 July, (b) 1 May–15 June, and (c) 16 June–31 July 2020, (d) OFP for 1 May–31 July, (e) 1 May–15 June, and (f) 16 June–31 July 2020. The red, yellow, blue, and green colors mean that vehicular exhaust, paint and solvent usage, gasoline evaporation, and biogenic emission.
To find out the reason why the relative contribution of gasoline evaporation increased after the implementation of this policy, changes of mass concentrations for 4 PMF-resolved factors were further compared. The total mass concentration of 19 NMHCs decreased from 37.08 μg/m3 to 35.64 μg/m3 after the implementation of this policy. However, mass concentrations from gasoline evaporation were close during these two periods, with respective values of 6.63 μg/m3 and 6.67 μg/m3. Meanwhile, NMHCs concentrations contributed by vehicle exhaust decreased from 19.43 μg/m3 to 18.71 μg/m3, paint and solvent usage decreased from 8.23 μg/m3 to 6.64 μg/m3, and biogenic emission increased from 2.79 μg/m3 to 3.62 μg/m3, respectively. These results suggest that NMHCs concentrations from gasoline evaporation did not significantly decrease after the implementation of this policy, whereas relative contributions of gasoline evaporation showed an increase due to the decrease of NMHCs concentrations from other sources.
Ozone formation potential (OFP) of individual NMHC species was calculated using the following equation OFP = NMHCi × MIRi, where NMHCi was the mass concentration of individual 19 NMHC species, MIRi was the maximum incremental reactivity coefficient of individual NMHC species simulated by Venecek et al. (2018) [27]. Relative contributions of 4 individual PMF-resolved sources to the total OFP of 19 NMHCs were shown in Figure 9d. Biogenic emission has a higher relative contribution to OFP (16.4%) than that for mass concentration of NMHCs, due to the high reactivity of isoprene. For the three anthropogenic sources, vehicle exhaust was the largest contributor to OFP (39.0%), followed by paint and solvent usage (27.4%) and gasoline evaporation (17.3%). Figure 9e,f compare the relative contributions of individual sources to OFP before and after the implementation of this policy. Relative contributions of vehicle exhaust to OFP were close between these two periods, with respective values of 38.7% and 39.0%. Relative contributions of gasoline evaporation to OFP were 17.0% and 17.4% during these two periods, respectively. Relative contributions of biogenic emission increased from 14.5% during 1 May–15 June 2020 to 19.1% during 16 June–31 July 2020, while relative contributions of paint and solvent usage decreased from 29.8% to 24.4%.
To further investigate the impact of this price incentive policy for nighttime refueling, the average diurnal variation patterns of relative contributions from gasoline evaporation to NMHCs mass concentrations were compared before and after the implementation of this policy (Figure 10). Gasoline evaporation showed higher relative contributions during the nighttime and morning and then decreased gradually to the minimum value in the afternoon (around 16:00–18:00) during both periods. After the implementation of this policy, relative contributions of gasoline evaporation were in the range of 25.4–28.2% in the early morning (1:00–4:00), while the values for 1 May–15 June were 20.2–22.7%. Meanwhile, relative contributions of gasoline evaporation in the afternoon (16:00–18:00) were in the range of 13.9–15.7%, lower than results for 1 May–15 June, with values of 16.8–18.7%. These findings indicate that this policy possibly influenced the diurnal distribution of NMHCs emissions from gasoline evaporation.
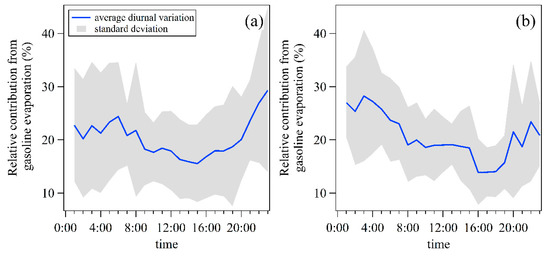
Figure 10.
Average diurnal variation patterns of relative contributions from gasoline evaporation to NMHCs mass concentrations during (a) 1 May–15 June and (b) 16 June–31 July of 2020.
3.4. O3 Formation Analysis during 2020
3.4.1. Sensitivity of O3 Production of NMHCs and NOx
The O3 concentrations measured in this study showed a negative correlation (r = −0.508 **) with NOx concentrations but a positive correlation (r = 0.202 **) with the ratio of NO2 versus NOx (NO2/NOx) which was often used to indicate aging of air masses [28]. Furthermore, the non-linear relationship of O3 formation with NMHCs and NOx during May–July 2020 was analyzed using two methods, including the RIR values (Equation (1)) and the empirical kinetic modeling approach (EKMA) based on the OBM. The EKMA was modeled based on 20 × 20 combinations of anthropogenic NMHCs and NOx reduction scenarios. Each scenario represented a 5% reduction of anthropogenic NMHCs and NOx from 0% to 100%.
Figure 11a shows the isopleth diagram of DMA-8h O3 with relative reductions of anthropogenic NMHCs and NOx (i.e., the EKMA plot). This plot can be divided into 2 parts by the ridgeline (the dashed black line in Figure 11a). The upper-left part represents O3 formation is in the NMHCs-limited regime, while the lower-right part represents O3 formation in the NOx-limited regime. Based on the EKMA plot, the O3 formation in Ji’nan during May–July 2020 was in the NMHCs-limited regime. This means that O3 concentrations would decrease by reducing anthropogenic NMHCs (AHC), while a small reduction of NOx would lead to an increase in O3 concentration. This price incentive policy encouraged the public to refuel vehicles at night and could reduce NMHCs levels in the daytime to some extent, and therefore this policy could inhibit the formation of O3 during the daytime.
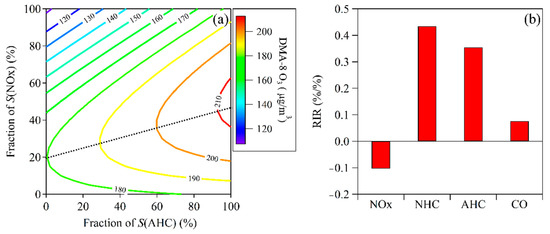
Figure 11.
(a) Relationship of DMA-8h O3 concentrations with relative change of S(AHC) and S(NOx) and (b) average relative incremental reactivity (RIR) values for NOx, NHC (i.e., isoprene), anthropogenic NMHCs (AHC), and CO during May–July of 2020.
Figure 11b shows the RIR values for NOx, NHC (i.e., isoprene), AHC, and CO that were calculated by the OBM. The RIR value of NOx was negative (−0.103%/%), indicating that reducing NOx possibly resulted in O3 increase. Contrary to NOx, the RIR values of NHC, AHC, and CO were all positive, which suggests that the reduction of NMHCs and CO would decrease O3 formation. Although the RIR value for CO was also positive, its value was only 0.076%/%, significantly lower than the RIR values for AHC (0.354%/%) and NHC (0.434%/%). This implies that ambient NMHCs played a more important role in O3 formation than CO. Considering it was hard to reduce biogenic emission, reduction of AHC would be the relatively effective way to control O3 pollution.
To determine the key NMHC species in O3 formation during May–July of 2020, the RIR values for individual NMHC species were calculated using the OBM. The AHC species with the top 10 largest RIR values included 5 aromatics, 4 alkenes, and propane, indicating that aromatics and alkenes played key roles in O3 formation. Propene had the largest RIR value (0.087%/%), followed by m,p-xylene (0.058%/%), o-xylene (0.027%/%), 1-butene (0.020%/%), 1,2,4-trimethylbenzene (0.017%/%), ethylene (0.014%/%), 3-ethyltoluene (0.013%/%), propane (0.012%/%), 1,3-butadiene (0.011%/%), and 1,2,4-trimethylbenzene (0.010%/%), respectively. The RIR values for i-pentane and n-pentane were 0.008%/% and 0.003%/%, respectively.
3.4.2. The Impact of This Policy on Simulated O3 Concentrations
To quantitatively evaluate the impact of this policy on O3 concentrations, two scenarios for gasoline evaporation control were designed. The simulated O3 concentrations by the OBM were compared between the baseline scenario and two control scenarios. The measurement data of O3 and its precursors during 1 May–15 June 2020 (i.e., before the implementation of this policy) were used as inputs for the baseline scenario. According to the above results in Section 3.2.4, the ratio of pentanes percentages in NMHCs during the nighttime versus daytime increased by about 3% after the implementation of this policy. Therefore, scenario 1 assumed that the relative contribution of gasoline evaporation to NMHCs decreased by 1.5% during the daytime and increased by 1.5% during the nighttime. Scenario 2 assumed that stricter control measures or preferential policies were implemented to encourage the public to refuel vehicles at night, and then the relative contribution of gasoline evaporation to NMHCs decreased by 30% during the daytime and increased by 30% during the nighttime. It should be pointed out that the concentrations of NMHCs from gasoline evaporation changed in scenario 1 and scenario 2, while concentrations of NMHCs from other sources, as well as levels of NOx, CO, and meteorological parameters, did not change among the baseline scenario and two control scenarios.
Figure 12 shows the average diurnal variation patterns of decreases of O3 concentrations simulated by the OBM between the baseline scenario and two control scenarios for all days and non-attainment days during 1 May–15 June 2020. For scenario 1, the average peak concentration of O3 decreased by 0.16 ± 0.15 μg/m3 at 15:00 and 0.19 ± 0.15 μg/m3 at 18:00 for all days (Figure 12a) and non-attainment days (Figure 12b), respectively. In scenario 2, the average peak concentration of O3 at 17:00 decreased by 2.25 ± 1.40 μg/m3 and 2.76 ± 1.19 μg/m3 for all days and non-attainment days, respectively. These findings suggest that this price incentives policy for nighttime refueling would decrease O3 peak concentrations in the early afternoon. However, the relative decreases of O3 peak concentrations were lower than 1% for scenario 1. This means that the current policy had a limited impact on O3 concentrations at the Ji’nan site during the observation period of 2020.
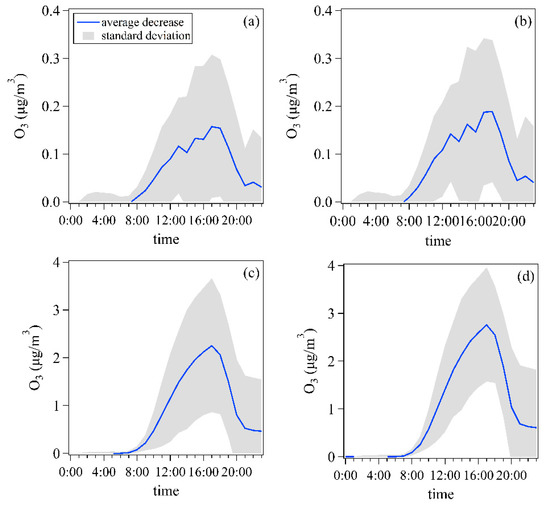
Figure 12.
Average diurnal variation patterns of decreases for O3 concentrations simulated by the observation-based model (OBM) for all days and non-attainment days in 1 May–15 June 2020. (a) the scenario 1 versus baseline scenario for all days, (b) the scenario 1 versus baseline scenario for non-attainment days, (c) the scenario 2 versus baseline scenario for all days, (d) the scenario 2 versus baseline scenario for non-attainment days.
4. Conclusions
The price incentives policy for nighttime refueling was implemented from 16 June 2020 in Ji’nan to control O3 pollution. The impact of this policy on O3 and NMHCs was evaluated based on online observation data of O3, NMHCs, NOx, and CO at an urban site in Ji’nan during May–July of 2019 and 2020.
Changes in O3 concentrations, NMHCs levels, and sources: The average DMA-8 O3 concentration during 16 June–31 July 2020 decreased by 8.6% to 181 μg/m3. Meanwhile, the average mixing ratios of NMHCs decreased by 9.5% to 18.02 ppbv. The PMF model was applied for NMHCs source apportionment. Four source categories were identified, including vehicle exhaust, paint and solvent use, gasoline evaporation, and biogenic emission. Vehicle exhaust was the dominant source to NMHCs, with a relative contribution of 52.5%, followed by paint and solvent use (20.6%), gasoline evaporation (18.3%), and biogenic emission (8.6%). After the implementation of this policy, relative contributions of gasoline evaporation in 1:00–4:00 increased from 20.2–22.7% to 25.4–28.2%, while those in 16:00–18:00 decreased from 16.8–18.7% to 13.9–15.7%. This indicates that this policy possibly influenced the diurnal distribution of gasoline evaporation.
O3 sensitivity to its precursors: The RIR values for AHC, NHC, and CO were positive, while the RIR value for NOx was negative, suggesting that O3 production was in the NMHCs-limited regime. The EKMA plot suggests that reducing AHC was an effective way to control O3. The AHC species with the top ten largest RIR values included 5 aromatics, 4 alkenes, and propane, indicating that aromatics and alkenes are key species in O3 production. The summed RIR value for i-pentane and n-pentane was 0.011%/%, close to the value for propane.
Impact of this policy on O3 concentrations: Two scenarios for gasoline evaporation control were designed and simulated using the OBM. The measurement data of O3 and its precursors during 1 May–15 June 2020 were used as inputs of the baseline scenario. Scenario 1 and 2 assumed that the relative contribution of gasoline evaporation to NMHCs decreased by 1.5% and 30% during the daytime and increased by 1.5% and 30% during the nighttime, respectively. In scenarios 1 and 2, O3 peak concentrations decreased by 0.16 ± 0.15 μg/m3 and 2.25 ± 1.40 μg/m3, with relative decline lower than 1%. This means that the current price incentives policy for nighttime refueling had a limited impact on O3 concentrations during the observation period.
Author Contributions
Conceptualization, W.C. (Wenxuan Chai), M.W. and G.T.; data curation, Y.S., Y.H., K.H. and S.L.; formal analysis, Y.S., Y.H. and S.L.; investigation, W.C. (Wenxuan Chai); methodology, W.C (Wenxuan Chai) and W.C. (Wentai Chen); software, W.C. (Wentai Chen) and K.H.; Writing—Original draft preparation, W.C. (Wenxuan Chai) and Y.S.; Writing—Review and Editing, M.W. and G.T.; funding acquisition, G.T. and M.W. All authors have read and agreed to the published version of the manuscript.
Funding
This research was funded by the National Key Research and Development Program of China (No. 2018YFC0213201) and the National Natural Science Foundation of China (No. 41505113).
Institutional Review Board Statement
Not applicable.
Informed Consent Statement
Not applicable.
Data Availability Statement
Not applicable.
Acknowledgments
We are grateful for financial support from the National Key Research and Development Program of China (No. 2018YFC0213201) and the National Natural Science Foundation of China (No. 41505113).
Conflicts of Interest
The authors declare no conflict of interest.
References
- Atkinson, R. Atmospheric chemistry of VOCs and NOx. Atmos. Environ. 2000, 34, 12–14. [Google Scholar] [CrossRef]
- Guo, H.; Ling, Z.; Cheng, H.; Simpson, I.; Lyu, X.; Wang, X.; Shao, M.; Lu, H.; Ayoko, G.; Zhang, Y.; et al. Tropospheric volatile organic compounds in China. Sci. Total Environ. 2017, 574, 1021–1043. [Google Scholar] [CrossRef]
- Barrett, B.; Raga, G. Variability of winter and summer surface ozone in Mexico City on the intraseasonal timescale. Atmos. Chem. Phys. 2016, 16, 15359–15370. [Google Scholar] [CrossRef]
- Yang, Y.; Shao, M.; Keßel, S.; Li, Y.; Lu, K.; Lu, S.; Williams, J.; Zhang, Y.; Zeng, L.; Nölscher, A.; et al. How the OH reactivity affects the ozone production efficiency: Case studies in Beijing and Heshan, China. Atmos. Chem. Phys. 2017, 17, 7127–7142. [Google Scholar] [CrossRef]
- Kleinman, L.; Daum, P.; Lee, Y.; Nunnermacker, L.; Springston, S.; Weinstein-Lloyd, J.; Rudolph, J. A comparative study of ozone production in five U.S. metropolitan areas. J. Geophys. Res. Atmos. 2005, 110, D02301. [Google Scholar] [CrossRef]
- Zhang, Y.; Su, H.; Zhong, L.; Cheng, Y.; Zeng, L.; Wang, X.; Xiang, Y.; Wang, J.; Gao, D.; Shao, M.; et al. Regional ozone pollution and observation-based approach for analyzing ozone–precursor relationship during the PRIDE-PRD2004 campaign. Atmos. Environ. 2008, 42, 6203–6218. [Google Scholar] [CrossRef]
- Tan, Z.; Lu, K.; Dong, H.; Hu, M.; Li, X.; Liu, Y.; Lu, S.; Shao, M.; Su, R.; Wang, H.; et al. Explicit diagnosis of the local ozone production rate and the ozone-NOx-VOC sensitivities. Sci. Bull. 2018, 63, 1067–1076. [Google Scholar] [CrossRef]
- Kansal, A. Sources and reactivity of NMHCs and VOCs in the atmosphere: A review. J. Hazard. Mater. 2009, 166, 17–26. [Google Scholar] [CrossRef]
- Li, M.; Zhang, Q.; Zheng, B.; Tong, D.; Lei, Y.; Liu, F.; Hong, C.; Kang, S.; Yan, L.; Zhang, Y.; et al. Persistent growth of anthropogenic non-methane volatile organic compound (NMVOC) emissions in China during 1990–2017: Drivers, speciation and ozone formation potential. Atmos. Chem. Phys. 2019, 19, 8897–8913. [Google Scholar] [CrossRef]
- Gentner, D.; Harley, R.; Miller, A.; Goldstein, A. Diurnal and seasonal variability of gasoline-related volatile organic compound emissions in Riverside, California. Environ. Sci. Technol. 2009, 43, 4247–4252. [Google Scholar] [CrossRef]
- Gentner, D.; Jathar, S.; Gordon, T.; Bahreini, R.; Day, D.; El Haddad, I.; Hayes, P.; Pieber, S.; Platt, S.; de Gouw, J.; et al. Review of urban secondary organic aerosol formation from gasoline and diesel motor vehicle emissions. Environ. Sci. Technol. 2017, 51, 1074–1093. [Google Scholar] [CrossRef] [PubMed]
- Song, C.; Liu, B.; Dai, Q.; Li, H.; Mao, H. Temperature dependence and source apportionment of volatile organic compounds (VOCs) at an urban site on the north China plain. Atmos. Environ. 2019, 207, 167–181. [Google Scholar] [CrossRef]
- Zhang, Y.; Wang, X.; Zhang, Z.; Lu, S.; Shao, M.; Lee, F.; Yu, J. Species profiles and normalized reactivity of volatile organic compounds from gasoline evaporation in China. Atmos. Environ. 2013, 79, 110–118. [Google Scholar] [CrossRef]
- Yuan, Z.; Lau, A.; Shao, M.; Louie, P.; Liu, S.; Zhu, T. Source analysis of volatile organic compounds by positive matrix factorization in urban and rural environments in Beijing. J. Geophys. Res. Atmos. 2009, 114, D00G15. [Google Scholar] [CrossRef]
- Liu, Y.; Wang, H.; Jing, S.; Gao, Y.; Peng, Y.; Lou, S.; Cheng, T.; Tao, S.; Li, L.; Li, J.; et al. Characteristics and sources of volatile organic compounds (VOCs) in Shanghai during summer: Implications of regional transport. Atmos. Environ. 2019, 215, 116902. [Google Scholar] [CrossRef]
- Cardelino, C.; Chameides, W. An observation-based model for analyzing ozone precursor relationships in the urban atmosphere. J. Air Waste Manag. Assoc. 1995, 45, 161–180. [Google Scholar] [CrossRef]
- Norris, G.; Duvall, R.; Brown, S.; Bai, S. EPA Positive Matrix Factorization (PMF) 5.0 Fundamentals and User Guide; EPA/600/R-14/108 (NTIS PB2015–105147); U.S. Environmental Protection Agency: Washington, DC, USA, 2014. [Google Scholar]
- Wang, T.; Xue, L.; Brimblecombe, P.; Lam, Y.; Li, L.; Zhang, L. Ozone pollution in China: A review of concentrations, meteorological influences, chemical precursors, and effects. Sci. Total Environ. 2017, 575, 1582–1596. [Google Scholar] [CrossRef] [PubMed]
- de Gouw, J.; Middlebrook, A.; Warneke, C.; Goldan, P.; Kuster, W.; Roberts, J.; Fehsenfeld, F.; Worsnop, D.; Canagaratna, M.; Pszenny, A.; et al. Budget of organic carbon in a polluted atmosphere: Results from the New England Air Quality Study in 2002. J. Geophys. Res. Atmos. 2005, 110, D16305. [Google Scholar] [CrossRef]
- Song, C.; Liu, Y.; Sun, L.; Zhang, Q.; Mao, H. Emissions of volatile organic compounds (VOCs) from gasoline- and liquified natural gas (LNG)-fueled vehicles in tunnel studies. Atmos. Environ. 2020, 234, 117626. [Google Scholar] [CrossRef]
- Mo, Z.; Shao, M.; Lu, S. Compilation of a source profile database for hydrocarbon and OVOC emissions in China. Atmos. Environ. 2016, 143, 209–217. [Google Scholar] [CrossRef]
- Cao, X.; Yao, Z.; Shen, X.; Ye, Y.; Jiang, X. On-road emission characteristics of VOCs from light-duty gasoline vehicles in Beijing, China. Atmos. Environ. 2016, 124, 146–155. [Google Scholar] [CrossRef]
- Yuan, B.; Shao, M.; Lu, S.; Wang, B. Source profiles of volatile organic compounds associated with solvent use in Beijing, China. Atmos. Environ. 2010, 44, 1919–1926. [Google Scholar] [CrossRef]
- Wang, H.; Qiao, Y.; Chen, C.; Lu, J.; Dai, H.; Qiao, L.; Lou, S.; Huang, C.; Li, L.; Jing, S.; et al. Source profiles and chemical reactivity of volatile organic compounds from solvent use in Shanghai, China. Aerosol Air Qual. Res. 2014, 14, 301–310. [Google Scholar] [CrossRef]
- Guenther, A.; Karl, T.; Harley, P.; Wiedinmyer, C.; Palmer, P.; Geron, C. Estimates of global terrestrial isoprene emissions using MEGAN (Model of Emissions of Gases and Aerosols from Nature). Atmos. Chem. Phys. 2006, 6, 3181–3210. [Google Scholar] [CrossRef]
- Mo, Z.; Shao, M.; Wang, W.; Liu, Y.; Wang, M.; Lu, S. Evaluation of biogenic isoprene emissions and their contribution to ozone formation by ground-based measurements in Beijing, China. Sci. Total Environ. 2018, 627, 1485–1494. [Google Scholar] [CrossRef] [PubMed]
- Venecek, M.; Carter, W.; Kleeman, M. Updating the SAPRC maximum incremental reactivity (MIR) scale for the United States from 1988 to 2010. J. Air Waste Manag. Assoc. 2018, 68, 1301–1316. [Google Scholar] [CrossRef]
- Huang, Y.; Mok, W.; Yam, Y.; Zhou, J.; Surawski, N.; Organ, B.; Chan, E.; Mofijur, M.; Mahlia, T.; Ong, H. Evaluating in-use vehicle emissions using air quality monitoring stations and on-road remote sensing systems. Sci. Total Environ. 2020, 740, 139868. [Google Scholar] [CrossRef] [PubMed]
Publisher’s Note: MDPI stays neutral with regard to jurisdictional claims in published maps and institutional affiliations. |
© 2021 by the authors. Licensee MDPI, Basel, Switzerland. This article is an open access article distributed under the terms and conditions of the Creative Commons Attribution (CC BY) license (https://creativecommons.org/licenses/by/4.0/).