Article

A Study on the Mechanisms Accounting for the Generation of a Southwest Vortex That Caused a Series of Severe Disasters during the 2020 Abnormal Meiyu Season

1
Beijing Goldwind Smart Energy Technology Co., Ltd., Beijing 100176, China
2
State Grid Xinjiang Electric Power Co., Ltd., Urumqi 830002, China
3
Hebei Construction & Investment Group New-Energy Co., Ltd., Shijiazhuang 050051, China
4
College of Resources and Environmental Science, South-Central University for Nationalities, Wuhan 430074, China
*
Author to whom correspondence should be addressed.
Atmosphere 2021, 12(5), 556; https://doi.org/10.3390/atmos12050556
Submission received: 21 March 2021 / Revised: 18 April 2021 / Accepted: 23 April 2021 / Published: 26 April 2021
(This article belongs to the Section Meteorology)

Abstract

:
The abnormal 2020 Meiyu season caused the worst disasters over the Yangtze River Valley in recent decades. Of these, the Sichuan Basin (SCB) and its surrounding regions were one of the most severely affected areas. Disastrous weather frequently occurs in these regions, with a large proportion of it closely related to the southwest vortices (SWVs). In order to further the understanding of SWV generation, this study investigated the formation mechanisms of a quasi-stationary SWV (by using two sets of vorticity budgets), which caused torrential rainfall (resulting in flash floods in Sichuan and Chongqing), lightning activities (causing tripping incidents of transmission lines in Sichuan) and strong winds (leading to shutting down of wind turbines in Hubei). Results showed that the SWV was generated in a favorable background environment, during which an upper-tropospheric divergence and a middle-tropospheric warm advection appeared over the SCB. Trajectory analyses and vorticity budget showed that the air particles that came from the lower troposphere of the regions south of the Tibetan Plateau dominated the SWV formation. These air particles experienced notable ascending during which an increase in their cyclonic vorticity occurred mainly due to convergence-related stretching, whereas, tilting mainly decelerated this increase. The air particles sourced from the areas within the key region of the SWV and areas northeast of the key region were the second dominant factor for the vortex formation. Overall, for the air particles that formed the SWV, their most rapid changes of vorticity and divergence appeared in the period 24 h before SWV formation, implying that this was the critical period for the SWV generation.

1. Introduction

Every year, floods cause serious economic losses and heavy casualties in different regions, which make them one of the most serious natural disasters worldwide [1]. For China, on average, the direct economic loss due to floods is around 250 billion RMB each year [2]. According to statistics, the most severe floods of China mainly appeared in the Yangtze River Valley (YRV), due to the heavy precipitation during the Meiyu season [3], such as the famous 1931, 1954, and 1998 floods [4,5]. In summer 2020, the YRV experienced another abnormal Meiyu season [5,6], with its accumulated precipitation breaking the historical record of events since 1961. The 2020 flood caused more than 140 dead/missing and about $12 billion of economic losses [6], which made it the worst flood in recent decades. The Sichuan Basin (SCB) and its surroundings were one of the most severely affected areas during the 2020 Meiyu season, with some sections of the basin experiencing a once-in-a-hundred-year flood [5,6].
Compared to the mean state of 1979–2020, during 2020 June, there existed an upper-level anticyclone anomaly and a middle-level shortwave trough anomaly around the SCB (not shown), which favored heavy rainfall events by enhancing upper-tropospheric divergence and middle-tropospheric warm advection. Synoptic analyses indicated that mesoscale vortices [7] were active in the YRV during the 2020 abnormal Meiyu season [6,8]. Accumulated precipitation associated with the mesoscale vortices (the precipitation within the circle centered at a mesoscale vortex center with a radius of 300 km was regarded as being associated with the mesoscale vortex) was heavy, with some stations exceeding 500 mm (Figure 1a). This indicates that the mesoscale vortices were an important reason for the torrential rainfall events in the SCB and its surrounding areas, which induced severe floods in the 2020 Meiyu season. The mesoscale vortices formed within/around the SCB were named as the southwest vortices (SWVs) by the Chinese meteorologists [9,10,11,12]. This type of vortex is usually located in the lower troposphere and has a radius of 100–300 km [9,10]. In addition to heavy rainfall, the SWVs are also closely related to strong wind and lightning events within/around the SCB [10]. Owing to their great importance, for years, the SWVs have been a research focus for meteorologists at home and abroad [13,14,15,16,17,18,19]. Formation mechanisms of this type of vortex is a key scientific issue in this field. However, as there are numerous types of SWVs [10,11,12,19], which feature notably differences, to reach a comprehensive understanding of SWV generation, more case studies are needed.
During the period of 1800 UTC 26–2200 UTC 27 June 2020, a quasi-stationary SWV appeared in the SCB (Figure 1b,c). This vortex induced torrential rainfall in southern SCB, Chongqing, and Hubei (Figure 1c), with several precipitation centers of above 120 mm (over a period of 28 h) appeared in southern Chongqing as well as southwestern and central Hubei. The torrential rainfall resulted in flash floods in Sichuan and Chongqing; the SWV-associated lightning activities caused tripping incidents of transmission lines in Sichuan; and the strong winds associated with the vortex rendered the shutting down of wind turbines in Hubei. How was this disaster-producing SWV generated? Where did the air particles that formed the SWV come from? The primary aims of this study were to address these two scientific questions, so as to be helpful in rendering a more comprehensive understanding of SWV formation. The remainder of this paper is structured as follows. The data and methods are presented in Section 2, the main results are given in Section 3 and Section 4, and finally, a conclusion is drawn in Section 5.

2. Data and Methods

2.1. Data

The ground station observational precipitation data (http://data.cma.cn/data/detail/dataCode/A.0012.0001.html) was used to analyze the precipitation features during the focused period. The hourly, 0.25° × 0.25° ERA5 reanalysis data from the European Centre for Medium-Range Weather Forecasts (ECMWF) [20] was used in the synoptic analyses, air particle tracking [21], and vorticity budget calculations.

2.2. Methods

As vorticity is an effective indicator of mesoscale vortex [9,10,11,12], this study used the Lagrangian vorticity-budget equation [12,18] to investigate the generation of the SWV. Its expression is as follow:
d ς d t = k V h p × h ω TIL ς + f h V h STR β v + RES APV
where ζ is the vorticity (i.e., relative vorticity, hereinafter the same), (i, j, k) are the unit vectors in the zonal, meridional, and zenith directions, respectively. d d t =   t + V h h + ω p is the Lagrangian derivative, V h = u i + v j is the wind vector in the horizontal direction, p is the pressure, ω is the vertical velocity in the p coordinate, h = x i + y j is the gradient operator, f is the Coriolis parameter, and β is the meridional derivative of the Coriolis parameter. Term TIL denotes the vorticity variation due to the tilting effect, term STR represents the vorticity produce/extinction due to vertical stretching/shrinking, and term APV stands for the vorticity variation due to advection of planetary vorticity. RES denotes the residual effect that is mainly caused by friction, calculation errors, and subgrid processes. This study used the ratio of TIL + STR + APV to the Lagrangian derivative to check whether Equation (1) was well balanced. The results indicated that during the period from 1800 UTC 23 to 1800 UTC 26 June 2020, this ratio was mainly between 0.9 to 1.21 (i.e., the relative error was from 10% to 21%), implying that the balance of Equation (1) was in a relatively good balanced state, and thus the budget results could be used for further studies.
This study used the HYSPLIT model [21], which was developed by the National Oceanic and Atmospheric Administration (NOAA), for determining air parcel trajectories. This model is a complete system for computing simple air parcel trajectories, as well as the complex transports, dispersions, chemical transformations, and deposition simulations. After tracking the air parcel trajectories, the vorticity budget was conducted along these trajectories to show their vorticity variations. This type of along-track vorticity budget is an effective way to understand vortex formation [12,18].

3. Overview of the Event and Synoptic Analyses

During the abnormal 2020 Meiyu season, SWVs were active, which caused a series of torrential rainfall events within/around the SCB (Figure 1a). Of these, an SWV formed at 1800 UTC 26 June 2020 (Figure 1b,c), maintained a quasi-stationary behavior during its life span (as the black solid line with black dots in Figure 1c shows, the vortex mainly hovered within the SCB), and dissipated at 2200 UTC 27 June 2020. East of the vortex, there was a zonally stretched lower-level shear line, which also induced heavy precipitation (Figure 1b,c). In total, this vortex was maintained for ~28 h, and caused an accumulated precipitation center of above 60 mm in south Sichuan (Figure 1c), two centers of above 120 mm in south Chongqing, and three centers of above 160 mm in Hubei. Strong winds associated with the SWV mainly appeared in the regions south and southeast of the vortex (Figure 1b), where the low-level jet was strong. The strong winds caused the crops to fall and wind turbines to shut down, both of which resulted in large economic losses.
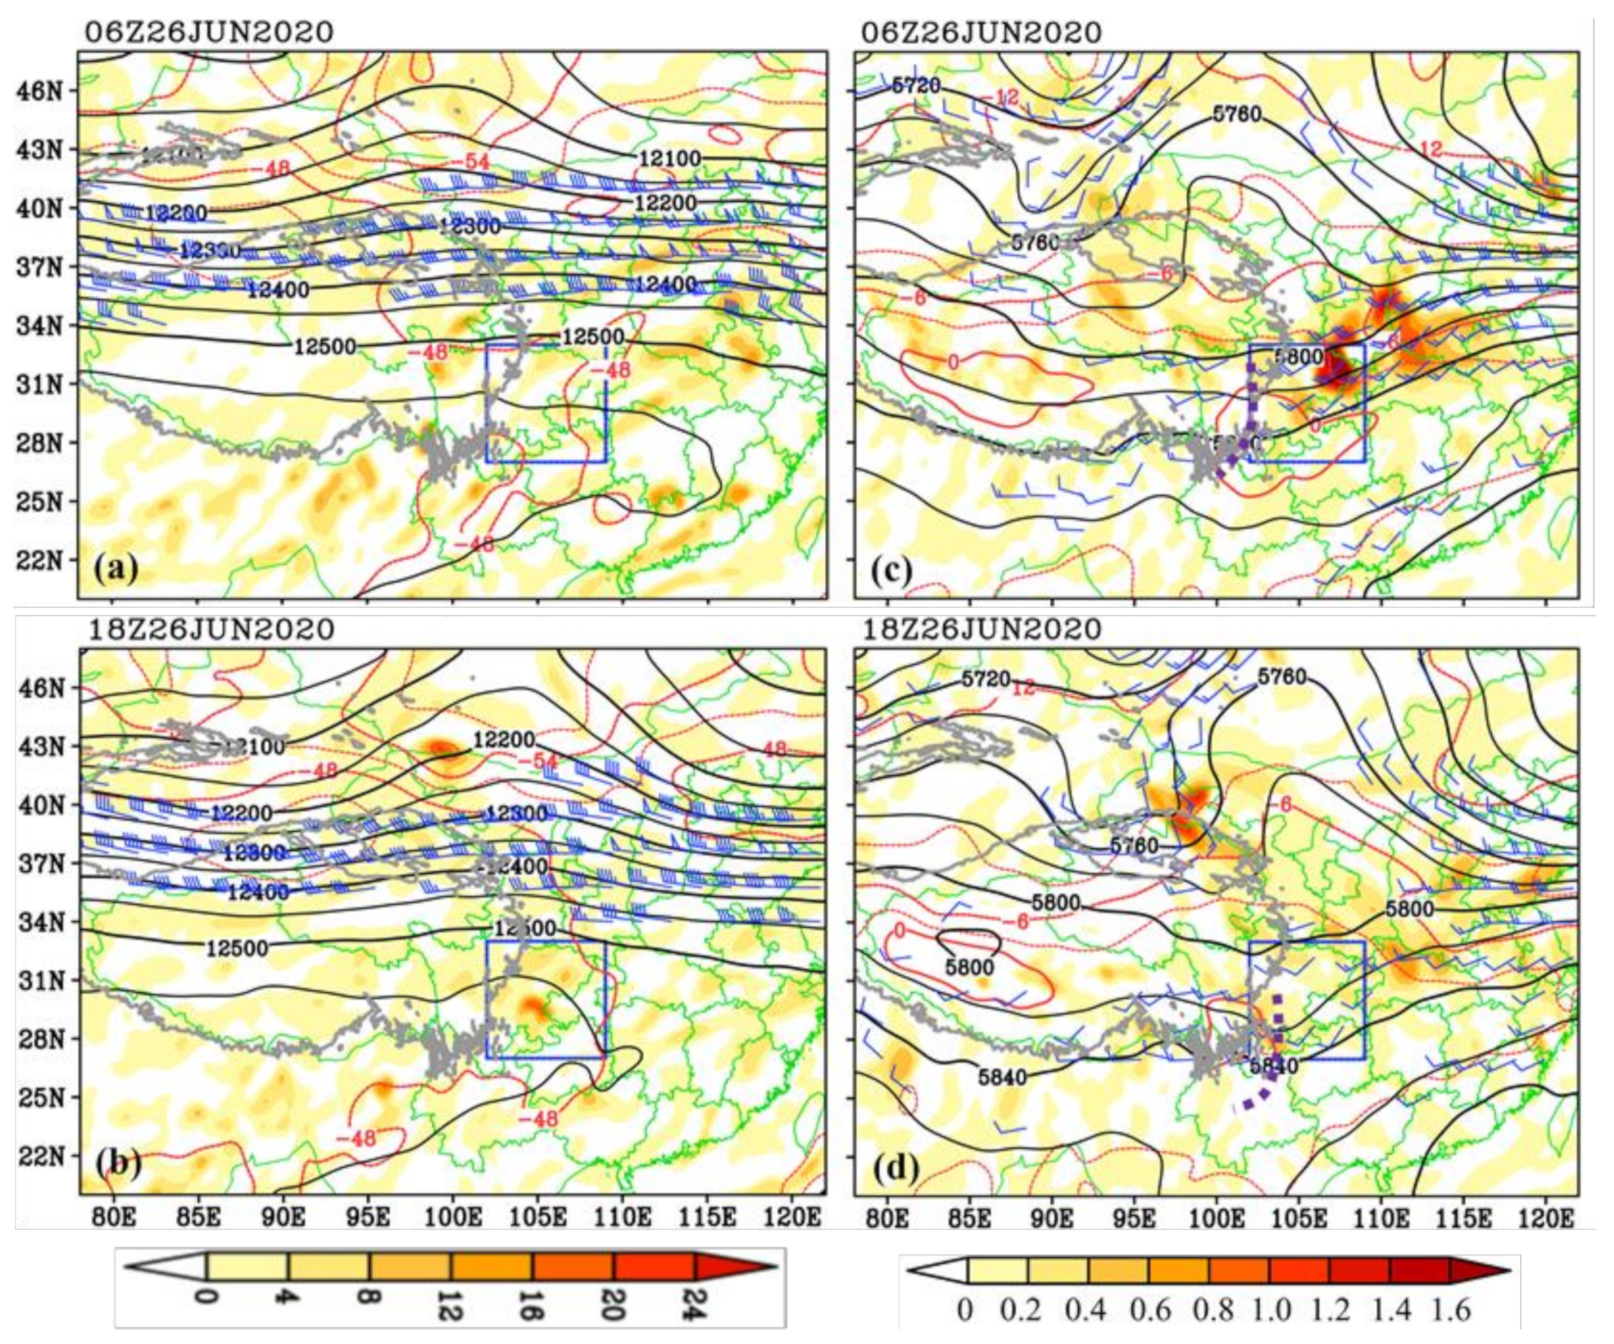
Synoptic analyses indicate that the SWV was generated in a favorable background environment. In the upper troposphere, over the SCB, there was a notable divergence zone (Figure 2a,b), which was located northeast of the South Asia high and south of an upper-level jet (34–43° N). The upper-level divergence was conducive to maintaining ascending motions in the middle and lower troposphere due to the continuity of fluid [22]. In the middle troposphere, a notable warm advection, which was situated ahead of a middle tropospheric shortwave trough east of the Tibetan Plateau controlled the SCB (Figure 2c,d). The middle-level warm advection mainly contributed to the SWV’s formation in two aspects: (i) it was conducive to lowering pressure near the surface [23], and (ii) it acted to promote ascending motions in the lower and middle levels due to quasi-geostrophic forcing [22,23].
The SWV is a type of shallow three-dimensional vortex [10,19], which means that its vertical extent (i.e., the range between the bottom and top of a vortex) is small. As Figure 3a–d show, in this study, the SWV mainly stretched from 850 hPa to 700 hPa at the time when it formed. The SWV had a strong cyclonic vorticity center in its central region, with strong winds surrounding it. In order to focus on the SWV, a key region was defined as the black dashed box illustrated in Figure 3a. This box was determined according to the horizontal size of the SWV (i.e., it could cover the main body of the SWV when it formed). Before using this box for calculation, a sensitivity test was conducted to check whether relatively small size changes of the key region could lead to notable changes in the calculation results. Results of the sensitivity test indicated that the calculation results were insensitive to relatively small size changes (±0.25° to each boundary) to the key region (not shown). This implies that the key-region associated calculation results were representative of the SWV’s formation. Figure 3e illustrates the key-region averaged features, from which it is clear that, the SWV’s key region featured notable cyclonic vorticity and convergence. The maximum convergence appeared in the layer of 875–775 hPa, and the maximum cyclonic vorticity was located at levels of 850–650 hPa, which was consistent with the vertical extent of the vortex. The vertical configuration of convergence and cyclonic vorticity (i.e., the former was located at a lower lay than that of the latter) confirmed the importance of convergence and vertical transport in producing the SWV (Section 4.3).

4. Main Results

4.1. Trajectory Analysis

In order to clarify where the air particles that formed the SWV came from, we conducted a trajectory analysis by using the HYSLPIT model [21]. Hourly ERA5 reanalysis data was used in the model and a total of 589 points (at a horizontal resolution of 0.25° × 0.25°) that were evenly distributed within the SWV’s key region were used in the backward tracking. The start time was set at 1800 UTC 26 June 2020, and a period of 72 h was used in the backward tracking. The start locations of the tracking were at 750 hPa (as Figure 3e shows, 750 hPa was the central level of the SWV in this study where its maximum cyclonic vorticity appeared, and therefore this level could represent the SWV’s formation effectively) within the key region. Since the mean height of 750 hPa is about 2500 m above sea level, we defined the levels with a height of between 2000 m and 3000 m as the levels similar (LSM) to 750 hPa. The levels with a height of above 3000 m were defined as the levels above (LAB) 750 hPa, and the levels with a height of below 2000 m were defined as the levels below (LBE) 750 hPa.
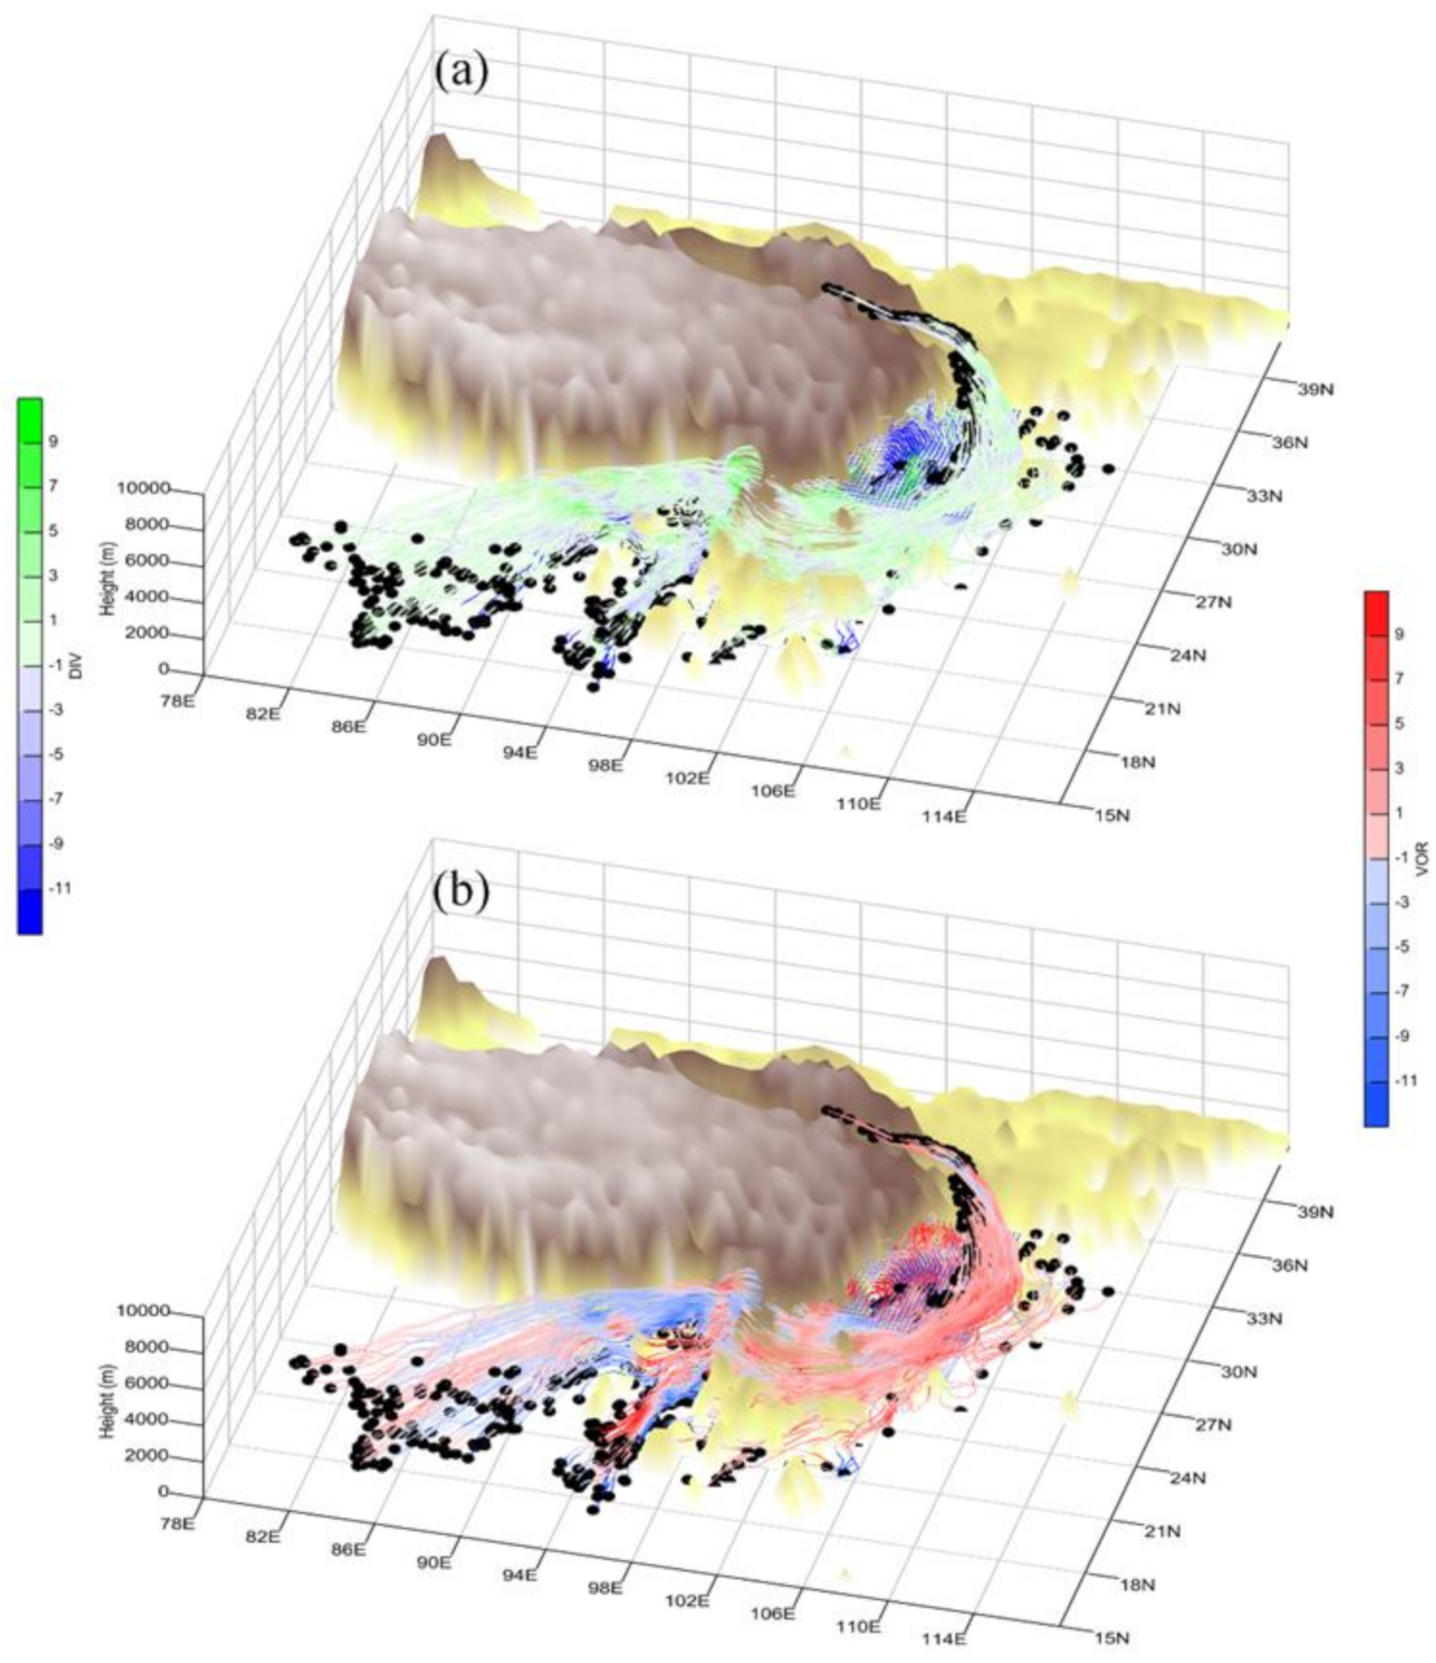
As Figure 4 shows, air particles that formed the SWV mainly came from the regions outside the key region (they accounted for ~95.2% of the total air particles), and the air particles that originated from the key region only occupied a proportion of ~4.8%. Around 69.6% of these air particles came from the LBE (of these, the lowest height was close to 0 m above sea level), ~14.9% came from the LSM, and the remaining ~15.5% came from the LAB (of these, the highest air particle came from a height of around 5416 m above sea level, which was located over the Tibetan Plateau). During moving, vorticity and divergence of these air particles changed greatly. In order to analyze these changes quantitatively, we classified the air particles into four main types according to their initial (i.e., 1800 UTC 26 June 2020) states (at this time they were all within the SWV’s key region) in the backward tracking: (i) the negative (NEG) type, which had anticyclonic vorticity (negative values in the Northern Hemisphere) at the time when the vortex formed (they were detrimental for the vortex’s formation); (ii) the positive-LBE (PSO-LBE) type, which had cyclonic vorticity (positive values in the Northern Hemisphere) at the time when the vortex formed, while these air particles came from the LBE. (iii) the PSO-LSM type, which was the same as (ii) but came from the LSM. (iv) the PSO-LAB type, which was the same as (ii) but came from the LAB.
As Table 1 shows, the NEG type accounted for 33% in the total air particles that formed the SWV. These air particles contributed ~20.2% to the final (i.e., at the time when the SWV formed) key-region averaged vorticity, which was detrimental for the SWV’s formation. This type of air particles overall experienced a weak lifting in their height during the 72-h moving, with their vorticity decreased whereas divergence increased. All the POS-LAB, POS-LSM, and POS-LBE types of air particles were favorable for the SWV’s formation, as they all had cyclonic vorticity when the vortex formed. Of these, the POS-LBE occupied the largest proportion in number (49.1%) (Table 1) and in final vorticity (88.3%). These air particles showed notable ascending (~1825 m) during their moving, and their cyclonic vorticity and convergence both increased (Table 1). The POS-LSM type of air particles ranked second place in contributing to the vortex’s formation, as their proportion in the final vorticity was 21.8%. However, the number of this type of air particles was the smallest of all the four types, implying that the cyclonic vorticity associated with this type was the strongest. These air particles only experienced weak ascending motions (~98 m) during moving, with their cyclonic vorticity and convergence enhanced. The POS-LAB type of air particles contributed the least (10.1%) to the cyclonic vorticity within the key region (Table 1), whereas, their proportion in number was larger than that of the POS-LSM type. Overall, this type of air particles had the smallest cyclonic vorticity, and remarkable lowering in height during their moving (Table 1). Their enhancement in cyclonic vorticity and convergence were also the smallest of the three types (i.e., POS-LAB, POS-LSM, and POS-LBE).

4.2. Vorticity Budget ALONG Trajectories

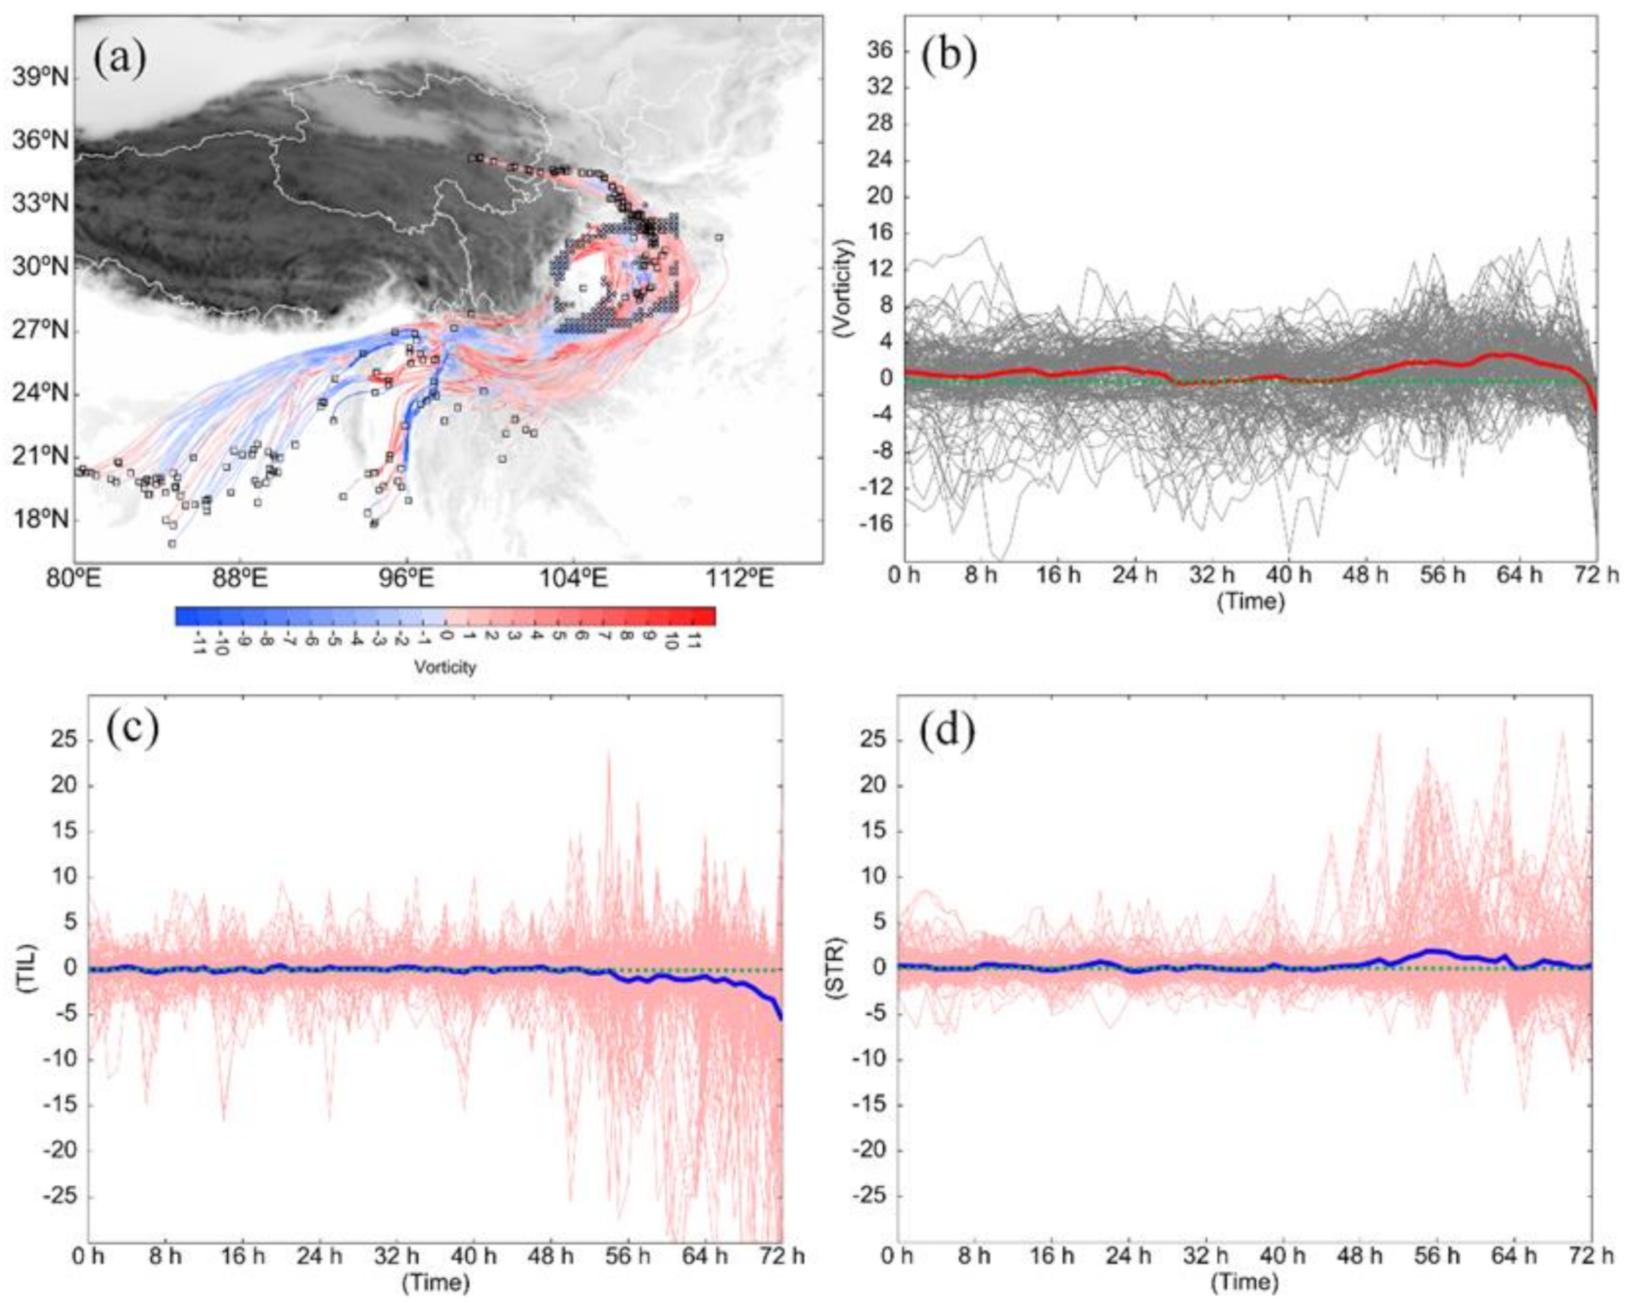
For the NEG type of air particles, there were mainly two sources (small black open boxes in Figure 5a): one was located in the regions south of the Tibetan Plateau, with an initial height of lower than 2000 m; and the other was situated over the northeastern section of the Tibetan Plateau, with a height of more than 4000 m. Final locations of these air particles were mainly located in the marginal area of the SCB (small black open circles in Figure 5a). Vorticity variation associated with this type of air particles (thick red line in Figure 5b) shows that, from 0 h (1800 UTC 23 June 2020) to 28 h (2200 UTC 24 June 2020), these air particles mainly had cyclonic vorticity (Figure 5b); from 29 h (2300 UTC 24 June 2020) to 46 h (1600 UTC 25 June 2020), their vorticity was mainly around 0; from 47 h (1700 UTC 25 June 2020) to 63 h (0900 UTC 26 June 2020), their vorticity became positive and kept increasing; and from 64 h (1000 UTC 26 June 2020) to 72 h (1800 UTC 26 June 2020, when the SWV formed), their vorticity decreased rapidly. From Figure 5c,d it can be seen that, terms TIL and STR were generally weak before 47 h, and then from 48 h on, they became stronger, as ascending motions and convergence were more intense around the SCB (not shown). Overall, tilting (i.e., TIL) dominated the decreasing of cyclonic vorticity of the NEG type of air particles (Figure 5c) during the period of 64–72 h, whereas, stretching (i.e., STR) mainly acted as maintaining their cyclonic vorticity (Figure 5d).
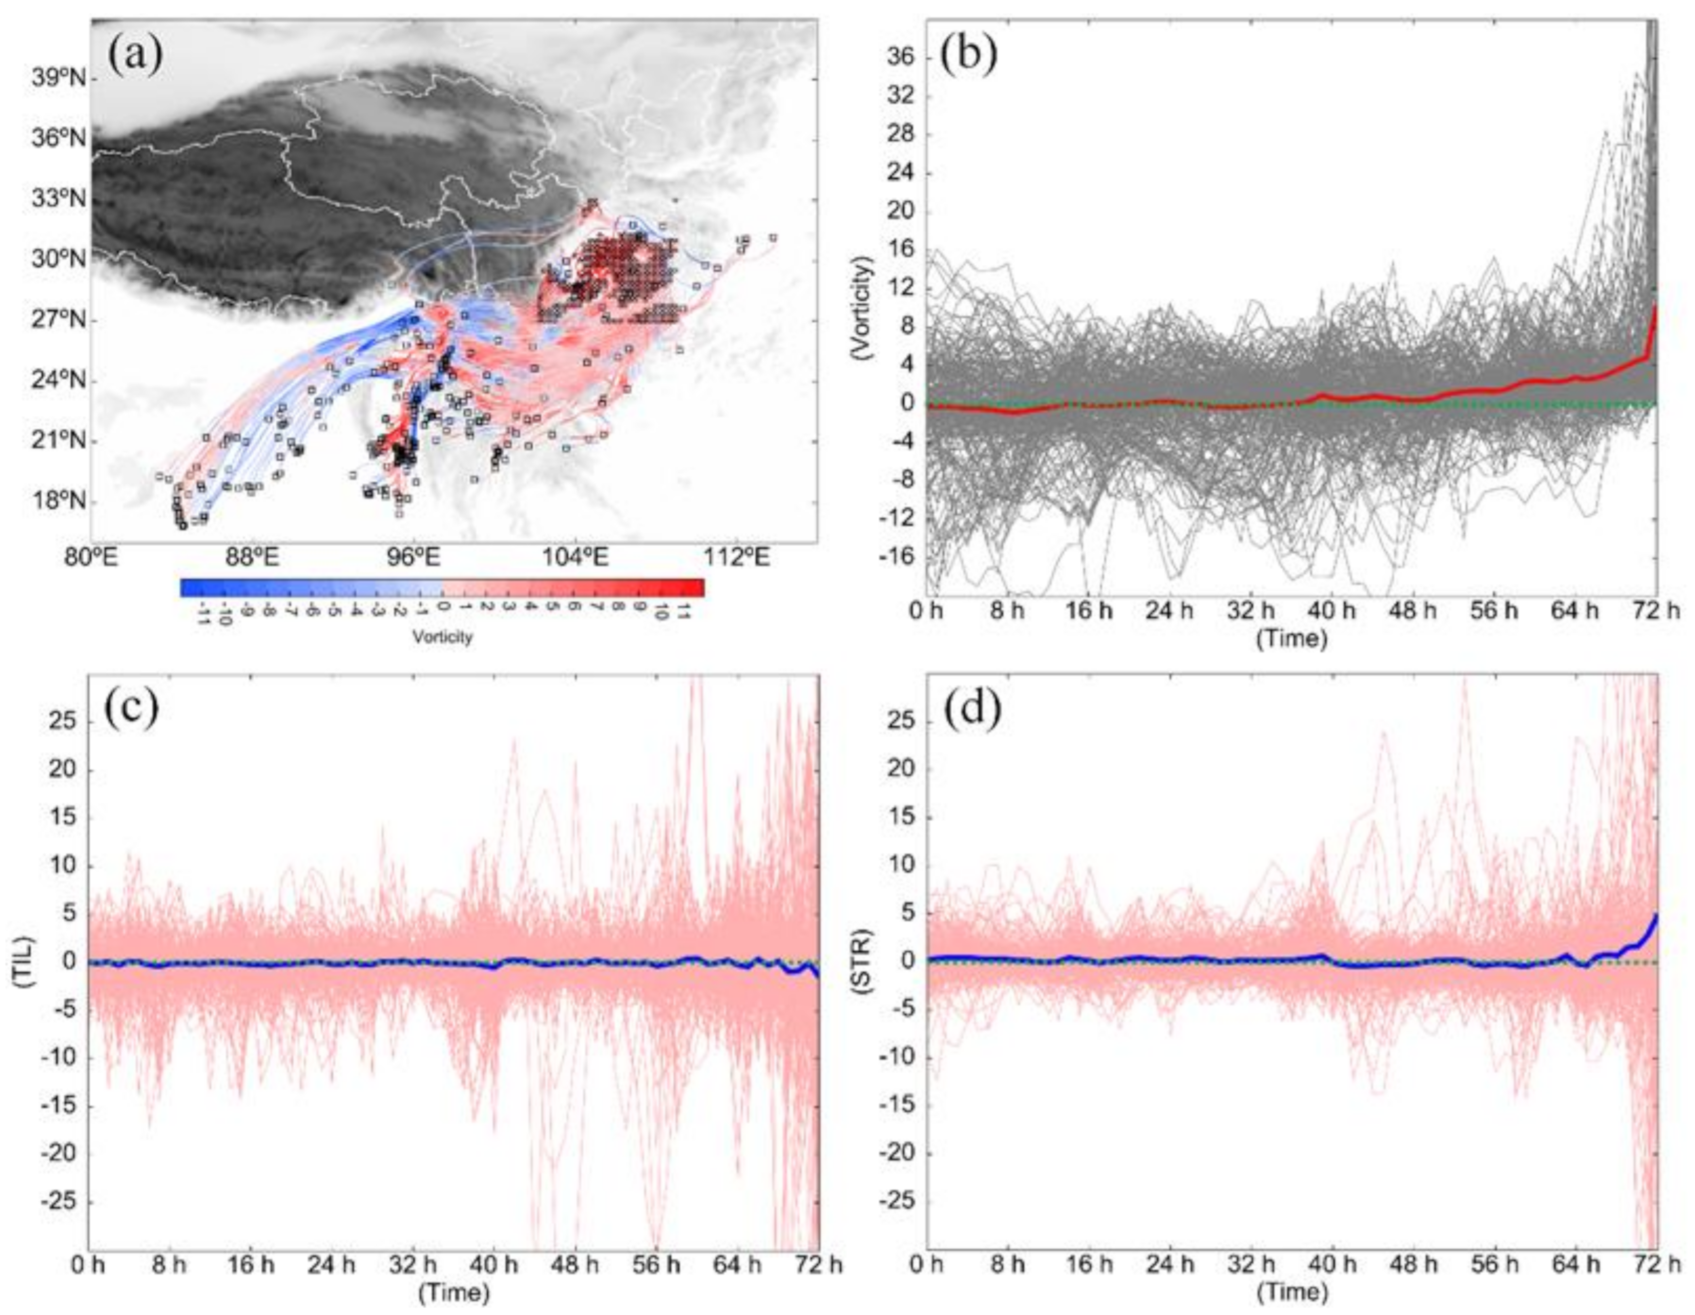
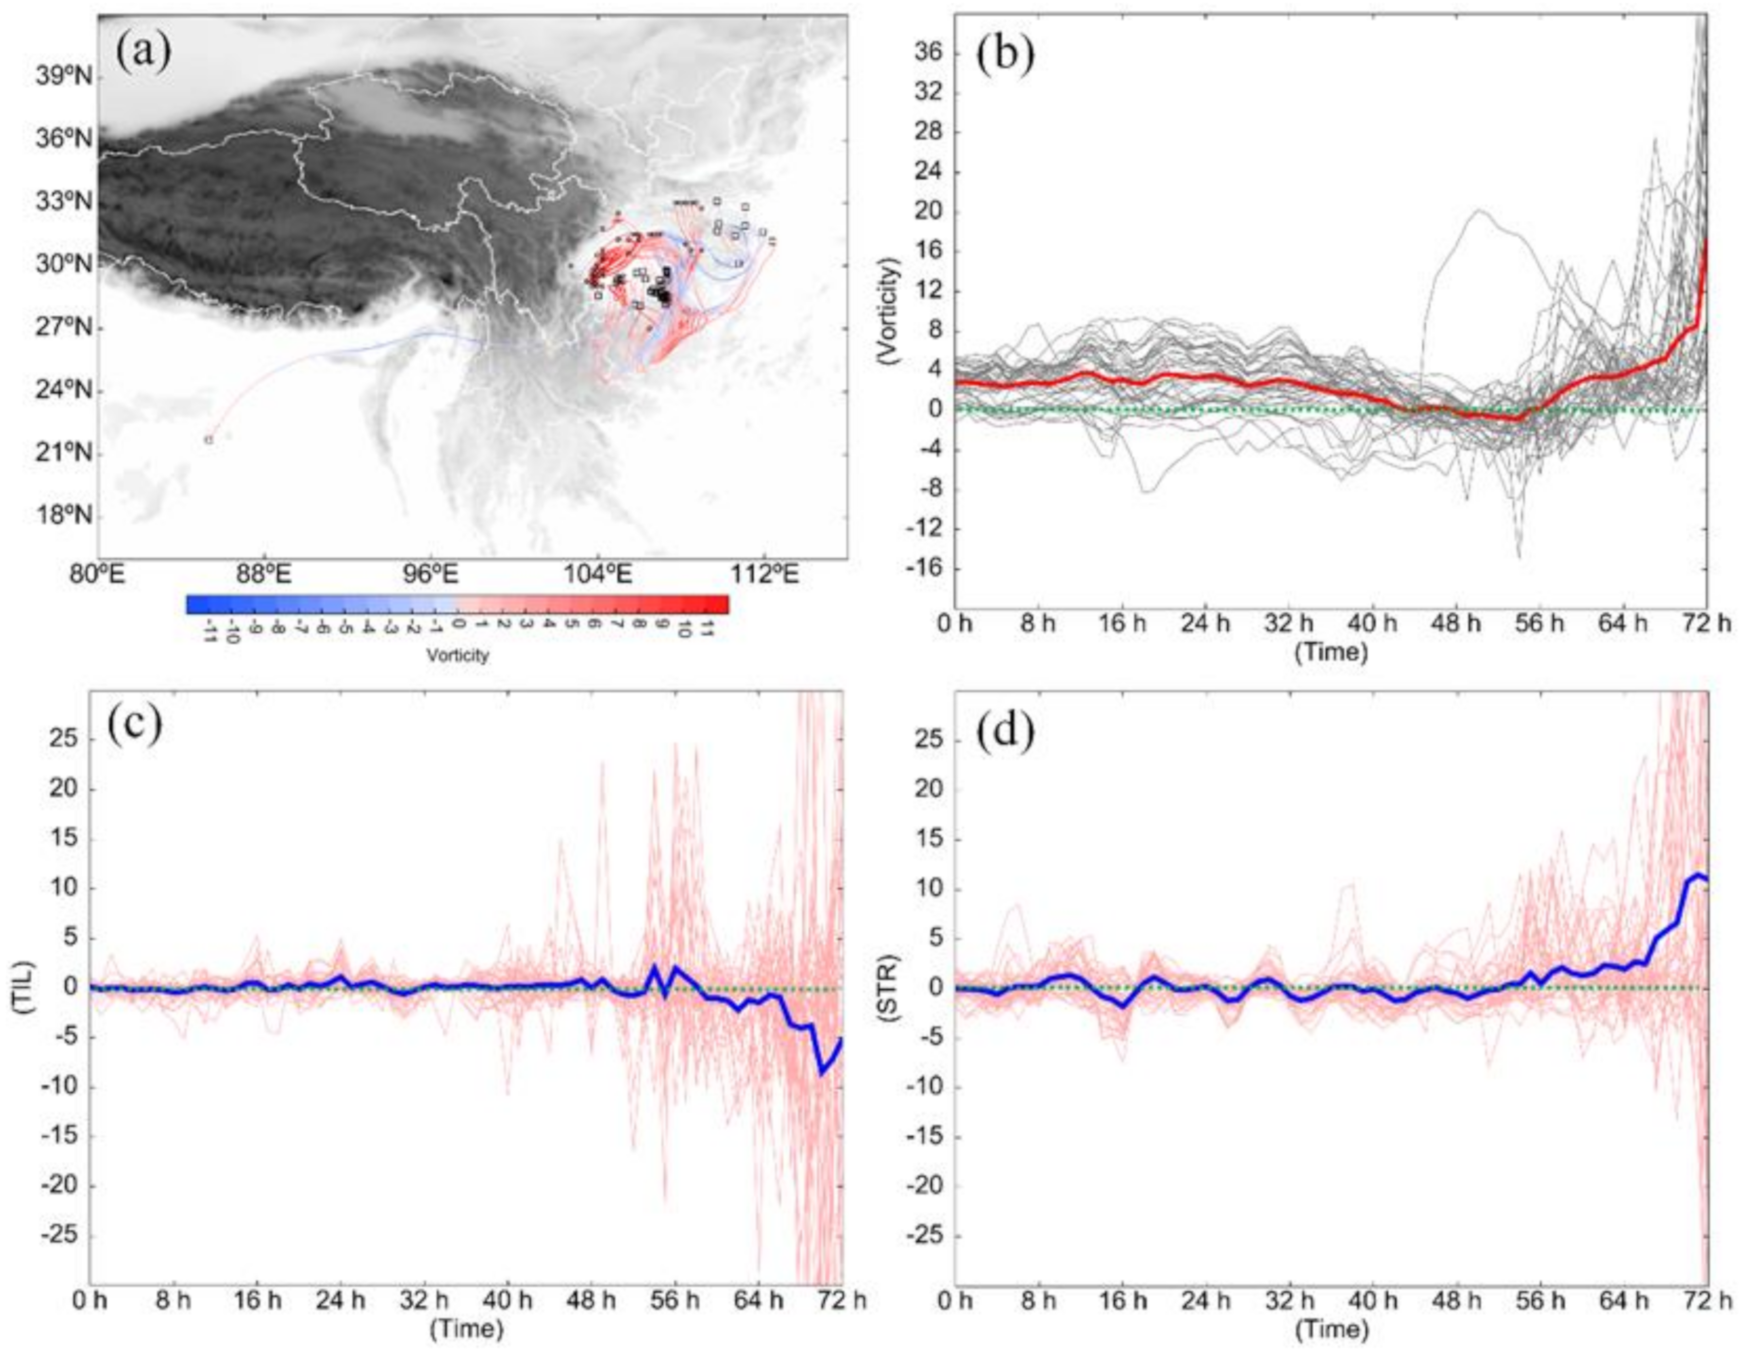
For the POS-LBE type of air particles, they mainly came from the regions south of the Tibetan Plateau (small black open boxes in Figure 6a), and their initial height was generally below 1000 m. Final locations of these air particles were mainly located within the central area of the SCB (small black open circles in Figure 6a), which was also the central region for the SWV (Figure 3b). Vorticity associated with these air particles (thick red line in Figure 6b) was mainly around 0 or negative before 38 h (0800 UTC 25 June 2020); from 39 h (0900 UTC 25 June 2020) to 49 h (1900 UTC 25 June 2020), their vorticity changed to weakly positive; from 50 h (2000 UTC 25 June 2020) to the SWV’s formation time (i.e., 72 h), their cyclonic vorticity increased rapidly. From 50 h to 68 h, positive effects and negative effects appear alternately for both TIL and STR (Figure 6c,d). Calculation indicates that during this period, the total effect of TIL was weakly positive (not shown), which was conducive to enhancing cyclonic vorticity, whereas, the total effect of STR was weakly negative (not shown) which decreased cyclonic vorticity. From 68 h to 72 h, cyclonic vorticity associated with the POS-LBE type of air particles increased rapidly (Figure 6b) which was mainly due to STR (Figure 6d). In contrast, during the same period, TIL stayed weakly negative (Figure 6c), mainly acting to decelerate the cyclonic vorticity’s increase.
For the POS-LSM types of air particles, they mainly came from regions within the key region of the SWV, and areas northeast of the key region (small black open boxes in Figure 7a). Final locations of these air particles were mainly located in the western section of the SCB (small black open circles in Figure 7a). As the thick red line of Figure 7b shows, vorticity of these air particles was positive during the period of 0 h (1800 UTC 23 June 2020)–42 h (1200 UTC 25 June 2020); from 43 h (1300 UTC 25 June 2020) to 55 h (0100 UTC 26 June 2020), their vorticity changed to negative; and then from 56 h to the SWV’s formation time (i.e., 72 h), cyclonic vorticity associated with these air particles increased rapidly. Term STR (Figure 7d) was the primary reason for this rapid increase. In contrast, term TIL (Figure 7c) was the most detrimental factor for the enhancement of the cyclonic vorticity.
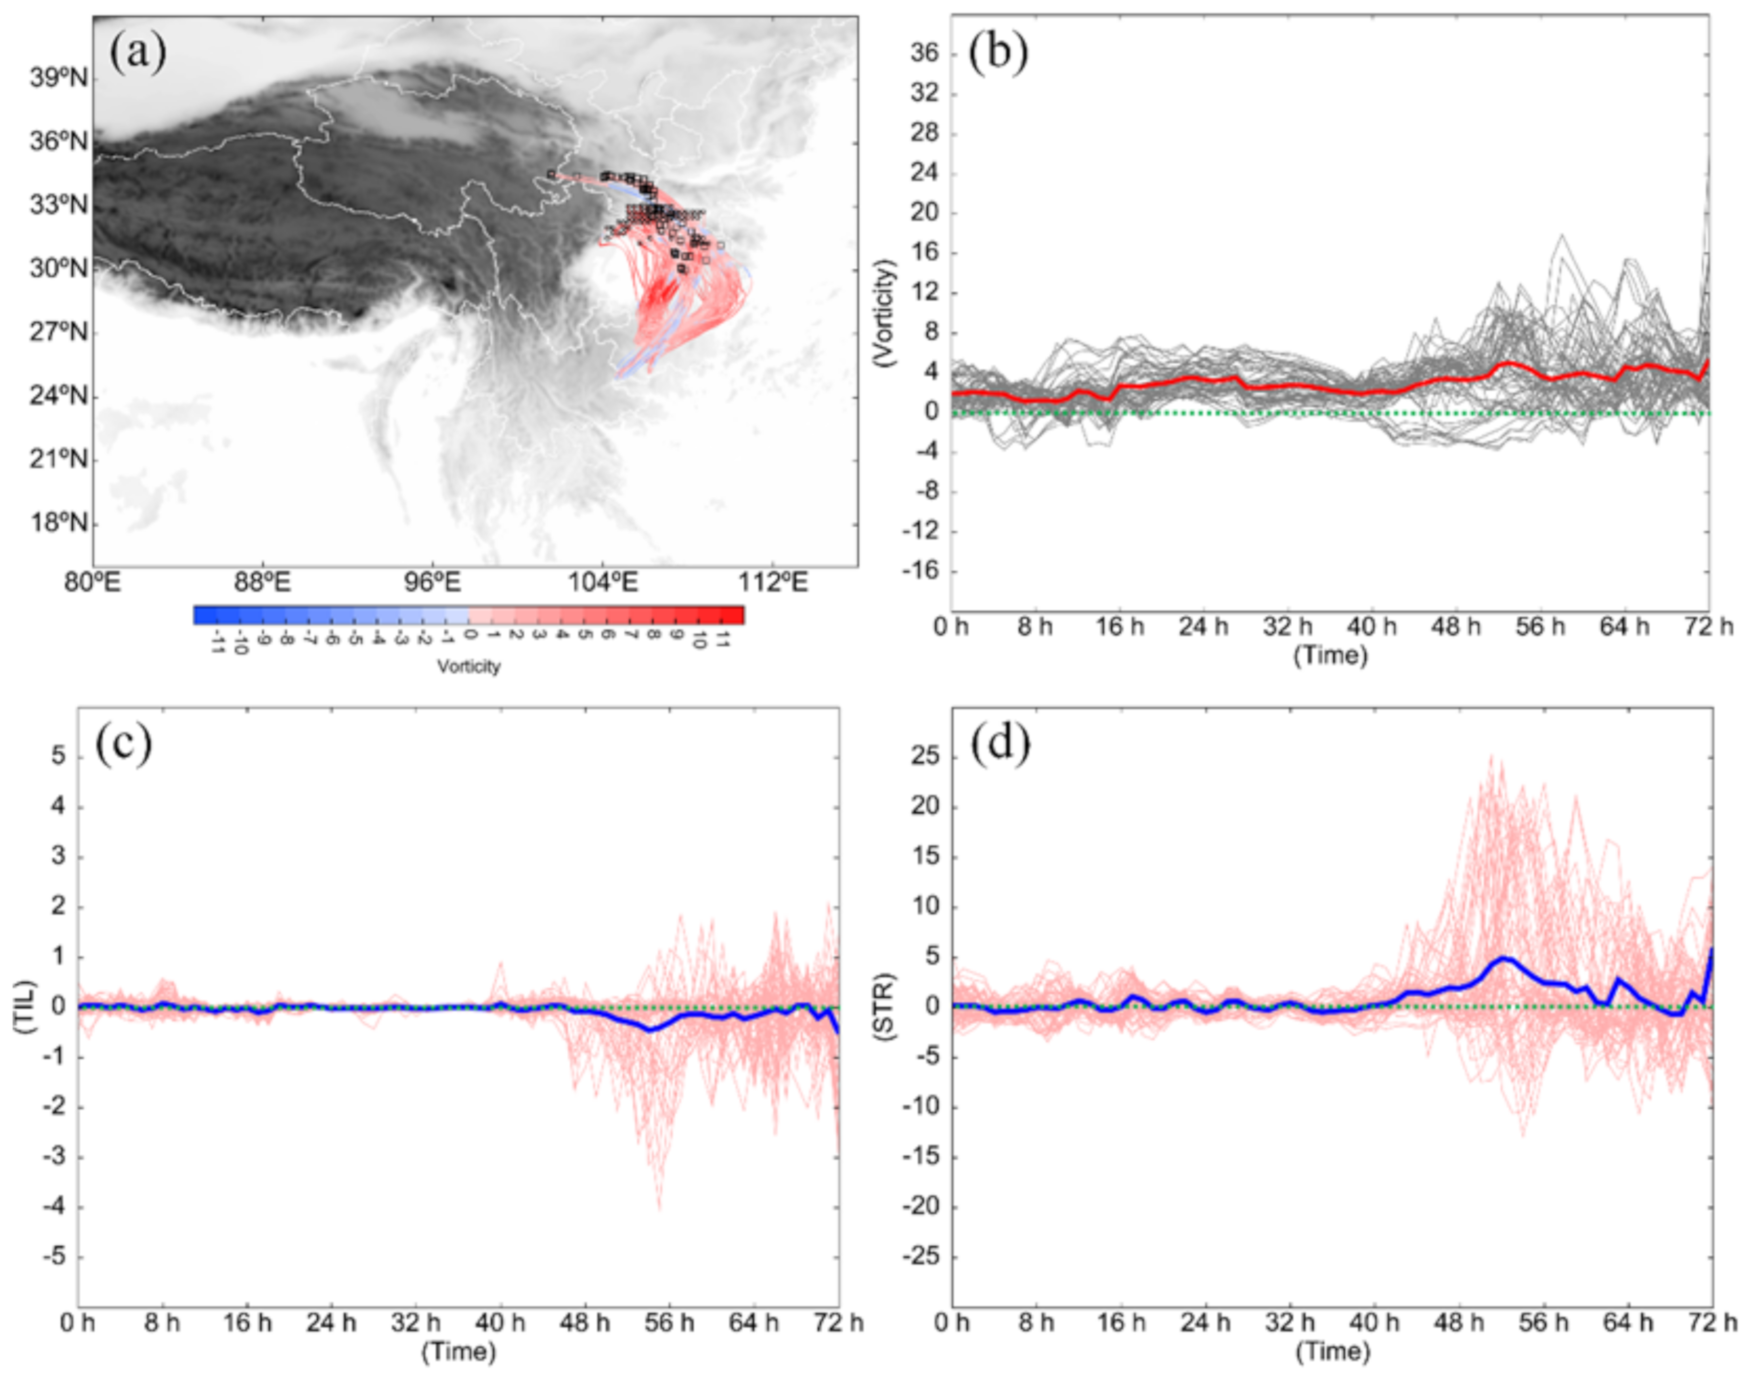
For the POS-LAB types of air particles, they mainly came from regions northeast of the Tibetan Plateau (with an initial height of above 4000 m) and the areas northeast of the key region (small black open boxes in Figure 8a). Final locations of these air particles were mainly located in the northern section of the SCB (small black open circles in Figure 8a). These air particles kept a cyclonic vorticity during their 72-h moving (Figure 8b), with a slow increase in vorticity appearing from 40 h (1000 UTC 25 June 2020) to the SWV’s formation time (i.e., 72 h). STR dominated this slow increase (Figure 8d), whereas TIL acted conversely (Figure 8c).

4.3. Vorticity Budget within the Key Region

As discussed in Section 2.2, the Lagrangian derivative d ζ d t and the Euler derivative ζ   t have this relationship: d ζ d t = ζ   t + V h h ζ + ω ζ p . Taking this into Equation (1) we get the following expression [9,12,24,25]:
ζ t = V h h ζ HAV ω ζ p VAV + k ( V h p × h ω ) TIL ζ + f h V h STR β v + RES APV
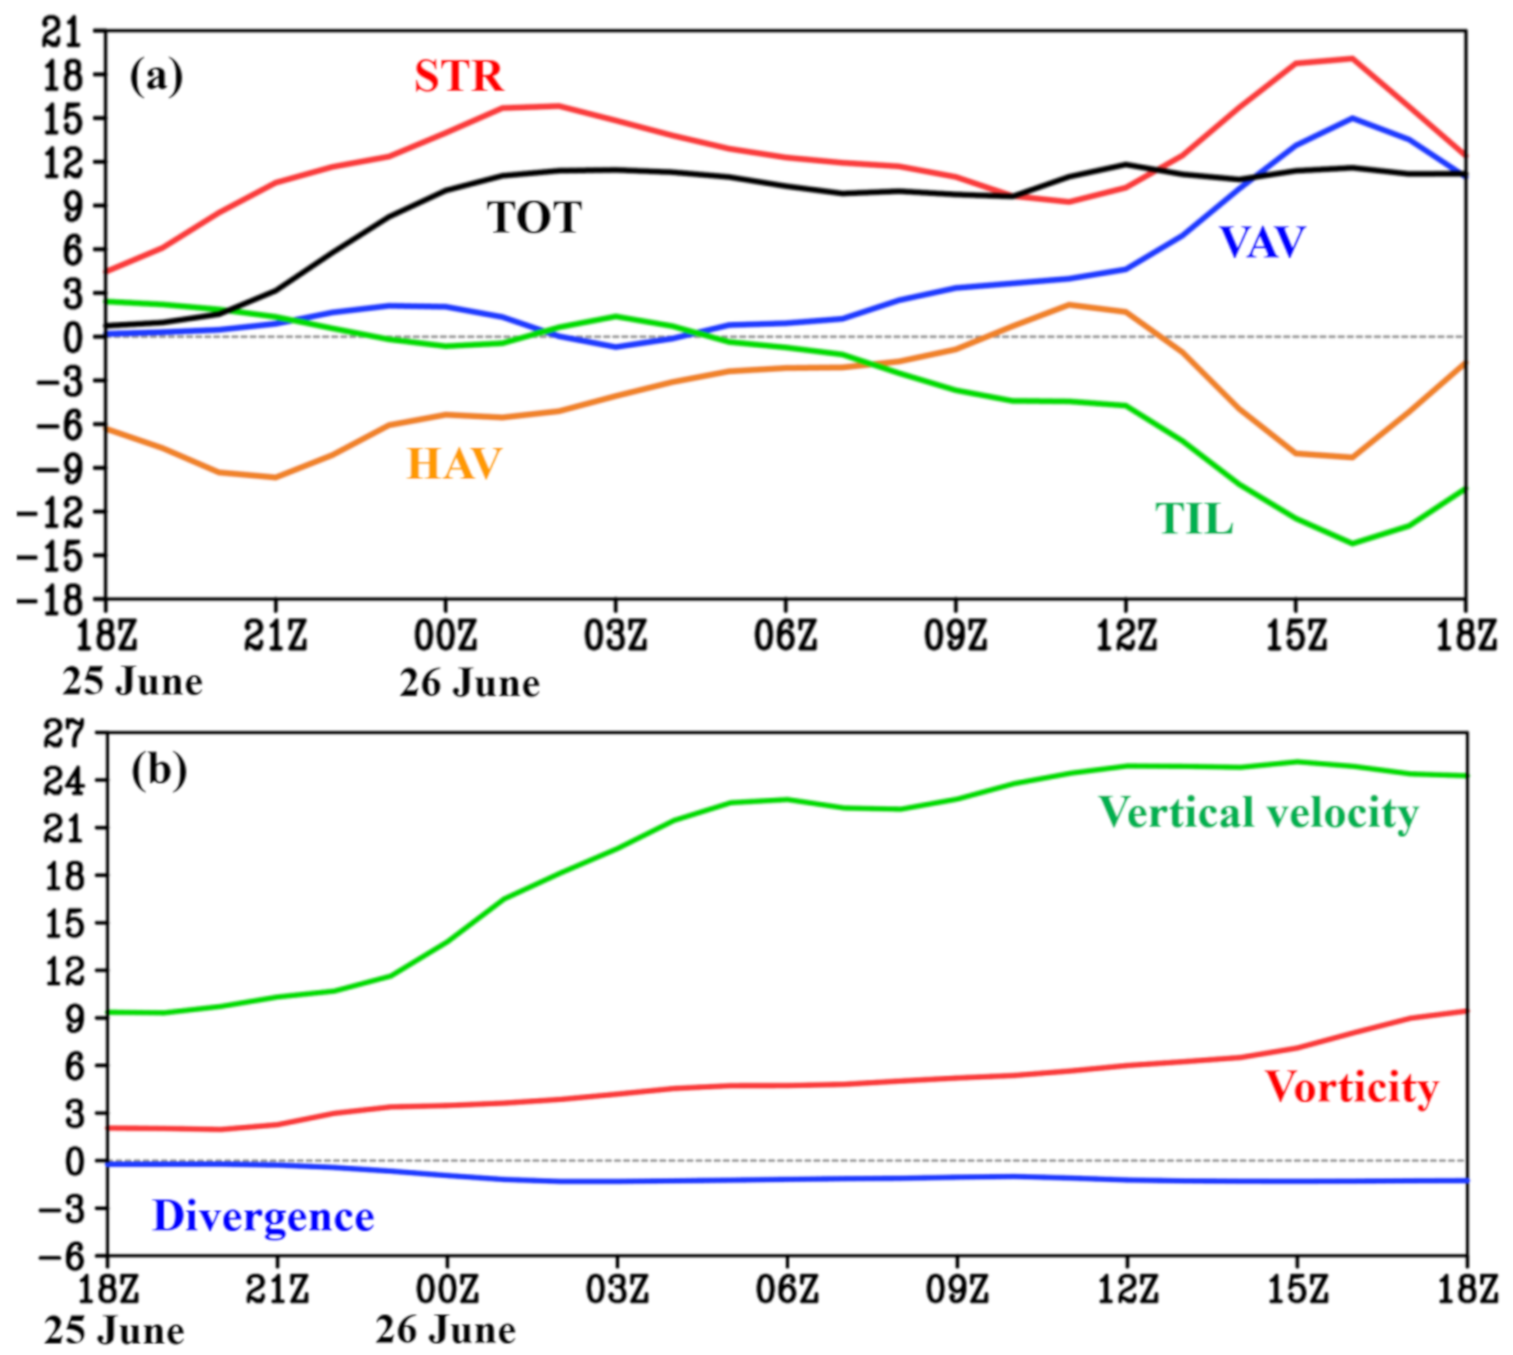
where terms HAV and VAV represent the horizontal and vertical advection of vorticity, respectively. A total (TOT) term was defined as TOT = HAV + VAV + TIL + STR + APV. Equation (2) was used for a vorticity budget that was averaged within the SWV’s key region, which can effectively represent the mechanisms accounting for the SWV’s formation [10,11,24,25]. As Figure 9a illustrates, from 1800 UTC 25 to 1800 UTC 26 June 2020, a positive TOT appeared within the SWV’s key region (black line in Figure 9a), which was consistent with the increase of cyclonic vorticity within the key region (red line in Figure 9b). This was conducive to the SWV’s formation. Term STR (red line in Figure 9a), which was due to convergence (blue line in Figure 9b), contributed the largest to the positive TOT. This was consistent with the results in Section 4.2. The vertical transport of vorticity (blue line in Figure 9a) due to ascending motions (green line in Figure 9b) was the second dominant factor. This accorded with the vertical configuration of the convergence and cyclonic vorticity within the SWV’s key region (Figure 3e). In contrast, term TIL (green line in Figure 9a) was the most detrimental factor for the SWV’s formation. This was consistent with the finding in Section 4.2. The horizontal transport was the second important factor that decelerated the SWV’s formation.

5. Conclusions and Discussion

In the summer of 2020, an abnormal Meiyu season appeared over the YRV, which caused the worst disasters of recent decades. Liu et al. [26] found that the sequential warm and cold Meiyu front regulated by the North Atlantic Oscillation was responsible for this abnormal Meiyu event. Fu et al. [27] claimed that abnormally active mesoscale vortices and low-level jet acted as the direct reasons for a series of heavy rainfall events during the 2020 Meiyu season. The SCB and its surrounding regions were one of the most severely affected areas during the 2020 abnormal Meiyu season, and the SWVs were found to be one of the most important reasons for the torrential rainfall, lightning, and strong winds in this region. In order to render a more comprehensive understanding of SWV formation, a quasi-stationary SWV that appeared during the period of 1800 UTC 26–2200 UTC 27 June 2020, and caused a series of severe disasters, was selected for a detailed investigation. The main findings are as follows: (i) the SWV focused in this study was a shallow three-dimensional vortex which mainly stretched in the layer of 700–850 hPa. This vortex formed in a favorable background environment which was characterized by an upper-tropospheric divergence northwest of the South Asia high and a middle-tropospheric warm advection east of the Tibetan Plateau. (ii) The POS-LBE type of air particles that sourced from the lower levels of the regions south of the Tibetan Plateau contributed the most to the SWV’s formation. These air particles experienced notable ascending motions before they entered the key region. The along-track vorticity budget showed that convergence-related stretching was the dominant factor for the increase in their cyclonic vorticity. In contrast, tilting effects due to convection mainly decelerated the SWV’s formation. (iii) The POS-LSM type of air particles that came from the regions within the key region of the SWV and areas northeast of the key region were the second dominant factor for the SWV’s formation. These air particles showed no notable changes in their height during their moving, whereas, their cyclonic vorticity showed the largest intensity and most rapidly increasing rate (mainly due to stretching) among all the four types of air particles. (iv) The POS-LAB type of air particles that came from the regions northeast of the Tibetan Plateau and northeast of the key region made the smallest positive contribution to the SWV’s formation, as their cyclonic vorticity had the smallest intensity and slowest increasing rate. These air particles experienced notable descending during their moving, which enhanced their convergence slightly. (v) About 1/3 of the air particles within the key region had anticyclonic vorticity (i.e., the NEG type) at the time when the SWV formed. These air particles were mainly sourced from the regions south and northeast of the Tibetan Plateau, and their final locations were mainly situated in the marginal area of the SWV. Due to tilting, their vorticity experienced a notable decrease during their moving. (vi) A key-region averaged vorticity budget (from the Euler perspective) also confirmed the dominant role of convergence-related stretching in producing the SWV; and it also confirmed that the convection-related tilting was the most detrimental factor for the SWV’s formation.
Overall, using the vorticity budgets from both the Lagrange and Euler perspectives, this study determined the formation mechanisms of a typical quasi-stationary SWV. A detailed comparison between the results of these two budget methods showed that, the convergence-related stretching and the convection-related tilting were the most favorable and detrimental factors for the SWV’s formation, respectively. As a type of heavy-rainfall producing vortex, SWVs are a hotspot issue for meteorologists in China. Which period is of the most importance for their formation? This scientific question remains unsolved [10,17]. Comparing the variation of air particles during different stages, we found that the most rapid changes of vorticity and divergence appeared in the period 24 h before the vortex’s formation. This means that meteorologists and forecasters should pay more attention to this critical period, during which cyclonic vorticity associated with the vortex experienced the most rapid increase. This study mainly investigated the SWV’s formation by using dynamic diagnoses. Thermodynamical processes such as latent heat release, evaporative cooling, and sensible heating from the surface can also affect the vortex’s formation by modifying divergence and vertical motions associated with the air particles [12,18]. Moreover, sensitivity simulations regarding aerosols showed that, aerosols exerted a notable effect on the storm formation by modifying the radiation and microphysics processes of cloud/precipitation [28,29]. It should be noted that, although we clarified the sources and vorticity variation mechanisms of the air particles that formed the SWV in this study, as a case study, its representativeness was still limited. Therefore, in the future, more case studies should be conducted, to finally render a comprehensive understanding of SWV formation.

Author Contributions

Conceptualization, H.M.; Data curation, X.M. and Y.J.; Formal analysis, H.M.; Funding acquisition, Y.J. and G.W.; Investigation, H.M.; Methodology, H.M. and X.M.; Resources, X.M., Y.J. and G.W.; Software, H.M.; Writing—original draft, X.M. and Y.J.; Writing—review & editing, H.M. and G.W. All authors have read and agreed to the published version of the manuscript.

Funding

This research was supported by the National Key R&D Program of China (2018YFC0809400), National Natural Science Foundation of China (grant no. 91637211).

Institutional Review Board Statement

Not Applicable.

Informed Consent Statement

Not Applicable.

Data Availability Statement

Data used in this study are available upon request.

Acknowledgments

The authors thank the European Centre for Medium-Range Weather Forecasts (ECMWF) (https://www.ecmwf.int/en/forecasts/datasets/reanalysis-datasets/era5) and China Meteorological Administration (CMA) (http://data.cma.cn) for providing the data.

Conflicts of Interest

The authors declare no conflict of interest.

References

  1. IPCC. Summary for Policymakers. In Climate Change 2013: The Physical Science Basis. Contribution of Working Group I to the Fifth Assessment Report of the Intergovernmental Panel on Climate Change; Cambridge University Press: Cambridge, UK; New York, NY, USA, 2013; p. 29. [Google Scholar]
  2. Song, L.C. Yearbook of Meteorological Disasters in China; China Meteorological Press: Beijing, China, 2018; p. 229. (In Chinese) [Google Scholar]
  3. Tao, S.Y. Rainstorms in China; Science Press: Beijing, China, 1980; p. 225. (In Chinese) [Google Scholar]
  4. Zhao, S.X.; Tao, Z.Y.; Sun, J.H.; Bei, N.F. Study on Mechanism of Formation and Development of Heavy Rainfalls on Meiyu Front in Yangtze River; China Meteorological Press: Beijing, China, 2004; p. 282. (In Chinese) [Google Scholar]
  5. Wei, K.; Ouyang, C.; Duan, H.; Li, Y.; Chen, M.; Ma, J.; An, H.; Zhou, S. Reflections on the catastrophic 2020 Yangtze River Basin flooding in Southern China. Innovation 2020, 1, 100038. [Google Scholar] [CrossRef]
  6. Ding, Y.H.; Liu, Y.Y.; Hu, Z.Z. The record-breaking Meiyu in 2020 and associated atmospheric circulation and tropical SST anomalies. Adv. Atmos. Sci. 2021. [Google Scholar] [CrossRef] [PubMed]
  7. Fu, S.M.; Zhang, J.P.; Tang, H.; Jiang, L.Z.; Sun, J.H. A new mesoscale-vortex identification metric: Restricted vorticity and its application. Environ. Res. Lett. 2020, 15, 124053. [Google Scholar] [CrossRef]
  8. Chen, T.; Zhang, F.; Yu, C.; Ma, J.; Zhang, X.D.; Shen, X.L.; Zhang, F.; Luo, Q. Synoptic analysis of extreme Meiyu precipitation over Yangtze River Basin during June-July 2020. Meteor. Mon. 2020, 46, 1415–1426. (In Chinese) [Google Scholar]
  9. Fu, S.M.; Yu, F.; Wang, D.H.; Xia, R.D. A comparison of two kinds of eastward-moving mesoscale vortices during the mei-yu period of 2010. Sci. China Earth Sci. 2013, 56, 282–300. [Google Scholar] [CrossRef]
  10. Fu, S.M.; Li, W.L.; Sun, J.H.; Zhang, Y.C. Universal evolution mechanisms and energy conversion characteristics of long-lived mesoscale vortices over the Sichuan Basin. Atmos. Sci. Lett. 2015, 16, 127–134. [Google Scholar] [CrossRef]
  11. Zhang, Y.C.; Fu, S.M.; Sun, J.H.; Fu, R.; Jin, S.L.; Ji, D.S. A 14-year statistics-based semi-idealized modeling study on the formation of a type of heavy rain–producing southwest vortex. Atmos. Sci. Lett. 2019, 2019, e894. [Google Scholar] [CrossRef] [Green Version]
  12. Feng, S.L.; Jin, S.L.; Fu, S.M.; Sun, J.H.; Zhang, Y.C. Formation of a kind of heavy-rain-producing mesoscale vortex around the Sichuan Basin: An along-track vorticity budget analysis. Atmos. Sci. Lett. 2019, 2019, e949. [Google Scholar] [CrossRef]
  13. Kuo, Y.; Cheng, L.; Bao, J. Numerical simulation of the 1981 Sichuan Flood. Part I: Evolution of a mesoscale southwest vortex. Mon. Weather Rev. 1988, 116, 2481–2504. [Google Scholar] [CrossRef] [Green Version]
  14. Zhao, P.; Hu, C.Q. Numerical simulation and diagnosis of the formation process of SW vortex. Chin. J. Atmos. Sci. 1992, 16, 177–184. (In Chinese) [Google Scholar]
  15. Chen, Z.M.; Xu, M.L.; Min, W.B.; Miu, Q. Relationship between abnormal activities of southwest vortex and heavy rain the upper reach of Yangtze River during summer of 1998. Plateau Meteorol. 2003, 22, 162–167. [Google Scholar]
  16. Zhao, S.X.; Fu, S.M. An analysis on the southwest vortex and its environment fields during heavy rainfall in eastern Sichuan Province and Chongqing in September 2004. Chin. J. Atmos. Sci. 2007, 31, 1059–1075. [Google Scholar]
  17. Fu, S.M.; Sun, J.H.; Zhao, S.X.; Li, W.L. The energy budget of a southwest vortex with heavy rainfall over South China. Adv. Atmos. Sci. 2011, 3, 709–724. [Google Scholar] [CrossRef]
  18. Wang, Q.W.; Tan, Z.M. Multi-scale topographic control of southwest vortex formation in Tibetan Plateau region in an idealized simulation. J. Geophys. Res. Atmos. 2014, 119, 11543–11561. [Google Scholar] [CrossRef]
  19. Zhang, J.P.; Fu, S.M.; Sun, J.H.; Shen, X.Y.; Zhang, Y.C. A statistical and compositional study on the two types of mesoscale vortices over the Yangtze River basin. Clim. Environ. Res. 2015, 20, 319–336. (In Chinese) [Google Scholar]
  20. Hans, H.; Bill, B.; Paul, B.; Shoji, H.; Jeankmol, T. The ERA5 global reanalysis. Q. J. R. Meteorol. Soc. 2020, 146, 1999–2049. [Google Scholar]
  21. Stein, A.F.; Draxler, R.R.; Rolph, G.D.; Stunder, B.J.B.; Cohen, M.D.; Ngan, F. NOAA’S HYSPLIT atmospheric transport and dispersion modeling system. Bull. Am. Meteor. Soc. 2015, 96, 2059–2077. [Google Scholar] [CrossRef]
  22. Holton, J.R. An Introduction to Dynamic Meteorology; Academic Press: San Diego, CA, USA, 2004. [Google Scholar]
  23. Markowski, P.; Richardson, Y. Mesoscale Meteorology in Midlatitudes; Wiley-Blackwell: Hoboken, NJ, USA, 2010; p. 407. [Google Scholar]
  24. Fu, S.M.; Zhang, J.P.; Sun, J.H.; Zhao, T.B. Composite analysis of long-lived mesoscale vortices over the middle reaches of the Yangtze River valley: Octant features and evolution mechanisms. J. Clim. 2016, 29, 761–781. [Google Scholar] [CrossRef]
  25. Tang, H.; Fu, S.M.; Sun, J.H.; Mai, Z.; Jin, S.L.; Zhang, Y.C. Investigation of severe precipitation event caused by an eastward-propagating MCS originating from the Tibetan Plateau and a downstream southwest vortex. Chin. J. Atmos. Sci. 2020, 44, 1275–1290. (In Chinese) [Google Scholar]
  26. Liu, B.Q.; Yan, Y.H.; Zhu, C.W.; Ma, S.M.; Li, J.Y. Record breaking Meiyu rainfall around Yangtze River in 2020 regulated by the subseasonal phase transition of North Atlantic Oscillation. Geophys. Res. Lett. 2020, 47, e2020GL090342. [Google Scholar] [CrossRef]
  27. Fu, S.-M.; Tang, H.; Li, Y.; Ma, H.; Sun, J.-H. On the Relationship of a Low-Level Jet and the Formation of a Heavy-Rainfall-Producing Mesoscale Vortex over the Yangtze River Basin. Atmosphere 2021, 12, 156. [Google Scholar] [CrossRef]
  28. Mansell, E.R.; Ziegler, C.L. Aerosol effects on simulated storm electrification and precipitation in a two-moment bulk microphysics model. J. Atmos. Sci. 2013, 70, 2032–2050. [Google Scholar] [CrossRef]
  29. Wang, C. A modeling study of the response of tropical deep convection to the increase of cloud condensation nuclei concentration: 1. Dynamics and microphysics. J. Geophys. Res. 2005, 110, D21211. [Google Scholar] [CrossRef] [Green Version]
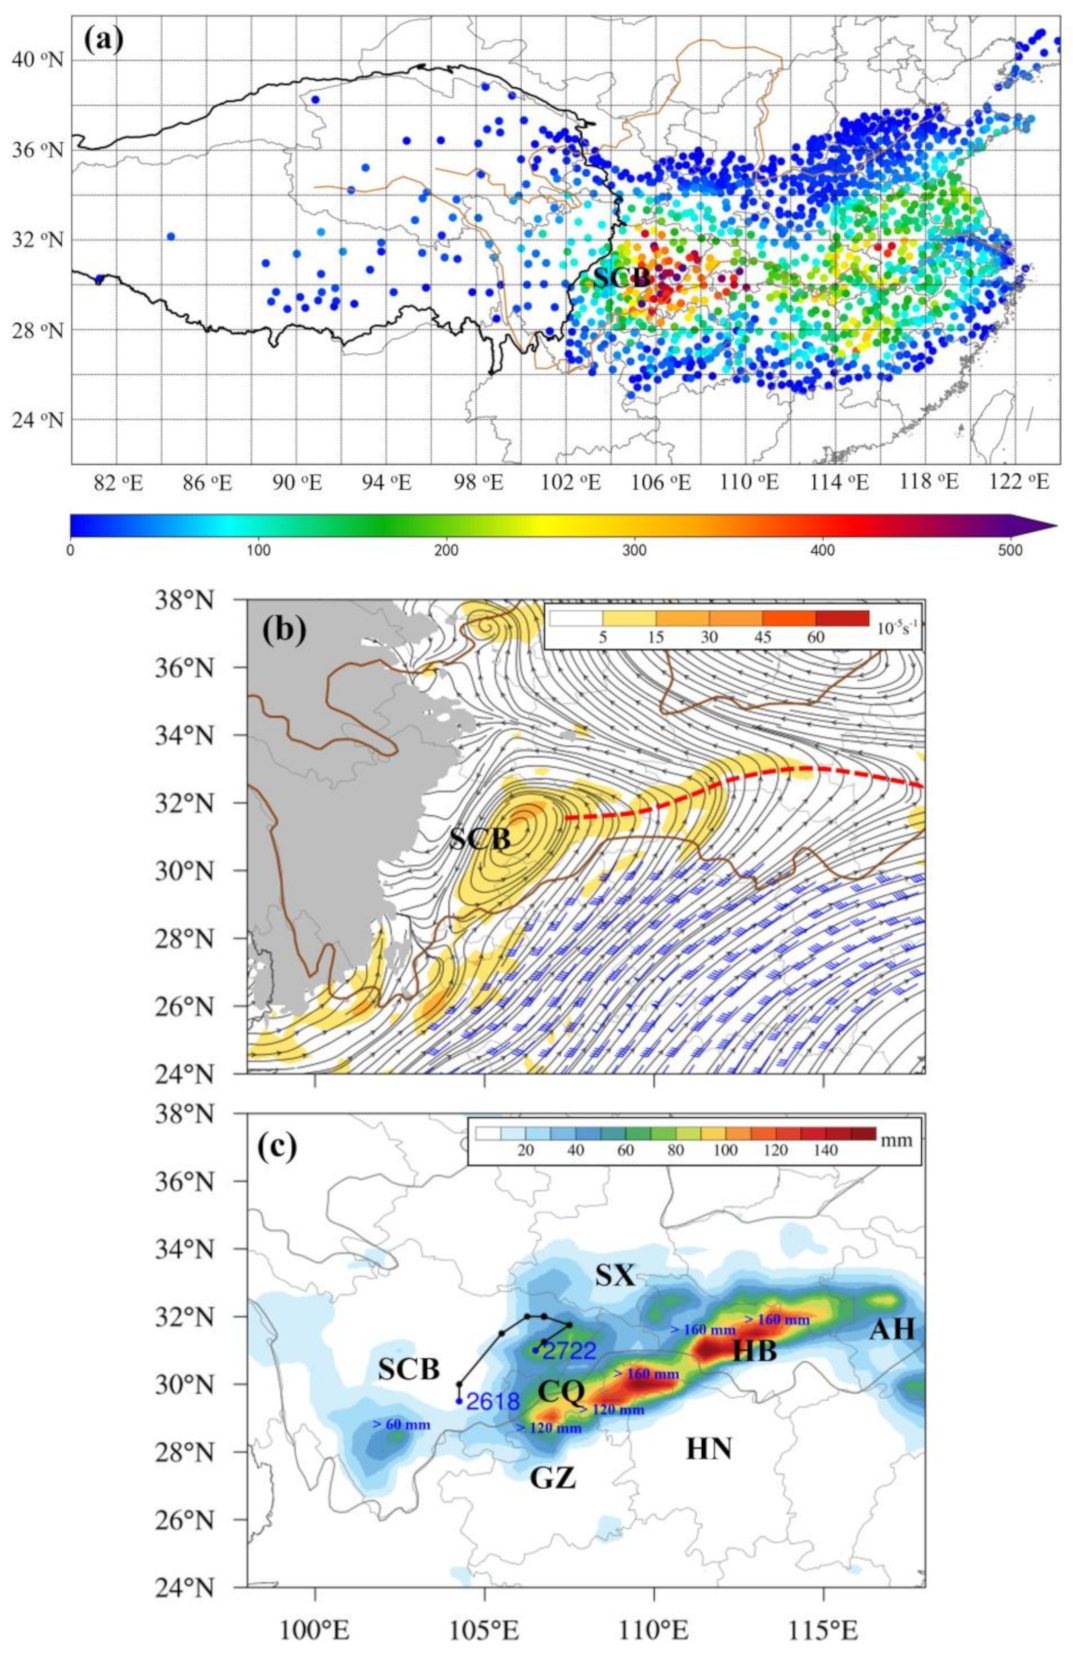
Figure 1. Panel (a) illustrates the accumulated precipitation (shading dots, units: mm) associated with mesoscale vortices at the ground observational stations (dots) in the YRV, during the 2020 Meiyu season. Panel (b) shows the temporal mean (from 1800 UTC 26 to 2200 UTC 27 June 2020) stream field, vorticity (shading, units: 10−5 s−1), and wind exceeding 12 m s−1 (a full bar represents 4 m s−1) at 750 hPa, where the grey shading outlines terrain higher than 2500 m and the thick red dashed line shows the lower-level shear line. Panel (c) illustrates the 28-h accumulated precipitation (shading, units: mm) and the track of the SWV (black solid line with black dots, where the blue dots mark the formation and dissipation locations). SCB = Sichuan Basin; SC = Sichuan, CQ = Chongqing, HB = Hubei, HN = Hunan, GZ = Guizhou, AH = Anhui, and SX = Shanxi.
Atmosphere 12 00556 g001
Figure 2. Panels (a,b) show the divergence (shading, units: 10−5 s−1), geopotential height (black contours, units: gpm), temperature (red contours, units: °C), and wind exceeding 35 m s−1 (a full wind bar is 10 m s−1) at 200 hPa. Panels (c,d) illustrate the temperature advection (shading, units: K h−1), geopotential height (black contours, units: gpm), temperature (red contours, units: °C), and wind exceeding 10 m s−1 (a full wind bar is 10 m s−1) at 500 hPa, where the purple dashed lines are the trough lines. The grey solid lines outline the terrain of 3000 m, and the blue dashed boxes show the SWV’s key region.
Atmosphere 12 00556 g002
Figure 3. Panel (a) shows the stream field, vorticity (shading, units: 10−5 s−1), and wind exceeding 8 m s−1 (a full bar represents 4 m s−1) at 750 hPa; Panels (bd) are the same as (a), but for 750 hPa, 800 hPa, and 850 hPa, respectively. Abscissa is longitude, and ordinate is latitude. Grey shading outlines the terrain higher than 3000 m in (a), 2500 m in (b), 2000 m in (c), and 1500 m in (d). Black dashed boxes show the key region of the southwest vortex. Panel (e) shows the key-region averaged vorticity (shading, units: 10−5 s−1) and divergence (black contours, units: 10−5 s−1), where the blue solid line marks the formation time of the southwest vortex, and the thick grey solid lines with double arrows show the vertical range of the southwest vortex. Abscissa is time, and ordinate is pressure (units: hPa).
Atmosphere 12 00556 g003
Figure 4. Panel (a) shows the backward (from 1800 UTC 26 to 1800 UTC 23 June 2020) trajectories and divergence (shading, units: 10−5 s−1) of the air particles within the key region, where black dots show the initial locations of the air particles. Panel (b) is the same as (a) but for vorticity (shading, units: 10−5 s−1).
Atmosphere 12 00556 g004
Figure 5. Panel (a) shows the backward (from 1800 UTC 26 to 1800 UTC 23 June 2020) trajectories and vorticity (shading, units: 10−5 s−1) of the air particles that belong to the Neg type, where black boxes/circles show the initial/final locations of the air particles. Panel (b) shows the vorticity variations of the NEG-type trajectories (units: 10−6 s−1). Panels (c,d) show the budget terms TIL and STR of the NEG-type trajectories, respectively (units: 10−10 s−2).
Atmosphere 12 00556 g005
Figure 6. The same as Figure 5, but for the POS-LBE type trajectories. Panel (a) shows the backward (from 1800 UTC 26 to 1800 UTC 23 June 2020) trajectories and vorticity (shading, units: 10−5 s−1) of the air particles that belong to the POS-LBE type, where black boxes/circles show the initial/final locations of the air particles. Panel (b) shows the vorticity variations of the POS-LBE-type trajectories (units: 10−6 s−1). Panels (c,d) show the budget terms TIL and STR of the POS-LBE-type trajectories, respectively (units: 10−10 s−2).
Atmosphere 12 00556 g006
Figure 7. The same as Figure 5, but for the POS-LSM type trajectories. Panel (a) shows the backward (from 1800 UTC 26 to 1800 UTC 23 June 2020) trajectories and vorticity (shading, units: 10−5 s−1) of the air particles that belong to the POS-LSM type, where black boxes/circles show the initial/final locations of the air particles. Panel (b) shows the vorticity variations of the POS-LSM-type trajectories (units: 10−6 s−1). Panels (c,d) show the budget terms TIL and STR of the POS-LSM-type trajectories, respectively (units: 10−10 s−2).
Atmosphere 12 00556 g007
Figure 8. The same as Figure 5, but for the POS-LAB type trajectories. Panel (a) shows the backward (from 1800 UTC 26 to 1800 UTC 23 June 2020) trajectories and vorticity (shading, units: 10−5 s−1) of the air particles that belong to the POS-LAB type, where black boxes/circles show the initial/final locations of the air particles. Panel (b) shows the vorticity variations of the POS-LAB-type trajectories (units: 10−6 s−1). Panels (c,d) show the budget terms TIL and STR of the POS-LAB-type trajectories, respectively (units: 10−10 s−2).
Atmosphere 12 00556 g008
Figure 9. Panel (a) illustrates the key-region averaged vorticity budget terms (units: 10−10 s−2) at 750 hPa. Panel (b) shows the key-region averaged vertical velocity (green line, units: 10−3 m s−1), vorticity (red line, units: 10−5 s−1) and divergence (blue line, units: 10−5 s−1) at 750 hPa.
Atmosphere 12 00556 g009
Table 1. Proportions (in number and final vorticity) and mean changes (final state minus initial state) of the four groups of trajectories. Units for vorticity and divergence are 10−5 s−1. NEG = negative (i.e., final vorticity is negative); POS = positive (i.e., final vorticity is positive). ‘LAB’ means air particles coming from a height above 3000 m, ‘LSM’ means air particles coming from a height of 2000–3000 m, and ‘LBE’ means air particles coming from a height below 2000 m.
FeaturesNEGPOS-LABPOS-LSMPOS-LBE
Proportion in number33.0%10.7%7.1%49.1%
Proportion in final vorticity−20.2%10.1%21.8%88.3%
Mean vorticity change−4.4+3.4+14.7+13.3
Mean divergence change+1.7−1.4−6.5−5.8
Mean height change141 m−1873 m98 m1825 m
Publisher’s Note: MDPI stays neutral with regard to jurisdictional claims in published maps and institutional affiliations.