Article

Is New Always Better? Frontiers in Global Climate Datasets for Modeling Treeline Species in the Himalayas

Center for Earth System Research and Sustainability, Institute of Geography, University of Hamburg, Bundesstraße 55, 20146 Hamburg, Germany
*
Author to whom correspondence should be addressed.
Atmosphere 2021, 12(5), 543; https://doi.org/10.3390/atmos12050543
Submission received: 30 March 2021 / Revised: 17 April 2021 / Accepted: 19 April 2021 / Published: 23 April 2021
(This article belongs to the Special Issue Climates of the Himalayas: Present, Past and Future)

Abstract

:
Comparing and evaluating global climate datasets and their effect on model performance in regions with limited data availability has received little attention in ecological modeling studies so far. In this study, we aim at comparing the interpolated climate dataset Worldclim 1.4, which is the most widely used in ecological modeling studies, and the quasi-mechanistical downscaled climate dataset Chelsa, as well as their latest versions Worldclim 2.1 and Chelsa 1.2, with regard to their suitability for modeling studies. To evaluate the effect of these global climate datasets at the meso-scale, the ecological niche of Betula utilis in Nepal is modeled under current and future climate conditions. We underline differences regarding methodology and bias correction between Chelsa and Worldclim versions and highlight potential drawbacks for ecological models in remote high mountain regions. Regarding model performance and prediction plausibility under current climatic conditions, Chelsa-based models significantly outperformed Worldclim-based models, however, the latest version of Chelsa contains partially inherent distorted precipitation amounts. This study emphasizes that unmindful usage of climate data may have severe consequences for modeling treeline species in high-altitude regions as well as for future projections, if based on flawed current model predictions. The results illustrate the inevitable need for interdisciplinary investigations and collaboration between climate scientists and ecologists to enhance climate-based ecological model quality at meso- to local-scales by accounting for local-scale physical features at high temporal and spatial resolution.

1. Introduction

The Himalayas are the largest mountain system in the world with a distinct three-dimensional geoecological differentiation, with a high variation of altitude, temperature, precipitation, soils, and land use [1,2,3]. The small-scale heterogeneity of habitats and site conditions provides a multitude of ecological niches associated with high diversity of species and communities [4,5,6]. Compared to other regions of the world, anthropogenic influence is less pronounced, but even in the Himalayas, near-natural treeline sites can hardly be found [7]. In the course of past climate changes, refugia at higher elevations facilitated the preservation of biodiversity, and even greater importance could be attached to these refugia in the future [8].
In recent decades, interest in treeline research in the world’s mountains has considerably increased. Research on treeline causation, spatial patterns, and treeline dynamics has particularly intensified from the 1990s to today [9]. Inspired by easy-to-use software and freely accessible data, analyzing underlying factors of treeline position and dynamics as well as forecasting future changes of treeline species composition, altered species phenology, and future species ranges represents an ongoing trend in recently published literature (e.g., References [10,11,12,13,14]). In contrast to other mountains of the world, the Himalayan region is still under-researched in this respect and is clearly underrepresented in scientific literature on climate change-induced species range shifts [7,15,16,17]. In a recent review on modeling studies in the Himalayan mountains, Bobrowski et al. [18] pointed out numerous challenges for modeling species’ niches and their distributions in the Himalayas. The most important constraint is limited data availability due to poor terrain accessibility. Furthermore, the evaluation of input parameters comprising occurrences and predictor variables were often not sufficiently considered, and modeling studies comparing the effect of different climate datasets on model performance remain very scarce [18]. In consequence, models are afflicted with unknown sources of prediction bias, especially when predictor variables are selected without fundamental knowledge of ecological drivers determining species distribution. Severe drawbacks can be traced back to distorted models being based on flawed input parameters, and when serving as a baseline for potential future range shifts, errors will potentially multiply [19,20,21].
Numerous publications exist that evaluate modeling challenges such as quality and quantity of occurrence data [22,23,24], generated pseudo-absences [25], multi-collinearity among predictor variables [12,26], choice of modeling algorithm [22,27,28], and evaluation criteria [29,30]. However, the evaluation of freely available climate datasets, their computation methods, coherent limitations, and potential inaccuracies still remains largely out of focus. Overall, Worldclim 1.4 [31] is the most widely used (>12,400 citations, Web of Knowledge, March 2021), freely available, worldwide climate dataset with 30 arc seconds resolution (approximately 1 km) for ecological modeling studies. Recently, a new version, Worldclim 2.1, was launched [32]. The Chelsa climate dataset implies the same attributes of availability and resolution (version 1.1 [33], version 1.2 [34]) and has been increasingly used for studies in the Himalayas [35,36,37]. Recent publications on ecological models compared and evaluated Worldclim and Chelsa climate data, reporting higher model performance using Chelsa climate data [38,39], or equal performance [40,41]. On the other hand, diverging results for Chelsa climate data were reported for modeling ecological niches in the Himalayas. The authors of [42,43] found Chelsa performing inferior to Worldclim, however only marginally. In contrast, significantly better results using Chelsa were found for the Himalayan arc and Bhutan in [34,44], respectively. The conclusiveness of the aforementioned studies remains limited, since different versions of Chelsa and Worldclim were utilized. To date, a comprehensive comparative study of Chelsa and Worldclim and their respective versions with regard to their methodology and their application potential for ecological modeling studies in the Himalayas has not been conducted.
In this paper, we aim at emphasizing differences in computation methods, spatial structure of input data (i.e., weather stations or reanalysis data), and afflicted limitations for further applications between the climate datasets and respective versions. In addition, we evaluate the impact of these climate datasets when modeling the ecological niche of the principal broadleaved treeline species Betula utilis in Nepal as a meso-scale case study using bioclimatic variables as predictors under current and future climate conditions. In the discussion, our results will be embedded in potential future approaches to shape and advance modern research on modeling treeline species under current and future climate conditions in the Himalayas.

2. Materials and Methods

2.1. Description of Climate Datasets

To allow for direct comparison among climate datasets and between versions, we choose the most frequently used source of freely available, fine-scale, and long-term climate raster dataset with global coverage, Worldclim 1.4 [31], its updated version 2.1 [32], and Chelsa 1.1 [33] and 1.2 [34].
All climate datasets consist of current climate data (Worldclim 1.4 and 2.1: 1960–1990; Chelsa 1.1. and 1.2: 1979–2013) with the highest available resolution of 30 arc seconds (Table 1). Future climate data (2021–2100), with four different Representative Concentration Pathways (RCPs), ranging from low to high (2.6, 4.5, 6.0, 8.5) for numerous Global Circulation Models (GCM), are available for Chelsa 1.2 and Worldclim 1.4 at 30 arc seconds, whereas for Worldclim 2.1, it is only available at 2.5 arc minutes. Although Chelsa 1.1 from 2016 and Worldclim 1.4 from 2005 are replaced by updated versions and their authors recommend using the most recent datasets, they are still included in this comparison as they were and to date still are widely used in ecological studies.
All climate datasets offer monthly temperature (minimum, maximum, average) and precipitation sums as well as bioclimatic variables derived from those, which are indispensable in ecological modeling studies since they represent annual tendencies of temperature and precipitation, seasonality, and monthly to quarterly climatic extremes, as well as their combinations [45,46]. All provided variables are calculated for the near surface (~2 m above ground) climatic conditions of terrestrial areas.

2.2. Methodology of Climate Datasets

Worldclim 1.4 [31]
The Worldclim 1.4 climate dataset is based on interpolation of point observations from weather stations, which regionalizes monthly observations of precipitation and temperature with a thin-plate smoothing spline algorithm, using latitude, longitude, and elevation as statistical predictor variables. Thus, climatic variations from areas with high station densities are fairly well resolved, whereas areas with limited weather stations yield higher insecurity. To account for this uncertainty in input data, weather station density, elevation bias in the weather stations, and elevation variation within grid cells, data partitioning and cross-validation were applied. Despite the high spatial resolution of 30 arc seconds, Worldclim 1.4 neglects local-scale atmospheric processes which are crucial for the formation of site-specific topo-climatic conditions in high mountain environments. The authors clearly emphasized that uncertainty in Worldclim 1.4 climate estimates resulting from high variation within grid cells is highest in mountainous and poorly sampled regions. Irregular distribution and low density of weather stations is a common feature of almost all mountain areas outside of Europe and North America, and especially of the Himalayas. At the time of publication, Worldclim 1.4 had higher spatial resolution, higher number of weather station records, improved elevation data, and more information on spatial distribution of uncertainties compared to other hitherto available products. For Worldclim 1.4, monthly minimum, maximum, and mean temperature, monthly precipitation sums, and bioclimatic variables are freely available for download.
Worldclim 2.1 [32]
For Worldclim 2.1, weather station data were interpolated using likewise thin-plate splines with covariates including elevation, distance to the coast, and satellite-derived covariates (i.e., maximum and minimum land surface temperature and MODIS cloud cover). Data from weather stations (9000–60,000) between 1970 and 2000 included monthly temperatures (minimum, maximum, and mean), precipitation sums, incoming solar radiation, vapor pressure, and wind speed.
Compared to the former version, prediction accuracy for temperature variables increased by 5–15% (0.07–0.17 °C) due to remote sensing data. However, prediction error remained high for all climate variables in areas with low weather station density (i.e., remote, mountainous regions in less developed countries).
For the final product, the best performing model for each region and variable was selected. Finally, global cross-validation correlations revealed r ≥  0.99 for temperature and humidity, 0.86 for precipitation, and 0.76 for wind speed. The authors highlight the necessity to expand weather station data networks, since remote sensing covariates only marginally improved most Worldclim climate estimates in version 2.1. Besides monthly minimum, maximum, and mean temperature, monthly precipitation sums, and bioclimatic variables, Worldclim 2.1 offers solar radiation, wind speed, water vapor pressure, and elevation.
Chelsa 1.1 [33]
Chelsa 1.1 climate data are based on a quasi-mechanistical statistical downscaling of climatic reanalysis interim (ERA-Interim) global circulation model with Global Precipitation Climatology Centre (GPCC) and Global Historical Climate Network (GHCN) bias correction. The algorithm for temperatures in Chelsa 1.1 relies on a statistical downscaling of monthly vertical atmospheric means of daily mean temperatures at ERA-Interim pressure levels from 1000 to 300 hPa. The free atmospheric temperature lapse rates were calculated using linear regression for each ERA-Interim grid cell. After the reduction to sea level, it was interpolated between grid cells and afterwards projected back on the elevational surface of the DEM GMTED2010 [47]. For the precipitation algorithm, orographic predictors such as wind fields, valley exposition, and boundary layer height with a subsequent bias correction were incorporated. The latter includes bias correction at different scales (large scale at ~150 × 150 km and small scale at ~0.75° × 0.75° latitude/longitude) and temporal aspects (backward bias correction) for aggregation of monthly precipitation sums to annual rainfall estimates. The resulting data consist of a monthly temperature and precipitation climatology for the years 1979–2013 available at a resolution of 30 arc seconds. Especially, precipitation amounts showed higher accuracy compared to precipitation data from other climate datasets (e.g., Worldclim). The authors emphasized the appropriate performance of Chelsa 1.1 in mountainous regions since orographic precipitation effects were considered. For Chelsa 1.1, monthly minimum, maximum, and mean temperature, precipitation, and bioclimatic derivates are available.
Chelsa 1.2 [34]
For the latest version of Chelsa climate data, the original quasi-mechanistical statistical downscaling approach was enhanced to compute more accurate temperature and precipitation estimates.
As in version 1.1, free atmospheric temperature lapse rates (1000 to 300 hPa) were used to estimate near-surface air temperatures at sea level, which were then interpolated between grid cells using B-spline interpolation, and afterwards projected back on the elevational surface of the DEM GMTED2010 [47]. Maximum and minimum temperatures were calculated using climatological-aided interpolation. Mean monthly temperature values were used and added or subtracted to the maximum or minimum daily temperature derived from the three-hourly data of previous post-processing data fields in ERA-Interim of minimum or maximum temperature.
The downscaling of precipitation is in accordance with version 1.1, applying the bias correction with GHCN and GPCC data. Advances in the latest version refer to the calculation of annual precipitation sums for the climatologies and the handling of bias correction, which now includes GPCC data at a higher resolution of 0.25° × 0.25° latitude/longitude.
The authors aim at providing climatologies for precipitation and temperature at high spatial resolution for environmental and ecological studies, which might prove valuable in varied scientific applications that rely on a good representation of small-scale precipitation and temperature patterns. For Chelsa 1.2, the following additional predictors are available: aridity, hydrothermic coefficient, potential evapotranspiration, growing season length, temperature and precipitation, growing degree days, frost change frequency, glacier height, and solar radiation.

2.3. Modeling Procedure

To evaluate the effect of different climate datasets when modeling the ecological niche of B. utilis in Nepal under current and future climate conditions, we followed the approach described by Bobrowski et al. [36]. Out of 360 occurrences of B. utilis, 13 geo-referenced records (1980–2016) were accessed via the Global Biodiversity Information Facility (gbif.org), 31 records were extracted from a database compiled from a literature survey ([15]; unpublished data), and 316 occurrences were obtained via satellite images of Google Earth (GoogleEarthTM, ver. 7.1.1.1888, Google, 2015) (Figure 1). These occurrence localities were validated through expert knowledge, obtained from numerous field visits in the Himalayan region. This method has been proven to be useful in global treeline research [48,49].
To limit the space for pseudo-absence selection (i.e., the space where the species is known not to occur, e.g., the Tibetan Plateau and the Indian lowlands), a convex hull with a buffer of 5° was drawn around the occurrences utilizing the R-package ‘rgeos’ [50]. Additionally, a buffer of 5 km was placed around the known occurrences to ensure that pseudo-absences where not placed directly next to occurrences. Following the procedure described in [25], a total of 4000 pseudo-absences were generated as randomly stratified points (i.e., one pseudo-absence per grid cell), as implemented in the R-package ‘sp’ [51].
The data were split into 80% training and 20% testing data utilizing the ‘caret’ package [52]. We applied generalized linear models (GLM, [53]) and followed the procedure described in Bobrowski et al. [36], with binomial distribution, logit-link function, and polynomial terms of second order were used to build the model. We calculated the root mean square error (RMSE) in order to account for overfitting of the data (i.e., RMSE should be very similar between training and testing datasets), indicating a good fit of all models. Five model runs were averaged, and final models were evaluated using Pseudo R2 [54] to determine the explained variance of the test data.
To compare the different Chelsa and Worldclim climate datasets (Table 1), we downloaded the bioclimatic variables of the respective datasets directly in R using the package ‘ClimDatDownload’ [55], which is a recently published package designed to download, process, and compare different climate datasets.
In accordance with the species-specific ecology and to allow for a direct comparison, the same climatic variables were used (after Spearman’s rank correlation coefficient of rs ≤ │0.7│ with the ‘psych’ package [56], which was applied to check for autocorrelation between predictor variables) viz. Mean Temperature of Wettest Quarter (i.e., mean temperature of the growing season), and Precipitation of the Coldest Quarter (i.e., proxy for melt water availability in the pre-monsoon season). Additionally, we calculated the average mean precipitation sums of March, April, and May, and included that variable into the models to account for pre-monsoon drought stress [7,57]. All utilized bioclimatic variables have been shown to reflect ecological requirements of B. utilis at treeline sites, accounting for growth limitations due to low temperature and insufficient moisture availability, and to describe the ecological niche (for detailed interpretation, see [35,36]).
To demonstrate the significance of current predictions, we projected the ecological niche of B. utilis under future climate change conditions. Only for Chelsa 1.2 and Worldclim 1.4 future scenarios were available at 30 arc seconds resolution and subsequently downloaded, cropped, and snapped directly in R with the package ‘ClimDatDownload’ [55]. We used future scenarios of the American National Center for Atmospheric Research (NCAR) with their Community Climate System Model (CCSM4, [58]) with two RCPs, namely 4.5 as medium–low and 8.5 as high scenario for the timeframe 2080. In detail, RCP 4.5 assumes an increase in temperature of around 2 °C relative to the period between 1950 and 2000, whereas in RCP 8.5, an increase of around 4 °C is predicted for most parts of the study area. Furthermore, a slight increase in precipitation amounts is projected for central Nepal, which is highest under RCP 8.5.
All statistical analyses were performed using the programming language R [59] and all maps were created in ArcMap 10.7.1 [60].

3. Results

3.1. Comparison of Chelsa and Worldclim Climate Datasets

Prior to the modeling approach, we inspected selected predictor variables and found striking differences between the climate datasets and respective versions. As mentioned above, differences between temperature-related variables were smaller compared to precipitation-related variables.
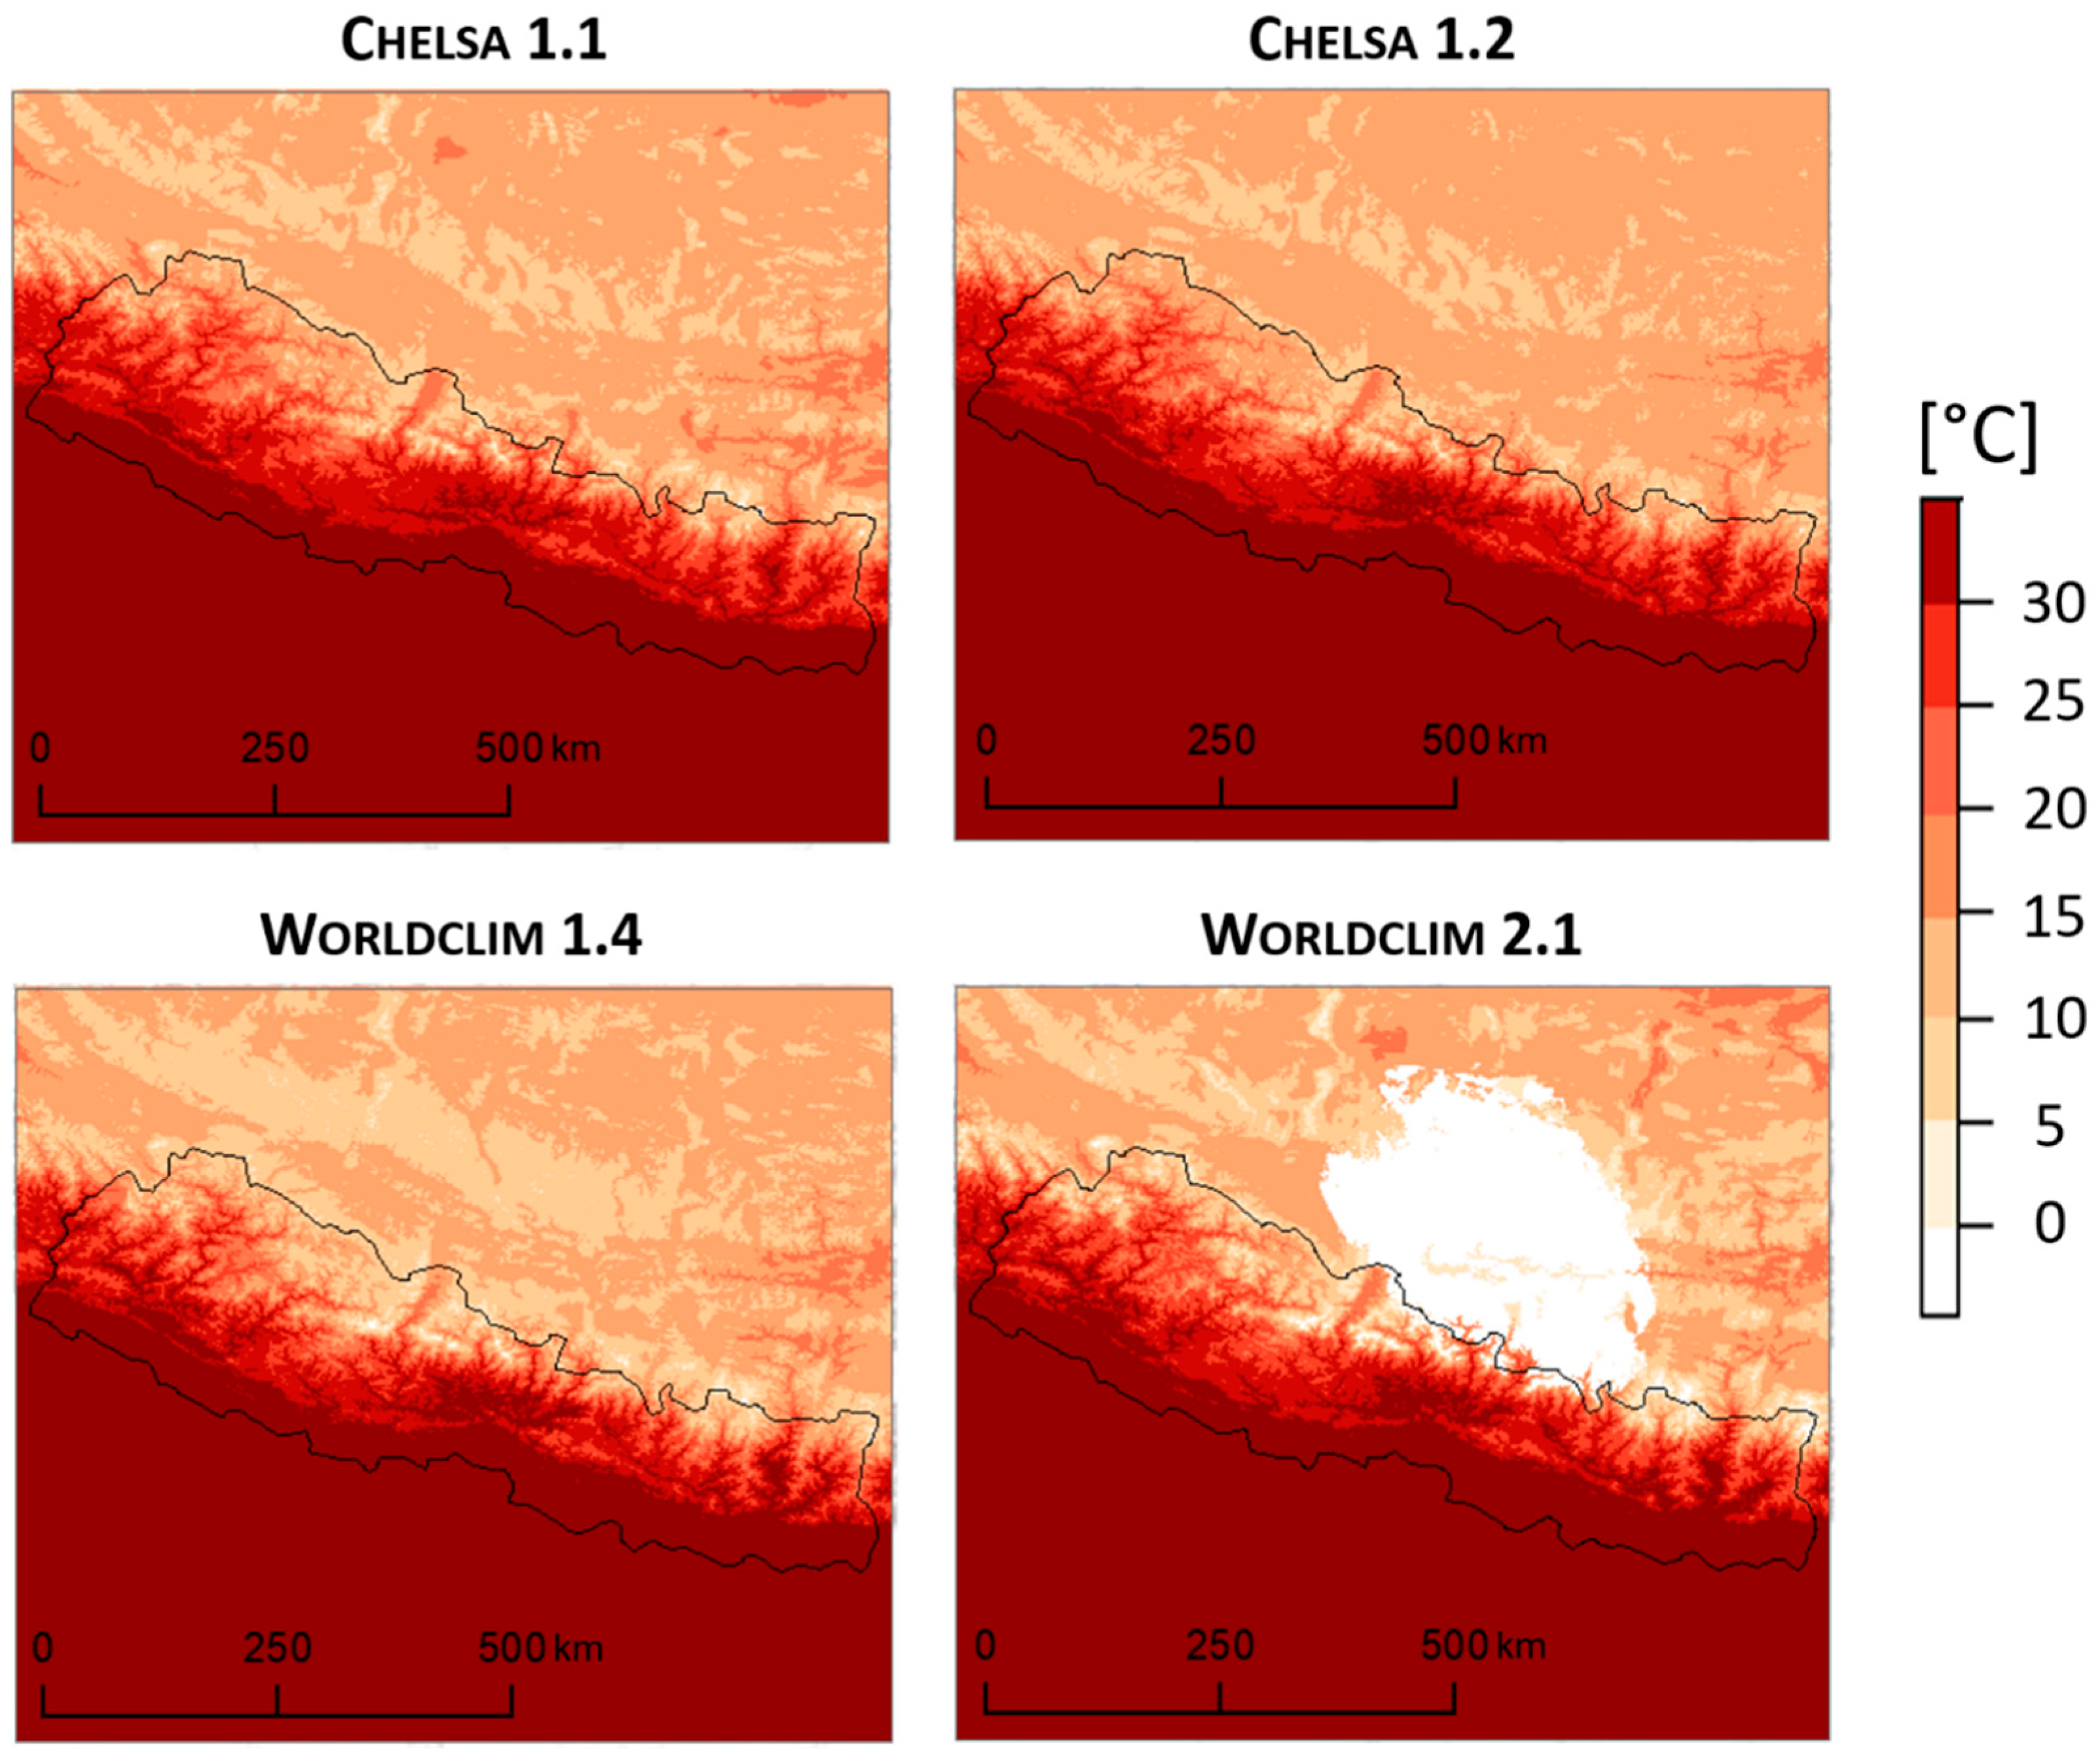
For the Mean Temperature of the Wettest Quarter, all climate datasets show highly significant positive correlations (Table 2), and similar value ranges with consistent distribution (Figure 2). The negative correlation between increasing altitude and decreasing temperature becomes clearly visible. Worldclim 2.1 reproduces comparatively low temperature values on the Tibetan plateau (Figure 2).
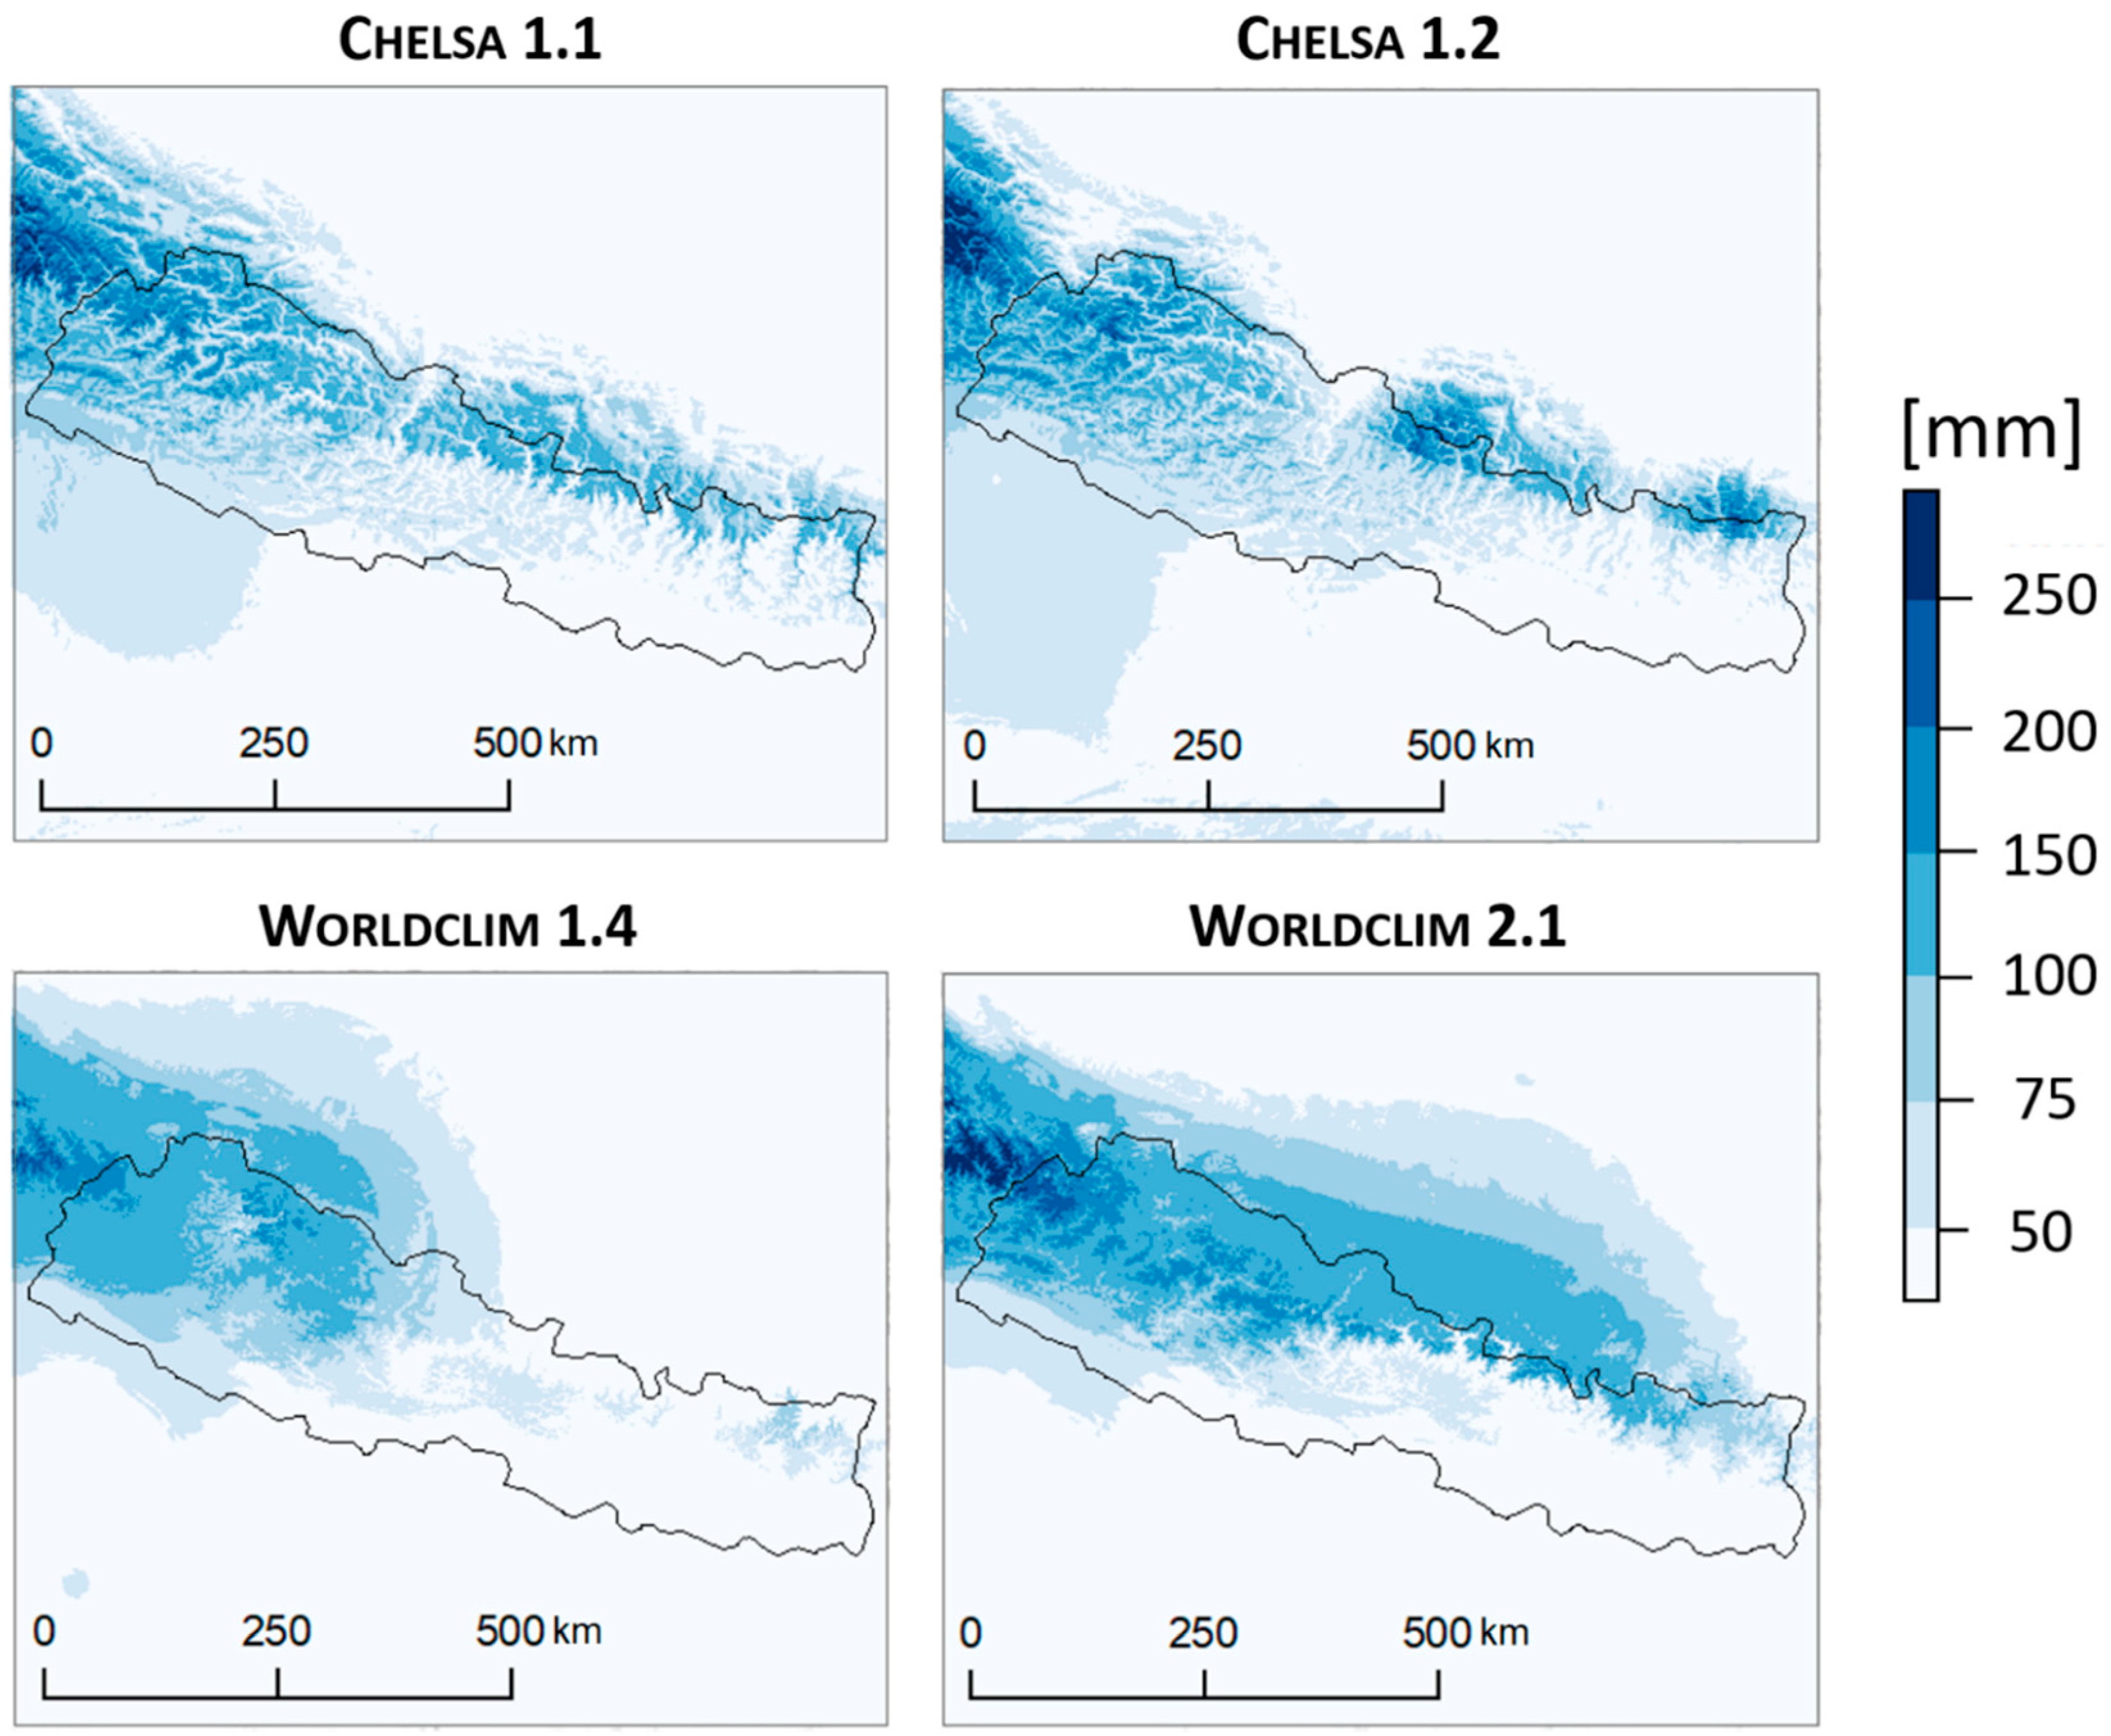
The comparison of precipitation-related variables between the climate datasets revealed major differences, and even among versions, wide disparities could be found (Figure 3 and Figure 4). Correlation analyses showed high coefficients among versions and lower coefficients between climate datasets, whereas coefficients were higher for Chelsa versions and Worldclim 2.1 compared to 1.4 (Table 3). These differences are mainly attributed to different origin of input data and calculation methods between the versions. Precipitation-related variables of Chelsa versions are based on precipitation data from ERA-Interim data, which are downscaled and include a three-fold bias correction [34]. Chelsa precipitation estimates are corrected using GPCC and GHCN data to execute monthly bias correction, inclusion of orographic effects, and weather station bias correction (for more details, see [34]). Worldclim-related variables are solely based on station data, which are point data that are interpolated with latitude, longitude, and elevation as independent variables [31]. The very low density of weather stations on the Tibetan plateau is one of the main challenges, leading to an unequal distribution of measurements for the climate dataset calculations and to the need to apply different correction methods. Although more consistent between versions than Worldclim, Chelsa versions show remarkable differences. One major difference is the bubble-shaped structure of the northern edge of the values in version 1.2 compared to a smoother curve shape in version 1.1 (Figure 3 and Figure 4). This difference is attributed to weighting and smoothing factors applied to predictions when correcting precipitation values by including orographic effects. In version 1.1, the monthly bias-corrected precipitation grids are proportionally distributed at ERA resolution and boundary layer of corrected wind effect surface, whereas in version 1.2, this relationship is assumed to be linear to achieve data scaled to 0.75° resolution [33,34]. For both approaches, precipitation values are erroneously overpredicted in topographically caused rain-shadow regions behind the Himalayan main range and on the Tibetan Plateau.
The two Worldclim versions show severe artefacts on the Tibetan plateau, with these artefacts appearing ball-shaped in version 1.4 and more flattened and stretching towards the East in version 2.1 (Figure 3). Differences between the two versions can be particularly attributed to the number of weather stations used for interpolations. Fick and Hijmans [32] stated higher prediction error with increase in station elevation and distance to nearest neighboring station, and further reported higher relative error in areas with complex topography (i.e., mountains) and low station density. Compared to Worldclim version 1.4, a higher number of weather station data points (version 1.4: 47,554, version 2.1: 60,419) were incorporated in version 2.1 to interpolate precipitation values. Furthermore, they included cloud cover to increase accuracy in regions with low weather station density and sharply contrasting microclimates to emphasize topographic effects and avoid over-smoothing relationships between elevation and precipitation with stations at equivalent elevations across rain-shadows [61].
Correlation analyses revealed consistent high coefficients among versions and rather low coefficients between climate datasets, whereas the lowest coefficients were found for Chelsa 1.1 and Worldclim 1.4 as well as 2.1 (Table 4). In general, Worldclim shows lower precipitation values compared to Chelsa for Average Precipitation in March, April, and May (Figure 4). Comparing Chelsa 1.1 and 1.2, the circular arrangement of precipitation amounts remains, with highest values being predicted in the eastern parts of the study area and north of the Himalayan main range. This is suspicious, since the main range constitutes a barrier, leading to very dry climate on the Tibetan plateau. This artefact in Chelsa 1.2 is attributed to the interpolation of station-derived biases. The effect of remote sensing products to decrease bias of precipitation variables can be observed for Average Precipitation in March, April, and May, with artefacts in the eastern part of the study area on the Tibetan Plateau being diminished in Worldclim 2.1 compared to 1.4.

3.2. Effects of Climate Datasets on Model Performance and Prediction

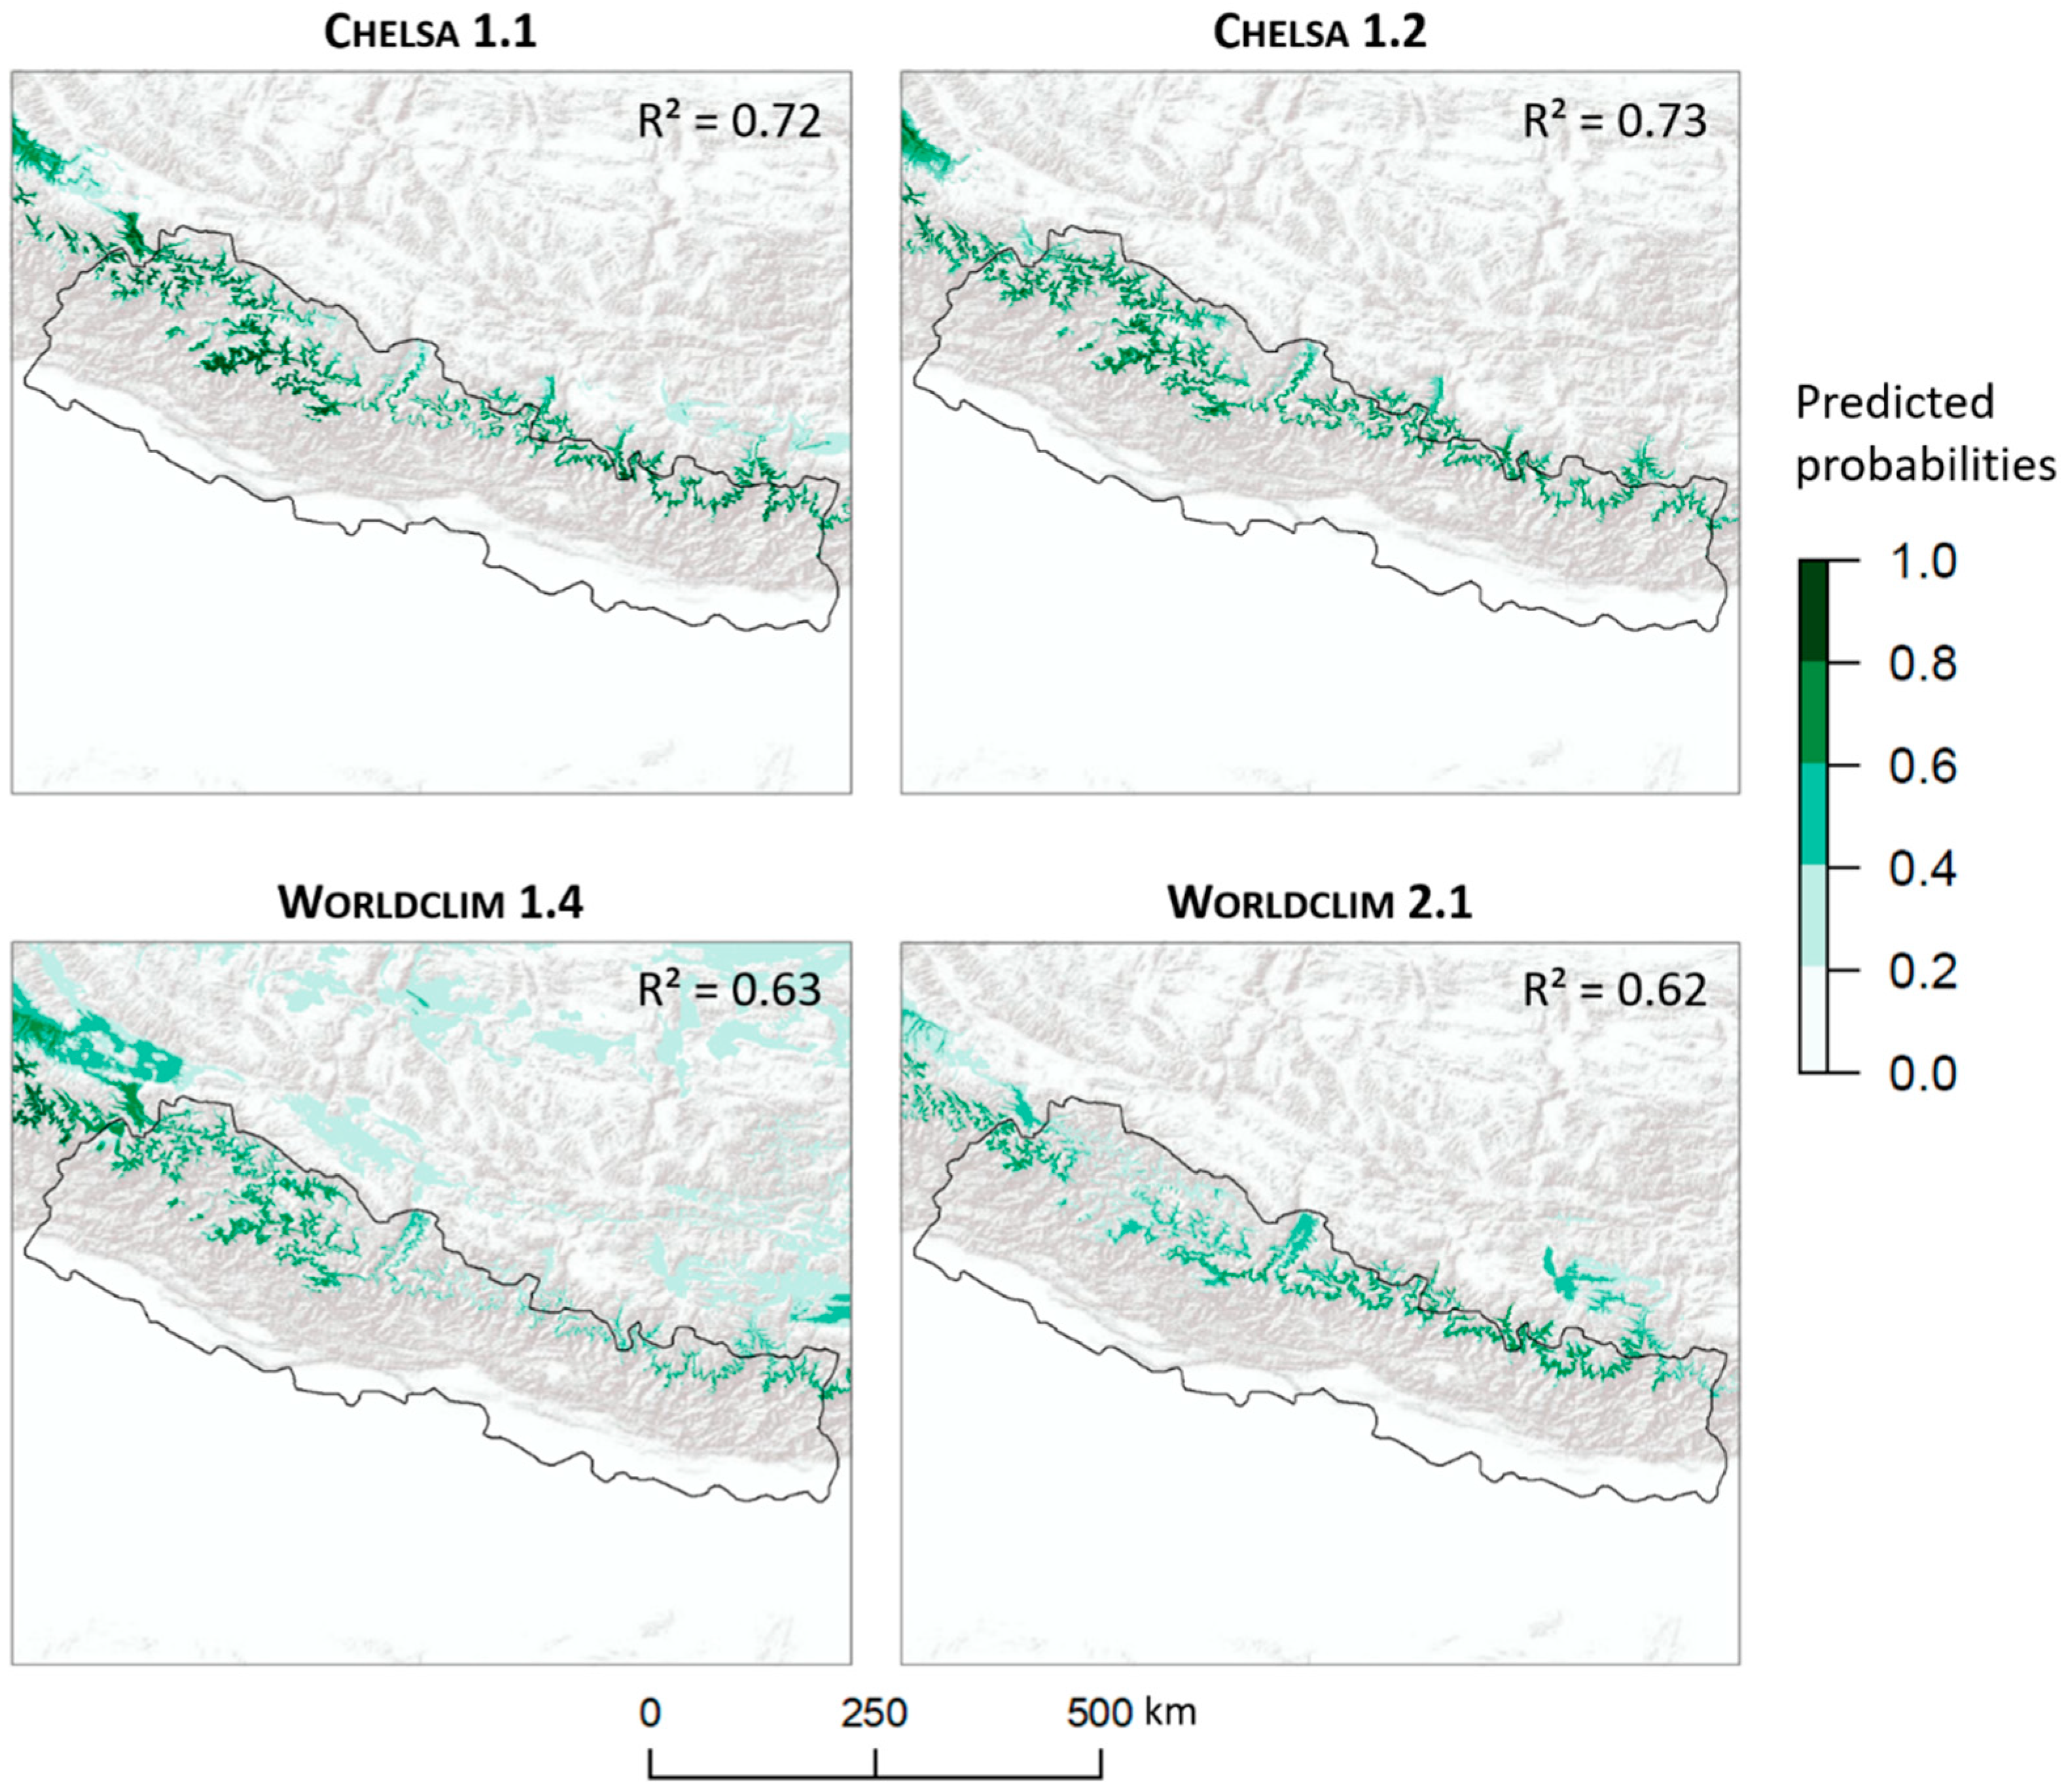
Although the modeled potential distribution of Betula utilis stretches along the Himalayan mountain range, we found significant differences in the explained variance between the models using the different climate datasets (Friedmann X2 = 9.96, p ≤ 0.05), but not among respective versions (Figure 5). Explained variance was highest for Chelsa 1.2 with 73%, followed by Chelsa 1.1 (72%), whereas Worldclim 1.4 and Worldclim 2.1 received considerably lower explained variances, with 63% and 62%, respectively. Chelsa-related model predictions generally show higher predicted values compared to Worldclim-related predictions, resulting in significant differences between Chelsa 1.1 and Worldclim 1.4 (p ≤ 0.05), Chelsa 1.1 and Worldclim 2.1 (p ≤ 0.05), as well as between Chelsa 1.2 and Worldclim 1.4 (p ≤ 0.01), and Chelsa 1.2 and Worldclim 2.1 (p ≤ 0.01). Models based on Chelsa climate datasets predict the potential distribution of B. utilis as a narrow band stretching along the Himalayan arc, whereas predictions of version 1.2 are slightly more narrow and uniform. Using Worldclim versions, model predictions were opposed to each other, with predictions based on Worldclim 1.4 failing to predict B. utilis in Central and East Nepal, and those based on Worldclim 2.1 in the western part of Nepal.
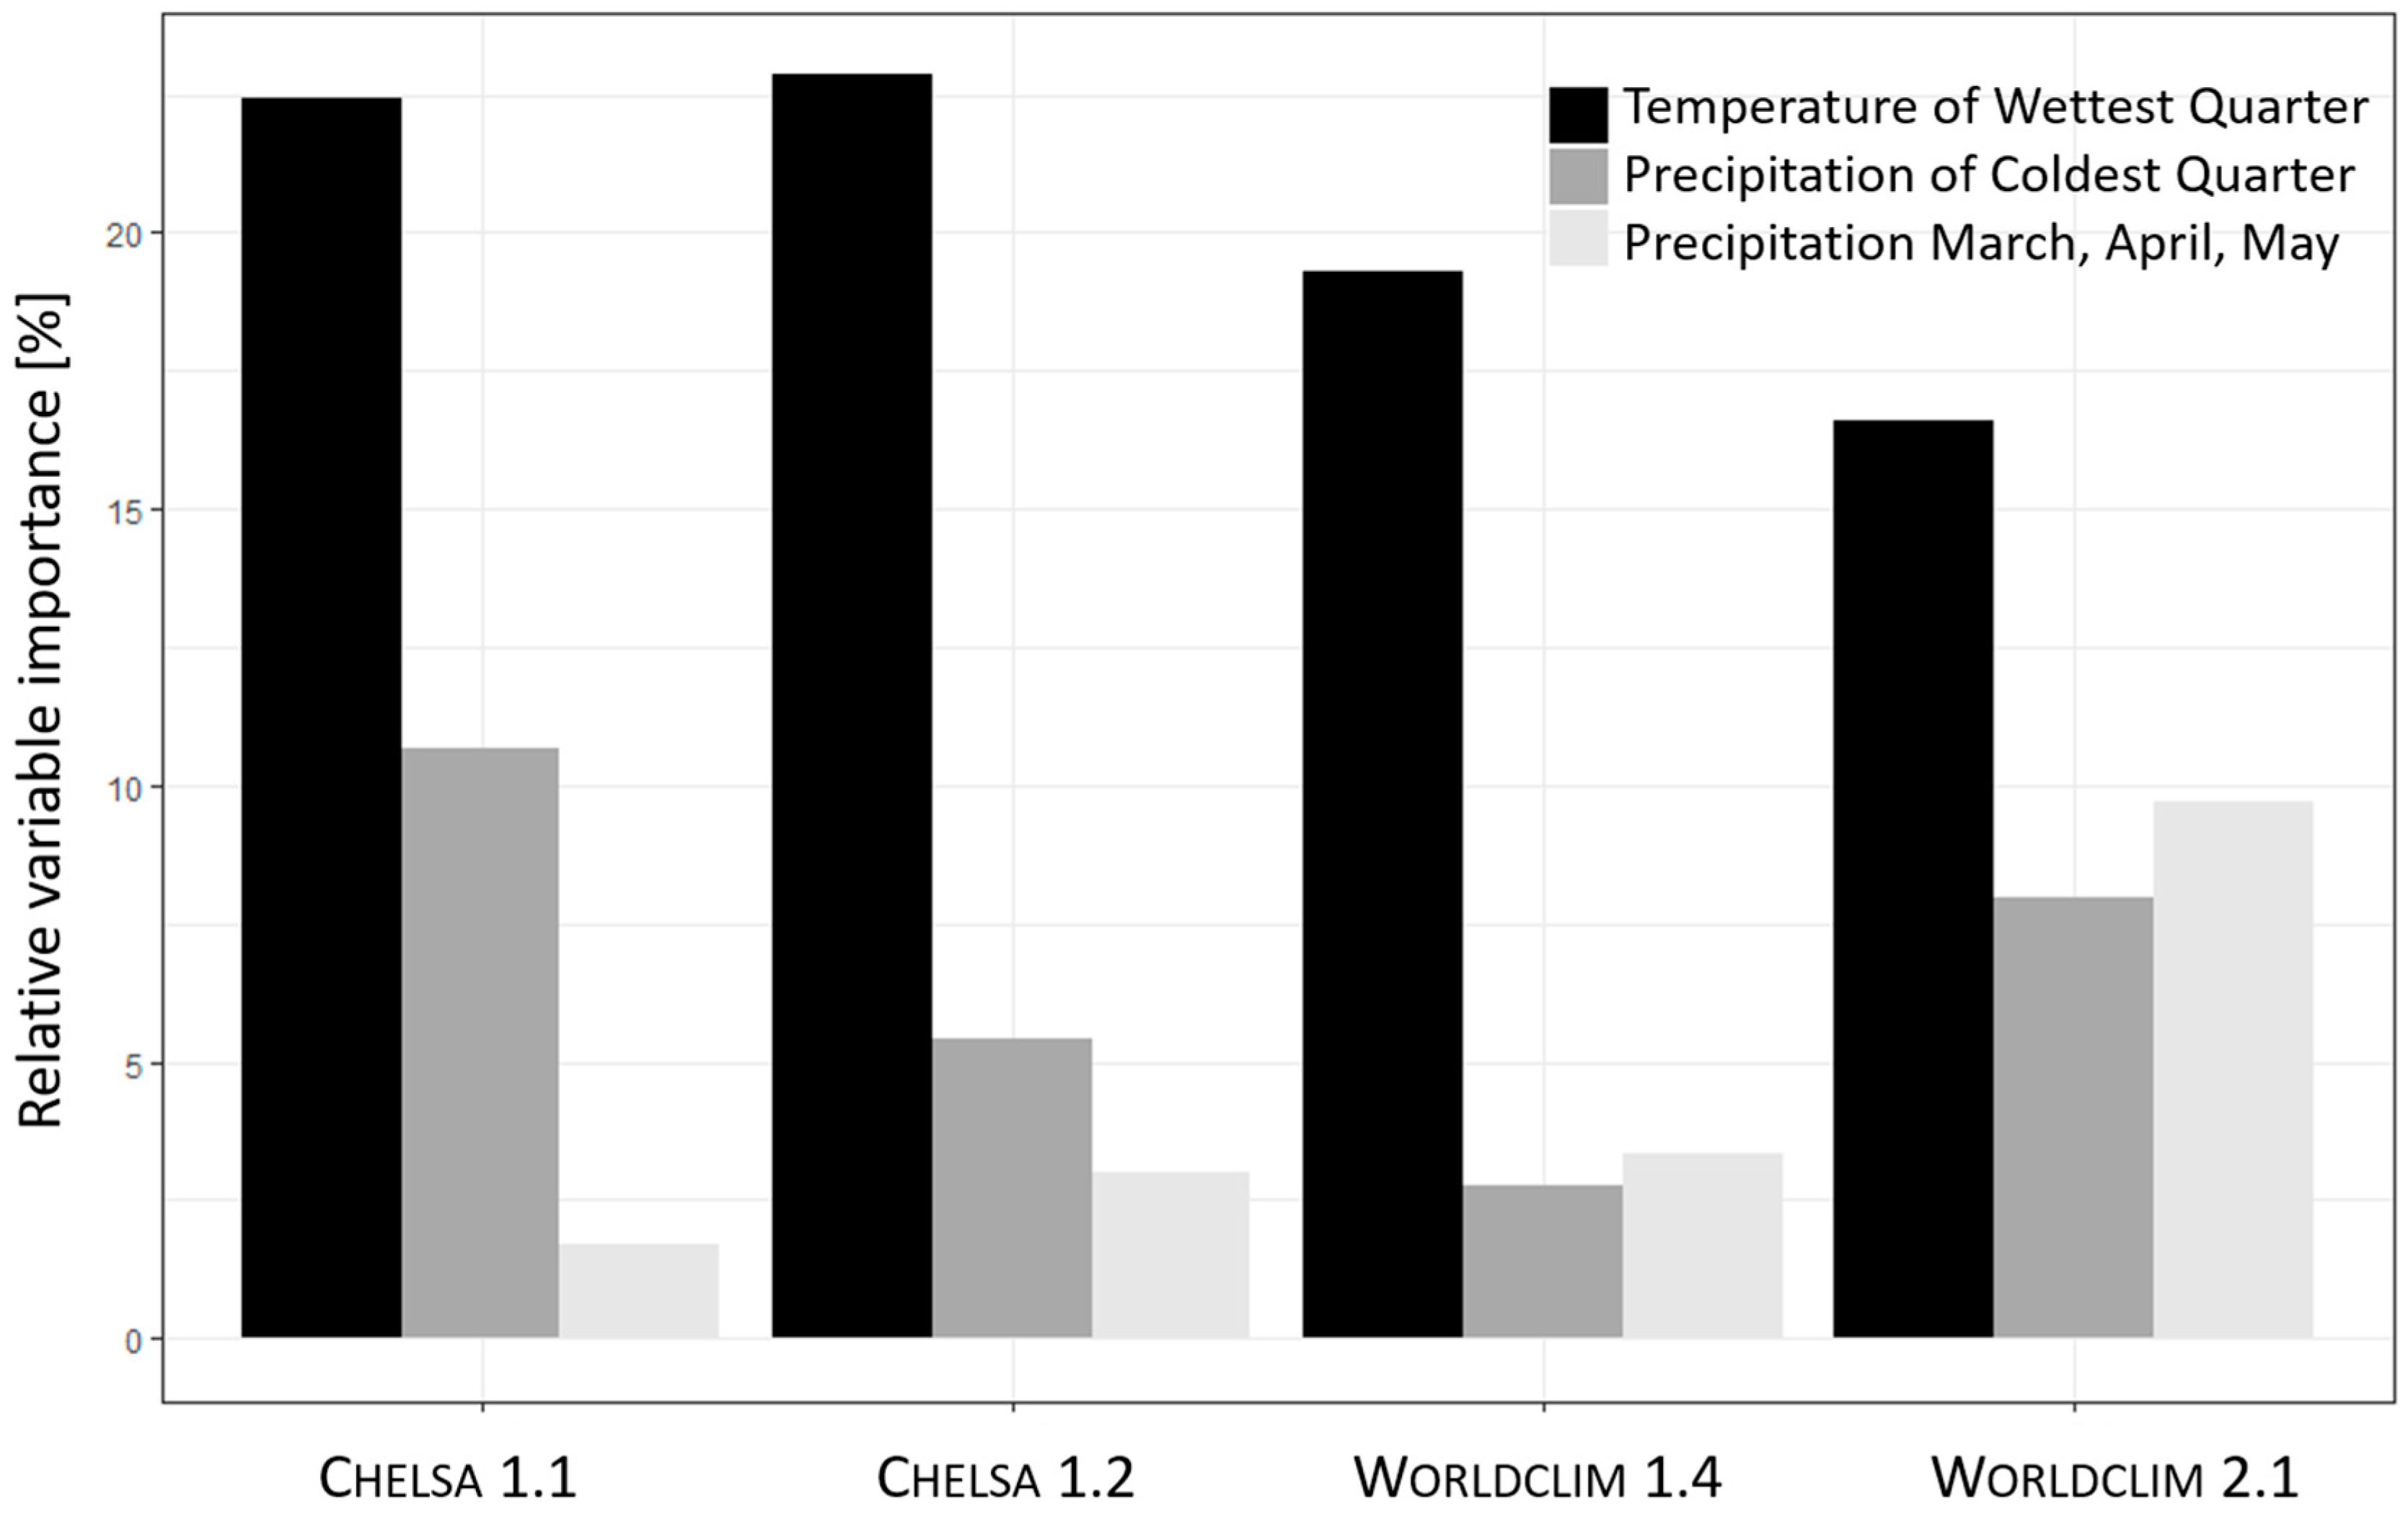
We found conspicuous differences between variable importance for models based on climate datasets, whereas Mean Temperature of the Wettest Quarter gained the highest values for all models (Figure 6). Precipitation of the Coldest Quarter reached relative importance between 5.4% (Chelsa 1.2) and 11% (Chelsa 1.1). For models based on Worldclim 1.4, variable importance for Mean Temperature of Wettest Quarter and Average Precipitation in March, April, and May was considerably lower (<3%). Most balanced variable importance was found for models based on Worldclim 2.1. The relative importance of Average Precipitation in March, April, and May was always higher for Worldclim-based models than for Chelsa-based models.

3.3. Comparison of Future Projections between Chelsa and Worldclim

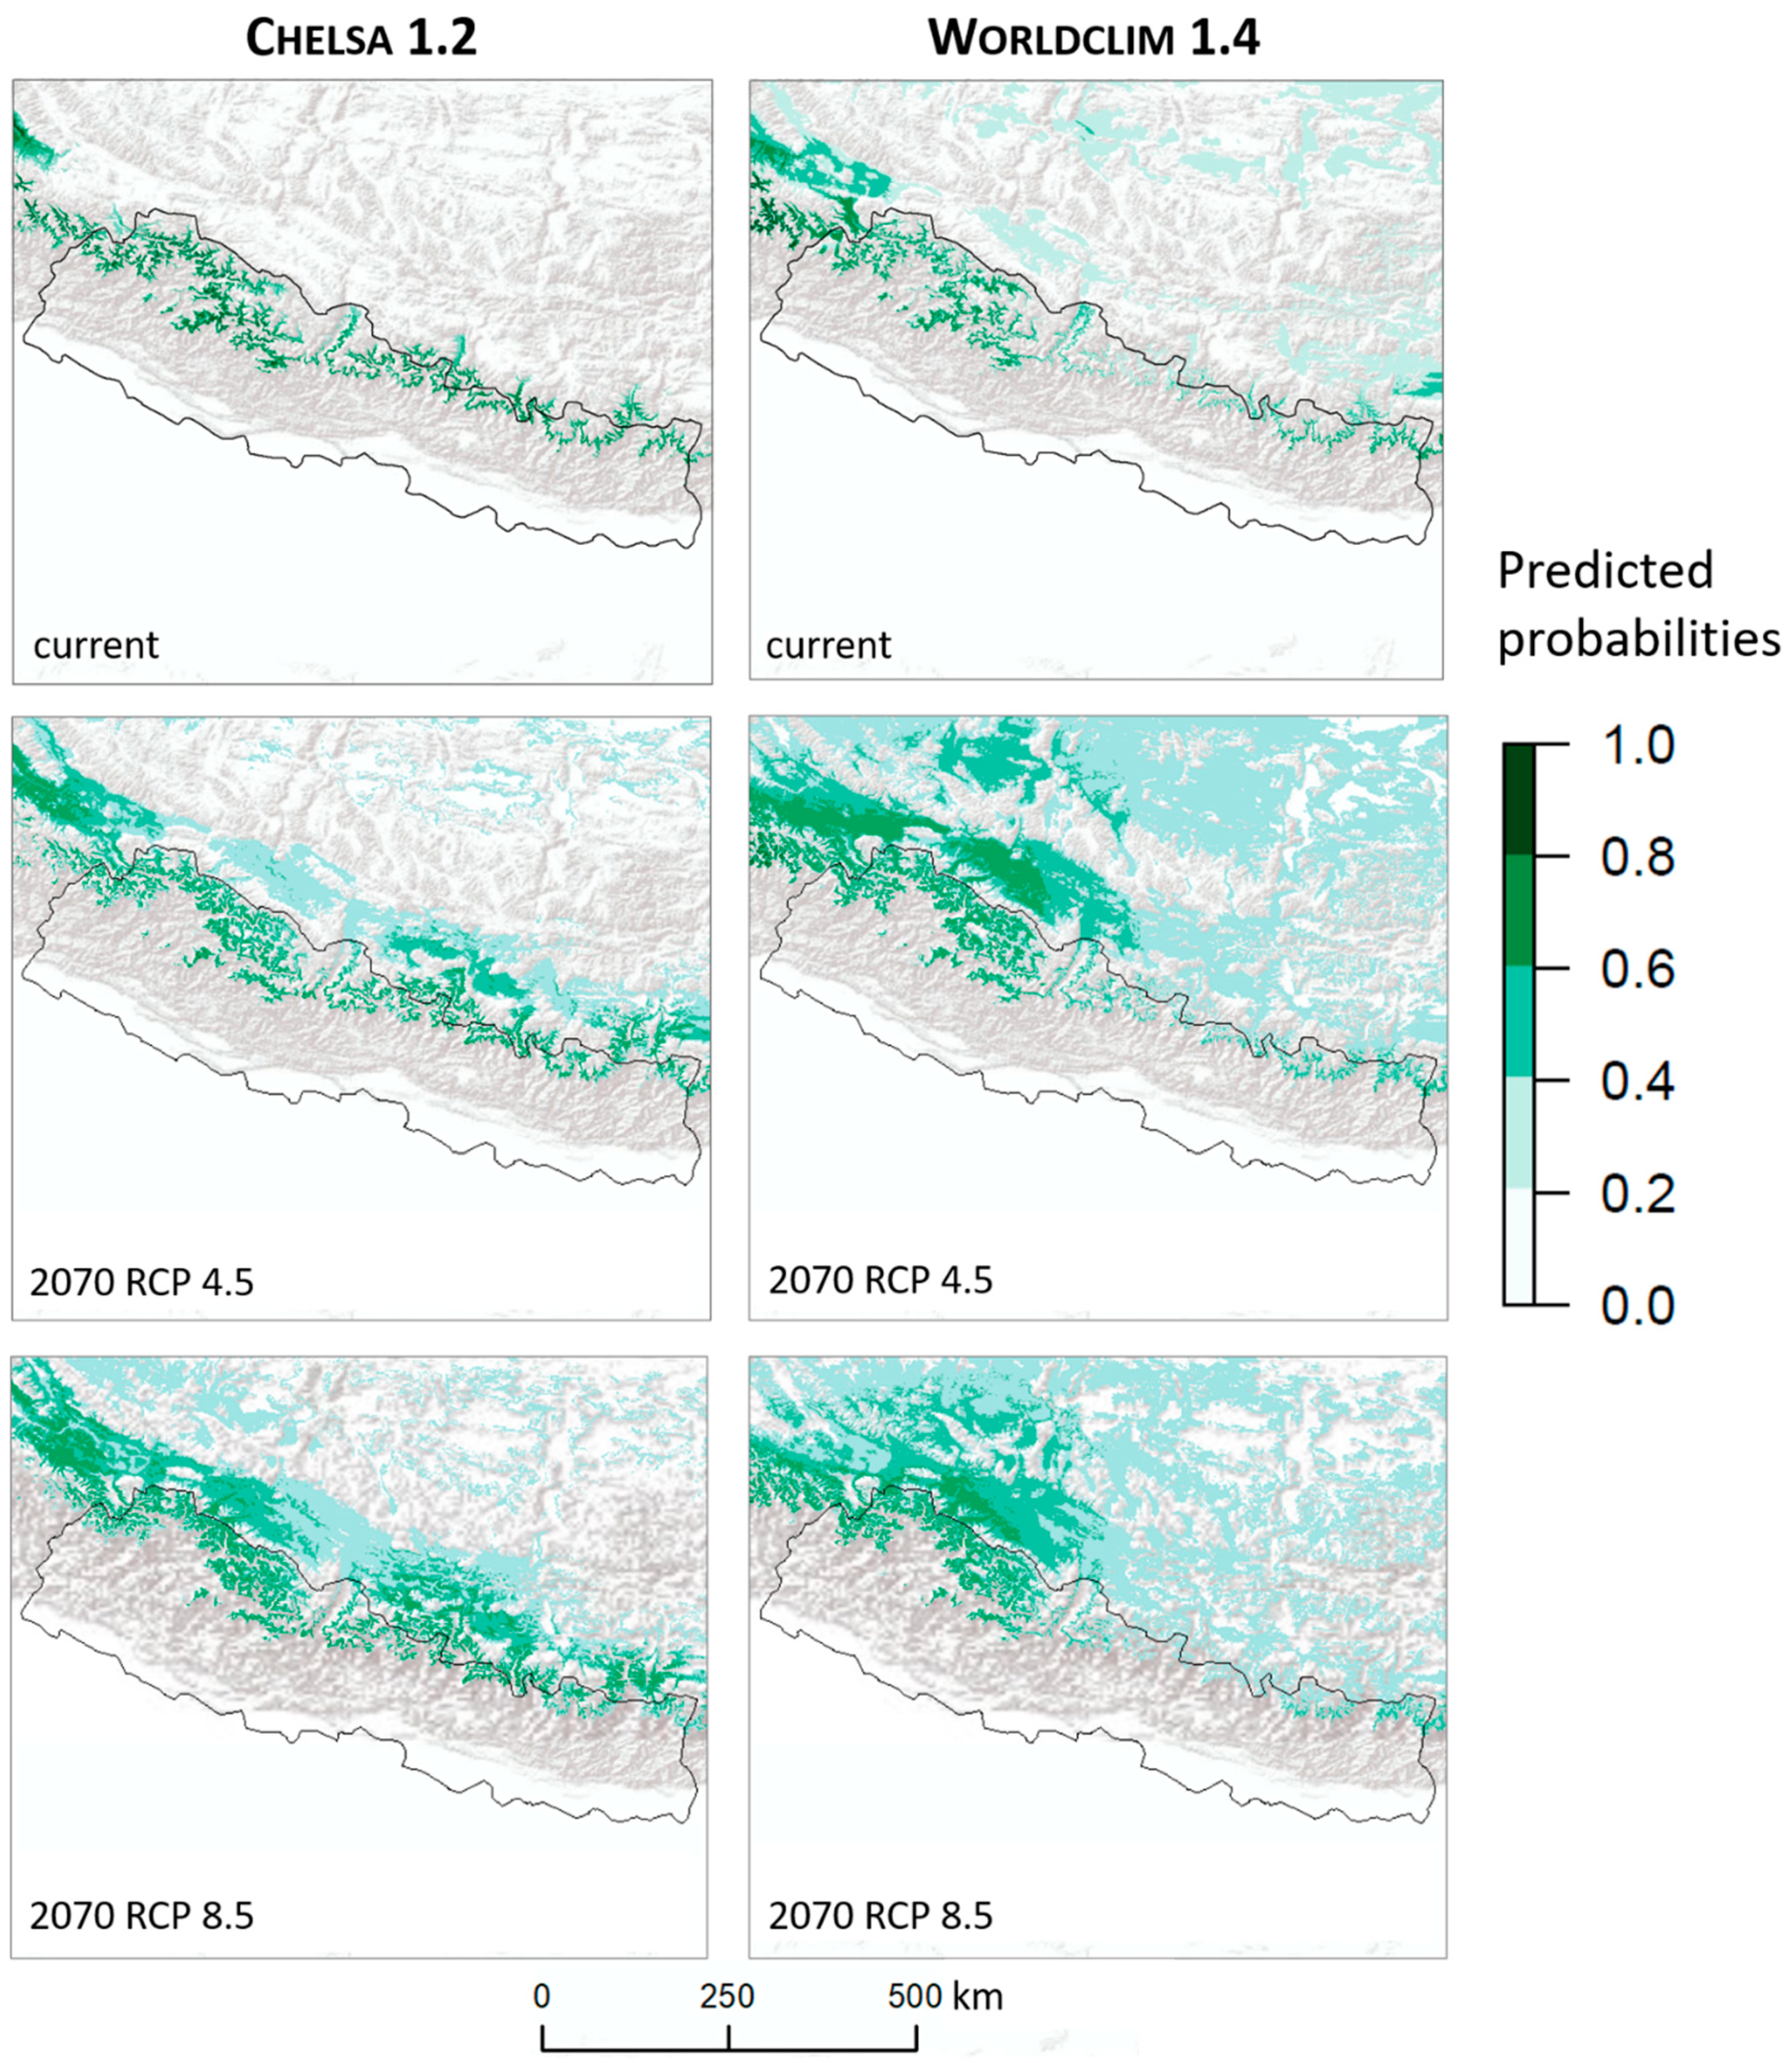
For demonstration purposes, we projected model predictions under future climate conditions in 2070 using the Community Climate System Model (CCSM4, [58]) of the American National Center for Atmospheric Research (NCAR) for RCPs 4.5 and 8.5 for each climate dataset where future scenarios were available at 30 arc seconds resolution. Differences between the model projections of Chelsa 1.2 and Worldclim 1.4 could hardly be greater (Figure 7). Chelsa future model projection with RCP 4.5 shows a shift of suitable habitat of B. utilis to higher elevations, whereas suitable habitat is no longer projected as a narrow vegetation belt but becomes blurred towards the upper distributional limits. This trend is reinforced under RCP 8.5, where suitable habitat is projected at even higher elevations and on the Tibetan plateau. Based on Chelsa, an increase in potentially suitable habitat for B. utilis is projected under both RCPs. Based on Worldclim future climate projections, a totally different picture emerges with the potential distribution of B. utilis being mainly predicted in west Nepal, and future projections being overruled by the artefact-adhesive data. This leads, for both RCPs, to a projected future distribution on the Tibetan plateau, which is skewed to the western part of the study area. Under RCP 4.5, the potential habitat is projected as more extensive compared to RCP 8.5.

4. Discussion

4.1. How Does the Methodology of Climate Datasets Influence Model Performance and Predictions?

Freely downloadable climate data with global extent and high resolution (~1 km) have led to a tremendous increase in ecological modeling studies predicting local to global distributional ranges of species under current, future, and past climatic conditions. Such modeling studies are often conducted without evaluation and comparison of climate data quality. The most profound effect on climate data quality can be attributed to solid databases of input parameters (i.e., long-term meteorological records and high density of weather stations). This constitutes the major challenge for global climate datasets since weather stations’ distribution is highly uneven due to accessibility and funding, resulting in a poor data basis for regions with high climatic variability (i.e., mountainous regions, coastal areas, and lowland rainforests in the tropics) [62,63,64]. Although both climate datasets use in parts the same raw data (i.e., weather station data) to produce the bioclimatic raster-layers, we found striking differences, especially for precipitation-related variables. For temperature-related variables, differences were not paramount due to the negative correlation between altitude and temperature, allowing only little room for variation. Further, smaller annual and diurnal ranges (e.g., −14 to 22 °C) of variations in temperatures as well as more bell-shaped distributions of near-surface air temperatures compared to monthly precipitation sums (e.g., 31 to 1620 mm) with highly skewed gamma distributions result in much higher disparities for spatial rainfall climatologies.
The quantity and quality of raw data, applied methodology, and subsequent bias correction are key to understanding differences between the climate datasets. For regions like Europe and Northern America with high densities of weather stations, Worldclim performs well for stations which were used in modeling but fails to predict between stations [34]. Although in Worldclim 2.1 more weather station data were utilized, the interpolation approach can be regarded as inferior to statistical downscaling approaches or climatologies based on remote sensing for ecological approaches [34,63]. Contrary to Worldclim, the challenge of the heterogeneity of spatial and temporal distribution of weather station data incorporated in Chelsa was addressed with a Model Output Statistics algorithm for ERA-Interim reanalysis data, which was corrected using gauge-derived products from the GPCC and the GHCN datasets [34].
For remote mountainous regions with low weather station density and complex topography, climate modeling constitutes a challenging endeavor, since local-scale atmospheric processes, which cause site-specific topo-climatic conditions, have to be included in the final product. Generally, local-scale atmospheric conditions are mainly influenced by the underlying terrain, leading to a complex temperature pattern due to anisotropic heating at different slope positions as well as cold air drainage and pooling in mountain valleys during autochthonous weather conditions [35]. Likewise, the spatial pattern of precipitation is influenced by windward and leeward slope positions, leading to hyper-humid climate conditions at the southern declivity of the Himalayan range and semi-arid to arid conditions in the Trans-Himalayan valleys.
For Europe, Marchi et al. [65] assessed good representativeness for mean annual temperature, but high discrepancies for mean annual precipitation between Worldclim 1.4 and climate observations. Generally, they stress that the main shortcoming of Worldclim 1.4 is the lack of reliable precipitation values due to its low spatial and temporal autocorrelation and missing statistical relationships with physiographic parameters like elevation. The lacking capability of Worldclim 1.4 to capture precipitation in mountainous regions has been debated (e.g., in References [61,65,66,67,68]). To overcome this challenge, the Chelsa climate dataset includes orographic wind effects and boundary layers in the validation of the main correction step to increase validity of precipitation at stations before downscaling to 1 km resolution [34]. Overall, Chelsa shows more plausible precipitation values compared to Worldclim for our study region, confirming better precipitation patterns compared to Worldclim versions, as stated in Karger et al. [34]. Nevertheless, some limitations to precipitation variables of Chelsa 1.2 exist due to the interpolation of station-derived biases, especially for complex terrain with low densities in either windward and leeward areas (e.g., the Himalayas and the Tibetan Plateau).

4.2. Modeling Treeline Species—Oversimplifying Treeline Dynamics?

In general, global climate datasets are rarely robustly evaluated for ecological applications and ecologists often do not account for afflicted uncertainties in their studies [64]. Comparisons and investigations on shortcomings and uncertainties in climate datasets remain largely out of focus in ecological modeling studies (e.g., in References [62,63,64,69,70,71,72,73,74]) and the number of ecological modeling studies in the Himalayas incorporating robust evaluations of climate datasets is very limited (e.g., [42,43,44]). Bobrowski and Schickhoff [44] and Suwal et al. [43] compared Chelsa 1.1 and Worldclim 1.4 under current climate conditions. The former focused on B. utilis, a principal treeline species along the Himalayan arc, while the latter modeled the ecological niche of two Macaca assamensis subspecies in the Hindu-Kush-Himalaya region. Bobrowski and Schickhoff [44] found significantly better results for Chelsa climate data compared to Worldclim. In contrast, Suwal et al. [43] found marginally better results for Worldclim 1.4, however, differences between their model performance criteria were neither statistically validated nor comprehensively discussed in terms of climatological plausibility. Additionally, they modeled potential future range shifts using Worldclim climate data since future Chelsa climate data were not available at that time. Datta et al. [42] compared Chelsa 1.2 and Worldclim 2 under the current climate for modeling Ageratina adenophora in South Asia and concluded marginally better results for Worldclim 2, which were likewise not statistically validated. Although they provided several reasons for their findings, profound climatological explanations in relation to the methodology of the used climate datasets were missing. In order to gauge the potential and challenges of global climate datasets for meso- and macro-scale studies, a critical examination of climate data generation approaches and their ability to capture the underlying climatological processes is mandatory. Our findings expand and update former research of Bobrowski and Schickhoff [44], as most prominent climate datasets and their versions were evaluated for modeling the ecological niche of B. utilis in Nepal with regard to underlying databases, methodological approaches, and their application for ecological models in remote high-altitude regions. In recently published modeling studies on B. utilis in the Himalayas, a critical examination of uncertainties and limitations of global climate datasets has not been carried out (for Worldclim, e.g., References [75,76,77,78,79,80,81]; for Chelsa, e.g., [37]).
We demonstrated the effect of different climate datasets on model performance and prediction plausibility and found major differences between model predictions and serious shortcomings that can be attributed to flawed climate predictors of the respective climate datasets. Model predictions based on Chelsa climate datasets performed significantly better, regarding the explained variance in the test data, than models based on Worldclim (Friedmann X2 = 9.96, p ≤ 0.05). A comparison among versions of Chelsa revealed no significant differences, while Chelsa 1.2 received the highest explained variance. However, the latest version should not be favored without carefully verifying afflicted distortions of precipitation amounts. To conclude, more plausible precipitation estimates for Chelsa 1.1 compared to Chelsa 1.2 can be found. Thus, Chelsa 1.1 should be preferred when modeling the ecological niche of B. utilis in Nepal. Although Fick and Hijmans [32] highlight significant improvements of Worldclim 2.1 compared to the former version 1.4, we found no significant differences when modeling the ecological niche of B. utilis in Nepal. Especially, the variable Precipitation of Coldest Quarter reflects biased precipitation values similarly skewed towards the Tibetan plateau. We confirmed shortcomings of both Worldclim versions regarding model performance for our case study detected for Worldclim 1.4 in a previous study [44].
Additionally, we found differences in contributions to variable importance between the climate datasets, with all models showing highest importance for temperature during the growing season (i.e., Temperature of Wettest Quarter). These findings are in accordance with the primary dependency of alpine treelines on low air and soil temperatures during growing season [82,83,84]. In general, the position of treelines is controlled by heat deficiency, leading to high susceptibility to climate change impacts [9,85]. For precipitation-related variables, which obtained overall lower importance, Precipitation of the Coldest Quarter was higher for models based on Chelsa climate datasets. The role of thickness and snow cover providing sufficient moisture at the beginning of the growing season for Betula forests has been emphasized [1,86,87,88]. However, Worldclim climate datasets inherit high biases in precipitation values for the coldest quarter. The climate at treeline sites ranges from more continental in the NW to more oceanic in the SE of the Himalayan mountain system. The amount of annual precipitation increases with increasing monsoonal influence in the same direction along the southern front of the range [15,89]. Average Precipitation of March, April, and May showed higher importance in models using Worldclim, although precipitation amounts are highly patchily distributed, neglecting the degree of continentality towards the eastern part of the Himalayan mountains.
Furthermore, we demonstrated how flawed predictions under current climate conditions impact future projections. The striking differences between Chelsa- and Worldclim-based projections emerge from incoherent values of the reference period (i.e., current climate conditions). Although Chelsa projects a more conservative distribution in 2070 for both scenarios, extensive care in interpretation should be taken since only one GCM has been projected. Robustness of projections can be increased by comparing multiple GCMs [90]. Wrong assumptions could lead to severe consequences, when these predictions are used to implement conservation strategies without quantification of afflicted uncertainties [91,92,93].

4.3. Implications for Future Research

Global climate datasets often neither capture local-scale physical features nor satisfy requirements for climate impact studies [62,64,94]. Furthermore, they have been found to be inferior to local fine-scale climate datasets [69,95,96], whereas climate data with higher resolution (<1 km), capturing microclimates and spatial heterogeneity, shows increased prediction accuracy when modeling species in mountainous regions [97,98,99,100]. Moreover, local, fine-grained climate datasets (250 m) intended for ecological applications have been shown to improve model performance by incorporating climate variability and average extremes [101]. Especially in the course of climate change, the role of microrefugia in topographically complex regions may be emphasized depending on spatiotemporal extent and resolution of the studied area [102,103]. Data on microclimate in mountainous regions is needed to assess changes in species distributions (e.g., extinction, upward shift, range contraction) [104,105,106], but is often not covered in coarse grain, global climate datasets (i.e., Chelsa and Worldclim).
Due to high resolution and spatial and temporal continuity without geographical biases, variables derived from remote sensing products present a valuable option and have been successfully applied to improve ecological models [63,107]. Most notably, information on topo-climate conditions (e.g., elevation, aspect, slope, solar insolation) are vital in mountainous regions, and can be obtained via high-resolution Global Digital Elevation Models (30 m) [108]. In addition, availability and resolution of remote sensing products for ecological applications are advancing, offering great potential for future studies. Currently, a purely remotely sensed bioclimatic predictor set at global extent is available at 2.5 arc minutes [109]. The “classical” modeling approach of bioclimatic and topographical predictors can be enhanced by remotely sensed products of cloud cover [110], snow cover [111], and soil moisture [112] to derive tailored predictors for ecological models. Remotely sensed land surface temperature (LST) and precipitation derivates such as cloud cover were found to provide fair substitutes for climate data derived from Chelsa, when modeling the ecological niche of B. utilis in the Himalayas [36,113]. Moreover, the potential of remotely sensed data as proxies for interpolated weather station data could be confirmed [114]. To generate fine spatiotemporal microclimate consisting of current, future, and past predictors of sufficient extent, Lembrechts et al. [115] proposed a combination of in situ microclimate measurements, long-term weather station data, and high-resolution remote sensing data (e.g., airborne LiDAR and hyperspectral images). Different approaches to reduce errors in climate datasets have been proposed, such as improvement of physics in models, quantification of uncertainty by applying multi-model ensembles, and climate data post-processing to remove model biases [116,117]. However, for the first approach, high research effort is needed, whereas the latter requires tremendous computational power.
Climate data sources and subsequent predictor variables’ selection are dependent on the target species and on temporal and spatial extent of the studied region, and may vary between taxa and growth forms, especially in mountainous regions [118]. Incorporation of ecophysiological predictors, other than climate, are needed for complete niche quantification and thus will increase predictive power of the ecological model [119,120,121]. In other words, although treeline elevations can be attributed to prevailing thermal conditions, climate is not the exclusive factor and information on further abiotic and biotic factors driving species distribution are needed to account for species–environment relationships, interactions, and dynamics. To date, an array of additional, standardized predictor variable sets have been published, e.g., CliMond [122,123], EcoClimate [124], ENVIREM [125], MERRAclim [109], and CMCC-BioClimInd [126], varying in spatio-temporal resolution (from ~1 to ~340 km at the equator). The spatial resolution of ≥1 km may be too coarse to account for differences between slopes in topographically heterogeneous regions like the Himalayas, yet their comparison and evaluation in ecological modeling studies remains an open question.

5. Conclusions

Climate modeling and thus ecological modeling using climatic predictors face numerous challenges in high-altitude regions. The most important constraint is data availability, which is often sparse due to poor accessibility of the terrain. In many ecological studies, the investigation and evaluation of climate datasets are neglected. Global climate datasets often do not account for local climatic conditions in topographically heterogeneous landscapes due to their quantitatively limited weather station data, computation method, and relatively coarse resolution (≥1 km). Depending on spatial and temporal scales, these climate datasets lack precision of local temperature and precipitation patterns and thus may lead to flawed climate grids used in ecological modeling studies.
Although climate is not exclusively delimiting species niches in mountainous regions, it is an indispensable prerequisite as species occurrences and their dynamics at treelines are governed by low temperatures and local precipitation regimes. Incorporation of further local abiotic and biotic important factors in ecological models are mandatory to account for species’ ecophysiological needs, dispersal abilities, biotic interactions, site-specific processes, and their interrelations.
We showed that unmindful usage of global climate datasets may have severe consequences for modeling treeline species in remote high-altitude regions under current climatic conditions, and even more so if flawed current model predictions provide the basis for future projections. These results deepen our understanding of model performance and prediction plausibility related to climate data quality for treeline species in remote high-altitude regions and stress the need for interdisciplinary investigations to advance climate and ecological model quality. Especially in remote high-altitude regions, the underlying data basis of climate models needs urgent improvements, such as quality and quantity of weather station data, predictors, computation methodology, and resolution. However, coherent investigations of afflicted shortcomings and uncertainties in climate data and limitations of ecological model prediction accuracy will remain an essential basis for future modeling studies in high-altitude ecosystems with limited data availability. We advocate a closer collaboration between climate scientists and ecologists to develop high temporal and spatial resolution climate datasets intended for ecological applications, and thus also for conservation strategies.

Author Contributions

Conceptualization, formal analysis, methodology, software, validation, visualization and writing—original draft preparation, M.B.; writing—review and editing, M.B., J.W., and U.S. All authors have read and agreed to the published version of the manuscript.

Funding

This research received no external funding.

Institutional Review Board Statement

Not applicable.

Informed Consent Statement

Not applicable.

Data Availability Statement

Worldclim climate data version 1.4 were downloaded via https://www.worldclim.org/data/v1.4/worldclim14.html (accessed on 21 April 2021) and Worldclim climate data version 2.1 via https://www.worldclim.org/data/worldclim21.html (accessed on 21 April 2021). Chelsa climate data version 1.1 were downloaded via https://cera-www.dkrz.de/WDCC/ui/cerasearch/entry?acronym=CHELSA_v1_1 (accessed on 21 April 2021) and Chelsa climate data version 1.2 were downloaded via https://envicloud.wsl.ch/#/?prefix=chelsa%2Fchelsa_V1%2Fclimatologies (accessed on 21 April 2021).

Acknowledgments

We express our gratitude to Himalayan colleagues, guides and local people who accompanied us on numerous field trips to Betula treelines. Additionally, we would like to thank three anonymous reviewers for their comments and suggestions.

Conflicts of Interest

The authors declare no conflict of interest.

References

  1. Troll, C. The three-dimensional zonation of the Himalayan system. In Geoecology of the High-Mountain Regions of Eurasia; Troll, C., Ed.; Erdwissenschaftliche Forschung IV; Franz Steiner: Wiesbaden, Germany, 1972; pp. 264–275. [Google Scholar]
  2. Zurick, D.; Pacheco, J. Illustrated Atlas of the Himalaya; University Press of Kentucky: Lexington, KY, USA, 2006; ISBN 978-0-8131-2388-2. [Google Scholar]
  3. Miehe, G. Landscapes of Nepal. In Nepal: An Introduction to the Natural History, Ecology and Human Environment of the Himalayas; Miehe, G., Pendry, C.A., Chaudhary, R.P., Eds.; Royal Botanic Garden: Edinburgh, UK, 2015; pp. 7–16. ISBN 978-1-910877-02-9. [Google Scholar]
  4. Singh, P.; Dash, S.S. Plant diversity in Indian Himalayan regions: An overview. In Plant Diversity in the Himalaya Hotspot Region; Das, A.P., Bera, S., Eds.; Bishen Singh Mahendra Pal Singh: Dehra Dun, India, 2018; pp. 1–43. ISBN 978-81-211-0946-8. [Google Scholar]
  5. Xu, J.; Badola, R.; Chettri, N.; Chaudhary, R.P.; Zomer, R.; Pokhrel, B.; Hussain, S.A.; Pradhan, S.; Pradhan, R. Sustaining Biodiversity and Ecosystem Services in the Hindu Kush Himalaya. In The Hindu Kush Himalaya Assessment: Mountains, Climate Change, Sustainability and People; Wester, P., Mishra, A., Mukherji, A., Shrestha, A.B., Eds.; Springer International Publishing: Cham, Switzerland, 2019; pp. 127–165. ISBN 978-3-319-92288-1. [Google Scholar]
  6. Rajbhandary, S.; Siwakoti, M.; Rai, S.K.; Jha, P.K. An Overview of Plant Diversity in Nepal. In Plant Diversity in Nepal; Siwakoti, M., Jha, P.K., Rajbhandary, S., Eds.; Botanical Society of Nepal: Kathmandu, Nepal, 2020; pp. 1–15. ISBN 978-81-211-0106-6. [Google Scholar]
  7. Schickhoff, U.; Bobrowski, M.; Böhner, J.; Bürzle, B.; Chaudhary, R.P.; Gerlitz, L.; Heyken, H.; Lange, J.; Müller, M.; Scholten, T.; et al. Do Himalayan Treelines Respond to Recent Climate Change? An Evaluation of Sensitivity Indicators. Earth Syst. Dyn. 2015, 6, 245–265. [Google Scholar] [CrossRef]
  8. Malanson, G.P.; Resler, L.M.; Butler, D.R.; Fagre, D.B. Mountain Plant Communities: Uncertain Sentinels? Prog. Phys. Geogr. Earth Environ. 2019, 43, 521–543. [Google Scholar] [CrossRef]
  9. Holtmeier, F.-K.; Broll, G. Treeline Research—From the Roots of the Past to Present Time. A Review. Forests 2019, 11, 38. [Google Scholar] [CrossRef] [Green Version]
  10. Theurillat, J.-P.; Guisan, A. Potential Impact of Climate Change on Vegetation in the European Alps: A Review. Clim. Chang. 2001, 50, 77–109. [Google Scholar] [CrossRef]
  11. Bell, D.M.; Bradford, J.B.; Lauenroth, W.K. Mountain Landscapes Offer Few Opportunities for High-Elevation Tree Species Migration. Glob. Chang. Biol. 2014, 20, 1441–1451. [Google Scholar] [CrossRef] [PubMed]
  12. Braunisch, V.; Coppes, J.; Arlettaz, R.; Suchant, R.; Schmid, H.; Bollmann, K. Selecting from Correlated Climate Variables: A Major Source of Uncertainty for Predicting Species Distributions under Climate Change. Ecography 2013, 36, 971–983. [Google Scholar] [CrossRef]
  13. Halofsky, J.E.; Andrews-Key, S.A.; Edwards, J.E.; Johnston, M.H.; Nelson, H.W.; Peterson, D.L.; Schmitt, K.M.; Swanston, C.W.; Williamson, T.B. Adapting Forest Management to Climate Change: The State of Science and Applications in Canada and the United States. For. Ecol. Manag. 2018, 421, 84–97. [Google Scholar] [CrossRef]
  14. Scherrer, D.; Vitasse, Y.; Guisan, A.; Wohlgemuth, T.; Lischke, H. Competition and Demography Rather than Dispersal Limitation Slow down Upward Shifts of Trees’ Upper Elevation Limits in the Alps. J. Ecol. 2020, 108, 2416–2430. [Google Scholar] [CrossRef]
  15. Schickhoff, U. The Upper Timberline in the Himalayas, Hindu Kush and Karakorum: A Review of Geographical and Ecological Aspects. In Mountain Ecosystems; Broll, G., Keplin, B., Eds.; Springer: Berlin/Heidelberg, Germany, 2005; pp. 275–354. ISBN 978-3-540-24325-0. [Google Scholar]
  16. Telwala, Y.; Brook, B.W.; Manish, K.; Pandit, M.K. Climate-Induced Elevational Range Shifts and Increase in Plant Species Richness in a Himalayan Biodiversity Epicentre. PLoS ONE 2013, 8, e57103. [Google Scholar] [CrossRef] [Green Version]
  17. Dutta, P.K.; Dutta, B.K.; Das, A.K.; Sundriyal, R.C. Alpine Timberline Research Gap in Himalaya: A Literature Review. Indian For. 2014, 140, 419–427. [Google Scholar]
  18. Bobrowski, M.; Weidinger, J.; Schwab, N.; Schickhoff, U. Searching for Ecology in Species Distribution Models in the Himalayas. Ecol. Model. under review.
  19. Werkowska, W.; Márquez, A.L.; Real, R.; Acevedo, P. A Practical Overview of Transferability in Species Distribution Modeling. Environ. Rev. 2017, 25, 127–133. [Google Scholar] [CrossRef]
  20. Yates, K.L.; Bouchet, P.J.; Caley, M.J.; Mengersen, K.; Randin, C.F.; Parnell, S.; Fielding, A.H.; Bamford, A.J.; Ban, S.; Barbosa, A.M.; et al. Outstanding Challenges in the Transferability of Ecological Models. Trends Ecol. Evol. 2018, 33, 790–802. [Google Scholar] [CrossRef] [Green Version]
  21. Liu, C.; Wolter, C.; Xian, W.; Jeschke, J.M. Species Distribution Models Have Limited Spatial Transferability for Invasive Species. Ecol. Lett. 2020, 23, 1682–1692. [Google Scholar] [CrossRef]
  22. Elith, J.; Graham, C.H.; Anderson, R.P.; Dudík, M.; Ferrier, S.; Guisan, A.; Hijmans, R.J.; Huettmann, F.; Leathwick, J.R.; Lehmann, A.; et al. Novel Methods Improve Prediction of Species’ Distributions from Occurrence Data. Ecography 2006, 29, 129–151. [Google Scholar] [CrossRef] [Green Version]
  23. Elith, J.; Phillips, S.J.; Hastie, T.; Dudík, M.; Chee, Y.E.; Yates, C.J. A Statistical Explanation of MaxEnt for Ecologists: Statistical Explanation of MaxEnt. Divers. Distrib. 2011, 17, 43–57. [Google Scholar] [CrossRef]
  24. Rocchini, D.; Hortal, J.; Lengyel, S.; Lobo, J.M.; Jiménez-Valverde, A.; Ricotta, C.; Bacaro, G.; Chiarucci, A. Accounting for Uncertainty When Mapping Species Distributions: The Need for Maps of Ignorance. Prog. Phys. Geogr. Earth Environ. 2011, 35, 211–226. [Google Scholar] [CrossRef]
  25. Barbet-Massin, M.; Jiguet, F.; Albert, C.H.; Thuiller, W. Selecting Pseudo-Absences for Species Distribution Models: How, Where and How Many?: How to Use Pseudo-Absences in Niche Modelling? Methods Ecol. Evol. 2012, 3, 327–338. [Google Scholar] [CrossRef]
  26. Dormann, C.F.; Elith, J.; Bacher, S.; Buchmann, C.; Carl, G.; Carré, G.; Marquéz, J.R.G.; Gruber, B.; Lafourcade, B.; Leitão, P.J.; et al. Collinearity: A Review of Methods to Deal with It and a Simulation Study Evaluating Their Performance. Ecography 2013, 36, 27–46. [Google Scholar] [CrossRef]
  27. Franklin, J. Mapping Species Distributions: Spatial Inference and Prediction; Cambridge University Press: Cambridge, UK, 2010; ISBN 978-0-511-81060-2. [Google Scholar]
  28. Saupe, E.E.; Barve, V.; Myers, C.E.; Soberón, J.; Barve, N.; Hensz, C.M.; Peterson, A.T.; Owens, H.L.; Lira-Noriega, A. Variation in Niche and Distribution Model Performance: The Need for a Priori Assessment of Key Causal Factors. Ecol. Model. 2012, 237–238, 11–22. [Google Scholar] [CrossRef]
  29. Allouche, O.; Tsoar, A.; Kadmon, R. Assessing the Accuracy of Species Distribution Models: Prevalence, Kappa and the True Skill Statistic (TSS): Assessing the Accuracy of Distribution Models. J. Appl. Ecol. 2006, 43, 1223–1232. [Google Scholar] [CrossRef]
  30. Lobo, J.M.; Jiménez-Valverde, A.; Real, R. AUC: A Misleading Measure of the Performance of Predictive Distribution Models. Glob. Ecol. Biogeogr. 2008, 17, 145–151. [Google Scholar] [CrossRef]
  31. Hijmans, R.J.; Cameron, S.E.; Parra, J.L.; Jones, P.G.; Jarvis, A. Very High Resolution Interpolated Climate Surfaces for Global Land Areas. Int. J. Climatol. 2005, 25, 1965–1978. [Google Scholar] [CrossRef]
  32. Fick, S.E.; Hijmans, R.J. WorldClim 2: New 1-km Spatial Resolution Climate Surfaces for Global Land Areas. Int. J. Climatol. 2017, 37, 4302–4315. [Google Scholar] [CrossRef]
  33. Karger, D.N.; Conrad, O.; Böhner, J.; Kawohl, T.; Kreft, H.; Soria-Auza, R.W.; Zimmermann, N.E.; Linder, H.P.; Kessler, M. Climatologies at High Resolution for the Earth’s Land Surface Areas. Physics 2016. [Google Scholar] [CrossRef] [PubMed] [Green Version]
  34. Karger, D.N.; Conrad, O.; Böhner, J.; Kawohl, T.; Kreft, H.; Soria-Auza, R.W.; Zimmermann, N.E.; Linder, H.P.; Kessler, M. Climatologies at High Resolution for the Earth’s Land Surface Areas. Sci. Data 2017, 4, 170122. [Google Scholar] [CrossRef] [PubMed] [Green Version]
  35. Bobrowski, M.; Gerlitz, L.; Schickhoff, U. Modelling the Potential Distribution of Betula Utilis in the Himalaya. Glob. Ecol. Conserv. 2017, 11, 69–83. [Google Scholar] [CrossRef]
  36. Bobrowski, M.; Bechtel, B.; Böhner, J.; Oldeland, J.; Weidinger, J.; Schickhoff, U. Application of Thermal and Phenological Land Surface Parameters for Improving Ecological Niche Models of Betula Utilis in the Himalayan Region. Remote Sens. 2018, 10, 814. [Google Scholar] [CrossRef] [Green Version]
  37. Gilani, H.; Arif Goheer, M.; Ahmad, H.; Hussain, K. Under Predicted Climate Change: Distribution and Ecological Niche Modelling of Six Native Tree Species in Gilgit-Baltistan, Pakistan. Ecol. Indic. 2020, 111, 106049. [Google Scholar] [CrossRef]
  38. Kalan, K.; Ivović, V.; Glasnović, P.; Buzan, E. Presence and Potential Distribution of Aedes Albopictus and Aedes Japonicus Japonicus (Diptera: Culicidae) in Slovenia. J. Med. Entomol. 2017, 54, 1510–1518. [Google Scholar] [CrossRef]
  39. Bastidas Osejo, B.; Betancur Vargas, T.; Alejandro Martinez, J. Spatial Distribution of Precipitation and Evapotranspiration Estimates from Worldclim and Chelsa Datasets: Improving Long-Term Water Balance at the Watershed-Scale in the Urabá Region of Colombia. Int. J. Sustain. Dev. Plan. 2019, 14, 105–117. [Google Scholar] [CrossRef]
  40. Charitonidou, M.; Kougioumoutzis, K.; Halley, J.M. An Orchid in Retrograde: Climate-Driven Range Shift Patterns of Ophrys Helenae in Greece. Plants 2021, 10, 470. [Google Scholar] [CrossRef]
  41. Morales-Barbero, J.; Vega-Álvarez, J. Input Matters Matter: Bioclimatic Consistency to Map More Reliable Species Distribution Models. Methods Ecol. Evol. 2019, 10, 212–224. [Google Scholar] [CrossRef]
  42. Datta, A.; Schweiger, O.; Kuehn, I. Origin of Climatic Data Can Determine the Transferability of Species Distribution Models. Neobiota 2020, 61–76. [Google Scholar] [CrossRef]
  43. Suwal, M.K.; Huettmann, F.; Regmi, G.R.; Vetaas, O.R. Parapatric Subspecies of Macaca Assamensis Show a Marginal Overlap in Their Predicted Potential Distribution: Some Elaborations for Modern Conservation Management. Ecol. Evol. 2018, 8, 9712–9727. [Google Scholar] [CrossRef]
  44. Bobrowski, M.; Schickhoff, U. Why Input Matters: Selection of Climate Data Sets for Modelling the Potential Distribution of a Treeline Species in the Himalayan Region. Ecol. Model. 2017, 359, 92–102. [Google Scholar] [CrossRef]
  45. New, M.; Hulme, M.; Jones, P. Representing Twentieth-Century Space–Time Climate Variability. Part I: Development of a 1961–1990 Mean Monthly Terrestrial Climatology. J. Clim. 1999, 12, 28. [Google Scholar] [CrossRef]
  46. New, M.; Hulme, M.; Jones, P. Representing Twentieth-Century Space–Time Climate Variability. Part II: Development of 1901–1996 Monthly Grids of Terrestrial Surface Climate. J. Clim. 2000, 13, 22. [Google Scholar] [CrossRef]
  47. Danielson, J.J.; Gesch, D.B. Global Multi-Resolution Terrain Elevation Data 2010 (GMTED2010); Open-File Report 2011–1073; U.S. Geological Survey: Sioux Falls, SD, USA, 2011; 26p.
  48. Paulsen, J.; Körner, C. A Climate-Based Model to Predict Potential Treeline Position around the Globe. Alp. Bot. 2014, 124, 1–12. [Google Scholar] [CrossRef] [Green Version]
  49. Irl, S.D.H.; Anthelme, F.; Harter, D.E.V.; Jentsch, A.; Lotter, E.; Steinbauer, M.J.; Beierkuhnlein, C. Patterns of Island Treeline Elevation—A Global Perspective. Ecography 2015, 1–10. [Google Scholar] [CrossRef] [Green Version]
  50. Bivand, R.; Rundel, C. Rgeos: Interface to Geometry Engine—Open Source (’GEOS’). R Package Version 0.5-5. 2020. Available online: https://CRAN.R-project.org/package=rgeos (accessed on 21 April 2021).
  51. Bivand, R.; Pebesma, E.; Gomez-Rubio, V. Applied Spatial Data Analysis with R, 2nd ed.; Springer: New York, NY, USA, 2013; ISBN 978-1-4614-7618-4. [Google Scholar]
  52. Kuhn, M. Caret: Classification and Regression Training. R package Version 6.0-86. 2020. Available online: https://CRAN.R-project.org/package=caret (accessed on 21 April 2021).
  53. McGullagh, P.; Nelder, J.A. Generalized Linear Models; Vol. 37 of Monographs on Statistics and Applied Probability, 2nd ed.; Chapman and Hall: London, UK, 1989; ISBN 978-0-412-31760-6. [Google Scholar]
  54. Nagelkerke, N.J.D. A Note on a General Definition of the Coefficient of Determination. Biometrika 1991, 78, 691–692. [Google Scholar] [CrossRef]
  55. Jentsch, H. ClimDatDownloadR: Downloads Climate Data from Chelsa and WorldClim. R Package Version 0.1.5. 2021. Available online: https://gitlab.rrz.uni-hamburg.de/helgejentsch/climdatdownloadr (accessed on 21 April 2021).
  56. Revelle, W. Psych: Procedures for Personality and Psychological Research. Northwestern University, Evanston, IL, USA, R Package Version 2.0.12. 2020. Available online: https://CRAN.R-project.org/package=psych (accessed on 21 April 2021).
  57. Liang, E.; Dawadi, B.; Pederson, N.; Eckstein, D. Is the Growth of Birch at the Upper Timberline in the Himalayas Limited by Moisture or by Temperature? Ecology 2014, 95, 2453–2465. [Google Scholar] [CrossRef] [Green Version]
  58. Gent, P.R.; Danabasoglu, G.; Donner, L.J.; Holland, M.M.; Hunke, E.C.; Jayne, S.R.; Lawrence, D.M.; Neale, R.B.; Rasch, P.J.; Vertenstein, M.; et al. The Community Climate System Model Version 4. J. Clim. 2011, 24, 4973–4991. [Google Scholar] [CrossRef]
  59. R Core Team. R: A Language and Environment for Statistical Computing; R version 4.0.2, R Foundation for Statistical Computing: Vienna, Austria, 2020. [Google Scholar]
  60. ESRI. ArcGIS Desktop: Release 10.7.1 Environmental Systems Research Institute; ESRI: Redlands, CA, USA, 2019. [Google Scholar]
  61. Daly, C.; Halbleib, M.; Smith, J.I.; Gibson, W.P.; Doggett, M.K.; Taylor, G.H.; Curtis, J.; Pasteris, P.P. Physiographically Sensitive Mapping of Climatological Temperature and Precipitation across the Conterminous United States. Int. J. Clim. 2008, 34. [Google Scholar] [CrossRef]
  62. Soria-Auza, R.W.; Kessler, M.; Bach, K.; Barajas-Barbosa, P.M.; Lehnert, M.; Herzog, S.K.; Böhner, J. Impact of the Quality of Climate Models for Modelling Species Occurrences in Countries with Poor Climatic Documentation: A Case Study from Bolivia. Ecol. Model. 2010, 221, 1221–1229. [Google Scholar] [CrossRef]
  63. Deblauwe, V.; Droissart, V.; Bose, R.; Sonké, B.; Blach-Overgaard, A.; Svenning, J.-C.; Wieringa, J.J.; Ramesh, B.R.; Stévart, T.; Couvreur, T.L.P. Remotely Sensed Temperature and Precipitation Data Improve Species Distribution Modelling in the Tropics: Remotely Sensed Climate Data for Tropical Species Distribution Models. Glob. Ecol. Biogeogr. 2016, 25, 443–454. [Google Scholar] [CrossRef]
  64. Baker, D.J.; Hartley, A.J.; Pearce-Higgins, J.W.; Jones, R.G.; Willis, S.G. Neglected Issues in Using Weather and Climate Information in Ecology and Biogeography. Divers. Distrib. 2017, 23, 329–340. [Google Scholar] [CrossRef] [Green Version]
  65. Marchi, M.; Sinjur, I.; Bozzano, M.; Westergren, M. Evaluating WorldClim Version 1 (1961–1990) as the Baseline for Sustainable Use of Forest and Environmental Resources in a Changing Climate. Sustainability 2019, 11, 3043. [Google Scholar] [CrossRef] [Green Version]
  66. Hannachi, A.; Jolliffe, I.T.; Stephenson, D.B. Empirical Orthogonal Functions and Related Techniques in Atmospheric Science: A Review. Int. J. Clim. 2007, 34. [Google Scholar] [CrossRef]
  67. Metzger, M.J.; Bunce, R.G.H.; Jongman, R.H.G.; Sayre, R.; Trabucco, A.; Zomer, R. A High-Resolution Bioclimate Map of the World: A Unifying Framework for Global Biodiversity Research and Monitoring: High-Resolution Bioclimate Map of the World. Glob. Ecol. Biogeogr. 2013, 22, 630–638. [Google Scholar] [CrossRef] [Green Version]
  68. Schueler, S.; Falk, W.; Koskela, J.; Lefèvre, F.; Bozzano, M.; Hubert, J.; Kraigher, H.; Longauer, R.; Olrik, D.C. Vulnerability of Dynamic Genetic Conservation Units of Forest Trees in Europe to Climate Change. Glob. Chang. Biol. 2014, 20, 1498–1511. [Google Scholar] [CrossRef]
  69. Bedia, J.; Herrera, S.; Gutiérrez, J.M. Dangers of Using Global Bioclimatic Datasets for Ecological Niche Modeling. Limitations for Future Climate Projections. Glob. Planet. Chang. 2013, 107, 1–12. [Google Scholar] [CrossRef] [Green Version]
  70. Fernández, M.; Hamilton, H.; Kueppers, L.M. Characterizing Uncertainty in Species Distribution Models Derived from Interpolated Weather Station Data. Ecosphere 2013, 4, art61. [Google Scholar] [CrossRef]
  71. Watling, J.I.; Fletcher, R.J.; Speroterra, C.; Bucklin, D.N.; Brandt, L.A.; Romañach, S.S.; Pearlstine, L.G.; Escribano, Y.; Mazzotti, F.J. Assessing Effects of Variation in Global Climate Data Sets on Spatial Predictions from Climate Envelope Models. J. Fish Wildl. Manag. 2014, 5, 14–25. [Google Scholar] [CrossRef] [Green Version]
  72. Stoklosa, J.; Daly, C.; Foster, S.D.; Ashcroft, M.B.; Warton, D.I. A Climate of Uncertainty: Accounting for Error in Climate Variables for Species Distribution Models. Methods Ecol. Evol. 2015, 6, 412–423. [Google Scholar] [CrossRef]
  73. Baker, D.J.; Hartley, A.J.; Butchart, S.H.M.; Willis, S.G. Choice of Baseline Climate Data Impacts Projected Species’ Responses to Climate Change. Glob. Chang. Biol. 2016, 22, 2392–2404. [Google Scholar] [CrossRef] [Green Version]
  74. Tang, Y.; Winkler, J.A.; Viña, A.; Liu, J.; Zhang, Y.; Zhang, X.; Li, X.; Wang, F.; Zhang, J.; Zhao, Z. Uncertainty of Future Projections of Species Distributions in Mountainous Regions. PLoS ONE 2018, 13, e0189496. [Google Scholar] [CrossRef] [Green Version]
  75. Marston, R.A. Geomorphology and Vegetation on Hillslopes: Interactions, Dependencies, and Feedback Loops. Geomorphology 2010, 116, 206–217. [Google Scholar] [CrossRef]
  76. Singh, C.P.; Panigrahy, S.; Parihar, J.S. Alpine Vegetation Ecotone Dynamics in Gangotri Catchment Using Remote Sensing Techniques. ISPRS Int. Arch. Photogramm. Remote Sens. Spat. Inf. Sci. 2012, XXXVIII-8/W20, 162–169. [Google Scholar] [CrossRef] [Green Version]
  77. Singh, C.P.; Panigrahy, S.; Parihar, J.S.; Dharaiya, N. Modeling Environmental Niche of Himalayan Birch and Remote Sensing Based Vicarious Validation. Trop. Ecol. 2013, 54, 321–329. [Google Scholar]
  78. Manish, K.; Telwala, Y.; Nautiyal, D.C.; Pandit, M.K. Modelling the Impacts of Future Climate Change on Plant Communities in the Himalaya: A Case Study from Eastern Himalaya, India. Model. Earth Syst. Environ. 2016, 2, 92. [Google Scholar] [CrossRef] [Green Version]
  79. Chhetri, P.K.; Gaddis, K.D.; Cairns, D.M. Predicting the Suitable Habitat of Treeline Species in the Nepalese Himalayas under Climate Change. Mt. Res. Dev. 2018, 38, 153. [Google Scholar] [CrossRef]
  80. Hamid, M.; Khuroo, A.A.; Charles, B.; Ahmad, R.; Singh, C.P.; Aravind, N.A. Impact of Climate Change on the Distribution Range and Niche Dynamics of Himalayan Birch, a Typical Treeline Species in Himalayas. Biodivers. Conserv. 2019, 28, 2345–2370. [Google Scholar] [CrossRef]
  81. Mohapatra, J.; Singh, C.P.; Hamid, M.; Verma, A.; Semwal, S.C.; Gajmer, B.; Khuroo, A.A.; Kumar, A.; Nautiyal, M.C.; Sharma, N.; et al. Modelling Betula Utilis Distribution in Response to Climate-Warming Scenarios in Hindu-Kush Himalaya Using Random Forest. Biodivers. Conserv. 2019, 28, 2295–2317. [Google Scholar] [CrossRef]
  82. Körner, C.; Paulsen, J. A World-Wide Study of High Altitude Treeline Temperatures: Study of High Altitude Treeline Temperatures. J. Biogeogr. 2004, 31, 713–732. [Google Scholar] [CrossRef]
  83. Holtmeier, F.-K. Mountain Timberlines: Ecology, Patchiness, and Dynamics; Advances in Global Change Research, 2nd ed.; Springer: Dordrecht, The Netherlands, 2009; ISBN 978-1-4020-9704-1. [Google Scholar]
  84. Körner, C. Alpine Treelines: Functional Ecology of the Global High Elevation Tree Limits; Springer: Basel, Switzerland, 2012; ISBN 978-3-0348-0396-0. [Google Scholar]
  85. Wieser, G. Alpine and Polar Treelines in a Changing Environment. Forests 2020, 11, 254. [Google Scholar] [CrossRef] [Green Version]
  86. Schweinfurth, U. Die horizontale und vertikale Verbreitung der Vegetation im Himalaya. In Bonner Geographische Abhandlungen; Dümmler: Bonn, Germany, 1957. [Google Scholar]
  87. Schickhoff, U. Die Degradierung Der Gebirgswälder Nordpakistans: Faktoren, Prozesse Und Wirkungszusammenhänge in Einem Regionalen Mensch-Umwelt-System; Erdwissenschaftliche Forschung; Steiner: Stuttgart, Germany, 2002; ISBN 978-3-515-07572-5. [Google Scholar]
  88. Miehe, G.; Miehe, S.; Böhner, J.; Bäumler, R.; Ghimire, S.K.; Bhattarai, K.; Chaudhary, R.P.; Subedi, M.; Jha, P.K.; Pendry, C. Vegetation ecology. In Nepal: An Introduction to the Natural History, Ecology and Human Environment of the Himalayas; Miehe, G., Pendry, C.A., Chaudhary, R.P., Eds.; Royal Botanic Garden: Edinburgh, UK, 2015; pp. 385–472. ISBN 978-1-910877-02-9. [Google Scholar]
  89. Böhner, J. Climate and Weather. In Nepal: An Introduction to the Natural History, Ecology and Human Environment of the Himalayas; Miehe, G., Pendry, C.A., Chaudhary, R.P., Eds.; Royal Botanic Garden: Edinburgh, UK, 2015; pp. 23–89. ISBN 978-1-910877-02-9. [Google Scholar]
  90. Zhang, L.; Liu, S.; Sun, P.; Wang, T.; Wang, G.; Zhang, X.; Wang, L. Consensus Forecasting of Species Distributions: The Effects of Niche Model Performance and Niche Properties. PLoS ONE 2015, 10, e0120056. [Google Scholar] [CrossRef] [PubMed] [Green Version]
  91. Mbogga, M.S.; Wang, X.; Hamann, A. Bioclimate Envelope Model Predictions for Natural Resource Management: Dealing with Uncertainty. J. Appl. Ecol. 2010, 47, 731–740. [Google Scholar] [CrossRef]
  92. Hamann, A.; Roberts, D.R.; Barber, Q.E.; Carroll, C.; Nielsen, S.E. Velocity of Climate Change Algorithms for Guiding Conservation and Management. Glob. Chang. Biol. 2015, 21, 997–1004. [Google Scholar] [CrossRef]
  93. Schuwirth, N.; Borgwardt, F.; Domisch, S.; Friedrichs, M.; Kattwinkel, M.; Kneis, D.; Kuemmerlen, M.; Langhans, S.D.; Martínez-López, J.; Vermeiren, P. How to Make Ecological Models Useful for Environmental Management. Ecol. Model. 2019, 411, 108784. [Google Scholar] [CrossRef]
  94. Ackerly, D.D.; Loarie, S.R.; Cornwell, W.K.; Weiss, S.B.; Hamilton, H.; Branciforte, R.; Kraft, N.J.B. The Geography of Climate Change: Implications for Conservation Biogeography: Geography of Climate Change. Divers. Distrib. 2010, 16, 476–487. [Google Scholar] [CrossRef]
  95. Pliscoff, P.; Luebert, F.; Hilger, H.H.; Guisan, A. Effects of Alternative Sets of Climatic Predictors on Species Distribution Models and Associated Estimates of Extinction Risk: A Test with Plants in an Arid Environment. Ecol. Model. 2014, 288, 166–177. [Google Scholar] [CrossRef]
  96. Bazzato, E.; Rosati, L.; Canu, S.; Fiori, M.; Farris, E.; Marignani, M. High Spatial Resolution Bioclimatic Variables to Support Ecological Modelling in a Mediterranean Biodiversity Hotspot. Ecol. Model. 2021, 441, 109354. [Google Scholar] [CrossRef]
  97. Engler, R.; Randin, C.F.; Thuiller, W.; Dullinger, S.; Zimmermann, N.E.; Araújo, M.B.; Pearman, P.B.; Le Lay, G.; Piedallu, C.; Albert, C.H.; et al. 21st Century Climate Change Threatens Mountain Flora Unequally across Europe. Glob. Chang. Biol. 2011, 17, 2330–2341. [Google Scholar] [CrossRef]
  98. Kollas, C.; Körner, C.; Randin, C.F. Spring Frost and Growing Season Length Co-Control the Cold Range Limits of Broad-Leaved Trees. J. Biogeogr. 2014, 41, 773–783. [Google Scholar] [CrossRef]
  99. Shrestha, U.B.; Bawa, K.S. Impact of Climate Change on Potential Distribution of Chinese Caterpillar Fungus (Ophiocordyceps Sinensis) in Nepal Himalaya. PLoS ONE 2014, 9, e106405. [Google Scholar] [CrossRef] [PubMed]
  100. Zischg, A.P.; Gubelmann, P.; Frehner, M.; Huber, B. High Resolution Maps of Climatological Parameters for Analyzing the Impacts of Climatic Changes on Swiss Forests. Forests 2019, 10, 617. [Google Scholar] [CrossRef] [Green Version]
  101. Stewart, S.B.; Elith, J.; Fedrigo, M.; Kasel, S.; Roxburgh, S.H.; Bennett, L.T.; Chick, M.; Fairman, T.; Leonard, S.; Kohout, M.; et al. Climate Extreme Variables Generated Using Monthly Time-series Data Improve Predicted Distributions of Plant Species. Ecography 2021, ecog.05253. [Google Scholar] [CrossRef]
  102. Lenoir, J.; Graae, B.J.; Aarrestad, P.A.; Alsos, I.G.; Armbruster, W.S.; Austrheim, G.; Bergendorff, C.; Birks, H.J.B.; Bråthen, K.A.; Brunet, J.; et al. Local Temperatures Inferred from Plant Communities Suggest Strong Spatial Buffering of Climate Warming across Northern Europe. Glob. Chang. Biol. 2013, 19, 1470–1481. [Google Scholar] [CrossRef] [PubMed]
  103. Lenoir, J.; Hattab, T.; Pierre, G. Climatic Microrefugia under Anthropogenic Climate Change: Implications for Species Redistribution. Ecography 2017, 40, 253–266. [Google Scholar] [CrossRef]
  104. Trivedi, M.R.; Berry, P.M.; Morecroft, M.D.; Dawson, T.P. Spatial Scale Affects Bioclimate Model Projections of Climate Change Impacts on Mountain Plants. Glob. Chang. Biol. 2008, 14, 1089–1103. [Google Scholar] [CrossRef] [Green Version]
  105. Hannah, L.; Flint, L.; Syphard, A.D.; Moritz, M.A.; Buckley, L.B.; McCullough, I.M. Fine-Grain Modeling of Species’ Response to Climate Change: Holdouts, Stepping-Stones, and Microrefugia. Trends Ecol. Evol. 2014, 29, 390–397. [Google Scholar] [CrossRef] [PubMed]
  106. Lembrechts, J.J.; Lenoir, J.; Nuñez, M.A.; Pauchard, A.; Geron, C.; Bussé, G.; Milbau, A.; Nijs, I. Microclimate Variability in Alpine Ecosystems as Stepping Stones for Non-native Plant Establishment above Their Current Elevational Limit. Ecography 2018, 41, 900–909. [Google Scholar] [CrossRef]
  107. He, K.S.; Bradley, B.A.; Cord, A.F.; Rocchini, D.; Tuanmu, M.-N.; Schmidtlein, S.; Turner, W.; Wegmann, M.; Pettorelli, N. Will Remote Sensing Shape the next Generation of Species Distribution Models? Remote Sens. Ecol. Conserv. 2015, 1, 4–18. [Google Scholar] [CrossRef] [Green Version]
  108. NASA/METI/AIST/Japan Spacesystems; U.S./Japan ASTER Science Team. ASTER Global Digital Elevation Model V003; NASA EOSDIS Land Processes DAAC: Sioux Falls, SD, USA, 2019. [CrossRef]
  109. Vega, G.C.; Pertierra, L.R.; Olalla-Tárraga, M.Á. MERRAclim, a High-Resolution Global Dataset of Remotely Sensed Bioclimatic Variables for Ecological Modelling. Sci. Data 2017, 4, 170078. [Google Scholar] [CrossRef] [Green Version]
  110. Wilson, A.M.; Jetz, W. Remotely Sensed High-Resolution Global Cloud Dynamics for Predicting Ecosystem and Biodiversity Distributions. PLOS Biol. 2016, 14, e1002415. [Google Scholar] [CrossRef]
  111. Hall, D.K.; Riggs, G.A. MODIS/Terra Snow Cover Daily L3 Global 0.05Deg CMG; Version 6; NASA National Snow and Ice Data Center Distributed Active Archive Center: Boulder, CO, USA, 2016. [CrossRef]
  112. Mohanty, B.P.; Cosh, M.H.; Lakshmi, V.; Montzka, C. Soil Moisture Remote Sensing: State-of-the-Science. Vadose Zone J. 2017, 16, vzj2016.10.0105. [Google Scholar] [CrossRef] [Green Version]
  113. Bobrowski, M. Modelling the ecological niche of a treeline tree species (Betula utilis) in the Himalayas—A methodological overview. In Mountain Landscapes in Transition: Effects of Land Use and Climate Change; Schickhoff, U., Singh, R.P., Mal, S., Eds.; Springer: Berlin, Germany, 2021. [Google Scholar]
  114. Amiri, M.; Tarkesh, M.; Jafari, R.; Jetschke, G. Bioclimatic Variables from Precipitation and Temperature Records vs. Remote Sensing-Based Bioclimatic Variables: Which Side Can Perform Better in Species Distribution Modeling? Ecol. Inform. 2020, 57, 101060. [Google Scholar] [CrossRef]
  115. Lembrechts, J.J.; Nijs, I.; Lenoir, J. Incorporating Microclimate into Species Distribution Models. Ecography 2019, 42, 1267–1279. [Google Scholar] [CrossRef]
  116. Ehret, U.; Zehe, E.; Wulfmeyer, V.; Warrach-Sagi, K.; Liebert, J. HESS Opinions “Should We Apply Bias Correction to Global and Regional Climate Model Data?”. Hydrol. Earth Syst. Sci. 2012, 16, 3391–3404. [Google Scholar] [CrossRef] [Green Version]
  117. Maraun, D.; Shepherd, T.G.; Widmann, M.; Zappa, G.; Walton, D.; Gutiérrez, J.M.; Hagemann, S.; Richter, I.; Soares, P.M.M.; Hall, A.; et al. Towards Process-Informed Bias Correction of Climate Change Simulations. Nat. Clim. Chang. 2017, 7, 764–773. [Google Scholar] [CrossRef] [Green Version]
  118. Lembrechts, J.J.; Lenoir, J.; Roth, N.; Hattab, T.; Milbau, A.; Haider, S.; Pellissier, L.; Pauchard, A.; Ratier Backes, A.; Dimarco, R.D.; et al. Comparing Temperature Data Sources for Use in Species Distribution Models: From In-situ Logging to Remote Sensing. Glob. Ecol. Biogeogr. 2019, 28, 1578–1596. [Google Scholar] [CrossRef]
  119. Mod, H.K.; Scherrer, D.; Luoto, M.; Guisan, A. What We Use Is Not What We Know: Environmental Predictors in Plant Distribution Models. J. Veg. Sci. 2016, 27, 1308–1322. [Google Scholar] [CrossRef]
  120. Sofaer, H.R.; Barsugli, J.J.; Jarnevich, C.S.; Abatzoglou, J.T.; Talbert, M.K.; Miller, B.W.; Morisette, J.T. Designing Ecological Climate Change Impact Assessments to Reflect Key Climatic Drivers. Glob. Chang. Biol. 2017, 23, 2537–2553. [Google Scholar] [CrossRef]
  121. Descombes, P.; Walthert, L.; Baltensweiler, A.; Meuli, R.G.; Karger, D.N.; Ginzler, C.; Zurell, D.; Zimmermann, N.E. Spatial Modelling of Ecological Indicator Values Improves Predictions of Plant Distributions in Complex Landscapes. Ecography 2020, 43, 1448–1463. [Google Scholar] [CrossRef]
  122. Kriticos, D.J.; Webber, B.L.; Leriche, A.; Ota, N.; Macadam, I.; Bathols, J.; Scott, J.K. CliMond: Global High-Resolution Historical and Future Scenario Climate Surfaces for Bioclimatic Modelling. Methods Ecol. Evol. 2012, 3, 53–64. [Google Scholar] [CrossRef]
  123. Kriticos, D.J.; Jarošik, V.; Ota, N. Extending the Suite of BIOCLIM Variables: A Proposed Registry System and Case Study Using Principal Components Analysis. Methods Ecol. Evol. 2014, 5, 956–960. [Google Scholar] [CrossRef]
  124. Lima-Ribeiro, M.S.; Varela, S.; González-Hernández, J.; De Oliveira, G.; Diniz-Filho, J.A.F.; Terrible, L.C. EcoClimate: A Database of Climate Data from Multiple Models for Past, Present, and Future for Macroecologists and Biogeographers. Biodivers. Inform. 2015, 10. [Google Scholar] [CrossRef] [Green Version]
  125. Title, P.O.; Bemmels, J.B. ENVIREM: An Expanded Set of Bioclimatic and Topographic Variables Increases Flexibility and Improves Performance of Ecological Niche Modeling. Ecography 2018, 41, 291–307. [Google Scholar] [CrossRef] [Green Version]
  126. Noce, S.; Caporaso, L.; Santini, M. A New Global Dataset of Bioclimatic Indicators. Sci. Data 2020, 7, 398. [Google Scholar] [CrossRef]
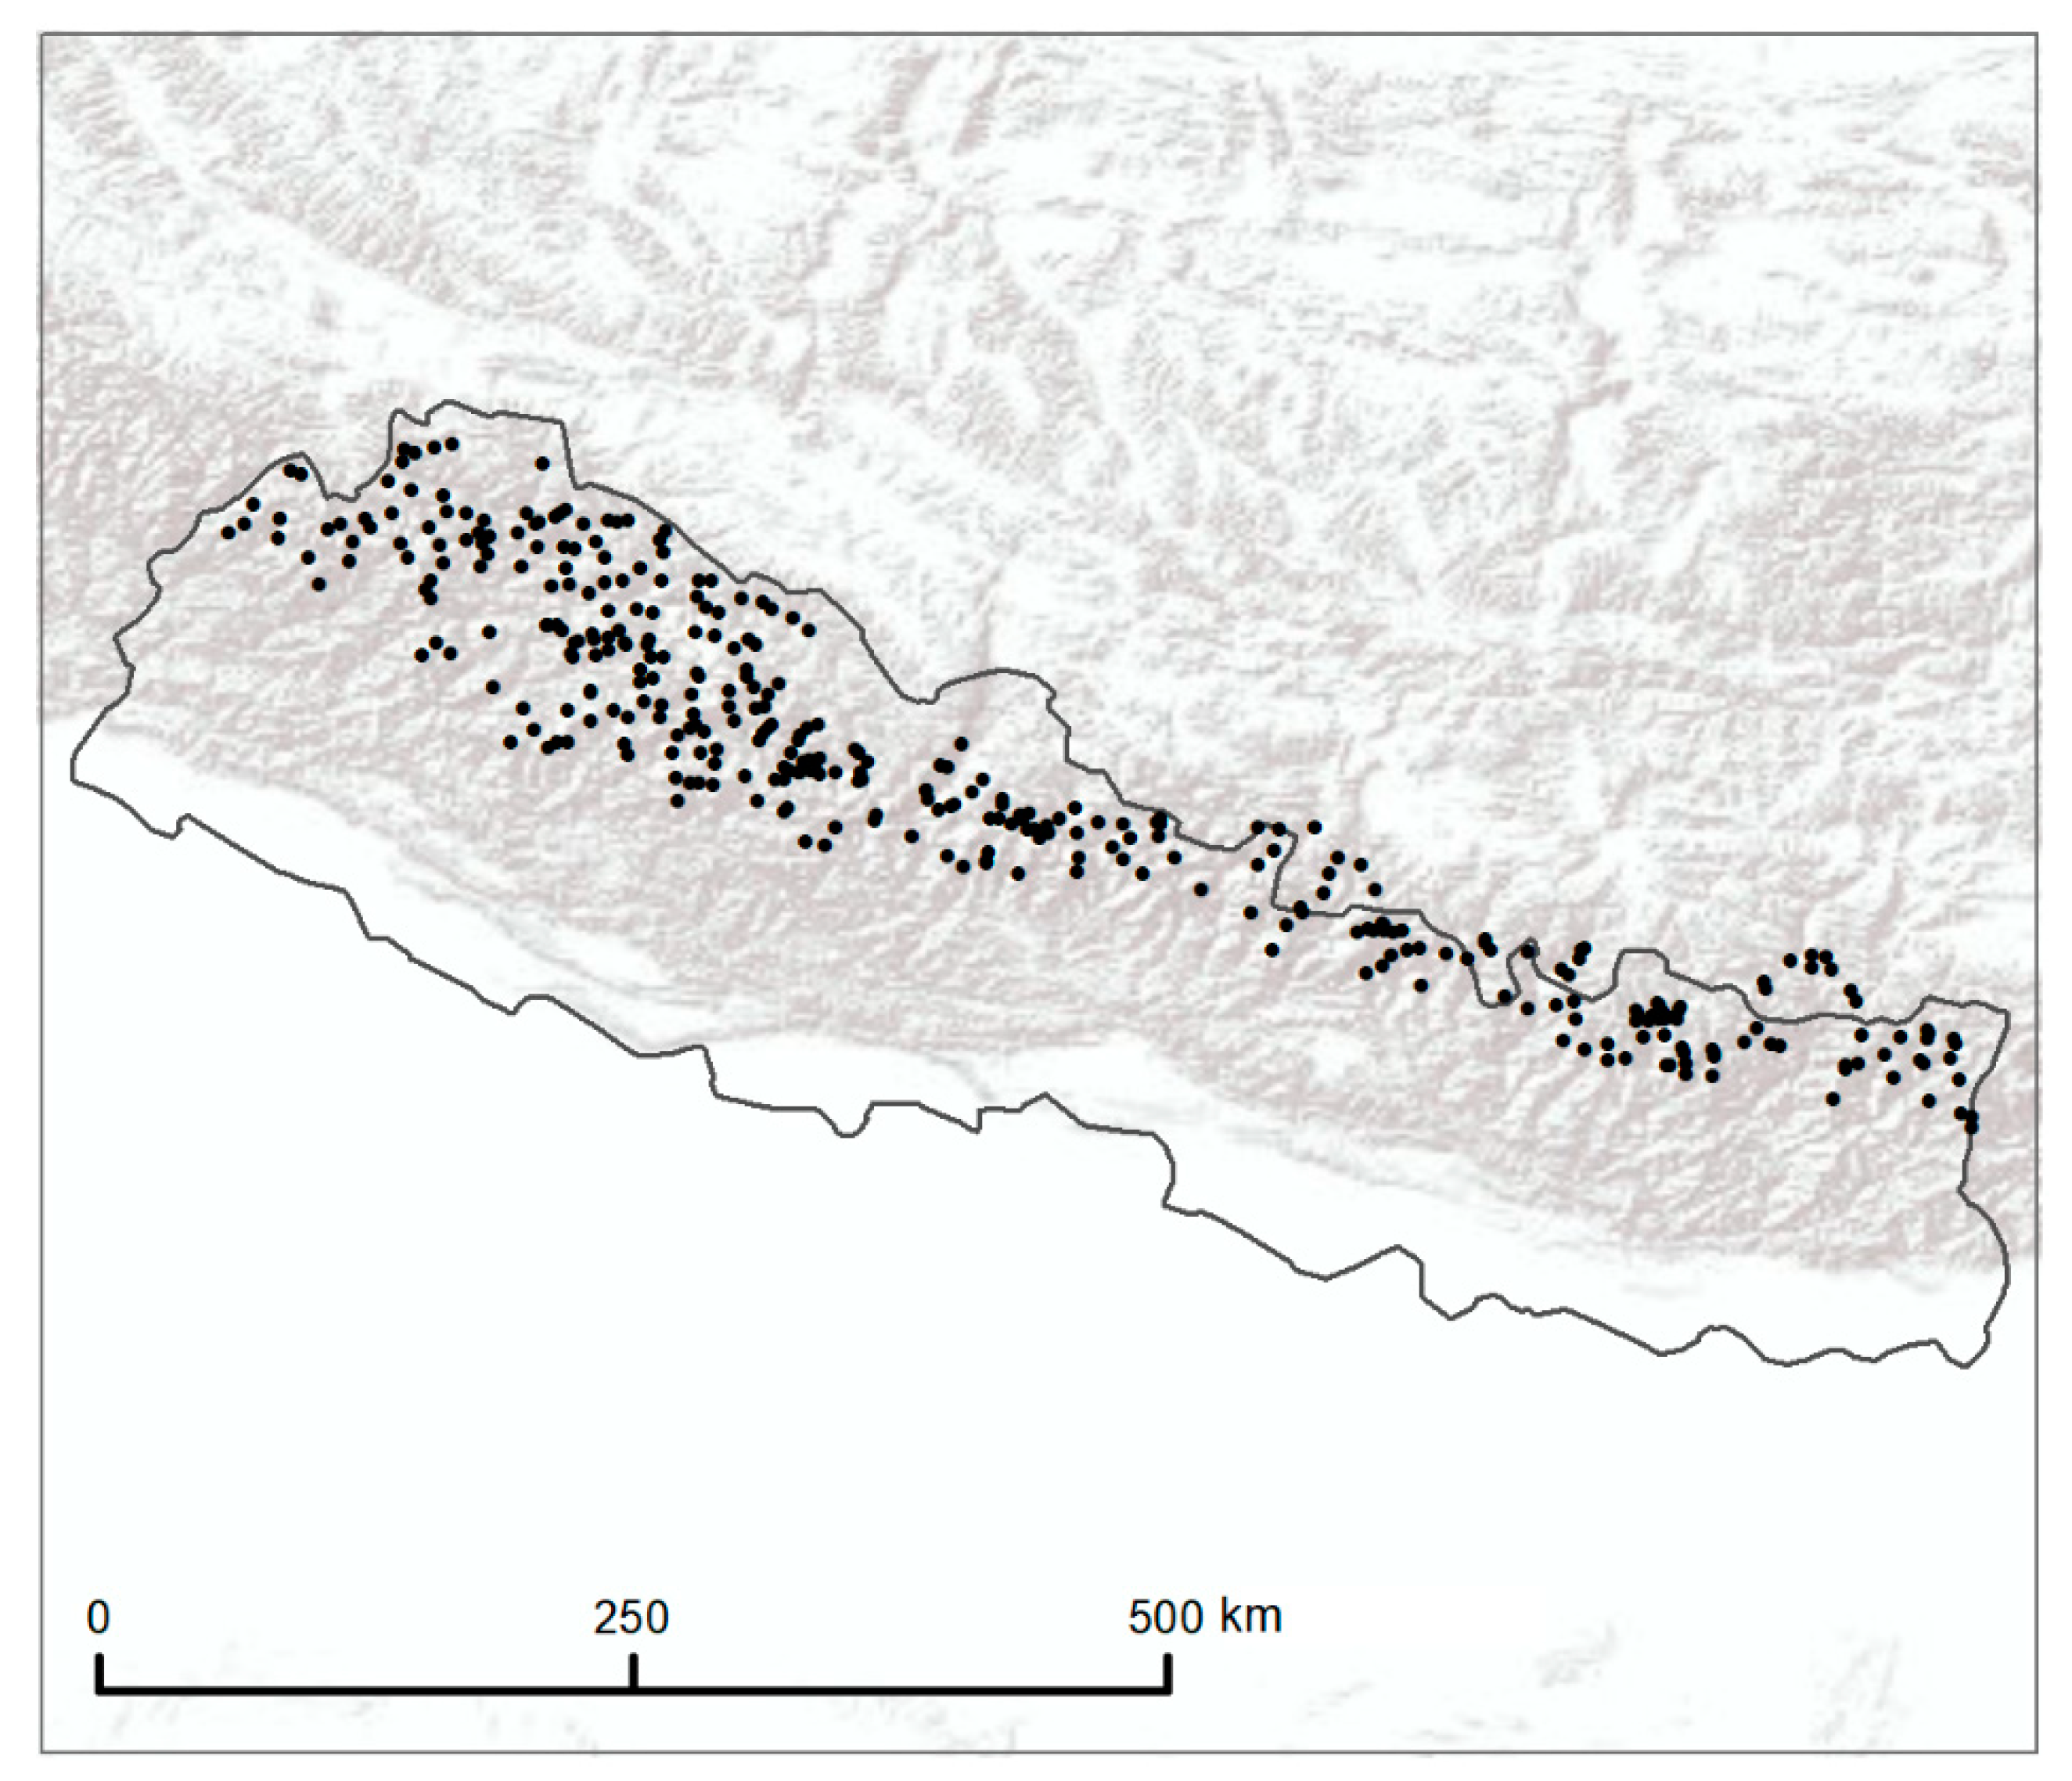
Figure 1. Occurrences of Betula utilis growing in the treeline ecotone in Nepal (N = 360).
Atmosphere 12 00543 g001
Figure 2. Mean Temperature of Wettest Quarter (i.e., temperature of the growing season) for all climate datasets and respective versions.
Atmosphere 12 00543 g002
Figure 3. Precipitation of the Coldest Quarter for all climate datasets and respective versions.
Atmosphere 12 00543 g003
Figure 4. Average Precipitation in March, April, and May for all climate datasets and respective versions.
Atmosphere 12 00543 g004
Figure 5. Comparison of continuous model predictions for the potential distribution of Betula utilis under current climate conditions for Chelsa and Worldclim and respective versions. Evaluation of modeling results was based on Pseudo R2 [54].
Atmosphere 12 00543 g005
Figure 6. Comparison of variable importance between final models for Betula utilis between climate datasets and respective versions.
Atmosphere 12 00543 g006
Figure 7. Comparison of model projections for the potential distribution of Betula utilis under current and future climate conditions for Chelsa 1.2 and Worldclim 1.4 climate datasets under RCPs 4.5 and 8.5, respectively. For Chelsa 1.1, no future climate scenarios are available, whereas for Worldclim 2.1, future scenarios are currently only available at coarser resolution (>30 arc seconds).
Atmosphere 12 00543 g007
Table 1. Description of climate datasets and their respective versions used for comparison of model performance. Number of citations were last accessed in Web of Knowledge (WOK), March 2021. * Only available at 10 arc minutes, 5 arc minutes, and 2.5 arc minutes resolution.
Climate DatasetVersionAuthorCurrent ClimateFuture ClimatePast ClimateNumber of Citations, WOKHighest Spatial Resolution
Chelsa1.1Karger et al., 20161979–2013 30 arc seconds
Chelsa1.2Karger et al., 20171979–20132050–207021,000 BP LGM52330 arc seconds
Worldclim1.4Hijmans et al., 20051960–19902050–20706000 BP; 22,000 BP LGM12,49730 arc seconds
Worldclim2.1Fick and Hijmans 20171970–20002021–2040 *, 2041–2060 *, 2061–2080 *, 2081–2100 * 193930 arc seconds
Table 2. Spearman rank correlation coefficients of Mean Temperature of the Wettest Quarter for all climate datasets and respective versions. All correlations were highly significant (p ≤ 0.001).
Chelsa 1.1Chelsa 1.2Worldclim 1.4Worldclim 2.1
Chelsa 1.1
Chelsa 1.21.00
Worldclim 1.40.990.99
Worldclim 2.10.980.980.99
Table 3. Spearman rank correlation coefficients of Mean Temperature of the Wettest Quarter for all climate datasets and respective versions. All correlations were highly significant (p ≤ 0.001).
Chelsa 1.1Chelsa 1.2Worldclim 1.4Worldclim 2.1
Chelsa 1.1
Chelsa 1.20.90
Worldclim 1.40.520.48
Worldclim 2.10.780.670.68
Table 4. Spearman rank correlation coefficients of Mean Temperature of the Wettest Quarter for all climate datasets and respective versions. All correlations were highly significant (p ≤ 0.001) (Precipitation in March, April, May).
Chelsa 1.1Chelsa 1.2Worldclim 1.4Worldclim 2.1
Chelsa 1.1
Chelsa 1.20.89
Worldclim 1.40.270.49
Worldclim 2.10.430.620.85
Publisher’s Note: MDPI stays neutral with regard to jurisdictional claims in published maps and institutional affiliations.