Abstract
The alpine meadow of Zoige Plateau plays a key role in local livestock production of cattle and sheep. However, it remains unclear how animal grazing or its intensity affect nitrous oxide (N2O) emissions, and the main driving factors. A grazing experiment including four grazing intensities (G0, G0.7, G1.2, G1.6 yak ha−1) was conducted between January 2013 and December 2014 to evaluate the soil nitrous oxide (N2O) fluxes under different grazing intensities in an alpine meadow on the eastern Qinghai–Tibet Plateau of China. The N2O fluxes were examined with gas collected by the static chamber method and by chromatographic concentration analysis. N2O emissions in the growing seasons (from May to September) were lower than that in non-growing seasons (from October to April) in 2013, 1.94 ± 0.30 to 3.37 ± 0.56 kg N2O ha−1 yr−1. Annual mean N2O emission rates were calculated as 1.17 ± 0.50 kg N2O ha−1 yr−1 in non-grazing land (G0) and 1.94 ± 0.23 kg N2O ha−1 yr−1 in the grazing land (G0.7, G1.2, and G1.6). The annual mean N2O flux showed no significant differences between grazing treatments in 2013. However, there were significantly greater fluxes from the G0.7 treatment than from the G1.6 treatment in 2014, especially in the growing season. Over the two years, the soil N2O emission rate was significantly negatively correlated with soil water-filled pore space (WFPS) and dissolved organic carbon (DOC) content as well as positively correlated with soil available phosphorus (P). No relationship was observed between soil N2O emission rate and temperature or rainfall. Our results showed that the meadow soils acted as a source of N2O for most periods and turned into a weak sink of N2O later during the sampling period. Our results highlight the importance of proper grazing intensity in reducing N2O emissions from alpine meadow. The interaction between grazing intensity and N2O emissions should be of more concern during future management of pastures in Zoige Plateau.
1. Introduction
Grassland ecosystems are an important ecosystem type in China and cover approximately twenty percent of the global terrestrial surface [1], which contributes to 10% of the atmosphere N2O flux on a global scale [2]. The Qinghai–Tibet Plateau (QTP) is the largest grassland area in the Eurasian continent and, also, the largest natural grassland area in China [3]. Alpine meadow takes up probably 31.3% of the total grassland area of Tibet [4]. The Qinghai–Tibet Plateau has a history of seasonal grazing dating thousands of years. Overgrazing, due to the rapid growth of population and food demand, is a major cause of grassland degradation in the QTP in recent years [5]. However, it remains unclear how animal grazing or its intensity affect N2O emissions, and the underlying mechanisms.
Grazing activities influence the emission of N2O mainly through two aspects. Firstly, the animal excrements, unevenly distributed on the grassland, can provide additional nitrogen inputs. On the other side, treading and trampling by the animals can result in the soil compaction and thus decrease soil aeration, probably leading to changes in the soil N transformation and N2O emission rates [6]. Generally, grazing promotes the emission of N2O in grassland ecosystem due to enhanced N cycling rate, with the results highly dependent on environmental factors. For example, Luo et al. [7] found that grazing increased the nitrogen input and the mineral (nitrogen) N content of the soil through the excrements of animals and, thus, increased the emission of N2O in New Zealand dairy farm systems. Saggar et al. [8] also found that N2O flux in grazing land was obviously higher than that in non-grazing land, mainly on account of the nitrogen inputs of animal excrements and higher soil WFPS. One study [9] on an alpine grassland of Kunlun Mountain also found positive relationships of daily N2O flux with WFPS, temperature, and DOC, indicating an important role of environmental factors in determining the grazing enhancement of N2O emissions from alpine grasslands. In contrast, a recent study on Inner Mongolia grassland found that grazing activities may significantly decrease, rather than increase, the emission of N2O in natural grasslands due to the reduction in microbial biomass, inorganic nitrogen production, and winter time water retention [10]. A global meta-analysis also found that heavy grazing reduced N2O emissions by nearly 40% as compared to non-grazing, on account of soil moisture and substrate availability reduction but at the cost of plant productivity and soil fertility [11]. These inconsistent results indicate the uncertainty of grazing impact on N2O, which could vary with different grazing intensities, climate, and grassland types.
To access the effect of grazing intensity on N2O emissions, a two-year field experiment was carried out measuring the N2O flux and the soil, vegetation, and environmental factors. The aims of this study were to (1) determine the seasonal and annual changes in soil N2O fluxes in response to the increasing grazing intensities; (2) better understand the relationships between the N2O fluxes and the environmental and biological factors.
2. Materials and Methods
2.1. Study Site
This study was conducted in a grazing plot located in Hongyuan county (102°06′ E, 34°54′ N) in Aba Autonomous Prefecture in Sichuan, China. The average elevation was 3480 m.a.s.l. The area has a typical mainland monsoon climate. The precipitation period is between May and August, with an annual mean of approximately 831 mm in the study period (Figure 1). The annual mean air temperature in Hongyuan county is 1.4 °C, with a minimum of −10.1 °C in January and a maximum of 11 °C in July [12]. The dominant species are Elymus sibiricus Linn. The accessory species are Kobresia setchwanensis, Saussurea nigrescens, Leontopodium nonum, and Potentilla bifurca Linn.
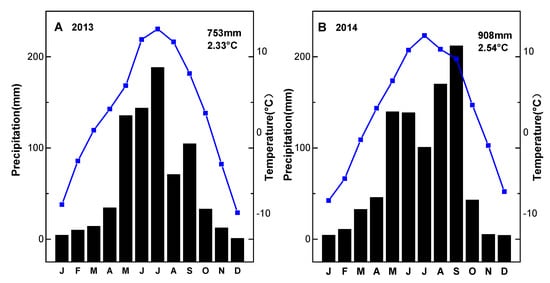
Figure 1.
Monthly cumulative precipitation (black column) and air temperature (blue line) in 2013 (A) and 2014 (B) for the grazing experimental site. Values shown in each panel are total annual precipitation and mean temperature.
During the sampling period, the air temperature was consistent with the seasonal pattern, with relatively large temporal variability (Figure 1A). In 2013, the annual mean temperature was 2.33 °C with a maximum of 12.8 °C in July and a minimum of −9.9 °C in December. In 2014, the annual mean temperature was 2.54 °C, with a maximum of 12 °C in July and minimum of −8.4 °C in January.
Most of the precipitation occurred in the growing seasons from May to September and decreased greatly in the winter (Figure 1B). Annual cumulative precipitation was 753 mm in 2013 and 908 mm in 2014. Separately, the maximum of monthly cumulative precipitation was 188 mm in July 2013 and 212 mm in September 2014.
2.2. Treatments
The grazing experiment was established in 2010. Four treatments were determined: G0.7 for light grazing intensity, G1.2 for moderate grazing intensity, G1.6 for heavy grazing intensity, and G0 for the control. Grazing intensity as 0, 0.7, 1.2, 1.6 yak ha−1 was calculated as the ratio of yak amount to the block area. The respective forage utilization rate of different treatments was 0%, 30%, 50%, and 70%. The grazing grassland was divided for ten blocks, with three replications for each grazing treatment and one block for the control. The block area of different treatments was partitioned as 1.6 ha (G0), 4.2 ha (G0.7), 2.5 ha (G1.2), and 1.9 ha (G1.6). Three yaks were grazed in each block for G0.7 to G1.6 and none for G0 from May to October.
2.3. Measurement of N2O Fluxes
Soil N2O fluxes were measured using the static chamber method. The chambers were made of polyvinylchloride (PVC) pipe with a length of 40 cm and an internal diameter of 20 cm. A pedestal was placed into the soil to a depth of 10 cm for each plot. Three replicate chambers were randomly deployed in each block, resulting in a total of 9 chambers per grazing treatment and 3 chambers for control. Gas samples were collected from 9:00 to 12:00 a.m. monthly from January 2013 to December 2014. Gas samples were collected at intervals of 0, 5, 10, and 15 min in 10 mL disposable vacuum tubes after the chambers were closed. Air temperature inside the chamber at 0 and 15 min was recorded for calculation of N2O flux. The N2O concentrations of all the samples were analyzed using gas chromatography (Agilent 7890A, Agilent Technologies Limited Co., Wilmington, DE, USA) equipped with an electron capture detector (ECD) operating at 350 °C. The flux of N2O was calculated as
where dc/dt is the rate of concentration change; P is the atmosphere pressure of the sampling site; M is the molar mass of N2O; T is the absolute temperature of the sampling time; V0, P0, and T0 is the molar volume, atmosphere pressure, and absolute temperature, respectively, under the standard condition; and H is the chamber height over the soil surface [13].
2.4. Measurements of Ancillary Factors
2.4.1. Climate Factors
Monthly accumulated precipitation and mean temperature data from Jan/2013 to Dec/2014 were collected from an automatic meteorological station from Hongyuan Weather Bureau (data from the Chinese National Meteorological Information Center, http://www.nmic.gov.cn/).
2.4.2. Soil Characteristics Analysis
Soil samples were collected from three random positions in each block (to the depth of 15 cm) in mid-August in 2013, and then stored at the laboratory at 4 °C. The fresh soil was air-dried at natural temperature and attributed through a 0.25 mm sieve for chemical analysis. The concentrations of NH4+-N, NO3−-N, available phosphorus and dissolved organic carbon (DOC) were measured using a continuous flow analyzer of San++ (SKALAR, Breda, Netherlands).
Soil temperature at 5 and 10 cm depth was measured using a handheld digital thermometer (SP-E-17 thermometer, Jinzhengmao Instruments China Inc., Beijing, China) around each chamber on the gas sampling date. Soil pH was measured using a pH meter (PB-10, Sartorius Instruments Inc., Goettingen, Germany). Soil water content was expressed as water-filled pore space % (WFPS).
The WFPS was calculated as:
WFPS = Vol/(1 − SBD/2.65)
Vol is volumetric water content (%), SBD is soil bulk density (g cm−3), and 2.65 is the density of quartz (g cm−3) [14].
2.4.3. Aboveground Biomass
In 2013, we randomly located three 20 cm × 20 cm quadrat frames in each block of grazing treatment (G0.7, G1.2, and G1.6) and nine quadrat frames for control (G0) at the end of August for biomass sampling. Therefore, 36 plots all together were selected for sampling. All the plants inside the frame were cut off from the bottom and oven-dried for 48 h at 65 °C to constant weight to calculate the aboveground biomass.
2.5. Statistical Analysis
One-way ANOVAs and LSD tests were used to determine the effects of grazing intensities on soil factors and plant factors. For each month, the means and standard error (SE) of N2O and different factors were calculated. Linear regression models were used to detect the relationships between N2O flux and the key factors. The effect of a certain variable was considered statistically significant for p < 0.05. The above analyses were performed with the SPSS 21.0 for Windows (IBM, Chicago, IL, USA).
3. Results
3.1. Soil Characteristics
The soil parameters over different grazing intensities during the experiment are shown in Table 1. The soil DOC showed decreased tendency with the grazing pressure in 2013, and the grazing plots (G0.7, G1.2, and G1.6) had significantly lower soil DOC content compared to the control (p < 0.05). The soil phosphorus in both G0.7 and G1.6 treatments were significantly higher than in G0 and G1.2 treatments (p < 0.01). Soil NO3−-N content was significantly higher in all grazing plots than in the control. The soil WFPS in G0.7 treatment was significantly (p < 0.05) higher than that in G0 and G1.2 treatments and not significantly different with that in the G1.6 treatment. However, no significant difference was found in soil pH, NH4+-N content, and soil bulk density among different grazing intensities. The non-grazing plot (G0) had significantly (p < 0.01) more aboveground biomass compared to the grazing plots, and it tended to decline along the grazing intensities.

Table 1.
Soil factors, pH, and AGB (aboveground biomass) in grasslands under different grazing intensities in 2013.
3.2. Seasonal and Annual Responses of N2O Fluxes to Grazing Intensities
During the sampling period, the temporal variation in N2O flux was observed in all grazing intensities (Figure 2). During the sampling period, the grassland soils acted as a source of N2O for most periods and turned into a weak sink of N2O in the last few months. In the two years, the peak of soil N2O emissions was 0.099 mg N2O m−2 h−1 from the G0 treatment in April 2013, and the peak of N2O absorption was −0.085 mg N2O m−2 h−1 from the G1.2 treatment in August 2014.
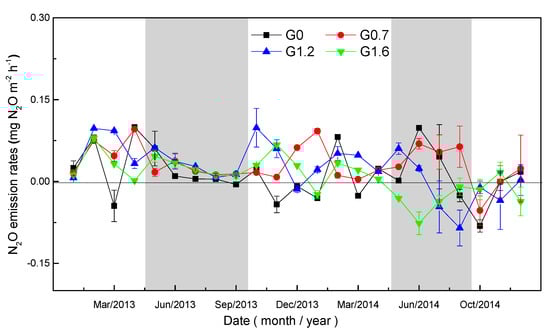
Figure 2.
Seasonal pattern of soil N2O emissions under different grazing intensities from 2013 to 2014. Bars represent the means of replicate plots (±SE).
Annual mean N2O emission rates were calculated as 1.17 ± 0.50 kg N2O ha−1 yr−1 in non-grazing land(G0) and 1.94 ± 0.23 kg N2O ha−1 yr−1 in grazing land (G0.7, G1.2, and G1.6). The mean annual N2O flux showed no significant differences between grazing treatments in 2013 (Figure 3). However, there were significantly (p < 0.05) greater fluxes from the G0.7 treatment than from the G1.6 treatment in 2014, especially in the growing season.
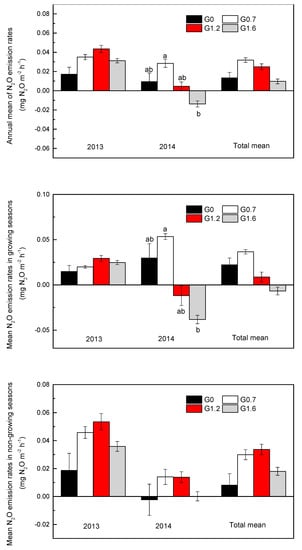
Figure 3.
Annual mean of soil N2O emission rates under different grazing intensities from 2013 to 2014. Bars represent the means of replicate plots (±SE). Letters a and b mean significant differences (p < 0.05).
The pattern of N2O emissions from growing season and non-growing season between 2013 and 2014 differed substantially (Figure 4). In 2013, the grassland soils released more N2O in non-growing season than in growing season, consistently among all grazing treatments. However, in 2014, the G0 and G0.7 treatments had higher emissions in growing season than in non-growing season, and the grassland soil in growing season turned into a sink of N2O from the G1.2 and G1.6 treatments.
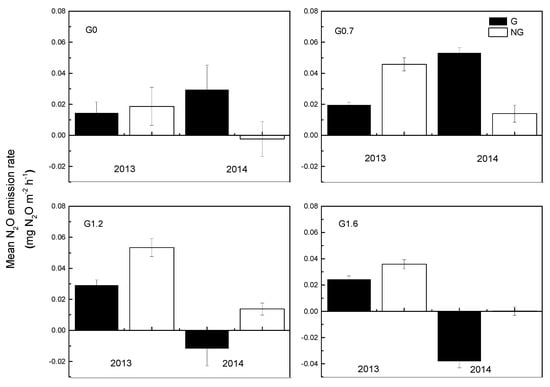
Figure 4.
Mean of soil N2O emission rates in growing season and non-growing season between 2013 and 2014 under different grazing intensities. Bars represent the means of replicate plots (±SE).
3.3. Effect of Driving Factors on N2O Fluxes under Different Grazing Intensities
The relationships between the soil N2O fluxes and driving factors (including climate factors, soil, and biological factors) were shown in Table 2. Across all the treatments (Figure 5), soil N2O emission rate was shown to be significantly positively correlated with the soil phosphorus content (R2 = 0.2579, p = 0.007), whereas significantly negative correlations were observed between N2O emission rate and soil DOC content. There were significantly positive linear relationships between soil N2O flux and soil pH (R2 = 0.987, p < 0.01) in all treatments. In contrast, there were negative relationships between soil N2O flux and soil WFPS (R2 = 0.756, p < 0.01) in grazing treatments and aboveground biomass (R2 = 0.709, p < 0.01) in G1.2 treatment.
Table 2.
Pearson relationships between climate factor (rainfall and chamber temperature), soil factor (DOC, P, NO3−-N, NH4+-N, SBD, WFPS, pH) biological factor (aboveground biomass), and the monthly mean flux rates of N2O under different grazing intensities.
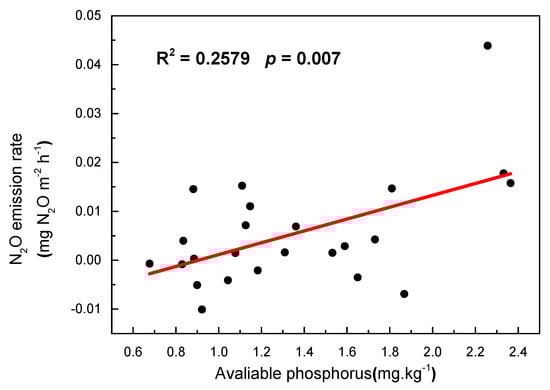
Figure 5.
Linear correlation between the mean soil N2O fluxes and available phosphorus in 2013.
4. Discussion
4.1. N2O Emission Rates—Comparison with Other Studies
In our study, the alpine meadow acted as a strong source of N2O in 2013 but a weak sink in the last few months of 2014 (Figure 2). The sink in 2014 may be caused by the intensive rainy season that year, which induced the saturation of water-filled pore space and a stronger N2O uptake during the period [15]. The annual mean N2O emission rates were calculated as1.17 ± 0.50 kg N2O ha−1 yr−1 in non-grazing land and 1.94 ± 0.23 kg N2O ha−1 yr−1 in the grazing land in the sampling periods, which were coincidently much larger than those in other alpine meadows in Qinghai–Tibet Plateau [16,17] or semiarid grasslands in Inner Mongolia [18].The difference compared to the semiarid grassland may be due to the higher nitrogen mineralization rates in the moister environments in the alpine meadow in Qinghai–Tibet Plateau (Table 3).
Table 3.
Comparisons of annual mean N2O fluxes with other studies in different grassland types.
Seasonal variations in N2O emissions indicated that N2O emissions in the growing seasons (from May to September) were lower than that in non-growing seasons (from October to April), 1.94 ± 0.30 to 3.37 ± 0.56 kg N2O ha−1 yr−1 in 2013. This was not consistent with other studies with more N2O emissions in the growing seasons [19]. We assumed that the rainfall pattern and soil water content can best explain the variations in N2O emissions. N2O production in the surface soils is mostly driven by microbial processes, including nitrification and denitrification. Soil with high water content can promote microbial activities. In addition, with the decrease of oxygen concentration in soil, high denitrification rates can be induced under anaerobic conditions.
A peak of N2O emissions was also observed in April of 2013, especially in the G0 and G0.7 plots, likely due to freezing and thawing processes. Teepe et al. [20] reported that both the duration of freezing and the soil water content could critically affect the N2O emissions during the thawing process, probably owing to the increased nutrient release or increased amounts of denitrifying bacteria changing from aerobic to anaerobic activity with increasing freezing time.
4.2. Responses of Soil N2O Fluxes to Grazing Intensities
In our study, the grazed grassland was a source of soil N2O persistently in 2013 and 2014. The intensity of grazing substantially promoted the emission of soil N2O in alpine meadow. This is consistent with the results of other studies [7,8,21]. However, our results negate that the alpine meadow is a constant source of N2O for the atmosphere. In certain conditions, it can turn to be a weak sink of N2O.
Our results demonstrate that light grazing increased soil N2O fluxes in our research site. This is consistent with previous studies [19,22] as elevated nitrogen input from the excrements could stimulate the denitrification processes and lead to enhanced N2O emissions in grazing grasslands [23]. However, the soil N2O fluxes tended to decrease with the grazing intensity increasing (Figure 3), which is consistent with the results of other studies [24,25], but in contrast with other reports where it is believed that grazing increases soil N2O fluxes [26]. Several possible reasons could explain the differences between our results and those of previous studies. Firstly, grazing changes the vegetation structure and plant species composition through the gnawing processes of yaks. In our study, the aboveground biomass significantly decreased along with the grazing intensities, except for the G1.6 treatment (Table 1). Similar results in this site were also found by Yang et al. [27], that grazing prohibition could significantly increase the aboveground biomass and vegetation coverage and decrease the root–shoot ratio. Compared to non-grazing plots, the lower plant height and less aboveground biomass can result in increased soil temperature and decreased snow cover during winter time in grazed plots. Differences in soil temperature and moisture can have a significant influence on soil microbial N cycling and induce lower N2O emission rates in grazing plots [28]. Secondly, grazing changes the soil structure and aeration, thus affecting the oxygen content and soil moisture and resulting in higher soil compaction, which may be another factor resulting in lower N2O emissions in grazing plots. Moreover, grazing can increase soil bulk density and decrease the water-filled pore space (Table 1) through animal trampling, which can result in the restriction of soil N2O production [1]. Ding et al. [29] also reported that soil moisture dominantly controls the gene abundance of soil microorganisms along the precipitation gradient, including nitrification and denitrification processes. Thirdly, indirect effects of grazing on the nutrient allocation between the above- and belowground of plants may be responsible for the lower emission rate in higher grazing intensity. It was found in a previous study [30] of this research site that the vegetation distributed more nutrients into the aboveground tissues and induced higher TN and TP concentrations in the aboveground than those belowground in grazed plots. Such distribution pattern between above- and belowground tissues was contrast with those in other studies [31] and may mean different resource acquisition strategies of specific plant compositions [30].
4.3. Responses of Factors toward Controlling N2O Fluxes and Grazing Intensity
We found that the N2O flux was significantly positively correlated with the soil phosphorus content, which was consistent with the report by Rui et al. [32]. Phosphorus (P), one of the main soil nutrients in grassland ecosystem, is essential for plant growth. It is in short supply in many ecosystems and may limit the net primary production (NPP) and nitrogen fixation. It was indicated that grazing could increase the mineralization of organic P and soil phosphatase activities and stimulate soil microbial activities. Moreover, other studies [33] found that the increase in soil NO3−-N content due to grazing activity could positively influence phosphatase activity and P mineralization.
Moreover, significant negative correlations were observed between N2O flux and soil WFPS in all grazing lands in our study. This is consistent with previous studies [1], as grazing can alter soil structure. As a result of animal trampling, grazing can increase the soil bulk density and compaction, reduce the soil pore diameter, and decrease the water-filled pore space which, in turn, restrict the rates of N2O production from soil.
Our analysis showed that grazing significantly increased the soil nitrate content and N2O emissions were significantly positively correlated with the soil NO3−-N content in light and moderate grazing treatments, which were consistent with previous studies. Other studies also found that the nitrate N concentrations had good relationships with the denitrification rate and N2O emissions. High water content and concentration of nitrate nitrogen could promote a high denitrification rate owing to oxygen diffusion and carbon availability. However, when the water content is low, the diffusion of nitrate nitrogen could be limited, and the availability of the nitrate nitrogen may influence the denitrification process and N2O emissions [34,35].
5. Conclusions
This study, to our best knowledge, has taken the lead in examining the effects of grazing on N2O emissions in alpine meadows. There were differences in temporal patterns of N2O flux in the sampling periods for different grazing intensities. The natural source of N2O in alpine meadow can be turned into a weak sink in certain conditions by the interaction of grazing activities and soil moisture. Significant negative linear relationships were found between soil N2O fluxes and soil WFPS and DOC content over the period of the experiment. This paper provides evidence for better understanding the mechanisms of grazing effects on N2O emissions, and soil nitrate and organic carbon concentrations are mostly likely to affect N2O emissions in alpine meadows.
Author Contributions
Conceptualization, J.L. and Z.Y.; methodology, G.Y. and Y.H.; investigation, E.Z., J.H. and L.J.; software, L.L.; writing-original draft preparation, W.Z.; writing-review and editing, W.Z.; supervision, C.Z., D.X. and D.Z.; project administration, H.C. and C.P. All authors have read and agreed to the published version of the manuscript.
Funding
This study was supported by the Strategic Priority Research Program of Chinese Academy of Sciences (XDA2005010404), the Second Tibetan Plateau Scientific Expedition (2019QZKK0304), the Youth Innovation Promotion Association of the Chinese Academy of Sciences (2020366), and the Sichuan Science and Technology Program (2020YFS0020).
Institutional Review Board Statement
Not applicable.
Informed Consent Statement
Not applicable.
Data Availability Statement
Publicly available datasets were analyzed in this study. This data can be found here: http://www.nmic.gov.cn/. The other data presented in this study are available on request from the corresponding author. The data are not publicly available due to privacy or ethical.
Conflicts of Interest
The authors declare no conflict of interest.
References
- Yan, R.; Tang, H.; Xin, X.; Chen, B.; Murray, P.J.; Yan, Y.; Wang, X.; Yang, G. Grazing intensity and driving factors affect soil nitrous oxide fluxes during the growing seasons in the Hulunber meadow steppe of China. Environ. Res. Lett. 2016, 11, 054004. [Google Scholar] [CrossRef]
- Bertora, C.; Van Vliet, P.C.; Hummelink, E.W.; Van Groenigen, J.W. Do earthworms increase N2O emissions in ploughed grassland? Soil Biol. Biochem. 2007, 39, 632–640. [Google Scholar] [CrossRef]
- Cardenas, L.M.; Thorman, R.; Ashlee, N.; Butler, M.; Chadwick, D.; Chambers, B.; Cuttle, S.; Donovan, N.; Kingston, H.; Lane, S.; et al. Quantifying annual N2O emission fluxes from grazed grassland under a range of inorganic fertiliser nitrogen inputs. Agric. Ecosyst. Environ. 2010, 136, 218–226. [Google Scholar] [CrossRef]
- Lu, X.; Yan, Y.; Sun, J.; Zhang, X.; Chen, Y.; Wang, X.; Cheng, G. Carbon, nitrogen, and phosphorus storage in alpine grassland ecosystems of Tibet: Effects of grazing exclusion. Ecol. Evol. 2015, 5, 4492–4504. [Google Scholar] [CrossRef]
- Harris, R. Rangeland degradation on the Qinghai-Tibetan plateau: A review of the evidence of its magnitude and causes. J. Arid. Environ. 2010, 74, 1–12. [Google Scholar] [CrossRef]
- Oenema, O.; Velthof, G.L.; Yamulki, S.; Jarvis, S.C. Nitrous oxide emissions from grazed grassland. Soil Use Manag. 1997, 13, 288–295. [Google Scholar] [CrossRef]
- Luo, J.; Ledgard, S.F.; de Klein, C.A.M.; Lindsey, S.B.; Kear, M. Effects of dairy farming intensification on nitrous oxide emissions. Plant Soil 2008, 309, 227–237. [Google Scholar] [CrossRef]
- Saggar, S.; Andrew, R.M.; Tate, K.R.; Hedley, C.B.; Rodda, N.J.; Townsend, J.A. Modelling nitrous oxide emissions from dairy-grazed pastures. Nutr. Cycl. Agroecosys. 2004, 68, 243–255. [Google Scholar] [CrossRef]
- Yin, M.; Gao, X.; Tenuta, M.; Li, L.; Gui, D.; Li, X.; Zeng, F. Enhancement of N2O emissions by grazing is related to soil physicochemical characteristics rather than nitrifier and denitrifier abundances in alpine grassland. Geoderma 2020, 375, 114511. [Google Scholar] [CrossRef]
- Wolf, B.; Zheng, X.; Brüggemann, N.; Chen, W.; Dannenmann, M.; Han, X.; Sutton, M.A.; Wu, H.; Yao, Z.; Butterbach-Bahl, K. Grazing-induced reduction of natural nitrous oxide release from continental steppe. Nat. Cell Biol. 2010, 464, 881–884. [Google Scholar] [CrossRef]
- Tang, S.; Wang, K.; Xiang, Y.; Tian, D.; Wang, J.; Liu, Y.; Cao, B.; Guo, D.; Niu, S. Heavy grazing reduces grassland soil greenhouse gas fluxes: A global meta-analysis. Sci. Total Environ. 2019, 654, 1218–1224. [Google Scholar] [CrossRef]
- Yang, G.; Chen, H.; Wu, N.; Tian, J.; Peng, C.; Zhu, Q.; Zhu, D.; He, Y.; Zheng, Q.; Zhang, C. Effects of soil warming, rainfall reduction and water table level on CH4 emissions from the Zoige peatland in China. Soil Biol. Biochem. 2014, 78, 83–89. [Google Scholar] [CrossRef]
- Bai, Z.; Yang, G.; Chen, H.; Zhu, Q.; Chen, D.; Li, Y.; Wang, X.; Wu, Z.; Zhou, G.; Peng, C. Nitrous oxide fluxes from three forest types of the tropical mountain rainforests on Hainan Island, China. Atmos. Environ. 2014, 92, 469–477. [Google Scholar] [CrossRef]
- Zhang, W.; Zhu, X.; Liu, L.; Fu, S.; Chen, H.; Huang, J.; Lu, X.; Liu, Z.; Mo, J. Large difference of inhibitive effect of nitrogen deposition on soil methane oxidation between plantations with N-fixing tree species and non-N-fixing tree species. J. Geophys. Res. Space Phys. 2012, 117. [Google Scholar] [CrossRef]
- Ciarlo, E.; Conti, M.; Bartoloni, N.; Rubio, G. The effect of moisture on nitrous oxide emissions from soil and the N2O/(N2O + N2) ratio under laboratory conditions. Biol. Fertil. Soils 2006, 43, 675–681. [Google Scholar] [CrossRef]
- Jiang, C.M.; Yu, G.R.; Fang, H.J.; Cao, G.M.; Li, Y.N. Short-term effect of increasing nitrogen deposition on CO2, CH4 and N2O fluxes in an alpine meadow on the Qinghai-Tibetan Plateau, China. Atmos. Environ. 2010, 44, 2920–2926. [Google Scholar] [CrossRef]
- Kato, T.; Hirota, M.; Tang, Y.H.; Wada, E. Spatial variability of CH4 and N2O fluxes in alpine ecosystems on the Qinghai-Tibetan Plateau. Atmos. Environ. 2011, 45, 5632–5639. [Google Scholar] [CrossRef]
- Du, R.; Lu, D.; Wang, G. Diurnal, seasonal, and inter-annual variations of N2O fluxes from native semi-arid grassland soils of inner Mongolia. Soil Biol. Biochem. 2006, 38, 3474–3482. [Google Scholar] [CrossRef]
- Li, Y.; Dong, S.; Liu, S.; Zhou, H.; Gao, Q.; Cao, G.; Wang, X.; Su, X.; Zhang, Y.; Tang, L.; et al. Seasonal changes of CO2, CH4 and N2O fluxes in different types of alpine grassland in the Qinghai-Tibetan Plateau of China. Soil Biol. Biochem. 2015, 80, 306–314. [Google Scholar] [CrossRef]
- Teepe, R.; Vor, A.; Beese, F.; Ludwig, B. Emissions of N2O from soils during cycles of freezing and thawing and the effects of soil water, texture and duration of freezing. Eur. J. Soil Sci. 2004, 55, 357–365. [Google Scholar] [CrossRef]
- Carran, R.A.; Theobald, P.W.; Evans, J.P. Emission of Nitrous-Oxide from Some Grazed Pasture Soils in New-Zealand. Aust. J. Soil Res. 1995, 33, 341–352. [Google Scholar] [CrossRef]
- Pendall, E.; Schwendenmann, L.; Rahn, T.; Miller, J.B.; Tans, P.P.; White, J.W.C. Land use and season affect fluxes of CO2, CH4, CO, N2O, H2 and isotopic source signatures in Panama: Evidence from nocturnal boundary layer profiles. Glob. Chang. Biol. 2010, 16, 2721–2736. [Google Scholar] [CrossRef]
- Hu, Y.; Chang, X.; Lin, X.; Wang, Y.; Wang, S.; Duan, J.; Zhang, Z.; Yang, X.; Luo, C.; Xu, G.; et al. Effects of warming and grazing on N2O fluxes in an alpine meadow ecosystem on the Tibetan plateau. Soil Biol. Biochem. 2010, 42, 944–952. [Google Scholar] [CrossRef]
- Hou, L.; Yin, G.; Liu, M.; Zhou, J.; Zheng, Y.; Gao, J.; Zong, H.; Yang, Y.; Gao, L.; Tong, C. Effects of Sulfamethazine on Denitrification and the Associated N2O Release in Estuarine and Coastal Sediments. Environ. Sci. Technol. 2015, 49, 326–333. [Google Scholar] [CrossRef]
- Wang, S.; Liu, C.; Yeager, K.M.; Wan, G.; Li, J.; Tao, F.; Lu, Y.; Liu, F.; Fan, C. The spatial distribution and emission of nitrous oxide (N2O) in a large eutrophic lake in eastern China: Anthropogenic effects. Sci. Total. Environ. 2009, 407, 3330–3337. [Google Scholar] [CrossRef]
- Liebig, M.A.; Gross, J.R.; Kronberg, S.L.; Hanson, J.D.; Phillips, R.L. Soil response to long-term grazing in the northern Great Plains of North America. Agric. Ecosyst. Environ. 2006, 115, 270–276. [Google Scholar] [CrossRef]
- Yang, Z.; Jiang, L.; Yingyi, X.U.; Zhan, W.; Zhu, E.; Chen, H. Responses of vegetation and soil of alpine meadows on the Qinghai-Tibet Plateau to short-term grazing prohibition. Acta Ecol. Sin. 2017, 37. [Google Scholar] [CrossRef][Green Version]
- Butterbachbahl, K.; Wolf, B.; Chen, W.; Zheng, X.; Han, X.; Wu, H.; Yao, B.Z.; DannenmannA, M. Grazing and GHG fluxes in steppe environments—How grazing reduces N2O emissions and CH4 uptake. In Proceedings of the 19th World Congress of Soil Science: Soil Solutions for a Changing World, Brisbane, Australia, 1–6 August 2010; pp. 89–91. [Google Scholar]
- Ding, K.; Zhong, L.; Xin, X.P.; Xu, Z.H.; Kang, X.M.; Liu, W.J.; Rui, Y.C.; Jiang, L.L.; Tang, L.; Wang, Y.F. Effect of grazing on the abundance of functional genes associated with N cycling in three types of grassland in Inner Mongolia. J. Soils Sediments 2014, 15, 683–693. [Google Scholar] [CrossRef]
- Yang, Z.; Zhu, Q.; Zhan, W.; Xu, Y.; Zhu, E.; Gao, Y.; Li, S.; Zheng, Q.; Zhu, D.; He, Y.; et al. The linkage between vegetation and soil nutrients and their variation under different grazing intensities in an alpine meadow on the eastern Qinghai-Tibetan Plateau. Ecol. Eng. 2018, 110, 128–136. [Google Scholar] [CrossRef]
- Han, G.; Hao, X.; Zhao, M.; Wang, M.; Ellert, B.H.; Willms, W. Effect of grazing intensity on carbon and nitrogen in soil and vegetation in a meadow steppe in Inner Mongolia. Agric. Ecosyst. Environ. 2008, 125, 21–32. [Google Scholar] [CrossRef]
- Rui, Y.; Wang, Y.; Chen, C.; Zhou, X.; Wang, S.; Xu, Z.; Duan, J.; Kang, X.; Lu, S.; Luo, C. Warming and grazing increase mineralization of organic P in an alpine meadow ecosystem of Qinghai-Tibet Plateau, China. Plant Soil 2012, 357, 73–87. [Google Scholar] [CrossRef]
- Olofsson, J.; Kitti, H.; Rautiainen, P.; Stark, S.; Oksanen, L. Effects of summer grazing by reindeer on composition of vegetation, productivity and nitrogen cycling. Ecography 2001, 24, 13–24. [Google Scholar] [CrossRef]
- Estavillo, J.M.; Rodriguez, M.; Domingo, M.; Gonzalez-Murua, C. Denitrification losses from a natural grassland in the Basque Country under organic and inorganic fertilization. Plant Soil 1994, 162, 19–29. [Google Scholar] [CrossRef]
- Strong, D.; Fillery, I. Denitrification response to nitrate concentrations in sandy soils. Soil Biol. Biochem. 2002, 34, 945–954. [Google Scholar] [CrossRef]
Publisher’s Note: MDPI stays neutral with regard to jurisdictional claims in published maps and institutional affiliations. |
© 2021 by the authors. Licensee MDPI, Basel, Switzerland. This article is an open access article distributed under the terms and conditions of the Creative Commons Attribution (CC BY) license (https://creativecommons.org/licenses/by/4.0/).