Article

A Reliability Assessment of the NCEP/FNL Reanalysis Data in Depicting Key Meteorological Factors on Clean Days and Polluted Days in Beijing

1
National Meteorological Centre, Beijing 100081, China
2
State Key Laboratory of Severe Weather, Chinese Academy of Meteorological Sciences, Beijing 100081, China
3
Key Laboratory of Beijing on Regional Air Pollution Control, Beijing University of Technology, Beijing 100124, China
*
Author to whom correspondence should be addressed.
Atmosphere 2021, 12(4), 481; https://doi.org/10.3390/atmos12040481
Submission received: 30 March 2021 / Revised: 8 April 2021 / Accepted: 9 April 2021 / Published: 11 April 2021
(This article belongs to the Special Issue Interaction between Air Pollution and Urban Boundary Layer)

Abstract

:
In this study, based on the National Centers for Environmental Prediction (NCEP) Final Analysis (FNL) data, the reliability and performances of their application on clean days and polluted days (based on the PM2.5 mass concentrations) in Beijing were assessed. Conventional meteorological factors and diagnostic physical quantities from the NCEP/FNL data were compared with the L-band radar observations in Beijing in the autumns and winters of 2017–2019. The results indicate that the prediction reliability of the temperature was the best compared with those of the relative humidity and wind speed. It is worth noting that the relative humidity was lower and the near-surface wind speed was higher on polluted days from the NCEP/FNL data than from the observations. As far as diagnostic physical quantity is concerned, it was revealed that the temperature inversion intensity depicted by the NCEP/FNL data was significantly lower than that from the observations, especially on polluted days. For example, the difference in the temperature inversion intensity between the NCEP/FNL data and the observation ranged from −0.56 to −0.77 °C on polluted days. In addition, the difference in the wind shears between the NCEP/FNL reanalysis data and the observations increased to 0.40 m/s in the lower boundary layer on polluted days compared with that on clean days. Therefore, it is suggested that the underestimation of the relative humidity and temperature inversion intensity, and the overestimation of the near-surface wind speed should be seriously considered in simulating the air quality in the model, particularly on polluted days, which should be focused on more in future model developments.

1. Introduction

With the rapid expansion of industrialization and economic development over recent decades, severe air pollution events have frequently occurred in China [1,2,3,4,5], with fine particular matter (PM2.5, with an aerodynamic diameter of 2.5 μm or less) being the dominant pollutant [6,7,8,9]. Since China promulgated the “Air Pollution Prevention and Control Action Plan” and “Blue Sky Protection Campaign” in 2013 and 2018, respectively, a series of control measurements for pollution emission have been implemented, including the upgrading of industrial emission standards, the renovation of coal-fired boilers, and the control of mobile source emissions. As a result, the PM2.5 concentration in Beijing decreased to 38 μg m−3 in 2020 from 89.5 μg m−3 in 2013 according to the Ministry of Ecology and Environment of the People’s Republic of China. However, the annual average PM2.5 concentration in Beijing is still higher than the standard value (Grade Ⅱ: 35 μg m−3) according to the “Ambient Air Quality Standard” (GB 3095-2012). Recently, numerous studies have revealed that the haze in Beijing and its surrounding regions is attributed to pollutant emission and regional transport together with adverse meteorological conditions [10,11,12,13,14]. It is proposed that stable weather conditions such as the low wind speed near the surface [15,16], high relative humidity [17,18], and strong temperature inversion [19,20,21] have direct influences on the formation of the haze. In other words, the meteorological conditions play significant roles in the formation of the pollution.
Since 1999, the National Centers for Environmental Prediction (NCEP) has provided NCEP Final Analysis (NCEP/FNL) data for use by researchers. This product is based on the Global Data Assimilation System (GDAS), which continuously collects observational data from the Global Telecommunications System (GTS) and other sources for many analyses. Since more observational data have been assimilated into the NCEP/FNL data, it has become the best choice for data archiving and analysis due to its higher spatio-temporal resolution. As for China, considering a few sounding stations (Figure 1), the NCEP/FNL reanalysis data have been widely used to investigate the formation and evolution mechanisms of the air pollution, which involves investigations of large-scale meteorological conditions [3,22,23,24,25], source apportionment [26,27], and pollutant transport paths [28,29]. Therefore, it is important to assess the reliability of the NCEP/FNL data in researching the pollution.
During the past decades, significant efforts have been made to assess the performance of the NCEP/FNL data in various studies, which have involved the inter-comparison among several kinds of reanalysis data [30,31,32,33,34,35] and reliability assessment [36,37,38,39]. For instance, Wang (2016) reported that the NCEP-Ⅰ and NCEP-Ⅱ considerably differ from the observational data, while the European Centre for Medium-Range Weather forecasts Reanalysis (ERA) Interim data are reliable at most stations except the Amundsen-Scott South Pole Station [40]. Cheng (2019) analyzed the conventional physical variables and diagnostic physical variables on a total of 1218 rainy and snowy days from 2005 to 2014 in Kelan, Shanxi province based on NCEP/FNL data [41]. Brunke (2015) discussed the existence of specific humidity inversions in five reanalysis datasets, including NCEP-Ⅱ, ERA-40, Modern-Era Retrospective analysis for Research and Applications (MERRA), the Climate Forecast System Reanalysis (CFSR) of NCEP, and the ERA-Interim [42]. Zhao (2006) also found that the distributions of temperature and precipitation described in NCEP-Ⅱ and ERA-40 are similar to the observations [43]. In addition, Malmusi and Boccolari (2010) noted that the NCEP-Ⅰ reanalysis data perform better in depicting the relative humidity in the upper layer (600–300 hPa) than in the middle layer (850–600 hPa) [44]. Wei (2020) calculated the confidence and characteristics of short-duration heavy rainfall environmental parameters based on merging data in Tianjin, and they found that the environmental parameters based on data fusion are more reliable than those only based on NCEP/FNL analysis data [45]. Xu (2001) examined the reliability of the NCEP reanalysis data in climate change research and found that the reanalysis data are more reliable in the eastern and southern parts than in the western part of China [46]. Based on the 32 year (1971–2002) monthly mean NCEP and National Center for Atmospheric Research (NCEP/NCAR) reanalysis data, Zhou (2009) conducted a comparison with the observed temperature and geopotential height from the radiosonde reports of 12 stations [47]. However, there are still some uncertainties and deficiencies. Few studies have focused on the extreme climate and weather events during the air pollution events, which are more sensitive to climate change than the climatology is. Moreover, there are few studies on the assessment of reanalysis data in depicting multiple meteorological factors, and the reliability characteristics of the NCEP/FNL data are still not clear, particularly on heavily polluted days in Beijing.
As a result, compared with the observations, the reliabilities of the NCEP/FNL reanalysis data on clean days and polluted days were assessed, which can provide references for the development of reanalysis datasets and models in the future. The remainder of this paper is organized as follows. The data and methods are introduced in Section 2. The comparison between the NCEP/FNL data and the observations is presented in Section 3. Finally, the conclusions and discussion are provided in Section 4.

2. Data and Methods

2.1. NCEP/FNL Data

In this paper, the NCEP/FNL reanalysis data (http://dss.ucar.edu/datasets/ds083.2/, accessed on 10 April 2021) with a horizontal resolution of 1.0° × 1.0° and temporal resolution of 6 h (observed at 0000 UTC, 0600 UTC, 1200 UTC, and 1800 UTC) were adopted, which involves 26 pressure levels in the vertical direction and 5 pressure levels (1000, 950, 925, 900, and 850 hPa) in the boundary layer.

2.2. Observational Data

To assess the reliability of the NCEP/FNL reanalysis data, the L-band sounding data from the China Meteorological Administration (CMA) were used in this study, which provides specific meteorological factors twice every day (0000 UTC and 1200 UTC), including wind speed, wind direction, temperature, relative humidity, and atmospheric pressure, with a high resolution in the vertical direction. In this study, the L-band radar data in Beijing in the autumns and winters (January, February, October, November, and December) of 2017–2019 were used.
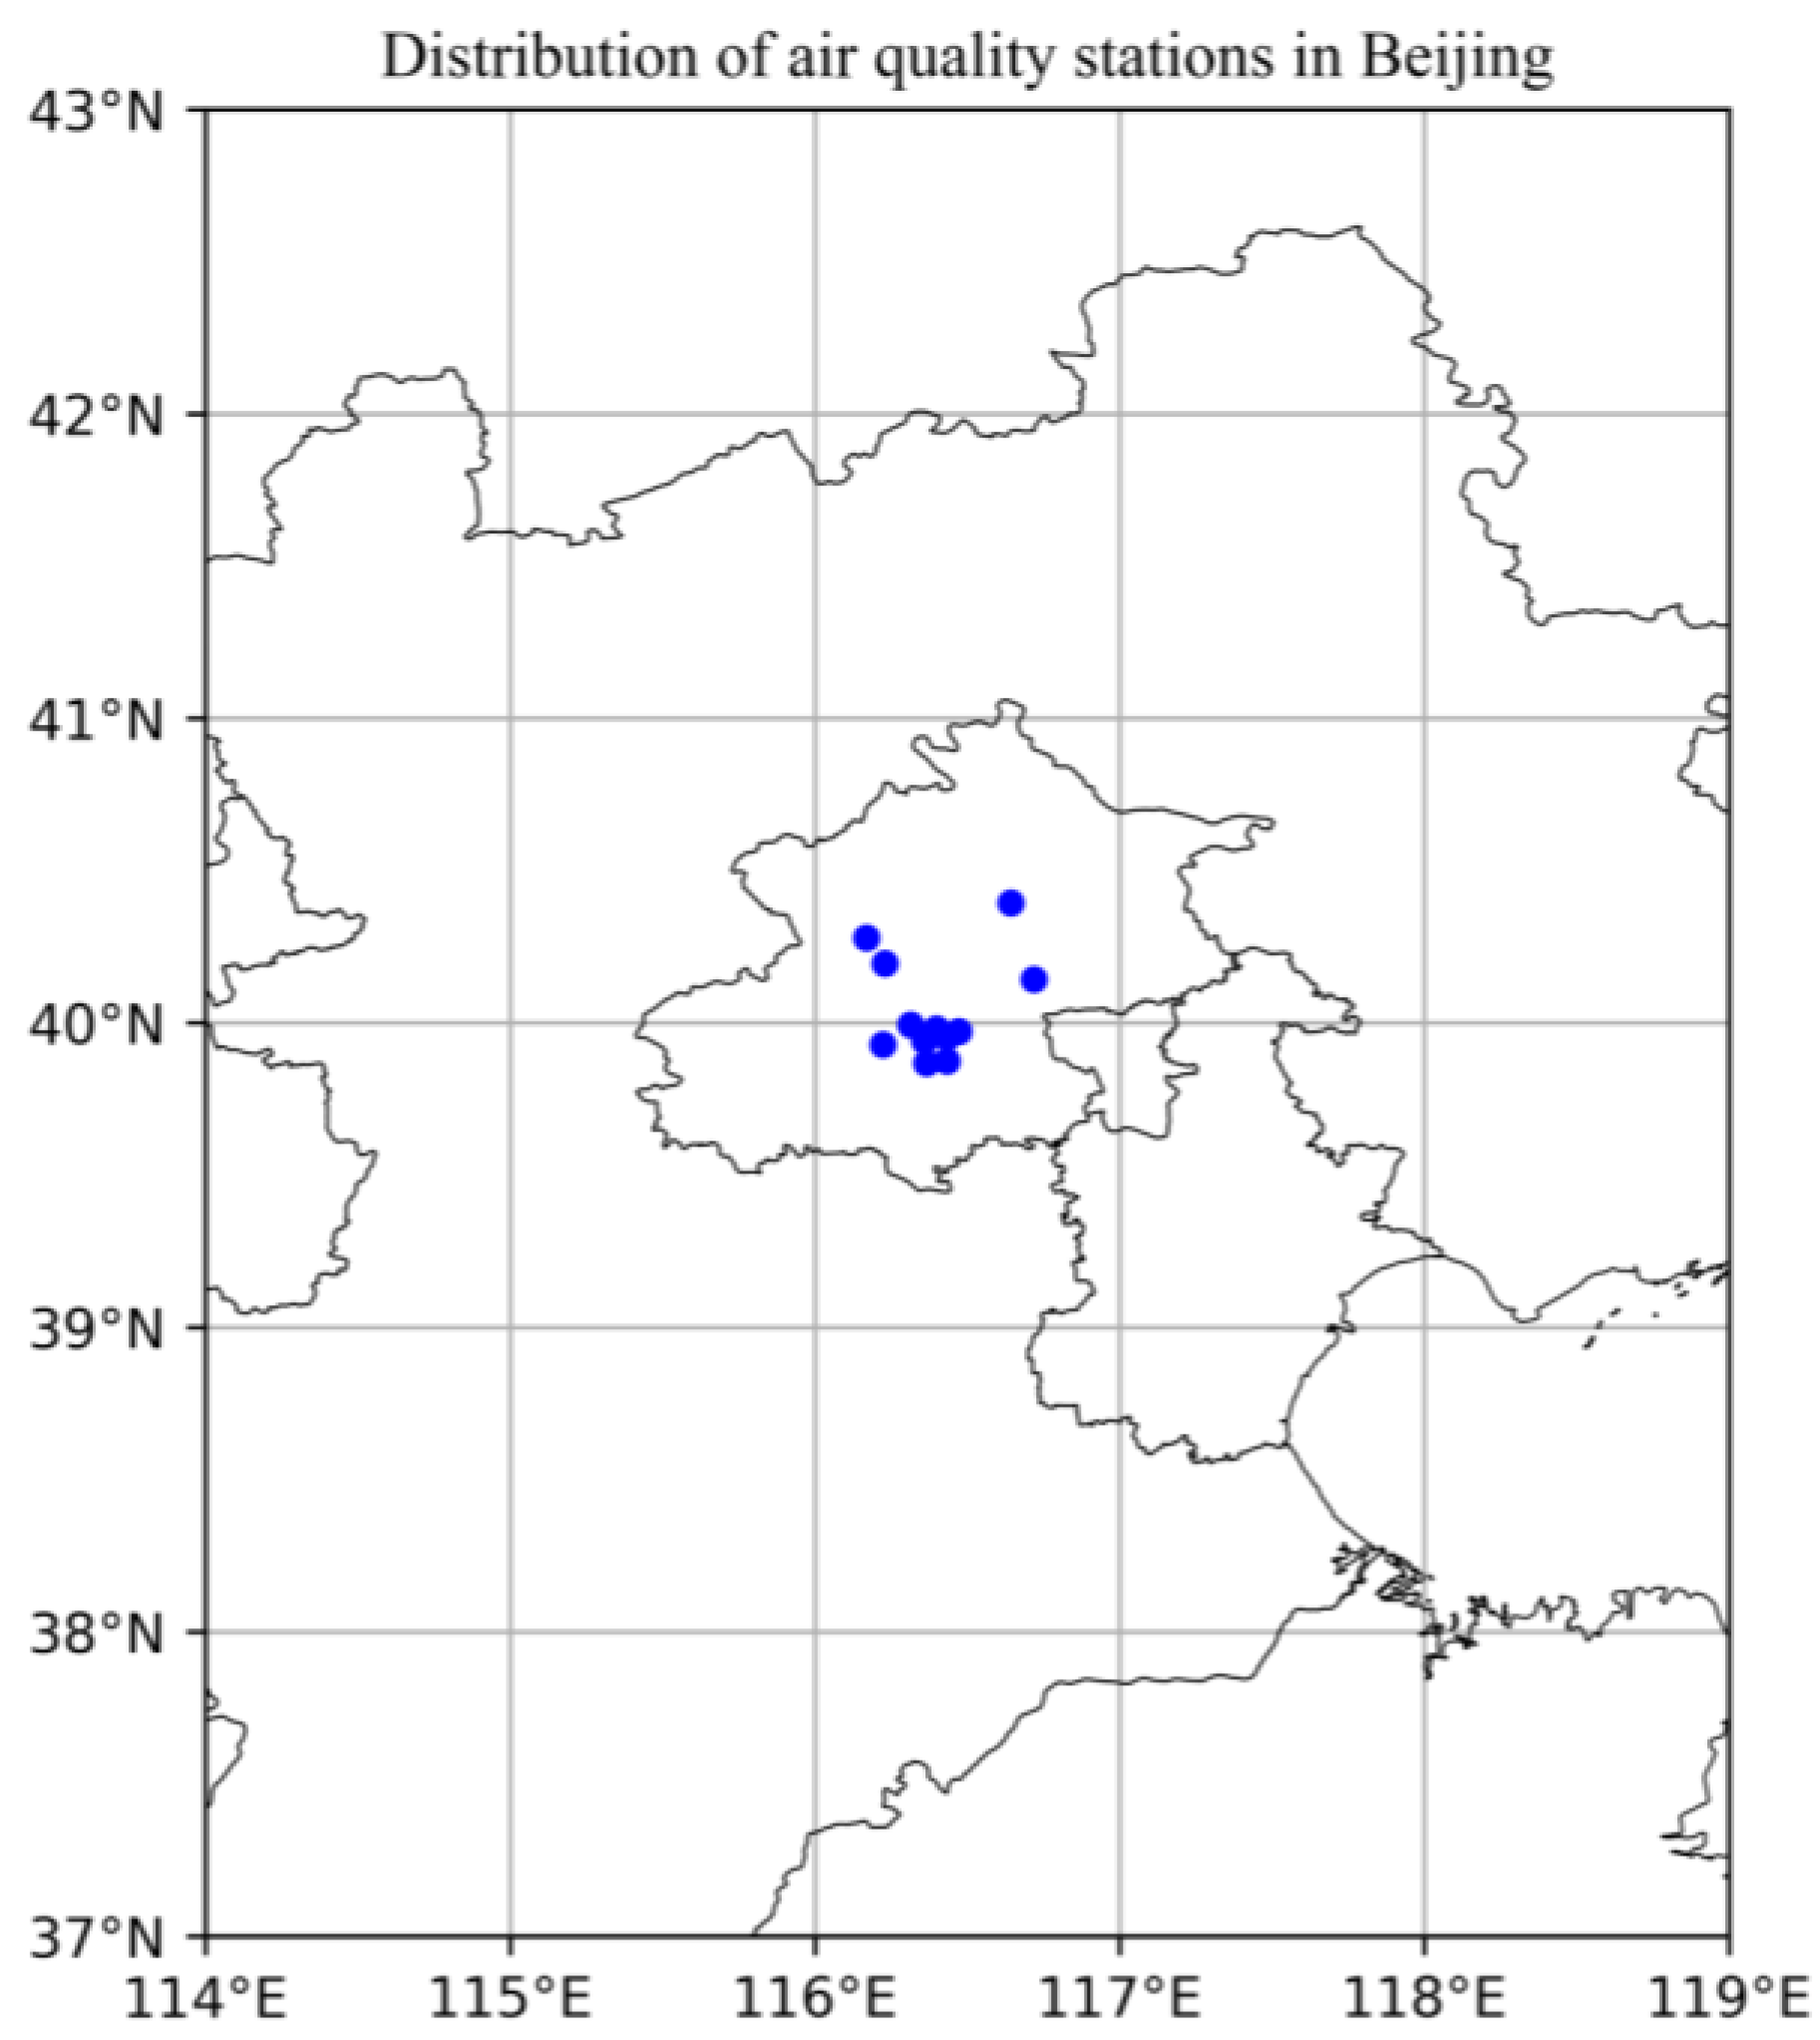
The hourly surface PM2.5 mass concentration obtained from the China National Environmental Monitoring Centre (http://113.108.142.147:20035/emcpublish/, accessed on 10 April 2021) was adopted. Based on the “Ambient Air Quality Standard” (GB 3095-2012), a clean day is defined as a day with a PM2.5 mass concentration below 75 μg m−3, while a polluted day is defined as a day with a PM2.5 mass concentration above 75 μg m−3. The PM2.5 mass concentration in Beijing is calculated through the average of the PM2.5 concentrations at all stations in this city. The locations of the air quality monitoring stations are presented in Figure 2. Besides, location of L-band radar station and numbers of clean days and polluted days in Beijing are shown in Table 1.

2.3. Methods

In order to compare with the L-band radar observational data, the reanalysis data were interpolated to the station location of the L-band radar through the bilinear interpolation method with distance weighting [41,44,48]. The error metrics, including the bias ( B I A S ), root-mean-square error ( R M S E ), and coefficient of correlation ( C C , which describes the correlation between the NCEP/FNL and the observations), were used to quantify the differences between the observations and the reanalysis data. The definitions of these metrics are shown in Table 2, in which x and y represent the observations and the calculation results over time, respectively. Considering the different units of meteorological factors, the C C was used to assess the reliability of the reanalysis data in this paper. In addition, the BIAS and RMSE were, respectively, used to assess the deviation and the specific deviation degree between the NCEP/FNL and the observations.

3. Results

3.1. Conventional Meteorological Factors

Because the air pollution mainly occurs in the atmospheric boundary layer, the meteorological factors, including the temperature, relative humidity, and wind speed, at 850–1000 hPa in the NCEP/FNL reanalysis dataset were selected for detailed analyses in this paper.

3.1.1. Temperature

The observed temperatures during the clean days and polluted days in different layers are displayed in Figure 3. The colored bands imply the probability distributions in different layers on clean days and polluted days. It can be seen that the temperatures of the low levels are mainly distributed near 0 °C on the polluted days, and they are significantly higher than those on the clean days. Many studies have pointed out that the increase in aerosols leads to the significant reduction in the solar shortwave radiation received by the ground, which results in a decrease in the near-surface temperature and an increase in the boundary layer temperature [49,50]. The variation trend of the temperature in each layer also confirms the above conclusions. The difference in temperature between layers is smaller on the polluted days, and the change trend is smoother than that on the clean days. Moreover, the turbulent exchange [51,52] between the upper layer and the lower boundary layer on the polluted days is weaker than that on the clean days, which results in the stable maintenance of haze weather.
The correlations of the temperature between the observations and the NCEP/FNL data in different layers during clean days and polluted days are shown in Figure 4 and Table 3. The NCEP/FNL data are slightly lower than the observations, with the B I A S ranging from −0.15 to −0.75 °C on the clean days and from −0.45 to −0.81 °C on the polluted days. The test metrics show that the NCEP/FNL reanalysis data perform better in the middle and lower layers (850–950 hPa) than in the near-surface layer (1000 hPa) on both the clean days and polluted days. Taking the C C as an example, the C C s range from 0.94 to 0.95 on clean days and from 0.92 to 0.93 on polluted days in the middle and lower layers, while they decrease to 0.90 and 0.84 in the near-surface layer on clean days and polluted days, respectively. The bad performance of the NCEP/FNL at 1000 hPa may be attributed to the topography and land-use types adopted in the reanalysis model, as well as other factors. Overall, the NCEP/FNL data have the highest C C for temperature, and they generally show no significant difference between clean days and polluted days. As a result, the prediction reliability of the temperature is the best compared with those of the relative humidity and wind speed (discussed in Section 3.1.2 and Section 3.1.3).

3.1.2. Relative Humidity

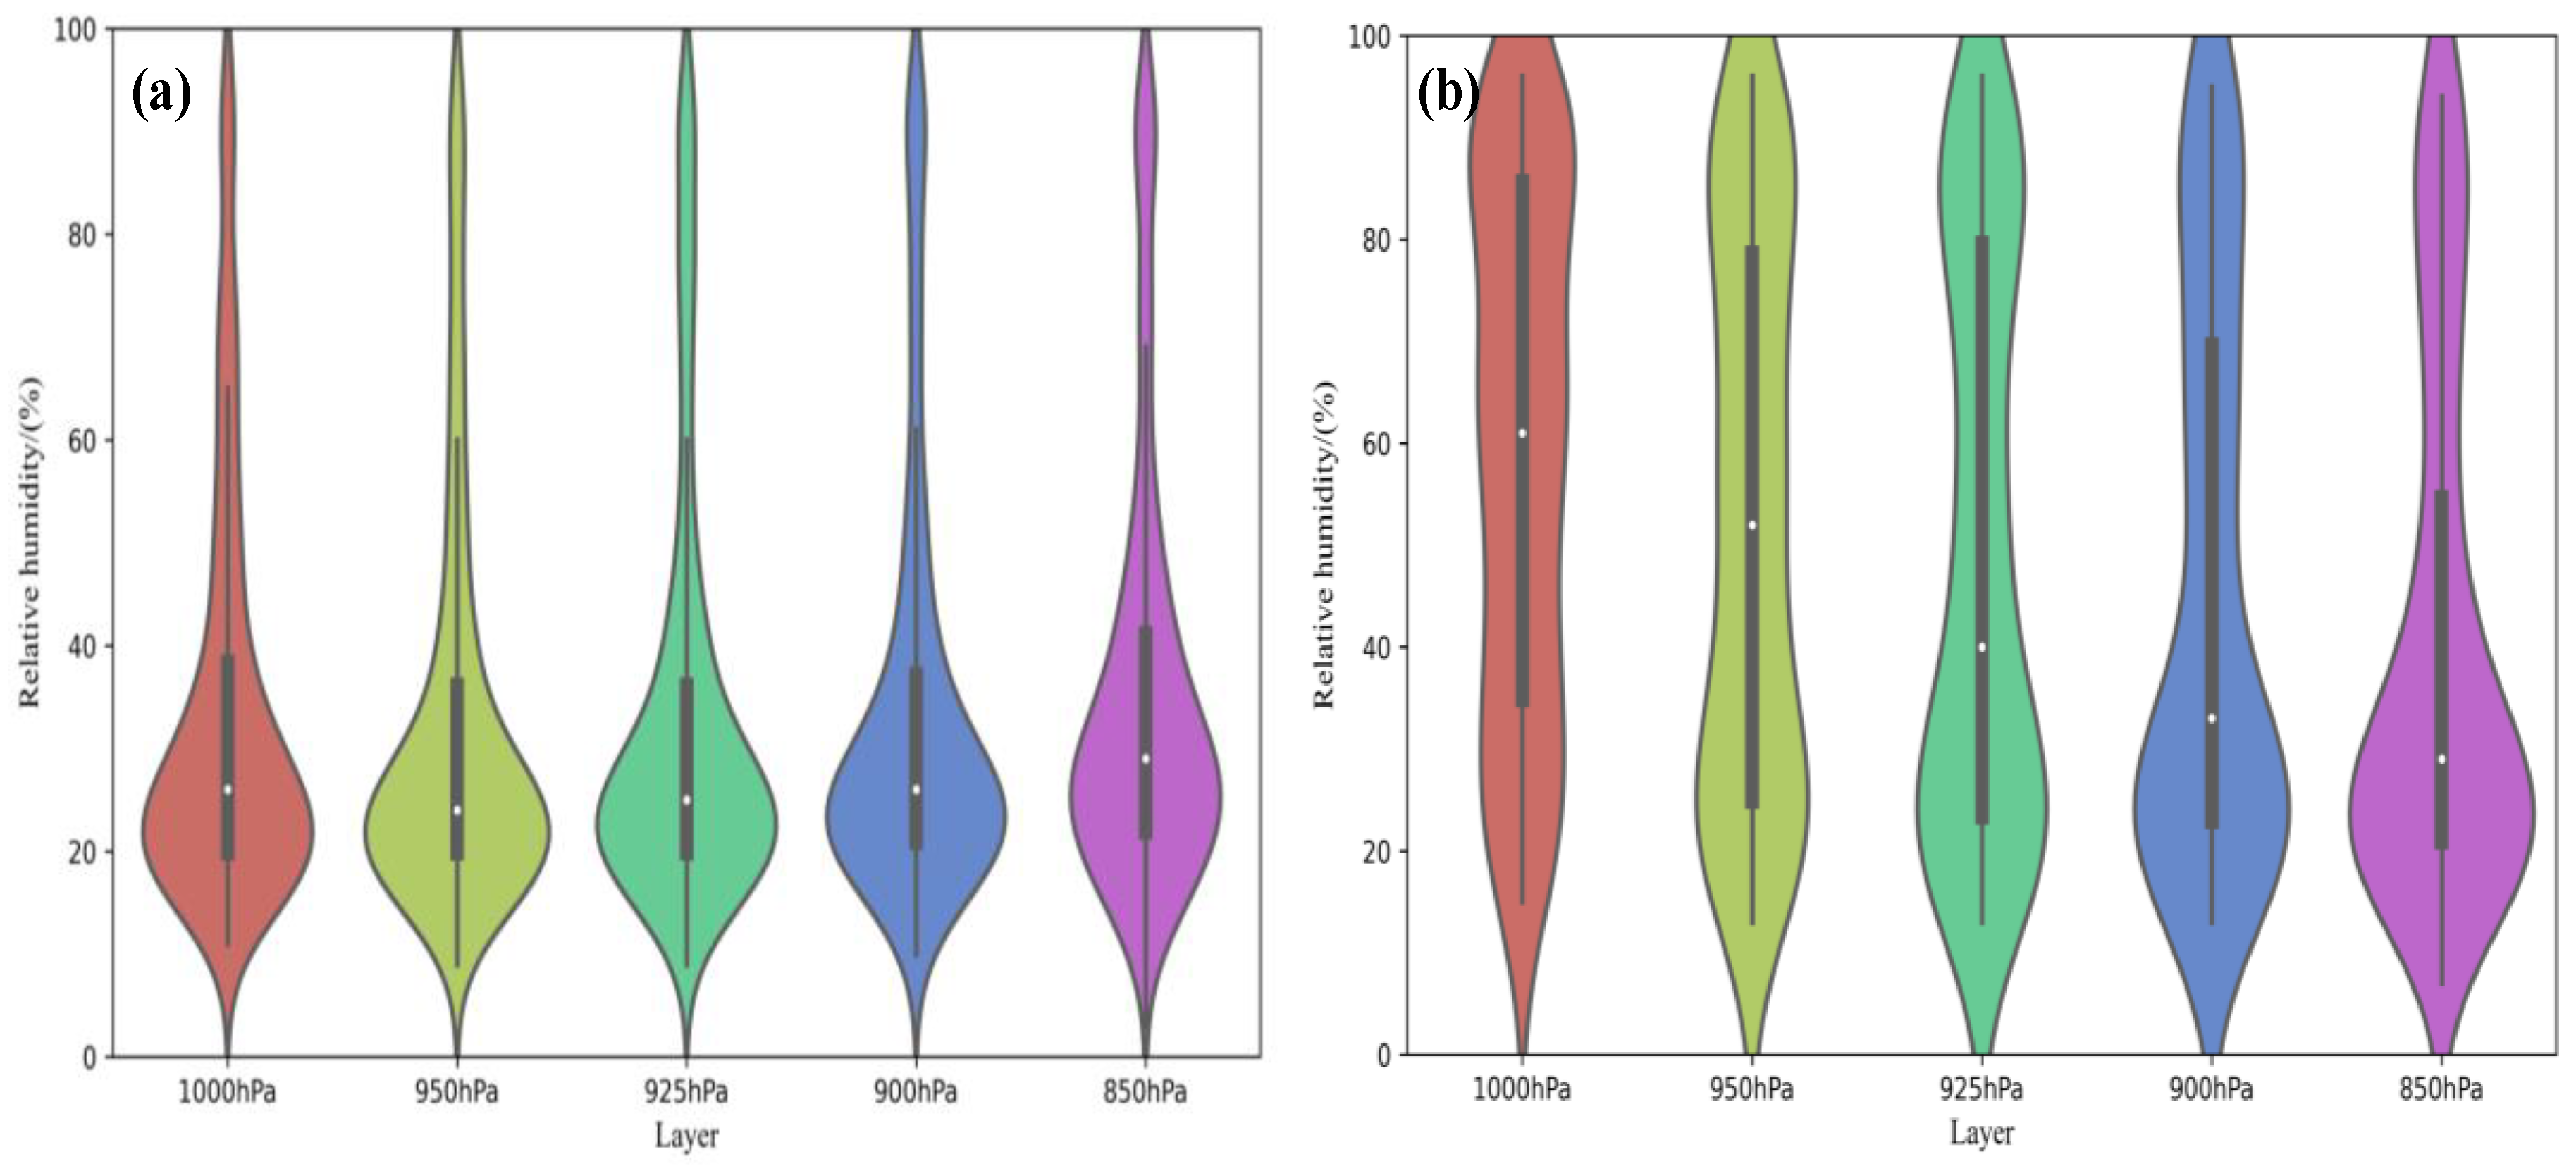
Figure 5 shows the observations of the relative humidity during the clean days and polluted days in different layers. The observed relative humidity span is large on polluted days, which is significantly higher than that on the clean days, especially at 1000 hPa. In addition, the relative humidity decreases gradually with height on the polluted days, which shows a vertical structure of “dry in the upper-layer and wet in the lower-layer.” This structure is conducive to the formation of fog in the boundary layer, resulting in the reduction of visibility near the surface, but the mechanism of aerosols feedback on the meteorological factor cannot be ignored (explained in Section 3.1.3). However, there is no significant change for the relative humidity in each layer on clean days.
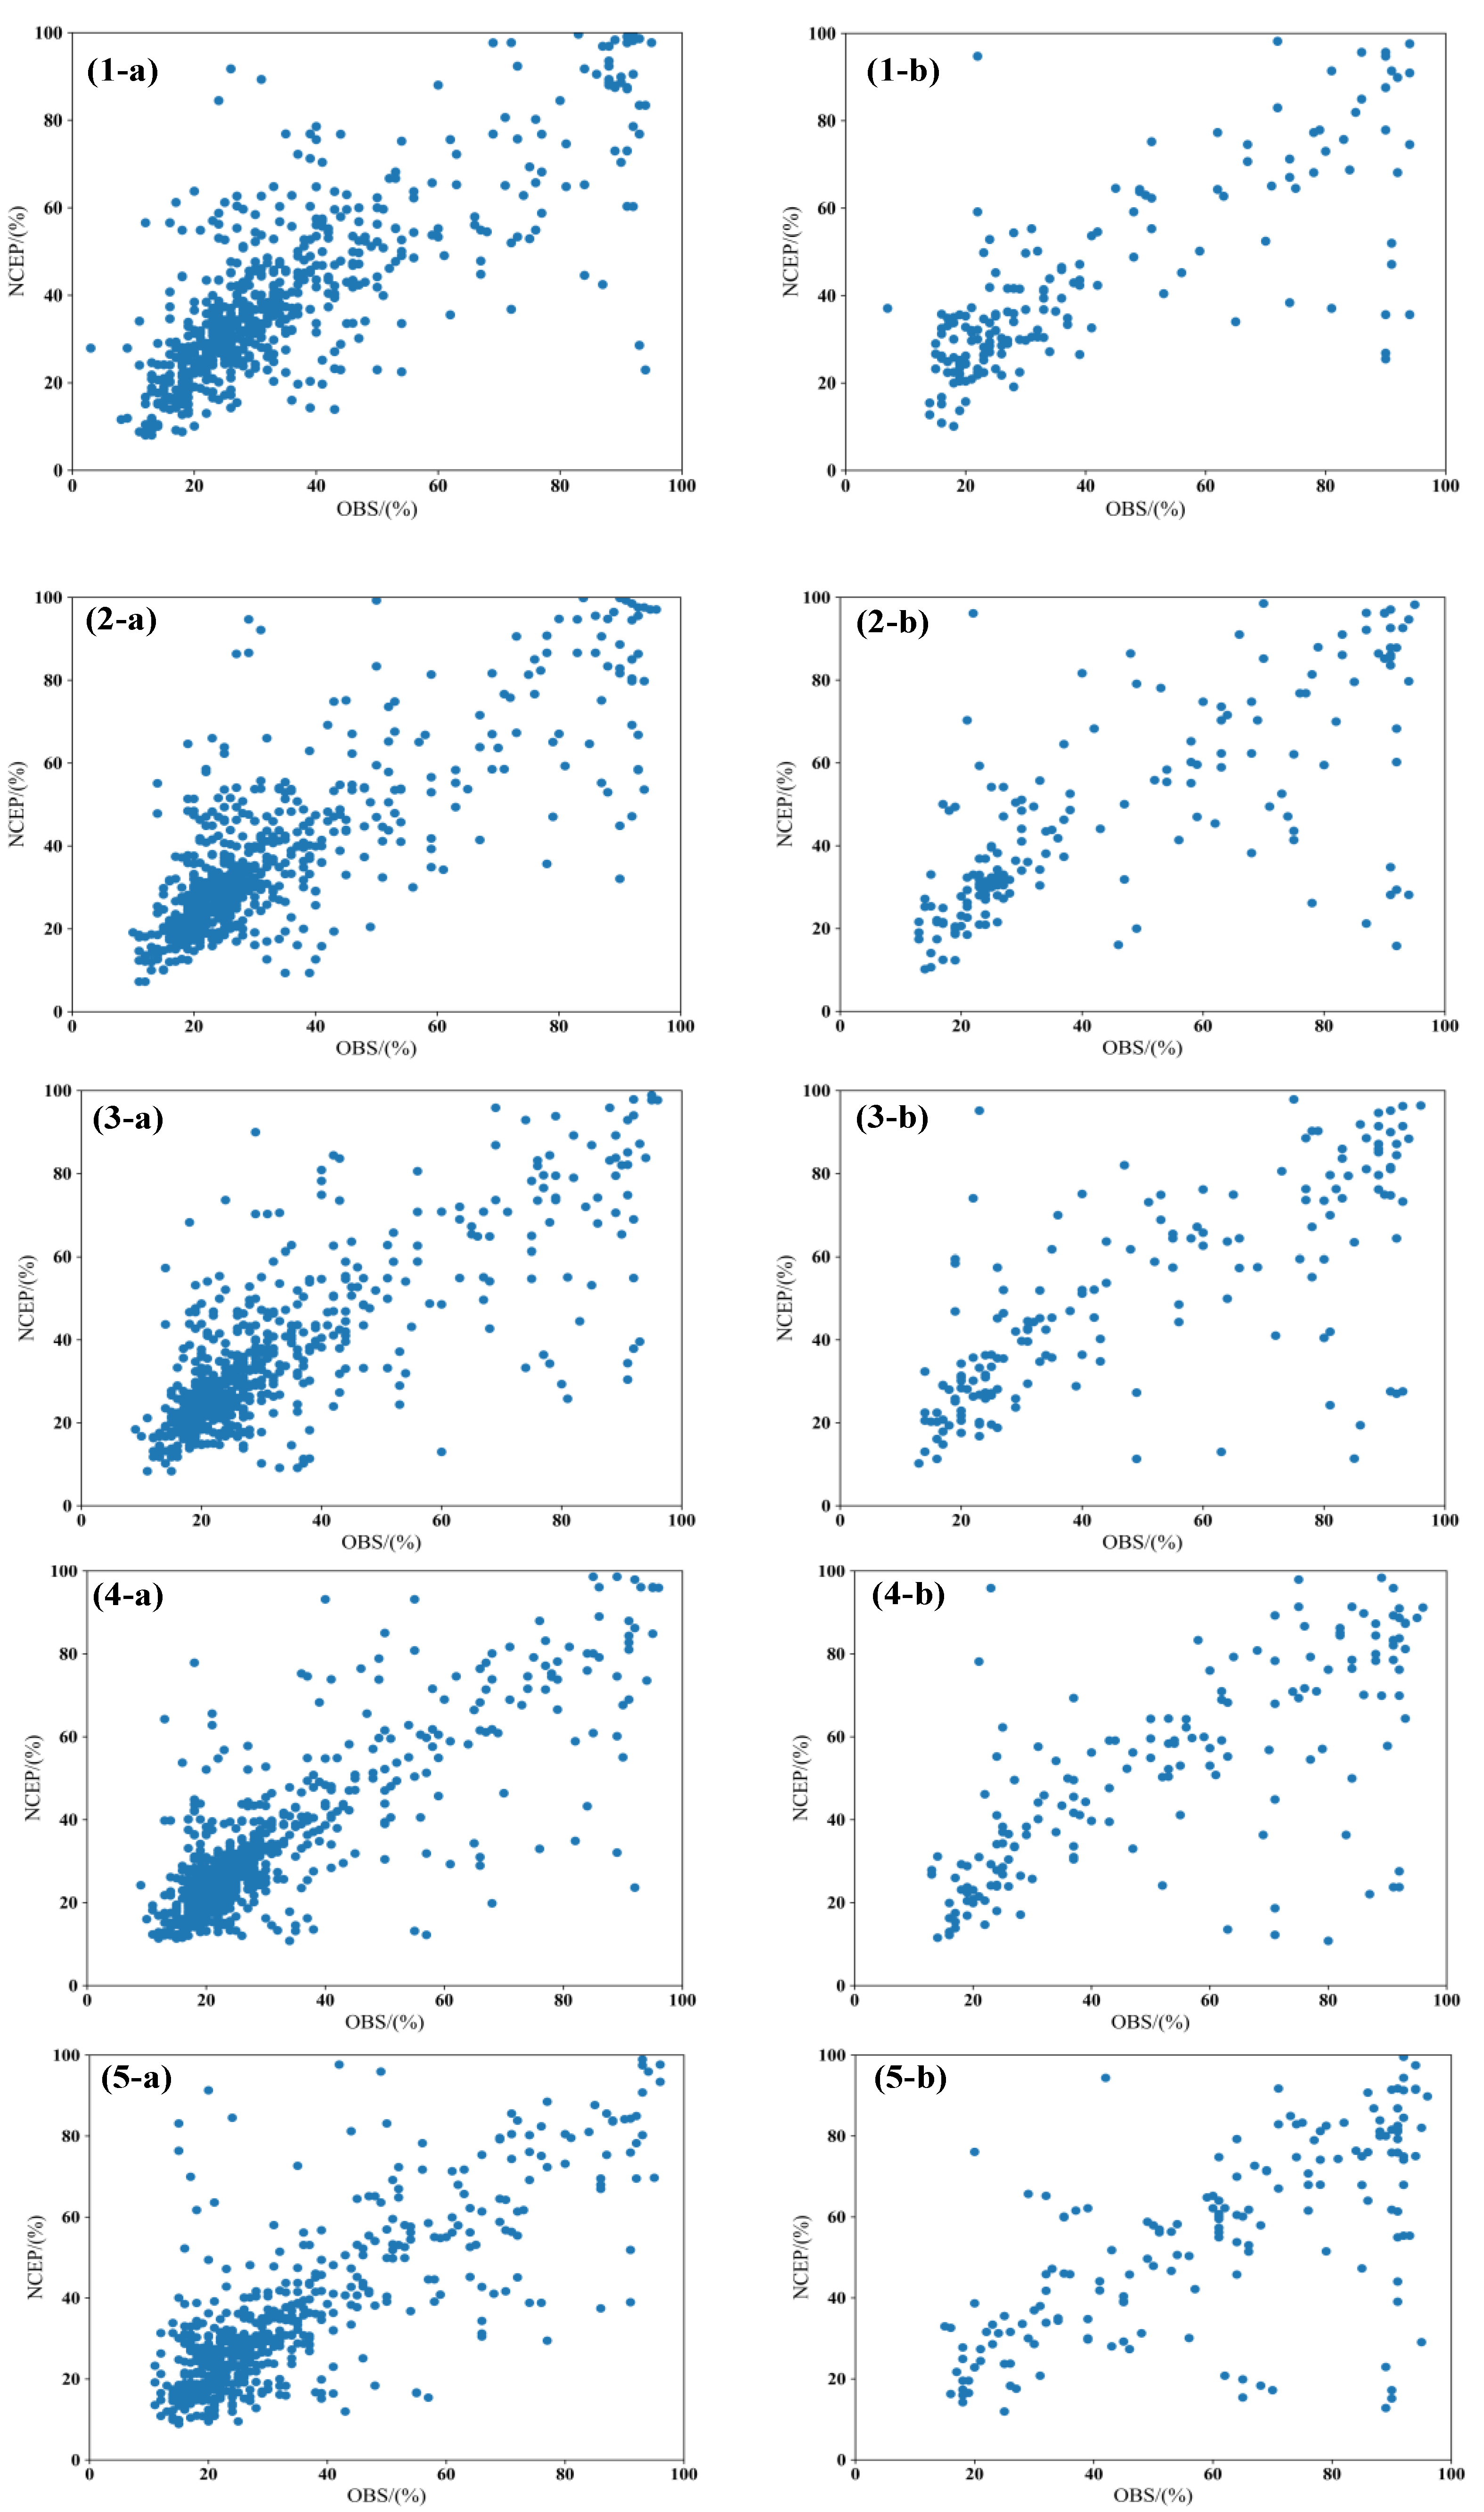
Figure 6 and Table 4 present the correlation of the relative humidity between the observations and the NCEP/FNL reanalysis data in different layers during the clean days and polluted days. The prediction of relative humidity in the NCEP/FNL reanalysis data is higher than the observations and the B I A S increases with height on the clean days. In addition, the R M S E ranges from 12.4% to 13.8% and the C C is about 0.79 on the clean days. Compared with research by Yuan (2012) (5–15%) [53], our results are acceptable. For the polluted days, although the B I A S of the relative humidity gradually increases with height, the NCEP/FNL reanalysis data are lower than the observations at 1000 (−5.12%) and 950 hPa (−0.90%). It has been revealed that the high relative humidity is conducive to the absorption of aerosol particles on the polluted days [54,55]. Therefore, the underestimation of the near-surface relative humidity in the NCEP/FNL reanalysis data may be one of the main reasons for the underestimation of the simulated particle concentrations in the air quality model. In addition, the correlation of the relative humidity between the NCEP/FNL reanalysis data and the observations is less than 0.75 on the polluted days, which decreases to some degree in all layers on the clean days. Overall, the reliability of the NCEP/FNL reanalysis data for the prediction of relative humidity on polluted days is lower than that on clean days, especially in the near-surface layer.

3.1.3. Wind Speed

There is a great deal of research that has indicated that the stable atmospheric structure is often accompanied with low wind speed on the polluted days, where it is easy for the pollutants to accumulate in the atmospheric boundary layer [56]. Figure 7 displays the observed wind speed on clean days and polluted days in different layers. As can be seen, the wind speed increases with height on both the clean days and polluted days, but the wind speed on polluted days is significantly lower than that on clean days. For example, the median of the wind speed on the polluted days is only 2.6 m s−1 at 1000 hPa, which accounts for 51.9% of that on the clean days.
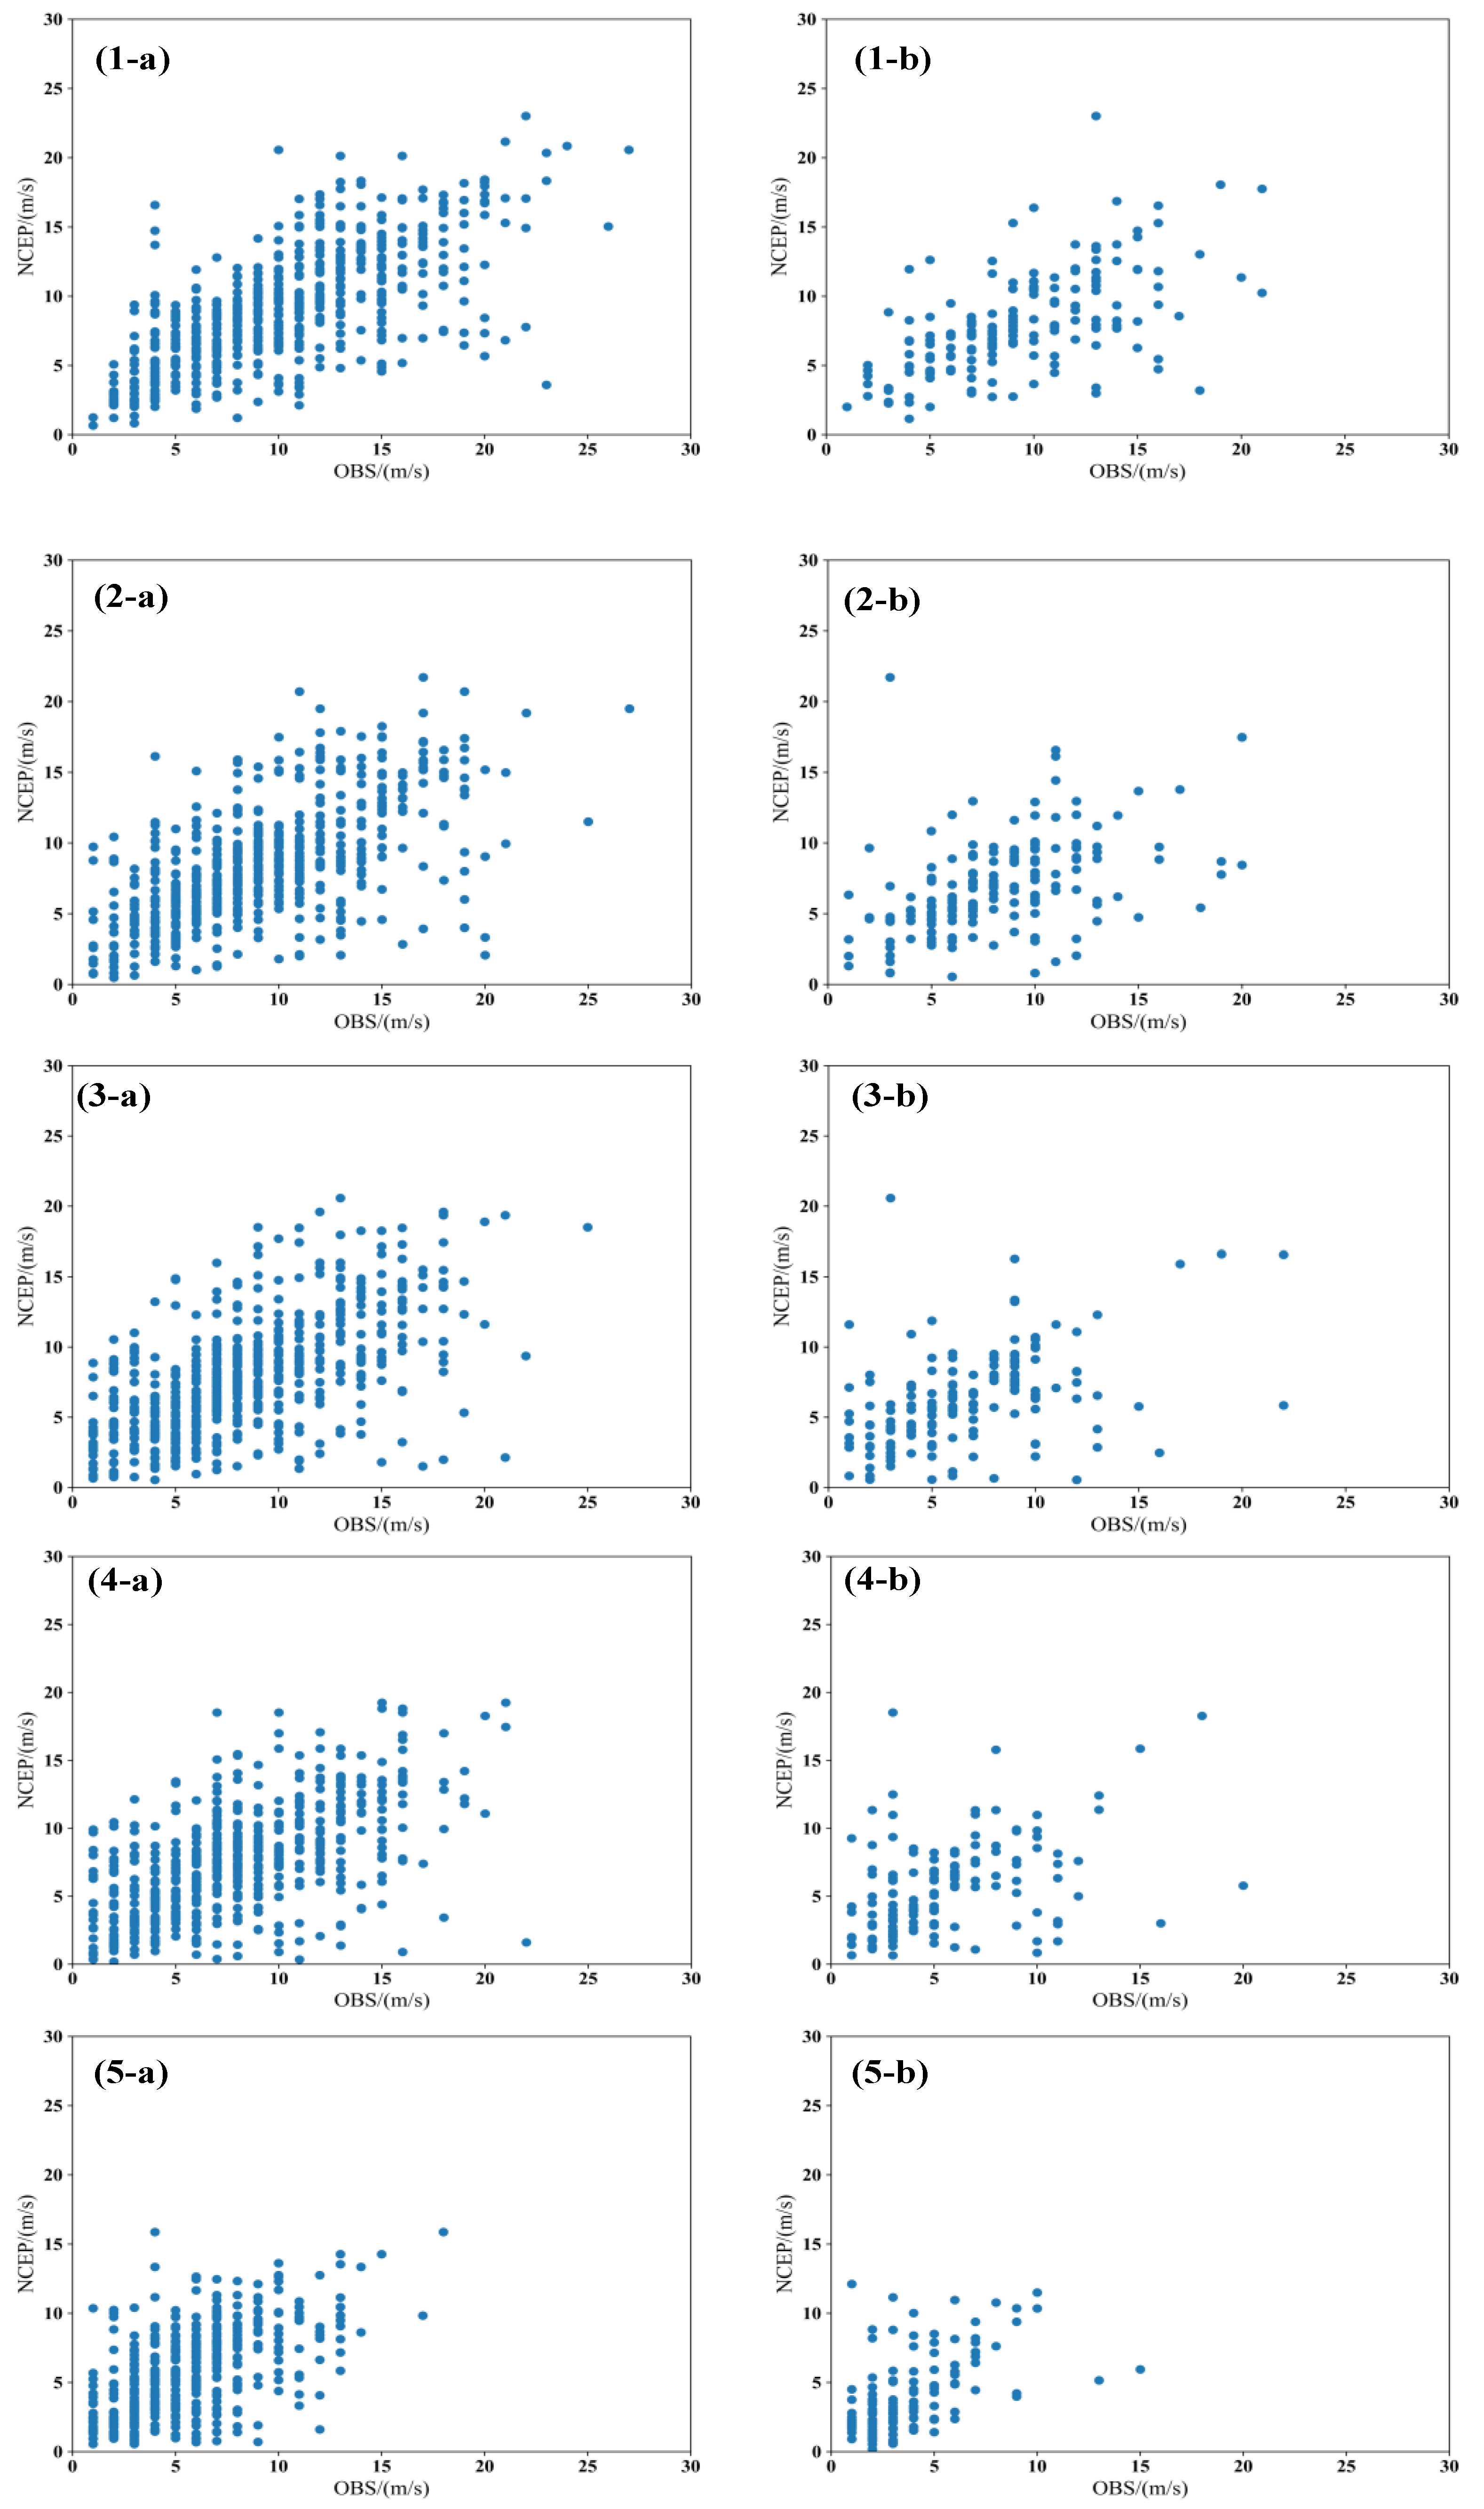
It can be clearly seen from Figure 8 and Table 5 that the wind speed in the NCEP/FNL reanalysis data is weaker than the observations at 850–950 hPa on both clean and polluted days, while it is stronger in the near-surface layer (1000 hPa) with B I A S s of 0.19 m s−1 on the clean days and 0.21 m s−1 on the polluted days. This may result in two direct or indirect effects. One is that the overestimation of the near-surface wind speed will promote the diffusion ability for the pollutants, resulting in the underestimation of the pollutant concentrations. The other is that small differences between the upper and lower layers will reduce the vertical exchange capacity in the boundary layer. In addition, the RMSE of 2.60–4.02 m s−1 agrees somewhat with the results of Dong (2014) (2.5–5.0 m s−1) [57]. In addition, there is no significant difference in the B I A S and RMSE between the clean days and polluted days. However, the C C on the clean days is significantly larger than that on the polluted days, with the former as 0.57–0.69 and the latter as only 0.40–0.58. Although the reliability of the NCEP/FNL data for the prediction of wind speed is better on clean days than that on polluted days, it is lowest compared with those of the temperature and relative humidity.
According to the above C C results, the prediction reliability of temperature is highest, followed by the relative humidity and wind speed in NCEP/FNL reanalysis. In addition, the prediction reliability of clean days is better than that on polluted days. Based on previous research, there is a two-way feedback mechanism between meteorological factors and pollutants in the boundary layer [49,58]. This feedback mechanism is that aerosols weaken the solar radiation reaching the ground, inhibit the development of the boundary layer, and significantly reduce the dilution ability of all pollutants in the horizontal and vertical directions. As this feedback mechanism is not considered in the NCEP/FNL reanalysis model, the relative humidity is underestimated and the near-surface wind speed is overestimated in the reanalysis data, as mentioned above, which mainly contributes to the underestimation of the pollutant concentrations in the air quality model.

3.2. Diagnostic Physical Quantity

Many studies have suggested that the meteorological factors play important roles in the diffusion and transport of the pollutants in the boundary layer [56,59,60]. In order to further analyze the reliability of the NCEP/FNL reanalysis data, the temperature inversion and wind shear that, respectively, represent the thermal and dynamic conditions were selected. A temperature inversion is where the temperature in an upper layer is higher than the temperature in its adjacent low layer. A wind shear calculation method was introduced in the paper of Xu (2016) [61].

3.2.1. Temperature Inversion

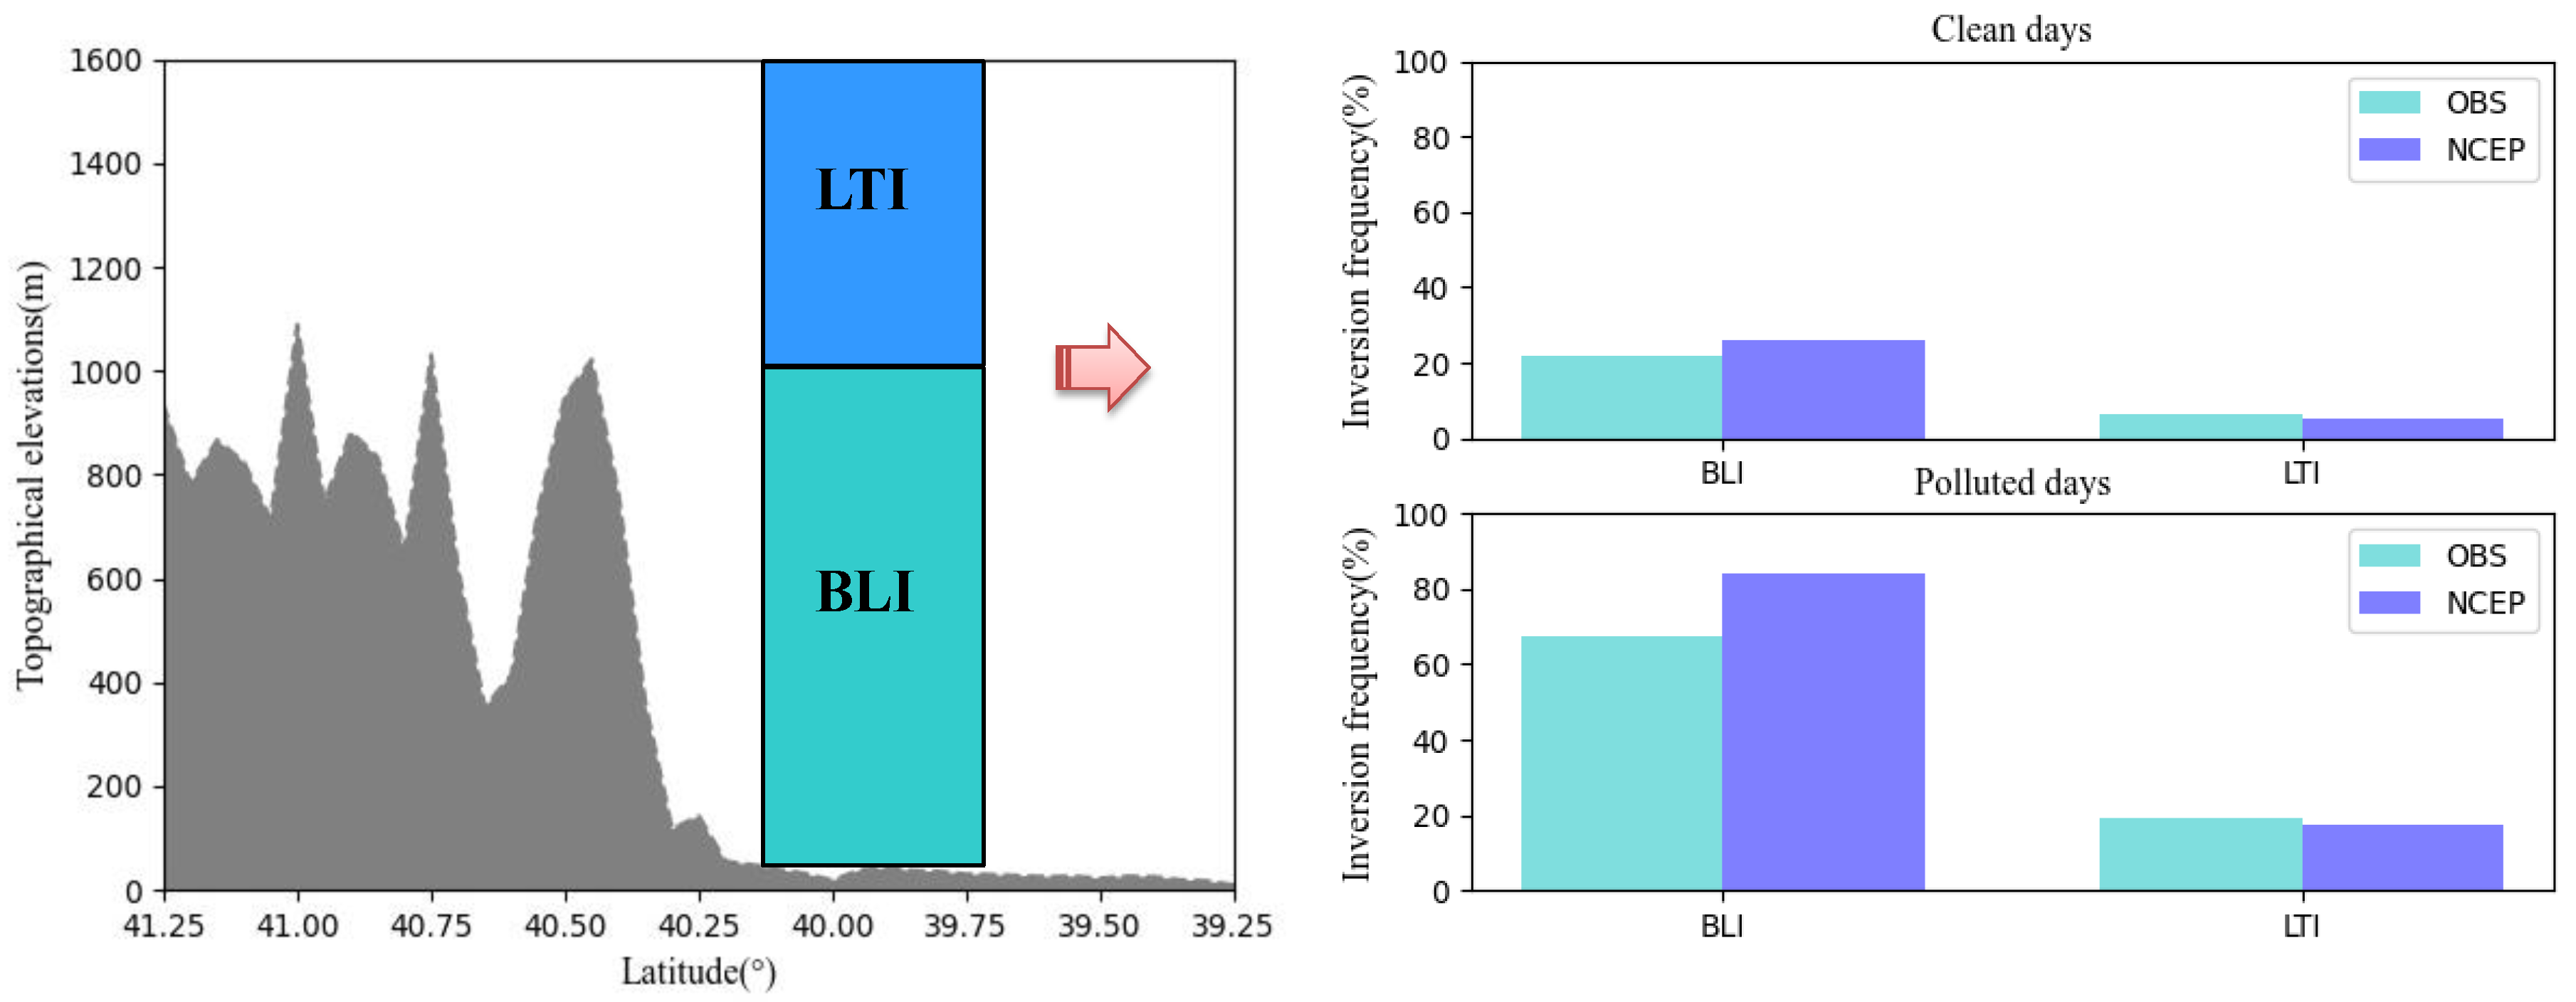
The temperature inversion layer has a strong inhibitory effect on the convection, and the existence of a temperature inversion prevents the downward transport of the momentum, which results in a large number of water vapor and aerosol particles gathering under the temperature inversion layer. The moisture absorption of aerosol particles is conducive to the formation of air pollution. The temperature inversion with the bottom height above 1000 m is called the lower-troposphere inversion (LTI), while the surface-based temperature inversion (SI) and elevated temperature inversion (EI) are collectively referred to as the boundary layer inversion (BLI), of which both the bottom heights are below 1000 m [62]. The temperature inversion frequencies in both the observations and the NCEP/FNL reanalysis data on clean days and polluted days are shown in Figure 9. As can be seen, the frequency of the BLIs (84.1%) extracted from the NCEP/FNL reanalysis data on polluted days is significantly higher than that from the observations. However, the frequency of the LTIs is slightly lower than that from the observation, which are 5.2% and 17.6% on clean days and polluted days, respectively.
To better understand the reliability of the NCEP/FNL reanalysis data for the temperature inversion, some statistics for temperature inversion are given in Table 6. The temperature inversion intensity between 950–1000 and 850–900 hPa on polluted days is higher than that on clean days, which are 2.19 °C and 2.06 °C, respectively. In addition, the temperature inversion intensity predicted by the NCEP/FNL reanalysis data is significantly lower than the observations, especially on polluted days. The differences in the temperature inversion intensities between the NCEP/FNL reanalysis data and the observations are between 0.16 and 0.62 °C on clean days, which is more significant than the range of 0.56–0.77 °C on polluted days. Similarly, the difference in the accumulated temperature inversion in all layers between the NCEP/FNL reanalysis data and the observations is only 0.1 °C on the clean days, while it is −0.55 °C on the polluted days. Although the temperature inversion frequency is higher under the height of 1000 m, its intensity is significantly underestimated by the NCEP/FNL reanalysis data.

3.2.2. Wind Shear

Vertical wind shear is an important factor influencing the diffusion of the pollutants [62,63]. Therefore, the wind shears at 850–925 and 925–1000 hPa were selected to represent the conditions in the upper and lower boundary layers, respectively.
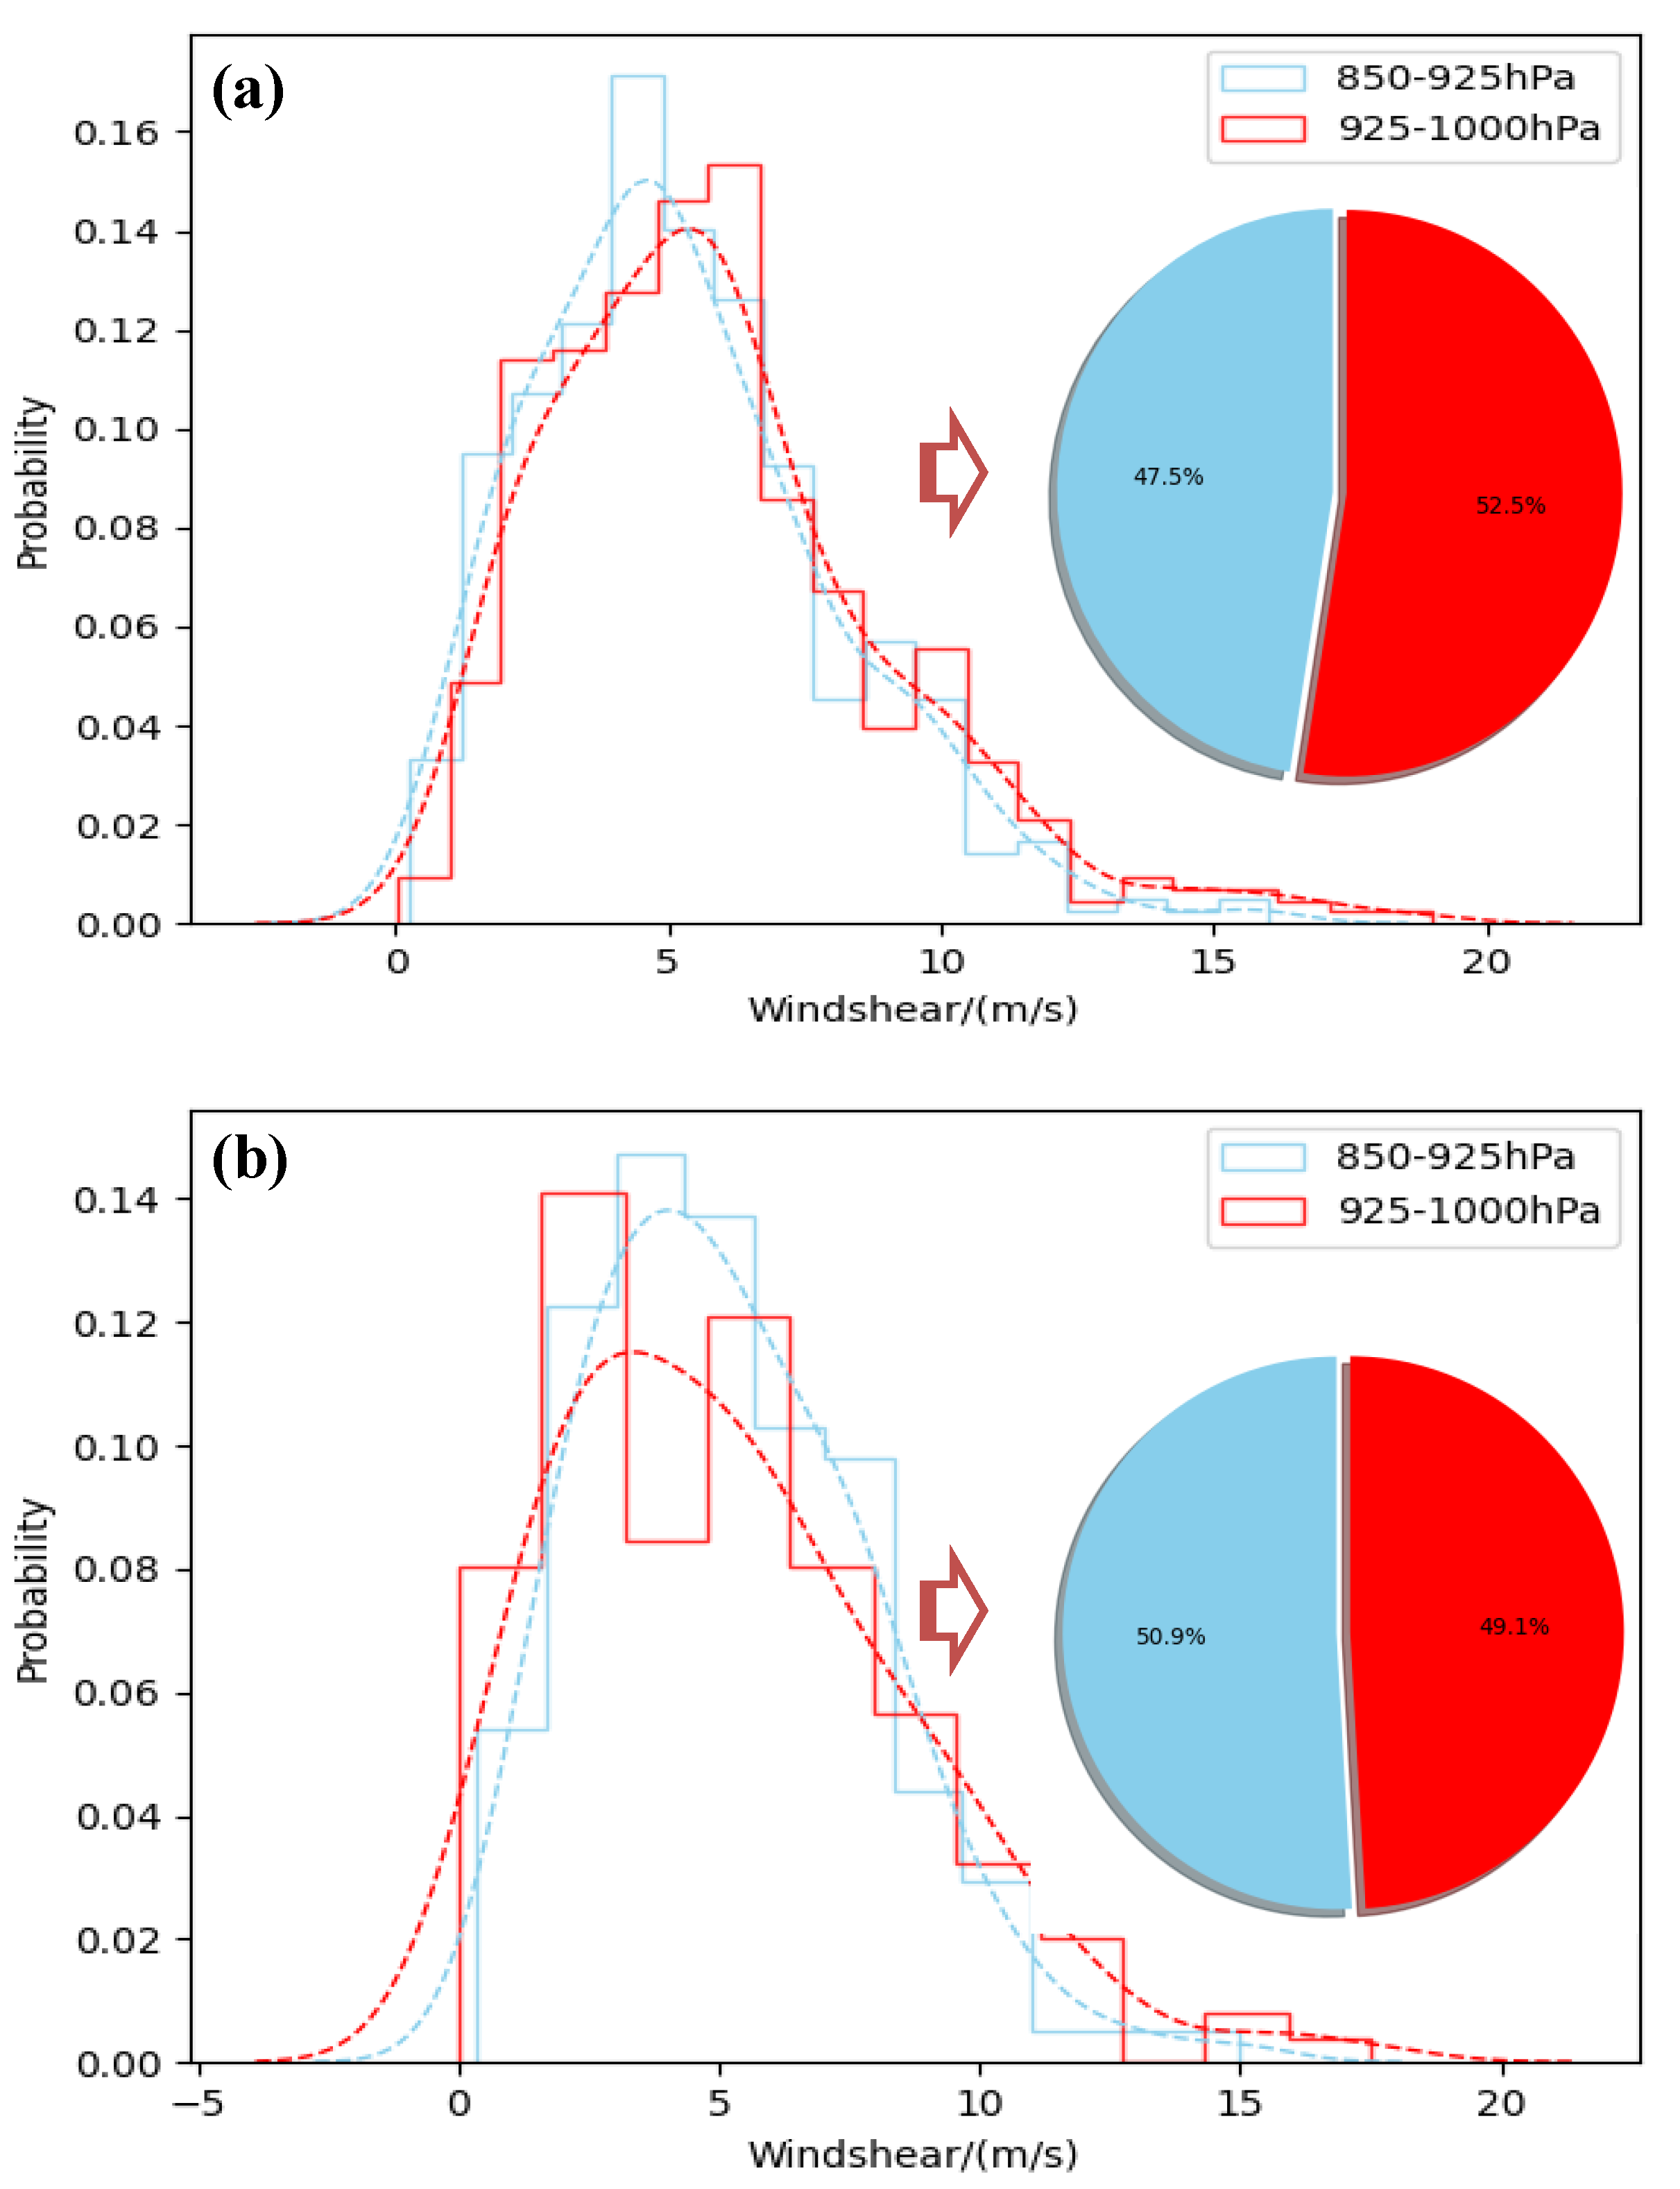
The observations (Figure 10) display similar distribution patterns of the wind shears at 850–925 and 925–1000 hPa. The wind shears with occurrence probabilities of over 0.1 are mainly distributed in the ranges of 2.0–7.0 m s−1 on clean days and 1.0–6.5 m s−1 on polluted days. Additionally, the wind shears at 925–1000 and 850–925 hPa account for 52.5% and 47.5% of the total on clean days, respectively (Figure 10), while the difference is only 1.8%. This indicates that the dynamic condition of the lower boundary layer is slightly more significant but less stable on clean days.
In order to further assess the reliability of the NCEP/FNL reanalysis data in describing the wind shear, the statistics for the wind shears between the observations and the NCEP/FNL reanalysis data on clean days and polluted days are presented in Table 7. The wind shear depicted by the NCEP/FNL reanalysis data is significantly smaller than that by the observations on both clean and polluted days, indicating that the dynamic conditions in the boundary layer are underestimated by the NCEP/FNL reanalysis data. Although no past studies have reported that the wind shear calculated by NCEP/FNL data is underestimated compared with the observations, the SI index (representing the stability of the atmosphere) calculated by the NCEP/FNL data [64] is lower than the observation. Besides, the NCEP/FNL reanalysis data perform better for wind shears in the lower boundary layer than in the upper layer. For example, the difference between the NCEP/FNL reanalysis data and the observations is 1.08 m s−1 on the clean days in the upper boundary layer (850–925 hPa), while it is only 0.16 m s−1 in the lower boundary layer (925–1000 hPa). In addition, the difference between the NCEP/FNL reanalysis data and the observations increases to 0.40 m s−1 in the lower boundary layer on polluted days, indicating that the underestimation of the dynamic conditions in the lower boundary layer is more significant on polluted days.

4. Conclusions and Discussion

In this study, the reliabilities of the NCEP/FNL reanalysis data on clean days and polluted days during the period of 2017–2019 in autumn and winter in Beijing were assessed and compared, which provides references for the development of the NCEP/FNL reanalysis data and model simulations. It also provides the scientific basis for the assessment of the air pollution. The main conclusions are as follows.
In terms of the temperature, relative humidity, and wind speed, the NCEP/FNL reanalysis data perform best in depicting the temperature. Although the temperature described by the NCEP/FNL reanalysis is slightly lower than the observations, and the B I A S is from −0.15 °C to −0.75 °C (−0.45 °C to −0.81 °C) on the clean days (polluted days), there is generally no significant difference between the clean days and polluted days.
It is worth noting that the relative humidity described by the NCEP/FNL reanalysis data is lower than the observations on the polluted days, with a B I A S of −5.12% (−0.90%) at 1000 hPa (950 hPa), while the prediction of wind speed by the NCEP/FNL data is higher at 1000 hPa, with B I A S s of 0.19 m s−1 on the clean days and 0.21 m s−1 on the polluted days.
The temperature inversion intensity depicted by the NCEP/FNL reanalysis data is significantly lower than the observations, especially on polluted days. The difference in the temperature inversion intensity between the NCEP/FNL reanalysis data and the observations is between 0.16 and 0.62 °C on the clean days, which is more significant with the range of 0.56–0.77 °C on the polluted days. It is suggested that the temperature inversion intensity is significantly underestimated by the NCEP/FNL reanalysis data, especially on the polluted days. Additionally, the analysis of the wind shear concludes that the difference between the NCEP/FNL reanalysis data and the observations increases to 0.40 m/s in the lower boundary layer on the polluted days.
Therefore, in this study, it is suggested that the relative humidity and temperature inversion intensity are underestimated and the near-surface wind speed is overestimated by the NCEP/FNL reanalysis data, which can lead to the underestimation of the pollutant concentrations in the air quality model. Furthermore, the effect of the underestimation by the NCEP/FNL reanalysis data on dynamic conditions should not be ignored, because it may impact the vertical exchange of the pollutants.

Author Contributions

Conceptualization, C.L.; methodology, B.Z.; data curation and formal analysis and writing—original draft preparation, C.L.; writing—review and editing, J.G.; visualization, H.Z.; funding acquisition: P.G. and R.X. All authors have read and agreed to the published version of the manuscript.

Funding

This work was supported by the grants from the Open Research Program of the State Key Laboratory of Severe Weather (2019LASW-B12), National Key R&D Program Pilot Project of China (2016YFC0203301), National Key Research and Development Program of China(2019YFC0214602), and National Natural Science Foundation of China (42005095). The authors are grateful to the anonymous reviewers for their insightful comments.

Institutional Review Board Statement

Not applicable.

Informed Consent Statement

Not applicable.

Data Availability Statement

Not applicable.

Conflicts of Interest

The authors declare that they have no known competing financial interests or personal relationships that could have appeared to influence the work reported in this paper.

References

  1. Guo, Z.; Guo, Q.; Chen, S.; Zhu, B.; Zhang, Y.; Yu, J.; Guo, Z. Study on pollution behavior and sulfate formation during the typical haze event in Nanjing with water soluble inorganic ions and sulfur isotopes. Atmos. Res. 2019, 217, 198–207. [Google Scholar] [CrossRef]
  2. Li, W.; Liu, X.; Zhang, Y.; Tan, Q.; Feng, M.; Song, M.; Hui, L.; Qu, Y.; An, J.; Gao, H. Insights into the phenomenon of an explosive growth and sharp decline in haze: A case study in Beijing. J. Environ. Sci. 2019, 84, 122–132. [Google Scholar] [CrossRef] [PubMed]
  3. Li, X.; Gao, Z.; Li, Y.; Gao, C.Y.; Ren, J.; Zhang, X. Meteorological conditions for severe foggy haze episodes over north China in 2016–2017 winter. Atmos. Environ. 2019, 199, 284–298. [Google Scholar] [CrossRef]
  4. Dong, Z.S.; Su, F.C.; Zhang, Z.Y.; Wang, S.B. Observation of chemical components of PM2.5 and secondary inorganic aerosol formation during haze and sandy haze days in Zhengzhou, China. J. Environ. Sci. China 2020, 88, 316–325. [Google Scholar] [CrossRef] [PubMed]
  5. Li, Q.; Wu, B.; Liu, J.; Zhang, H.; Cai, X.; Song, Y. Characteristics of the atmospheric boundary layer and its relation with PM2.5 during haze episodes in winter in the North China Plain. Atmos. Environ. 2020, 223, 117265. [Google Scholar] [CrossRef]
  6. He, J.; Gong, S.; Zhou, C.; Lu, S.; Wu, L.; Chen, Y.; Yu, Y.; Zhao, S.; Yu, L.; Yin, C. Analyses of winter circulation types and their impacts on haze pollution in Beijing. Atmos. Environ. 2018, 192, 94–103. [Google Scholar] [CrossRef] [Green Version]
  7. Xu, Q.; Wang, S.; Jiang, J.; Bhattarai, N.; Li, X.; Chang, X.; Qiu, X.; Zheng, M.; Hua, Y.; Hao, J. Nitrate dominates the chemical composition of PM2.5 during haze event in Beijing, China. Sci. Total Environ. 2019, 689, 1293–1303. [Google Scholar] [CrossRef]
  8. Ma, T.; Duan, F.; He, K.; Qin, Y.; Tong, D.; Geng, G.; Liu, X.; Li, H.; Yang, S.; Ye, S.; et al. Air pollution characteristics and their relationship with emissions and meteorology in the Yangtze River Delta region during 2014–2016. J. Environ. Sci. 2019, 83, 8–20. [Google Scholar] [CrossRef] [PubMed]
  9. Yang, S.; Duan, F.; Ma, Y.; Li, H.; Ma, T.; Zhu, L.; Huang, T.; Kimoto, T.; He, K. Mixed and intensive haze pollution during the transition period between autumn and winter in Beijing, China. Sci. Total Environ. 2020, 711, 134745. [Google Scholar] [CrossRef]
  10. Zhou, S.Z.; Yang, L.X.; Gao, R.; Wang, X.F.; Gao, X.M.; Nie, W.; Xu, P.J.; Zhang, Q.Z.; Wang, W.X. A comparison study of carbonaceous aerosols in a typical North China Plain urban atmosphere: Seasonal variability, sources and implications to haze formation. Atmos. Environ. 2017, 149, 95–103. [Google Scholar] [CrossRef]
  11. Liu, C.; Hua, C.; Zhang, H.; Zhang, B.; Wang, G.; Zhu, W.; Xu, R. A severe fog-haze episode in Beijing-Tianjin-Hebei region: Characteristics, sources and impacts of boundary layer structure. Atmos. Pollut. Res. 2019, 10, 1190–1202. [Google Scholar] [CrossRef]
  12. Sun, J.; Gong, J.; Zhou, J.; Liu, J.; Liang, J. Analysis of PM2.5 pollution episodes in Beijing from 2014 to 2017: Classification, interannual variations and associations with meteorological features. Atmos. Environ. 2019, 213, 384–394. [Google Scholar] [CrossRef]
  13. Wang, S.B.; Yin, S.S.; Zhang, R.Q.; Yang, L.M.; Zhao, Q.Y.; Zhang, L.S.; Yan, Q.S.; Jiang, N.; Tang, X.Y. Insight into the formation of secondary inorganic aerosol based on high-time-resolution data during haze episodes and snowfall periods in Zhengzhou, China. Sci. Total Environ. 2019, 660, 47–56. [Google Scholar] [CrossRef] [PubMed]
  14. Zhang, H.; Cheng, S.; Yao, S.; Wang, X.; Zhang, J. Multiple perspectives for modeling regional PM2.5 transport across cities in the Beijing–Tianjin–Hebei region during haze episodes. Atmos. Environ. 2019, 212, 22–35. [Google Scholar] [CrossRef]
  15. Liu, D.Y.; Yan, W.L.; Kang, Z.M.; Liu, A.N.; Zhu, Y. Boundary-layer features and regional transport process of an extreme haze pollution event in Nanjing, China. Atmos. Pollut. Res. 2018, 9, 1088–1099. [Google Scholar] [CrossRef]
  16. Shi, P.; Zhang, G.; Kong, F.; Chen, D.; Azorin-Molina, C.; Guijarro, J.A. Variability of winter haze over the Beijing-Tianjin-Hebei region tied to wind speed in the lower troposphere and particulate sources. Atmos. Res. 2019, 215, 1–11. [Google Scholar] [CrossRef]
  17. Deng, H.; Tan, H.B.; Li, F.; Cai, M.F.; Chan, P.W.; Xu, H.B.; Huang, X.Y.; Wu, D. Impact of relative humidity on visibility degradation during a haze event: A case study. Sci. Total Environ. 2016, 569–570, 1149–1158. [Google Scholar] [CrossRef] [PubMed]
  18. Liu, W.; Han, Y.; Li, J.; Tian, X.; Liu, Y. Factors affecting relative humidity and its relationship with the long-term variation of fog-haze events in the Yangtze River Delta. Atmos. Environ. 2018, 193, 242–250. [Google Scholar] [CrossRef]
  19. Wu, W.; Zha, Y.; Zhang, J.; Gao, J.; He, J. A temperature inversion-induced air pollution process as analyzed from Mie LiDAR data. Sci. Total Environ. 2014, 479–480, 102–108. [Google Scholar] [CrossRef]
  20. Zang, Z.; Wang, W.; You, W.; Li, Y.; Ye, F.; Wang, C. Estimating ground-level PM2.5 concentrations in Beijing, China using aerosol optical depth and parameters of the temperature inversion layer. Sci. Total Environ. 2017, 575, 1219–1227. [Google Scholar] [CrossRef] [PubMed]
  21. Xu, T.; Song, Y.; Liu, M.; Cai, X.; Zhang, H.; Guo, J.; Zhu, T. Temperature inversions in severe polluted days derived from radiosonde data in North China from 2011 to 2016. Sci. Total Environ. 2019, 647, 1011–1020. [Google Scholar] [CrossRef]
  22. Bei, N.; Xiao, B.; Meng, N.; Feng, T. Critical role of meteorological conditions in a persistent haze episode in the Guanzhong basin, China. Sci. Total Environ. 2016, 550, 273–284. [Google Scholar] [CrossRef] [PubMed]
  23. Zhou, Y.K.; Zhu, B.; Han, Z.W.; Pan, C.; Guo, T.; Wei, J.S.; Liu, D.Y. Analysis of visibility characteristics and connecting factors over the Yangtze River Delta Region during winter time. China Environ. Sci. 2016, 36, 660–669. (In Chinese) [Google Scholar]
  24. Lu, M.M.; Tang, X.; Wang, Z.F.; Alex, G.; Liang, S.W.; Hu, K.; Wu, L.; Wu, H.J.; Huang, Z.; Shen, L.J. Source tagging modeling study of heavy haze episodes under complex regional transport processes over Wuhan megacity, Central China. Environ. Pollut. 2017, 231, 612–621. [Google Scholar] [CrossRef] [PubMed]
  25. Bei, N.F.; Li XPTie, X.X.; Zhao, L.N.; Wu, J.R.; Li, X.; Liu, L.; Shen, Z.X.; Li, G.H. Impact of synoptic patterns and meteorological elements on the wintertime haze in the Beijing-Tianjin-Hebei region, China from 2013 to 2017. Sci. Total Environ. 2020, 704, 1–10. [Google Scholar] [CrossRef] [PubMed]
  26. Zhang, L.; Wang, T.; Lv, M.Y.; Zhang, Q. On the severe haze in Beijing during January 2013: Unraveling the effects of meteorological anomalies with WRF-Chem. Atmos. Environ. 2015, 104, 11–21. [Google Scholar] [CrossRef]
  27. Li, J.; Du, H.; Wang, Z.; Sun, Y.; Yang, W.; Li, J.; Tang, X.; Fu, P. Rapid formation of a severe regional winter haze episode over a mega-city cluster on the North China Plain. Environ. Pollut. 2017, 223, 605–615. [Google Scholar] [CrossRef] [PubMed]
  28. Lee, Y.; Yang, X.; Wenig, M. Transport of dusts from East Asian and non-East Asian sources to Hong Kong during dust storm related events 1996–2007. Atmos. Environ. 2010, 44, 3728–3738. [Google Scholar] [CrossRef]
  29. Li, T.; Deng, X.; Li, Y.; Song, Y.; Li, L.; Tan, H.; Wang, C. Transport paths and vertical exchange characteristics of haze pollution in Southern China. Sci. Total Environ. 2018, 625, 1074–1087. [Google Scholar] [CrossRef]
  30. Kanamitsu, M.; Ebisuzaki, W.; Woollen, J.; Yang, S.-K.; Hnilo, J.J.; Fiorino, M.; Potter, G.L. NCEP–DOE AMIPII Reanalyzed (R-2). Br. Am. Meteor. Soc. 2002, 83, 1631–1643. [Google Scholar] [CrossRef]
  31. Fu, J.J.; Li, S. Intercomparison of the South Asian high in NCEP1, NCEP2, and ERA-40 reanalyses and in station observations. Atmos. Ocean. Sci. Lett. 2012, 5, 189–194. [Google Scholar]
  32. Carvalho, D.; Rocha, A.; Gómez-Gesteira, M.; Santos, C.S. Comparison of reanalyzed, analyzed, satellite-retrieved and NWP modelled winds with buoy data along the Iberian Peninsula coast. Remote Sens. Environ. 2014, 152, 480–492. [Google Scholar] [CrossRef]
  33. Stopa, J.E.; Cheung, K.F. Intercomparison of wind and wave data from the ECMWF Reanalysis Interim and the NCEP Climate Forecast System Reanalysis. Ocean. Model. 2014, 75, 65–83. [Google Scholar] [CrossRef]
  34. Dhana, L.D.; Satyanarayana, A.N.V. Influence of atmospheric rivers in the occurrence of devastating flood associated with extreme precipitation events over Chennai using different reanalysis data sets. Atmos. Res. 2019, 215, 12–36. [Google Scholar] [CrossRef]
  35. Huai, B.; Wang, Y.; Ding, M.; Zhang, J.; Dong, X. An assessment of recent global atmospheric reanalyses for Antarctic near surface air temperature. Atmos. Res. 2019, 226, 181–191. [Google Scholar] [CrossRef]
  36. Santer, B.D.; Wigley, T.M.L.; Gaffen, D.J.; Bengtsson, L.; Doutriaux, C.; Boyle, J.S.; Esch, M.; Hnilo, J.J.; Jones, P.D.; Meehl, G.A.; et al. Interpreting Differential Temperature Trends at the Surface and in the Lower Troposphere. Science 2000, 287, 1227–1232. [Google Scholar] [CrossRef] [PubMed] [Green Version]
  37. Zolina, O.; Kapala, A.; Simmer, C.; Gulev, S.K. Analysis of extreme precipitation over Europe from different reanalyses: A comparative assessment. Glob. Planet. Chang. 2004, 44, 129–161. [Google Scholar] [CrossRef]
  38. Xie, A.; Ren, J.; Qin, X.; Kang, S. Pressure and temperature feasibility of NCEP/NCAR reanalysis data at Mt. Everest. J. Mt. Sci. 2008, 5, 32–37. [Google Scholar] [CrossRef]
  39. Tabata, Y.; Hashiguchi, H.; Yamamoto, M.K.; Yamamoto, M.; Yamanaka, M.D.; Mori, S.; Syamsudin, F.; Manik, T. Lower trop-ospheric horizontal wind over Indonesia: A comparison of wind profiler network observations with global reanalyses. J. Atmos. Sol. Terr. Phys. 2011, 73, 986–995. [Google Scholar] [CrossRef]
  40. Wang, Y.; Zhou, D.; Bunde, A.; Havlin, S. Testing reanalyzed data sets in Antarctica: Trends, persistence properties, and trend significance. J. Geophys. Res. Atmos. 2016, 121, 12839–12855. [Google Scholar] [CrossRef] [Green Version]
  41. Cheng, H.H.; Wang, Y.B.; Wen, B.; Wu, S.; Zhi, M.L.; Zhao, L. Confidence analysis of rainy and snowy weather diagnosis in Kelan, Shanxi province based on NCEP/FNL data. J. Meteorol. Environ. 2019, 35, 23–31. (In Chinese) [Google Scholar]
  42. Brunke, M.A.; Stegall, S.T.; Zeng, X. A climatology of tropospheric humidity inversions in five reanalyses. Atmos. Res. 2015, 153, 165–187. [Google Scholar] [CrossRef] [Green Version]
  43. Zhao, T.B.; Fu, C.B. Preliminary Comparison and Analysis between ERA-40, NCEP-2 Reanalysis and Observations over China. Clim. Environ. Res. 2006, 11, 14–32. (In Chinese) [Google Scholar]
  44. Malmusi, S.; Boccolari, M. Upper and middle precipitable water calculated from METEOSAT-8/-9 tropospheric humidity and NCEP/NCAR temperatures. Atmos. Res. 2010, 95, 8–18. [Google Scholar] [CrossRef]
  45. Wei, Y.H.; Wang, Y.C.; Zhu, L.L.; Lin, X.M.; Yang, Y. Confidence and characteristics of short-duration heavy rainfall environment parameters based on merging data in Tianjin. Desert Oasis Meteorol. 2020, 14, 84–91. (In Chinese) [Google Scholar]
  46. Xu, Y.; Ding, Y.H.; Zhao, Z.C. Confidence Analysis of NCEP/NCAR 50-year Global Reanalyzed Data in Climate Change Research in China. J. Appl. Meteorol. Sci. 2001, 12, 337–347. (In Chinese) [Google Scholar]
  47. Zhou, S.W.; Zhang, R.H. Comparison of NCEP/NCAR reanalyzed data and radiosonde data about temperature and geopotential height of upper air over the Tibetan Plateau. Clim. Environ. Res. 2009, 14, 284–292. (In Chinese) [Google Scholar]
  48. You, Q.L.; Klaus, F.; Min JZKang, S.C.; Zhu, X.H.; Ren, G.Y.; Meng, X.H. Can temperature extremes in china be calculated from reanalysis? Glob. Planet. Chang. 2013, 111, 268–279. [Google Scholar] [CrossRef]
  49. Peng, Y.; Wang, H.; Zhang, X.; Zhao, T.; Jiang, T.; Che, H.; Zhang, W.; Liu, Z. Impacts of PBL schemes on PM2.5 simulation and their responses to aerosol-radiation feedback in GRAPES_CUACE model during severe haze episodes in Jing-Jin-Ji, China. Atmos. Res. 2021, 248, 105268. [Google Scholar] [CrossRef]
  50. Zhang, M.; Jin, S.K.; Ma, Y.Y.; Fan, R.N.; Wang, L.C.; Gong, W.; Liu, B.M. Haze events at different levels in winters: A comprehensive study of meteorological factors, Aerosol characteristics and direct radiative forcing in megacities of north and central China. Atmos. Environ. 2021, 245, 118056. [Google Scholar] [CrossRef]
  51. Ren, Y.; Zhang, H.; Wei, W.; Wu, B.; Liu, J.; Cai, X.; Song, Y. Comparison of the turbulence structure during light and heavy haze pollution episodes. Atmos. Res. 2019, 230, 104645. [Google Scholar] [CrossRef]
  52. Ren, Y.; Zhang, H.S.; Zhang, X.Y.; Li, Q.H.; Cai, X.H.; Song, Y.; Kang, L.; Zhu, T. Temporal and spatial characteristics of turbulent transfer and diffusion coefficient of PM2.5. Sci. Total Environ. 2021, 146804. [Google Scholar] [CrossRef]
  53. Yuan, S.; Cheng, H.; Wang, D.Y.; Wu, D.C.; Zhou, J. Comparative analysis on meteorological parameters of sounding data and model-generated sounding data. J. Meteorol. Sci. 2012, 32, 62–67. (In Chinese) [Google Scholar]
  54. Han, B.; Wang, Y.; Zhang, R.; Yang, W.; Ma, Z.; Geng, W.; Bai, Z. Comparative statistical models for estimating potential roles of relative humidity and temperature on the concentrations of secondary inorganic aerosol: Statistical insights on air pollution episodes at Beijing during January 2013. Atmos. Environ. 2019, 212, 11–21. [Google Scholar] [CrossRef]
  55. Peng, Y.; Wang, H.; Hou, M.; Jiang, T.; Zhang, M.; Zhao, T.; Che, H. Improved method of visibility parameterization focusing on high humidity and aerosol concentrations during fog–haze events: Application in the GRAPES_CAUCE model in Jing-Jin-Ji, China. Atmos. Environ. 2020, 222, 117139. [Google Scholar] [CrossRef]
  56. Wang, H.; Li, J.; Peng, Y.; Zhang, M.; Che, H.; Zhang, X. The impacts of the meteorology features on PM2.5 levels during a severe haze episode in central-east China. Atmos. Environ. 2019, 197, 177–189. [Google Scholar] [CrossRef]
  57. Dong, L.P.; Wu, L. Comparing wind profiler data with NCEP reanalyzed data and analyzing. Electron. Des. Eng. 2014, 22, 156–161. (In Chinese) [Google Scholar]
  58. Zhong, J.T.; Zhang, X.Y.; Wang, Y.Q. Relatively weak meteorological feedback effect on PM2.5 mass change in Winter 2017/18 in the Beijing area: Observational evidence and machine-learning estimations. Sci. Total Environ. 2019, 664, 140–147. [Google Scholar] [CrossRef] [PubMed]
  59. Zhang, Q.; Ma, Q.; Zhao, B.; Liu, X.; Wang, Y.; Jia, B.; Zhang, X. Winter haze over North China Plain from 2009 to 2016: Influence of emission and meteorology. Environ. Pollut. 2018, 242, 1308–1318. [Google Scholar] [CrossRef]
  60. Li, Y.; Xue, Y.; Guang, J.; Gerrit, D.L.; Richard, S.; She, L.; Fan, C.; Xie, Y.Q.; Chen, G.L. Spatial and temporal distribution characteristics of haze days and associated factors in China from 1973 to 2017. Atmos. Environ. 2019, 214, 1–14. [Google Scholar] [CrossRef]
  61. Xu, F.; Zheng, Y.Y.; Xiao, H.; Mu, X.Y. Mesoscale Characteristics of a Severe Hail Event over the Area along Yangtze River in Jiangsu. Meteorol. Mon. 2016, 42, 567–577. (In Chinese) [Google Scholar]
  62. Feng, W.Y.; Wang, M.H.; Zhang, Y.; Dai, X.L.; Liu, X.H.; Xu, Y.Y. Intraseasonal variation and future projection of atmospheric diffusion conditions conductive to extreme haze formation over eastern China. Atmos. Ocean. Sci. Lett. 2020, 13, 346–355. [Google Scholar] [CrossRef] [Green Version]
  63. Sun, Y.; Zhang, B.; Yan, W.L.; Chen, Q.; Zhao, K. Analysis of a heavy haze event in Nanjing and its surrounding area. Plateau Meteorol. 2010, 29, 794–800. (In Chinese) [Google Scholar]
  64. Cheng, H.H.; Wen, B.; Wang, Y.B.; Xu, Y. Confidence analysis of NCEP/FNL FNL data on strong convective weather. Meteorol. Environ. Sci. 2018, 41, 1–10. [Google Scholar]
Figure 1. Location of the L-band radar stations in China.
Atmosphere 12 00481 g001
Figure 2. Locations of the air quality monitoring stations in Beijing.
Atmosphere 12 00481 g002
Figure 3. Observations of the temperature during the clean days (a) and polluted days (b).
Atmosphere 12 00481 g003
Figure 4. Correlation of the temperature between the observations and NCEP/FNL reanalysis data at (1) 850, (2) 900, (3) 925, (4) 950, and (5) 1000 hPa during the (a) clean days and (b) polluted days.
Atmosphere 12 00481 g004
Figure 5. Observations of the relative humidity during the clean days (a) and polluted days (b).
Atmosphere 12 00481 g005
Figure 6. Correlation of the relative humidity between the observations and the NCEP/FNL reanalysis data at (1) 850, (2) 900, (3) 925, (4) 950, and (5) 1000 hPa during the (a) clean days and (b) polluted days.
Atmosphere 12 00481 g006
Figure 7. Observations of the wind speed during the clean days (a) and polluted days (b).
Atmosphere 12 00481 g007
Figure 8. Correlation of the wind speed between the observations and the NCEP/FNL reanalysis data at (1) 850, (2) 900, (3) 925, (4) 950, and (5) 1000 hPa during the (a) clean days and (b) polluted days.
Atmosphere 12 00481 g008
Figure 9. Topographical cross-section of Beijing and surrounding areas along 116.5° E, as well as the temperature inversion frequencies of the observations and the NCEP/FNL reanalysis data during the clean days and polluted days.
Atmosphere 12 00481 g009
Figure 10. Distribution of the observed wind shears during the clean days (a) and polluted days (b), where the dashed line represents the probability distribution line during the clean days (red) and polluted days (blue).
Atmosphere 12 00481 g010
Table 1. Location of L-band radar station and numbers of clean days and polluted days in Beijing.
StationStation CodeLatitude (°)Longitude (°)Numbers of Clean Days (n)Numbers of Polluted Days (n)
Beijing5451139.80116.47632171
Table 2. Error metrics and equations used in this paper.
NumberError MetricsEquation
1BIAS BIAS = i = 1 n ( y i x i ) n
2RMSE RMSE = i = 1 n ( y i x i ) 2 n
3 C C C C = i = 1 n ( y i y ¯ ) ( x i x ¯ ) i = 1 n ( y i y ¯ ) 2   i = 1 n ( x i x ¯ ) 2
Table 3. Error metrics for the temperature in Beijing.
Type of DaysError MetricsLayer (hPa)
1000950925900850
clean daysBIAS −0.75−0.69−0.31−0.23−0.15
RMSE3.212.502.532.312.39
C C 0.900.940.940.950.95
polluted daysBIAS−0.81−0.70−0.50−0.47−0.45
RMSE 3.482.512.512.382.46
C C 0.840.920.930.930.92
Table 4. Error metrics for the relative humidity in Beijing.
Type of DaysError MetricsLayer (hPa)
1000950925900850
clean daysBIAS 0.742.452.983.623.91
RMSE12.512.413.513.413.8
C C 0.790.790.780.790.78
polluted daysBIAS−5.12−0.900.891.942.85
RMSE 20.6719.519.719.216.6
C C 0.670.710.720.710.75
Table 5. Error metrics for the wind speed in Beijing.
Type of DaysError MetricsLayer (hPa)
1000950925900850
clean daysBIAS 0.19−0.37−0.63−0.78−1.04
RMSE2.913.793.933.843.71
C C 0.570.590.590.620.69
polluted daysBIAS0.21−0.01−0.41−1.19−1.28
RMSE 2.603.893.854.023.83
C C 0.530.400.440.480.58
Table 6. Statistics for the temperature inversion (units: °C).
Type of DaysDataLayer (hPa)Accumulated Temperature Inversion in All Layers
950–1000925–950900–925850–900
clean daysOBS1.581.130.941.531.71
NCEP1.420.860.600.911.61
polluted daysOBS2.191.661.572.062.67
NCEP1.630.900.801.442.12
Table 7. Statistics for the wind shears between the observations and the NCEP/FNL reanalysis data during the clean days and polluted days (units: m/s).
Type of DaysDataLayer (hPa)
850–925925–1000
clean daysOBS5.555.85
NCEP4.475.69
polluted daysOBS5.185.21
NCEP4.284.81
Publisher’s Note: MDPI stays neutral with regard to jurisdictional claims in published maps and institutional affiliations.