Article

Responses of the Optical Properties and Distribution of Aerosols to the Summer Monsoon in the Main Climate Zones of China

1
Lanzhou Regional Climate Center, Lanzhou 730020, China
2
Meteorology Bureau of Gansu, Lanzhou 730020, China
3
Lanzhou Central Meteorological Observatory, Lanzhou 730020, China
*
Author to whom correspondence should be addressed.
Atmosphere 2021, 12(4), 482; https://doi.org/10.3390/atmos12040482
Submission received: 23 March 2021 / Revised: 7 April 2021 / Accepted: 9 April 2021 / Published: 11 April 2021
(This article belongs to the Special Issue Efficiency Evaluation in Atmospheric Environment)

Abstract

:
The influence of aerosols on climate varies greatly within different spatial zones. China has a very prominent summer monsoon climate and summer monsoon activity basically determines the climate distribution pattern. Consequently, we need to understand the aerosol optical properties and spatial distribution under the background of summer monsoon activity in China, which is the basis for further research on the impact of aerosols on the climate system. Based on Moderate Resolution Imaging Spectroradiometer (MODIS) and Modern-Era Retrospective Analysis for Research and Applications (MERRA-2) data, the spatial response of the high aerosol optical depth (AOD) region in China to the advance and retreat of summer monsoon was analyzed. The main types of aerosol and the contribution of each type of aerosol particles to the total AOD were discussed. The results showed that before the landing of summer monsoon, the high value areas of AOD were distributed in the eastern Sichuan Basin, Changsha, Wuhan and Pearl River Delta regions. With the northward advance of the monsoon, the high value areas moved to the transition region affected by the summer monsoon and the AOD in this region was highly sensitive to the summer monsoon. The main aerosol types were dust and sulfate in this region and the contribution to total AOD was 27% and 57%, respectively; before the monsoon onset, the contribution of dust to total AOD was 16%, and that of sulfate was 18%; after the monsoon onset, the contribution of dust decreased by half to 8%, while the contribution of sulfate aerosol increased to 20%.

1. Introduction

China is affected by the summer monsoon, which operates at different intensities and over different durations in different parts of the country. China’s climate can be divided into several climate zones: the summer monsoon zone in the southeast; the westerly dominated non-monsoon zone in the northwest; and the summer monsoon transition zone. The summer monsoon zone is mainly humid, while the non-monsoon zone is arid. The climate status of these two areas is relatively stable. The summer monsoon transition zone experiences the frequent intersection of cold-dry and warm-humid air masses. It also generates mesoscale weather processes, with the most vigorous climate activity [1,2]. The precipitation in the intersection zone responds sensitively to the summer monsoon activity and precipitation amounts are very uncertain (as shown in Figure 1). Slight changes in the summer monsoon may cause violent fluctuations in the climate of the region.
The aerosol loadings in this region display a sensitive and prominent response to summer monsoon activity. Many studies of dust aerosols in northwest China’s arid and semi-arid areas and pollution aerosols in southeast China have been conducted [3,4,5,6,7,8,9,10]. However, there have been few studies of the temporal and spatial characteristics of aerosol optical properties in the summer monsoon transition zone. Summer precipitation makes a crucial contribution to the total annual rainfall in the summer monsoon transition zone. Summer precipitation in the summer monsoon transition zone rapidly decreases from 900 mm at the southern edge of the region to 100 mm at the northern border, with an intense decreasing gradient of about 200 mm/100 km. Precipitation can reduce the aerosol concentration in the atmosphere; thus, water vapor can significantly change the optical properties of atmospheric aerosols. The summer monsoon transition zone has become the core area of aridification and desertification in China [11]. Therefore, it is essential to clarify the types and spatial characteristics of aerosols in this area.
The aerosol–cloud–radiation interaction is one of the most uncertain factors in the climate system, and has become a hot research topic [12,13,14,15,16,17,18,19]. The radiation characteristics of aerosols are related to various factors, such as particle shape, scale, vertical distribution characteristics, underlying surface reflectivity, and aerosol–cloud interaction. There is a lot of debate regarding the quantification of aerosol radiation characteristics (Intergovernmental Panel on Climate Change, 2007). Menon et al. [20] used global climate models to simulate the climate effects of black carbon aerosols in China and India. They found that direct radiative heating due to aerosols affects the physical quantities of aerosols in clouds. They speculated that the increase in absorptive aerosols in the atmosphere was the main reason for the drought in northern China and the floods in southern China. Zhang [21] analyzed the chemical composition of atmospheric aerosols in different cities in China and found that the Sichuan Basin and eastern China were mostly polluted by aerosols dominated by sulfate and organic carbon. Because aerosols have various effects on climate, their spatial distribution characteristics are the basis for studying their climate effects. It is therefore imperative to research the temporal and spatial evolution of various aerosol particles.
Aerosols can influence the amount of radiation received at the ground by interacting with the monsoon. According to the results of many forcing experiments, aerosols play a significant role in weakening the lower-level circulation [22,23]. East Asia is one of the primary source areas of global aerosols, but experiences a profound surface cooling effect caused by aerosols. The surface cooling reduces the sea–land temperature difference and weakens the East Asian summer monsoon circulation. Many studies have confirmed that the East Asian summer and winter monsoons are weakening [24]. The East Asian monsoon affects the multi-scale (i.e., seasonal, interannual, and interdecadal scales) variations of aerosol concentration and spatial distribution in China. This study investigated the response of aerosol optical depth (AOD) to the East Asian summer monsoon circulation in China’s different climate zones, and particularly its role in weakening the summer monsoon. The study also clarified the contribution of different types of aerosol particle to the AOD.

2. Data and Methods

2.1. The Second Modern-Era Retrospective Analysis for Research and Applications (MERRA-2) Data

The MERRA-2 data have been obtained by assimilating multi-decade meteorological and aerosol observations into the global climate data system. The simultaneous assimilation and integration of multiple sets of satellite data and ground-based Aerosol Robotic Network data has reduced false trends and numerical jumps related to changes in the meteorological observation system [25]. The MERRA-2 data have 576 longitudinal grid points and 361 latitude grid points, with a resolution of 0.625° × 0.5°, and its analytical aerosol field has a wide range of applications [26]. These fields can be used as the initial conditions for regional models and air-quality forecasts, and as tools for studying aerosol interactions with weather and climate. Monthly data were available for sulfate, black carbon, organic carbon, dust, and sea salt aerosol as well as the total AOD in China from 2008 to 2017.

2.2. Terra Satellite Data

Launched by a joint project of the United States, Japan, and Canada at the end of the 20th century, the Terra satellite was the first satellite carrying Moderate Resolution Imaging Spectroradiometer (MODIS) sensors. It can collect four factors: the Earth’s atmosphere, land, ocean, and solar energy balance at the same time. The Terra satellite moves at an altitude of more than 700 km along the Earth’s polar orbit. It passes through the equator at 10:30 am local time in the morning when the cloud cover on the ground is lowest; thus, it has the widest view of the Earth’s surface. Its orbit is almost perpendicular to the Earth’s direction of rotation, enabling it to form a complete image of the Earth. Scientists have been able to obtain a preliminary understanding of the causes and effects of global climate change from these images, leading to a better understanding of how the Earth’s climate and ecological environment work as a whole system. The data used in this study were the three-level daily product data MOD08 of MODIS-Terra from 2008 to 2017, with a spatial resolution of 1° × 1°.
MODIS and MERRA-2 tend to overestimate and underestimate AOD, respectively, in comparison with AERONET. MODIS AOD agrees better with AERONET than MERRA-2. MODIS showed higher efficiency in detecting extreme events than MERRA-2 [27]. However, MODIS has no aerosol classification data. In monsoon zone, MODIS AOD results are better, but there are great differences in different ecological regions and geographical locations; in non-monsoon zone, MODIS AOD results are significantly overestimated; in transition zone of Northeast Agricultural Ecology and southern forest ecology, MODIS results are underestimated [28,29,30].
To study the optical properties and distribution of aerosols in specific climate zones, we selected three study areas with flat underlying surfaces; one in each of the monsoon zone, transition zone, and non-monsoon zone (as shown in Figure 2). These areas were located along the monsoon direction: Jianghan Plain (29°–32° N, 111°–114° E), Dongzhi Loess Tableland (35°–37° N, 106°–108° E), and Badain Jaran Desert (39°–42° N, 99°–102° E).

3. Results

China is mainly affected by the summer monsoon over the ocean from the tropics and the Pacific subtropics. The summer monsoon from the ocean will bring a large amount of precipitation, and it is also the main source of precipitation in China, which affects the difference of precipitation between North and South [31].
In summer, the temperature on the continent is higher than that of the ocean, which is controlled by a huge thermal low pressure. The subtropical high is strong on the ocean, the atmospheric pressure gradient points from the ocean to the continent, and the air current is from the ocean to the continent. The movement of the subtropical high ridge in China is consistent with the movement of the summer monsoon and rain belt (as shown in Figure 3). In June, the ridge line of the subtropical high jumped northward by 20° N and stabilized between 20° N and 25° N. The precipitation belt was located in the lower reaches of the Yangtze River; In July, the ridge line of the subtropical high jumped northward again, and the rainfall belt shifted from the Yangtze River Basin to the Huanghuai Basin; in the beginning of August, the high-pressure ridge further crossed 30° N, and the rain belt also moved to North and Northeastern China. In early September, the high-pressure ridge began to jump back south, and the rain belt also moved from north to south. The activity of the summer monsoon is the main cause of the humid climate in the south and the dry climate in the north of China [32].

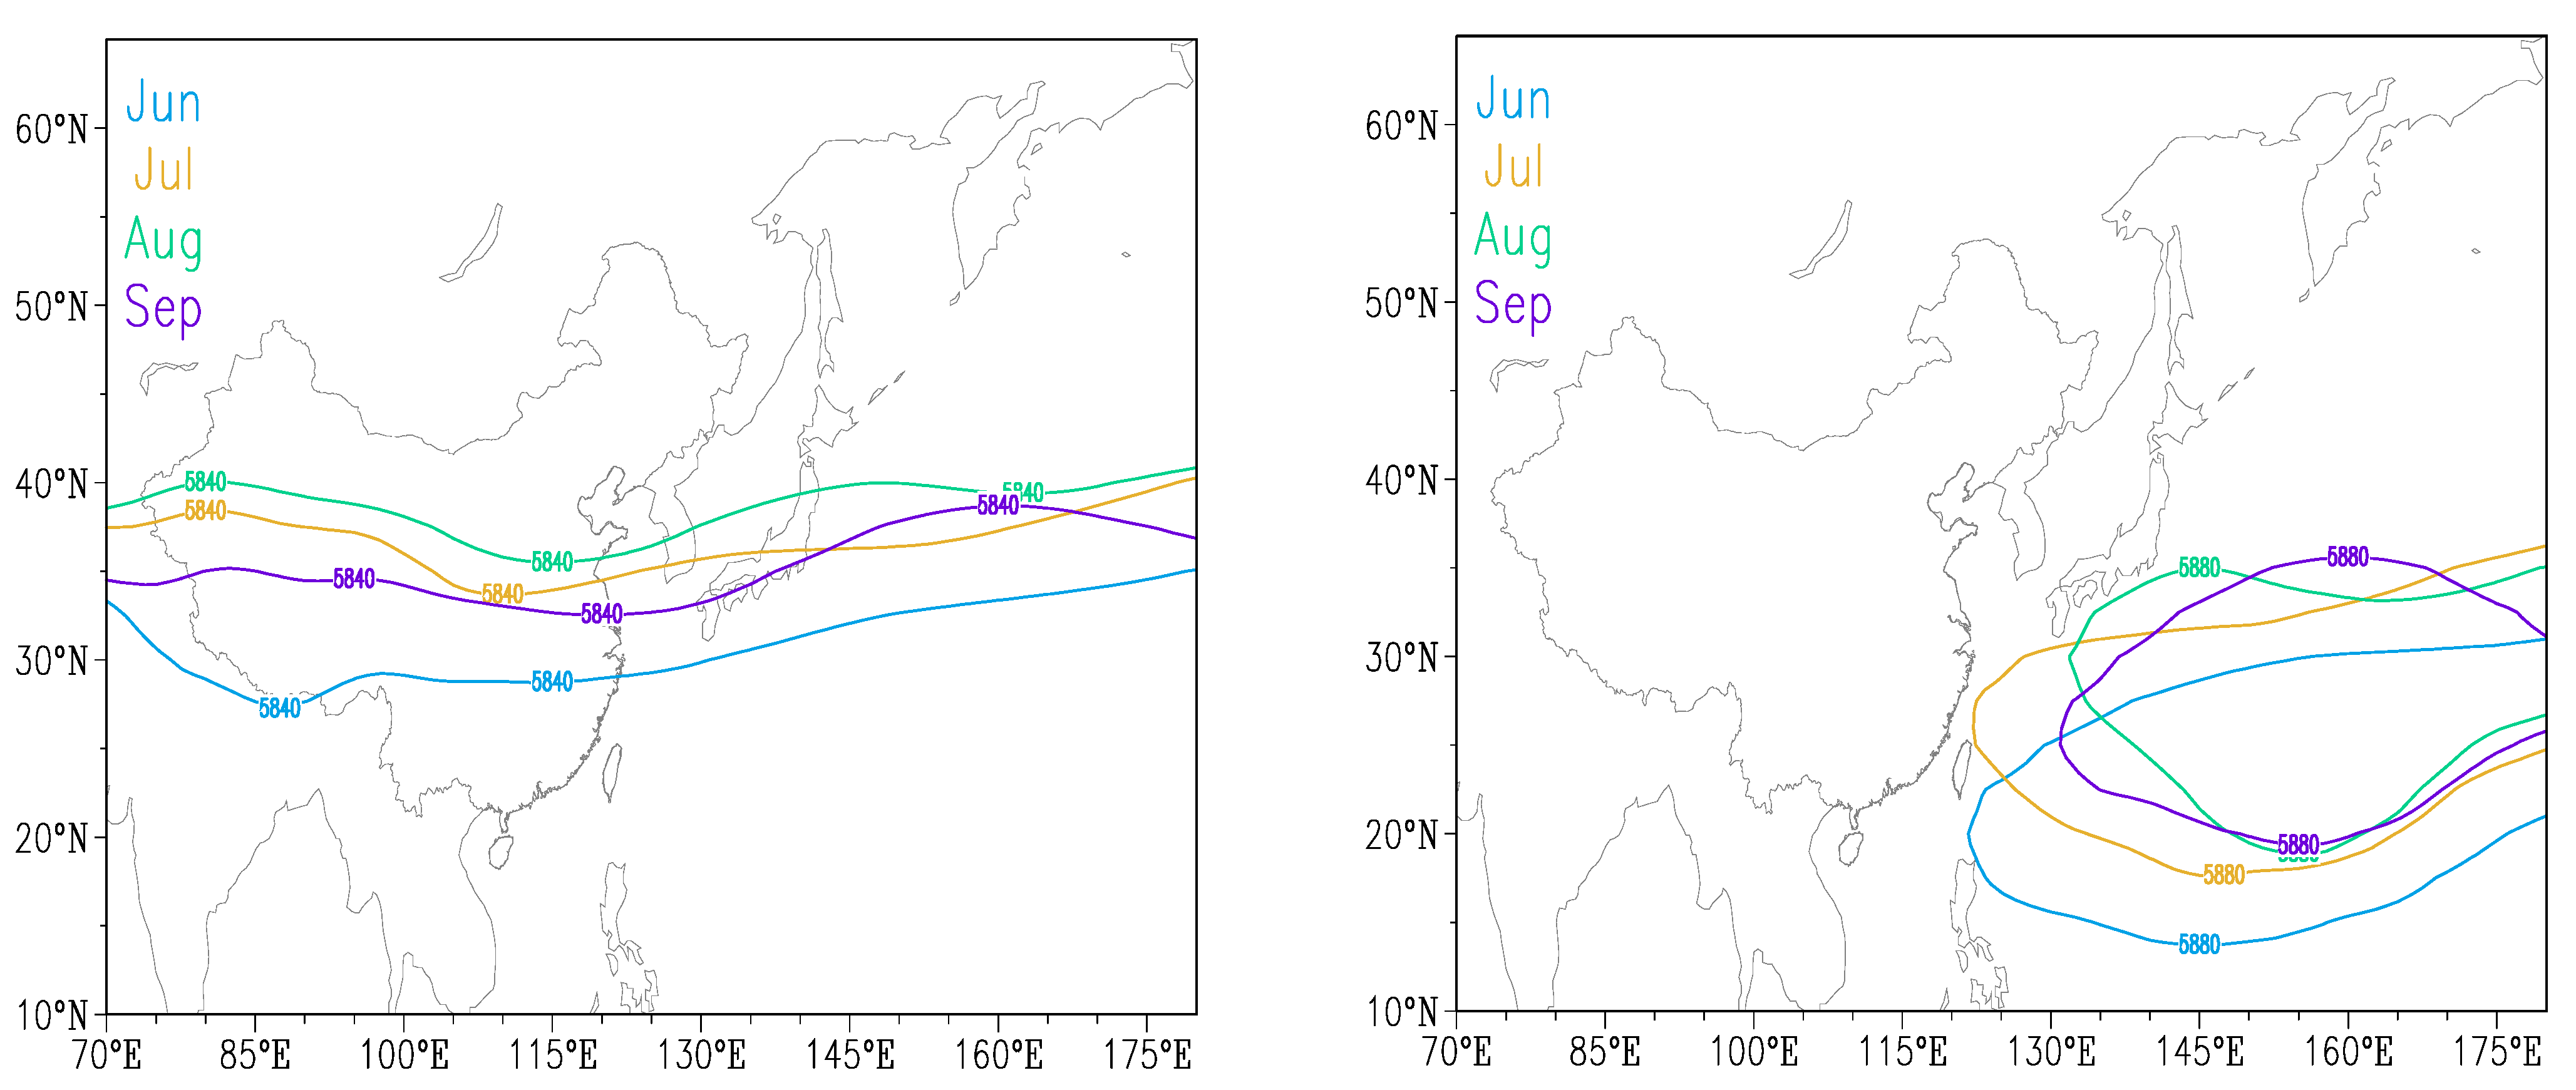
3.1. The Response of Aerosol Optical Depth (AOD) to the Advance and Retreat of the Summer Monsoon

Wang et al. [33] studied the temporal and spatial distribution characteristics of AOD in China over the past 15 years. They found that the AOD in eastern China is usually relatively high. The highest values of about 0.8 are mostly distributed in the Sichuan Basin and the border of Hubei and Hunan in central China. The other two high AOD centers are located in north China and the Pearl River Delta.
The spatial variation characteristics of the high-AOD area with monsoon activity are plotted in Figure 4. Before the East Asian summer monsoon, we found that there were high-AODs in the eastern Sichuan Basin, Changsha-Wuhan area, and Pearl River Delta. The Sichuan Basin has always been a high-AOD center in China due to its low altitude and high humidity. The area from Changsha to Wuhan is a more developed region, with a large population. It has many water systems and high humidity levels, which results in a considerable AOD. The Pearl River Delta region has a developed economy and experiences severe air pollution, resulting in an enormous local AOD. However, this region was found to be the area in which AOD was most sensitive to the response of the summer monsoon. At 850 hPa, the prevailing wind was a southern wind in both the abundant and deficient years. Atmospheric circulation transmitted the polluted particles from the south of China to the transition zone, where they accumulated (as shown in Figure 5). In a future study, we will simulate the trajectory of pollutants using a numerical model. After the monsoon landed, the AOD rapidly declined.
There was a high AOD in northern China during the monsoon, further confirming that pollutant particles in southern China moved to the summer monsoon transition zone as the monsoon advanced. The particle size of the pollutants increased through moisture absorption, which increased the AOD in this area. In addition to industry, agricultural activities in northern China, such as straw burning in summer, also increased the AOD. As the monsoon retreated to the south, the AOD in north China decreased, and the AOD in south China increased. Here, we only considered the monsoon as a factor affecting AOD, and not considered seasonal emissions or the wind pattern independent of precipitation. The changes in the AOD in the monsoon zone were the opposite of those in the summer monsoon transition zone. When the monsoon advanced northward, the AOD decreased in the monsoon zone, while it increased in the summer monsoon transition zone. When the monsoon retreated southward, the AOD increased in the monsoon zone, while it decreased in the summer monsoon transition zone. The high AOD in the south Xinjiang Basin in the non-monsoon zone was due to the low precipitation, large source of sand, and frequent dusty weather. The aerosol particles that affected the AOD of the area were mainly sand dust.

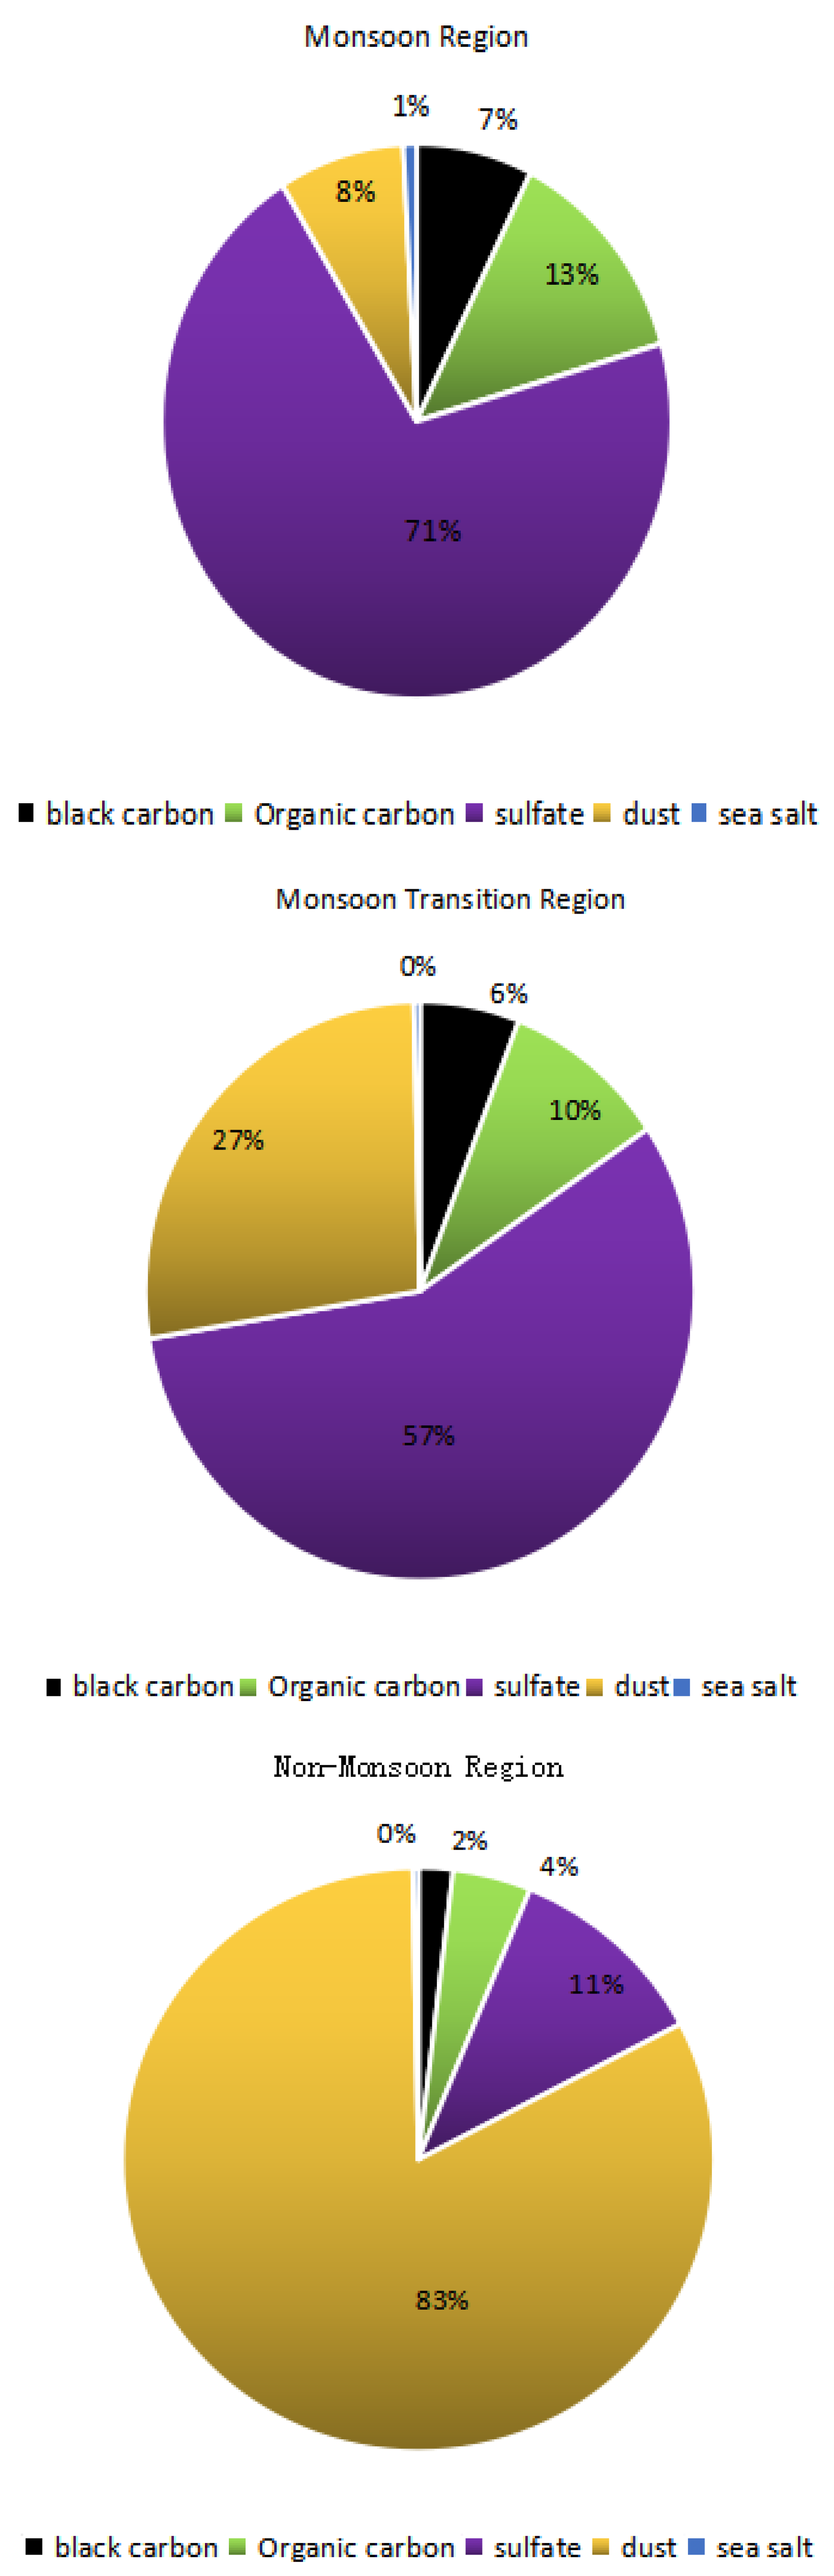
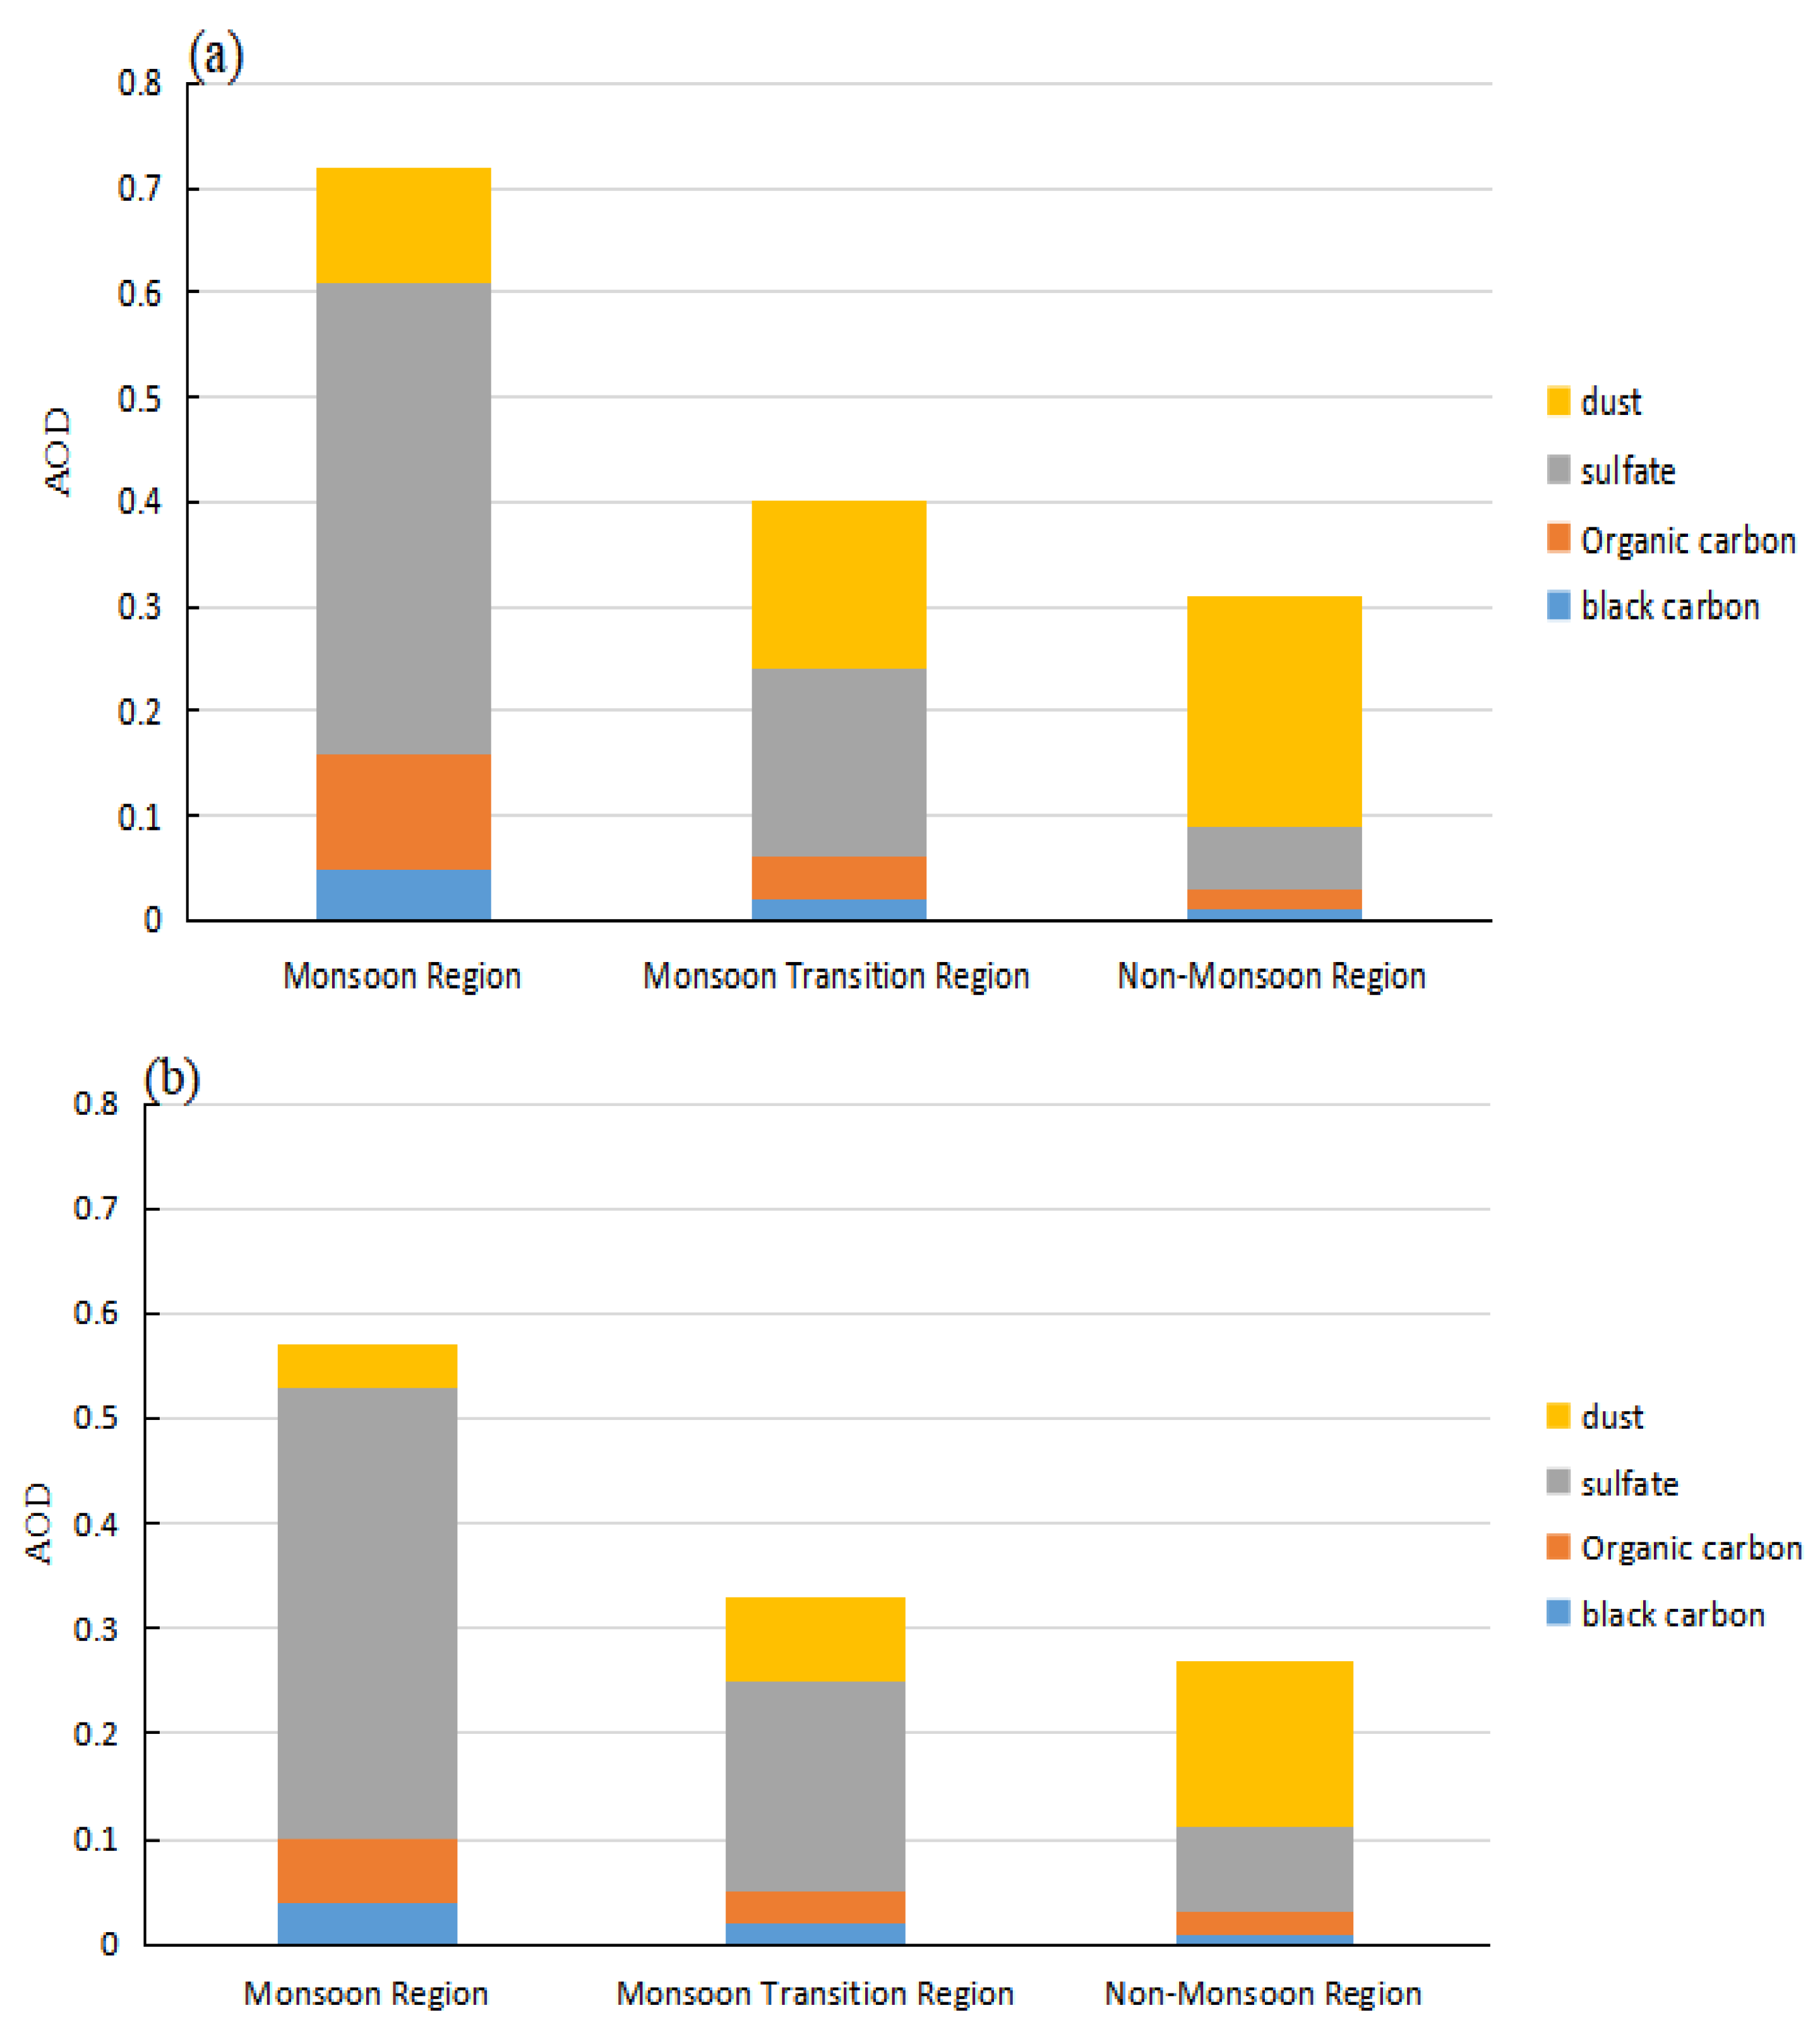
3.2. The Contribution of Different Aerosols to the AOD in the Main Climate Zones of China

Compared with ground solar photometer measurements, the MERRA-2 data is better for simulating the temporal and spatial trends of AOD. The MERRA-2 dataset is more strongly correlated with the AERONET observations than that of the Monitoring Atmospheric Composition and Climate reanalysis data provided by the European Centre for Medium-Range Weather Forecasts [34]. To understanding the dominant aerosol types in each typical zones, We therefore used sulfate, black carbon, organic carbon, sand-dust, and sea salt data from the MERRA-2 dataset and the contribution rate of AOD to total aerosol was calculated.
Figure 6 shows the contribution of the five aerosols to the total AOD in the three specific climate zones. In the summer monsoon zone, the aerosol was dominated by sulfate, which accounted for 71% of the AOD. Organic carbon accounted for 13% of the total AOD. The summer monsoon zone comprises the economically developed areas in eastern China, where the urbanization rate is significantly higher than in other parts of the country. The atmospheric pollutant SO2 is oxidized in the atmosphere to produce sulfate aerosol, and its presence in the atmosphere is strongly affected by human industrial activities. The concentration of sulfate aerosols in the atmosphere is affected by temperature and precipitation, and displays noticeable seasonal variations. The non-monsoon zone is arid, and the underlying surface is dominated by deserts, where aerosols are dominated by dust, which accounted for 83% of the AOD. The aerosol composition in this region was more stable than in the monsoon and transition zones. The climate in northwest China is warming and humidification is also occurring. Improvements in desertification control have been made. The contribution of dust to the AOD in the area will, therefore, decrease in the future.
The underlying surface of the arid transition zone contains sparse vegetation cover, including desert plants, natural grasslands, and shrubs. The aerosol in the area was dominated by sulfate and sand dust, accounting for 57% and 27% of the AOD, respectively. The monsoon influenced the aerosol in this area, with the proportion of dust and sulfate aerosols changing as the northern edge of the monsoon advanced and retreated. This area is considered to be an outpost of the summer monsoon system, and its response to summer monsoon activity was the most sensitive of the three regions studied. Thus, its precipitation was also the most significantly affected by summer monsoon activity. This region coincides with the “Hu Huanyong Line” that separates the country based on economic activity, social development, and population distribution. With the continuous strengthening of global warming, changes in the climate system have also occurred. The impact of global warming on China’s climate transition zone have been more significant than in other regions, resulting in a more complex interaction of climate events. The atmospheric aerosol is a mixture of various sources in this region, and it was difficult to identify the temporal and spatial evolution of different aerosol particles. It is essential to understand how the aerosol optical properties in the summer monsoon transition zone respond to the summer monsoon’s temporal and spatial distribution characteristics.
The East Asian summer monsoon activity is the critical factor that has led to the essential climate characteristics of a “wet south and dry north” in China. The East Asian summer monsoon can also lead to prominent upheavals. The annual advance and retreat of the summer monsoon causes the seasonal variation of droughts and floods in China. The summer monsoon usually lasts for about five months every year (onset in mid-May and then advances to the northwest before retreating to the southeast in early and mid-October). Its impact weakens from the southeast to the northwest.
The contribution of sea salt aerosols to the total AOD in the study area was negligible. Figure 7 shows the regional average AOD of sand dust, sulfate, organic carbon, and black carbon in the different stages of monsoon development in the specific climate zones. In the summer monsoon zone, the sulfate aerosol contribution remained constant during the three stages of monsoon evolution. It made the most considerable contribution to the total AOD of 45%, 52%, and 43% before, during, and after the monsoon, respectively. After the onset of the monsoon, the contribution of dust aerosols decreased by 64%, which was due to the wet deposition of particles. The large precipitation amounts as a result of the northward advancement of the summer monsoon removed the larger dust particles from the atmosphere, which reduced the AOD of dust aerosols. The contribution of organic carbon to the total AOD also decreased during the monsoon.
Although the monsoon advances to the north and south, it hardly affects the non-monsoon zone, where the contributions of various aerosol particles to the total AOD varied little. The contributions of sulfate and organic carbon remained at 8% and 2%, while sand dust contributed about 20%. Sand dust dominated the different stages of monsoon development. Before the onset of the monsoon, the contribution of sand and dust to the total AOD was 16% in the summer monsoon transition zone, while the contribution of sulfate was 18%. Once the monsoon began, the summer monsoon precipitation and circulation affected aerosol transport and caused a lower AOD. The sedimentation of the medium-sized and large sand dust particles was noticeable, and the contribution of sand dust was significantly reduced to 8%.
This phenomenon did not occur in the monsoon and non-monsoon zones. The contribution of various aerosol particle types to the total AOD did not vary, indicating that dust aerosols were the most sensitive particles to the summer monsoon in the summer monsoon transition zone. The strength of the summer monsoon directly determined the amount of sand dust in the summer monsoon transition zone.
The contribution of sulfate to the total AOD at this time increased to 20% due to the increase in particle size. As a hygroscopic aerosol, sulfate adsorbs the water vapor brought by the summer monsoon. The contribution of organic carbon remained at about 4% during the different stages of monsoon development. The contribution of black carbon in the three regions was relatively stable and did not respond sensitively to the monsoon. The contribution of black carbon aerosols to the total AOD was largest in the summer monsoon zone, followed by the transition zone, while it was smallest in the non-monsoon area.

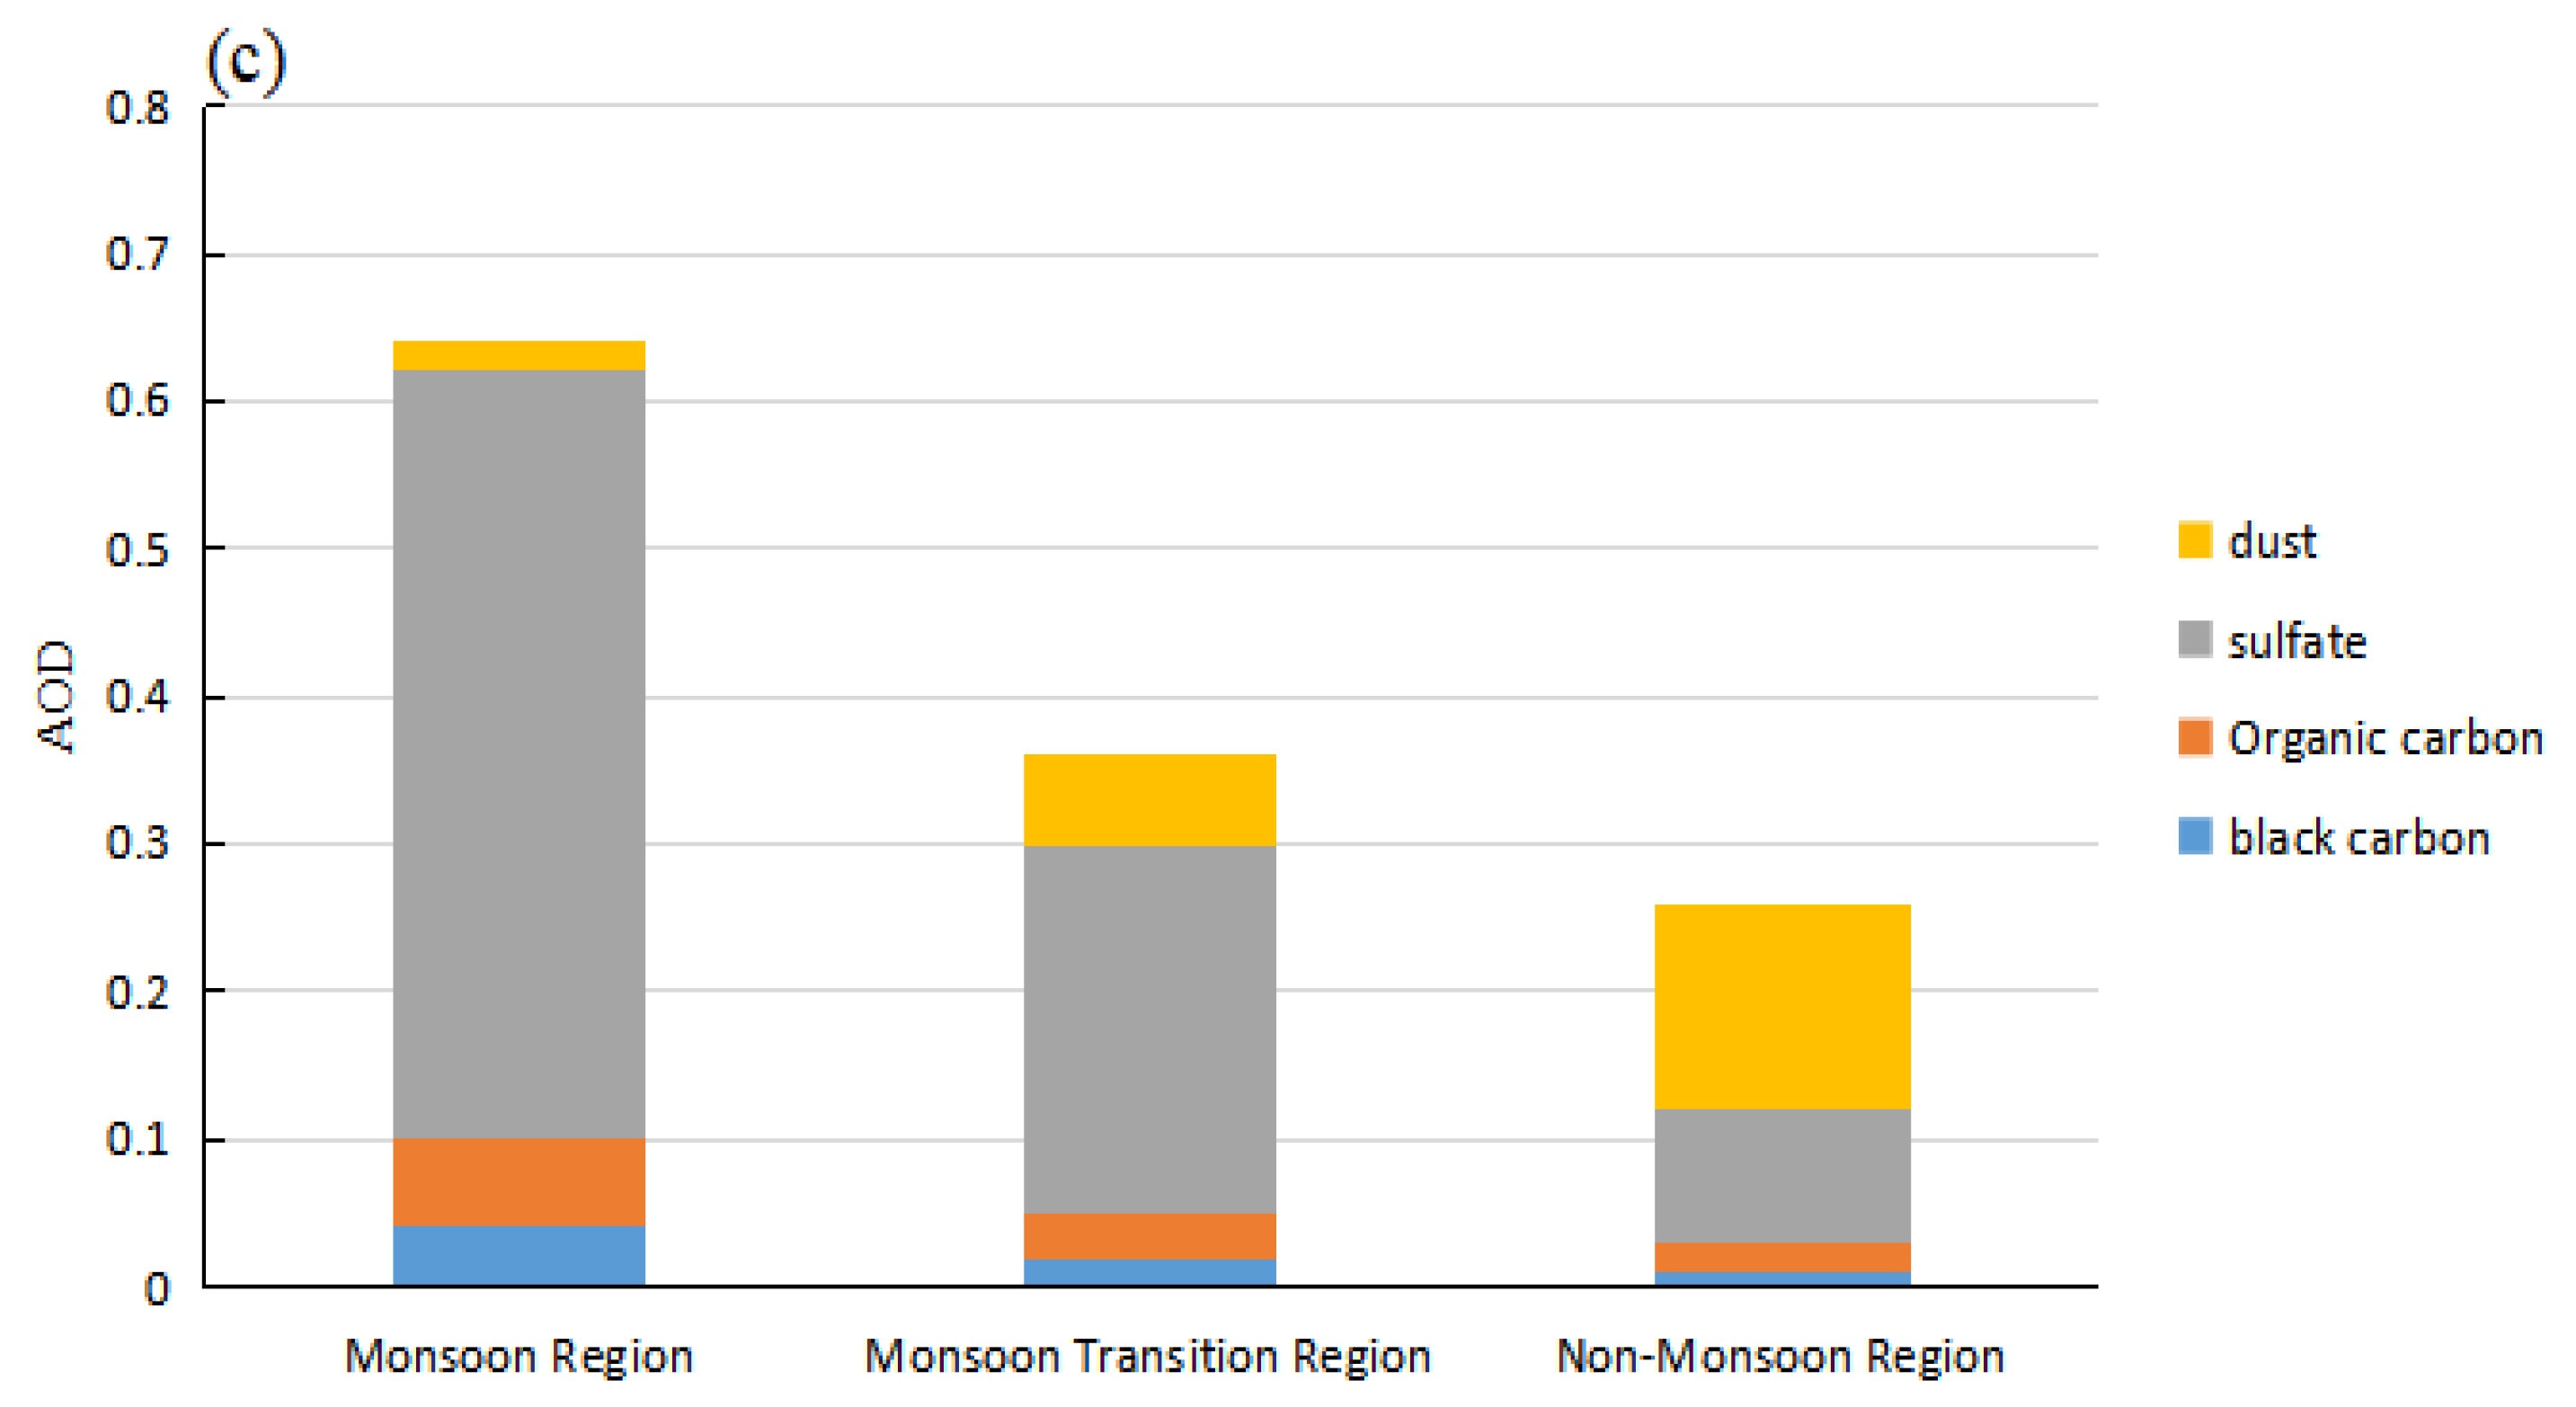
3.3. The Evolution of AOD in the Main Climate Zones of China

The monthly variation of the five aerosols and total AOD in each climate zone are shown in Figure 8.
The trend of the monthly changes in the AOD of sand dust remained stable over the study period. The highest values of sand dust AOD in the three climate zones occurred in spring, indicating that the natural sources of aerosols in the three climate zones were mainly affected by the underlying surface type. The AOD of black carbon, organic carbon, and sulfate displayed the same patterns. The AOD was highest in the summer monsoon zone, followed by the transition and non-monsoon zones. The AOD variation for black carbon and sulfate displayed no seasonal characteristics. The AOD of organic carbon in the summer monsoon transition zone and the monsoon zone remained stable through the entire year, although in the monsoon there was a significant increase in winter followed by a decrease. In the summer monsoon zone, the AOD of anthropogenic particles was considerably higher than that of dust aerosol, while sulfate had the largest AOD. Sulfate particles absorb moisture and are enlarged when water vapor is abundant in the atmosphere, which caused an increase in the contribution of sulfate to the total AOD.
The total AOD was highest in the summer monsoon zone, followed by the transition and non-monsoon areas. The large number of anthropogenic aerosols generated by the activities of the summer monsoon zones extensive population has become a hot topic in aerosol research under the background of the apparent reduction in China’s dust weather conditions. Also, because the transition area is most sensitive to the summer monsoon, air pollution prevention and control appear to be particularly important. It is necessary to reduce emissions from their source, strengthen pollution control, and use practical actions to achieve the goal of “carbon neutrality.”

4. Conclusions

The monsoon can change the transmission, precipitation, and chemical reactions of atmospheric aerosols and affect the concentration and distribution of aerosol particles. This study used satellite remote sensing and reanalysis data to analyze the spatial variability of AODs with the advance and retreat of the summer monsoon in China and clarified the main types of aerosols and their contribution to the total AOD.
Before the onset of the summer monsoon, there were high AODs in the eastern Sichuan Basin, Changsha-Wuhan area, and Pearl River Delta. During the monsoon, as the monsoon advanced northward, polluted aerosols (especially sulfate aerosols, which remain in the atmosphere for a long time and have a wide transmission range) moved to the summer monsoon transition zone.
The size of the hygroscopic particles increased as they absorbed moisture, which increased the AOD in the area. As the monsoon retreated south, the AOD in north China decreased and the AOD in south China increased. Sulfate was the dominant aerosol (accounting for 71% of the total AOD) in the summer monsoon zone. The contribution of sulfate to the total AOD was 45%, 43%, and 52% before the monsoon, during the monsoon, and after the monsoon, respectively. Sulfate and sand dust dominated the aerosol in the summer monsoon transition zone, accounting for 57% and 27% of the total AOD, respectively. Before the monsoon, the contribution of sulfate and sand dust to the total AOD was 16% and 18%, respectively. After the monsoon, the contribution of sand and dust was reduced by half to 8%, indicating that dust particles were the most sensitive type of aerosol to the summer monsoon. At the same time, the contribution of sulfate aerosols increased slightly to 20% due to moisture absorption.
In the non-monsoon zone, sand and dust accounted for 83% of the total AOD, and the contribution of sand dust always dominated. The highest AOD of sand dust in the three climate zones always occurred in spring. The AOD of anthropogenic particles in the monsoon area was significantly higher than that in the transition and non-monsoon zones. Sulfate was responsible for the largest AOD. The aerosol composition in the monsoon and non-monsoon zones was stable, and the aerosol types in the summer monsoon transition zone were greatly affected by the summer monsoon. The strength and speed of the monsoon directly affected the aerosol mixture in the region. More attention should be given to aerosol research in this sensitive area because aerosols pose a particular threat to human health. Research on aerosol radiative forcing and climate response is fundamental, and the summer monsoon transition zone, with its significantly variable land surface characteristics, is sensitively responding to climate change. The summer monsoon transition zone is where the climate changes from humid to arid. It is also the ecological transition zone from the southeast broad-leaved deciduous forest area to the northwest desert steppe area. There are more extreme weather events in this region than in the monsoon and non-monsoon zones.
The results of this study will enable a better understanding of the relationship between regional aerosols and the summer monsoon, and provide support to regional numerical models and early warnings of severe weather and climate events. Further studies should also be conducted in this area and should consider the influence of monsoon intensity.

Author Contributions

Q.Z. provided the study concept and interpretation of results; B.B. and D.T. carried out the data analysis; P.H. and F.Y. reviewed the manuscript. All authors have read and agreed to the published version of the manuscript.

Funding

This research was funded by the Natural Science Foundation of China under grant no. 41630426.

Institutional Review Board Statement

Not applicable.

Informed Consent Statement

Not applicable.

Data Availability Statement

This study did not report any data.

Acknowledgments

We thank the NASA Langley Research Center and Global Modeling and Assimilation Office for the MODIS and MERRA-2 data. We also thank International Science Editing (http://www.internationalscienceediting.com, accessed on 10 April 2021) for editing this manuscript.

Conflicts of Interest

The authors declare no conflict of interest.

References

  1. Qiang, Z.; Ping, Y.; Liang, Z.; Sheng, W.; Jie, Z.; Jianhua, Z.; Runyuan, W.; Fulin, Y. Land-Atmosphere Interaction over the Summer Monsoon Transition Zone in China: A Review and Prospects. Acta Meteorol. Sin. 2019, 77, 758–773. [Google Scholar]
  2. Zhang, Q.; Zhang, J.; Qiao, J.; Sheng, W. Relationship of Atmospheric Boundary Layer Depth with Thermodynamic Processes at the Land Surface in Arid Regions of China. Sci. China Earth Sci. 2011. [Google Scholar] [CrossRef]
  3. Huang, Z.; Huang, J.; Bi, J.; Wang, G.; Wang, W.; Fu, Q.; Si-Chee, Z.L.; Jinsen, T. Dust. Aerosol Vertical Structure Measurements Using Three MPL Lidars during 2008 China-U.S. joint dust field experiment. J. Geophys. Res. Atmos. 2010, 115, 1–12. [Google Scholar]
  4. Jianbo, R.; Tianhe, W.; Jiming, L.; Ying, H.; Beidou, Z. Characteristics of Dust Aerosol in both Clear-sky and Above-cloud Conditions over East Asia. J. Desert Res. 2018, 38, 372–383. [Google Scholar]
  5. Tijian, W.; Jinzhong, M.; Zhaobo, S.; Zongkai, L.; Longshan, J. Characteristics of Sulphate Aerosol Distribution in China. Clim. Environ. Res. 2000, 5, 165–174. [Google Scholar]
  6. Ying, W.; Xinyong, S.; Yong, W.; Zhenming, J.; Zhou, W. Simulation of Direct Radiation Forcing of Anthropogenic Aerosols and its Climate Effects over Eastern Asia. J. Meteorol. Sci. 2012, 32, 515–525. [Google Scholar]
  7. Zhili, W. Simulation of Radiative Forcing of Typical Aerosols and Their Effects on Climate; Chinese Academy of Meteorological Sciences: Beijing, China, 2011. [Google Scholar]
  8. Jian, Z.; Qiang, Z.; Chunling, W. Spatial-Temporal Pattern of Surface Energy Fluxes over the East Asian Summer Monsoon Edge Area in China and its Relationship with Climate. J. Meteorol. Res. 2016, 74, 876–888. [Google Scholar]
  9. Gaoying, Z.; Sixiong, Z.; Jianhua, S. Analysis of Climatological Characteristics of Severe Dust Storms in Recent Years in the Northern China. Clim. Environ. Res. 2004, 9, 101–115. (In Chinese) [Google Scholar]
  10. Hongli, Z.; Qiang, Z.; Xiaoyun, L. Study on the Main Factors of Aridity in Hetao Area of North China. Clim. Chang. Res. 2016, 12, 20–27. [Google Scholar]
  11. Qiang, Z.; Hongli, Z.; Liang, Z.; Ping, Y. Study on Summer Monsoon Transition Zone and Its Land-Air Interaction. Adv. Earth Sci. 2017, 32, 1009–1019. [Google Scholar]
  12. Xiujin, Z.; Guoxiong, W. Research on the Development Strategy of China’s Meteorological Cause; Meteorological Press: Beijing, China, 2004. [Google Scholar]
  13. Adams, A.; Prospero, J.; Zhang, C. CALIPSO-Dericed Three-Dimensional Structure of Aerosol over the Atlantic Basin and Adjacent Continents. J. Clim. 2012, 25, 6862–6879. [Google Scholar] [CrossRef]
  14. Berjamin, S.; Seaman, O. Simple Scheme for Objective in Curved Flow. Mon. Weather Rev. 1985, 113, 1184–1198. [Google Scholar] [CrossRef] [Green Version]
  15. Bi, J.; Shi, J.; Xie, Y.; Liu, Y.; Takamura, T.; Khatri, P. Dust Aerosol Characteristics and Shortwave Radiative Impact at a Gobi Desert of Northwest China During the Spring of 2012. Meteor. Soc. Jpn. 2014, 92, 33–56. [Google Scholar] [CrossRef] [Green Version]
  16. Bollasina, M.; Ming, Y.; Ramaswamy, V. Anthropogenic Aerosols and the Weakening of the South Asian Summer Monsoon. Science 2011, 334, 502–505. [Google Scholar] [CrossRef] [PubMed] [Green Version]
  17. Bowyer, T.W.; Kephart, R.; Eslinger, P.W.; Friese, J.I.; Miley, H.S.; Saey, P.R.J. Maximum Reasonable Radioxenon Releases from Medical Isotope Production Facilities and Their Effect on Monitoring Nuclear Explosions. J. Environ. Radioact. 2013, 115, 192–200. [Google Scholar] [CrossRef] [PubMed]
  18. Charney, J. Dynamics of Deserts and Drought in the Sahel. Q. J. R. Meteorol. Soc. 1975, 101, 193–202. [Google Scholar] [CrossRef]
  19. Che, H.; Xia, X.; Zhu, J.; Li, Z.; Dubovik, O.; Holben, B.; Goloub, P.; Chen, H.; Estelles, V.; Cuevas-Agulló, E. Column Aerosol Optical Properties and Aerosol Radiative Forcing during a Serious Haze-Fog Month Over North China Plain in 2013 Based on Ground-Based Sunphotometer Measurements. Atmos. Chem. Phys. 2014, 14, 2125–2138. [Google Scholar] [CrossRef] [Green Version]
  20. Menon, S.; Hansen, J.; Nazarenko, L.; Luo, Y. Climate Effects of Black Carbon Aerosols in China and India. Science 2002, 297, 2250–2253. [Google Scholar] [CrossRef] [PubMed] [Green Version]
  21. Zhu, J.; Liao, H.; Li, J. Increases in Aerosol Concentrations Over Eastern China due to the Decadal-Scale Weakening of the East Asian Summer Monsoon. Geophys. Res. Lett. 2012, 39, 9809–9814. [Google Scholar] [CrossRef] [Green Version]
  22. Zhang, L.; Liao, H.; Li, J. Impacts of Asian Summer Monsoon on Seasonal and Inter Annual Variations of Aerosols Over Eastern China. J. Geophys. Res. 2010, 115, D00K05. [Google Scholar] [CrossRef] [Green Version]
  23. Wu, G.X.; Li, Z.Q.; Fu, C.B.; Zhang, X.Y.; Zhang, R.Y.; Zhang, R.H.; Zhou, T.J.; Li, J.P.; Li, J.D.; Zhou, D.G.; et al. Advances in Studying Interactions Between Aerosols and Monsoon in China. Sci. China Earth Sci. 2016, 59, 1–16. [Google Scholar] [CrossRef]
  24. Xiaoye, Z. Aerosol over China and Their Climate Effect. Adv. Earth Sci. 2007, 22, 12–16. [Google Scholar]
  25. Holben, B.; Eck, T.; Slutsker, I.; Tanré, D.; Buis, J.P.; Setzer, A.; Vermote, E.; Reagan, J.A.; Kaufman, Y.J.; Nakajima, T. Aeronet-A Federated Instrument Network and Data Archive for Aerosol Characterization. Remote Sens. Environ. 2012, 66, 1–16. [Google Scholar] [CrossRef]
  26. Bocquet, M.; Elbern, H.; Eskes, H.; Hirtl, M.; Zabkar, R.; Carmichael, G.R.; Flemming, J.; Inness, A.; Pagowski, M.; Perez Camano, J.L.; et al. Data Assimilation in Atmospheric Chemistry Models: Current Status and Future Prospects for Coupled Chemistry Meteorology Models. Atmos. Chem. Phys. 2015, 15, 5325–5358. [Google Scholar] [CrossRef] [Green Version]
  27. Aldabash, M.; Balcik, F.; Glantz, P. Validation of MODIS C6.1 and MERRA-2 AOD Using AERONET Observations: A Comparative Study over Turkey. Atmosphere 2020, 11, 905. [Google Scholar] [CrossRef]
  28. Lili, W. Evaluation of MODIS Aerosol Products Applicability in China; Institute of Atmospheric Physics, Chinese Academy of Sciences: Beijing, China, 2007. [Google Scholar]
  29. Ichoku, C.; Chu, D.A.; Mattoo, S.; Yoram, J.; Kaufman Lorraine, A.; Remer, D.; Tanré, I.; Slutsker, B.N.; Holben, A. Spatio-Temporal Approach for Global Validation and Analysis of MODIS Aerosol Products. Geophys. Res. Lett. 2002, 29, MOD1-1–MOD1-4. [Google Scholar] [CrossRef] [Green Version]
  30. Chu, D.A.; Kaufman, Y.J.; Ichoku, C.; Mattoo, S. Validation of MODIS Aerosol Optical Depth Retrieval Over Land. Geophys. Res. Lett. 2002, 29, 1617–1621. [Google Scholar] [CrossRef] [Green Version]
  31. Zhang, Q.; Yue, P.; Zhang, L.; Wang, S.; Zhang, J.; Zhao, J.; Wang, R.; Yang, F. Land-atmosphere interaction over the summer monsoon transition zone in China: A review and prospects. Acta Meteorol. Sin. 2019, 77, 758–773. [Google Scholar]
  32. Jinhai, H.; Pinwen, G.; Yan, Y.; Shuanghe, S. Introduction to Atmospheric Science. China Meteorological Press: Beijing, China, 2012. [Google Scholar]
  33. Yin-pai, W.; Xin, Y.; Xie, G.-Q. Spatial Distribution and Temporal Variation of Aerosol Optical Depth over China in the Past 15years. China Environ. Sci. 2018, 38, 426–434. [Google Scholar]
  34. Mukkavilli, S.K.; Prasad, A.A.; Taylor, R.A.; Huang, J.; Mitchell, R.M.; Troccoli, A.; Kay, M.J. Assessment of Atmospheric Aerosols from Two Reanalysis Products Overaustralia. Atmos. Res. 2019, 215, 149–164. [Google Scholar] [CrossRef] [Green Version]
Figure 1. Location of the summer monsoon transition zone (shaded area), which is affected by the summer monsoon in China.
Atmosphere 12 00482 g001
Figure 2. Topographic map of the three climate areas considered in this study (Jianghan Plain, Dongzhi Loess Tableland, and Badain Jaran Desert).
Atmosphere 12 00482 g002
Figure 3. Subtropical high and its periphery activity range (June–September).
Atmosphere 12 00482 g003
Figure 4. The monthly distribution of average aerosol optical depth (AOD, Moderate Resolution Imaging Spectroradiometer (MODIS) from March to October (ah). The red line is the boundary of the summer monsoon transition zone.
Atmosphere 12 00482 g004aAtmosphere 12 00482 g004b
Figure 5. The summer wind regime from the European Centre for Medium-Range Weather Forecasts (ECMWF) at 850 hPa over the East Asian summer monsoon (EASM) transition zone in abundant and deficient monsoon years (Left: abundant monsoon year; Right: deficient monsoon year).
Atmosphere 12 00482 g005
Figure 6. The contribution of different aerosols to the total AOD (Modern-Era Retrospective Analysis for Research and Applications (MERRA-2)) in typical climate zones.
Atmosphere 12 00482 g006
Figure 7. Average regional AOD (MERRA-2) for primary aerosols in the three main climate zones of China (a) before the onset of the monsoon (February–March), (b) during the monsoon (June–July), and (c) after the monsoon retreats (October–November)).
Atmosphere 12 00482 g007aAtmosphere 12 00482 g007b
Figure 8. The monthly AOD (MERRA-2) variation from 2008 to 2017. (a) sand dust, (b) black carbon, (c) organic carbon, (d) sulfate, and (e) total aerosol. Different colors represent different climate zones.
Atmosphere 12 00482 g008aAtmosphere 12 00482 g008b
Publisher’s Note: MDPI stays neutral with regard to jurisdictional claims in published maps and institutional affiliations.

