Article

Recent Changes in the Low-Level Jet along the Subtropical West Coast of South America

by
Catalina Aguirre
1,2,3,4,*,
Valentina Flores-Aqueveque
5,6,
Pablo Vilches
2,
Alicia Vásquez
5,6,
José A. Rutllant
3,7,8 and
René Garreaud
1,8
1
Center for Climate and Resilience Research (CR)2, Santiago 8320000, Chile
2
Escuela de Ingeniería Civil Oceánica, Facultad de Ingeniería, Universidad de Valparaíso, Valparaíso 2340000, Chile
3
Millennium Nucleus Understanding Past Coastal Upwelling Systems and Environmental Local and Lasting Impacts (UPWELL), Agencia Nacional de Investigación y Desarrollo (ANID) Millennium Science Initiative, Coquimbo 1780000, Chile
4
Centro de Observación Marino Para Estudios de Riesgos del Ambiente Costero, COSTAR, Valparaíso 2340000, Chile
5
Departamento de Geología, Facultad de Ciencias Físicas y Matemáticas, Universidad de Chile, Santiago 8320000, Chile
6
Millennium Nucleus Paleoclimate, Agencia Nacional de Investigación y Desarrollo (ANID) Millennium Science Initiative, Ñuñoa 7750000, Chile
7
Centro de Estudios Avanzados en Zonas Áridas (CEAZA), Coquimbo 1780000, Chile
8
Departamento de Geofísica, Facultad de Ciencias Físicas y Matemáticas, Universidad de Chile, Santiago 8320000, Chile
*
Author to whom correspondence should be addressed.
Atmosphere 2021, 12(4), 465; https://doi.org/10.3390/atmos12040465
Submission received: 20 February 2021 / Revised: 26 March 2021 / Accepted: 1 April 2021 / Published: 8 April 2021
(This article belongs to the Special Issue Characteristics of Coastal Low Level Wind Jet)

Abstract

:
Surface winds along the subtropical west coast of South America are characterized by the quasi-weekly occurrences of low-level jet events. These short lived but intense wind events impact the coastal ocean environment. Hence, identifying long-term trends in the coastal low-level jet (CLLJ) is essential for understanding changes in marine ecosystems. Here we use ERA5 reanalysis (1979–2019) and an objective algorithm to track anticyclones to investigate recent changes in CLLJ events off central Chile (25–43 °S). Results present evidence that the number of days with intense wind (≥10 ms−1), and the number and duration of CLLJ events have significantly changed off central Chile in recent decades. There is an increase in the number of CLLJ events in the whole study area during winter (June-July-August; JJA), while during summer (December–January–February; DJF) a decrease is observed at lower latitudes (29–34 °S), and an increase is found at the southern boundary of the Humboldt system. We suggest that changes in the central pressures and frequency of extratropical, migratory anticyclones that reach the coast of South America, which force CLLJs, have played an important role in the recent CLLJ changes observed in this region.

1. Introduction

Low-level winds along the west coast of subtropical South America are strongly influenced by the Southeast Pacific Anticyclone (SPA), a quasi-stationary atmospheric high-pressure cell that drives equatorward winds off Perú and Chile (Figure 1). In this vast region the seasonal cycle of these low-level winds differs between its northern and southern portions, mainly driven by the latitudinal migration of the SPA through the year. During austral winter (JJA) the SPA moves northward, producing mean westerly winds in south-central Chile (35–42 °S). During austral summer (DJF) the SPA moves southward, producing mean equatorward alongshore winds as far south as 42 °S [1,2]. Off northern Chile (18–28 °S) southerly winds prevail through the year, but they are rather weak and stable, with low synoptic and seasonal variability [3].
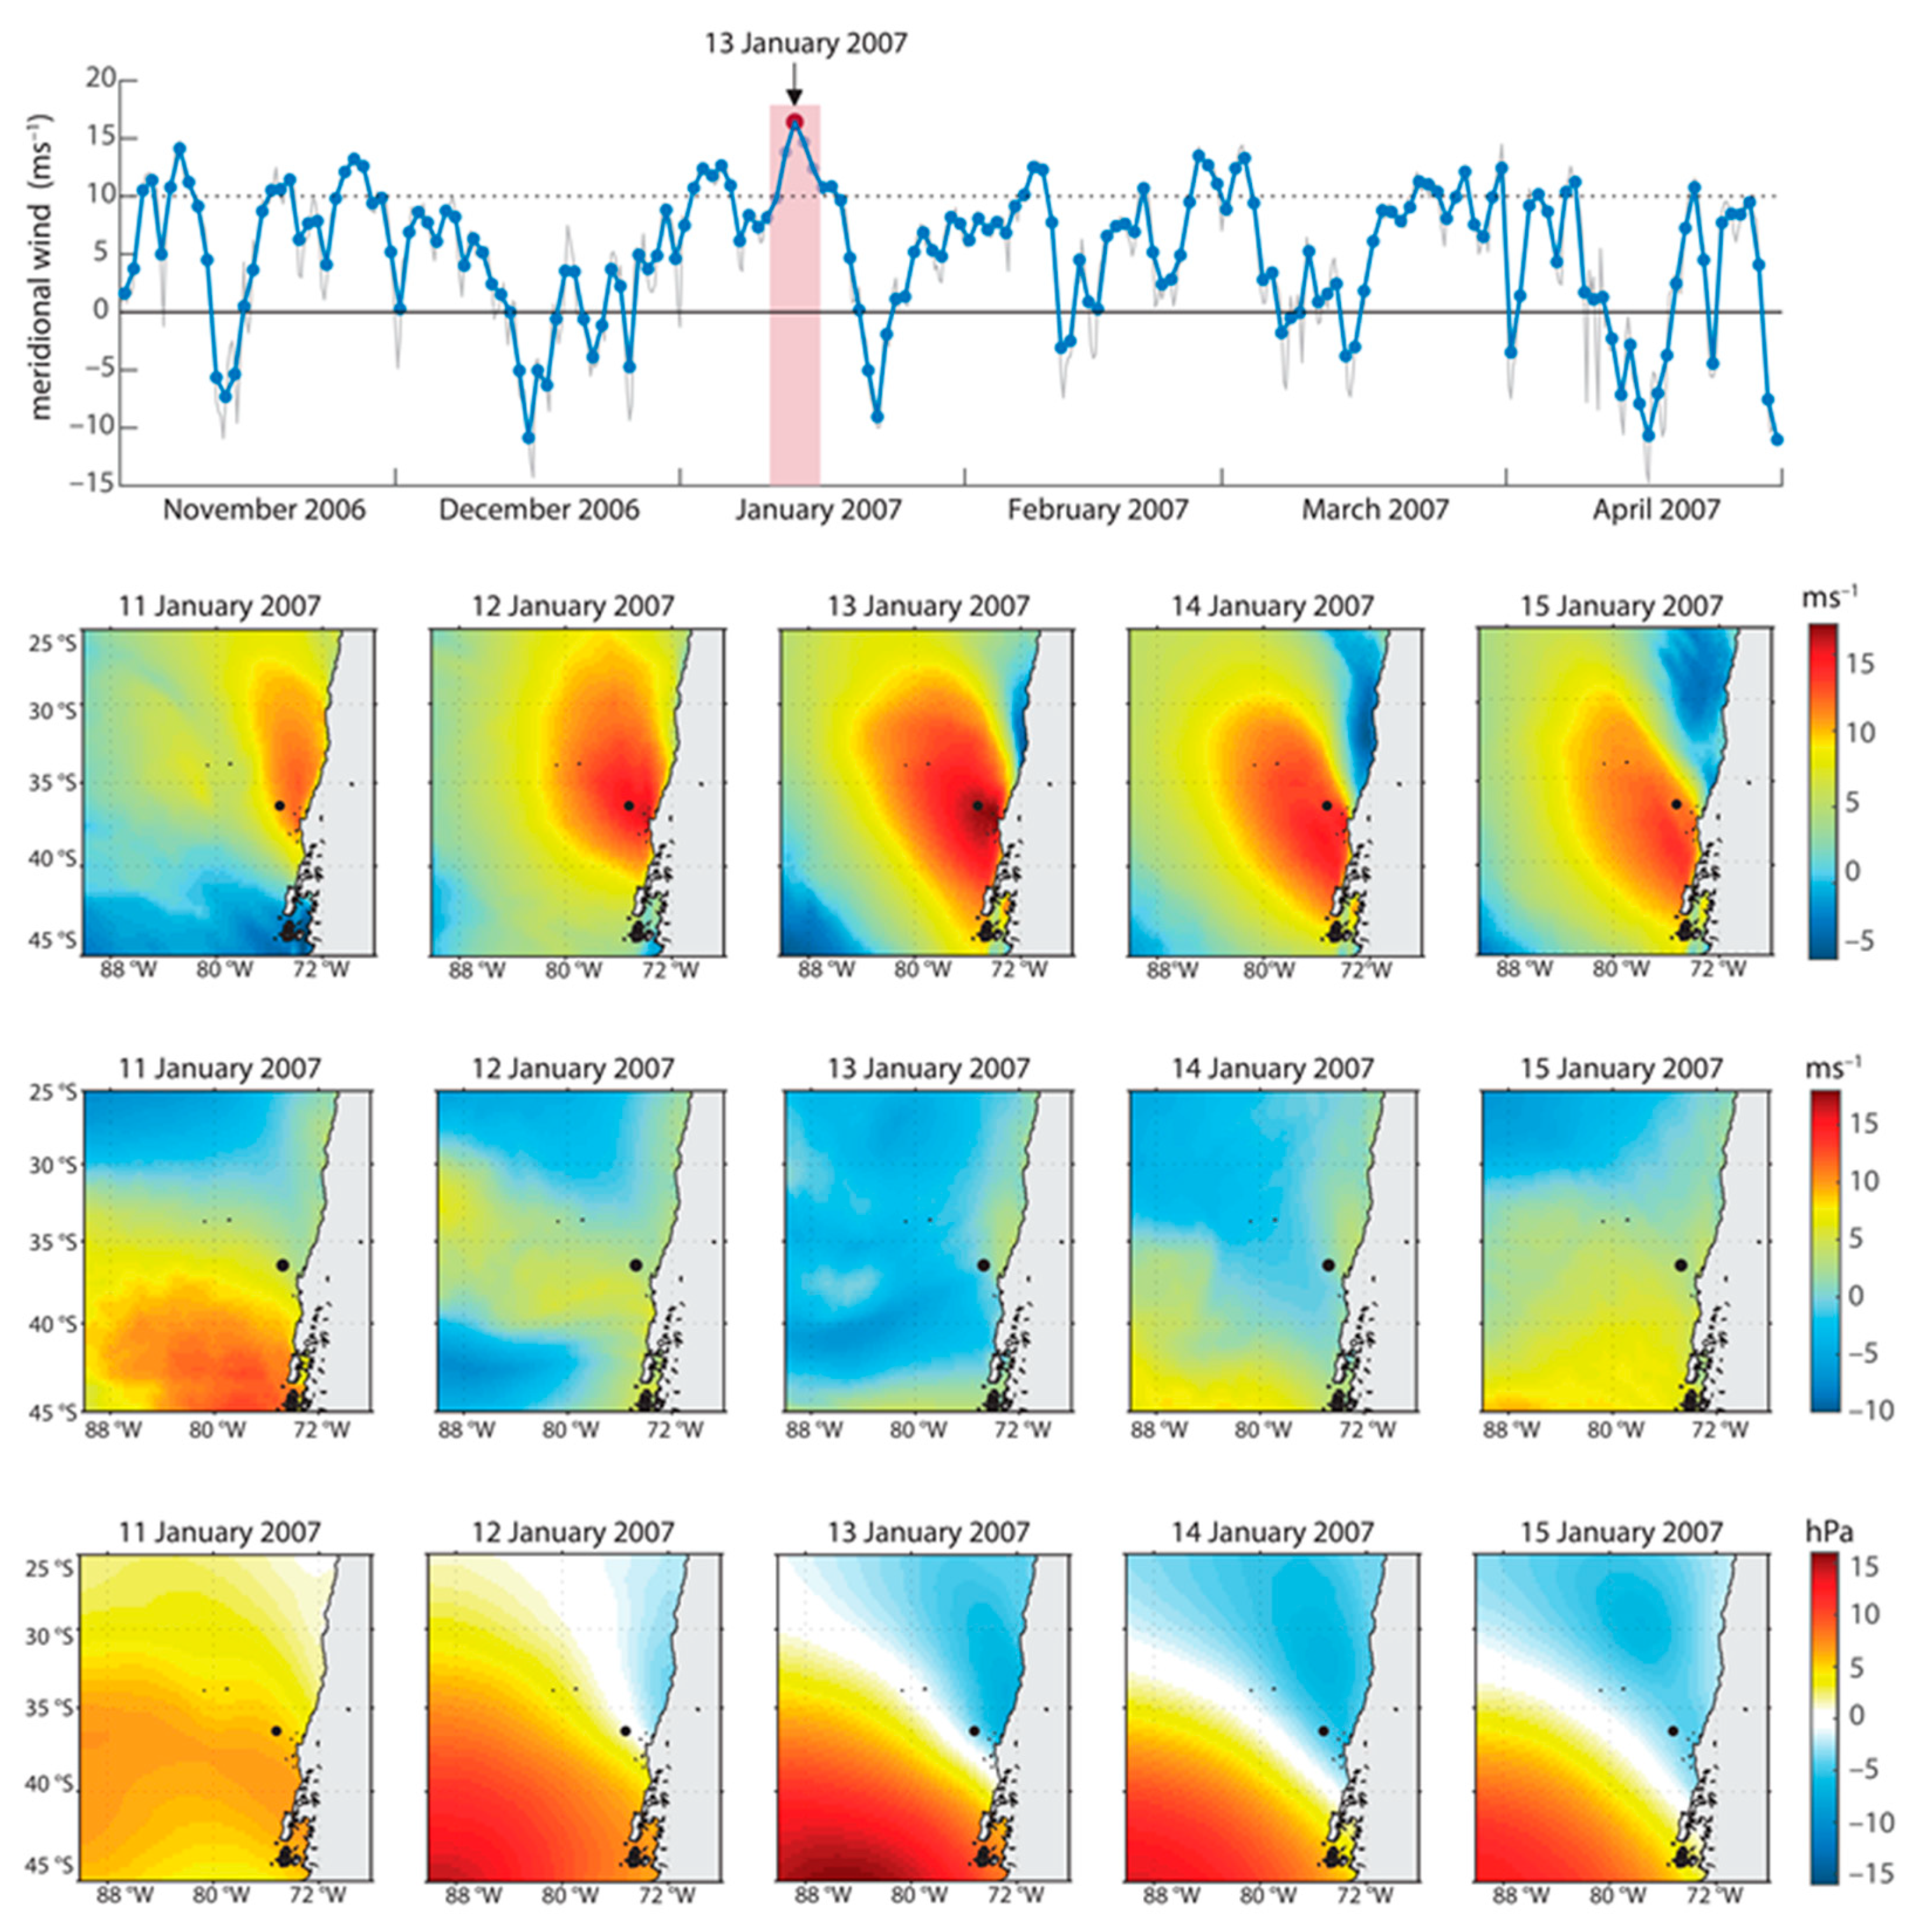
During austral spring and summer there is a quasi-weekly occurrence of a southerly atmospheric coastal low-level jet (CLLJ) alternating with periods of relaxation or even weak northerly winds [4,5]. This CLLJ is characterized by a band of southerly winds in excess of 10 ms−1 extending up to 1000 km along the coast but only 200–300 km in the cross-shore direction [6]. Vertically, the strong winds encompass the whole marine boundary layer (MBL), peaking just below the base of the capping subsidence temperature inversion at about 1 km above the surface. Studies in other ocean eastern boundaries indicate that CLLJs are associated with the quasi-stationary subtropical high-pressure cells concomitant with an inland thermal low, which enhance the cross-shore sea level pressure gradient (e.g., [7]). The CLLJ off central Chile, however, is driven by the alongshore surface pressure gradient between a coastal low over north-central Chile and a migratory anticyclone farther south, as illustrated for a case of study in January 2007 (Figure 2). This is because the very steep coastal topography breaks down the geostrophic balance (that otherwise would result in an easterly flow), thus accelerating the equatorward alongshore low-level flow, only constrained by surface friction [1,5,6].
The CLLJ plays an important role in the regional climate of the midlatitude and subtropical western continental coastal areas (e.g., [8]), impacting directly on the coastal ocean [9,10,11,12,13,14]. The CLLJ prompts intense coastal upwelling, introducing high synoptic-scale variability in sea surface temperature (SST), ocean diffusivities and surface heat fluxes along the coast [10,11,12,15] in the upper-ocean circulation and biogeochemical cycles [16,17]. During austral spring and summer, a well-defined near-surface ocean equatorward flow with a jet-like structure develops, following the climatological position of the CLLJ axis [9,13], showing that during summer, in ocean eastern boundaries, wind sea wave heights are comparable to the swell wave heights. Particularly at the Humboldt system, authors in [14] have found that the CLLJ strongly modulates the seasonal cycle of significant wave heights.
Physical mechanisms associated with the generation of the CLLJ include complex regional- to large-scale atmosphere–ocean–land interactions. Therefore, how climate change will impact the future behavior of the CLLJ is a difficult task and a crucial environmental issue. Climate projections have been used for assessing the responses of CLLJs to climate change [18,19,20]. Although the CLLJ is a regional-scale process not resolved in coarse resolution global circulation models (GCMs), relative changes in the synoptic-scale patterns that force CLLJ events, well represented in GCMs, show a poleward shift of mid-latitude migratory anticyclones in the Canary and Humboldt systems [21]. Several efforts have been conducted in order to characterize trends in mean southerly winds during the last decades [22,23,24,25]. However, knowledge about recent trends in the CLLJ in the southern Humboldt system is still limited (e.g., [8]).
Here we use ERA5 reanalysis data of sea level pressure and 10 m above-the-surface winds to characterize the evolution of intense equatorward coastal winds (as a proxy of the CLLJ) during the last four decades (1979–2019) off central Chile. Changes in frequency and duration of the CLLJ are reported as a function of latitude and related to changes in central pressures and density of extratropical migratory anticyclones. Documenting the contemporaneous change in the CLLJ is important in its own, as it can assist interpretation of other coastal variables and serve as a stringent benchmark for model validation. For comparison purposes, we consider available wind and sea level pressure records at coastal stations. The rest of the paper is organized as follows: In Section 2 we describe the data used and analyses performed. The main results are presented in Section 3, which is followed by a discussion in Section 4. Finally, the main findings of this work are summarized in Section 5.

2. Materials and Methods

2.1. Data Sets

We focused on the region covering the coast of Chile between 25 and 44 °S, where the CLLJ is found more frequently [4]. We used hourly mean fields of meridional (V10) and zonal (U10) winds 10 m above the surface, and sea level pressure (SLP) data from the ERA5 reanalysis for the period 1979–2019. This reanalysis is produced by the European Centre for Medium-Range Weather Forecast (ECMWF) and consists of a global-scale regular grid with a 0.25 × 0.25 lat–lon resolution [26]. We used the ERA5 because it offers the best performance for surface wind speed and variability [27]. Data were downloaded from the Copernicus Climate Data Store (https://cds.climate.copernicus.eu/).
In addition, SLP and winds from 7 meteorological stations along the Chilean coast were also analyzed (Figure 3). Meteorological data were obtained from the Meteorological Service of the Chilean Navy (Dirección General del Territorio Marítimo y de Marina Mercante, DIRECTEMAR) except data from Punta Lengua de Vaca station that were obtained from the Center for Advanced Studies in Arid Zones (Centro de Estudios Avanzados en Zonas Áridas, CEAZA). All the stations have a temporal resolution of 3 h, except Punta Lengua de Vaca, where 30-min records are available (Table 1). In the latter case, the 30-min time series was transformed into an hourly mean time series. Data-void periods and outliers were discarded.
Furthermore, we used wind data from the SeaWinds scatterometer onboard QuikSCAT between July 1999 and November 2009. Daily winds data with a spatial resolution of 0.5° Were obtained from Centre d’Exploitation et de Recherche Satellitaire d’Archivage et de Traitement (CERSAT), at Institut Francais de Recherche pour l’Exploitation de la Mer (IFREMER). This dataset is available from ftp://ftp.ifremer.fr/ifremer/cersat/products/gridded/mwf-quikscat/, and for more information the reader is referred to the user manual at ftp://ftp.ifremer.fr/ifremer/cersat/products/gridded/mwf-quikscat/documentation/mutwqscat.pdf.

2.2. Data Processing

The long-time frame of the ERA5 data allowed us to describe changes of the coastal winds over the last four decades. First, hourly time series of U10 and V10 at 75 points (Figure 1) along the coast of central Chile were used to calculate the alongshore winds (Va) with respect to the adjacent coastal orientation. These alongshore winds were defined with positive values when directed equatorward. Then hourly values of Va and SLP were daily averaged. To describe changes in CLLJs during the last decades, our approach included changes in windy days (WDs), here defined as those with a mean Va above a threshold of 10 ms−1. Off central Chile, this value approximately indicates the limit of the upper 20% of the daily frequency distribution of the meridional wind speed [18]. First, we constructed seasonal time series of number of WDs and number of CLLJ events, defined as sets of consecutive WDs; and duration of CLLJ events time-series trends for the period 1979–2019 were calculated through least-square linear fits.
Six-hour SLP data from ERA5 were interpolated onto a 2.5° × 2.5° horizontal grid and used as input to a cyclone-tracking scheme, originally developed and implemented at the University of Melbourne [28]. A resolution of 2.5° allows for the representation of anticyclones since they have an average diameter in the order of 20° in the southern hemisphere [21]. This tracking algorithm has been and still is widely used for tracking both cyclones and anticyclones (e.g., [21,29,30,31,32]). Here we located and tracked anticyclones to assess relationships with the occurrence of WDs. From the total number of anticyclones identified, we separated stationary from migratory anticyclones. Following [21], migratory anticyclones were defined as anticyclones that last at least 3 days within the selected domain and move eastward faster than about 3 deg. lon day−1. Using these data, we calculated the probability that WDs occur along the coast of central Chile when a migratory anticyclone (identified by the tracking algorithm) resides inside the target area shown in Figure 1. Within our target area, stationary anticyclones, particularly the SPA, frequently merge with extratropical migratory anticyclones, producing an SLP spatial pattern that seems to be a poleward extension of the SPA. This pattern is not detected as a migratory anticyclone by the procedure after running the tracking algorithm. However, the relationship between migratory anticyclones and intense southerly winds found in this region using the Climate Forecast System Reanalysis [21] encourage us to use this methodology.
To test the statistical significance of trends we used a Monte Carlo method in which one-thousand synthetic randomized time series were constructed. Finally, if the trend of the original time series was larger than the 90th percentile in the distribution of randomly generated trends, we considered the trend to be significant. To assess any possible seasonality, we split the analyses into austral summer (December–January–February; DJF), fall (March–April–May; MAM), winter (June–July–August; JJA) and spring (September–October–November; SON).

3. Results

3.1. Wind Quality Assessments

To evaluate the quality of the ERA5 coastal Va and SLP, we compared them with observations at coastal meteorological stations and from satellite observations described in Section 2.1. To construct error metrics, common periods of data availability between ERA5 and those for each meteorological station were considered (Figure 3). The reanalysis data were linearly interpolated to match the location of each meteorological station. The following statistics were used as error metrics to assess the difference between the observed and ERA5 data: bias, root mean squared error (RMSE) and temporal linear correlation (R). This statistical analysis was performed using daily means time series.
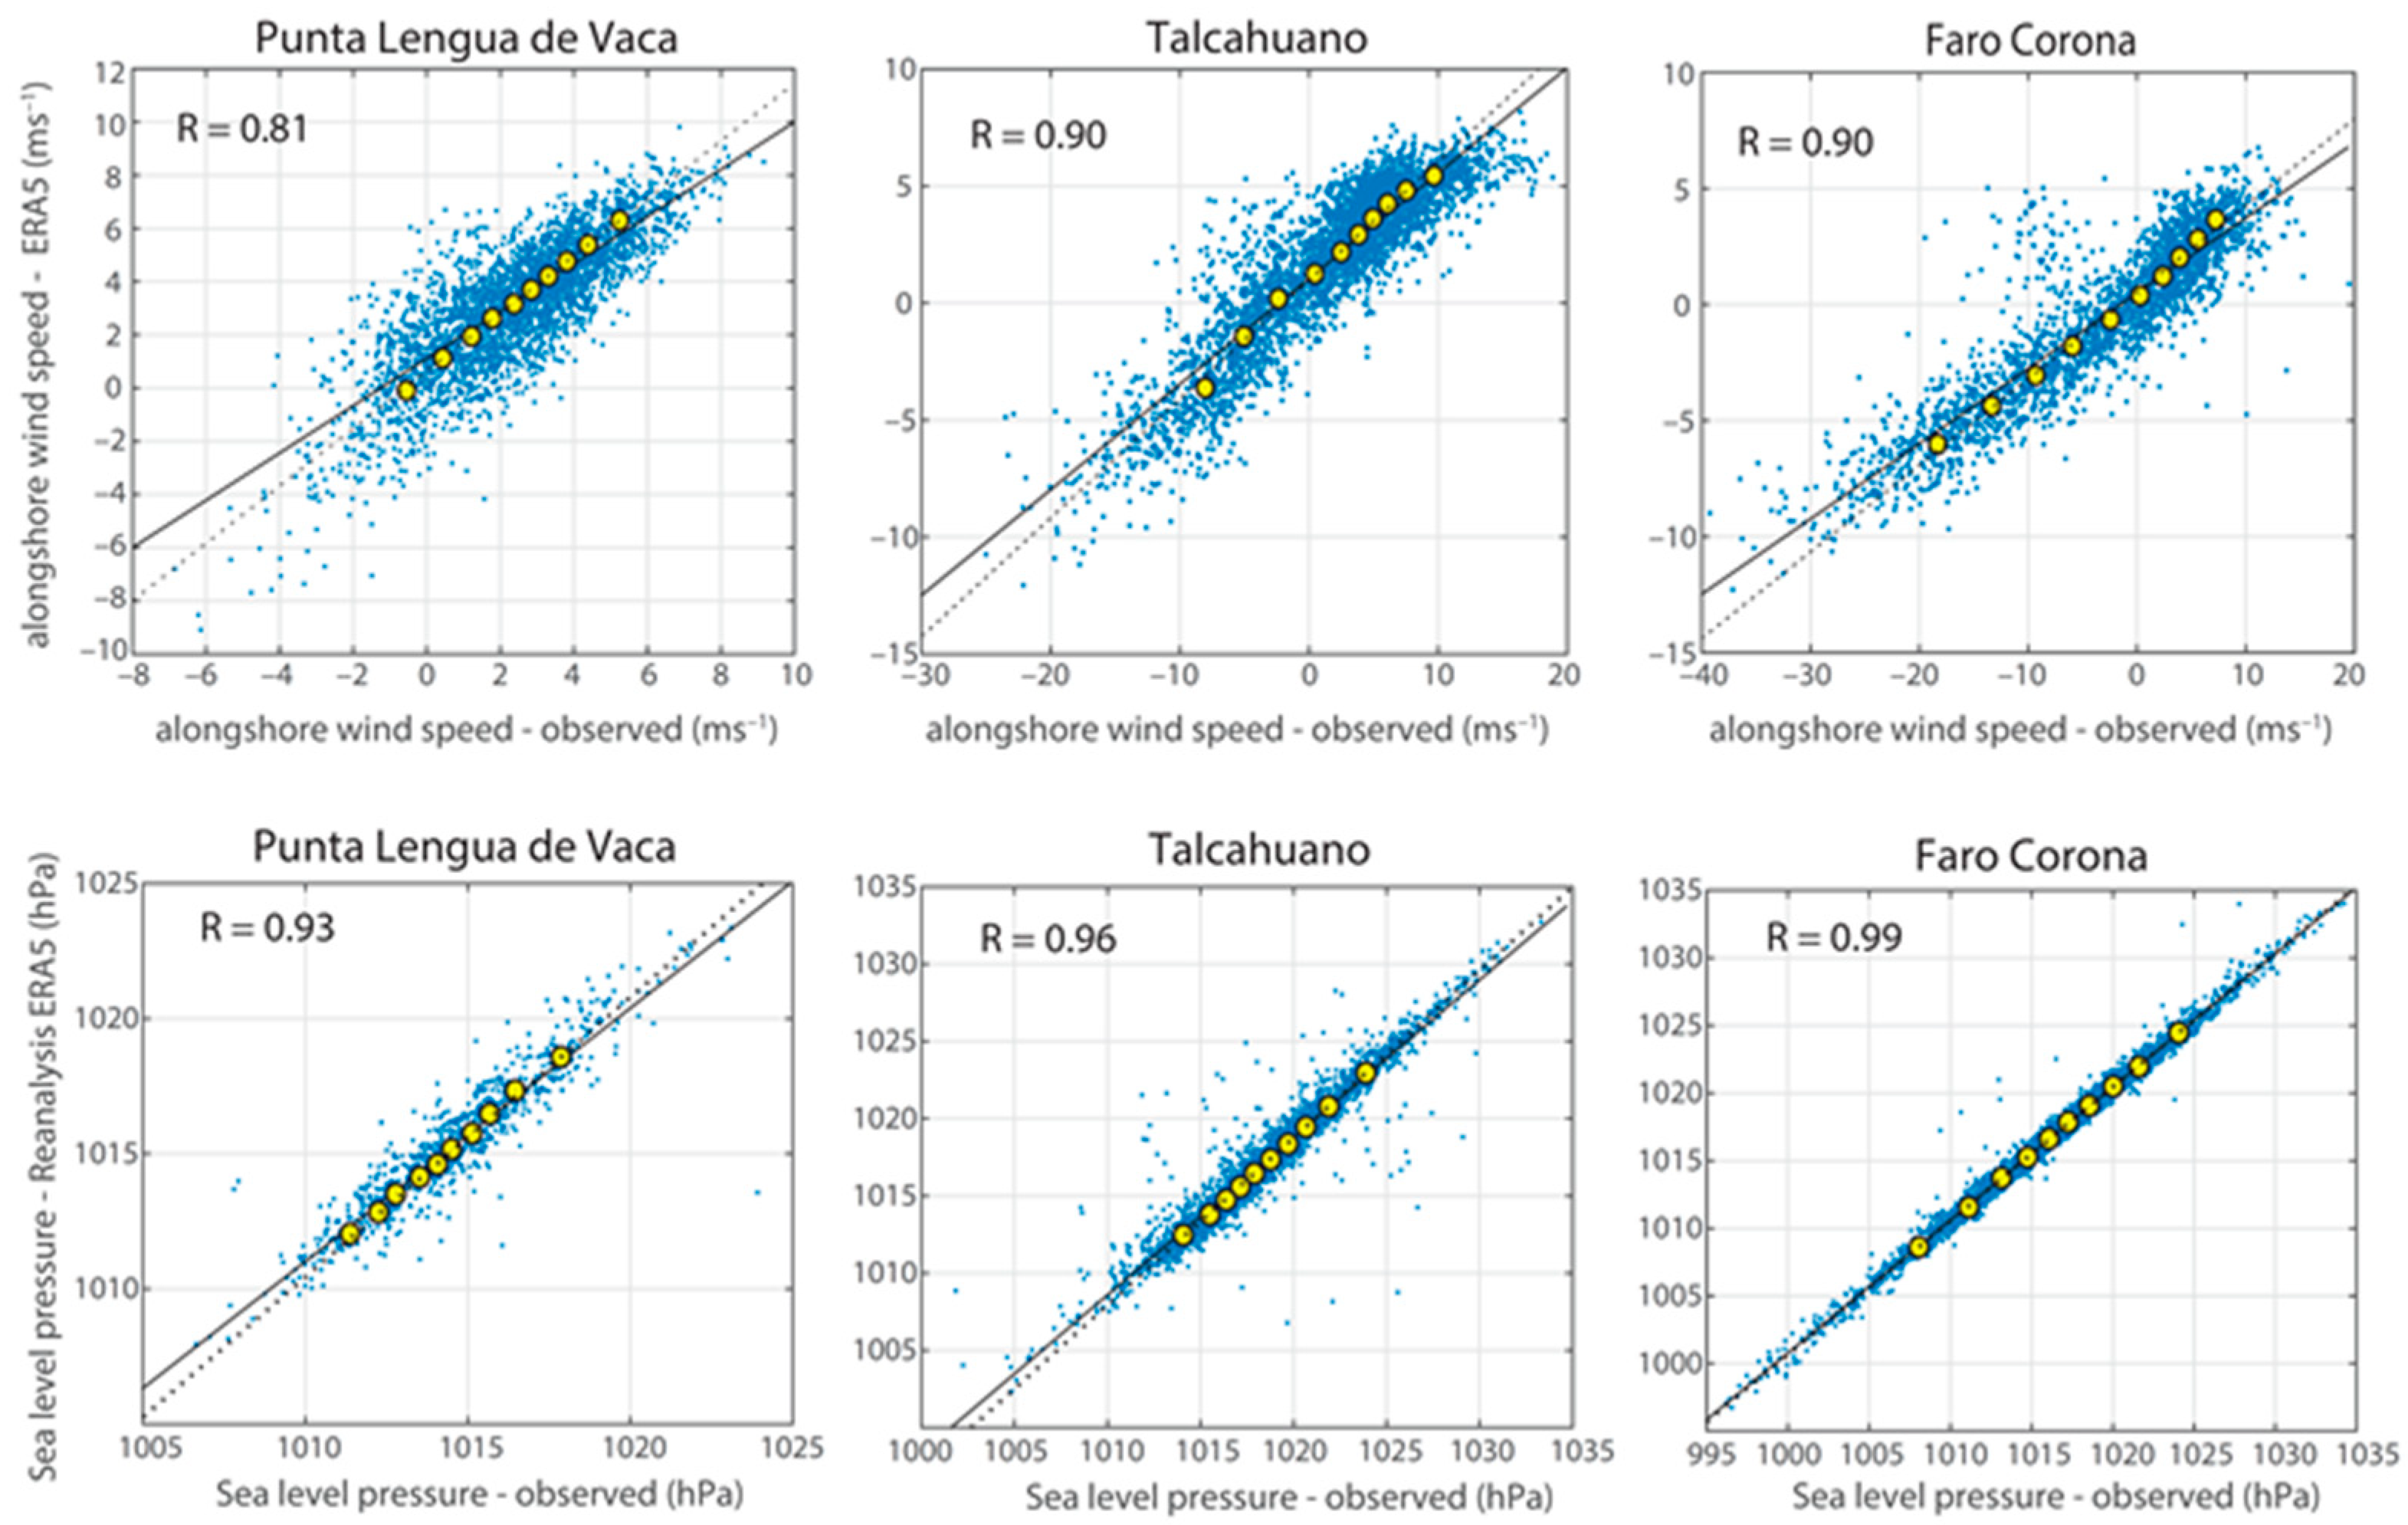
Statistics error metrics are presented in Table 2 and Table 3 for Va and SLP, respectively. Figure 4 shows scatter plots for selected meteorological stations located at the northern, center and southern regions of our study area.
The comparison between Va data from ERA5 and measurements indicated a high level of agreement for both time series, with R ranging between 0.76 and 0.84 (Table 2). Higher correlations were generally observed during austral winter (mean R-JJA = 0.84) along the entire coast. Lower correlation values appear in austral summer with a mean R-DJF = 0.76 (Table 2).
Mean values of bias indicated that Va in ERA5 data had, in general, higher values than in situ measurements. Particularly during austral winter and fall, when northerly winds increase in frequency, positive bias represented stronger (negative) winds in observations than reanalysis. In contrast, during spring and summer positive bias was associated with more intense (positive) winds reanalysis. On the other hand, RMSE showed similar values at different seasons, but in general, the values increased southward.
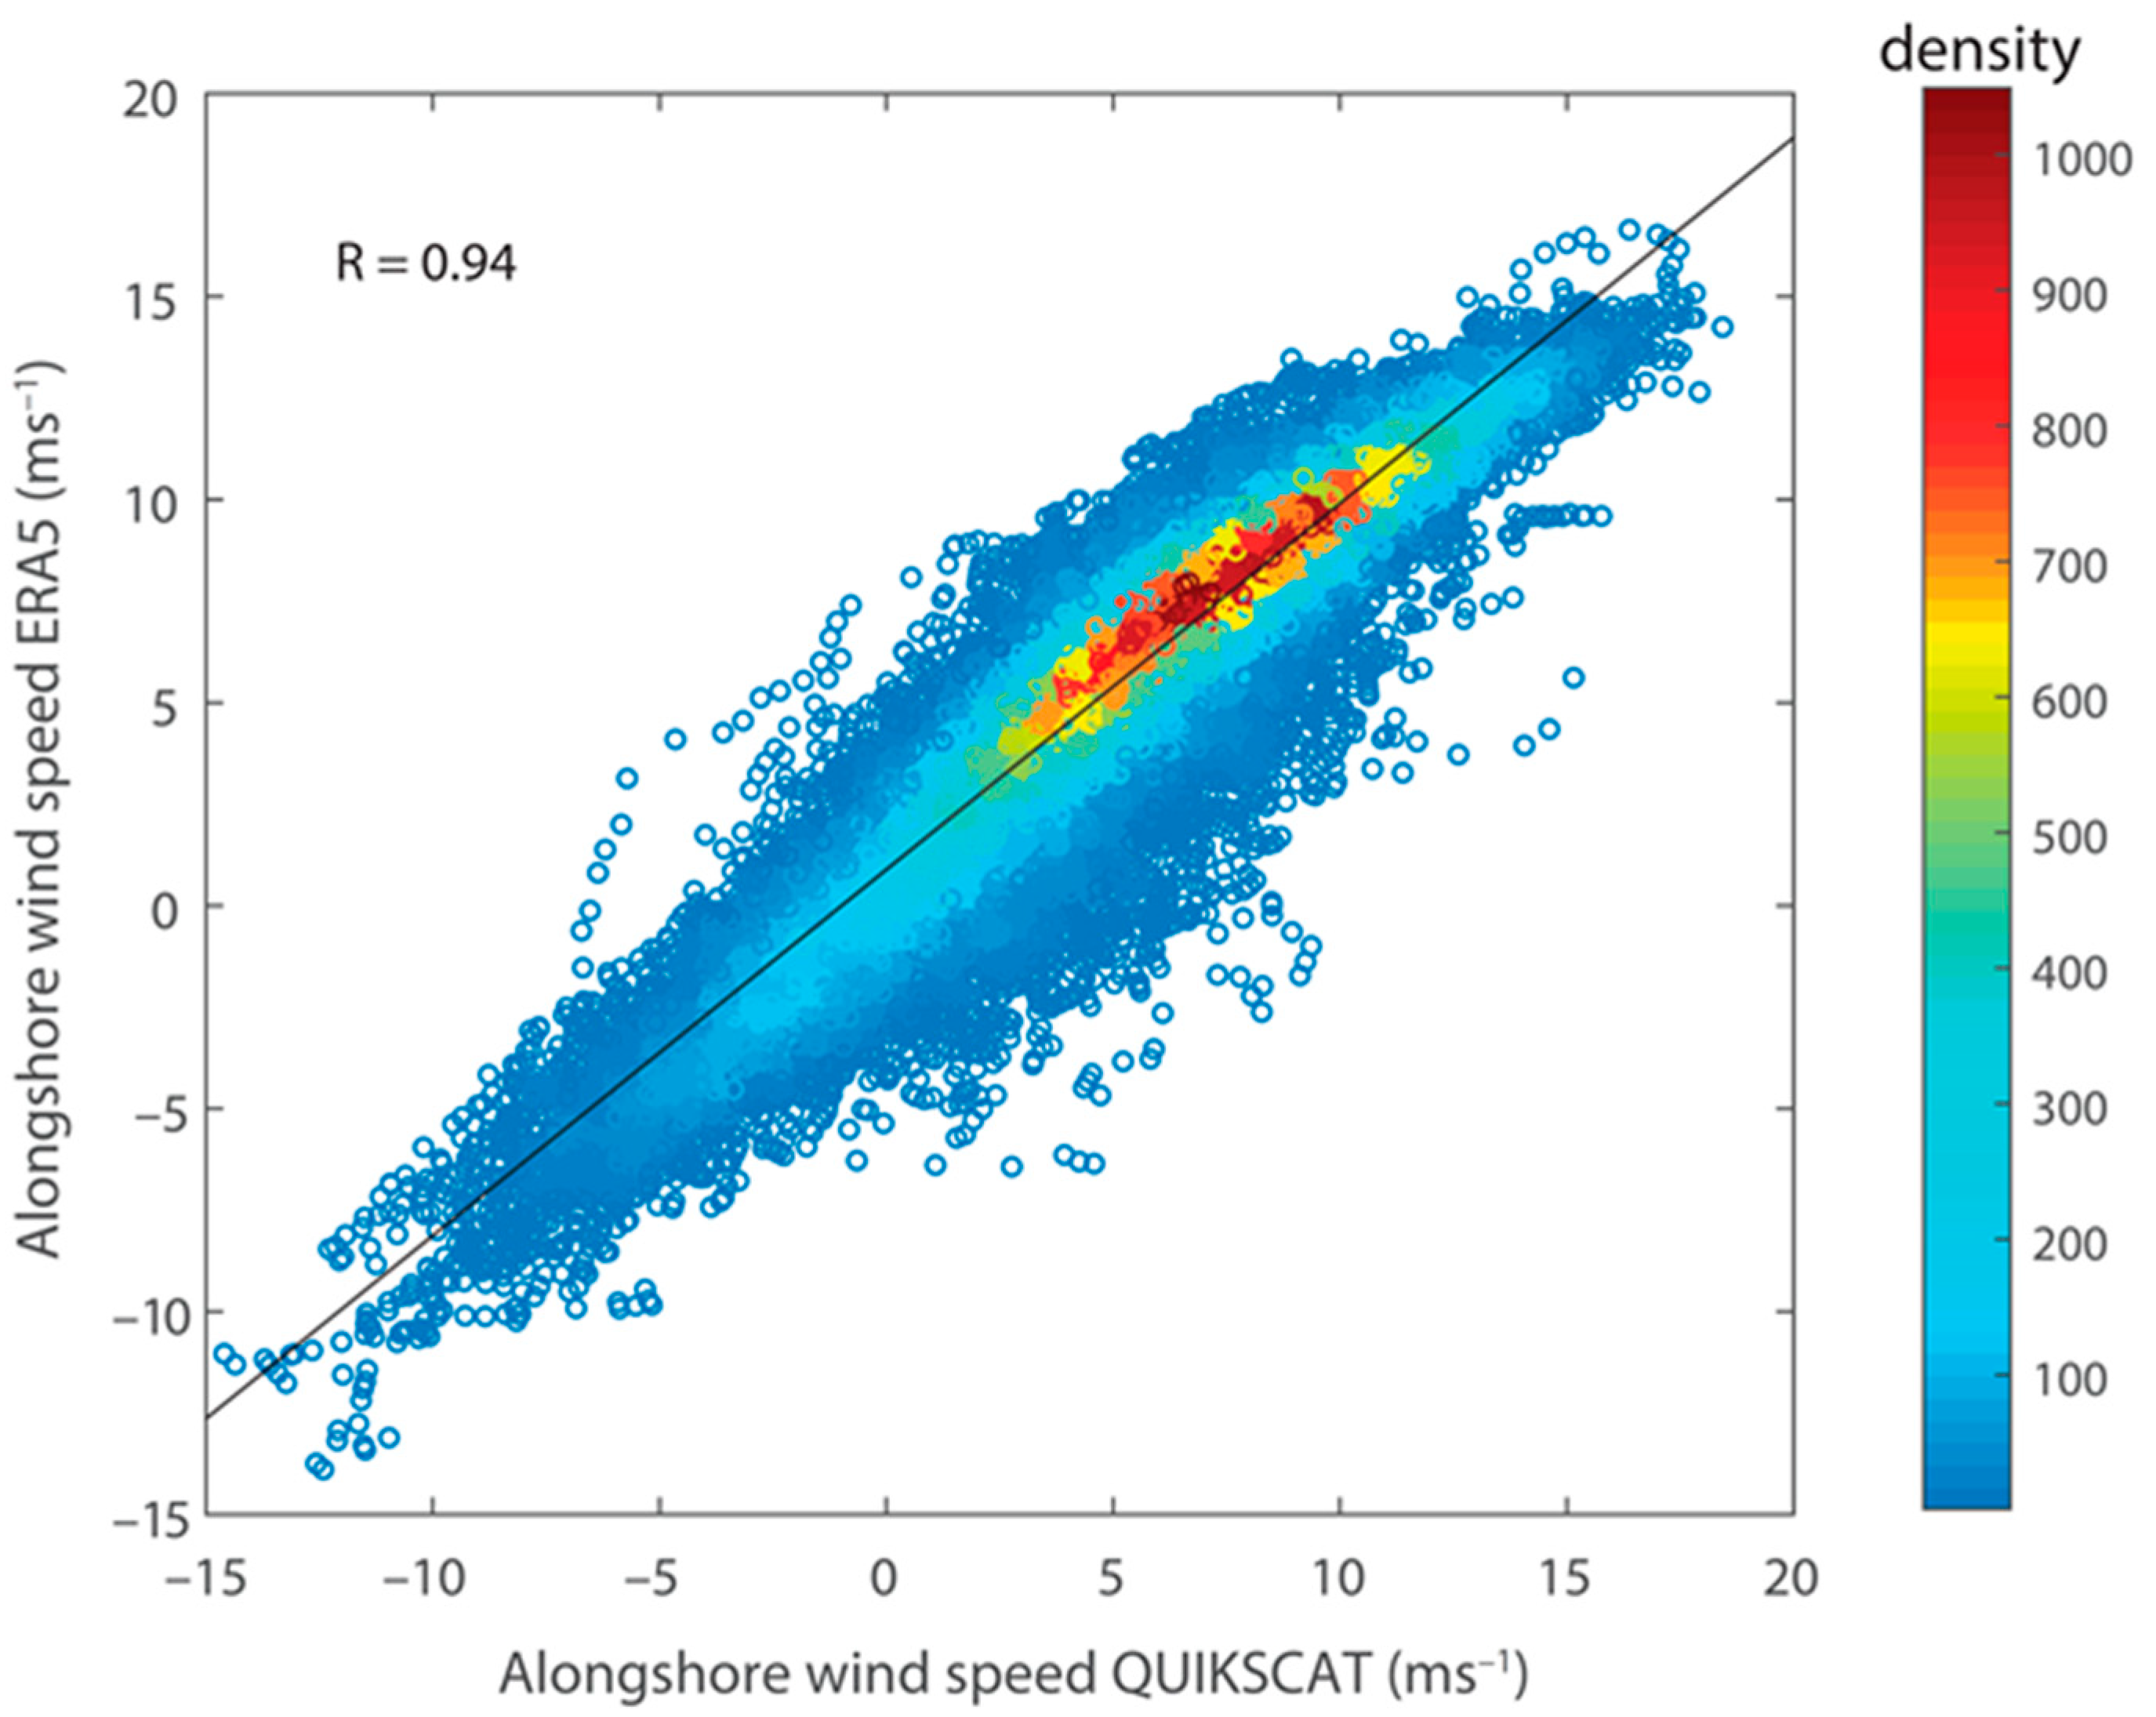
The good performance of ERA5 in representing surface wind variability was also ratified by the comparison of Va with satellite data from QuikSCAT (R = 0.94). A heat scatter plot (Figure 5) shows that reanalysis and satellite Va data ranged mostly between 3 and 12 ms−1, the mean ERA5 winds values being only slightly stronger than satellite winds (Table 2). Furthermore, lower values of bias and RMSE were observed in comparison with those obtained from the comparison of reanalysis with meteorological stations.
On the other hand, as it can be seen in Table 3, the comparison between measurements and reanalysis of SLP time series indicated a higher degree of agreement than the Va ones, with mean R values between 0.91 and 0.95. Seasonally, the strongest correlations were generally seen during austral winter (mean R-JJA = 0.95), while the opposite was observed during austral summer and fall, both seasons with mean R values of 0.91.
These metrics indicate that reanalysis data and in situ measurements are in close agreement for Va (mean R-annual >0.82) as well as for SLP (mean R annual >0.91), despite the spurious trends observed in reanalysis output derived of changing the source of information over time, among others. Higher correlations were observed during austral winter but they were lower in austral summer. These results highlight the ability of ERA5 for representing the strong wind events in our study area, and, therefore, the southerly low–level coastal jet along the southwestern coast of South America.

3.2. Seasonal Trends of the Southerly Coastal Jets

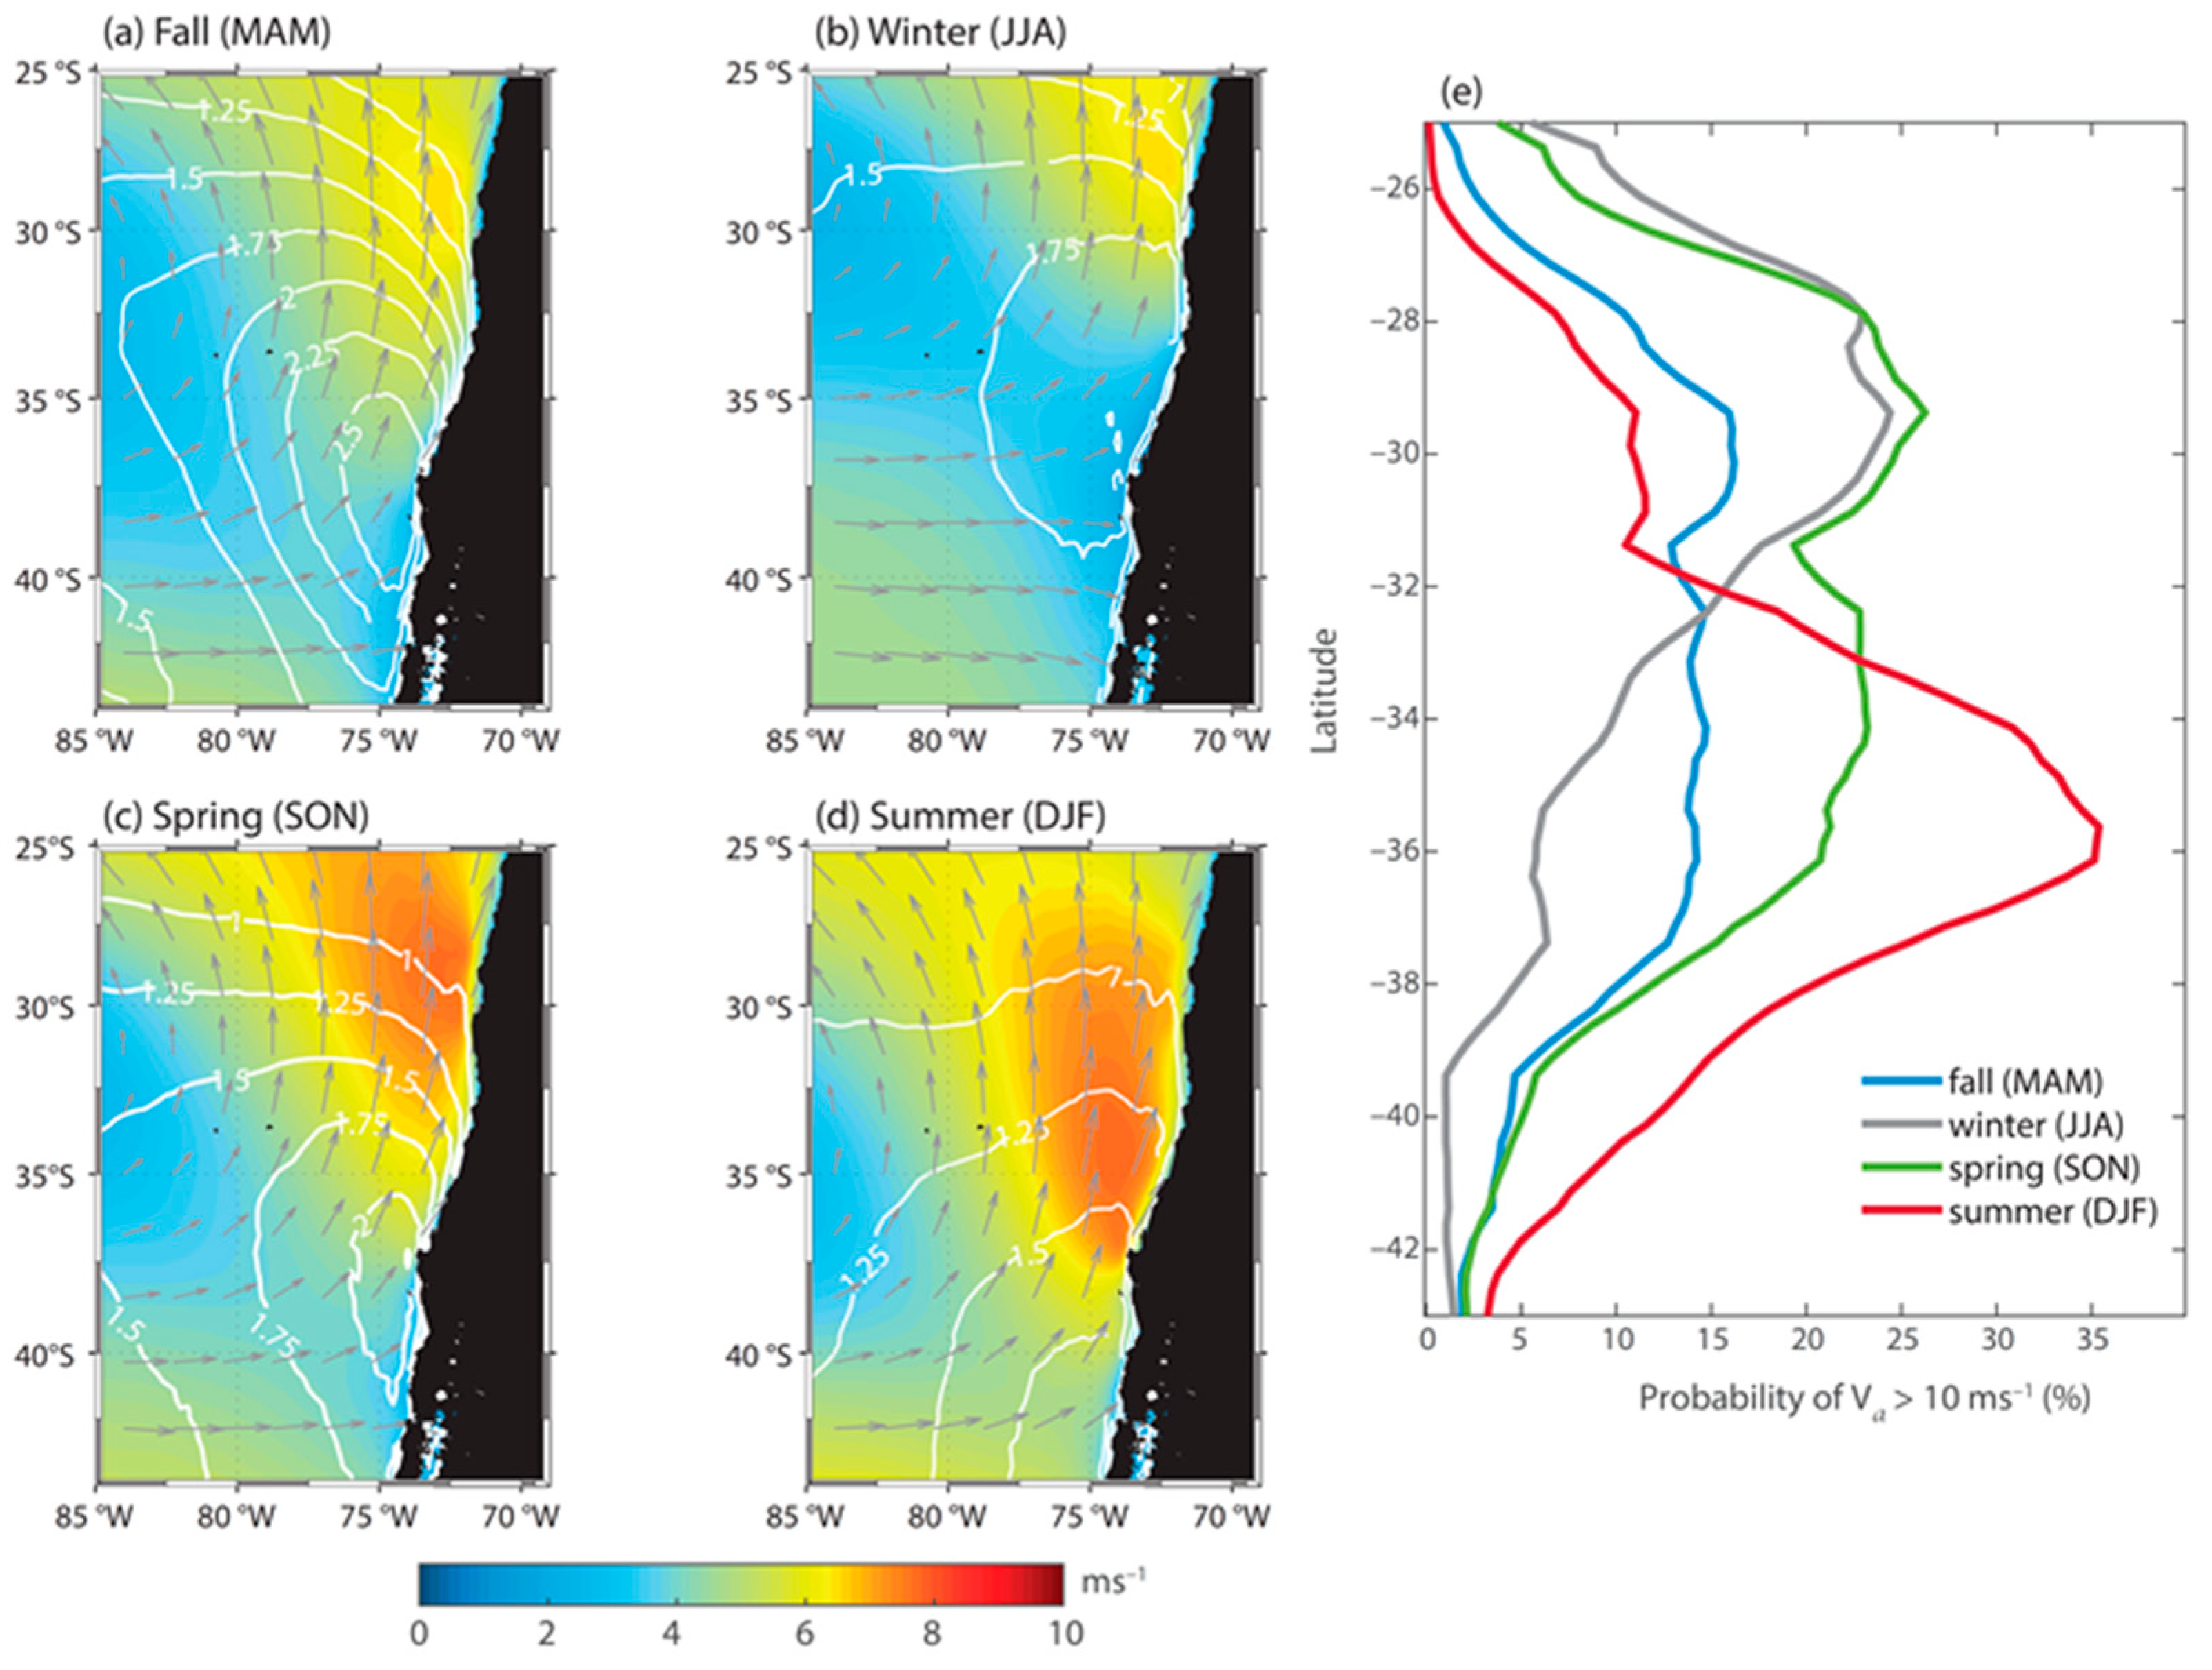
Now we describe the mean seasonal characteristics of the daily-averaged Va off central Chile, with emphasis on the CLLJ events. Figure 6 shows maps of the seasonal mean wind speeds between 25 °S and 44 °S. Weak mean wind speeds with a mean S–SW direction prevailed during fall and winter north of ~35 °S, while the mid-latitude westerlies dominated to the south of it. During spring and summer, wind speeds reached maximum intensities within an area of maximum meridional winds. The wind maxima at 30 °S in spring and 37 °S in summer were anchored to the major capes, Punta Lengua de Vaca and Punta Lavapie, respectively, marking a break in the otherwise straight north-south coastline [1]. This seasonal wind speed variability was consistent with the SPA poleward displacement during summer, delimiting the latitudinal span of the area where CLLJs develop. Southerly CLLJ events off central Chile occur year-round, but they are more frequent during spring-summer when they are present over 60% of the time [4]. Furthermore, CLLJ events are intermixed with periods of relaxed southerlies or weak northerlies that result in a pronounced day-to-day variability that reaches higher values to the south of the wind maxima in each season (white contours in Figure 6). During fall and spring, the core of this synoptic-scale variability is rooted at Punta Lavapie (~37 °S). During winter maximum Va variability is centered around 35 °S, but during summer, when the core of the wind maxima is located near 37 °S, the maximum of Va variability shifts southward.
Figure 6e shows the seasonal percent frequency of WDs (Va ≥ 10 ms−1) as a function of latitude. These windy days were present more than 20% of the time during winter between 27 °S and 31 °S but decreased rapidly with latitude. During spring this value expanded southward to 37 °S. In contrast, during summer, WDs occurred less than 10% of the time in the northern zone between 25 °S and 30 °S, being more frequent south of 33 °S with a peak frequency of 30% at 37 °S. Overall, these results are in agreement with previous climatologies based on scatterometer data [4], the Climate Forecast System Reanalysis [1] and regional climate simulations [18], lending further support for the use of ERA5 reanalysis.
During summer, positive trends in WDs were found off south-central Chile, particularly between 37 °S and 44 °S, contrasting with negative values at lower latitudes (29–34 °S) (red line Figure 7a). While a corresponding increase in the number of CLLJ events (consecutive windy days) was also observed between 37 °S and 44 °S, the negative trend at lower latitudes was not clear (red line, Figure 7b) suggesting a shortening of CLLJ event durations between 28 °S and 33 °S (red line, Figure 7c). In contrast, the duration of CLLJ events showed a significant increase only south of 42 °S. During austral winter, significant positive trends in WDs and CLLJ events were obtained in the whole domain, although these trends were higher at the northern part of the domain (gray line, Figure 7a,b), Furthermore, during this season the duration of the CLLJ events exhibited a significant increase south of 37 °S. In fall, a significant increase in the number of WDs was observed between 32 °S and 36 °S (blue line, Figure 7a), but the increase in the number of CLLJ events was observed between 34 °S and 39 °S. This pattern was consistent with the trends found in the duration of CLLJ events, which showed an increase around 33 °S and a decrease around 37 °S. These spatial patterns in changes in CLLJ were, in general, reproduced by other reanalysis products, such as CFSR (Figure S1).
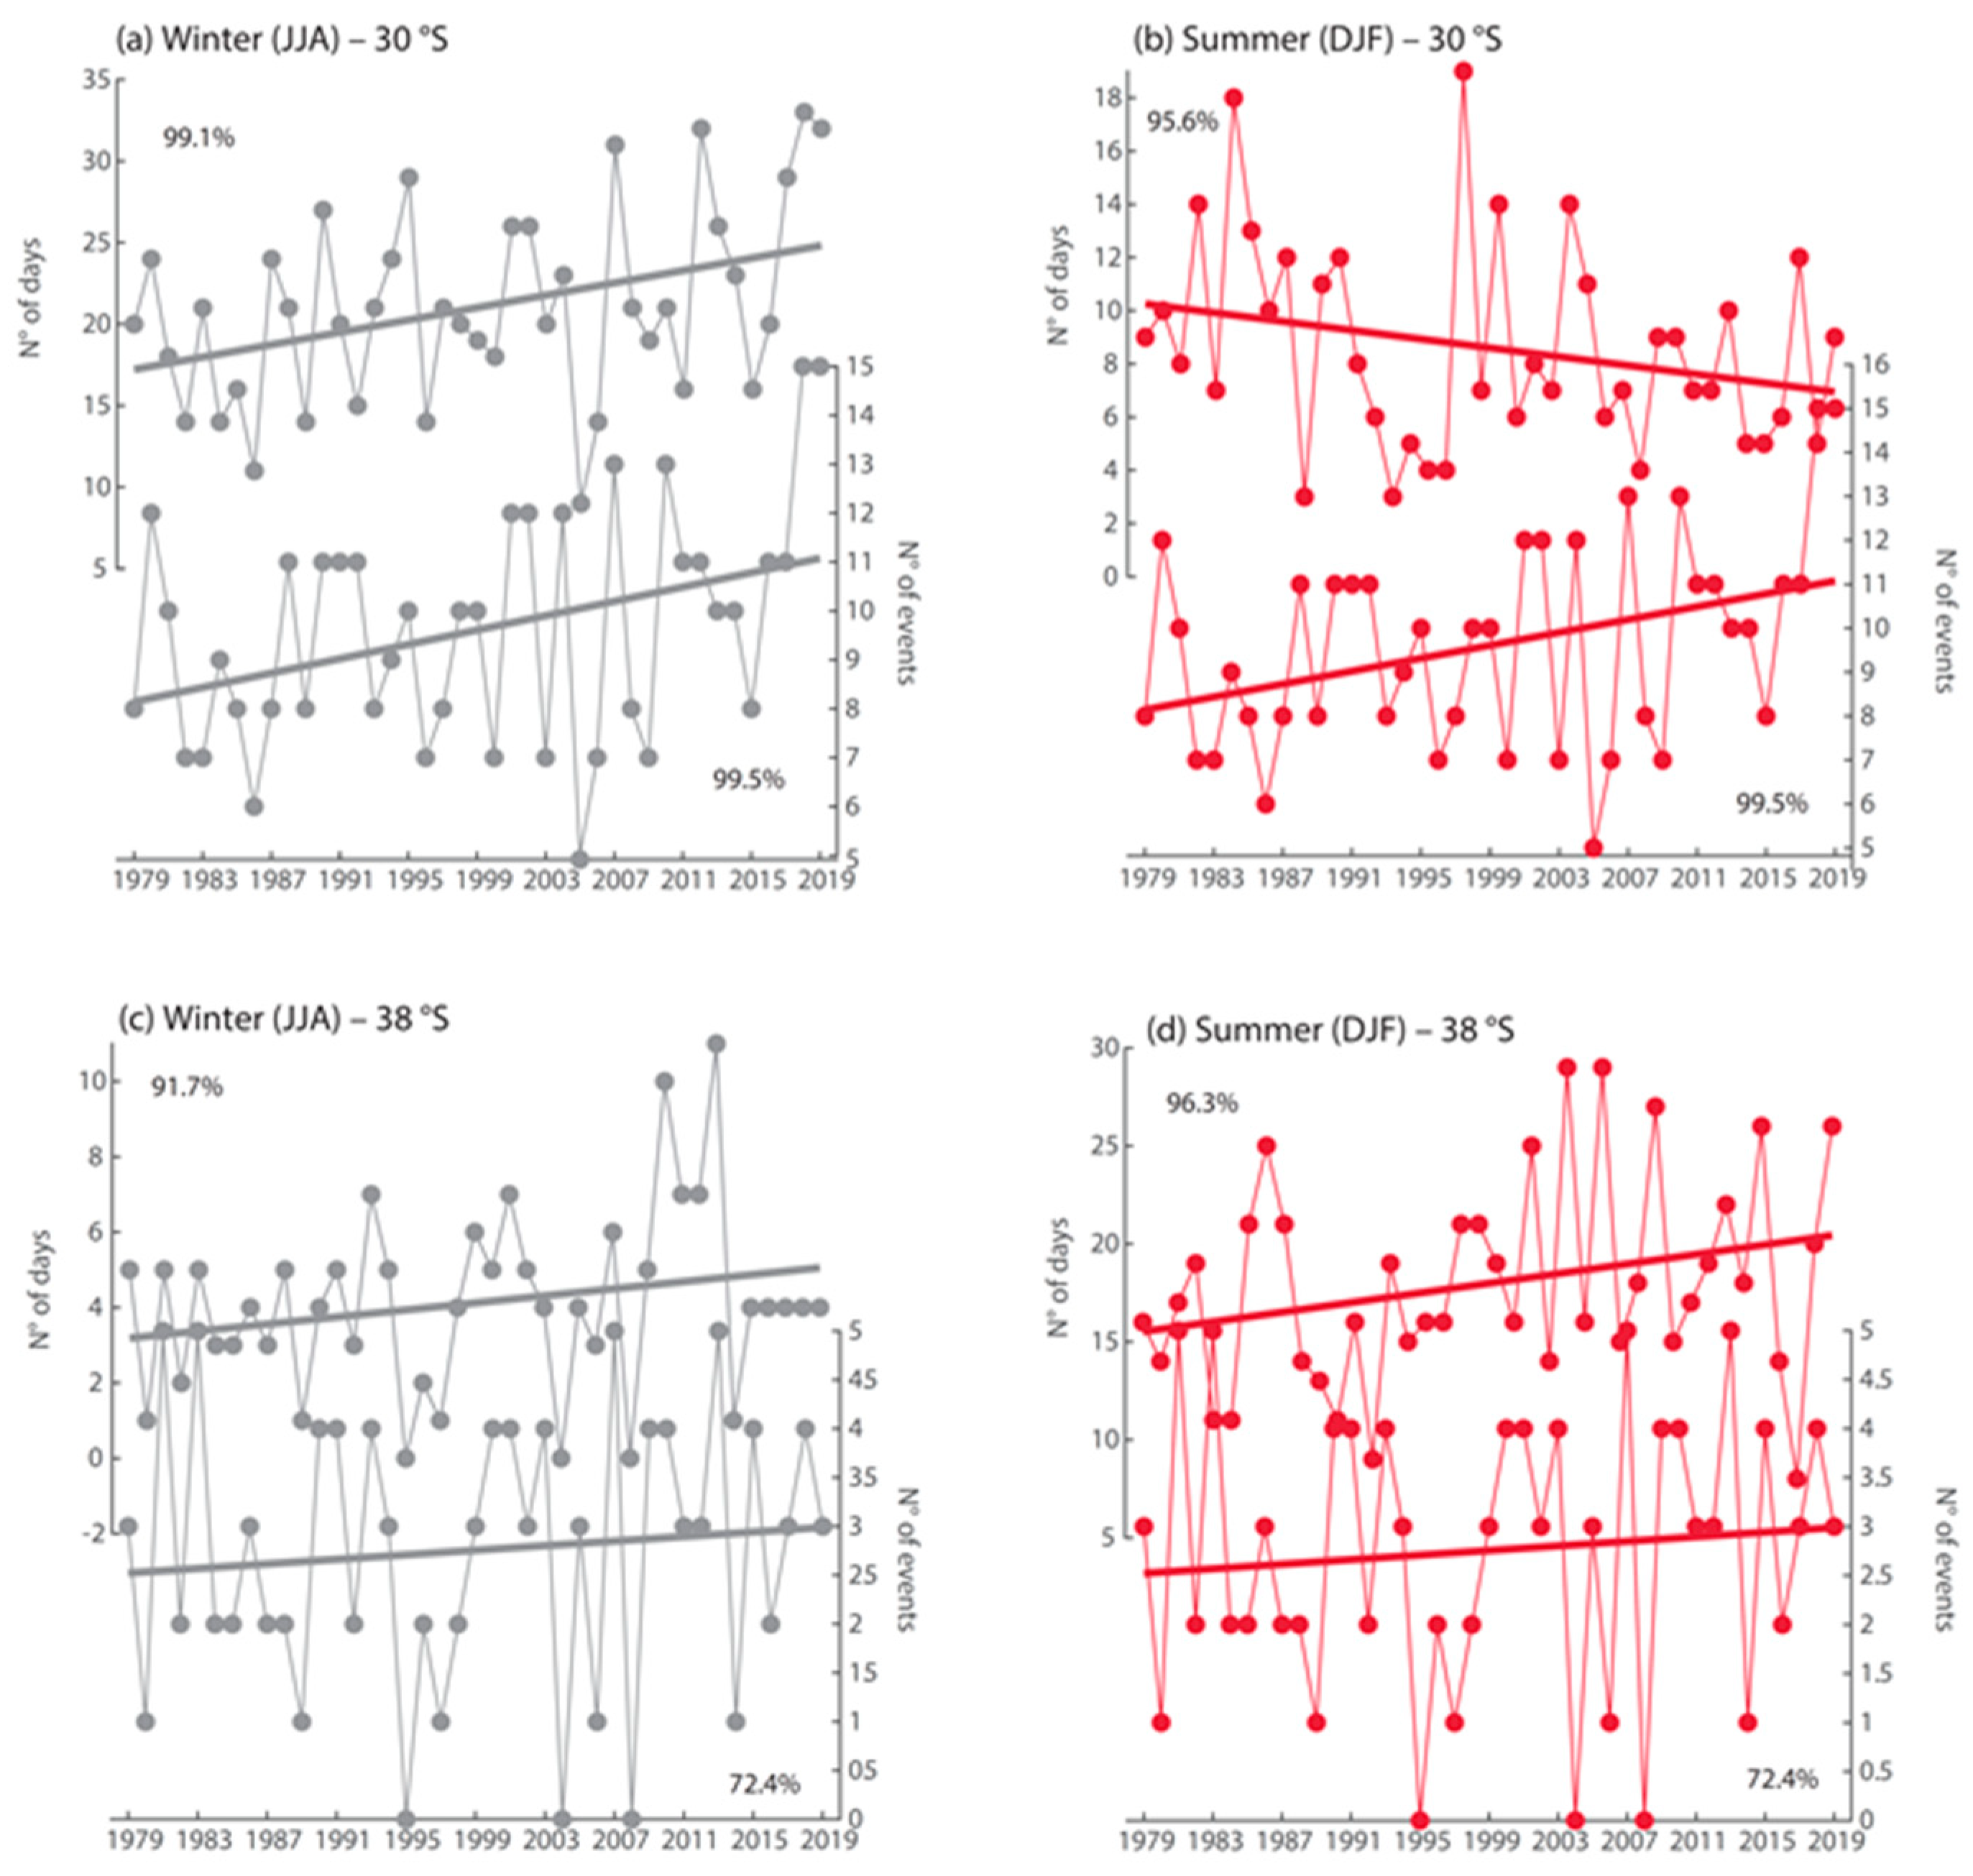
The time evolution of the number of WDs and CLLJ events are shown at selected locations as time series of seasonal means (austral summer and winter) offshore north-central Chile at 30 °S and south-central Chile at 38 °S (Figure 8). Off 30 °S positive trends were observed during winter, while negative trends were found in summer. In contrast, positive trends were found at 38 °S, more markedly during summer than winter. Trends that were significant at p = 0.1 are highlighted in Figure 8. The time series show that these long-term trends in the number of windy days and CLLJ events were linear in a first approximation, and they were embedded within high variability at interannual time scales.

3.3. Relationship with Migratory Anticyclones

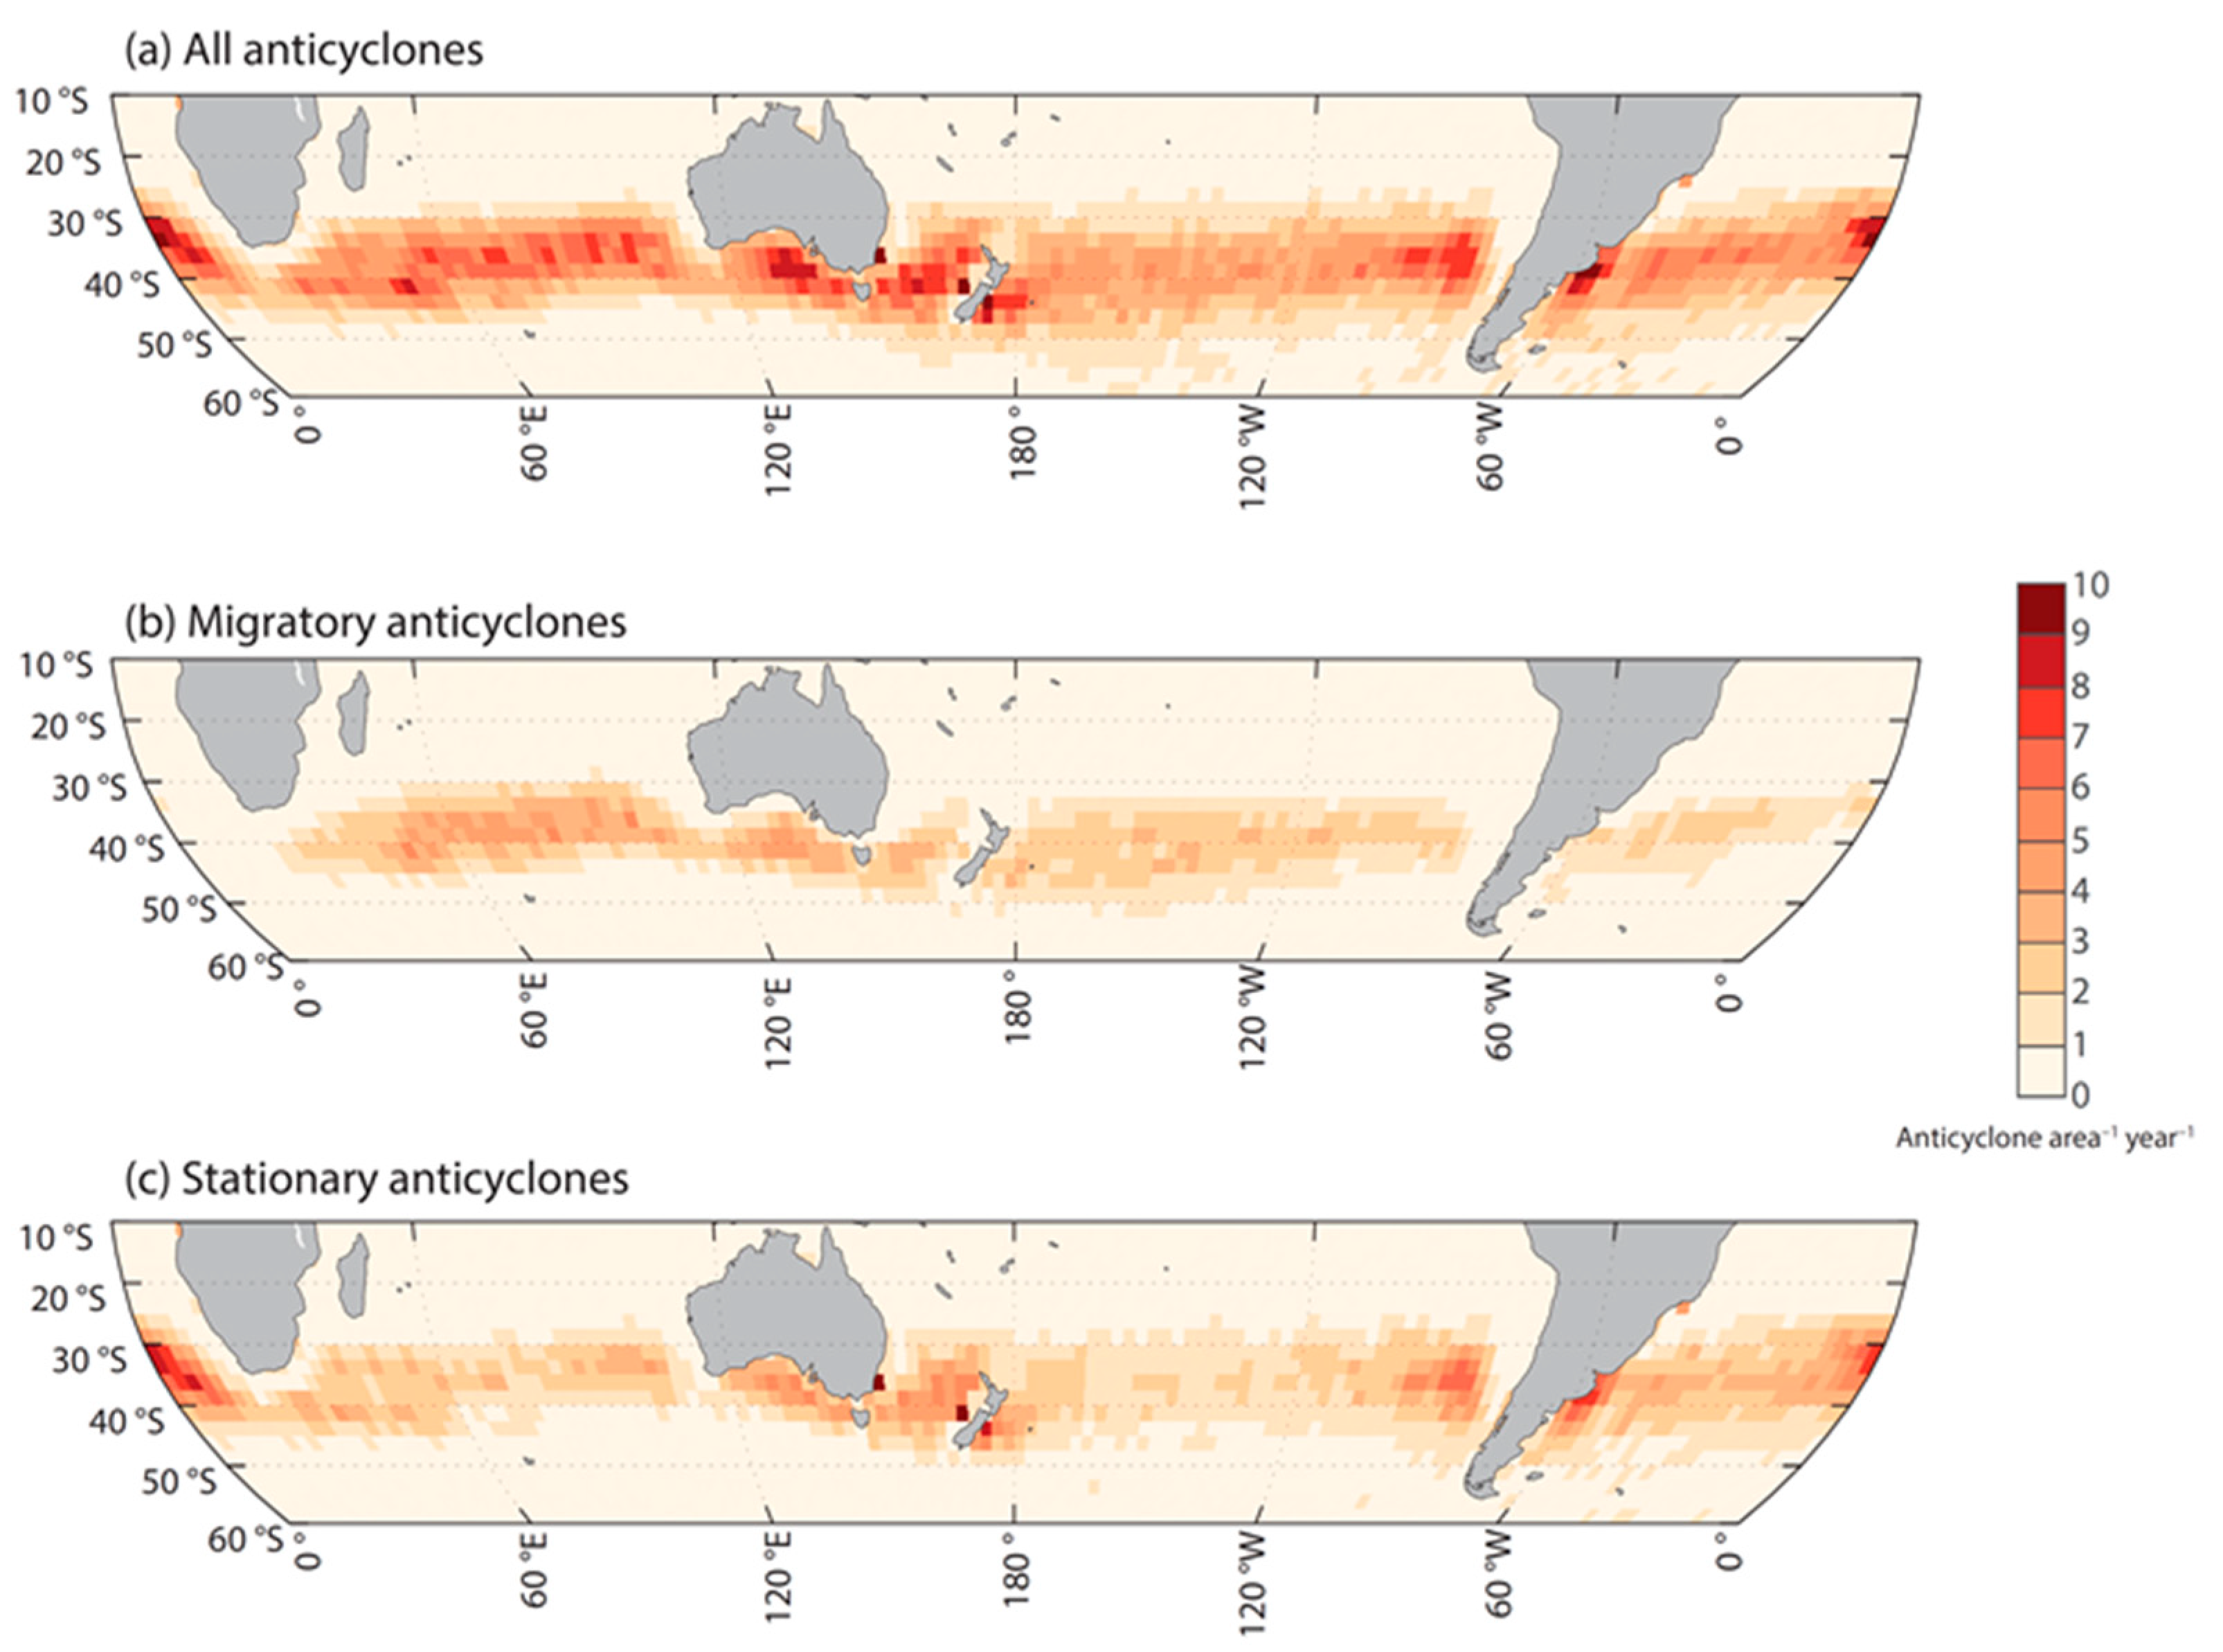
The average density of all anticyclones and the split between stationary and migratory anticyclones are shown in Figure 9 for the southern hemisphere. There was a well-defined belt of maximum density between 30 °S and 50 °S. Most of the tracked anticyclones were stationary, and the density increased with the position of the quasi-stationary subtropical highs at the southeast of each ocean basin. As expected, migratory anticyclones, embedded in the westerly wind belt, tracked preferentially to the south of the stationary anticyclones and exhibited a more homogeneous pattern in longitude. These results are consistent with a similar analysis using the Climate Forecast System Reanalysis [21].
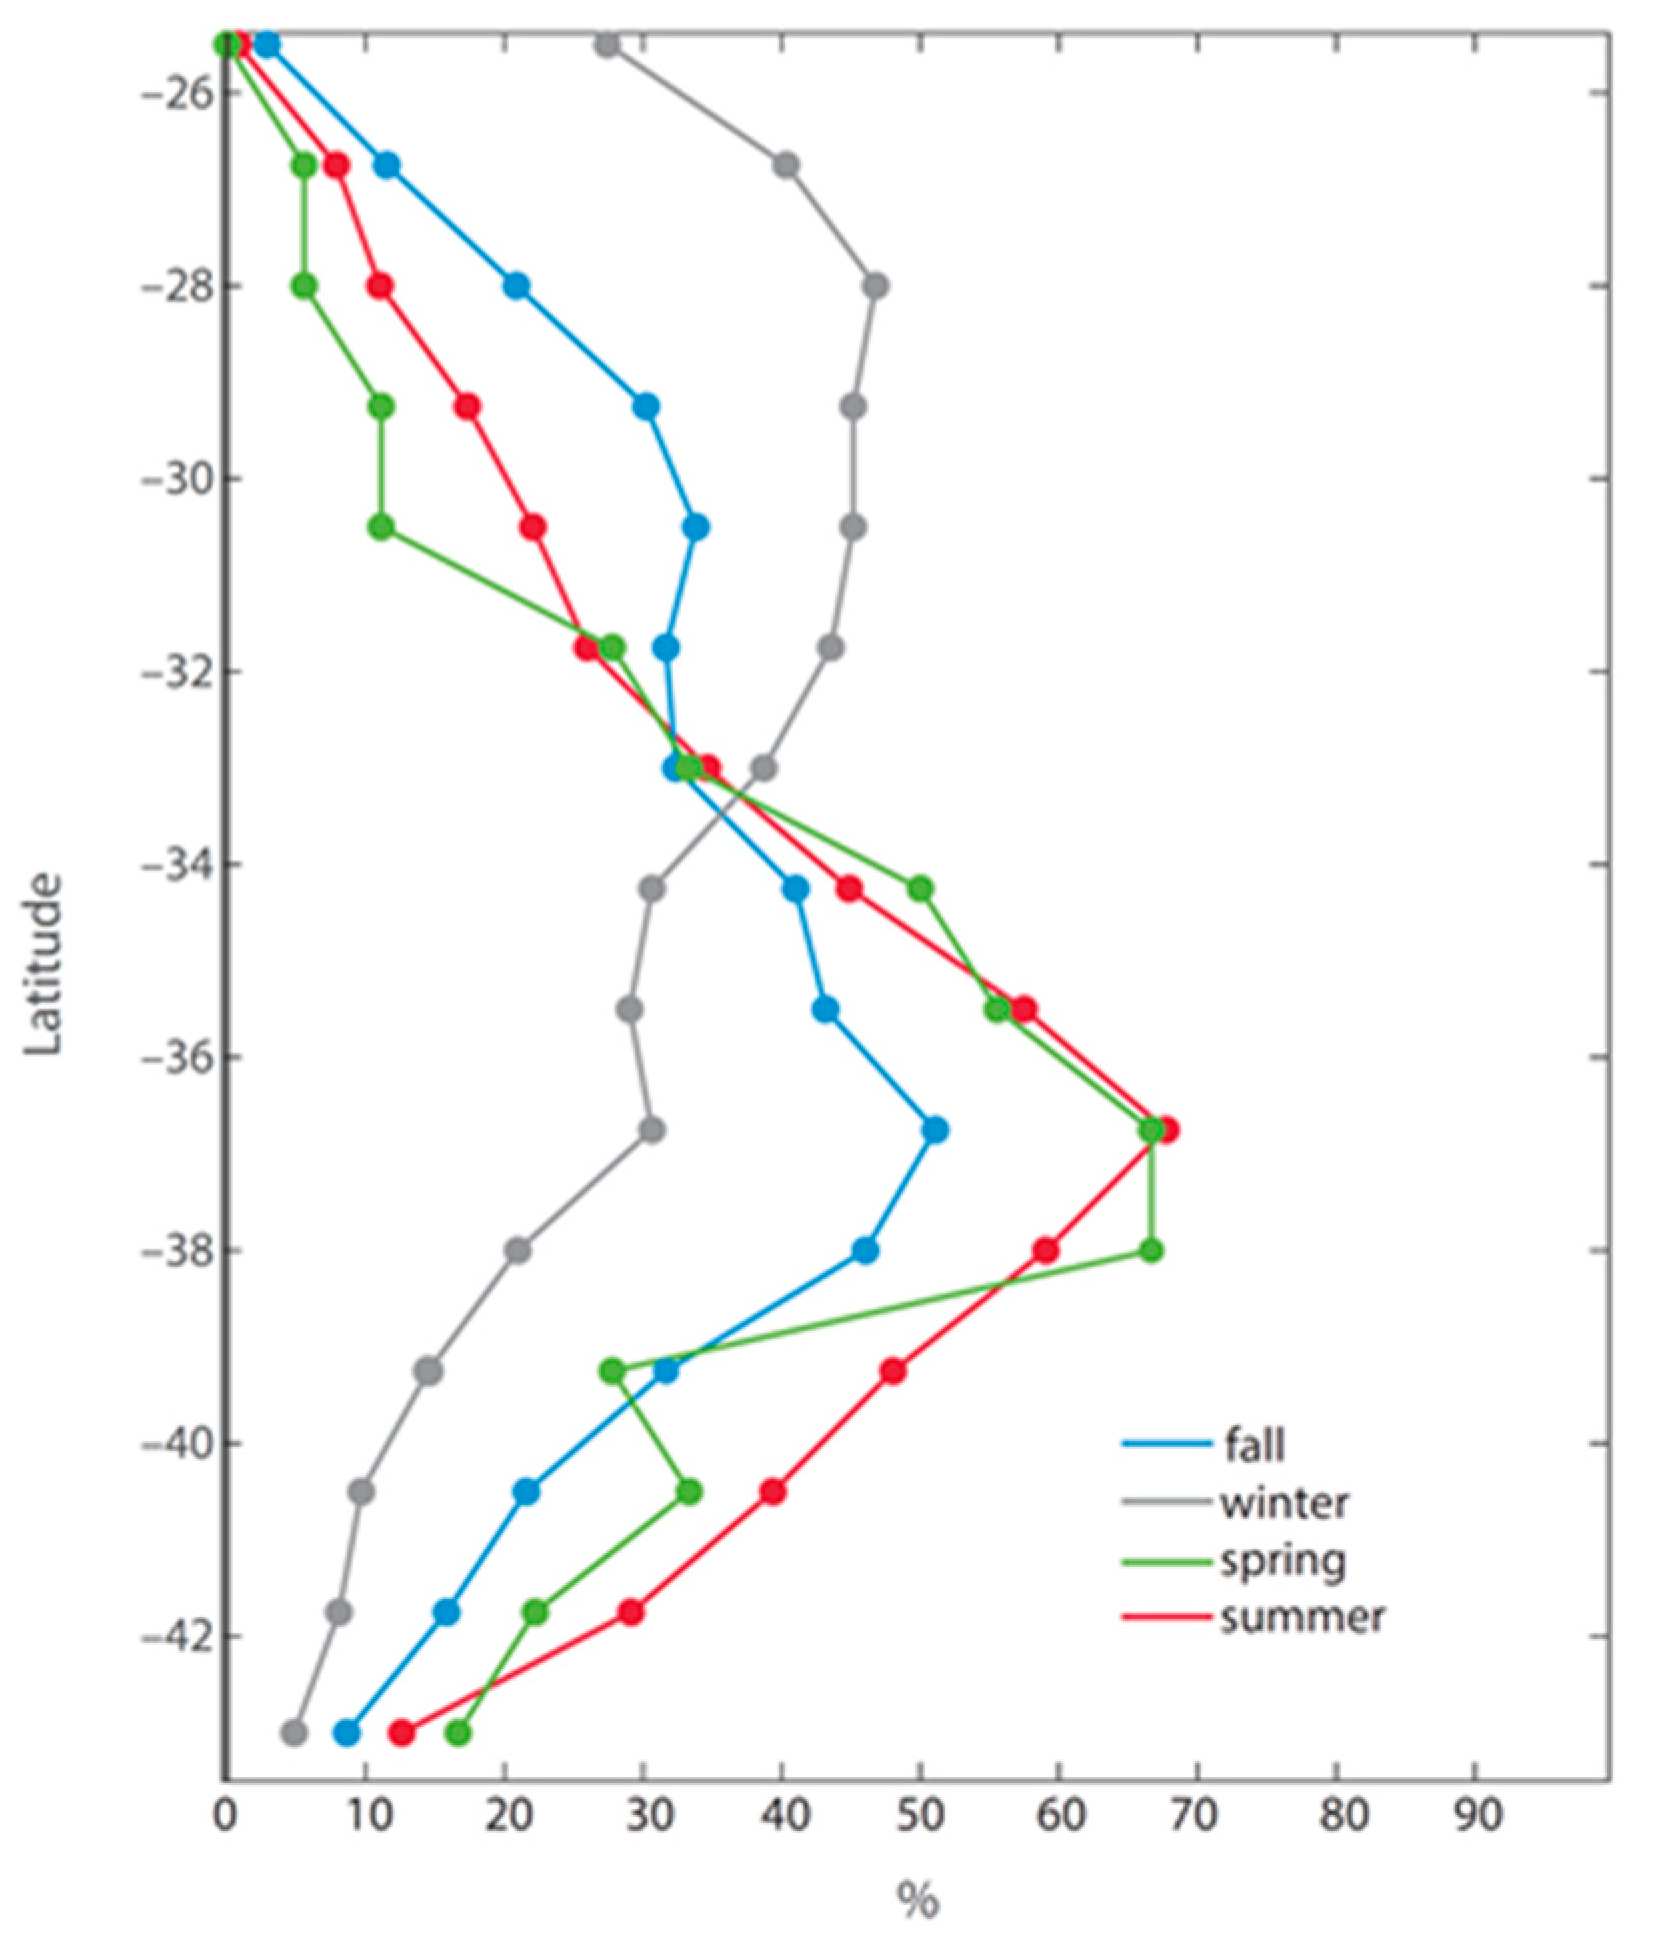
Since strong southerly wind events along the coast of central Chile have been linked to the enhanced alongshore pressure gradient associated with the passage of a migratory anticyclone through southern Chile [1,4,6], we evaluated such a link in the ERA5 reanalysis. We calculated the probability that a Va that exceeds 10 ms−1 occurs along the coast of central Chile when the center of a migratory anticyclone, identified by the tracking software, is located inside the box shown in Figure 1. Results showed that when a migratory anticyclone approaches the coast of Chile, there is a high probability (>90%) that a WDs occurs. To refine this relationship, the same analysis was repeated for winds at different latitudes (Figure 10). As expected, the overall relationship between migratory anticyclones and intense wind events at a particular latitude exhibited lower values. During winter, results showed that when a migratory anticyclone is located within the box there is a probability between 40% and 50% that a strong Va occurs along the coast off central Chile (27–36 °S), this probability being decreasing strongly south of 37 °S. In other seasons, the highest probability was found at 37 °S (Punta Lavapié Cape) with values of 50% during fall, increasing to 70% during spring and summer. In this region where a high probability of strong wind in the presence of a migratory anticyclone was found, a positive trend in CLLJ events has been observed during the last four decades (Section 3.2).
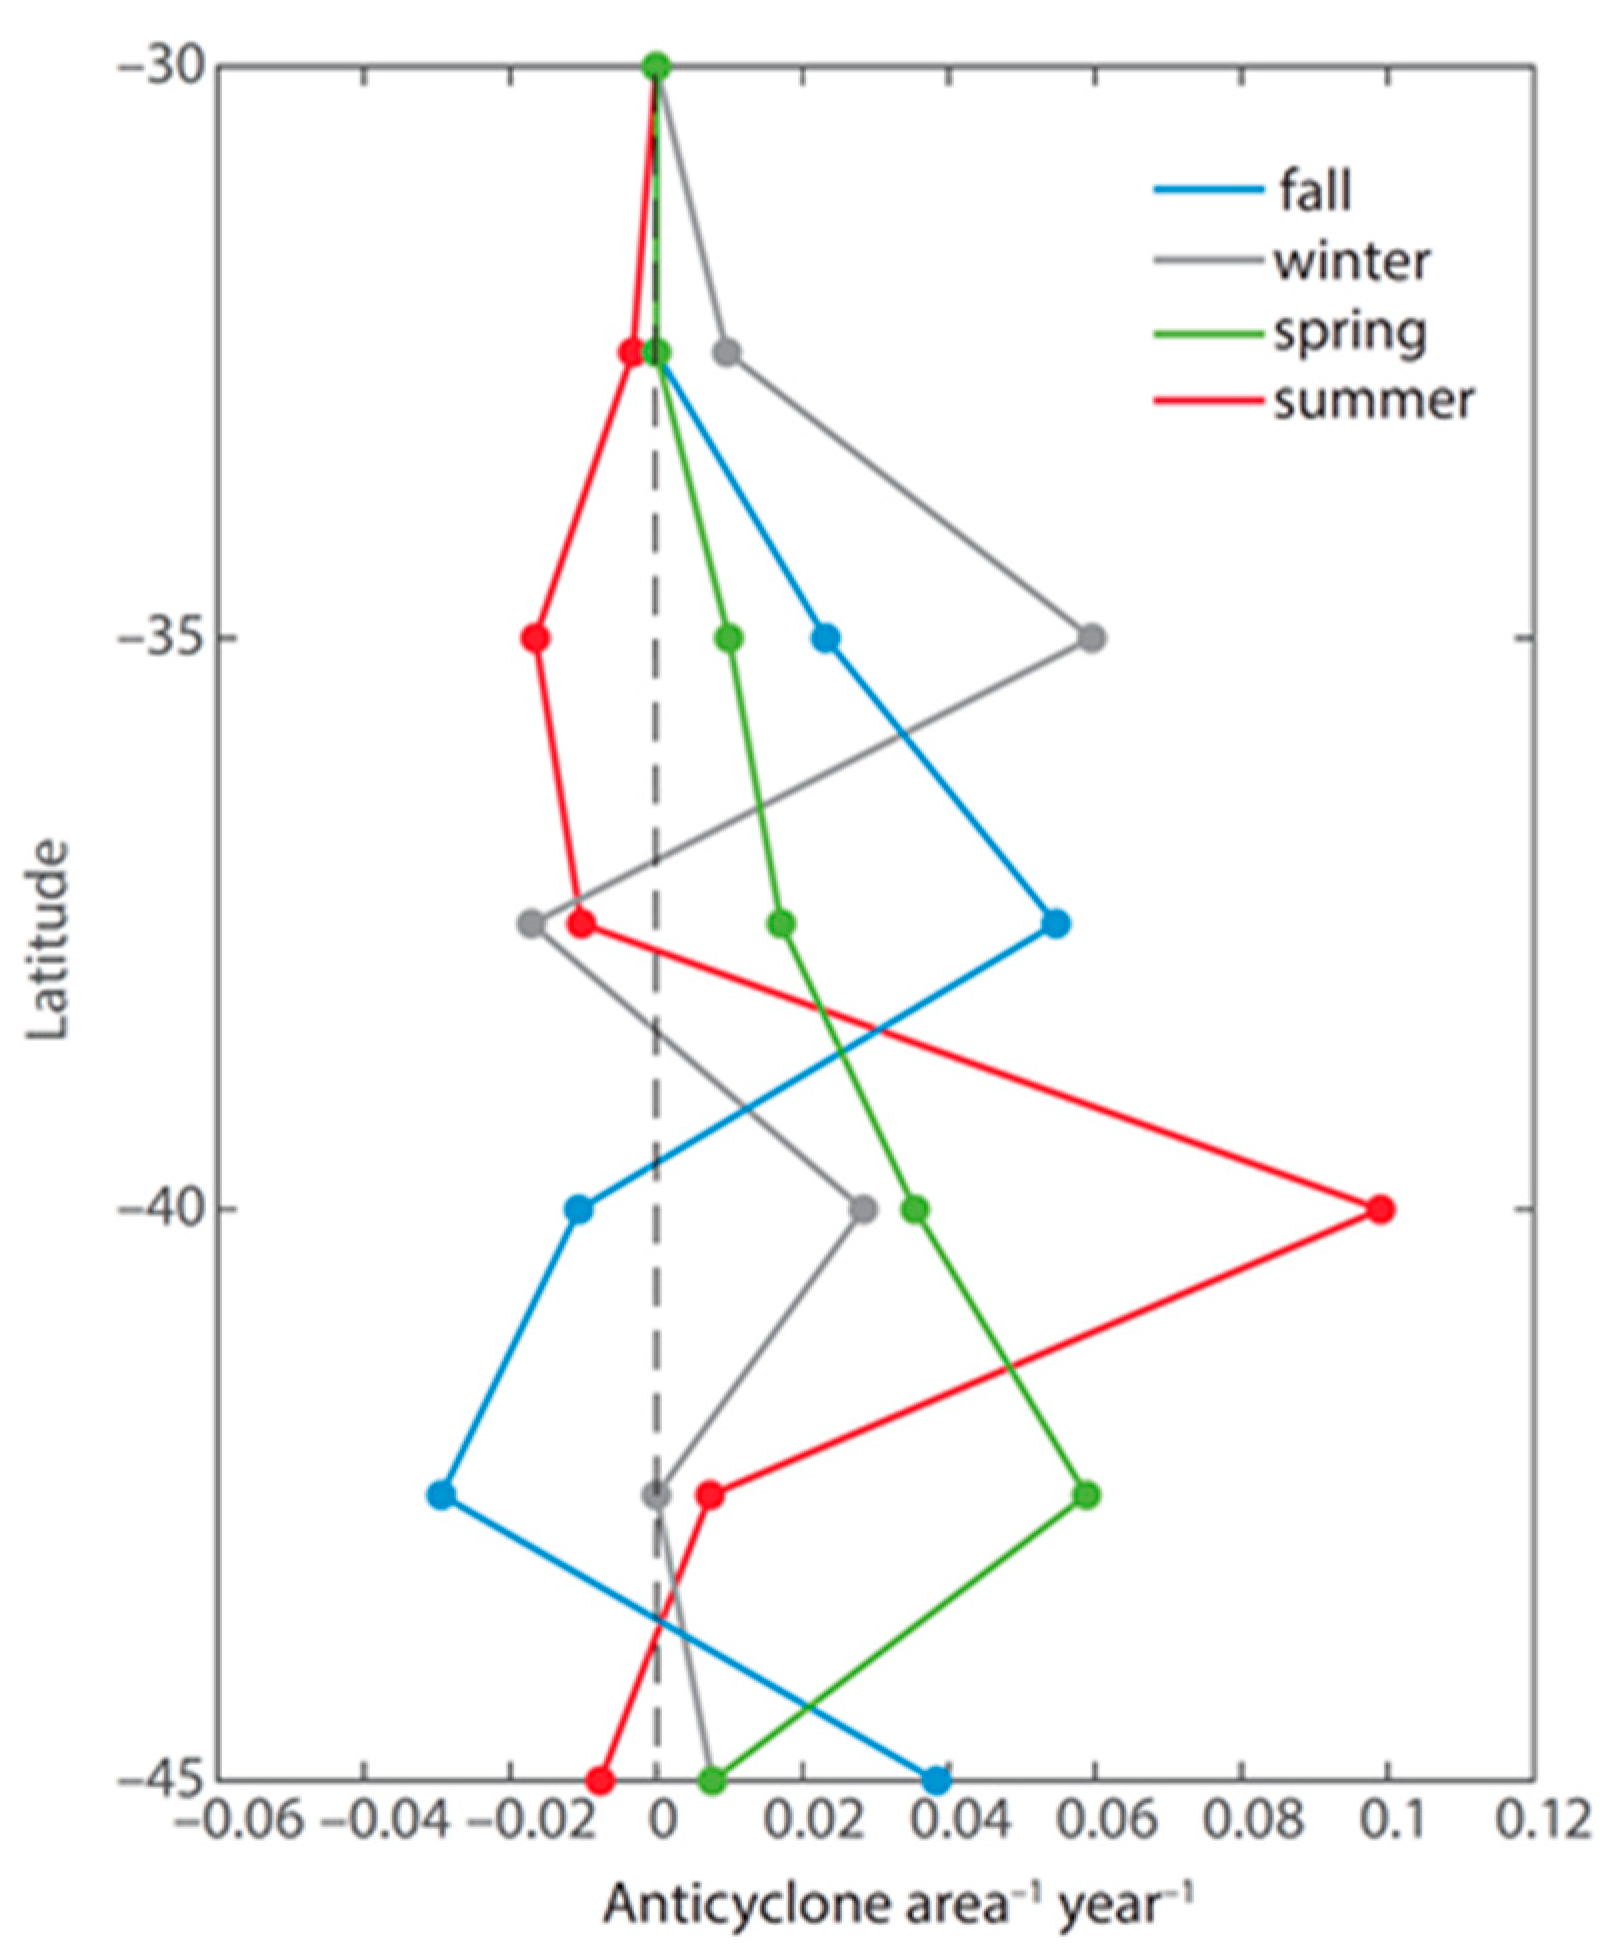
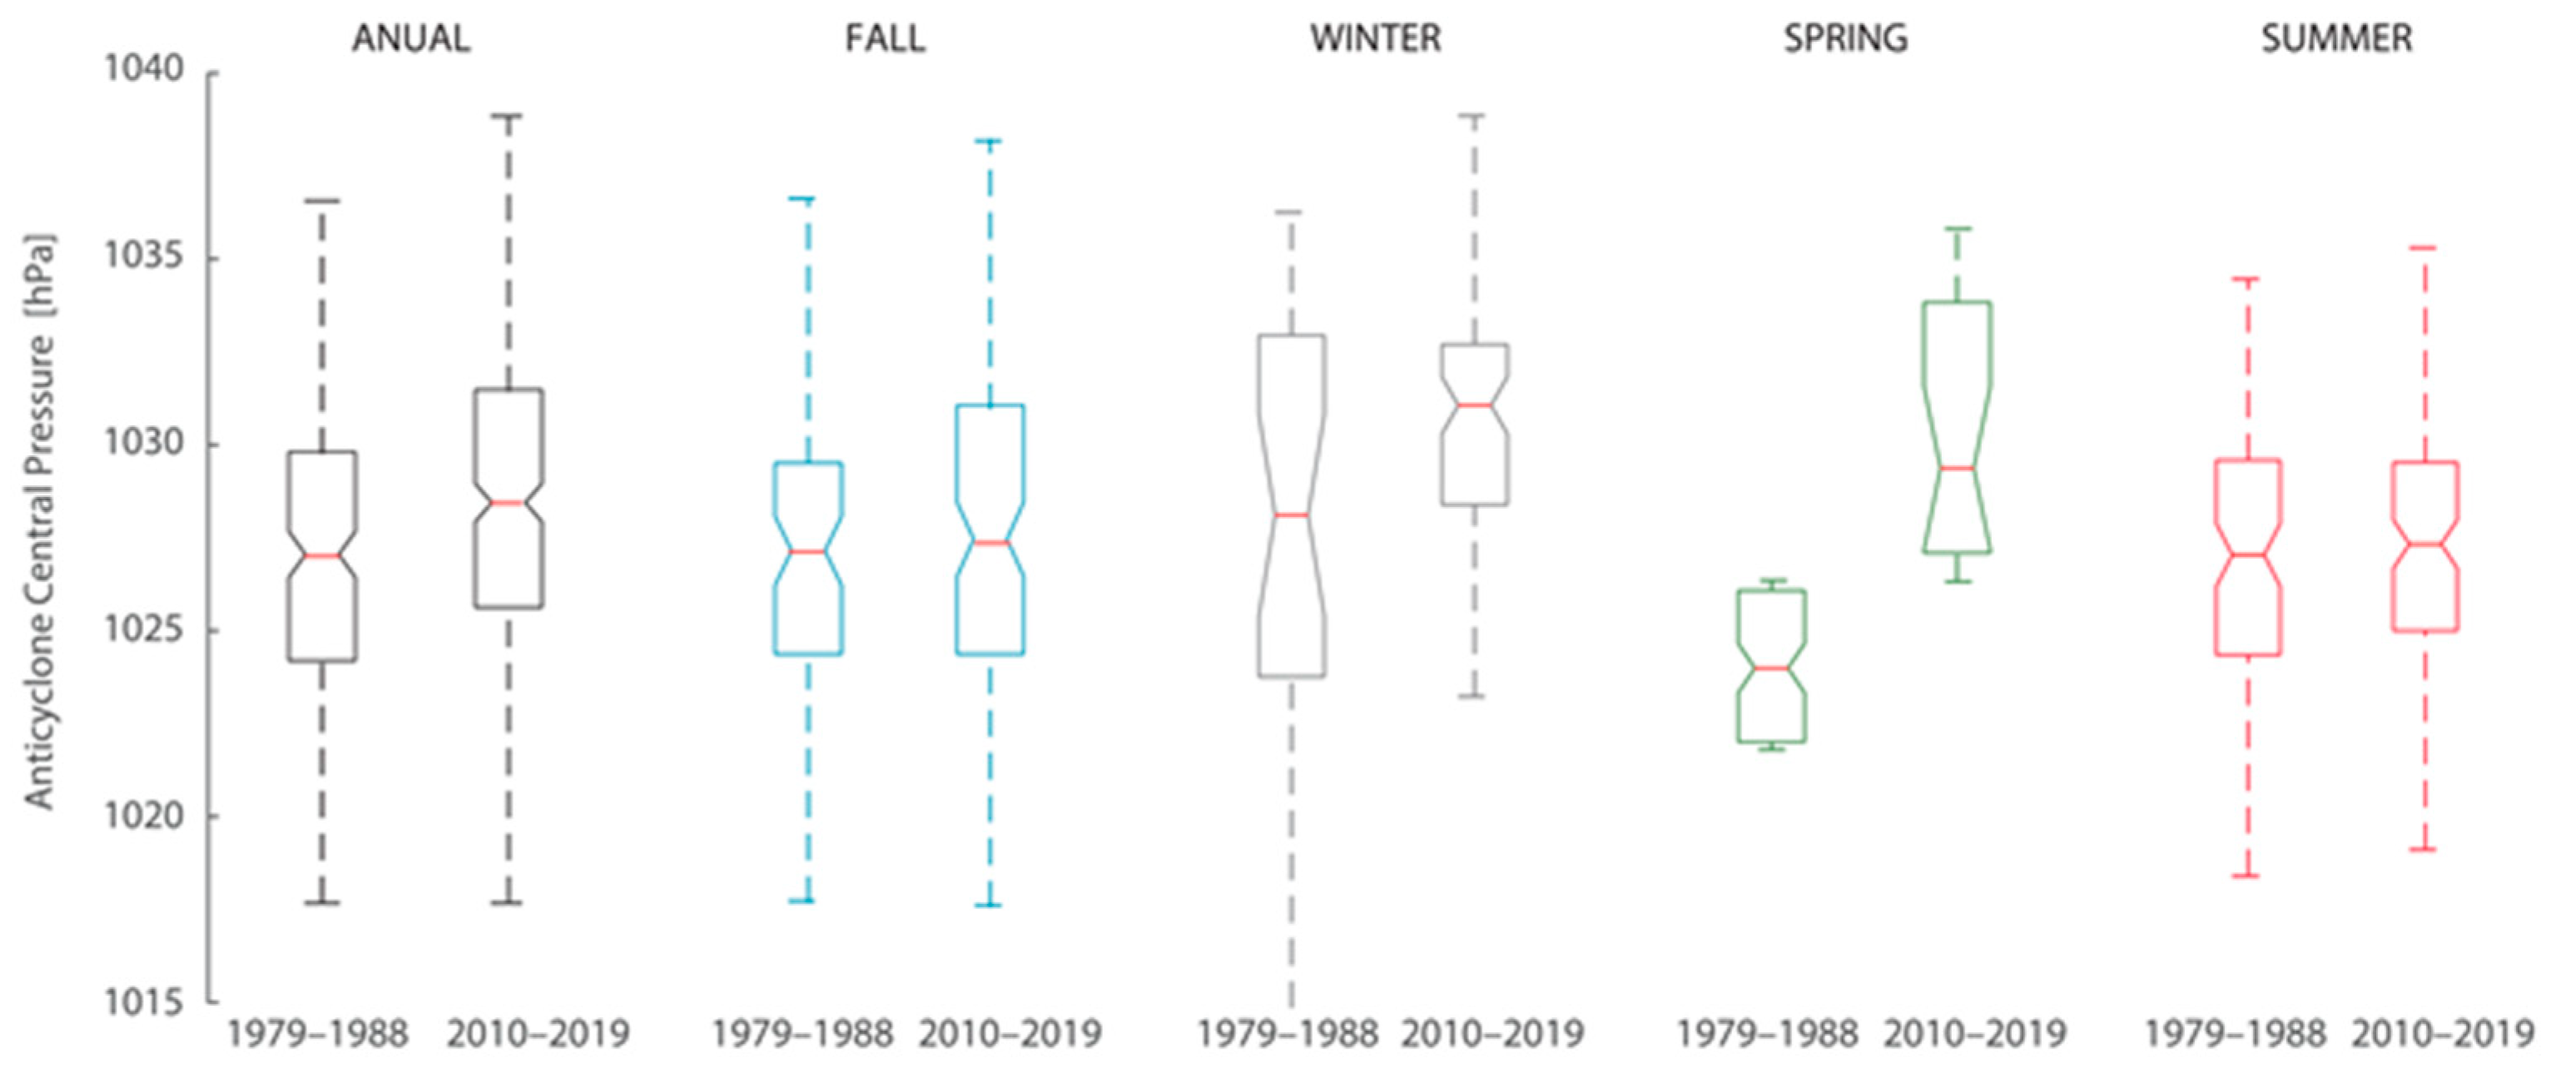
To provide a regional scale picture of changes in migratory anticyclones, Figure 11 shows the difference between the density of the last decade (2000–2019) and the first decade of the data (1979–1988) separately for each season and averaged in longitude in the box shown in Figure 1. An increase in migratory anticyclone density was noticeable during summer around 40 °S, while a slight decrease was observed between 27 °S and 38 °S. Minor changes in density of migratory anticyclones were found during winter without any spatial pattern. Furthermore, a comparison in the distribution of the central SLP in migratory anticyclones between the last decade (2000–2019) and the first decade (1979–1988) of the data is shown in Figure 12. Changes in the central pressures of migratory anticyclones that reach the coast of the Southeast Pacific (box in Figure 1) showed an increase during winter and spring and no major changes during summer and fall. Hence, the observed trends in strong southerly winds and CLLJ events seem to be linked to changes in pressures and frequency of migratory anticyclones at the southwestern coast of South America. The increased coastal winds in the southern part of the study area during summer is then consistent with an increase in migratory anticyclone density, while during winter the observed increase in WDs of intense southerly winds and CLLJ events at the northern region would be more related to an increase in central pressures of migratory anticyclones. These results are consistent with SLP and wind anomalies during the CLLJ events, which show that during the last decade (2000–2019) they were increased compared to the first decade of the data (1979–1988). Figures S2 and S3 show examples of mean anomalies associated with CLLJ centered at Punta Lengua de Vaca (30 °S) and Punta Lavapie, respectively.

4. Discussion

Studies in eastern boundary current systems provide examples of the association between CLLJ and subtropical high-pressure systems, frequently enhanced by the presence of an inland thermal low (e.g., [7]) and that CLLJ events are more frequent during summer [8]. Nevertheless, the most intense southerly wind events observed off central Chile are driven by the alongshore pressure gradient between a coastal low developing in central Chile and a migratory anticyclone drifting eastward farther south [1,5,6]. Therefore, the annual cycle of the strong equatorward winds along the coast is clearly different in the northern and southern part of our study area. Our results are consistent with previous research that have shown the seasonality in the frequency of CLLJ using satellite data [4] and characterized the intense southerly winds at Punta Lengua de Vaca (30 °S) and Punta Lavapié (37 °S) using the Climate Forecast System Reanalysis data [1]. Here, we have shown that strong southerly winds in these two areas have evolved differently in the last four decades. In the northern area the intense alongshore winds have strengthened, particularly in the region (~30 °S) where the maximum winds intensity occurs, and during austral winter. Conversely, the southern area shows no change where the maximum winds occur (~36.5 °S) in summer but shows a decrease in southerly wind events to the north and an increase to the south of 37 °S. These seasonal and spatial patterns of change have also been observed in trends of mean alongshore winds [23,25] and have been mainly attributed to an intensification and poleward expansion of the SPA [22] and to the Bakun’s effect in the northern region [25]. Furthermore, this spatial configuration of the mean and intense alongshore wind trends is like that projected for the Humboldt system under global warming scenarios. Regional projections show an increase in mean upwelling-favorable winds off the Chilean coast south of 35 °S [18,33,34]. This is consistent with results from GCMs that show increased mean alongshore winds at the poleward boundaries of the major coastal upwelling systems. There, the region off south-central Chile stands out as one where major and more robust changes in timing, intensity and spatial distribution of mean alongshore winds occur, when compared to other eastern ocean boundaries [35,36]. Similarly, projections for the Humboldt system for austral summer show a clear increase in the intensity of southerly wind events in the southern region and decrease in the northern area [21,37]. A poleward shift of the SPA explains the strengthening (weakening) of mean southerly winds at high (low) latitudes of the Humboldt upwelling system in climate change projections [34,35], whereas a link between intense southerly events and the passage of migratory anticyclones is observed in the present-day climate and projections, as they become more/less frequent at higher/lower latitudes [1,21]. The trends seen during the last four decades for austral summer strong equatorward winds are expected to be continued throughout the XXI century.
Understanding the response of the coastal ocean to CLLJ events has extensive implications for coastal physics, biogeochemistry, ecology and fisheries. For example, it has been broadly recognized that CLLJ produces intense upwelling-favorable wind events that result in coastal cooling [10,11,12,15]. Thus, the increase in frequency in CLLJ reported here could be, at least partially, related to the observed coastal cooling during the last decades in the Humboldt system [22,24,38]. Furthermore, there are intense high-frequency biogeochemical fluctuations in the surface coastal ocean strongly coupled with CLLJ and associated relaxation wind events. During intense upwelling conditions, the dissolved oxygen and pH decrease, while nutrients and air-sea fluxes of heat and CO2 increase [15,39,40]. The decreasing dissolved oxygen and pH conditions during these intense upwelling events respond mainly to the vertical advection of equatorial subsurface water with dissolved organic matter remineralization products [15,41]. This high-frequency biogeochemical variability can cause changes in the microbiological community and primary production rates, impacting the lower trophic level dynamics [42,43,44]. Hence, the analysis of changes in CLLJ duration is essential to understand the environmental modification along the Humboldt system, which exhibits much more marked and conspicuous spatial and temporal heterogeneity in upwelling intensity and coastal water productivity than previously thought [25].
A long-term study of anticyclone variability through reanalysis products reveals their dependency on the southern annular mode (SAM) in the southern hemisphere. According to [30], strong trends over recent decades in anticyclone frequency have been observed in several reanalysis datasets at the southern hemisphere, and ERA5 in particular shows an increase in migratory anticyclone density (Figure S4). These changes can be partially attributed to changes in SAM, particularly during summer [30]. This spatial pattern is similar to the differences we found in the density of migratory anticyclones during summer, suggesting that latitudinal changes in migratory anticyclone density (and then in CLLJ) would be related to positive trends of SAM observed during the last decades, particularly during austral summer. This SAM behavior has been attributed to stratospheric ozone depletion and increased greenhouse gas concentrations [45,46]. It is relevant to note that the increase in wind speed in the southern portion of the Humboldt system shows a robust trend in several reanalysis datasets [27]. Particularly, the summer changes in upwelling-favorable wind occurrences provide a key mechanism for changes in the coastal waters of western Patagonia. For example, during the austral summer of 2016, a harmful algae bloom (HAB) developed close to Chiloé Island, generating economic losses and sanitary problems [47]. This HAB coincided with a strong El Niño event and an extreme positive phase of the SAM that altered the atmospheric circulation in southern South America, leading to positive anomalies in upwelling-favorable winds south of 40 °S and higher than normal solar radiation reaching the surface [48,49]. Hence, the positive trends in upwelling-favorable wind events found here in the southern Humboldt system could be contributing to the increase of HAB events in this region.
Understanding the origin of the present-day changes in southerly wind intensity is also especially relevant in the interpretation of paleoclimate records of eolian particles—a direct proxy for wind intensity (e.g., [50]). Along this line, several high-resolution paleoclimate studies have been carried out with the aim of reconstructing changes in the equatorward, alongshore winds in the coastal area of the Humboldt system (e.g., [51,52,53,54,55]). Two of these reconstructions [54,55], based on eolian lithic particles found on marine laminated sediments, emphasize the intensification of these alongshore winds in recent decades [37]. Our results provide new insights on the origin and variability of the alongshore wind intensity contributing to revisiting paleowind reconstructions in southwestern South America.

5. Conclusions

Based on 41 years of SLP and wind at a height of 10 m above sea level in the ERA5 reanalysis data along the southwestern coast of South America (25–43 °S), we have documented that, embedded within the strong variability at interannual time scales, significant long-term trends exist in the number of days with intense equatorward winds (i.e., > 10 ms−1) and in the number and duration of CLLJ events in recent decades. We have placed particular emphasis on a seasonal and latitudinal characterization of trends. An increase in the number of days with intense southerly winds and number of CLLJs events over the whole study area during winter contrasts during summer with a decrease in the number of days with intense southerly winds at lower latitudes (29–34 °S), and an increase farther south, particularly between 37 °S and 44 °S. During fall, an increase in the number of days with intense southerly winds and CLLJs events is observed between 32 °S and 39 °S.
Using an objective algorithm to track anticyclones, we have associated the passage of a migratory anticyclone through the southern portion of the study area with a high probability that an intense wind event occurs along the coast of central Chile on account of a temporary enhancement of the alongshore SLP gradient there, as stated originally in [1,5,6]. Thus, we suggest that changes in extratropical, synoptic-scale migratory anticyclones that reach the coast of South America and force CLLJs events could play an important role in recent trends observed in CLLJ in this region. In particular, the increase in the central surface pressure of migratory anticyclones observed during winter could explain the increase in the strength of CLLJs events. On the other hand, the increase in density of migratory anticyclones observed during summer at about 40 °S could explain the increase in the frequency of CLLJs events in the southern part of the study area. These results highlight the need to include extratropical processes to explain changes in the CLLJs in this coastal upwelling system, and that these changes complement large-scale tropical processes such as the poleward shift of the SPA during the last decades found in previous studies.

Supplementary Materials

The following are available online at https://www.mdpi.com/article/10.3390/atmos12040465/s1.

Author Contributions

C.A. and V.F.-A. conceived the idea, with the help of J.A.R. and R.G. C.A., P.V. and A.V. analyzed the data. C.A. and V.F.-A. wrote the paper with contributions from J.A.R. and R.G. All authors have read and agreed to the published version of the manuscript.

Funding

Catalina Aguirre and René Garreaud are sponsored by FONDAP-CONICYT 15110009. Catalina Aguirre and Pablo Vilches acknowledge support of Fondecyt, grant no. 11171163. Valentina Flores-Aqueveque and Alicia Vásquez were supported by Fondecyt, grant no. 1191942. Valentina Flores-Aqueveque is also sponsored by the Climate cHAnge, vaRIability and assesS of extreme events impacts on fragile ecosystems in western coast of AMericA (Colombian, Peru, and Chile): bringing paleoenvironmental evidence to reduce uncertainties (CHARISMA) project (Institute de Recherche pour le Développement; IRD-Jeunes Équipes Associées à l’IRD program). Catalina Aguirre and José A. Rutllant were funded by the Agencia Nacional de Investigación y Desarrollo (ANID) Millennium Science Initiative Program-NCN19-153.

Institutional Review Board Statement

Not applicable.

Informed Consent Statement

Not applicable.

Data Availability Statement

The ERA5 reanalysis analyzed in this study is available online at https://climate.copernicus.eu/climate-reanalysis.

Acknowledgments

We acknowledge the European Centre for Medium-Range Weather Forecast (ECMWF), which is responsible for ERA5 reanalysis. We also acknowledge the meteorological station data provided by the Meteorological Service of the Chilean Navy (Dirección General del Territorio Marítimo y de Marina Mercante, DIRECTEMAR) and the Center for Advanced Studies in Arid Zones (Centro de Estudios Avanzados en Zonas Áridas, CEAZA). We thank Centre d’Exploitation et de Recherche Satellitaire d’Archivage et de Traitement (CERSAT) for providing the SeaWinds data. This research was partially supported by the supercomputing infrastructure of the National Laboratory of High Performance Computing (NLHPC-ECM-02).

Conflicts of Interest

The authors declare no conflict of interest.

References

  1. Rahn, D.A.; Garreaud, R.D. A synoptic climatology of the near-surface wind along the west coast of South America. Int. J. Clim. 2014, 34, 780–792. [Google Scholar] [CrossRef]
  2. Sobarzo, M.; Bravo, L.; Donoso, D.; Garcés-Vargas, J.; Schneider, W. Coastal upwelling and seasonal cycles that influence the water column over the continental shelf off central Chile. Prog. Oceanogr. 2007, 75, 363–382. [Google Scholar] [CrossRef]
  3. Pizarro, O.; Hormazábal, S.; González, A.; Yañez, E. Variabilidad del viento, nivel del mar y temperatura en la costa norte de Chile. Investig. Mar. 1994, 22, 85–101. [Google Scholar] [CrossRef]
  4. Garreaud, R.; Muñoz, R. The low-level jet off the subtropical west coast of South America: Structure and variability. Mon. Weather Rev. 2005, 133, 2246–2261. [Google Scholar] [CrossRef] [Green Version]
  5. Garreaud, R.; Rutllant, J.; Fuenzalida, H. Coastal lows in north-central Chile: Mean structure and evolution. Mon. Weather Rev. 2002, 130, 75–88. [Google Scholar] [CrossRef] [Green Version]
  6. Muñoz, R.; Garreaud, R. Dynamics of the low-level jet off the west coast of subtropical South America. Mon. Weather Rev. 2005, 133, 3661–3677. [Google Scholar] [CrossRef]
  7. García-Reyes, M.; Sydeman, W.J.; Black, B.A.; Rykaczewski, R.R.; Schoeman, D.S.; Thompson, S.A.; Bograd, S.J. Relative influence of oceanic and terrestrial pressure systems in driving upwelling-favorable winds. Geophys. Res. Lett. 2013, 40, 5311–5315. [Google Scholar] [CrossRef] [Green Version]
  8. Lima, D.C.A.; Soares, P.M.M.; Semedo, A.; Cardoso, R.M. A global view of coastal low-level wind jets using an ensemble of reanalyses. J. Clim. 2018, 31, 1525–1546. [Google Scholar] [CrossRef]
  9. Aguirre, C.; Pizarro, O.; Strub, P.T.; Garreaud, R.; Barth, J. Seasonal dynamics of the near-surface alongshore flow off central Chile. J. Geophys. Res. 2012, 117, C01006. [Google Scholar] [CrossRef] [Green Version]
  10. Aguirre, C.; Garreaud, R.D.; Rutllant, J.A. Surface ocean response to synoptic-scale variability in wind stress and heat fluxes off south-central Chile. Dyn. Atmos. Ocean. 2014, 65, 64–85. [Google Scholar] [CrossRef] [Green Version]
  11. Renault, L.; Dewitte, B.; Falvey, M.; Garreaud, R.; Echevin, V.; Bonjean, F. Impact of the atmospheric coastal jet off central Chile on sea surface temperature from satellite observations (2000–2007). J. Geophys. Res. 2009, 114, C08006. [Google Scholar] [CrossRef] [Green Version]
  12. Renault, L.; Dewitte, B.; Marchesiello, P.; Illig, S.; Echevin, V.; Cambon, G.; Ramos, M.; Astudillo, O.; Minnis, P.; Ayers, K. Upwelling response to atmospheric coastal jets off central Chile: A modeling study of the October 2000 event. J. Geophys. Res. 2012, 117, C02030. [Google Scholar] [CrossRef] [Green Version]
  13. Semedo, A.; Suselj, K.; Rutgersson, A.; Sterl, A. A global view on the wind sea and swell climate and variability from ERA-40. J. Clim. 2011, 24, 1461–1479. [Google Scholar] [CrossRef]
  14. Aguirre, C.; Rutllant, J.A.; Falvey, M. Wind waves climatology of the Southeast Pacific Ocean. Int. J. Clim. 2017, 37, 4288–4301. [Google Scholar] [CrossRef]
  15. Ramajo, L.; Valladares, M.; Astudillo, O.; Fernández, C.; Rodríguez-Navarro, B.A.; Watt-Arévalo, P.; Núñez, M.; Grenier, C.; Román, R.; Aguayo, P.; et al. Upwelling intensity modulates the fitness and physiological performance of coastal species: Implications for the aquaculture of the scallop Argopecten purpuratus in the Humboldt Current System. Sci. Total Environ. 2020. [Google Scholar] [CrossRef] [PubMed]
  16. Huyer, A.; Smith, R.L.; Paluszkiewicz, T. Coastal upwelling off Peru during normal and El Niño times, 1981–1984. J. Geophys. Res. 1987, 92, 14297–14307. [Google Scholar] [CrossRef]
  17. Garreaud, R.; Rutllant, J.A.; Muñoz, R.; Rahn, D.; Ramos, M.; Figueroa, D. VOCALS-CUpEx: The Chilean Upwelling Experiment. Atmos. Chem. Phys. 2011, 11, 2015–2029. [Google Scholar] [CrossRef] [Green Version]
  18. Garreaud, R.; Falvey, M. The coastal winds off western subtropical South America in future climate scenarios. Int. J. Clim. 2009, 29, 543–554. [Google Scholar] [CrossRef]
  19. Semedo, A.; Soares, P.M.M.; Lima, D.C.A.; Cardoso, R.M.; Bernardino, M.; Miranda, P.M.A. The impact of climate change on the global coastal low-level wind jets: EC-EARTH simulations. Glob. Planet. Chang. 2016, 137, 88–106. [Google Scholar] [CrossRef]
  20. Soares, P.M.M.; Lima, D.C.A.; Cardoso, R.M.; Semedo, A. High resolution projections for the western Iberian coastal low level jet in a changing climate. Clim. Dyn. 2016, 49, 1547–1566. [Google Scholar] [CrossRef]
  21. Aguirre, C.; Rojas, M.; Garreaud, R.D.; Rahn, D. Role of synoptic activity on projected changes in upwelling-favourable winds at the ocean’s eastern boundaries. NPJ Clim. Atmos. Sci. 2019, 2, 44. [Google Scholar] [CrossRef]
  22. Schneider, W.; Donoso, D.; Garcés-Vargas, J.; Escribano, R. Water-column cooling and sea surface salinity increase in the upwelling region off central-south Chile driven by a poleward displacement of the South Pacific High. Prog. Oceanogr. 2017, 151, 38–48. [Google Scholar] [CrossRef]
  23. Aguirre, C.; García-Loyola, S.; Testa, G.; Silva, D.; Farias, L. Insight into anthropogenic forcing on coastal upwelling off south-central Chile. Elem. Sci. Anth. 2018, 6, 59. [Google Scholar] [CrossRef]
  24. Winckler, P.; Aguirre, C.; Farías, L.; Contreras-López, M.; Masotti, I. Evidence of climate-driven changes on atmospheric, hydrological, and oceanographic variables along the Chilean coastal zone. Clim. Chang. 2020, 163, 633–652. [Google Scholar] [CrossRef]
  25. Weidberg, N.; Ospina-Alvarez, A.; Bonicelli, J.; Barahona, M.; Aiken, C.; Broitman, B.; Navarrete, S. Spatial shifts in productivity of the coastal ocean over the past two decades induced by migration of the Pacific Anticyclone and Bakun’s effect in the Humboldt Upwelling Ecosystem. Glob. Planet. Chang. 2020, 193, 103259. [Google Scholar] [CrossRef]
  26. Hersbach, H.; Bell, B.; Berrisford, P.; Hirahara, S.; Horányi, A.; Muñoz-Sabater, J.; Nicolas, J.; Peubey, C.; Radu, R.; Schepers, D.; et al. The ERA5 global reanalysis. Q. J. R. Meteorol. Soc. 2020, 146, 1999–2049. [Google Scholar] [CrossRef]
  27. Ramon, J.; Lledó, L.; Torralba, V.; Soret, A.; Doblas-Reyes, F.J. What global reanalysis best represents near-surface winds? Q. J. R. Meteorol. Soc. 2019, 145, 3236–3251. [Google Scholar] [CrossRef] [Green Version]
  28. Simmonds, I.; Keay, K. Mean Southern Hemisphere Extratropical Cyclone Behavior in the 40-Year NCEP–NCAR Reanalysis. J. Clim. 2000, 13, 873–885. [Google Scholar] [CrossRef]
  29. Grieger, J.; Leckebusch, G.C.; Donat, M.G.; Schuster, M.; Ulbrich, U. Southern Hemisphere winter cyclone activity under recent and future climate conditions in multi-model AOGCM simulations. Int. J. Climatol. 2014, 34, 3400–3416. [Google Scholar] [CrossRef]
  30. Pepler, A.; Dowdy, A.; Hope, P. A global climatology of surface anticyclones, their variability, associated drivers and long-term trends. Clim. Dyn. 2019, 52, 5397–5412. [Google Scholar] [CrossRef]
  31. Pepler, A.; Dowdy, A.; van Rensch, P.; Rudeva, I.; Catto, J.; Hope, P. The contributions of fronts, lows and thunderstorms to southern Australian rainfall. Clim. Dyn. 2020, 55, 1489–1505. [Google Scholar] [CrossRef]
  32. Sato, K.; Inoue, J.; Simmonds, I.; Rudeva, I. Antarctic Peninsula warm winters influenced by Tasman Sea temperatures. Nat. Commun. 2021, 12, 1497. [Google Scholar] [CrossRef]
  33. Goubanova, K.; Echevin, V.; Dewitte, B.; Codron, F.; Takahashi, K.; Terray, P.; Vrac, M. Statistical downscaling of sea-surface wind over the Peru–Chile upwelling region: Diagnosing the impact of climate change from the IPSL-CM4 model. Clim. Dyn. 2011, 36, 1365–1378. [Google Scholar] [CrossRef]
  34. Belmadani, A.; Echevin, V.; Codron, F.; Takahashi, K.; Junquas, C. What dynamics drive future wind scenarios for coastal upwelling off Peru and Chile? Clim. Dyn. 2013, 43, 1893–1914. [Google Scholar] [CrossRef]
  35. Rykaczewski, R.R.; Dunne, J.P.; Sydeman, W.J.; García-Reyes, M.; Black, B.A.; Bograd, S.J. Poleward displacement of coastal upwelling-favorable winds in the ocean’s eastern boundary currents through the 21st century. Geophys. Res. Lett. 2015, 42, 6424–6431. [Google Scholar] [CrossRef]
  36. Wang, D.; Gouhier, T.C.; Menge, B.A.; Ganguly, A.R. Intensification and spatial homogenization of coastal upwelling under climate change. Nature 2015, 518, 390–394. [Google Scholar] [CrossRef]
  37. Flores-Aqueveque, V.; Rojas, M.; Aguirre, C.; Arias, P.; González, C. South Pacific Subtropical High from the late Holocene to the end of the 21st century: Insights from climate proxies and general circulation models. Clim. Past 2020, 16, 79–99. [Google Scholar] [CrossRef] [Green Version]
  38. Falvey, M.; Garreaud, R. Regional cooling in a warming world: Recent temperature trends in the SE Pacific and along the west coast of subtropical South America (1979–2006). J. Geophys. Res. 2009, 114, D04102. [Google Scholar] [CrossRef]
  39. Torres, R.; Turner, D.R.; Silva, N.; Rutllant, J. High short-term variability of CO2 fluxes during an upwelling event off the Chilean coast at 30 °S. Deep Sea Res. Part I Oceanogr. Res. Pap. 1999, 46, 1161–1179. [Google Scholar] [CrossRef]
  40. Torres, R.; Turner, D.; Rutllant, J.; Sobarzo, M.; Antezana, T.; E Gonzalez, H. CO2 outgassing off central Chile (31–30 °S) and northern Chile (24–23°S) during austral summer 1997: The effect of wind intensity on the upwelling and ventilation of CO2-rich waters. Deep Sea Res. Part I Oceanogr. Res. Pap. 2002, 49, 1413–1429. [Google Scholar] [CrossRef]
  41. Silva, N.; Rojas, N.; Fedele, A. Water masses in the Humboldt Current System: Properties, distribution, and the nitrate deficit as a chemical water mass tracer for Equatorial Subsurface Water off Chile. Deep Sea Res. Part II Top. Stud. Oceanogr. 2009, 56, 1004–1020. [Google Scholar] [CrossRef]
  42. Rutllant, J.; Montecino, V. Multiscale upwelling forcing cycles and biological response off north-central Chile. Rev. Chil. Hist. Nat. 2002, 75, 217–231. [Google Scholar] [CrossRef] [Green Version]
  43. Aguilera, V.; Escribano, R.; Herrera, L. High frequency responses of nanoplankton and microplankton to wind-driven upwelling off northern Chile. J. Mar. Syst. 2009, 78, 124–135. [Google Scholar] [CrossRef]
  44. Testa, G.; Masotti, I.; Farías, L. Temporal Variability in Net Primary Production in an Upwelling Area off Central Chile (36 °S). Front. Mar. Sci. 2018, 5. [Google Scholar] [CrossRef]
  45. Gillett, N.P.; Fyfe, J.C.; Parker, D.E. Attribution of observed sea level pressure trends to greenhouse gas, aerosol, and ozone changes. Geophys. Res. Lett. 2013, 40, 2302–2306. [Google Scholar] [CrossRef]
  46. Jones, J.M.; Gille, S.T.; Goosse, H.; Abram, N.J.; Canziani, P.O.; Charman, D.J.; Clem, K.R.; Crosta, X.; de Lavergne, C.; Eisenman, I.; et al. Assessing recent trends in high-latitude Southern Hemisphere surface climate. Nat. Clim. Chang. 2016, 6, 917–926. [Google Scholar] [CrossRef]
  47. Clément, A.; Lincoqueo, L.; Saldivia, M.; Brito, C.G.; Muñoz, F.; Fernández, C.; Pérez, F.; Maluje, C.P.; Correa, N.; Moncada, V.; et al. Exceptional Summer Conditions and HABs of Pseudochattonella in Southern Chile Create Record Impacts on Salmon Farms. Harmful Algae News 2016, 53, 1–3. [Google Scholar]
  48. Jacob, B.; Tapia, F.; Quiñones, R.; Montes, R.; Sobarzo, M.; Schneider, W.; Daneri, G.; Morales, C.; Montero, P.; González, H. Major changes in diatom abundance, productivity, and net community metabolism in a windier and dryer coastal climate in the southern Humboldt Current. Prog. Oceanogr. 2018, 168, 196–209. [Google Scholar] [CrossRef]
  49. León-Muñoz, J.; Urbina, M.A.; Garreaud, R.; Iriarte, J.L. Hydroclimatic conditions trigger record harmful algal bloom in western Patagonia (summer 2016). Sci. Rep. 2018, 8, 1330. [Google Scholar] [CrossRef] [Green Version]
  50. Alfaro, S.; Flores-Aqueveque, V.; Foret, G.; Caquineau, S.; Vargas, G.; Rutllant, J. A simple model accounting for the uptake, transport, and deposition of wind eroded mineral particles in the hyperarid coastal Atacama Desert of northern Chile. Earth Surf. Process. Landf. 2011, 36, 923–932. [Google Scholar] [CrossRef]
  51. Siffedine, A.; Gutiérrez, D.; Ortlieb, L.; Boucher, H.; Velazco, F.; Field, D.; Vargas, G.; Boussafire, M.; Salvatteci, R.; Ferreira, V.; et al. Laminated sediments from the central Peruvian continental slope: A 500-year record of upwelling system productivity, terrestrial runoff and redox conditions. Prog. Oceanogr. 2008, 79, 190–197. [Google Scholar] [CrossRef] [Green Version]
  52. Gutiérrez, D.; Sifeddine, A.; Field, D.B.; Ortlieb, L.; Vargas, G.; Chávez, F.P.; Velazco, F.; Ferreira, V.; Tapia, P.; Salvatteci, R.; et al. Rapid reorganization in ocean biogeochemistry off Peru towards the end of the Little Ice Age. Biogeosciences 2009, 6, 835–848. [Google Scholar] [CrossRef] [Green Version]
  53. Salvatteci, R.; Gutiérrez, D.; Field, D.; Sifeddine, A.; Ortlieb, L.; Bouloubassi, I.; Boussafir, M.; Boucher, H.; Cetin, F. The response of the Peruvian Upwelling Ecosystem to centennial-scale global change during the last two millennia. Clim. Past 2014, 10, 715–731. [Google Scholar] [CrossRef] [Green Version]
  54. Flores-Aqueveque, V.; Alfaro, S.; Vargas, G.; Rutllant, J.A.; Caquineau, S. Aeolian particles in marine cores as a tool for quantitative high-resolution reconstruction of upwelling favorable winds along coastal Atacama Desert, Northern Chile. Prog. Oceanogr. 2015, 134, 244–255. [Google Scholar] [CrossRef]
  55. Briceño-Zuluaga, F.J.; Sifeddine, A.; Caquineau, S.; Cardich, J.; Salvatteci, R.; Gutierrez, D.; Ortlieb, L.; Velazco, F.; Boucher, H.; Machado, C. Terrigenous material supply to the Peruvian, central continental shelf (Pisco, 14 °S) during the last 1000 years: Paleoclimatic implications. Clim. Past 2016, 12, 787–798. [Google Scholar] [CrossRef] [Green Version]
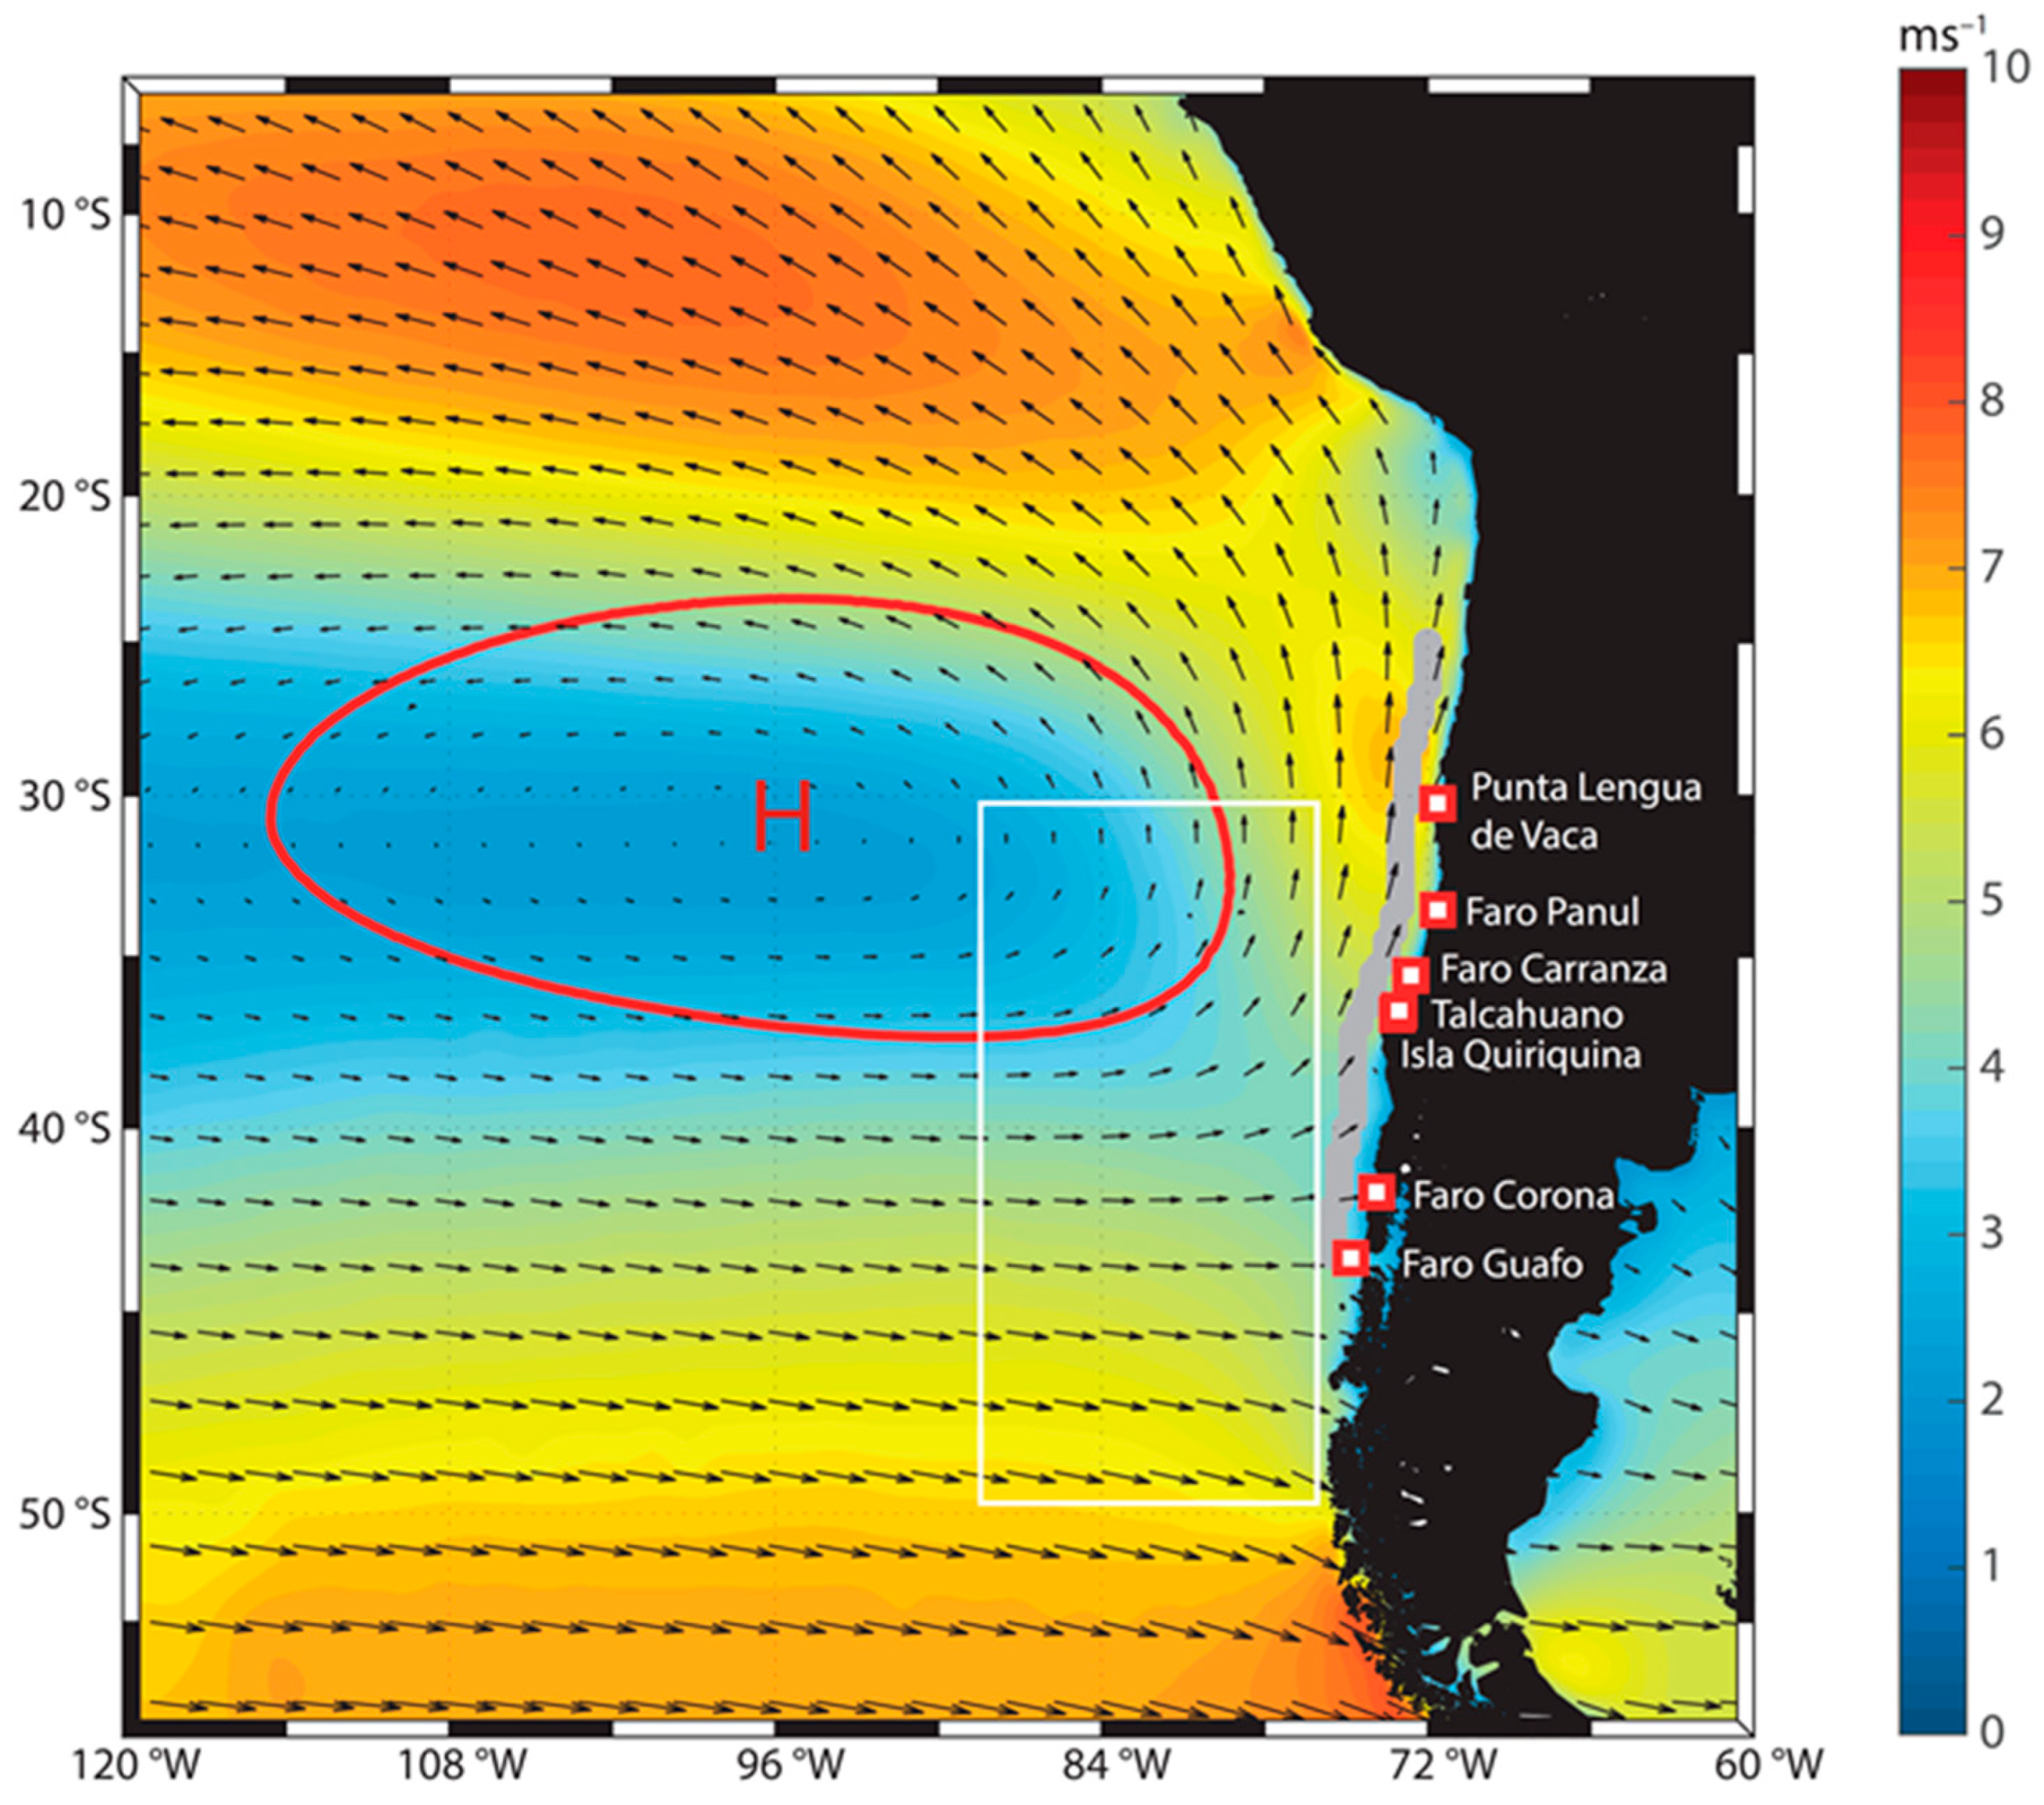
Figure 1. Mean magnitude (ms−1, colors) and direction (vectors) of 10-m winds in the Southeast Pacific for the period 1979–2019. Red line and H represent the high-pressure Southeast Pacific Anticyclone (contour of 1020 hPa). Locations of meteorological stations are indicated using red squares, and the gray line represents the locations where the time series of alongshore winds 10 m above the surface (Va) and sea level pressure (SLP) were obtained from ERA5 reanalysis at 75 points along the coast of central Chile. The white box indicates the region considered to have migratory anticyclones offshore of the west coast of South America.
Atmosphere 12 00465 g001
Figure 2. Daily mean time series of Va at 36 °S for the period November 2006 to March 2007 (upper panel). Maps of Va (ms−1) during the low-level coastal jet event observed between 11 to 15 January 2007 (middle panels). Maps of SLP anomalies (hPa) between 11 to 15 January 2007 (bottom panels).
Atmosphere 12 00465 g002
Figure 3. Periods of measurements at different meteorological stations for Va (light) and SLP (dark). The data obtained from CEAZA is presented in green, the data facilitated by DIRECTEMAR in blue, the ERA5 reanalysis in black and QuikSCAT in orange.
Atmosphere 12 00465 g003
Figure 4. Scatter plots of the observations from meteorological stations and reanalysis data, Va (upper panel) and SLP (bottom panel).
Atmosphere 12 00465 g004
Figure 5. Heat scatter plot of the satellite wind (QuikSCAT) and Va from reanalysis (ERA5) data. Warm and cold colors represent high and low density of data, respectively.
Atmosphere 12 00465 g005
Figure 6. Climatology of the wind speed (colors, ms−1), wind direction (vectors) and the standard deviation of the Va (contours) from ERA5 reanalysis (1979–2019) in the study area. (a) Fall (March–April–May), (b) winter (June–July–August), (c) spring (September–October–November) and (d) summer (December–January–February). (e) Percentile for a value of 10 ms−1 in the Va distribution at each season.
Atmosphere 12 00465 g006
Figure 7. (a) Trends in the number of windy days, (b) trends in the number of CLLJ events and (c) trends in the duration of the CLLJ events. Dots represent locations where trends are significant.
Atmosphere 12 00465 g007
Figure 8. Time series at selected locations of number of windy days and number of CLLJ events, (a) at 30 °S for winter, (b) at 30 °S for summer, (c) at 38 °S for winter and (d) at 38 °S for summer.
Atmosphere 12 00465 g008
Figure 9. Annual density of anticyclones in the southern hemisphere (anticyclone per area per year). (a) All anticyclones, (b) migratory anticyclones and (c) stationary anticyclones.
Atmosphere 12 00465 g009
Figure 10. Probability that a Va greater than 10 ms−1 occurs together with a migratory anticyclone inside the box defined in Figure 1.
Atmosphere 12 00465 g010
Figure 11. Difference of anticyclone density inside the box defined in Figure 1 between periods 2010–2019 and 1979–1988 at each season.
Atmosphere 12 00465 g011
Figure 12. Comparison of the distributions of central pressure of migratory anticyclones inside the box defined in Figure 1 between periods 2010–2019 and 1979–1988 at each season and annual.
Atmosphere 12 00465 g012
Table 1. Information and details of meteorological stations and satellite data used in this work.
No.Meteorological StationIDLat (°)Lon (°)Altitude (Masl)PeriodFrequencySource
1Punta Lengua de Vaca−30.24−71.63172 February 2000–18 May 2018Every 30 min and hourlyCEAZA
2Faro Panul330028−33.57−71.62301 January 2009–30 November 20203-hourlyDIRECTEMAR
3Faro Carranza350007−35.56−72.62211 March 2010–30 November 20203-hourly (from 12 to 24 h)DIRECTEMAR
4Isla Quiriquina360015−36.61−73.05841 August 2014–30 November 20203-hourly (from 12 to 24 h)DIRECTEMAR
5Talcahuano360017−36.72−73.1231 April 2008–31 August 20203-hourlyDIRECTEMAR
6Faro Corona410007−41.78−73.88531 January 2009–1 January 20163-hourlyDIRECTEMAR
7Faro Guafo430003−43.57−74.831051 January 2009–1 January 20163-hourlyDIRECTEMAR
8QuikSCAT1020 July 1999–21 November 2009DailyIFREMER
Table 2. Statistics from wind data comparison between reanalysis, measurements and satellite data.
AnnualDJFMAMJJASON
Source (number of data)Lat (°)Lon (°)RBiasRMSERBiasRMSERBiasRMSERBiasRMSERBiasRMSE
Lengua de Vaca (6681)−30.24−71.630.810.770.980.790.380.810.780.820.970.821.181.120.860.690.90
Faro Panul (3836)−33.57−71.620.603.173.780.575.043.210.633.103.270.731.163.820.633.463.71
Faro Carranza (3593)−35.56−72.620.86−1.135.410.76−0.866.380.87−1.584.860.910.305.190.91−2.114.92
Isla Quiriquina (1979)−36.61−73.050.791.964.590.701.274.450.851.143.540.843.484.820.712.265.05
Talcahuano (4292)−36.72−73.120.890.053.710.84−0.424.100.900.483.380.931.063.350.88−0.493.81
Faro Corona (2556)−41.78−73.880.902.806.710.850.875.910.922.706.160.934.517.470.873.266.72
Faro Guafo (2459)−43.57−74.830.740.328.510.78−0.608.070.590.889.110.760.619.050.800.177.61
Mean0.801.134.810.760.814.700.791.084.470.841.764.970.811.044.67
QuikSCAT (283,350)0.940.191.810.940.341.510.930.121.890.950.052.070.950.281.71
Table 3. Statistics from SLP data comparison between reanalysis and measurements.
SourceLat (°)Lon (°)AnnualDJFMAMJJASON
RBiasRMSERBiasRMSERBiasRMSERBiasRMSERBiasRMSE
Lengua de Vaca−30.24−71.630.9367.1180.200.9498.6344.950.8349.63102.110.9273.9285.390.8983.3879.81
Faro Panul−33.57−71.620.93−210.18121.400.89−245.5295.900.91−210.95105.150.91−164.12143.140.91−221.43121.44
Faro Carranza−35.56−72.620.94−0.92118.900.79−39.47131.550.93−1.6489.360.9429.60125.030.92−1.45116.79
Isla Quiriquina−36.61−73.050.95−136.42101.190.96−165.8155.970.97−152.7667.250.95−109.84133.110.92−107.74116.15
Talcahuano−36.72−73.120.94−66.87126.720.85−119.74131.330.92−69.64123.410.98−21.7194.360.92−66.06134.01
Faro Corona−41.78−73.880.9951.4470.850.9950.7149.971.0041.1854.860.9957.0491.300.9960.0077.69
Faro Guafo−43.57−74.830.93272.54277.880.94191.16199.090.82268.37426.430.97312.83207.910.96295.57182.39
Mean0.95−3.33128.160.91−32.86101.250.91−10.83138.370.9525.39125.750.936.04118.33
Publisher’s Note: MDPI stays neutral with regard to jurisdictional claims in published maps and institutional affiliations.