Article

Vertical Characteristics of Pollution Transport in Hong Kong and Beijing, China

1
State Key Laboratory of Earth Surface Processes and Resource Ecology, College of Global Change and Earth System Science, Beijing Normal University, Beijing 100875, China
2
Key Laboratory of Transportation Meteorology, China Meteorological Administration, Nanjing 210009, China
3
Jiangsu Institute of Meteorological Sciences, Nanjing 210009, China
4
Hong Kong Observatory, Hong Kong
5
Beijing Weather Modification Office, Beijing 100089, China
*
Authors to whom correspondence should be addressed.
Atmosphere 2021, 12(4), 457; https://doi.org/10.3390/atmos12040457
Submission received: 8 March 2021 / Revised: 26 March 2021 / Accepted: 31 March 2021 / Published: 4 April 2021
(This article belongs to the Special Issue Aerosol Pollution in Asia)

Abstract

:
Transported pollution plays an important role in the atmospheric environment of eastern China. This study analyzed the characteristics of surface winds at different air quality levels using meteorological station observations of both wind and mass concentrations of particulate matter with aerodynamic diameters <2.5 μm (PM2.5) over Hong Kong and Beijing. In recent decades, wind directions at the surface exhibit a similar pattern for both good and poor air quality levels at all three stations, indicating a weak relationship between surface winds and air quality in Hong Kong. However, winds at a height of 1–2 km govern pollution accumulation. This dominant role is illustrated by a sudden change in wind direction within this layer and a simultaneous pollution accumulation stage on 8 January 2014. The controlling influence of winds at 1–2 km on both the deterioration and improvement of air quality is also supported by a distinct vertical wind distribution for all 21 monotonic increasing stages and 17 decreasing stages of PM2.5. In contrast, air pollution is transported to Beijing throughout the atmospheric layer that extends from the surface to a height of more than 3 km. This key difference may be due to variations in meteorology, topography, and emission sources between Hong Kong and Beijing. The results that layer of 1–2 km in Hong Kong and of surface to 3 km in Beijing is the height where pollution transport is most likely to occur are critical for forecasting severe haze episodes in eastern China.

1. Introduction

Eastern China has been one of the most polluted regions in the world during recent decades. The pollution emissions not only contribute significantly to the local environment, but also affect air quality of downwind areas by regional transport. A simulation study suggested that pollutants are predominantly transported to Beijing during haze episodes at a height equivalent to 850–950 hPa (Wang et al., 2014 [1]). Simulation of a severe haze episode showed that PM2.5 (particulate matter with aerodynamic diameters < 2.5 μm) concentrations in the North China Plain (NCP) were substantially influenced by transported pollutions from the Yangtze River Delta (YRD). This transport was mainly through a pathway at an altitude of 700–800 m (Huang et al., 2020 [2]). Observational studies based on meteorological towers are limited by the height of towers, which are generally less than 300 m (Wang et al., 2018 [3]). Measurements from aircraft and lightweight unmanned aerial can provide vertical information of pollution transport, however, these observations with long term range are not easily available. Observational studies on vertical transport patterns are still rare.
Different transport pathways are found between NCP and YRD in a severe haze episode. Long-range transport from YRD to NCP mainly at an altitude of approximately 700 m, while subregional transport is strong in the lower planetary boundary layer (Huang et al., 2020 [2]). In Hangzhou, Zhejiang province, analysis based on lightweight unmanned aerial vehicle indicates slower winds below 1 km lead to higher surface PM2.5 concentrations (Lu et al., 2019 [4]) (in situ aircraft measurements in the Beijing area suggest that pollution transport can occur both inside and outside the boundary layer (Zhao et al., 2015 [5]). In addition, based on aircraft measurements, Tian et al. (2019) [6] indicate that black carbon is enhanced at 400–800 m by regional transport over Beijing. It seems the transport pathway in northern China has a wider range in height. These recent studies based on simulation or individual cases suggest that vertical transport patterns among regions may be distinct and need further study.
Transported pollution could trigger severe haze episodes in both Hong Kong and Beijing, where local emissions are very low (Wang et al., 2014 [1]; Chan, 2017 [7]). Studies of particle mass concentrations indicate that more than 80% of pollution loading in Hong Kong is attributed to regional transport (Nie et al., 2013 [8]). The most severe episodes of high concentrations of fine particles in Hong Kong is associated with air pollution in east China, especially in the Pearl River Delta Region (Hagler et al., 2007 [9]; Huang et al., 2009 [10]; Yang et al., 2018 [11]). The situation is similar for the Beijing area in recent years with implementation of strict emission control measures. Regional transport of emissions from NCP in the south significantly contributes to the deterioration of air quality in Beijing (Li et al., 2021 [12]). Therefore, PM2.5 concentrations in Hong Kong and Beijing can well reflect the transported pollutants. Furtherly, statistical vertical distribution in pollution transportation in Hong Kong and Beijing may represent the typical pattern in the regions of YRD and NCP. Taking Hong Kong and Beijing as the study areas, this study investigates the relationship between surface PM2.5 concentration and vertical distribution of winds to figure out the regional transport patterns. The vertical distribution characteristics of winds are derived from long-term wind profiler observations in Hong Kong and Beijing. This statistical analysis is critical for elucidating the transport mechanisms and formation of severe air pollution in Hong Kong and Beijing. The results will also be helpful for air quality forecasts in eastern China, where there is a high proportion of transported pollutants.

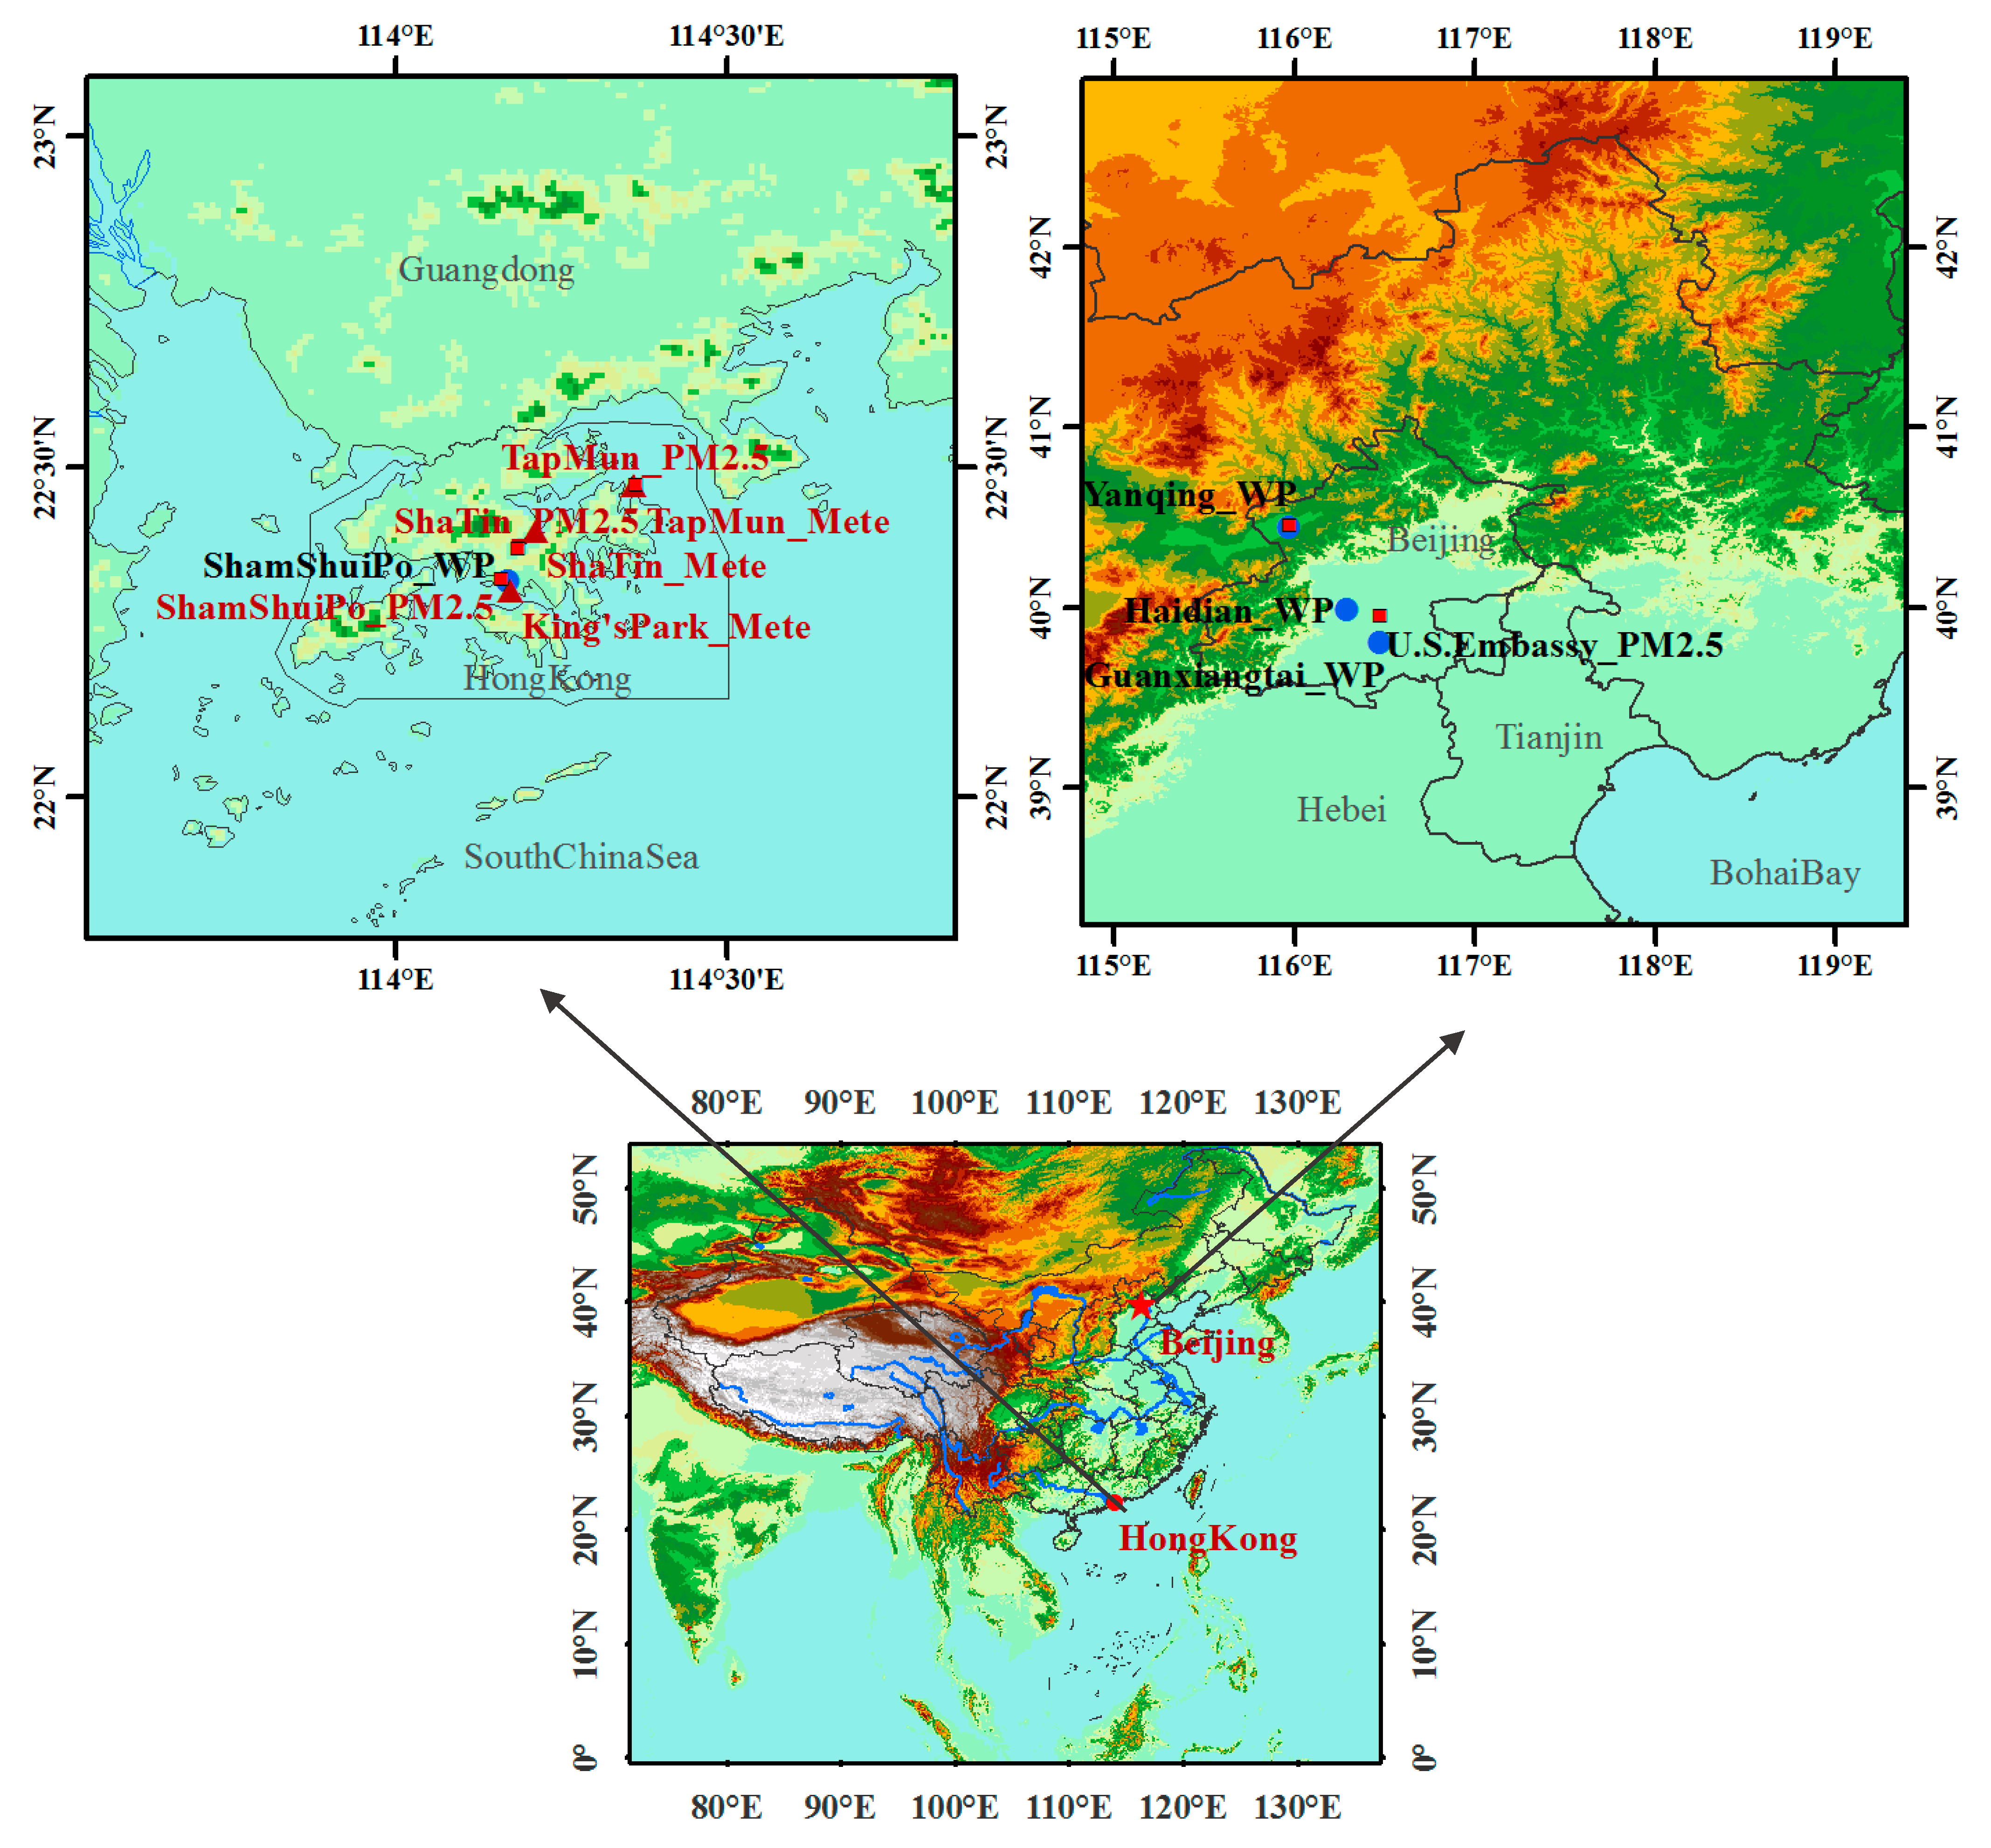
2. Dataset and Methodology

To evaluate the contribution of wind to local air quality, variations in surface winds were investigated for six levels of air quality. Although there are other categories of PM2.5 for pollution levels, the US EPA threshold is used in this study because it offers more detailed information on air quality. Note that hourly PM2.5 concentrations were used to accurately reflect the pollution process. Table 1 lists the thresholds and sample numbers for all six levels of air quality conditions in Hong Kong, according to which the surface winds were differentiated. As such, a sufficient contrast in the distribution of surface winds can be obtained between clean and increasingly polluted subsets. To limit the disturbance from seasonal variations in wind direction and the corresponding pollution source regions, these analyses were further divided into four parts according to the season (March–April–May for spring, June–July–August for summer, September–October–November for autumn, and December–January–February for winter). The hourly PM2.5 mass concentrations used in this study were obtained from the Environmental Protection Department of Hong Kong (http://epic.epd.gov.hk/EPICDI/air/station/). The air quality station of Sham Shui Po was chosen to match the wind profiler observation site. Surface meteorological observations at the nearest station of Kings Park were used to represent the situation of Sham Shui Po because most air quality stations in Hong Kong do not overlap with the locations of meteorological stations. Two other stations, Tap Mun and Sha Tin, were used to represent different types of background environment. Tap Mun station, which is located on a rural outlying island on the eastern side of Hong Kong, is often considered as an atmospheric background station for Hong Kong. The stations at Sha Tin and Sham Shui Po are located in the industrial and central urban areas of Hong Kong, respectively. Hourly surface winds were obtained from the Hong Kong Observatory (http://www.hko.gov.hk). The study region and location of the stations are shown in Figure 1. The distributions of surface winds under the six different pollution level conditions reflect the variation of winds with respect to gradually increasing PM2.5 concentrations. Based on the large sample number of surface winds, these statistical results are convincing for at least the first four levels of air quality conditions, considering that levels 5–6, which correspond to highly polluted conditions, rarely occur.
For all cases of very poor air quality, the time series of vertical wind evolution over 72 h was studied, as well as the corresponding aerosol loading from the surrounding regions of Hong Kong. Vertical measurements of wind from wind profile radar collected during the period from 2011–2017 at Sham Shui Po were used in this analysis. The wind profiler in Hong Kong works under nearly all weather conditions, providing 10-min average values of wind speed and direction. The vertical resolution for wind profiler observations was 200 m. The maximum height for wind observations varies with season, with the largest value of approximately 6.5 km in July and the lowest value of approximately 4.0 km in January. In general, the reachable observation altitude is higher during high relative humidity (wet summers or rainy periods) because atmospheric scattering is stronger when the atmosphere contains more moisture. More details about the wind profiler observations can be found in the studies of Imai et al. (2007) [13] and Tse et al. (2013) [14]. To contrast with the transport pattern of regional-scale pollution in Hong Kong in the Pearl River Delta (PRD) region, vertical wind variations were also investigated for the only three stations with a wind profile radar in Beijing: Guanxiangtai, Haidian, and Yanqing (Figure 1). This comparison using limited data can contribute to our understanding of potential transport mechanisms in typical regions in China. The Beijing wind profile data used in this study were measurements conducted at each sampling height with a vertical resolution of 120 m and a temporal resolution of 6 min. Wind profiler measurements are superior to radiosonde measurements because of their continuity in time and capability at a fixed location (NOAA, 1994 [15]; Dibbern et al., 2003 [16]; WMO, 2012 [17]; Ishihara et al., 2006 [18]); that is, sounding balloons only make observations a few times a day and might exhibit drift in sounding measurements. Therefore, wind profiler data are widely used to monitor changes in wind and atmospheric environments.
The vertical distribution characteristics of wind were also analyzed for all stages during which air quality continued to deteriorate in the winter of 2011–2017 (Hong Kong) and the winter of 2016–2019 (Beijing). These stages were selected according to the following criteria: (1) the duration of continually rising PM2.5 concentration was longer than 6 h; (2) occasional decreases in PM2.5 concentration were less than 1/10 of the PM2.5 concentration at the hour when it started to fall; (3) the maximum PM2.5 concentration was greater than the upper 5% percentile (73 μg/m3 in Hong Kong, 86 μg/m3 in Beijing), the minimum value of PM2.5 concentration was less than the lower 75% percentile (45 μg/m3 in Hong Kong, 22 μg/m3 in Beijing), and the difference between maximum PM2.5 and minimum PM2.5 concentrations was greater than the upper 50% percentile (32 μg/m3 in Hong Kong, 36 μg/m3 in Beijing).
These filters were used to select the continuous and rapidly increasing (decreasing) stages of air pollution. Thus, the characteristics of regional pollution transport in the study region were obtained by analyzing the wind variations during these stages. Note that the screening threshold value of maximum PM2.5 concentration for Yanqing station in Beijing was 43 μg/m3, which is less than half of the maximum PM2.5 concentration at the other two stations in Beijing. This is because Yanqing is located in the northwest mountainous area of Beijing, which is less influenced by surface anthropogenic emissions. For example, the maximum PM2.5 mass concentration was 91 μg/m3 during a heavy pollution event on 2 December 2016, but 134 μg/m3 at an urban site inside the U.S. Embassy. Variations in the vertical distribution of wind during monotonic increasing stages improve the reliability of the analysis of extreme cases. Furthermore, surface winds during the monotonic increasing intervals were simultaneously investigated to determine the impact of surface winds on air quality in Hong Kong.

3. Results and Discussion

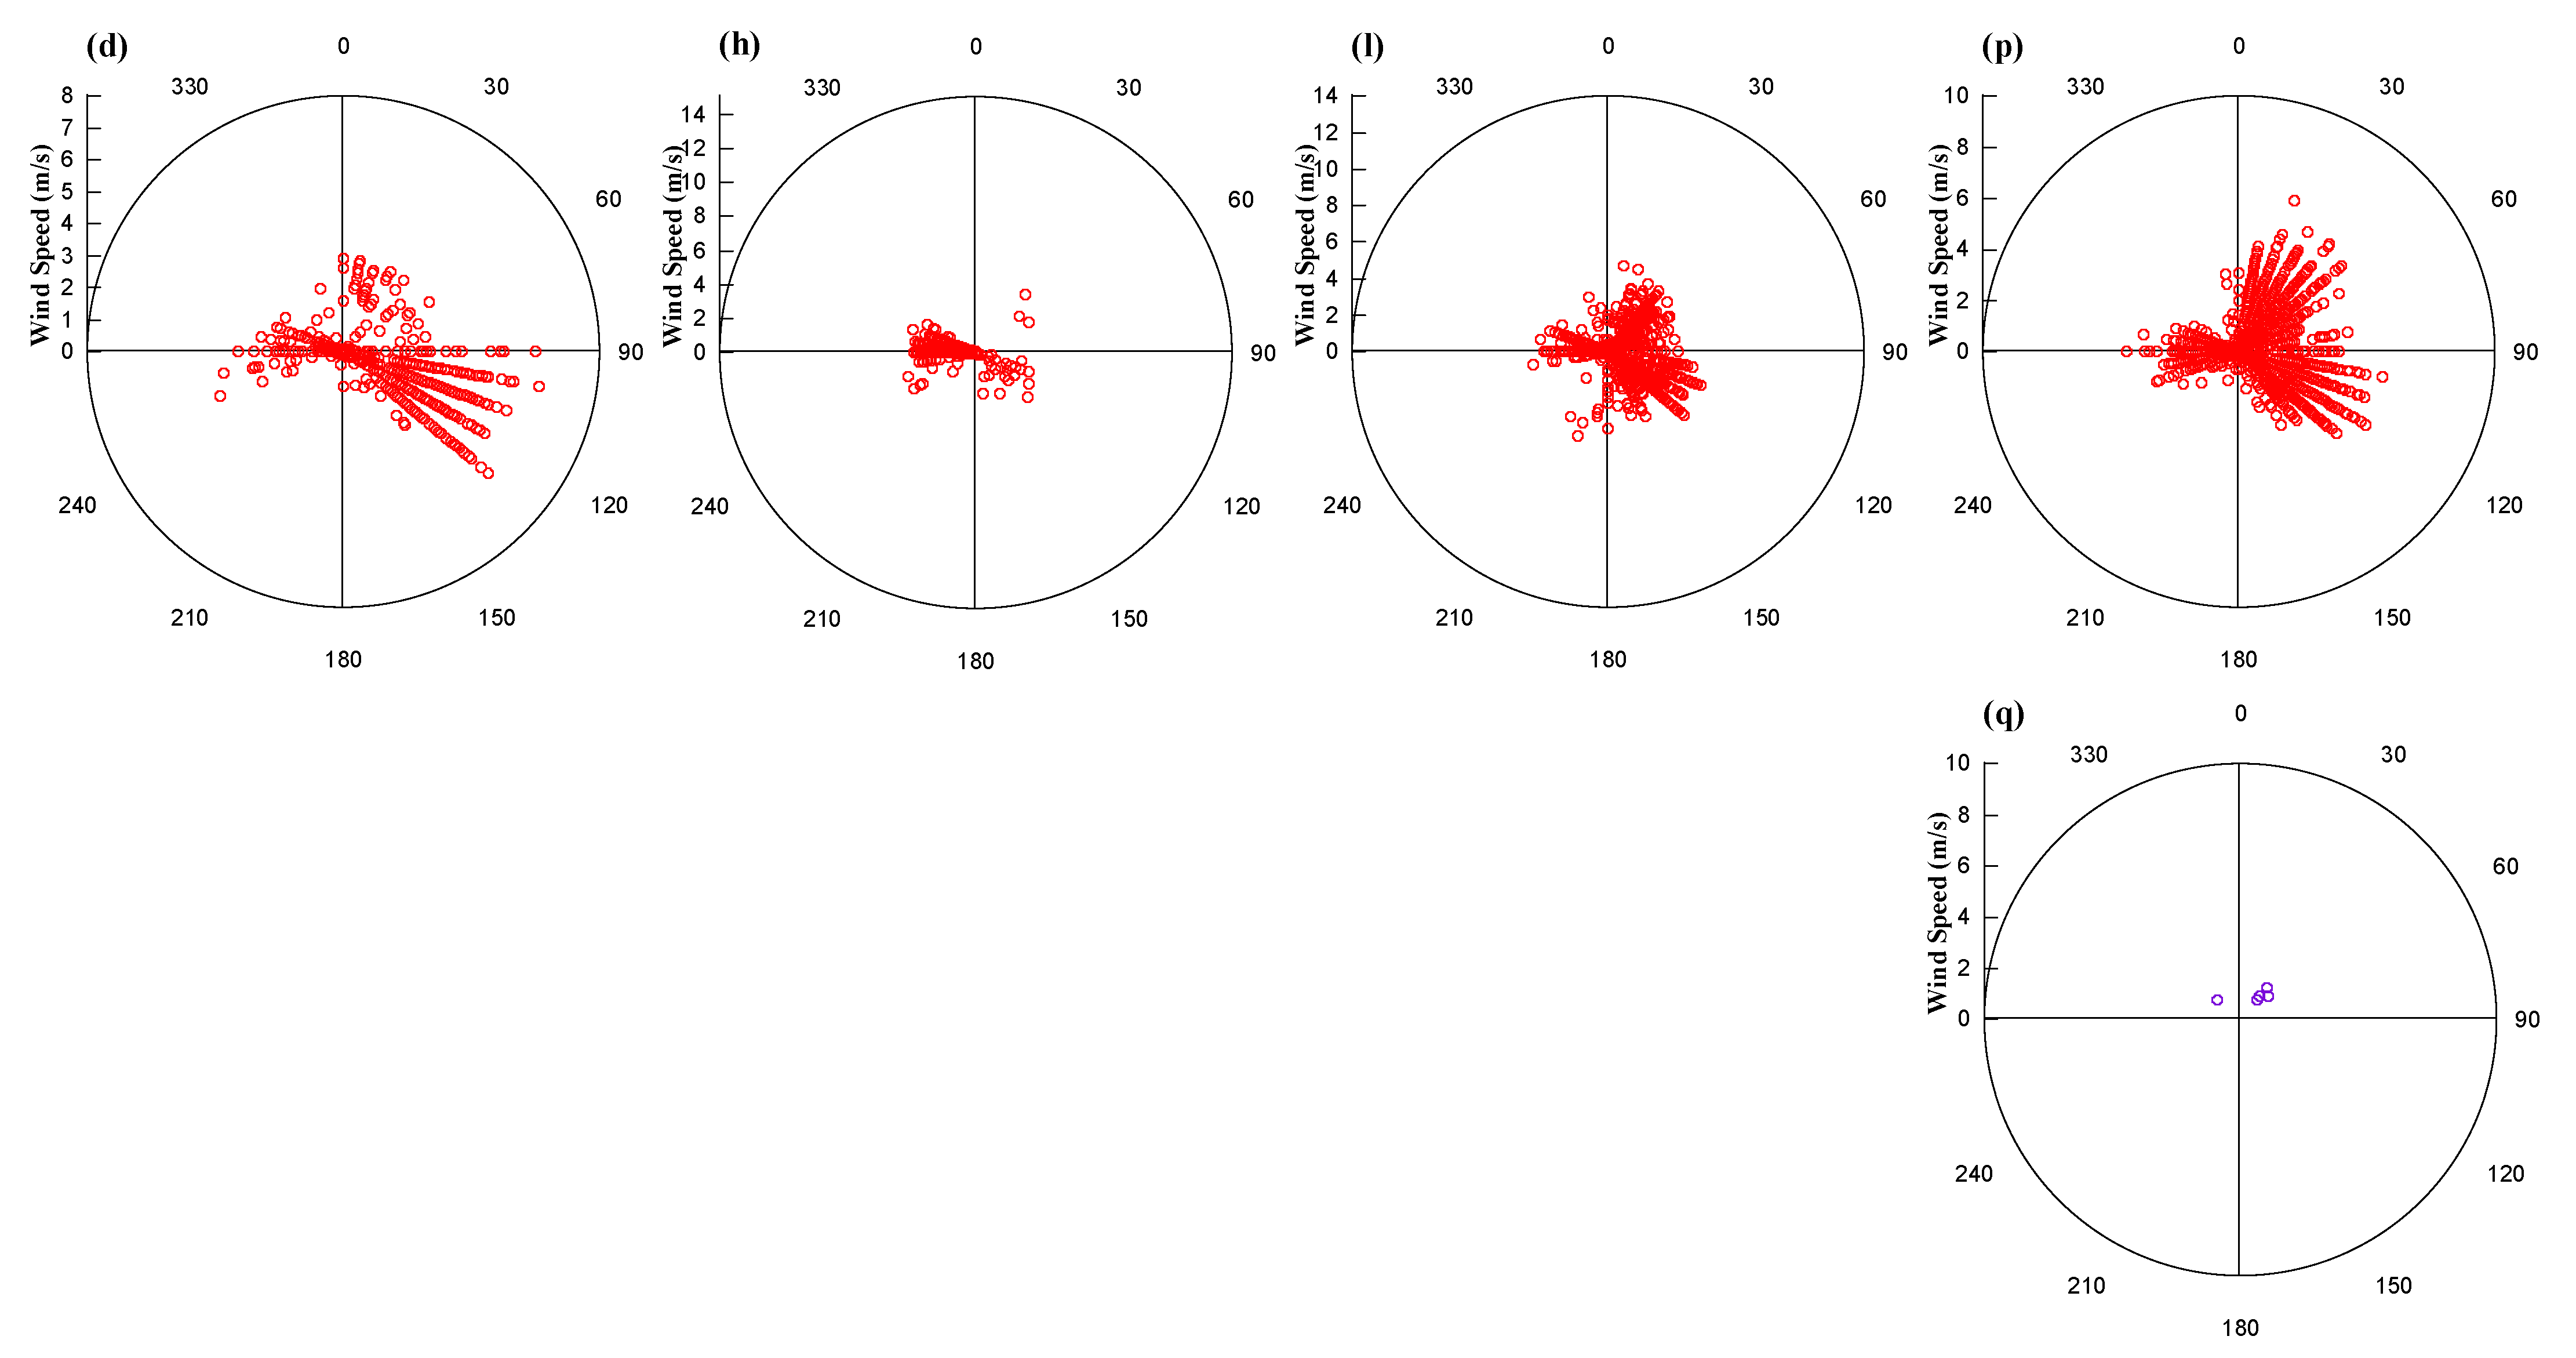
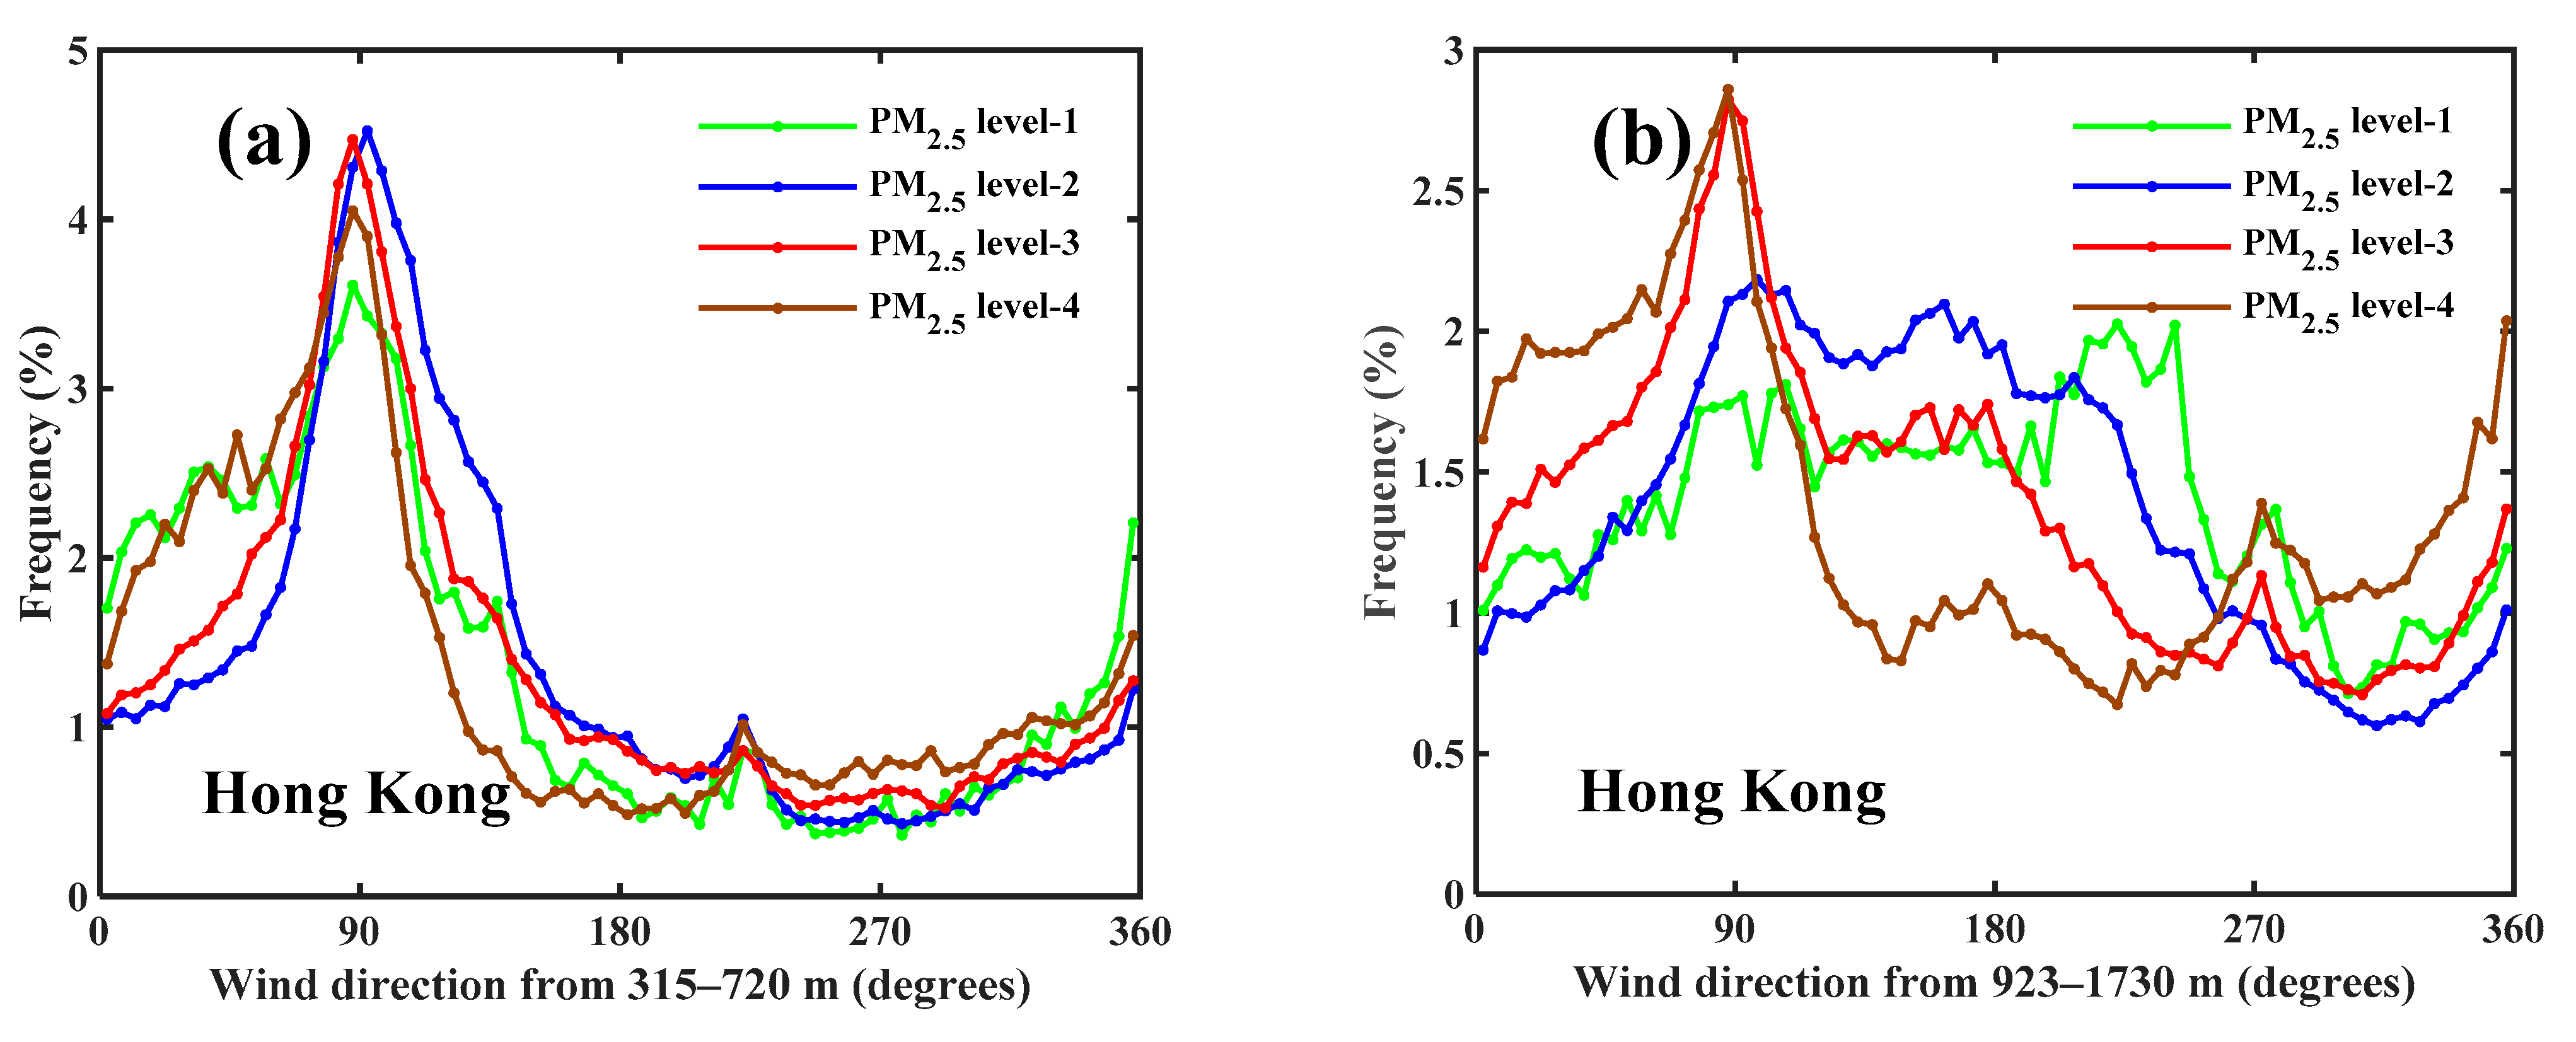
3.1. Relationship between PM2.5 Concentration and Wind at the Surface and Higher Levels

Due to the clean background levels, the PM2.5 concentration never exceeds 250.4 μg/m3 (pollution level 6) at any of the three stations of Hong Kong during the study period. In fact, the air quality of Hong Kong rarely reaches a very poor level (PM2.5 mass concentration 150.5–250.4 μg/m3). Particularly in summer and autumn, the mass concentration of PM2.5 is never greater than 150.5 μg/m3 for both Sha Tin and Sham Shui Po. The surface wind distributions for the four pollution level scenarios are shown in Figure 2 for Sham Shui Po. The distribution of surface winds is similar among the four air quality categories, especially in winter. During spring, summer, and autumn, the surface wind distribution patterns have no apparent differences, except that wind speed is generally smaller when air quality deteriorates. The frequency of the four air quality levels varies considerably among the seasons. The maximum frequency of good and poor air quality occurs in summer and winter, respectively. The distributions of surface wind for Tap Mun (Figure S1 in supplementary material) and Sha Tin (Figure S2) are similar to that of Sham Shui Po. Table 1 lists the number of samples for the six air quality categories at Tap Mun, Sha Tin, and Sham Shui Po. Compared to Tap Mun, the prevailing winds at the surface are slightly different at Tam Mun and Sha Tin because of the terrain and location, as shown in Figure 2, Figures S1 and S2. The distribution of surface winds is similar for all four air quality categories and all four seasons at both Sha Tin and Sham Shui Po, particularly in winter. The similarity in surface wind distributions under different pollution conditions at all three stations indicates that the relationship between surface wind and local air quality is very weak. This is helpful for understanding the formation mechanisms and evolution of air quality deterioration episodes in Hong Kong, where most pollutants originate from regional transport.
Due to limited wind profile observations, the lowest layer of wind data for Hong Kong and Beijing was 315 m and 150 m, respectively. From near-surface to a height of 3 km, the relationship between the wind direction distribution and pollution is shown for each detectable level in Figure 3 and Table 2. Note that cases when the air quality was at level 4 or above (PM2.5 concentration > 150.4 μg/m3) are combined for Hong Kong because this is a relatively rare situation. The maximum height of wind data was 2 km for Hong Kong because there were too much missing data above this layer. The results suggest that there are two distinct layers in the frequency distribution of wind direction with pollution for Hong Kong. In the lower layer (315–720 m), the wind direction frequencies exhibit little correlation with air quality. Eastern winds prevail in this layer for all four air quality levels, indicating that low-level winds may not be related to pollution transport to Hong Kong. However, wind direction frequencies for the upper layer (923–1732 m) vary substantially with increasing levels of pollution. The prevailing winds in this upper layer are predominantly southwest, followed by southeast, then north, when the air quality is good. The frequencies of northerly wind, especially northeasterly wind, increase gradually as the air quality deteriorates. This indicates that southerly winds in the upper layer (923–1732 m) bring a clean air mass, whereas northerly winds transport anthropogenic pollutants to Hong Kong. The large contrast in the distributions of wind direction between clean and polluted conditions in the upper layer, together with a similar distribution pattern among the four air quality categories for winds at lower levels, suggests that upper-level winds may play a dominant role during pollution episodes in Hong Kong.
For Beijing, wind direction frequencies may not be directly connected to the pollutant’s transportation. Pollution episodes in Beijing often last for a few days or even a week. With the accumulated pollutants and stagnant meteorological conditions, PM2.5 concentration may also be high even if winds are not blowing from the source region of the pollution. Moreover, the formation of secondary aerosols contributed greatly to the abrupt increase of PM2.5 concentrations in Beijing with the accumulated pollution particles (Ma et al., 2017 [19]; Xing et al., 2020 [20]; Du et al., 2021 [21]). Therefore, the statistical analysis of the distribution of wind direction with pollution level was not conducted for Beijing. It should be noted that the generation of secondary aerosols is limited in a relatively clean background during the early rising phase of PM2.5 concentrations. Note that wet and dry removal of pollution particles was not considered in this study. Since the study areas are less affected by local emissions, the relation between vertical evolution of winds and PM2.5 concentrations can provide insight for pollution transportation during air quality deterioration and improving stages.

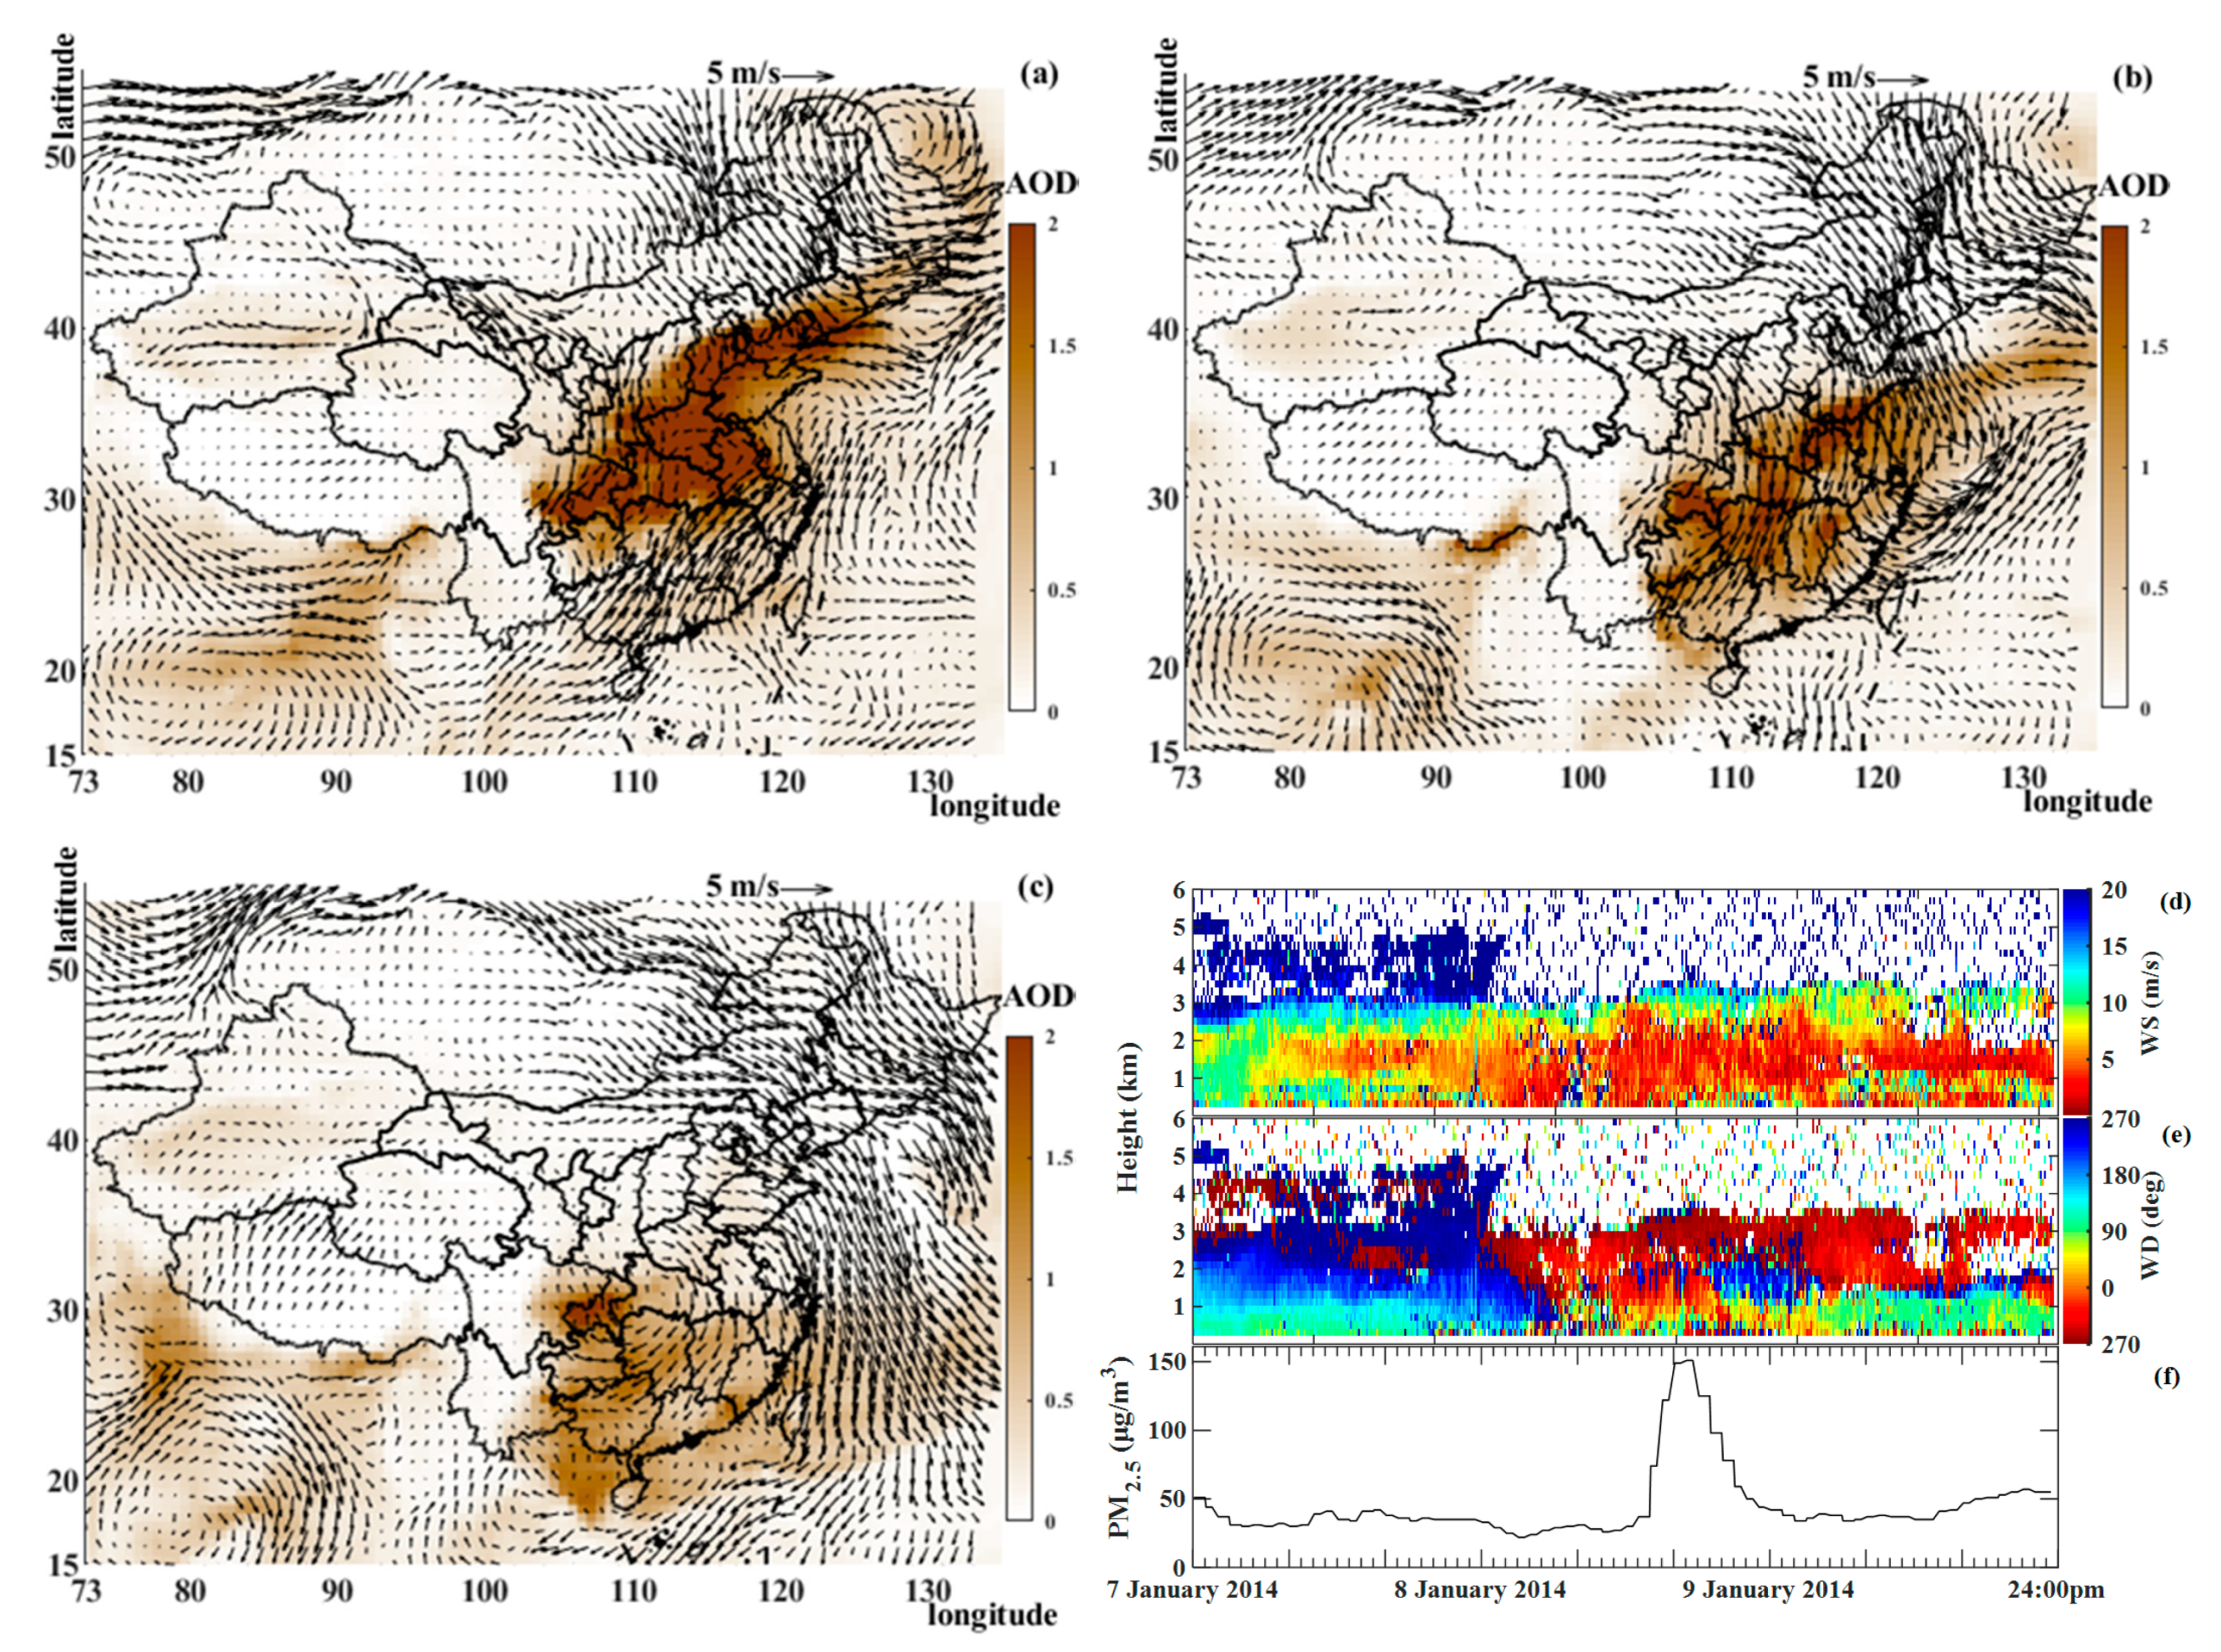
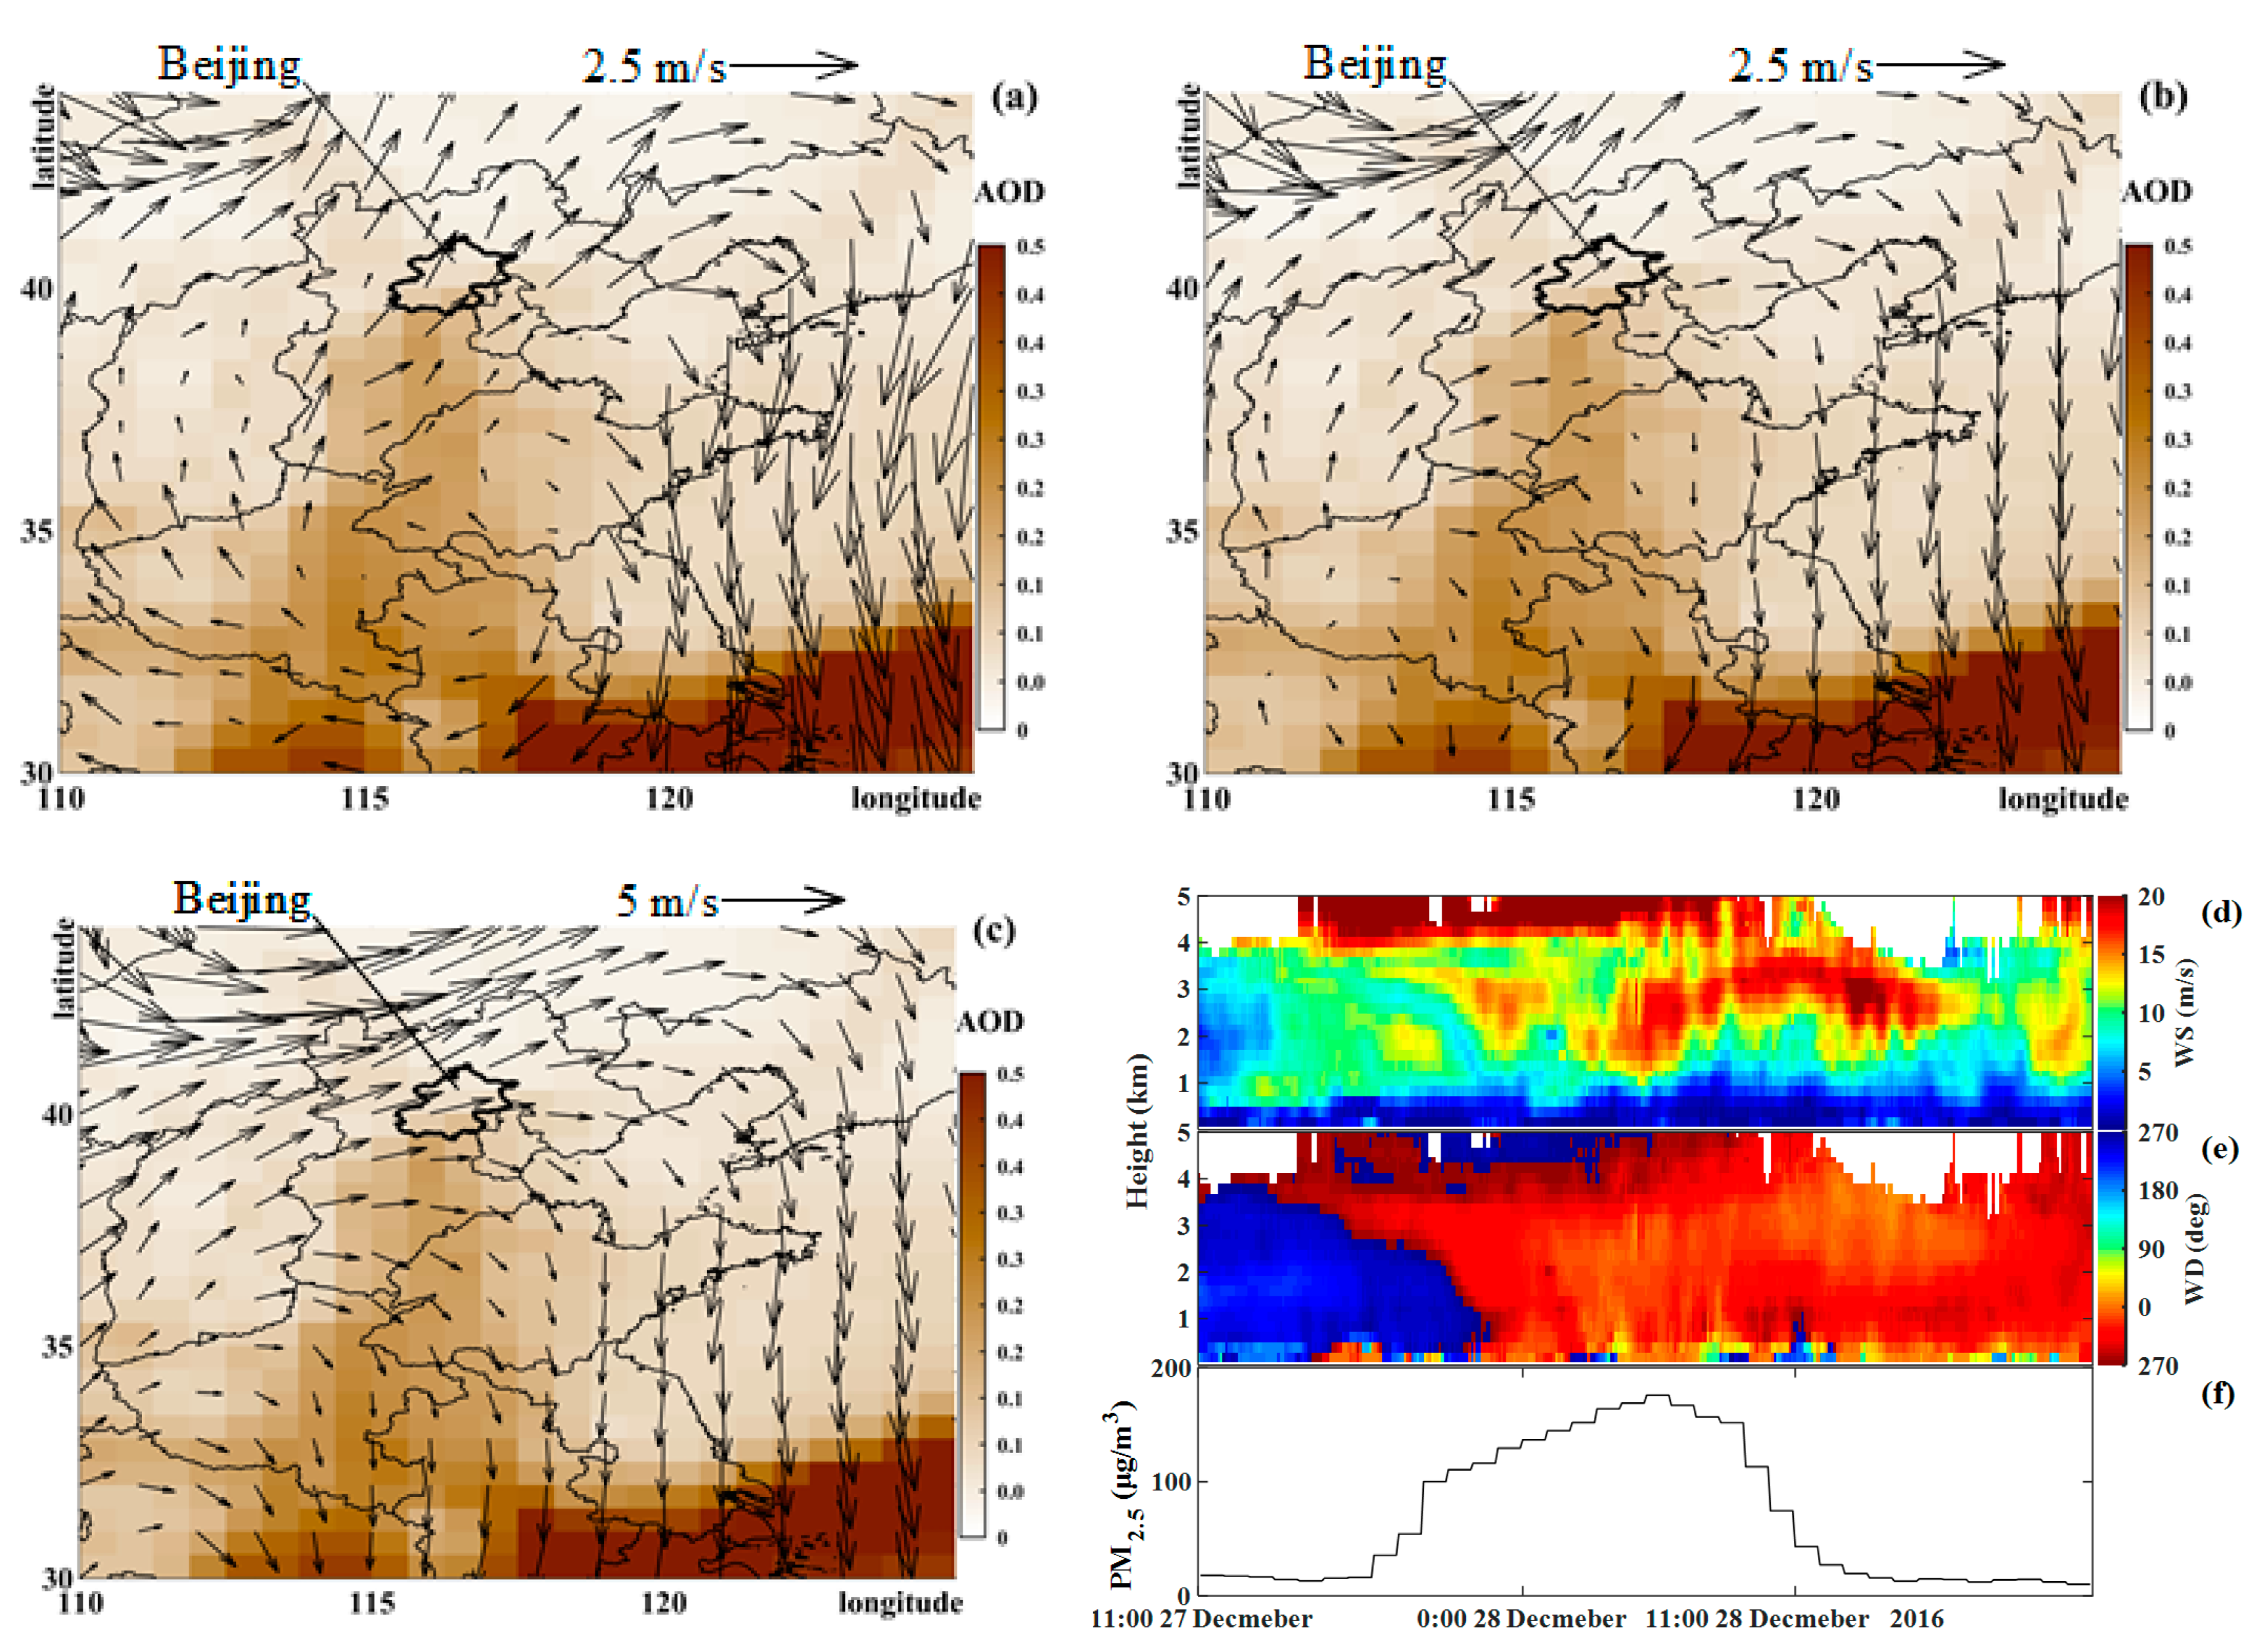
3.2. Case Study of Vertical Profile Evolution during the Most Severe Haze Episode

During the study period, the PM2.5 mass concentration exceeded the threshold value of very poor air quality (150.5 μg/m3) on two occasions in Hong Kong. Considering the large amount of missing data during the haze episode on December 26–28, 2013, only the case from 7–9 January, 2014 was analyzed to investigate the impact of winds on air quality in Hong Kong. The variables in the case analysis include the time series of PM2.5 mass concentration and vertical distribution of winds, and spatial distribution of aerosol optical thickness (MERRA-2 total aerosol extinction of aerosol optical thickness at 550 nm) over east China. Note that there was no rainfall during the entire period of this extreme haze episode.
Figure 4a–c shows pollutant transport during the severe pollution episode from northwest to southeast over east China, including the Hong Kong area. Located southeast of the pollutant source, Hong Kong experienced rapid deterioration of air quality on 7–9 January 2014. The corresponding vertical evolutions of wind speed, wind direction, and PM2.5 mass concentration during this severe haze episode are shown in Figure 4d–f, respectively. On 7 January 2014, the day before the heavy polluted day, two distinct layers are observed above and below a height of 1 km. Winds in the upper layer above 1 km are from the southwest, whereas easterly winds prevail in the lower layer below 1 km. Approximately half a day before the peak hour, a northwest wind suddenly appears in the upper layer, which persists until the PM2.5 mass concentration reaches its peak value of 151 μg/m3 (17:00 on 8 January). As mentioned in this study and previous references (Cheng et al., 2006 [22]; Yang et al., 2018 [11]), Hong Kong is susceptible to pollution transported from east China by northerly winds in winter. Therefore, steady northerly winds in the upper layer contribute to the accumulation of pollutants. This abrupt change in wind direction will transfer downward rapidly to the lower layer. However, the wind direction in the lower layer is easterly and not consistent with that of the upper layer. This may be explained by interference with the ground. After the time of peak pollution, southwest winds appear again in the upper layer and are accompanied by a reduction in pollution. The transport of pollutants through the upper layer is also supported by the changes of winds at 850 hpa and regional AOD distribution pattern, as shown in Figure 4a–c. Meanwhile, wind speed also slows gradually, corresponding to the change of wind direction in the upper layer, which lasts until the dissipation of the heavy pollution episode. The stabilized air favors the accumulation of transported particles at the surface, leading to the most serious pollution event. These findings suggest that pollutants affecting Hong Kong are mainly transported by winds in the upper layer.
Figure 5 shows pollutant transport from south to north to impact the Beijing area. This pollution episode is the first event in Beijing during the study period with the maximum PM2.5 concentration exceeding 150 μg/m3 and the duration not exceeding two days. According to Figure 5a–c, the source region of pollutants lies to the south of Beijing. On 27 December 2016, southerly winds bring pollutions to Beijing with wind direction gradually shift from south at 900 hPa to southwest at the height of 800 hPa. This is consistent with the vertical evolutions of wind speed, wind direction, and PM2.5 mass concentration during haze episode, as shown in Figure 5d–f. During the deteriorating air quality stages of the haze episode on 27 December 2016, southerly winds were observed from the surface up to a height of 3 km. This layer, with steady southerly winds, transported pollutants to Beijing and contributed to the haze episode. Meanwhile, the slower wind speed at the surface also favored the accumulation of pollutants. The vertical evolution of wind speed and direction during this haze episode suggests that pollutants in Beijing are transported by winds from the surface to a height of 3 km.

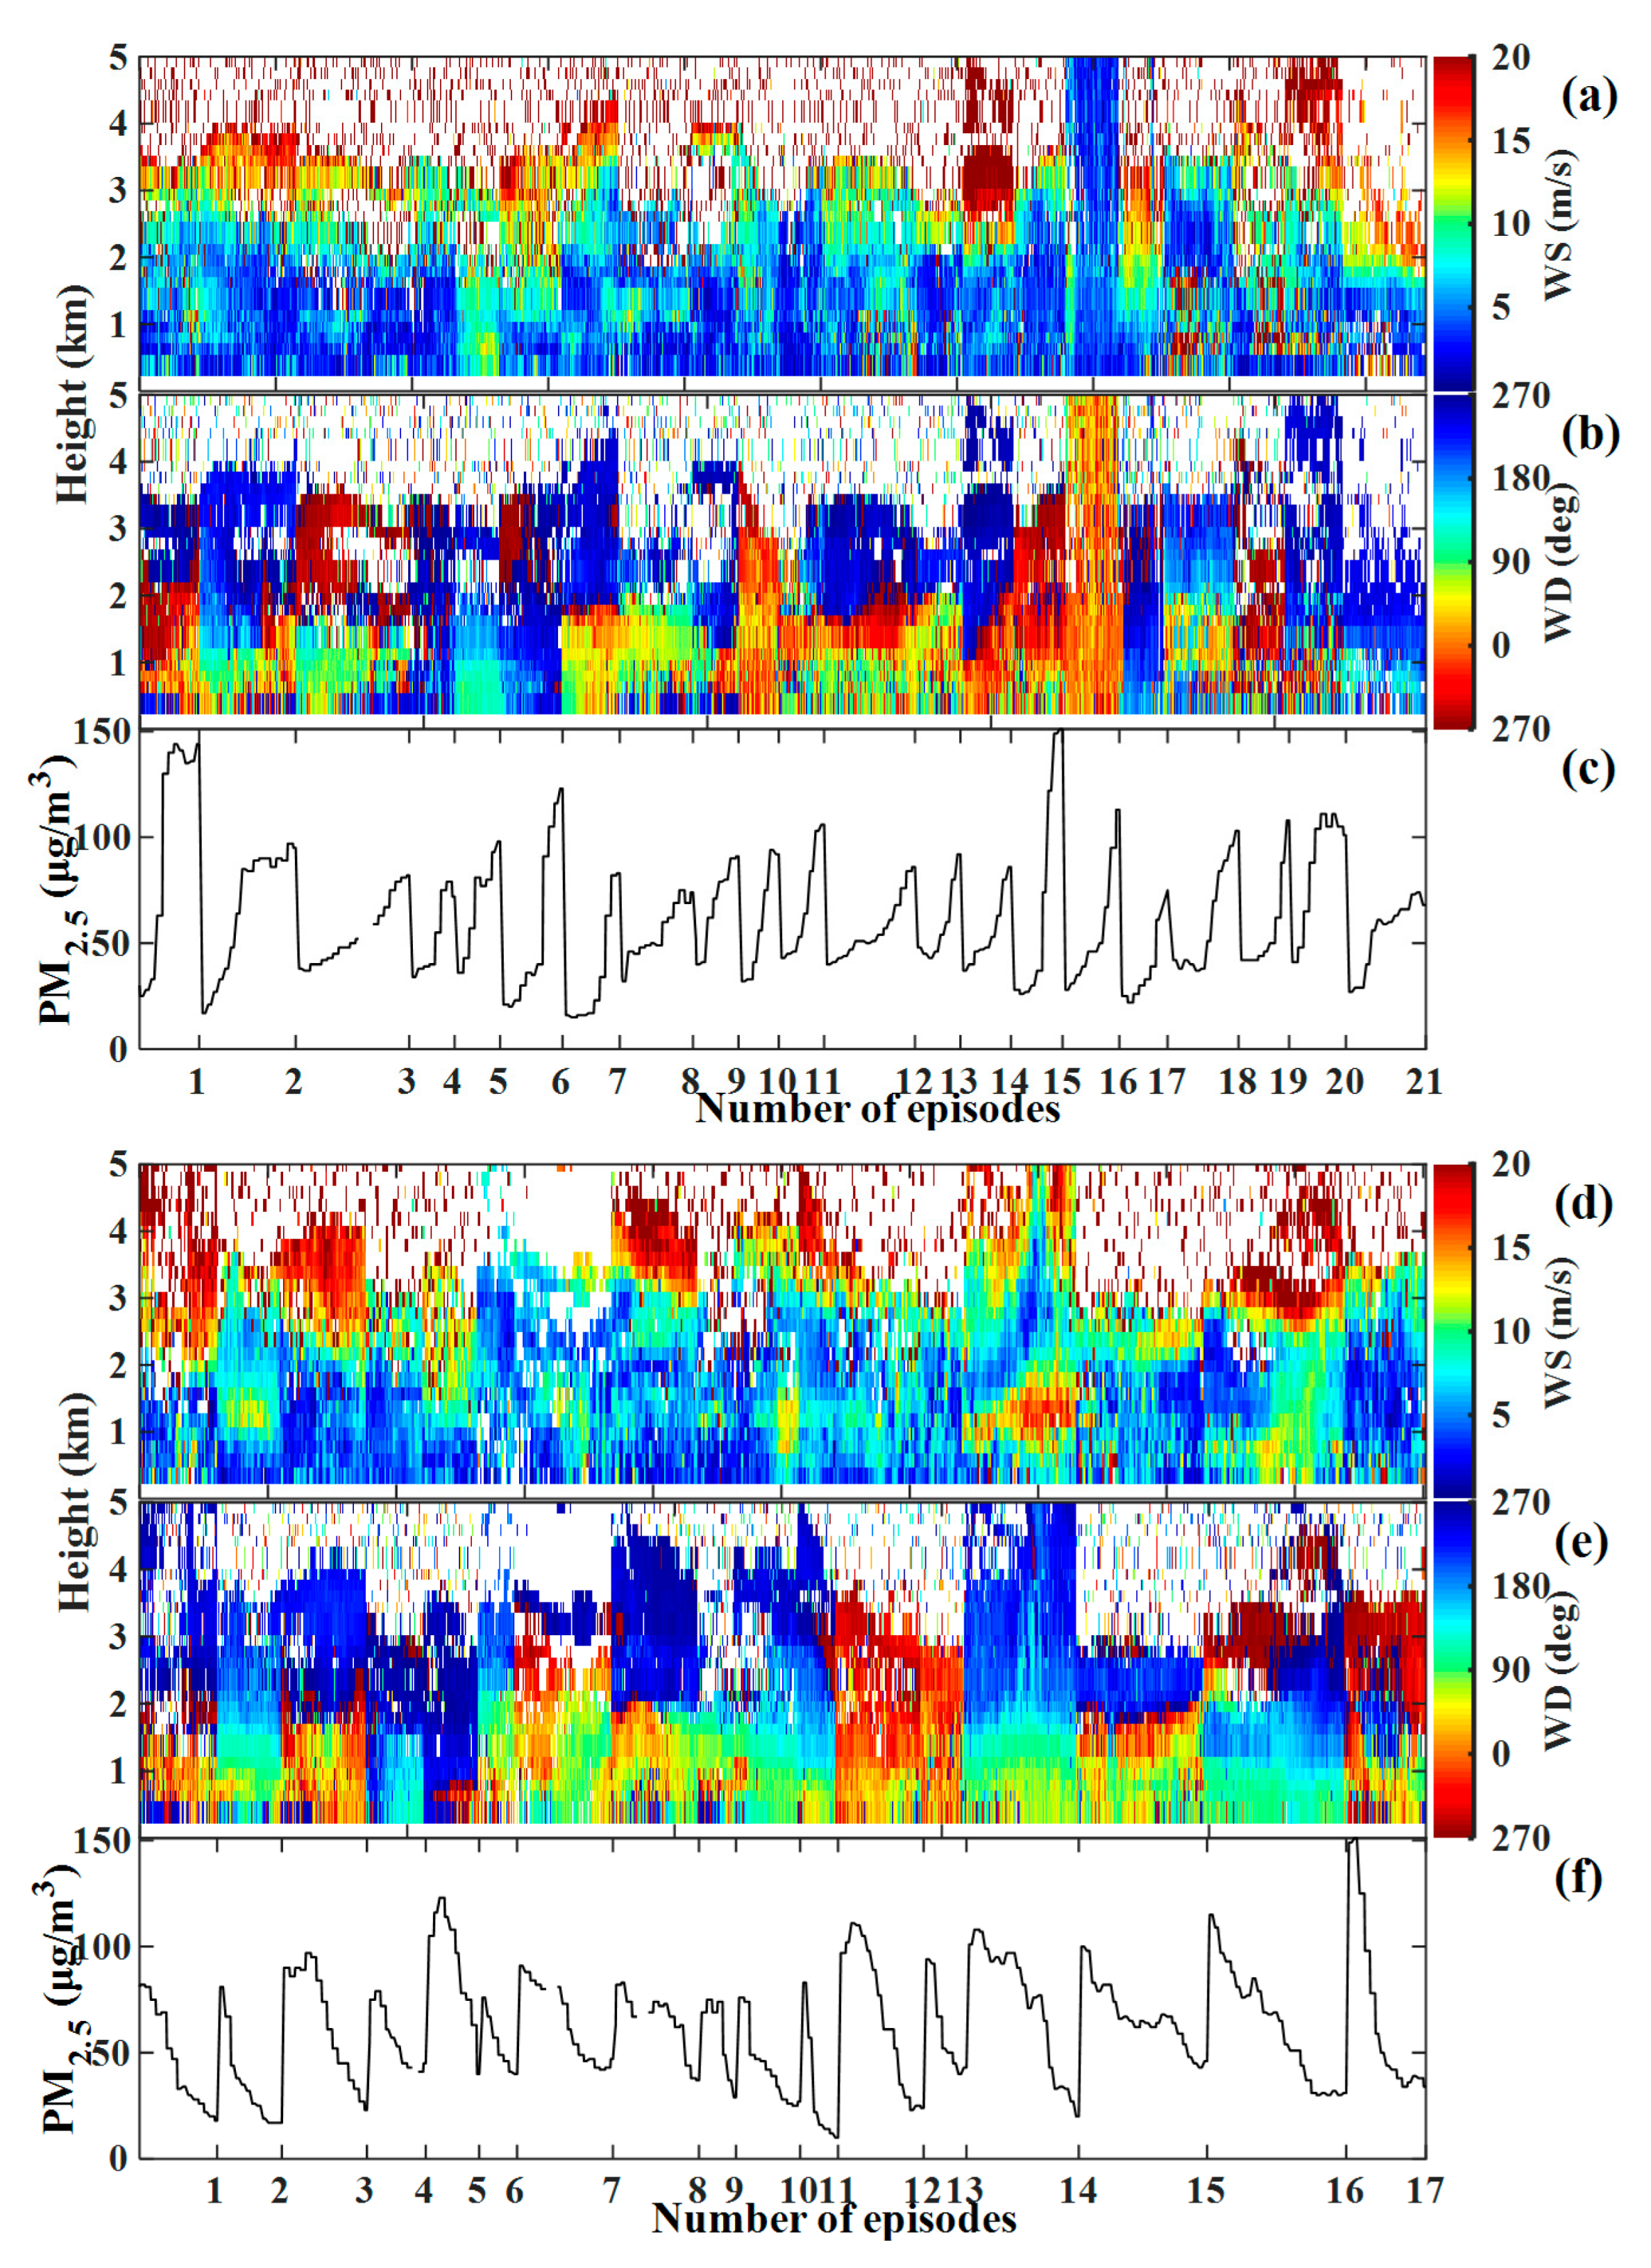
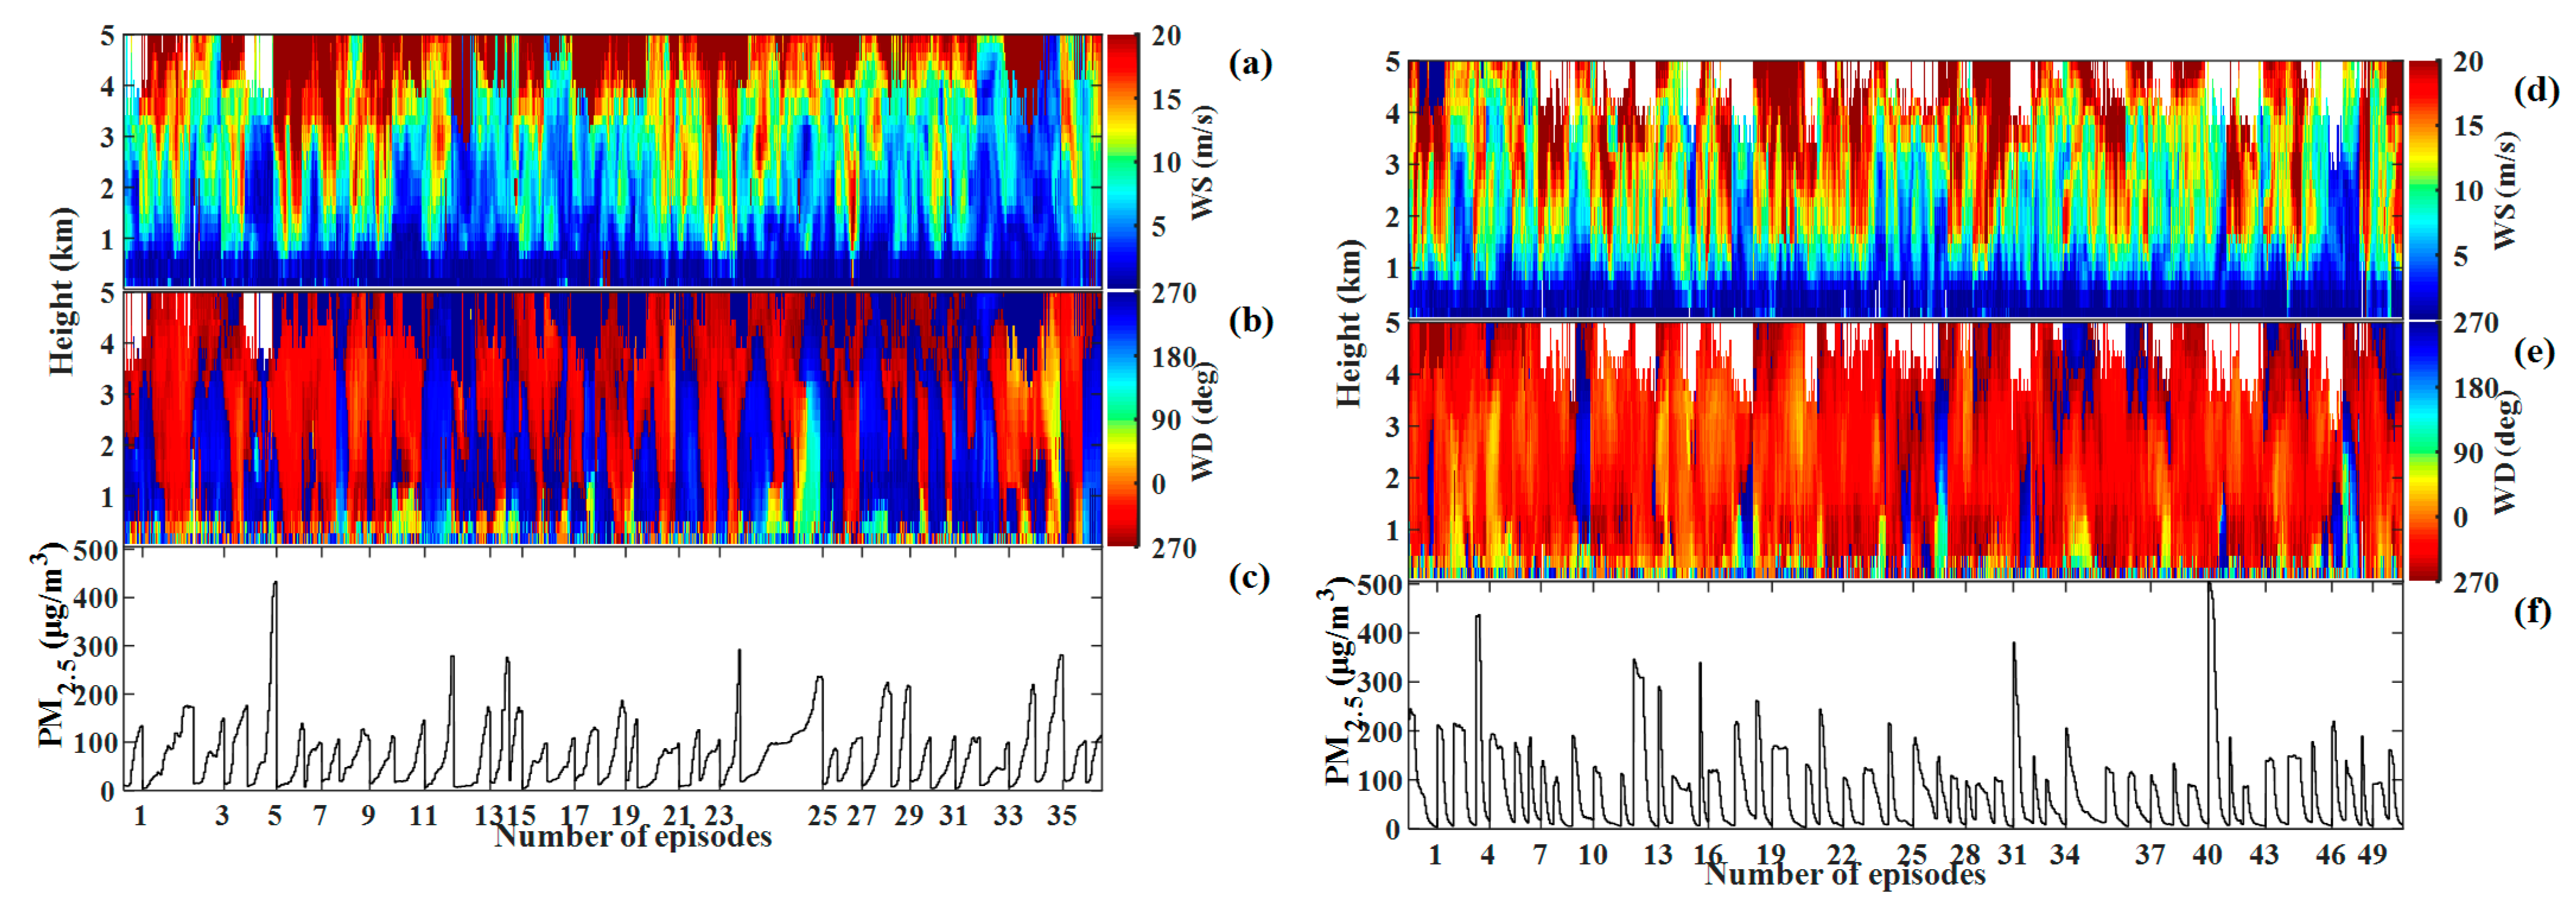
3.3. Statistical Analysis of Wind Profiles during Stages of Deteriorating and Improving Air Quality

Figure 6 shows the vertical distribution of winds for all monotonic increasing and decreasing stages of PM2.5 concentration during the winter of 2011–2017 in Hong Kong. According to the screening criteria described in Section 2, there are a total of 21 rapidly deteriorating air quality stages and 17 improving air quality stages in Hong Kong. The amount of pollution episodes during air quality deterioration stages in Beijing is 38 for Guanxiangtai and Haidian and 36 for Yanqing, but 52 for Guanxiangtai and Haidian (wind profile data is missing on 24 February 2019 at Guanxiangtai) and 48 for Yanqing during pollution dissipation (improving air quality) stages. The detailed data are listed in Table S1.
Compared to the severe haze episode shown in Figure 4, the main transport pathway at a height of approximately 1–2 km was not distinct in every pollution episode in Figure 6a. There are likely several reasons for different transportation behavior among pollution events. First, the wind direction in this layer ranges from northwest to northeast during deteriorating air quality stages. Although the PRD region in the northwest of Hong Kong was the main source region of pollution, anthropogenic aerosols in eastern China in the north and northeast of Hong Kong can also be transported to Hong Kong and affect air quality (Ding et al., 2017 [23]; Lin et al., 2018 [24]). Second, the pollution in most cases in Figure 6a–c was not as heavy as that in Figure 4. According to Figure 4, the severe pollution was mainly caused by aerosols transported throughout the entire layer from 1–3 km. This deep atmospheric layer transports pollutants for long distances and triggers severe haze episodes by transboundary processes (Huang et al., 2020 [2]). However, the transport layer in most pollution events in Figure 6a–c was below 2 km, despite missing data in several cases. The transport layer thickness fluctuated slightly among pollution events, blurring the vertical distribution in Figure 6a–c.
On the whole, the main transport pathway was the layer of 1–2 km, according to the wind direction in Figure 6b and the location of the emission source region. From a height of 1 km to near the ground surface, the wind direction became irregular among pollution episodes. This is attributed to friction and interferences by the ground, which calmed the atmosphere in this layer. Calm winds prevailed in the near-surface layer during almost all cases and extended upward to a height of 2 km in some episodes, as shown in Figure 6a. The layer with slow winds during deteriorating air quality episodes was evidently thicker than that in pollution dissipation stages. According to Figure 6d–f, strong winds with speeds close to 10 m/s prevailed in the layer at a height of 1–2 km. High winds may even move downward to the near-surface in some cases. Corresponding to the fast winds, southerly winds prevailed in the layer from 1–2 km during most improving air quality stages. In contrast, the prevailing winds in the layer below approximately 1 km were northerly. This distinct vertical distribution of winds between the layer from 1–2 km and below 1 km (and between rapidly deteriorating and improving air quality stages) suggests that the layer from 1–2 km is the main transport pathway of pollutants affecting Hong Kong. Considering the weather conditions and the fact that the prevailing wind direction has the greatest effect on surface mass concentrations in Hong Kong (Cheng et al., 2006 [22]), the similar surface wind distribution also indicates that severe pollution in Hong Kong is not closely related to winds in the layer below 1 km.
Figure 7 shows the vertical distribution of winds during deteriorating and improving air quality stages in Beijing. Wind directions during these episodes seem more regular at all three stations in Beijing than in Hong Kong. This is most likely because the emission sources and meteorology are relatively simple in Beijing. During winter, emissions transported from the North China Plain in the south reduce the air quality in Beijing and finally dissipate with north-monsoon winds. Vertical wind distributions during the same episodes were slightly different among the three stations in Beijing. Located in the southern suburb of Beijing, Guanxiangtai is connected directly to the North China Plain and was most affected by its emissions. During episodes of deteriorating air quality, southerly winds, ranging from southwest to east–southeast, prevailed in the layer below 500 m at Guanxiangtai. In the upper layer from 500 m to 3 km, southwesterly winds were overwhelmingly dominant. Winds in the layer below 500 m were steady and rarely faster than 5 m/s. This steady layer expands upward, with a maximum height of 3 km in half of all cases. It is clear that steady southwesterly winds transport pollutants through the layer from the surface to a height of 3 km. Similarly, pollution is dispersed by strong northwesterly winds throughout the layer that extends from the surface to 3 km. Winds at Haidian (shown in Figure S3) are similar to those at Guanxiangtai in both deteriorating and improvement stages because the location is similar to that of Guanxiangtai. Conversely, the wind distribution in Yanqing, located in the western mountain area, were slightly different from that at Guanxiangtai and Haidian. In Yanqing, southerly winds prevailed from the surface to a height of 4 km during pollution accumulation stages, with southeast winds in the layer below 1 km and southwest winds in the layer above 1 km (shown in Figure S4). In the stages of improving air quality, winds in Yanqing are more westward than those at Guanxingtai and Haidian (northerly). The vertical distributions of wind at all three stations suggested that the entire layer from the surface to a height of approximately 3 km is the pollution transport pathway in Beijing. The spatial pattern of wind vertical distribution at the three stations also confirmed that unique southerly (northerly) winds from the surface to 3 km control the accumulation (dispersion) of anthropogenic pollutants in Beijing.

4. Conclusions

In recent decades, regions in eastern China have experienced reduced air quality due to the emission and transport of anthropogenic pollution. Located in southeast China, Hong Kong is particularly affected by transported aerosols from the PRD, Yangtze River Delta, and even North China Plain. As a northern city in China, Beijing is also affected by transported air pollutants from the North China Plain. Wind variations at the surface and their vertical profiles were analyzed to investigate the impact of wind on pollutant transport in these regions. The direction of surface winds exhibited a very similar pattern for all stages of rapidly increasing PM2.5 concentration and for the different air quality levels at all three stations in Hong Kong, which indicates that the relationship between surface wind and air quality at ground level is very weak in Hong Kong. On the other hand, changes in the vertical distribution of wind during an episode of extreme air quality deterioration indicate that wind direction in the upper layer from 1–2 km dominates pollutant transport in Hong Kong. This finding is consistent with that of Lin et al. (2018) [24], whereby winds contribute to the regional transport of PM2.5 pollution in Hong Kong. The controlling effect of the 1–2 km layer was also reflected in the vertical wind distribution during stages of improving air quality. Our study suggests that variations in the vertical distribution of wind are more important than variations of surface winds for air quality in Hong Kong.
In contrast, pollution transport to Beijing occurs throughout the entire atmospheric layer that extends from the surface to a height of more than 3 km. This may be explained by the relatively simple meteorology, topography, and emission sources in Beijing compared to Hong Kong. The terrain of Beijing is low in the southeast and high in the northwest. Pollution from the North China Plain in the south of Beijing is distributed from south to north by south-south winds during haze episodes. Usually, monsoon winds from the north in winter clear up pollutants in Beijing. In contrast, sea–land breezes and multiple emission sources complicate pollution transport in Hong Kong. The other important difference is the distance from the emission sources to Hong Kong and Beijing. Located close to the North China Plain, Beijing is easily influenced by the transport of particles emitted from this region. However, the emission source for Hong Kong is typically the Yangtze River regions; therefore, pollution transport involves a long-range and multiple processes such as transboundary mixing (Ding et al., 2017 [23]; Lin et al., 2018 [24]), which contributes to stratification of pollution in the transport pathway.

Supplementary Materials

The following are available online at https://www.mdpi.com/article/10.3390/atmos12040457/s1.

Author Contributions

Data curation, W.Q., W.Z., Y.H. and Z.L.; Formal analysis, D.G.; Funding acquisition, X.Y. and C.Z.; Investigation, X.Y.; Writing – original draft, X.Y.; Writing—review & editing, X.Y., C.Z. and P.-w.C.; Writing—review & editing, F.Z. All authors have read and agreed to the published version of the manuscript.

Funding

This work was supported by the Ministry of Science and Technology of China (2017YFC1501403) and the Fundamental Research Funds for the Central Universities (2017EYT18).

Institutional Review Board Statement

Not applicable.

Informed Consent Statement

Not applicable.

Data Availability Statement

Data used in this study are available upon request via e-mail to Xin Yang ([email protected]).

Conflicts of Interest

The authors declare no conflict of interest.

References

  1. Wang, H.; Xu, J.; Zhang, M.; Yang, Y.; Shen, X.; Wang, Y.; Chen, D.; Guo, J. A study of the meteorological causes of a pro-longed and severe haze episode in January 2013 over Central-Eastern China. Atmos. Environ. 2014, 98, 146–157. [Google Scholar] [CrossRef]
  2. Huang, X.; Ding, A.; Wang, Z.; Ding, K.; Gao, J.; Chai, F.; Fu, C. Amplified transboundary transport of haze by aerosol–boundary layer interaction in China. Nat. Geosci. 2020, 13, 428–434. [Google Scholar] [CrossRef]
  3. Wang, H.; Sun, Z.; Li, H.; Gao, Y.; Wu, J.; Cheng, T. Vertical-distribution characteristics of atmospheric aerosols under different thermodynamic conditions in Beijing. Aerosol Air Qual. Res. 2018, 18, 2775–2787. [Google Scholar] [CrossRef] [Green Version]
  4. Lu, S.-J.; Wang, D.; Wang, Z.; Li, B.; Peng, Z.-R.; Li, X.-B.; Gao, Y. Investigating the role of meteorological factors in the vertical variation in PM2.5 by unmanned aerial vehicle measurement. Aerosol Air Qual. Res. 2019, 19, 1493–1507. [Google Scholar] [CrossRef]
  5. Zhao, D.; Tie, X.; Gao, Y.; Zhang, Q.; Tian, H.; Bi, K.; Jin, Y.; Chen, P. In-situ aircraft measurements of the vertical distribution of black carbon in the lower troposphere of Beijing, China, in the spring and summer time. Atmosphere 2015, 6, 713–731. [Google Scholar] [CrossRef] [Green Version]
  6. Tian, P.; Liu, D.; Huang, M.; Liu, Q.; Zhao, D.; Ran, L.; Deng, Z.; Wu, Y.; Fu, S.; Bi, K.; et al. The evolution of an aerosol event observed from aircraft in Beijing: An insight into regional pollution transport. Atmos. Environ. 2019, 206, 11–20. [Google Scholar] [CrossRef]
  7. Chan, K. Biomass burning sources and their contributions to the local air quality in Hong Kong. Sci. Total Environ. 2017, 596, 212–221. [Google Scholar] [CrossRef] [PubMed]
  8. Nie, W.; Wang, T.; Wang, W.; Wei, X.; Liu, Q. Atmospheric concentrations of particulate sulfate and nitrate in Hong Kong during 1995–2008: Impact of local emission and super-regional transport. Atmos. Environ. 2013, 76, 43–51. [Google Scholar] [CrossRef]
  9. Hagler, G.; Bergin, M.; Salmon, L.; Yu, J.Z.; Wan, E.; Zheng, M.; Zeng, L.; Kiang, C.; Zhang, Y.; Schauer, J. Local and regional anthropogenic influence on PM2.5 elements in Hong Kong. Atmos. Environ. 2007, 41, 5994–6004. [Google Scholar] [CrossRef]
  10. Huang, X.-F.; Yu, J.Z.; Yuan, Z.; Lau, A.K.; Louie, P.K. Source analysis of high particulate matter days in Hong Kong. Atmos. Environ. 2009, 43, 1196–1203. [Google Scholar] [CrossRef]
  11. Yang, X.; Zhao, C.; Zhou, L.; Li, Z.; Cribb, M.; Yang, S. Wintertime cooling and a potential connection with transported aerosols in Hong Kong during recent decades. Atmos. Res. 2018, 211, 52–61. [Google Scholar] [CrossRef]
  12. Li, J.; Gao, W.; Cao, L.; Xiao, Y.; Zhang, Y.; Zhao, S.; Liu, Z.; Liu, Z.; Tang, G.; Ji, D.; et al. Significant changes in autumn and winter aerosol composition and sources in Beijing from 2012 to 2018: Effects of clean air actions. Environ. Pollut. 2021, 268, 115855. [Google Scholar] [CrossRef]
  13. Imai, K.; Nakagawa, T.; Hashiguchid, H. Development of tropospheric wind profiler radar with Luneberg lens antenna (WPR LQ-7). Electr. Wire Cable Energy 2007, 24, 38–42. [Google Scholar]
  14. Tse, K.T.; Li, S.; Chan, P.; Mok, H.; Weerasuriya, A.U. Wind profile observations in tropical cyclone events using wind-profilers and doppler SODARs. J. Wind. Eng. Ind. Aerodyn. 2013, 115, 93–103. [Google Scholar] [CrossRef]
  15. NOAA. Wind Profiler Assessment Report and Recommendations for Future Use; National Weather Service and the Office of Oceanic and Atmospheric Research: 1994. pp. 1–141. Available online: https://ntrl.ntis.gov/NTRL/dashboard/searchResults/titleDetail/PB95131009.xhtml (accessed on 8 March 2021).
  16. Dibbern, J.; Engelbart, D.; Goersdorf, U.; Latham, N.; Lehmann, V.; Nash, J.; Oakley, T.; Richner, H.; Steinhagen, H. Operational Aspects of Wind Profiler Radars; Instruments and Observing Methods Report No. 79; WMO/TD No.1196; World Meteorological Organization: Geneva, Switzerland, 2003; pp. 1–92. [Google Scholar]
  17. World Meteorological Organization. Experience of the Japan Meteorological Agency with the Operation of Wind Profilers. Instrument and Observing Methods, Report No. 110. 2012. Available online: https://library.wmo.int/index.php?lvl=notice_display&id=13911#.YGQxrz8RVPY (accessed on 8 March 2021).
  18. Ishihara, M.; Kato, Y.; Abo, T.; Kobayashi, K.; Izumikawa, Y. Characteristics and performance of the operational wind profiler network of the Japan Meteorological Agency. J. Meteorol. Soc. Jpn. 2006, 84, 1085–1096. [Google Scholar] [CrossRef] [Green Version]
  19. Ma, Q.; Wu, Y.; Tao, J.; Xia, Y.; Liu, X.; Zhang, D.; Han, Z.; Zhang, X.; Zhang, R. Variations of Chemical Composition and Source Apportionment of PM2.5 during Winter Haze Episodes in Beijing. Aerosol Air Qual. Res. 2017, 17, 2791–2803. [Google Scholar] [CrossRef] [Green Version]
  20. Xing, M.; Liu, W.; Li, X.; Zhou, W.; Wang, Q.; Tian, J.; Li, X.; Tie, X.; Li, G.; Cao, J.; et al. Vapor isotopic evidence for the worsening of winter air quality by anthropogenic combustion-derived water. Proc. Natl. Acad. Sci. USA 2020, 117. [Google Scholar] [CrossRef] [PubMed]
  21. Du, W.; Dada, L.; Zhao, J.; Chen, X.; Daellenbach, K.R.; Xie, C.; Wang, W.; He, Y.; Cai, J.; Yao, L.; et al. A 3D study on the amplification of regional haze and particle growth by local emissions. NPJ Clim. Atmos. Sci. 2021, 4. [Google Scholar] [CrossRef]
  22. Cheng, Y.; Ho, K.; Lee, S.; Law, S. Seasonal and diurnal variations of PM1.0, PM2.5 and PM10 in the roadside environment of Hong Kong. China Particuology 2006, 4, 312–315. [Google Scholar] [CrossRef]
  23. Ding, H.; Liu, Y.; Yu, Z.; Cheung, C.; Zhan, J. Spatial and temporal characteristics and main contributing regions of high PM2.5 pollution in Hong Kong category: Observations of aerosols at mountainous, coastal, and urban measurement sites. Aerosol Air Qual. Res. 2016, 17, 2955–2965. [Google Scholar] [CrossRef] [Green Version]
  24. Lin, C.; Li, Y.; Lau, A.K.H.; Li, C.; Fung, J.C.H. 15-Year PM2.5 trends in the Pearl River Delta region and Hong Kong from satellite observation. Aerosol Air Qual. Res. 2018, 18, 1680–8584. [Google Scholar] [CrossRef]
Figure 1. Location of the study area of Hong Kong and Beijing in China. Locations of PM2.5 (red squares) and wind observation stations are also shown. Red triangles and solid dots denote surface meteorological stations and wind profiler stations, respectively.
Atmosphere 12 00457 g001
Figure 2. Surface wind distribution under the five pollution scenarios during 2011–2017 for Sham Shui Po in Hong Kong. Panels (ad), (eh), (il), and (mq) show the results for spring, summer, autumn, and winter, respectively. Green, dark yellow, orange, red, and purple denote the five pollution scenarios, with corresponding PM2.5 concentration (μg/m3) thresholds of 0.0–12.0, 12.1–35.4, 35.5–55.4, 55.5–150.4, and 150.5–250.4, respectively. Spring is March–April–May, summer is June–July–August, autumn is September–October–November, and winter is December–January–February. Note that surface winds for Sham Shui Po are from the nearest meteorological station of King’s Park.
Atmosphere 12 00457 g002aAtmosphere 12 00457 g002b
Figure 3. Distribution of wind direction from near-surface to the heights of 2 km in winter during 2009–2017 at Sham Shui Po in Hong Kong: (a) 315–720 m and (b) 923–1732 m. The five pollution scenarios are the same as those in Figure 2. The interval is 5 degrees in the statistical calculation of wind direction distribution.
Atmosphere 12 00457 g003
Figure 4. Aerosol concentrations (MERRA-2 total aerosol extinction of aerosol optical thickness at 550 nm) over China at 08:00 local time on (a) 7 January 2014, (b) 8 January 2014, and (c) 9 January 2014. Arrows denote wind speed and direction at 850 hPa, derived from ERA5. Vertical evolution of (d) wind speed and (e) wind direction at Sham Shui Po in Hong Kong during severe haze episodes in January 2014. (f) Time series of PM2.5 mass concentrations at Sham Shui Po in Hong Kong during severe haze episodes in January 2014.
Atmosphere 12 00457 g004
Figure 5. Aerosol concentrations (MERRA-2 total aerosol extinction of aerosol optical thickness at 550 nm) and winds (derived from ERA5) at (a) 900 hPa, (b) 850 hPa, and (c) 800 hPa over north China at 18:00 local time on 27 to 28 December. Vertical evolution of (d) wind speed and (e) wind direction at Guanxiangtai in Beijing during the haze episode in December 2016. (f) Time series of PM2.5 mass concentrations at Guanxiangtai in Beijing during the haze episode in January 2016.
Atmosphere 12 00457 g005
Figure 6. Vertical evolution of wind during (ac) increasing and (df) decreasing haze episodes in winter at Sham Shui Po, Hong Kong. Upper, middle, and lower panels indicate wind speed, wind direction, and PM2.5 mass concentrations, respectively. Note that wind direction centered on the east to display continuously for direction of the emission source (north) and of the clear air mass (south).
Atmosphere 12 00457 g006
Figure 7. Vertical evolution of wind during the haze episodes in winter at Guanxiangtai in Beijing. (ac) are episodes of increasing PM2.5 concentration and (df) are episodes of decreasing PM2.5 concentration. Upper, middle, and lower panels indicate wind speed, wind direction, and PM2.5 mass concentrations, respectively. Note that wind direction centered on the east to display continuously for direction of the emission source (south) and of the clear air mass (northwest).
Atmosphere 12 00457 g007
Table 1. US EPA air quality index based on PM2.5 concentrations (μg/m3) and number of samples for each air quality category at the three stations.
Air QalityAir Quality Category
1
Air Quality Category
2
Air Quality Category
3
Air Quality Category
4
Air Quality Category
5
Air Quality Category
6
Station & Season
PM2.5
health effects statement according to U.S. EPA
PM2.5 air pollution poses little or no riskUnusually sensitive individuals may experience respiratory symptomsAn increasing likelihood of respiratory symptoms in sensitive individuals, aggravation of heart or lung disease, and premature mortality in persons with cardiopulmonary disease and the elderlyIncreased aggravation of heart or lung disease and premature mortality in persons with cardiopulmonary disease and the elderly; increased respiratory effects in the general populationSignificant aggravation of heart or lung disease and premature mortality in persons with cardiopulmonary disease and the elderly; a significant increase in respiratory effects in the general populationSerious aggravation of heart or lung disease and premature mortality in persons with cardiopulmonary disease and the elderly; serious risk of respiratory effects in the general population
PM2.5 concentration:
μg/m3
0.0–12.012.1–35.435.5–55.455.5–150.4150.5–250.4250.5–500.4
Tap Mun
Station
spring630521,95477332734150
summer1860912,31717731074120
autumn378816,27790665631210
winter174214,40511,2267592340
Sha Tin
Station
spring31767417140326810
summer7614338254023300
autumn24906768243486700
winter1182657432592051180
Sham Shui Po
Station
spring16149246303068700
summer4810689569029000
autumn16138179345293700
winter90373084349195850
Table 2. Sample number of winds for the four air quality categories at the two layers in Figure 3.
Altitude315–720 m923–1732 m
Air Quality Category
Level 112,68522,308
Level 2107,322181,213
Level 372,906120,746
Level 434,78155,955
Publisher’s Note: MDPI stays neutral with regard to jurisdictional claims in published maps and institutional affiliations.

