Article

Biases of Global Tropopause Altitude Products in Reanalyses and Implications for Estimates of Tropospheric Column Ozone

1
School of Atmospheric Sciences, Nanjing University, Nanjing 210023, China
2
Department of Geography and Planning, University of Toronto, Toronto, ON M5S 3G3, Canada
3
Air Quality Research Division, Environment and Climate Change Canada, Downsview, ON M3H 5T4, Canada
4
School of Geography, Geomatics and Planning, Jiangsu Normal University, Xuzhou 221116, China
*
Author to whom correspondence should be addressed.
Atmosphere 2021, 12(4), 417; https://doi.org/10.3390/atmos12040417
Submission received: 3 February 2021 / Revised: 9 March 2021 / Accepted: 17 March 2021 / Published: 24 March 2021
(This article belongs to the Special Issue Climate Reanalysis)

Abstract

:
Accuracy of global tropopause altitude products from reanalyses is important to applications of the products, including the derivation of tropospheric column ozone (TCO). Here, monthly biases in lapse-rate tropopause pressure (PLRT) in two reanalyses, NCEP/NCAR and MERRA-2, and associated implications for estimating TCO are examined, based on global radiosonde observations over 1980–2017 at 689 stations. Our analysis suggests that the global mean PLRT is underestimated by −2.3 hPa in NCEP/NCAR and by −0.9 hPa in MERRA-2, mainly attributable to large negative biases around the subtropics (~20°–50°) in both hemispheres, with generally positive biases at other latitudes. Overall, NCEP/NCAR outperforms MERRA-2 in the Northern Hemisphere but underperforms MERRA-2 in the Southern Hemisphere. PLRT biases in the two reanalyses vary more evidently with latitude than with longitude. From winter to summer, the peaks of negative PLRT biases around the subtropics shift poleward by ~10°. Approximately, 70% of the reanalysis PLRT biases are within −10–10 hPa. Consequently, a negative (positive) PLRT bias induces a positive (negative) TCO bias. In absolute magnitude, the mean ozonesonde TCO bias attributable to PLRT biases is ~0.2, ~0.8 and ~1.2 Dobson Units (DU) if a PLRT bias is within 0–5, 10–15, and 10–15 hPa. Using a global ozone climatology, we estimate that the global mean bias in TCO induced by the PLRT biases in both reanalyses is positive, being 0.64 DU (or 2.2%) for NCEP/NCAR and 0.28 DU (or 1.1%) for MERRA-2.

Graphical Abstract

1. Introduction

As the boundary between the well-mixed convective troposphere and the radiatively controlled stratosphere, the tropopause closely relates to multiple processes in the atmosphere. Long-term changes in tropopause height are thought to be an indicator of climate change [1,2,3]. Previous studies [1] suggest that an increase in tropopause height is mainly attributable to warming of the troposphere due to an increase in well-mixed greenhouse gases (GHGs) and cooling of the stratosphere due to a reduction in stratospheric ozone and the increase in GHGs. The tropopause height frequency (THF) methodology is frequently used in exploring the long-term widening of the tropical belt [4]. Furthermore, tropopause properties, including height, pressure, and temperature, are strongly related to stratosphere-troposphere exchange (STE). Changes in tropopause temperature, especially in the tropics, could substantially affect the transport of water vapor from the troposphere to the stratosphere [5,6,7]. The determination of the tropopause is a prerequisite for identifying and classifying STE events using trajectory methods [8,9]. The tropopause is also the upper limit for integration of tropospheric properties in chemistry and physics, such as tropospheric column ozone (TCO) [10,11] and tropospheric temperature [12]. Satellite retrievals of stratospheric aerosol optical depths (SAOD) are often presented by integrating aerosol loads above the tropopause [13,14]. Previous studies have indicated that TCO values are sensitive to the tropopause definition [15,16]. In model simulations, different tropopause definitions might lead to 1–12% variability in TCO values, which can result in a difference in ozone radiative forcing by 5–41 mWm−2 [17].
Based on thermal, dynamical, and chemical characteristics of the atmosphere, the tropopause is determined by several criteria. The lapse-rate tropopause (LRT) is the original thermal definition of the tropopause [18], which is widely applied to explore global tropopause variations [19]. The second thermal definition of the tropopause, the cold point tropopause [20], is relevant to water vapor entering the stratosphere from the troposphere in the tropics [7,21]. However, the cold point tropopause is reliably coincident with the lapse-rate tropopause only within the deep tropics (20° S–20° N). The dynamic tropopause is determined by the potential vorticity (PV) threshold (ranges from ±1–4 PVU, usually ±2 PVU) and only applied in the extratropics [22] because PV values converge to zero at the equator. The PV-based tropopause is commonly used for discussing STE events in the extratropics [23]. Thresholds of ozone (O3) concentration or of the vertical gradient of O3 concentration are used to determine a chemical tropopause; these thresholds may vary in different latitudes [24]. Overall, the LRT is the most commonly used definition: it is globally applicable, generally consistent with other definitions (where they are valid), and can be determined unambiguously from individual temperature profiles [25,26] except at times in Antarctic winter [27].
Accurate determination of the tropopause is possible from radiosonde data [28], which provide thermodynamic profiles of the atmosphere from the near surface up to 30 km since the 1900s. However, the limited spatial coverage and temporal inhomogeneities of radiosonde stations are notable, and hamper assessment of the latitude-longitude variations of the global tropopause. A new observational dataset, the Global Positioning System (GPS) radio occultation (RO) data, provides atmospheric parameter profiles with high accuracy and global coverage, since the late 1990s. Previous studies have explored the spatiotemporal structure of the global tropopause on various timescales based on the GPS RO data [29,30,31].
Alternatively, reanalysis data, which provide global coverage of the tropopause for long-term periods, have been widely used in numerous applications for evaluating tropopause characteristics globally [2,3,32,33,34] and exploring the relationship between the tropopause and other variables such as O3 [35,36]. Some reanalysis data contain LRT data, which are routinely posted online, such as NCEP/NCAR reanalysis (the National Centers for Environmental Prediction/National Center for Atmospheric Research Reanalysis 1) [37], while others only provide atmospheric thermal profiles, from which users can derive the LRT themselves. However, the reanalysis data usually suffers from coarse vertical resolution compared with observational data. Therefore, reanalysis data may underestimate the sharpness of the tropopause [38,39], miss double tropopauses [40], and cause biases in estimates of tropopause properties [41]. Previous studies suggested that coarse vertical resolutions near the UTLS in reanalyses can greatly impact accuracy in determination of the tropopause [40,41]. In the tropics, tropopause pressure and temperature in NCEP/NCAR reanalysis have been found to be overestimated by 2–5 hPa and by 3–5 K, respectively, in comparison with radiosonde data for 1979–1997 [42]. Xian and Homeyer [40] studied four reanalysis datasets and found that the largest biases of LRT in these data appear in the subtropics (20°–45°) of each hemisphere. In their study, LRT is estimated from atmospheric thermal profiles in these reanalysis data [40]. In addition, different reanalysis LRT data can produce inconsistent values of tropopause properties [40,41,42]. As biases in reanalysis LRT would be passed to applications of these LRT data, such as in estimating TCO and STE mass fluxes, the LRT biases should be assessed thoroughly to provide confidence and appropriate cautions for usage of reanalysis LRT data.
As reanalyses are often regridded into different horizontal resolutions for different applications [40,43], whether LRT biases in a reanalysis dataset vary with its horizontal resolution is also a question to address. In many applications, it is necessary to identify the layer containing the tropopause in a profile of interest with a certain vertical resolution. Examples of such profiles include vertical temperature and ozone mixing ratio. LRT biases in reanalyses may cause misidentification of the tropopause layer. It is important to analyze how the misidentification rate varies with LRT biases and the vertical resolutions of the profile.
The tropopause is the upper limit for integration of TCO, and is therefore a prerequisite for estimating TCO. However, how large are the TCO biases induced from the LRT biases in reanalyses? How do the induced TCO biases vary spatially? Would the global mean TCO be overestimated or underestimated due to the LRT biases? These questions are worthy of investigation. An assessment of the LRT bias is useful to separating this bias from the overall bias for an estimation of TCO. Fishman et al. [44] and Ziemke et al. [45] developed the tropospheric ozone residual method to derive TCO based on satellite observations, by subtracting the stratospheric column ozone from the total column ozone. In this method, the information on the tropopause also is a critical prerequisite. TCO values are relevant to estimating the global tropospheric ozone burden and the tropospheric ozone radiative forcing [17,46,47,48], further suggesting the importance of assessing the induced TCO biases. Such assessments are also useful to wide applications of TCO data, for example, in data assimilation studies [49].
This study aims to address the above-discussed questions. Through comparison with radiosonde observations, we characterize the biases in global LRT data in two reanalyses, NCEP/NCAR and the National Aeronautics and Space Administration Modern-Era Retrospective analysis for Research and Applications, version 2 (MERRA-2), over 1980–2017 (Section 3.1). We examine how changes in horizontal resolution in the reanalyses affect LRT biases (Section 3.2). We quantify how LRT biases affect the identification of the tropopause layer in a vertical profile of interest (Section 3.2). Finally, we analyze the TCO biases induced from using the reanalysis PLRT as the upper integration limit (Section 3.3). The radiosonde, reanalysis, and ozone data are introduced in Section 2, and conclusions are provided in Section 4.

2. Materials and Methods

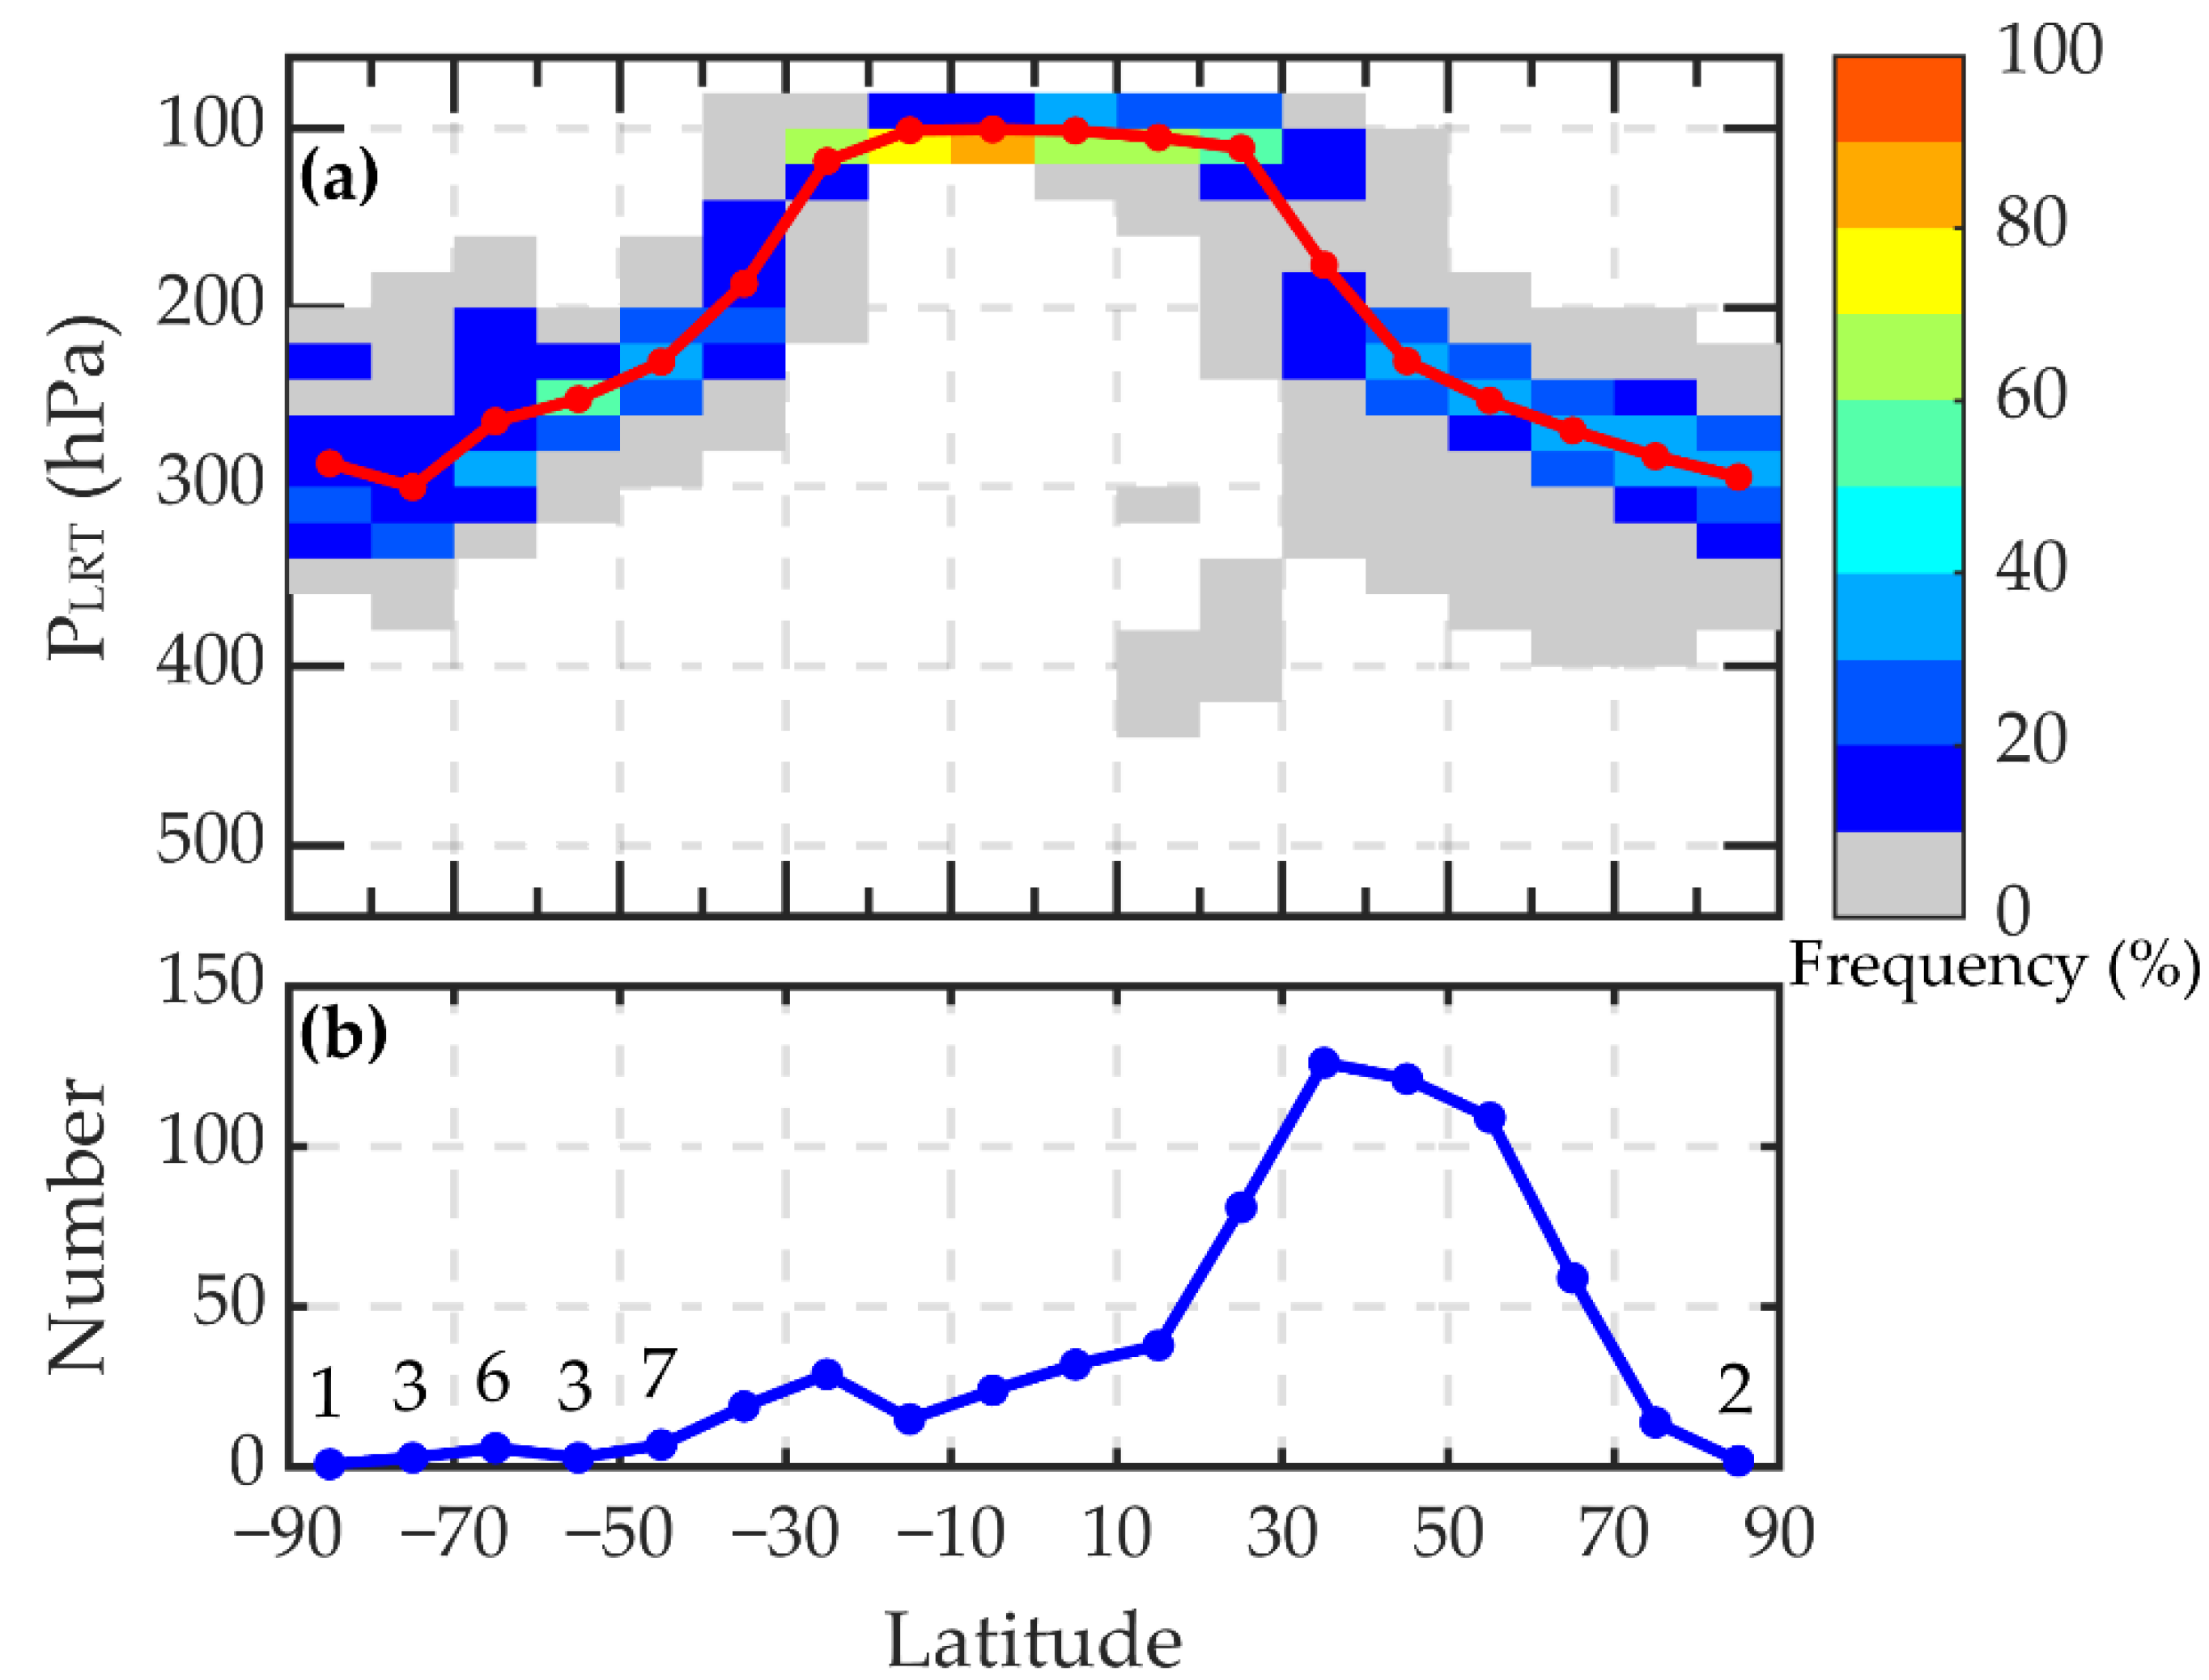
2.1. Tropopause Data from Radiosonde Data

Radiosonde observations used in this study were acquired from the Integrated Global Radiosonde Archive (version 2, IGRA 2), which provides historical sounding records at over 2700 stations globally [50]. We selected 689 radiosonde stations with reasonably complete and recently updated sounding records over 1980–2017. Each station selected for analysis satisfies the criteria that the station still reports data after 2014 (inclusive) and has at least 10,000 archived soundings. Figure 1 shows the number of selected stations in each 10° latitudinal zone.
The method of Zängl and Hoinka [27] was applied to detect LRT based on the geopotential height, pressure, and temperature profiles provided by the radiosonde data. The first lapse-rate tropopause is defined as “the lowest level at which the lapse rate decreases to 2 °C/km or less, provided also the average lapse rate between this level and all higher levels within 2 km does not exceed 2 °C/km” [18]. A secondary tropopause is detected “if above the first tropopause the average lapse rate between any level and all higher levels within 1 km exceeds 3 °C/km, then a second tropopause is defined by the same criterion”. In this paper, the tropopause height and the corresponding pressure refer to the first LRT height (HLRT) and the first LRT pressure (PLRT) unless stated otherwise. To avoid unrealistic PLRT and HLRT detected in some soundings, a calculated PLRT or HLRT in a sounding was regarded as invalid if (1) the HLRT is lower than 5 km (~550 hPa for PLRT) or higher than 18 km (~75 hPa for PLRT), or (2) the sounding has no records above 2 km of the HLRT, or (3) the HLRT exceeds the range of the mean HLRT ± two standard deviations over 1980–2017 at the station. Because both the reanalyses only provide PLRT data, we used PLRT, instead of HLRT, from radiosondes to reduce interpolation errors for direct comparisons between radiosonde and reanalysis PLRT. In Table 1, we provide assessments of both PLRT and HLRT biases on hemispheric and global scales. The HLRT biases (Table 1) are converted from PLRT biases based on the hydrostatic equation.
Following the criteria set by Seidel and Randel [28], we calculate a monthly PLRT only if the daily value of PLRT is available on at least 15 days in that month, which is appropriate for balancing temporal homogeneity and completeness of radiosonde soundings. In fact, our result is not sensitive to the selection of the threshold of available daily means (see Appendix A). To compare with the reanalysis data (see Section 2.2), monthly means of PLRT in radiosonde data were binned into the same longitude-latitude grids as the reanalysis data, before bias analysis (Figures 2–8). That is, the monthly mean PLRT at a grid cell was averaged from the monthly means over all stations within the grid cell. The first grid cell center of the gridded dataset was set to 90° S in latitude and 180° W in longitude minus a half of grid cell size in latitude and longitude.

2.2. Tropopause Data from Reanalysis Data

Monthly means of PLRT are available from the NCEP/NCAR [37] since 1948 and from the MERRA-2 (the National Aeronautics and Space Administration Modern-Era Retrospective analysis for Research and Applications, Version 2) [51] since 1980. In this study, we used the monthly means of PLRT over 1980–2017 from these two reanalysis datasets because (1) in these two reanalyses, PLRT are directly available, which benefits wide applications of the PLRT products. For other reanalyses, users have to derive PLRT from the reanalysis thermal profile data by themselves, like in Xian and Homeyer [40]; (2) using PLRT directly reduces calculation errors in deriving PLRT from the thermal profile data.
The NCEP/NCAR reanalysis is produced with a global spectral model with T62 horizontal resolution and 28 vertical sigma levels [37], while the MERRA-2 is produced with version 5.12.4 of the GEOS atmospheric data assimilation system [51] using a finite-volume dynamical core [52] at a horizontal resolution of 0.5° × 0.625° and 72 hybrid-eta levels from the surface to 0.01 hPa. NCEP/NCAR PLRT is derived only partly following the WMO definition, as the thickness criterion is not applied [53]. NCEP/NCAR PLRT data have been used in a wide range of applications [3,11,54]. The upper and lower limits allowed for PLRT in the NCEP/NCAR calculation are 450 and 85 hPa. Kalnay et al. [37] reported that PLRT is placed in the “A” (first) class of reliability in the reanalysis, suggesting that NCEP/NCAR PLRT data are more influenced by the observations than by the assimilation. Nevertheless, there are still PLRT biases in NCEP/NCAR PLRT, as reported in the literature [42]. NCEP/NCAR and MERRA-2 provide data, respectively, on grids of 2.5° × 2.5° and 0.625° × 0.5° in longitude and latitude. In the upper troposphere-lower stratosphere (UTLS) region, the vertical resolutions are ~1.5–2 km for NCEP/NCAR and ~1.1 km for MERRA-2 [55]. To examine biases in PLRT under different horizontal resolutions, we remapped PLRT from the original resolution in each of the reanalyses to different resolutions, which are 1° × 1° and 5° × 5° for NCEP/NCAR data and 1° × 1°, 2.5° × 2.5°, and 5° × 5° for MERRA-2 data. We remapped the PLRT value for a grid cell from the PLRT values at all the nearest neighbor grid cells, following the distance-weighted method. The Climate Data Operators (CDO) software (https://code.mpimet.mpg.de/projects/cdo/files, accessed on 14 October 2020) is used to perform the remapping. Note that the grid cell centers of the reanalysis datasets on the original or other resolutions were also adjusted to be consistent with the radiosonde data before the bias analysis (see Section 2.1).
To assess mean PLRT biases globally and by hemisphere, cosine-weighted latitudinal averages are taken at 10° latitudinal intervals. In this way, the impact of spatial inhomogeneity of radiosonde data on the global and hemispheric means is minimized. The corresponding standard deviations are calculated in the same way.

2.3. Ozone Data and Derivation of TCO

To derive TCO at a grid cell, the following data at that grid cell are needed: the ozone profile, the pressure profile, and the PLRT. We used two sets of ozone profile data. The first is from the global ozonesonde stations, available from the World Ozone and Ultraviolet Radiation Data Centre (WOUDC). Most of the profiles are from the electrochemical concentration cell (ECC)-type ozonesonde, which was introduced in the early 1970s and adopted by a majority of stations in the global network by the early 1980s. The original ozone profiles over 1980–2008 with various vertical resolutions were uniformly processed to 1-km vertical resolution and ozone volume mixing ratio was calculated for each of the 1-km layers from the sea level. A monthly mean of ozone volume mixing ratio in a layer was calculated only if one or more ozonesonde data are available in that layer and month. Accordingly, pressure profiles were processed at 1-km vertical resolution from radiosonde data. We used the reanalysis PLRT at their original horizontal resolutions, which are 2.5° × 2.5° for NCEP/NCAR and 0.625° × 0.5° for MERRA-2 (longitude × latitude). To be consistent with horizontal resolution of the reanalyses, all data, including ozonesonde profiles, radiosonde pressure profiles and radiosonde PLRT were gridded to 2.5° × 2.5° for NCEP/NCAR and 0.625° × 0.5° for MERRA-2 (longitude × latitude). In this processing, the mean of a variable at the corresponding grid cell was taken from one or more data points within that grid cell. Using the same ozone profile and radiosonde pressure profile at a grid cell, we can derive TCO at that grid cell using the PLRT value from the radiosonde and from one of the reanalyses, such as NCEP/NCAR. Therefore, the TCO bias is only attributable to the PLRT bias in that reanalysis. In a given month, the TCO bias at a grid cell can be assessed only if ozonesonde, radiosonde, and reanalysis data are all available at the grid cell. The number of available monthly samples are 6423 for NCEP/NCAR and 4679 for MERRA-2, as the horizontal resolution of NCEP/NCAR is coarser than that of MERRA-2.
Considering the limited spatial and temporal coverages of the ozonesonde data, we also used the second set of ozone profile data, which are the gridded ozone profiles from the Trajectory-mapped Ozonesonde dataset for the Stratosphere and Troposphere (TOST) over 1980–2012. This is derived from ozone soundings using a trajectory-based ozone mapping methodology [56]. The trajectory-mapping approach is an effective method for interpolating sparse ozonesonde measurements [56,57]. TOST provides monthly means of ozone volume mixing ratio binned into grids of 5° × 5° × 1 km (latitude, longitude, altitude) from sea level up to 26 km. For consistency with TOST data, we regridded the PLRT from the two reanalyses on grids of 5° × 5° (longitude, latitude). This 5° × 5° resolution for PLRT has a minor effect on the comparison between radiosonde and reanalysis data (see Section 3.2). We followed the procedure described in Section 2.1 to derive monthly means of vertical pressure profile on grids of 5° × 5° × 1 km (latitude, longitude, altitude) from radiosonde data. Using TOST data, we calculated the monthly mean TCO at grids only if ozone mixing ratios are available at over 80% of the vertical layers from surface to the tropopause at these grids. In the TCO calculation, the PLRT from radiosonde and from the two reanalyses were used respectively, while the vertical ozone and pressure profiles are the same. Therefore, the biases in reanalysis-PLRT-based TCO are induced by the PLRT biases in the reanalyses only.

3. Results

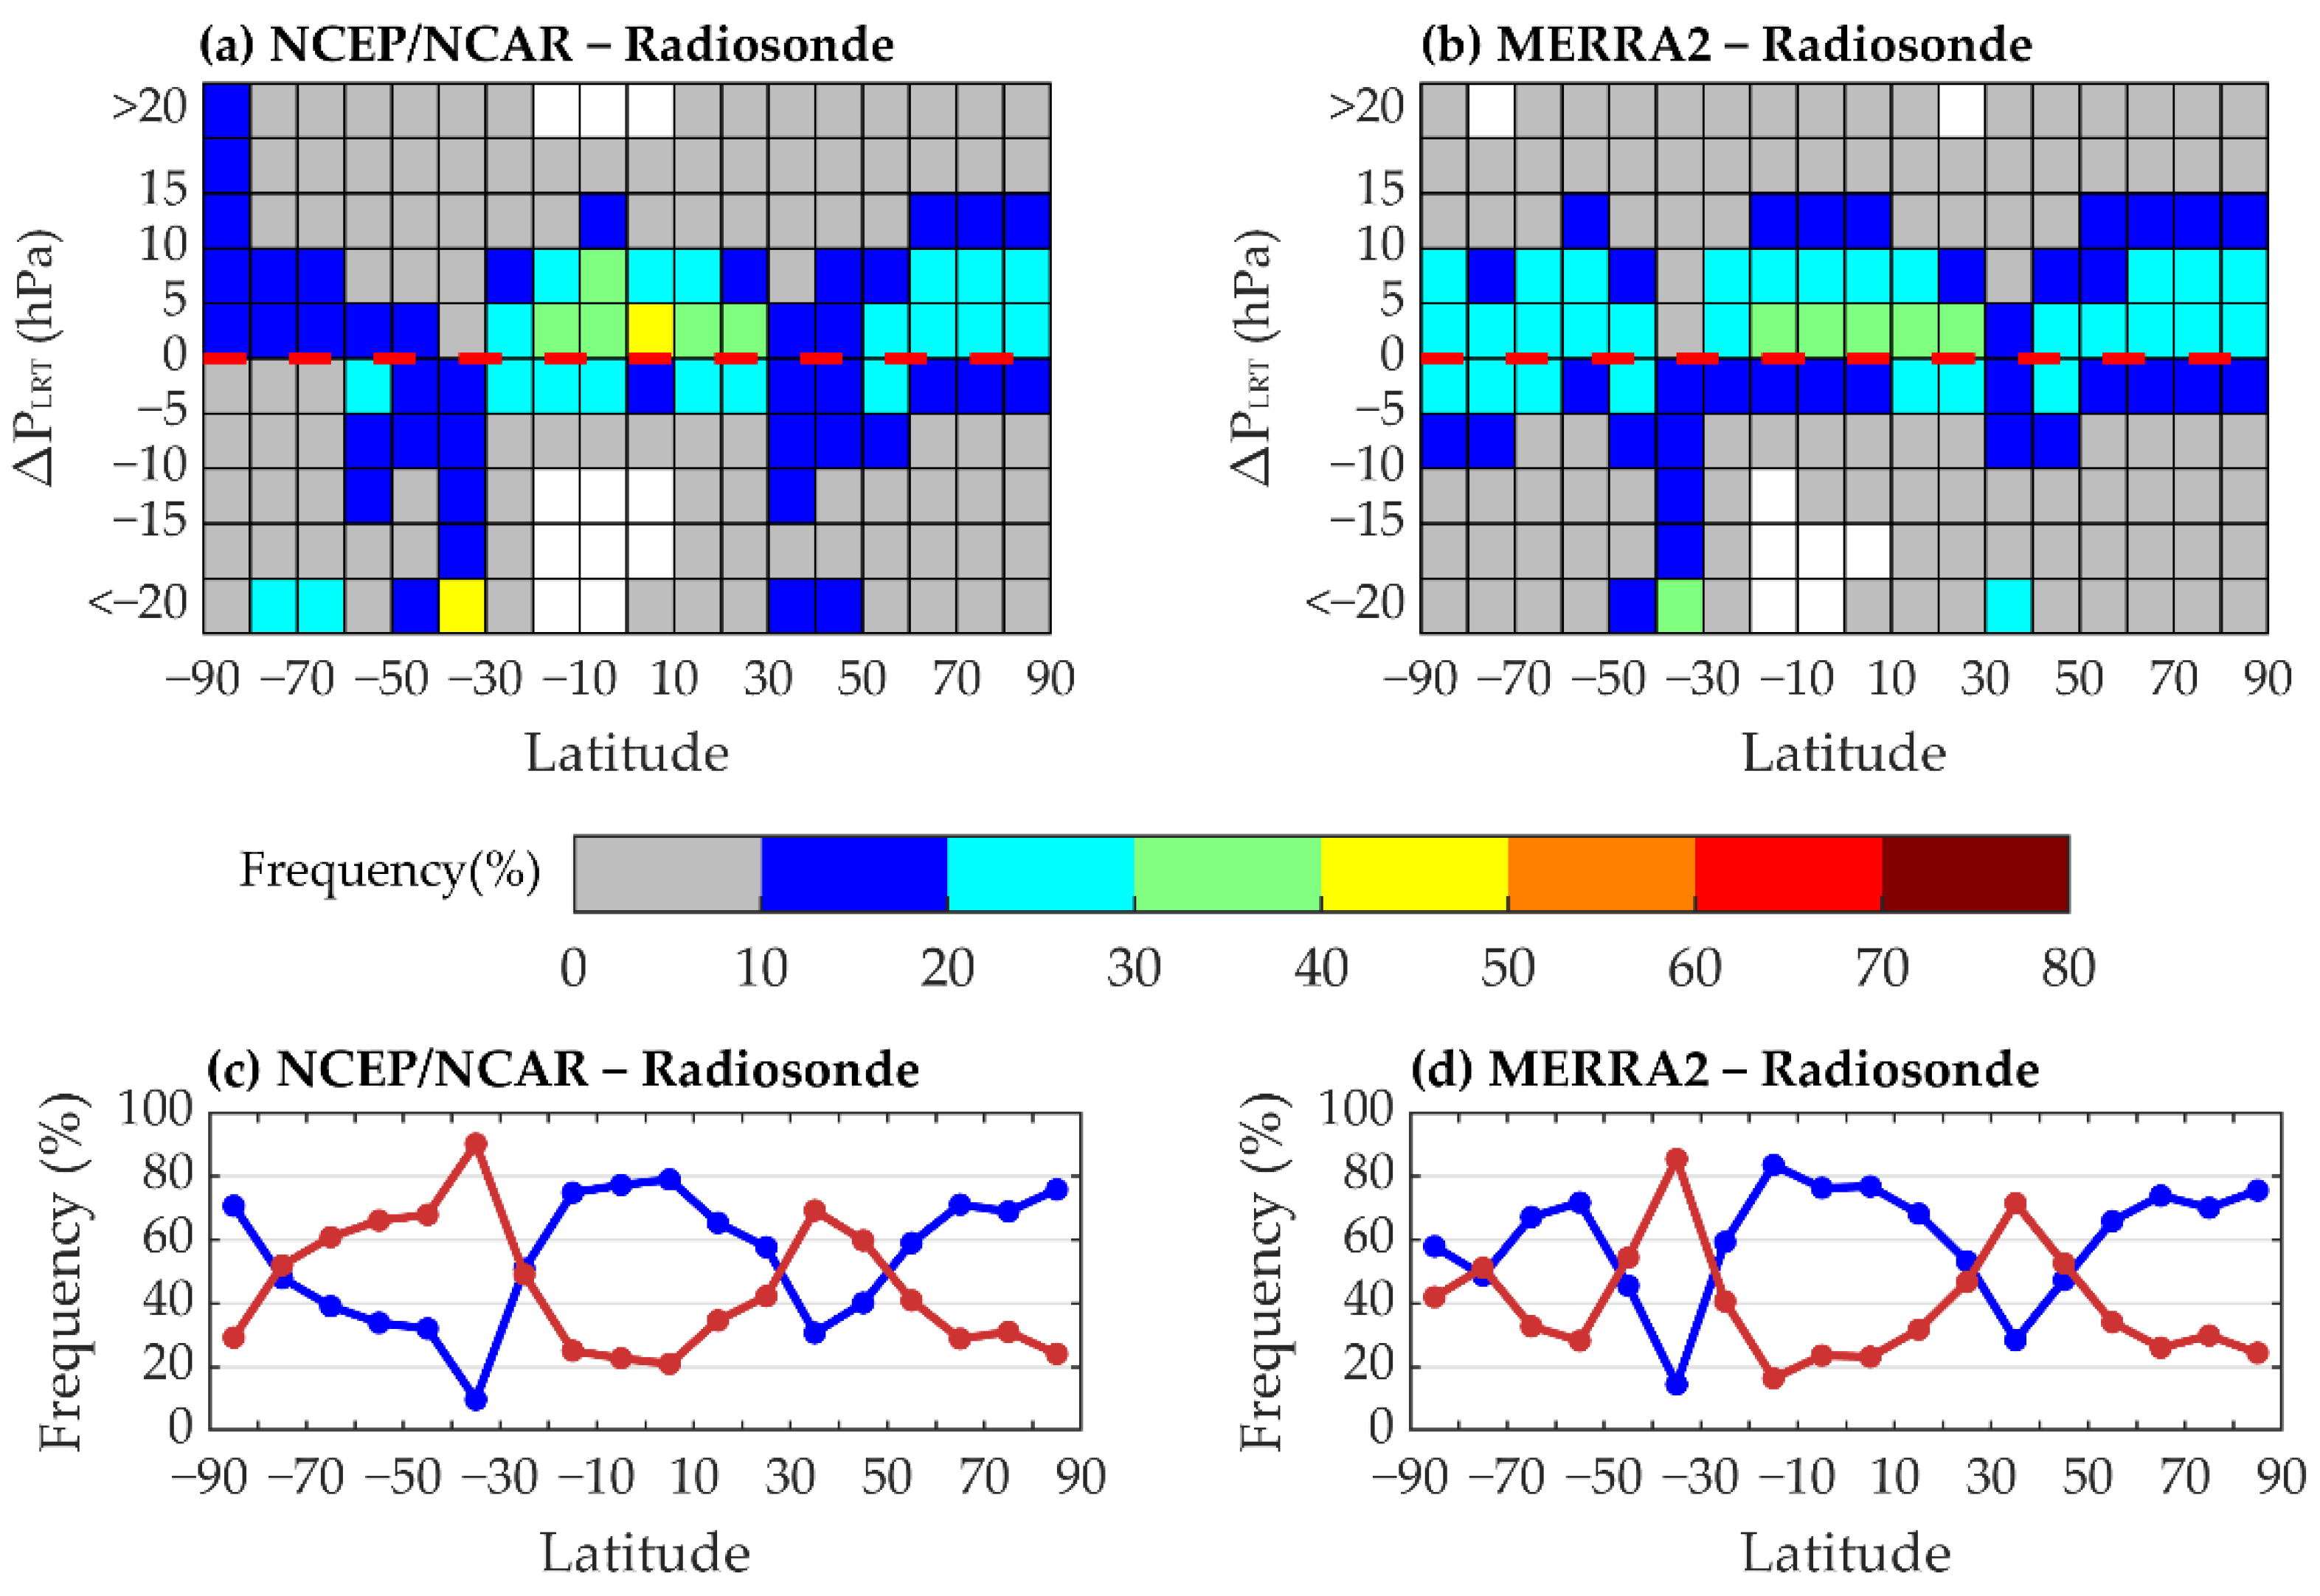
3.1. Spatial and Seasonal Variations in PLRT Biases

To evaluate PLRT biases in NCEP/NCAR and MERRA-2, we compared the monthly mean PLRT between the radiosonde and each of the reanalyses at their original horizontal resolutions. Figure 1 shows the climatological PLRT variation with latitude, based on all radiosonde data from 1980–2017. Although stations are predominantly located in the mid-latitudes of the Northern Hemisphere (NH), the latitudinal structure of PLRT is well depicted globally. The climatological PLRT increases from ~100 hPa around the equator to ~300 hPa near the polar regions, consistent with the latitudinal variation in the literature from reanalyses [2], GPS radio occultation [58], and radiosonde data [28].
NCEP/NCAR pioneered development of reanalysis data so that the NCEP/NCAR reanalysis has the longest temporal coverage (1948–present). Figure 2 shows that PLRT in NCEP/NCAR is usually overestimated by 0.5–5.5 hPa in the tropics (20° S–20° N) and at high latitudes of the NH (60°–90° N). In the tropics, positive PLRT biases of 2–6 hPa in NCEP/NCAR were found by Randel et al. [42], associated with a tropopause temperature overestimated by 3–5 K. In the subtropics (~20°–50°) of each hemisphere, PLRT in NCEP/NCAR is underestimated, and the bias reaches ~14 hPa around 30°–40° S. In MERRA-2, the largest biases of PLRT occur in the subtropics, consistent with the maximum biases of HLRT found there by Xian and Homeyer [40]. This is the location of the “tropopause break”, a sharp discontinuity in the first lapse-rate tropopause, found near the subtropical jets at roughly 30° S and 30° N (also evident in Figure 1). The subtropics in both hemispheres are transition zones where PLRT values are remarkably sensitive to the location and intensity of the subtropical jets since the steepest gradients of PLRT are near the jets [2,19].
A notable negative bias of about −20 hPa appears in the south polar region (70°–80° S) in NCEP/NCAR. The accuracy of PLRT at high latitudes of the Southern Hemisphere (SH) in MERRA-2, which was first released in 2015, is apparently much better. As a result, the mean PLRT bias over the SH is −4.00 ± 5.64 hPa in NCEP/NCAR, in comparison with −0.49 ± 3.6 hPa in MERRA-2 (Table 1). However, the mean PLRT bias over the NH is −0.57 ± 6.04 hPa in NCEP/NCAR, smaller than the mean value of −1.34 ± 9.83 in MERRA-2. Overall, the global mean PLRT bias is −2.28 ± 5.84 hPa in NCEP/NCAR and −0.92 ± 6.71 hPa in MERRA-2 over 1980–2017 (Table 1). Correspondingly, the global HLRT is overestimated by 52 m in NCEP/NCAR and 16 m in MERRA-2. Therefore, for applications of PLRT products, MERRA-2 may be a better choice between the two reanalyses on the global scale, whereas by hemisphere, NCEP/NCAR outperforms MERRA-2 in the NH but underperforms MERRA-2 in the SH. PLRT biases vary much more with latitude than with longitude in both reanalyses.
Figure 3a,b shows how the occurrence frequencies of positive and negative PLRT biases vary with latitude. The most extreme negative biases (below −20 hPa) appear most frequently (~30–40%) around 30°–40° S, where the mean negative biases peak (~14 hPa, see Figure 2). From 60°–90° S, the distribution of PLRT biases is more varied and extreme biases (over 20 hPa or below −20 hPa) appear more frequently in NCEP/NCAR than in MERRA-2, indicating better PLRT estimates in MERRA-2 for this region. Surprisingly, for NCEP/NCAR PLRT, most extreme biases are negative in the nine stations between 60° S and 80° S but positive at the Amundsen–Scott station located at 90° S. Except for 60°–90° S in the NCEP/NCAR, and the subtropics in the two reanalyses, most PLRT biases fall into a range from −10 hPa to 10 hPa at the remaining latitudes (Figure 3a,b). Additionally, positive PLRT biases appear more frequently (60–80%) than negative biases at the remaining latitudes, while the occurrence frequency of negative PLRT biases peaks over 30°–40° near the subtropical jet in each hemisphere (Figure 3c,d). Over the globe, positive and negative biases have comparable frequencies (~50%) and the negative global mean PLRT bias (Table 1) is attributable to the large negative biases around the subtropical jets.
The latitudinal variation of PLRT biases by season (Figure 4) is generally similar to that of the annual mean (Figure 2). However, some changes with season are notable. The seasonal variation of PLRT biases in each latitudinal zone around the extratropics (20°–90°) appears larger in NCER/NCAR than in MERRA-2. In both reanalyses, positive PLRT biases in the tropics occur in JJA and SON, while negative PLRT biases in the subtropics are persistent in all seasons. Around the subtropics, negative PLRT biases in MERRA-2 are slightly larger in winter or spring (JJA or SON for the SH; DJF or MAM for the NH), as has been found before for ERA Interim, JRA-55, and CFSR, as well as MERRA-2 [40]. However, the negative bias in NCEP/NCAR maximizes in summer in each hemisphere (DJF for the SH; JJA for the NH).
Additionally, in summer in each hemisphere, the latitude near the subtropics where negative biases of PLRT peak is shifted poleward by ~10°, relative to the latitude where negative biases peak in the corresponding winter. This is associated with the poleward shift of the tropopause breaks in summer over landmasses [43]. In NCER/NCAR, the extreme negative biases over high latitudes in the SH are most pronounced in winter (JJA) and spring (SON), especially in JJA when the bias is up to ~−50 hPa. However, such biases are not found in MERRA-2, possibly owing to the assimilation of Microwave Limb Sounder (MLS) stratospheric ozone profiles and Ozone Monitoring Instrument (OMI) column ozone in a system where the assimilated ozone is interactive with radiation [55]. The assimilation of these satellite ozone data improves the representation of ozone profiles in MERRA-2, especially in the SH winter and spring [59,60,61]. The improved assimilation of ozone profiles in MERRA-2 might correct PLRT at high latitudes of the SH through a modified temperature structure. As a result, the averaged bias over the SH is greatly reduced in MERRA-2, especially in JJA and SON (Table 1).

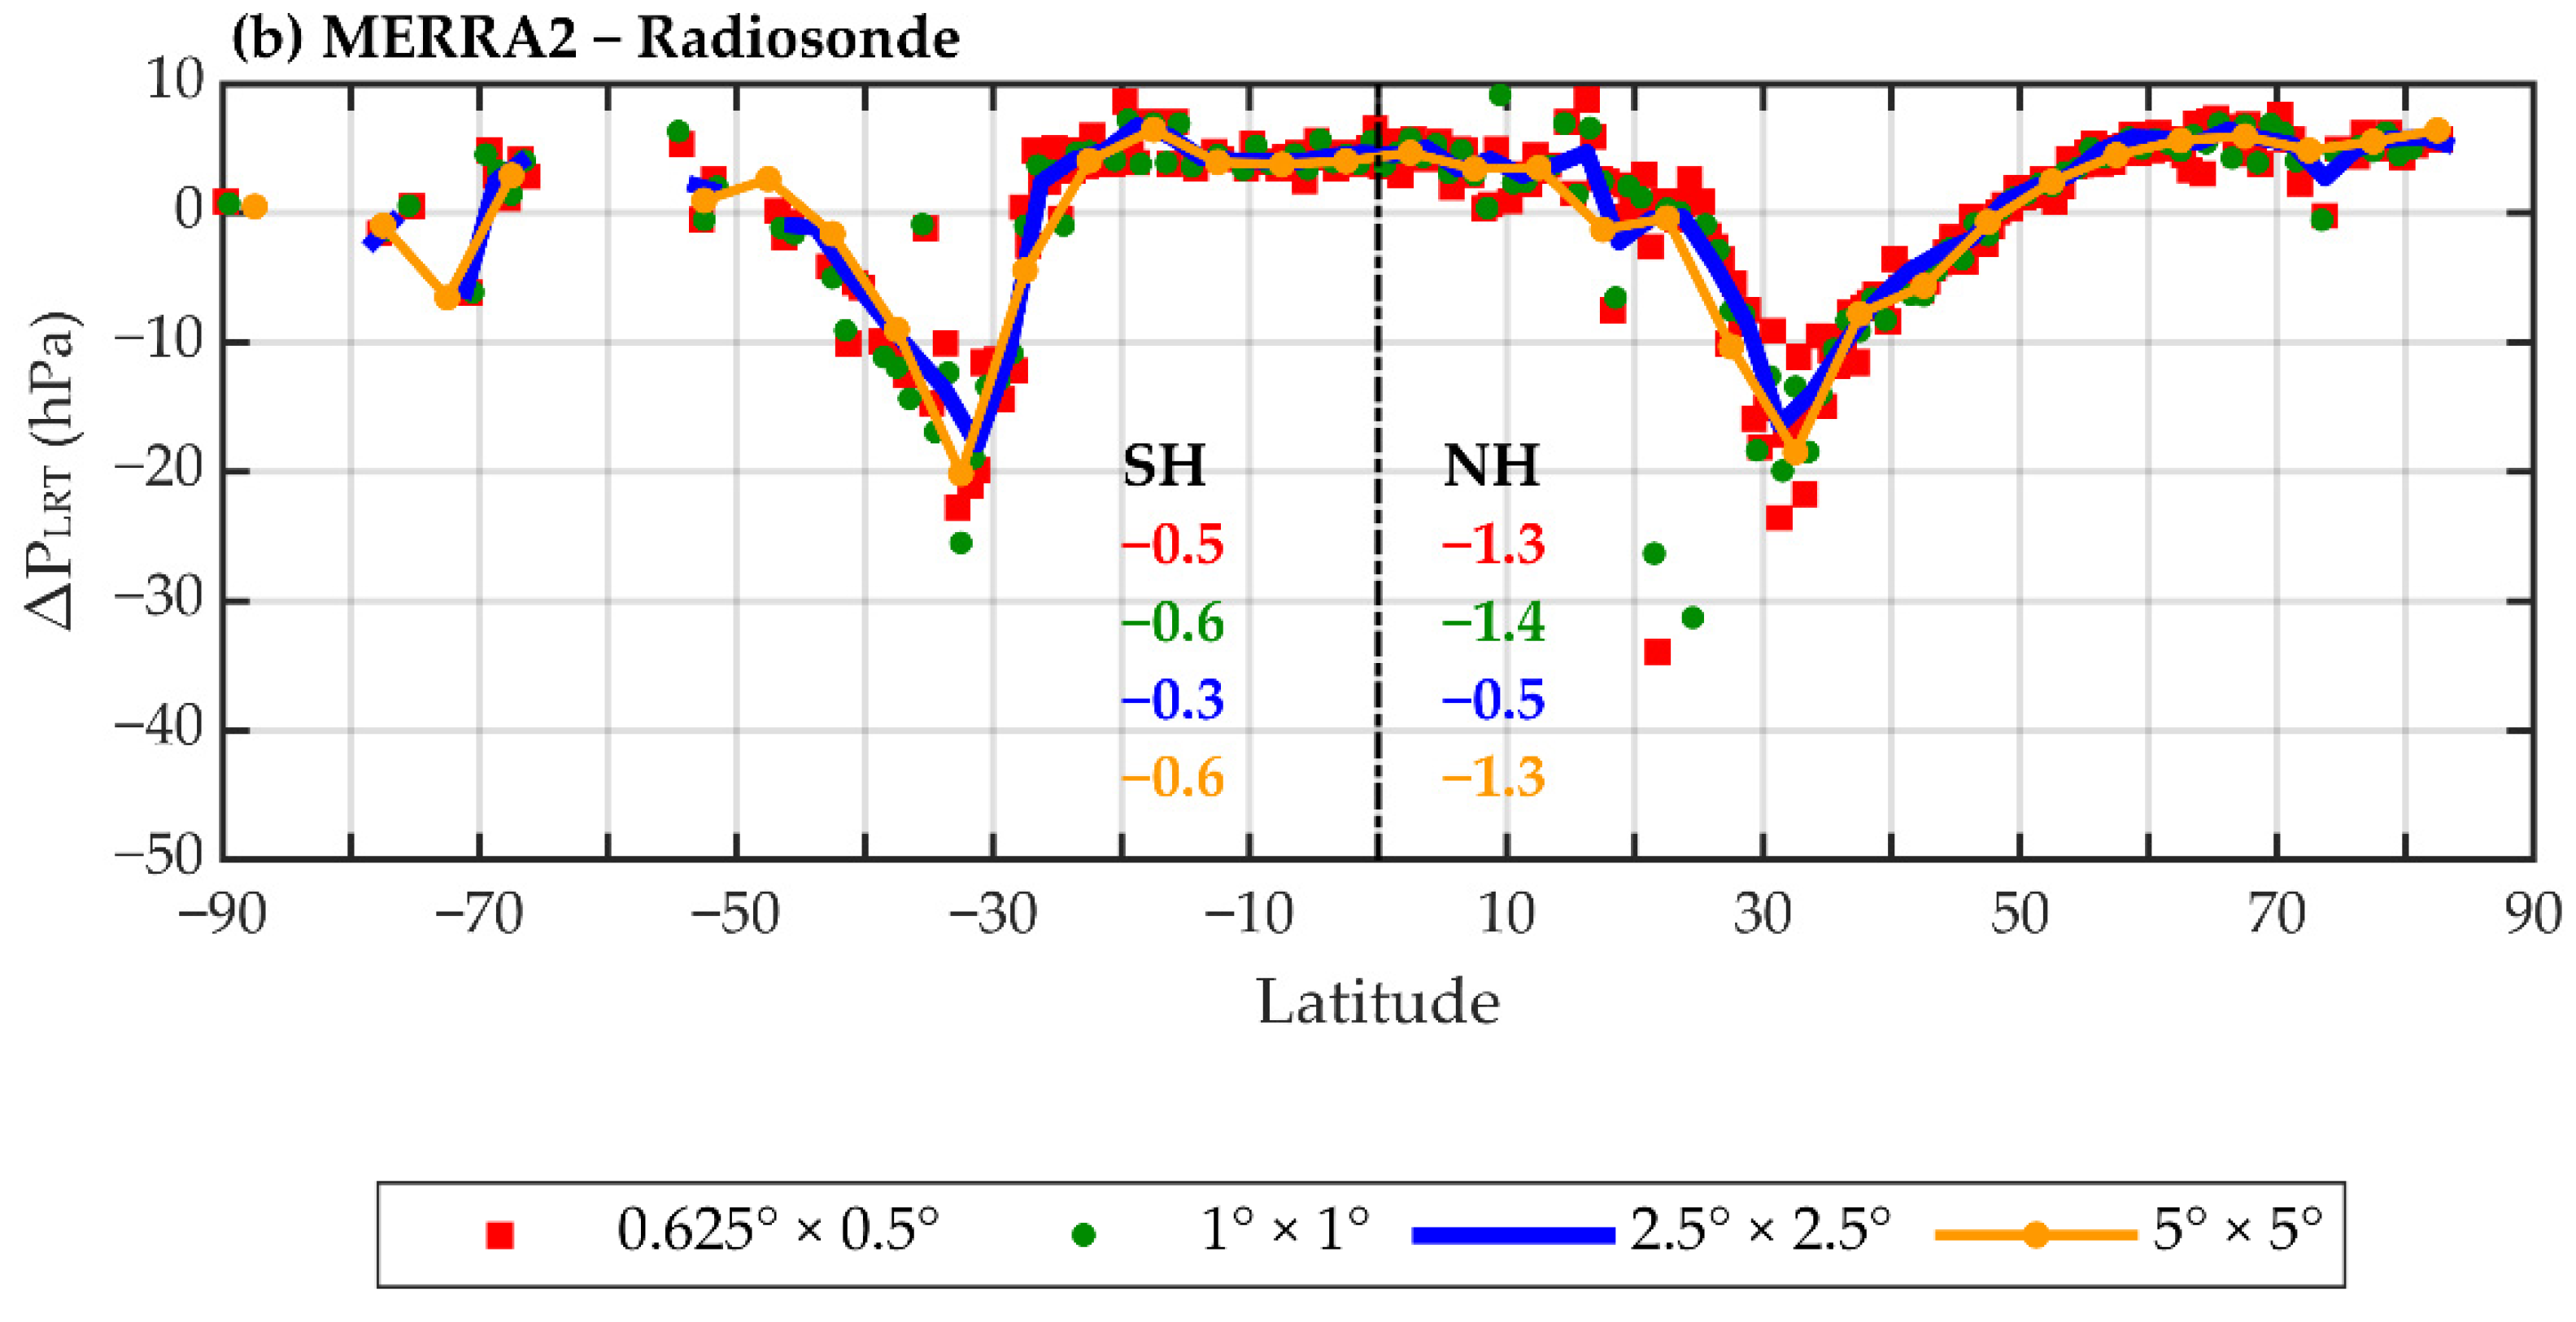
3.2. PLRT Biases in the Reanalyses at Different Horizontal Resolutions and Implication of PLRT Biases in Misidentification of the Tropopause Layer in Profiles with Different Vertical Resolutions

In applications of reanalysis LRT data, two issues are relevant. The first is whether PLRT biases vary with horizontal resolution. To address this question, we regridded PLRT to 1° × 1° and 5° × 5° from its original 2.5° × 2.5° resolution in NCER/NCAR, and to 1° × 1°, 2.5° × 2.5°, and 5° × 5° from its original resolution of 0.625° × 0.5 in MERRA-2, following the distance-weighted method using the Climate Data Operators (CDO) software (see Section 2.2). Figure 5 shows that there is no systematic difference in PLRT biases in either reanalyses remapped into different horizontal resolutions, in terms of the mean over 1980–2017 on a monthly basis. For example, in NCER/NCAR, the PLRT bias averaged over all 10° zones in the NH is −1.2, −0.6, and −1.3 hPa, for 1° × 1°, 2.5° × 2.5° and 5° × 5° resolutions. At higher resolutions PLRT biases show variations at smaller latitudinal intervals and have larger fluctuations, in the 20–40° latitude band in both hemispheres. This is the case for the NCER/NCAR reanalysis at 1° × 1° and for MERRA-2 at 0.625° × 0.5° and 1° × 1° resolutions.
In NCEP/NCAR, PLRT biases are positive in the tropics (20° S–20° N) and in high latitudes of the NH (60° N–90° N) with values close to 5 hPa, but are negative in the subtropics in both hemispheres from 20° to 50° with the largest negative bias close to −20 hPa around 30° S. Additionally, the extreme negative bias of ~−50 hPa appears around 70° S, which is only observed in NCEP/NCAR. PLRT biases in MERRA-2 vary with latitude, similarly to that in NCEP/NCAR, regardless of horizontal resolution.
As noted, PLRT biases are much reduced in the SH over 60° S–90° S in MERRA-2. Before bias evaluation, the first grid cell center of the reanalysis is adjusted as 90° S (180° W) minus one-half of the grid size in latitude and longitude, for a better match with gridded radiosonde PLRT. Since the differences in PLRT are large between the tropical and polar sides of the tropopause break near the subtropical jet [25], a minor mismatch in the locations of the grids between observational and reanalysis data might lead to incorrect interpretations of PLRT biases.
The second relevant issue is the implication of PLRT biases in reanalyses for misidentification of the tropopause layer. The vertical profiles of a variable (e.g., ozone mixing ratio or temperature) are often presented in a fixed vertical resolution. In some applications, it is necessary to identify the layer containing the tropopause in such a vertical profile. PLRT values from reanalyses are often used to make such determinations [10,13,57]. The accuracy of the identification will be affected by the magnitude of PLRT biases in reanalyses and the vertical resolution of the variable. We use NCEP/NCAR data as an example (Figure 6a); the results from MERRA-2 are similar (Figure 6b). As PLRT biases vary little with horizontal resolution (Figure 5), we use PLRT in NCEP/NCAR at 5° × 5° resolution in longitude and latitude. In Figure 6a, the frequency distribution of the differences in PLRT between the reanalysis and radiosondes is shown in blue bars. This histogram is based on regridded monthly PLRT from all radiosonde records over 1980–2017 with ~130,000 data points. This histogram is similar to a normal distribution and ~70% of the PLRT biases range between −10 and 10 hPa. We first examine a case in which the variable of interest is presented at 1-km vertical resolution. In Figure 6, the solid red line indicates misidentification frequency for a profile at 1-km vertical resolution, which is the number of samples with misidentified tropopause layer divided by the total number of samples in each of the PLRT bias intervals. If PLRT biases are within an interval of 0–5 hPa, the ratio is below 10%. The ratio increases with increase of PLRT biases. When PLRT biases are larger than 40 hPa, the ratio reaches 100%, i.e., the tropopause layer is misidentified in all data points. The ratio varies symmetrically with negative PLRT biases. With a vertical resolution of 0.5 km (the dashed red line in Figure 6), the ratio becomes larger at a given PLRT bias and reaches 100% at a smaller value of PLRT bias. Therefore, attention should be paid to the subtropics where absolute PLRT biases in the reanalyses are often greater than 10 hPa (Figure 3) and so may cause misidentification of the tropopause layer with probability larger than 40%. Of all samples, the samples with misidentified tropopause layer are ~30% at 1-km resolution and ~50% at 0.5-km resolution.

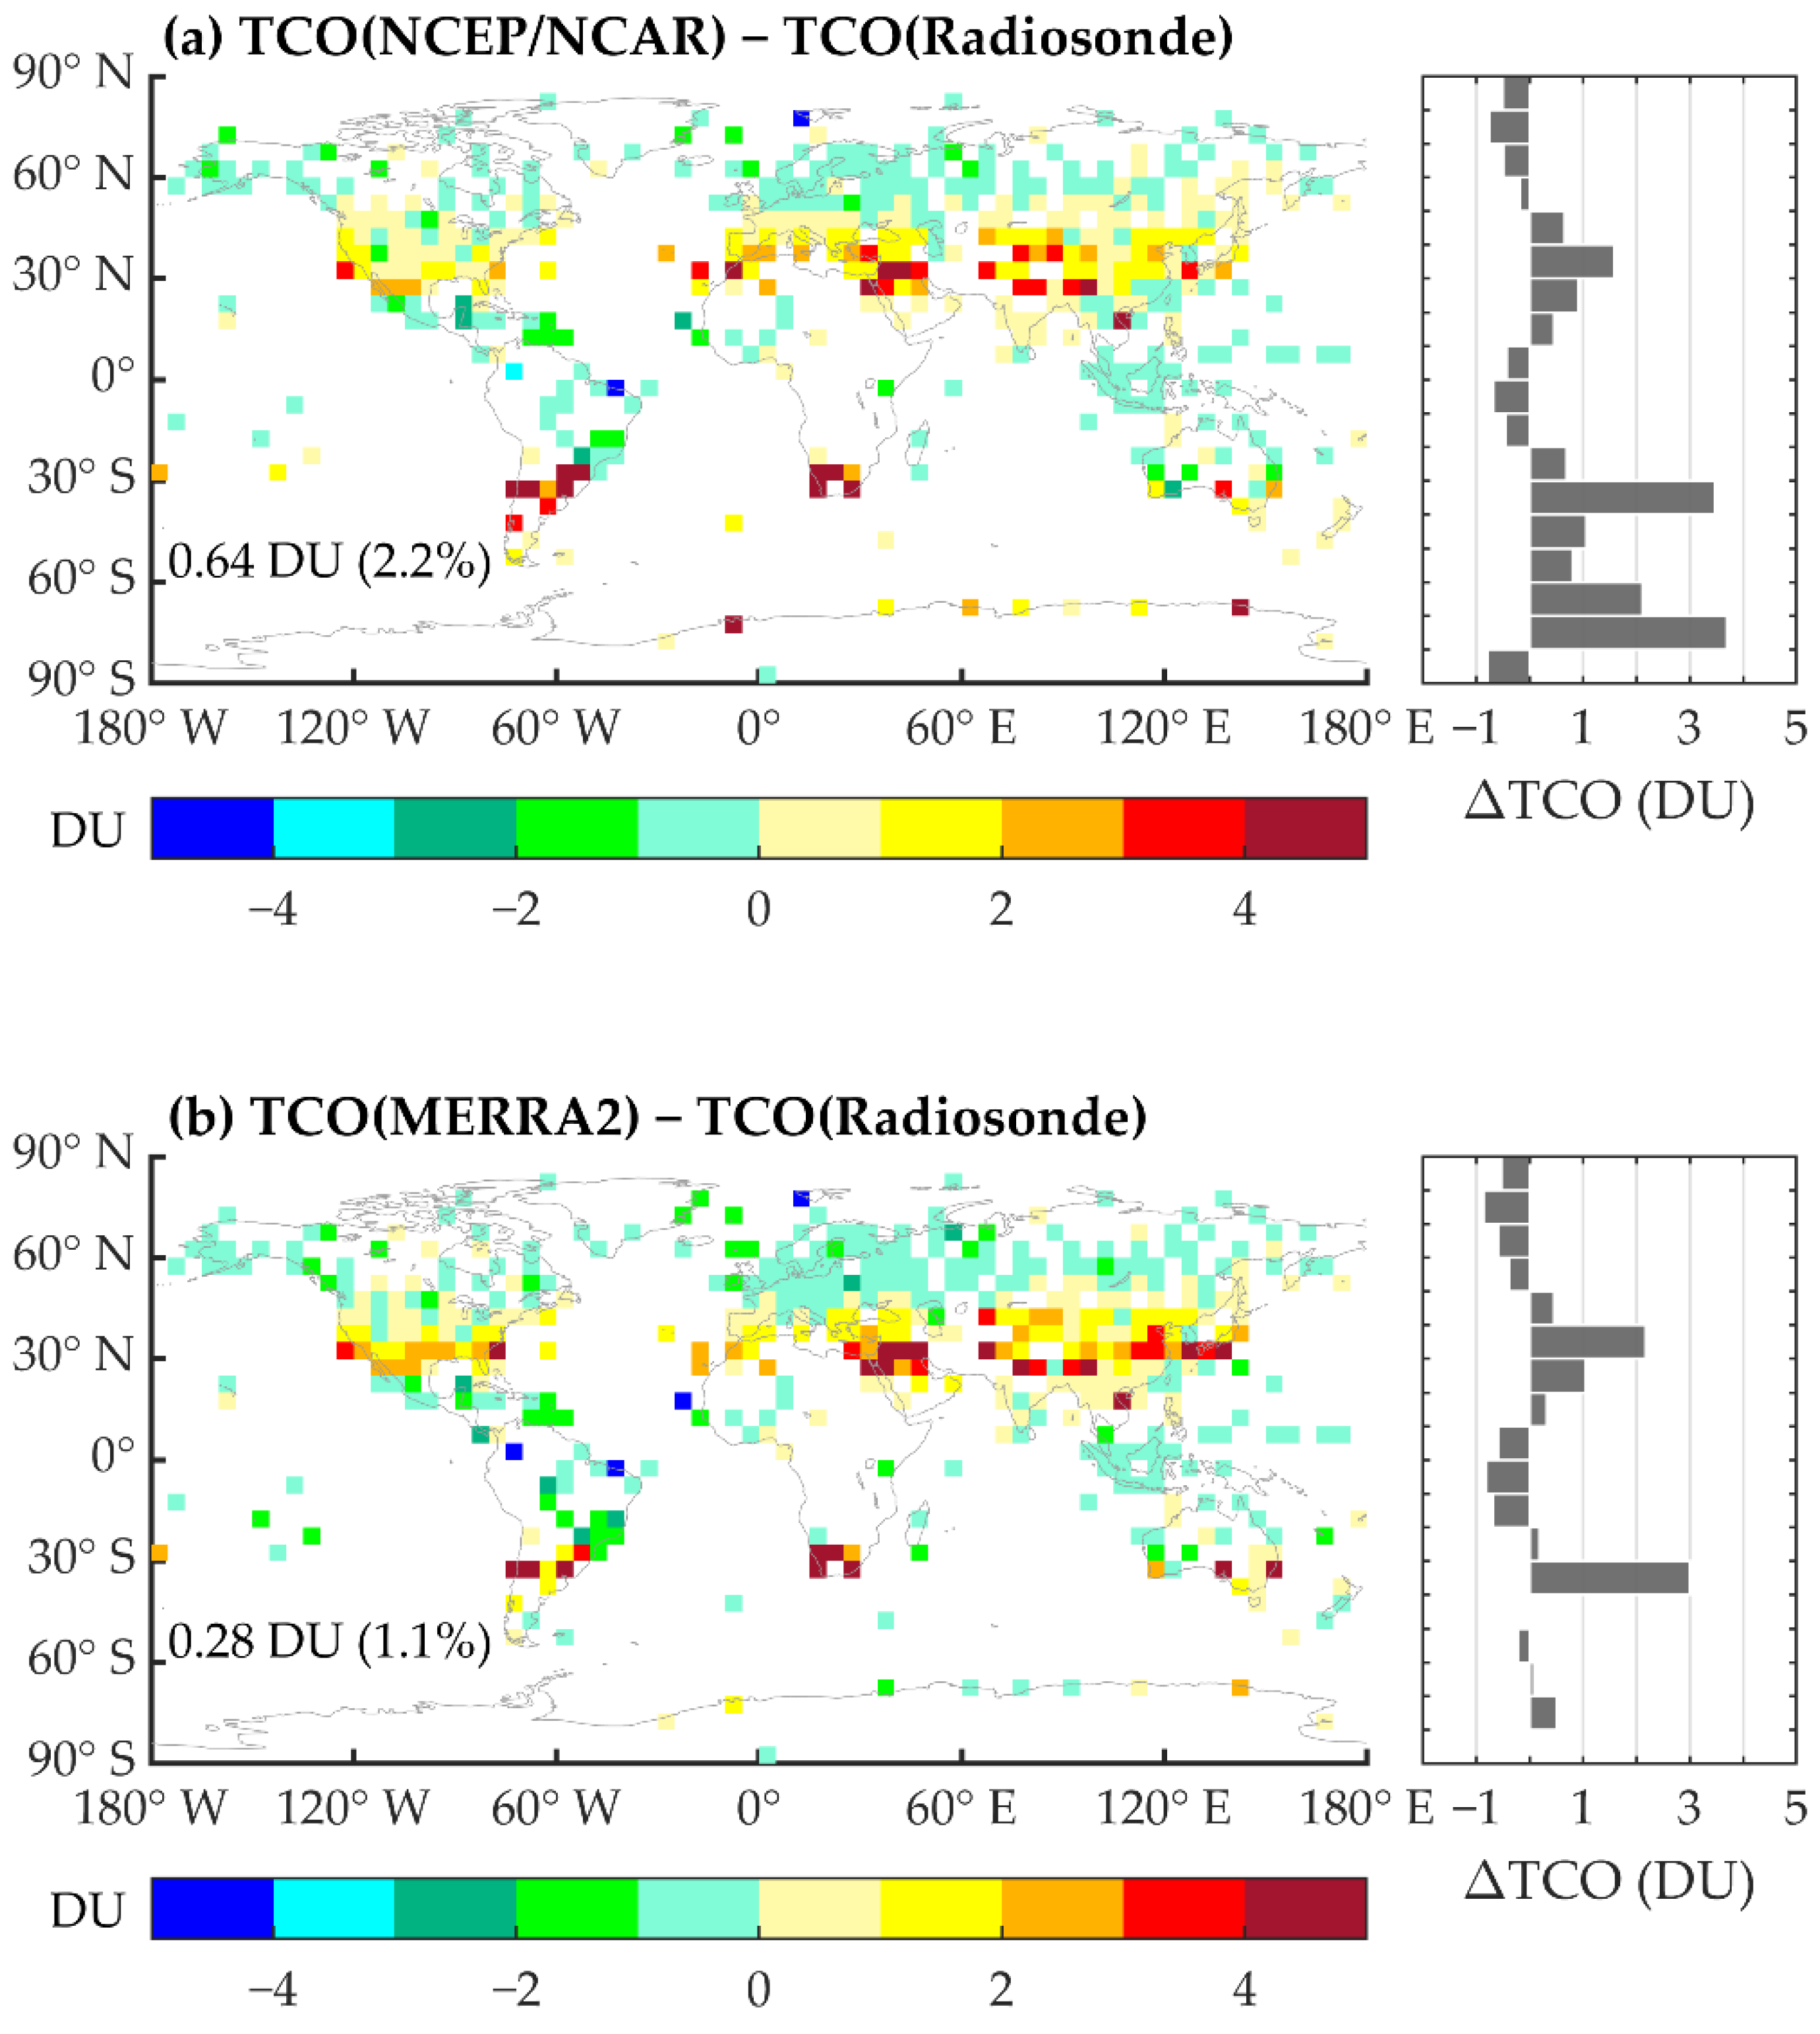
3.3. Implication of PLRT Biases to TCO Estimates

TCO is expressed in milli-atmo-centimeters of ozone, or Dobson Units (DU). We can use radiosonde PLRT and reanalysis PLRT as the upper limit for integration of TCO individually, but keep ozone and pressure profiles the same. Therefore, the difference in TCO (namely TCO bias) from the two ways are caused by the PLRT difference between the reanalysis and radiosonde.
We first assess the TCO biases at global ozonesonde stations. Figure 7 shows the mean TCO bias varying with different PLRT bias intervals in the reanalyses. Here, the reanalysis PLRT at their original resolutions were used; There are 6423 monthly mean samples in Figure 7a with NCEP/NCAR PLRT and 4679 in Figure 7b with MERRA-2 PLRT. A positive bias in PLRT can induce a negative bias in TCO, while a negative bias in PLRT can induce a positive bias in TCO. Regardless of the sign of the biases, TCO biases increase with PLRT biases, up to ~5 DU with PLRT biases of ~40 hPa in absolute values (Figure 7). The distribution of occurrence frequency in each of PLRT bias intervals is similar to that in Figure 6. Approximately, 85% of the PLRT biases range between −15 and 15 hPa. In absolute magnitude, the induced TCO bias is ~0.2, ~0.8 and ~1.2 DU if the PLRT bias is within 0–5, 10–15, and 10–15 hPa, respectively. Notably, the corresponding standard deviations are larger than the means of TCO biases in the PLRT intervals between −15 hPa and 15 hPa.
As ozonesonde stations are sparse, we further explore the influence of PLRT biases on TCO estimates using ozone profiles in TOST. As shown in Section 3.2, PLRT biases hardly vary with horizontal resolution. Therefore, we can neglect the influence of horizontal resolution and regrid the two reanalysis PLRT datasets into 5° × 5° in longitude and latitude resolution to match that of TOST.
The global distribution of TCO biases (Figure 8) is basically similar to that of PLRT biases (Figure 2), including the latitudinal behavior. Negative biases in TCO prevail in the tropics and the high-latitudes of the NH, with means less than 1 DU in magnitude. TCO in the subtropics is overestimated and the positive TCO biases peak around 30°–40° in each hemisphere with values of ~1.5–3.5 DU, corresponding to PLRT biases varying from −8 to −14 hPa (Figure 2). For some grid cells in the subtropics, the positive TCO bias even reaches 4 DU or more, corresponding to a negative PLRT bias less than −20 hPa. For the NCEP/NCAR, the overestimation of TCO reaches ~3.5 DU around 70°–80° S, because the extreme PLRT biases (about −20 hPa) appear there. Overall, the globally averaged bias in TCO due to use of the reanalysis PLRT is 0.64 DU in NCEP/NCAR and 0.28 DU in MERRA-2, corresponding to 2.2% and 1.1% of average TCO values, respectively. Note that TCO values from TOST can be affected by multiple factors, while this study only quantifies the impact of LRT biases in reanalysis products on TOST TCO estimates.

4. Discussion and Conclusions

NCEP/NCAR and MERRA-2 provide PLRT data directly for many applications. Here, through comparison with radiosonde IGRA2 data over 1980–2017, we have examined spatial and seasonal variations in PLRT biases in NCEP/NCAR and MERRA-2 on a monthly basis.
PLRT biases in the reanalyses vary more with latitude than with longitude (Figure 2). The latitudinal variation averaged over 1980–2017 is characterized by positive biases of 0.5–5.5 hPa in the tropics and high latitudes of the NH and negative biases of −0.3 to −14.1 hPa near the subtropics (~20°–50°) of each hemisphere in both reanalyses. The large negative PLRT biases in the subtropics, corresponding to positive biases in HLRT there, are linked to the location of the subtropical jet and tropopause break [2,19,62]. A noticeable difference between the two reanalyses is that in high latitudes of the SH, negative PLRT biases in NCEP/NCAR are greatly reduced in MERRA-2, possibly owing to including the assimilation of MLS stratospheric ozone profiles and OMI column ozone in MERRA-2. Except for 60°–90° S in NCEP/NCAR and the subtropics in both reanalyses, positive biases prevail and are usually less than 10 hPa at other latitudes. The extreme negative PLRT biases of below −20 hPa appear most frequently around 30°–40° S in both reanalyses. Approximately, 70% of the reanalysis PLRT biases are within −10–10 hPa (Figure 3). Taking cosine-weighted latitudinal averages for the globe, we estimate that the global mean PLRT bias is about −2.3 hPa in NCEP/NCAR and −0.9 hPa in MERRA-2, largely attributable to the large negative PLRT biases around the subtropics (Table 1). Correspondingly, the global mean HLRT bias is about 52 m in NCEP/NCAR and 16 m in MERRA-2. The latitudinal variations in PLRT biases in all four seasons are generally similar. However, around the subtropics, the latitudes with the largest negative biases in summer (JJA for the NH, DJF for the SH) are shifted ~10° poleward from the latitudes of winter maximum biases (DJF for the NH, JJA for the SH) (Figure 4). Overall, for applications of PLRT products, MERRA-2 may be a better choice between the two reanalyses on the global scale, whereas by hemisphere, NCEP/NCAR outperforms MERRA-2 in the NH but underperforms MERRA-2 in the SH.
Two issues relevant to PLRT biases in applications of reanalysis PLRT data are investigated. The first one is related to horizontal resolution in the reanalyses. Although PLRT biases vary little with horizontal resolution, finer horizontal resolution can provide a more detailed variation in grid cell size (Figure 5). Furthermore, caution should be paid to latitudes near the subtropics, as a small mismatch of the grid cell center there can lead to large differences in PLRT biases. The second issue is related to identifying the layer of the tropopause in a profile of variable of interest, e.g., ozone or temperature, at different fixed vertical resolutions. The accuracy of such identification depends on both the magnitude of PLRT bias and the vertical resolution of the profile. Overall, the accuracy decreases with increase of PLRT bias. When PLRT biases are above 10 hPa in magnitude, at 1 km resolution, the misidentification rate exceeds 40% for both reanalyses (Figure 6). Therefore, attention should be paid to the subtropics where the absolute PLRT biases in the reanalyses are often more than 10 hPa (Figure 3). The misidentification rate is lower for a vertical profile at 1 km than at 0.5 km resolution. Of all radiosonde samples, samples with misidentified tropopause layer are ~30% at 1-km resolution and ~50% at 0.5-km resolution (Figure 6).
We assess TCO biases that are attributed to PLRT biases in the reanalyses based on ozone profiles at ozonesonde stations and in TOST. After matching ozonesonde and radiosonde data with the reanlayses at their original horizontal resolutions (2.5° × 2.5° for NCEP/NCAR and 0.625° × 0.5° for MERRA-2 in longitude and latitude), we found ~6400 and ~4700 monthly ozone profiles for NCEP/NCAR and MERRA-2, respectively. As expected, a positive (negative) bias in PLRT leads to a negative (positive) bias in TCO. In absolute magnitude, the induced TCO bias is ~0.2, ~0.8 and ~1.2 DU if the PLRT bias is within 0–5, 10–15, and 10–15 hPa (Figure 7). Most of the PLRT biases in the reanalyses are less than 15 hPa in absolute magnitude. As TOST ozone data cover the globe, the assessment using TOST provides a detailed description of how the induced TCO biases vary with latitude and longitude. The global distribution of the induced TCO biases (Figure 8) is similar to that of PLRT biases in the reanalyses (Figure 2). The TCO biases vary much more with latitude than with longitude. Negative biases in TCO prevail in the tropics and high latitudes of the NH, with mean zonal biases less than 1 DU in absolute magnitude. However, positive TCO biases appear in the subtropics and peak around 30°–40° in each hemisphere with values of ~1.5–3.5 DU. For the NCEP/NCAR, negative TCO biases also reach ~3.5 DU around 70°–80° S, because the extreme PLRT biases (about −20 hPa) appear there. Globally, the mean bias in TCO is estimated to be positive, being ~0.64 (or 2.2%) and ~0.28 DU (or 1.1%), respectively, if NCEP/NCAR and MERRA-2 PLRT products are used in deriving TCO.
This study provides a comprehensive understanding of PLRT biases in the NCEP/NCAR and MERRA-2, as well as the related biases in TCO estimates. The PLRT biases could induce biases in other applications, such as estimates of STE mass fluxes, especially near the subtropics where PLRT biases are large. This study has assessed the magnitude, sign, and spatial variations in TCO biases attributable to PLRT biases in the two reanalyses. Such assessments have wide implications for studies of tropospheric ozone burden, tropospheric ozone radiative forcing, derivation of TCO from satellite data, and data assimilation. In this study, we select long-term global radiosonde data as a basis for the PLRT bias assessment because of the high quality of the data for identifying PLRT. We employ cosine-weighted latitudinal averaging to minimize the impact of spatial inhomogeneity of radiosonde data on our global and hemispheric assessments of PLRT biases. Although it is beyond the scope of this study, PLRT from GPS-RO satellite data could be used to enhance our understanding of the global variation in PLRT biases for recent decades. Furthermore, what drives biases in tropopause altitude in reanalyses could be further explored for improvement of reanalysis LRT products.

Author Contributions

J.L. conceptualized the research. L.M. conducted the data analysis and prepared the figures and tables under the supervision of J.L., L.M., and J.L wrote the paper with valuable input from D.W.T. and Y.L. D.W.T. thoroughly reviewed the paper. All authors have read and agreed to the published version of the manuscript.

Funding

This research was funded by the Chinese Ministry of Science and Technology National Key R&D Program of China (grant nos. 2019YFA0606803 and 2016YFA0600204).

Institutional Review Board Statement

Not applicable.

Informed Consent Statement

Not applicable.

Data Availability Statement

NCEP/NCAR products are openly provided by the NOAA/OAR/ESRL PSL, Boulder, Colorado, USA, from their Web site at https://psl.noaa.gov/ (accessed on 25 September 2020). MERRA-2 products are openly provided by the National Aeronautics and Space Administration (NASA) Global Modeling and Assimilation Office (GMAO), available online: https://disc.sci.gsfc.nasa.gov/ (accessed on 19 February 2019). The radiosonde observations are openly provided by the National Oceanic and Atmospheric Administration (NOAA) National Centers for Environ-mental Information (NCEI), available online: https://www.ncdc.noaa.gov/ (accessed on 12 September 2018). The global ozone sounding data are openly provided by the World Ozone and Ultraviolet Radiation Data Centre (WOUDC), available online: http://www.woudc.org/ (accessed on 26 October 2017).

Acknowledgments

The authors thank the agencies that provided reanalysis data used in this study: NCEP/NCAR from the NOAA/OAR/ESRL PSL, Boulder, Colorado, USA and MERRA-2 from the National Aeronautics and Space Administration (NASA) Global Modeling and Assimilation Office (GMAO). We also thank the National Oceanic and Atmospheric Administration (NOAA) National Centers for Environmental Information (NCEI) for providing IGRA radiosonde data. The global ozone sounding data were obtained from the World Ozone and Ultraviolet Radiation Data Centre (WOUDC) operated by Environment Canada, Toronto, Ontario, Canada, under the auspices of the World Meteorological Organization. We acknowledge the Max Plank Institute for Meteorology (MPI-M) for providing the CDO software (https://code.mpimet.mpg.de/projects/cdo/files (accessed on 14 October 2020)) and many contributors to the CDO development. We would like to thank the anonymous reviewers for their valuable comments and suggestions.

Conflicts of Interest

The authors declare no conflict of interest.

Appendix A

Table A1. The total number of stations and soundings that are used for calculating monthly radiosonde PLRT under different thresholds where daily PLRT values are available on at least 5, 10, 15, or 20 days in a month.
Thresholds5 Days10 Days15 Days20 Days
Soundings203,203190,304174,285148,643
Stations714705689673
Figure A1. Latitudinal variation in monthly PLRT difference (ΔPLRT, in hPa) between NCEP/NCAR reanalysis and radiosonde data averaged over 1980–2017. The monthly radiosonde PLRT is calculated with different thresholds that requires at least 5, 10, 15, or 20 days with available daily radiosonde PLRT in a month. The data showed is the 10°-zonal mean.
Atmosphere 12 00417 g0a1

References

  1. Santer, B.D.; Wehner, M.F.; Wigley, T.M.L.; Sausen, R.; Meehl, G.A.; Taylor, K.E.; Ammann, C.; Arblaster, J.; Washington, W.M.; Boyle, J.S.; et al. Contributions of anthropogenic and natural forcing to recent tropopause height changes. Science 2003, 301, 479–483. [Google Scholar] [CrossRef] [PubMed] [Green Version]
  2. Santer, B.D.; Sausen, R.; Wigley, T.M.L.; Boyle, J.S.; AchutaRao, K.M.; Doutriaux, C.; Hansen, J.E.; Meehl, G.A.; Roeckner, E.; Ruedy, R.; et al. Behavior of tropopause height and atmospheric temperature in models, reanalyses, and observations: Decadal changes. J. Geophys. Res. Space Phys. 2003, 108. [Google Scholar] [CrossRef] [Green Version]
  3. Santer, B.D.; Wigley, T.M.L.; Simmons, A.J.; Kållberg, P.W.; Kelly, G.A.; Uppala, S.M.; Ammann, C.; Boyle, J.S.; Brüggemann, W.; Doutriaux, C.; et al. Identification of anthropogenic climate change using a second-generation reanalysis. J. Geophys. Res. Space Phys. 2004, 109. [Google Scholar] [CrossRef] [Green Version]
  4. Lucas, C.; Timbal, B.; Nguyen, H. The expanding tropics: A critical assessment of the observational and modeling studies. Wiley Interdiscip. Rev. Clim. Chang. 2014, 5, 89–112. [Google Scholar] [CrossRef]
  5. Holton, J.R.; Haynes, P.H.; McIntyre, M.E.; Douglass, A.R.; Rood, R.B.; Pfister, L. Stratosphere-troposphere exchange. Rev. Geophys. 1995, 33, 403–439. [Google Scholar] [CrossRef]
  6. Eyring, V.; Butchart, N.; Waugh, D.W.; Akiyoshi, H.; Austin, J.; Bekki, S.; Bodeker, G.E.; Boville, B.A.; Bruhl, C.; Chipper-field, M.P.; et al. Assessment of temperature, trace species, and ozone in chemistry-climate model sim-ulations of the recent past. J. Geophys. Res. Atmos. 2006, 111, D22. [Google Scholar] [CrossRef]
  7. Fueglistaler, S.; Dessler, A.E.; Dunkerton, T.J.; Folkins, I.; Fu, Q.; Mote, P.W. Tropical tropopause layer. Rev. Geophys. 2009, 47, 47. [Google Scholar] [CrossRef]
  8. Sullivan, J.T.; McGee, T.J.; Thompson, A.M.; Pierce, R.B.; Sumnicht, G.K.; Twigg, L.W.; Eloranta, E.; Hoff, R.M. Characterizing the lifetime and occurrence of stratospheric-tropospheric exchange events in the rocky mountain region using high-resolution ozone measurements. J. Geophys. Res. Atmos. 2015, 120, 12410–12424. [Google Scholar] [CrossRef]
  9. Boothe, A.C.; Homeyer, C.R. Global large-scale stratosphere–troposphere exchange in modern reanalyses. Atmos. Chem. Phys. Discuss. 2017, 17, 5537–5559. [Google Scholar] [CrossRef] [Green Version]
  10. Di Noia, A.; Sellitto, P.; Del Frate, F.; De Laat, J. Global tropospheric ozone column retrievals from OMI data by means of neural networks. Atmos. Meas. Tech. 2013, 6, 895–915. [Google Scholar] [CrossRef] [Green Version]
  11. Gaudel, A.; Cooper, O.R.; Ancellet, G.; Barret, B.; Boynard, A.; Burrows, J.P.; Clerbaux, C.; Coheur, P.-F.; Cuesta, J.; Cuevas, E.; et al. Tropospheric Ozone Assessment Report: Present-day distribution and trends of tropospheric ozone relevant to climate and global atmospheric chemistry model evaluation. Elem. Sci. Anth. 2018, 6, 39. [Google Scholar] [CrossRef]
  12. Wang, C.-Y.; Xie, S.-P.; Kosaka, Y.; Liu, Q.; Zheng, X.-T. Global Influence of Tropical Pacific Variability with Implications for Global Warming Slowdown. J. Clim. 2017, 30, 2679–2695. [Google Scholar] [CrossRef]
  13. Ridley, D.A.; Solomon, S.; Barnes, J.E.; Burlakov, V.D.; Deshler, T.; Dolgii, S.I.; Herber, A.B.; Nagai, T.; Neely, R.R.; Nevzorov, A.V.; et al. Total volcanic stratospheric aerosol optical depths and implications for global climate change. Geophys. Res. Lett. 2014, 41, 7763–7769. [Google Scholar] [CrossRef] [Green Version]
  14. Friberg, J.; Martinsson, B.G.; Andersson, S.M.; Sandvik, O.S. Volcanic impact on the climate—The stratospheric aerosol load in the period 2006–2015. Atmos. Chem. Phys. Discuss. 2018, 18, 11149–11169. [Google Scholar] [CrossRef] [Green Version]
  15. Wild, O. Modelling the global tropospheric ozone budget: Exploring the variability in current models. Atmos. Chem. Phys. Discuss. 2007, 7, 2643–2660. [Google Scholar] [CrossRef] [Green Version]
  16. Prather, M.J.; Zhu, X.; Tang, Q.; Hsu, J.; Neu, J.L. An atmospheric chemist in search of the tropopause. J. Geophys. Res. Space Phys. 2011, 116. [Google Scholar] [CrossRef] [Green Version]
  17. Stevenson, D.S.; Young, P.J.; Naik, V.; Lamarque, J.-F.; Shindell, D.T.; Voulgarakis, A.; Skeie, R.B.; Dalsoren, S.B.; Myhre, G.; Berntsen, T.K.; et al. Tropospheric ozone changes, radiative forcing and attribution to emissions in the Atmospheric Chemistry and Climate Model Intercomparison Project (ACCMIP). Atmos. Chem. Phys. Discuss. 2013, 13, 3063–3085. [Google Scholar] [CrossRef] [Green Version]
  18. WMO. Meteorology: A three-dimensional science: Second session of the Commission for Aerology. WMO Bull. 1957, 4, 134–138. [Google Scholar]
  19. Schmidt, T.; Wickert, J.; Beyerle, G.; Heise, S. Global tropopause height trends estimated from GPS radio occultation data. Geophys. Res. Lett. 2008, 35. [Google Scholar] [CrossRef]
  20. Highwood, E.J.; Hoskins, B.J. The tropical tropopause (vol 124, pg 1579, 1998). Q. J. R. Meteorol. Soc. 1998, 124, 2536. [Google Scholar]
  21. Randel, W.J.; Wu, F.; Oltmans, S.J.; Rosenlof, K.; Nedoluha, G.E. Interannual changes of stratospheric water vapor and correlations with tropical tropopause temperatures. J. Atmos. Sci. 2004, 61, 2133–2148. [Google Scholar] [CrossRef]
  22. Kuang, S.; Newchurch, M.J.; Burris, J.; Wang, L.; Knupp, K.; Huang, G. Stratosphere-to-troposphere transport revealed by ground-based lidar and ozonesonde at a midlatitude site. J. Geophys. Res. Space Phys. 2012, 117. [Google Scholar] [CrossRef] [Green Version]
  23. Kunz, A.; Sprenger, M.; Wernli, H. Climatology of potential vorticity streamers and associated isentropic transport pathways across PV gradient barriers. J. Geophys. Res. Atmos. 2015, 120, 3802–3821. [Google Scholar] [CrossRef]
  24. Sivakumar, V.; Bencherif, H.; Bègue, N.; Thompson, A.M. Tropopause Characteristics and Variability from 11 yr of SHA-DOZ Observations in the Southern Tropics and Subtropics. J. Appl. Meteorol. Climatol. 2011, 50, 1403–1416. [Google Scholar] [CrossRef]
  25. Randel, W.J.; Seidel, D.J.; Pan, L.L. Observational characteristics of double tropopauses. J. Geophys. Res. Space Phys. 2007, 112. [Google Scholar] [CrossRef] [Green Version]
  26. Pan, L.L.; Honomichl, S.B.; Bui, T.V.; Thornberry, T.; Rollins, A.; Hintsa, E.; Jensen, E.J. Lapse Rate or Cold Point: The Tropical Tropopause Identified by In Situ Trace Gas Measurements. Geophys. Res. Lett. 2018, 45, 10-756–10-763. [Google Scholar] [CrossRef]
  27. Zängl, G.; Hoinka, K.P. The Tropopause in the Polar Regions. J. Clim. 2001, 14, 3117–3139. [Google Scholar] [CrossRef]
  28. Seidel, D.J.; Randel, W.J. Variability and trends in the global tropopause estimated from radiosonde data. J. Geophys. Res. Space Phys. 2006, 111. [Google Scholar] [CrossRef]
  29. Son, S.-W.; Tandon, N.F.; Polvani, L.M. The fine-scale structure of the global tropopause derived from COSMIC GPS radio occultation measurements. J. Geophys. Res. Space Phys. 2011, 116. [Google Scholar] [CrossRef]
  30. Wang, W.; Matthes, K.; Schmidt, T.; Neef, L. Recent variability of the tropical tropopause inversion layer. Geophys. Res. Lett. 2013, 40, 6308–6313. [Google Scholar] [CrossRef] [Green Version]
  31. Li, W.; Yuan, Y.-B.; Chai, Y.-J.; Liou, Y.-A.; Ou, J.-K.; Zhong, S.-M. Characteristics of the global thermal tropopause derived from multiple radio occultation measurements. Atmos. Res. 2017, 185, 142–157. [Google Scholar] [CrossRef]
  32. Hoinka, K.P. Statistics of the Global Tropopause Pressure. Mon. Weather. Rev. 1998, 126, 3303–3325. [Google Scholar] [CrossRef]
  33. Xie, F.; Li, J.; Tian, W.; Feng, J.; Huo, Y. Signals of El Niño Modoki in the tropical tropopause layer and stratosphere. Atmospheric Chem. Phys. Discuss. 2012, 12, 5259–5273. [Google Scholar] [CrossRef] [Green Version]
  34. Zerefos, C.S.; Tourpali, K.; Zanis, P.; Eleftheratos, K.; Repapis, C.; Goodman, A.; Wuebbles, D.; Isaksen, I.S.A.; Luterbacher, J. Evidence for an earlier greenhouse cooling effect in the stratosphere before 1980 over the Northern Hemisphere. Atmos. Chem. Phys. Discuss. 2014, 14, 7705–7720. [Google Scholar] [CrossRef] [Green Version]
  35. Hess, P.G.; Lamarque, J.-F. Ozone source attribution and its modulation by the Arctic oscillation during the spring months. J. Geophys. Res. Space Phys. 2007, 112. [Google Scholar] [CrossRef] [Green Version]
  36. Fitzka, M.; Hadzimustafic, J.; Simic, S. Total ozone and Umkehr observations at Hoher Sonnblick 1994-2011: Climatology and extreme events. J. Geophys. Res. Atmos. 2014, 119, 739–752. [Google Scholar] [CrossRef]
  37. Kalnay, E.; Kanamitsu, M.; Kistler, R.; Collins, W.; Deaven, D.; Gandin, L.; Iredell, M.; Saha, S.; White, G.; Woollen, J.; et al. The NCEP/NCAR 40-year reanalysis project. Bull. Am. Meteorol. Soc. 1996, 77, 437–471. [Google Scholar] [CrossRef] [Green Version]
  38. Birner, T.; Dörnbrack, A.; Schumann, U. How sharp is the tropopause at midlatitudes? Geophys. Res. Lett. 2002, 29, 45-1–45-4. [Google Scholar] [CrossRef] [Green Version]
  39. Birner, T. Fine-scale structure of the extratropical tropopause region. J. Geophys. Res. Space Phys. 2006, 111. [Google Scholar] [CrossRef] [Green Version]
  40. Xian, T.; Homeyer, C.R. Global tropopause altitudes in radiosondes and reanalyses. Atmos. Chem. Phys. Discuss. 2019, 19, 5661–5678. [Google Scholar] [CrossRef] [Green Version]
  41. Tegtmeier, S.; Anstey, J.; Davis, S.; Dragani, R.; Harada, Y.; Ivanciu, I.; Pilch Kedzierski, R.; Krüger, K.; Legras, B.; Long, C.; et al. Temperature and tropopause characteristics from reanalyses data in the tropical trop-opause layer. Atmos. Chem. Phys. 2020, 20, 753–770. [Google Scholar] [CrossRef] [Green Version]
  42. Randel, W.J.; Gaffen, D.J.; Wu, F. Interannual variability of the tropical tropopause derived from radiosonde data and NCEP reanalyses. J. Geophys. Res. Space Phys. 2000, 105, 15509–15523. [Google Scholar] [CrossRef]
  43. Luan, L.; Staten, P.W.; Ao, C.O.; Fu, Q. Seasonal and Annual Changes of the Regional Tropical Belt in GPS-RO Measure-ments and Reanalysis Datasets. J. Clim. 2020, 33, 4083–4094. [Google Scholar] [CrossRef] [Green Version]
  44. Fishman, J.; Watson, C.E.; Larsen, J.C.; Logan, J.A. Distribution of tropospheric ozone determined from satellite data. J. Geophys. Res. Space Phys. 1990, 95, 3599. [Google Scholar] [CrossRef]
  45. Ziemke, J.R.; Chandra, S.; Duncan, B.N.; Froidevaux, L.; Bhartia, P.K.; Levelt, P.F.; Waters, J.W. Tropospheric ozone determined from aura OMI and MLS: Evaluation of measurements and comparison with the Global Modeling Initiative’s Chemical Transport Model. J. Geophys. Res.-Atmos. 2006, 111, D19. [Google Scholar] [CrossRef]
  46. Young, P.J.; Archibald, A.T.; Bowman, H.; Lamarque, J.-F.; Naik, V.; Stevenson, D.S.; Tilmes, S.; Voulgarakis, A.; Wild, O.; Bergmann, D.; et al. Pre-industrial to end 21st century projections of tropospheric ozone from the Atmospheric Chemistry and Climate Model Intercomparison Project (ACCMIP). Atmos. Chem. Phys. Discuss. 2013, 13, 2063–2090. [Google Scholar] [CrossRef] [Green Version]
  47. Young, P.J.; Naik, V.; Fiore, A.M.; Gaudel, A.; Guo, J.; Lin, M.Y.; Neu, J.L.; Parrish, D.D.; Rieder, H.E.; Schnell, J.L.; et al. Tropospheric Ozone Assessment Report: Assessment of global-scale model performance for global and regional ozone distributions, variability, and trends. Elem. Sci. Anth. 2018, 6. [Google Scholar] [CrossRef]
  48. Griffiths, P.T.; Murray, L.T.; Zeng, G.; Archibald, A.T.; Emmons, L.K.; Galbally, I.; Hassler, B.; Horowitz, L.W.; Keeble, J.; Liu, J.; et al. Tropospheric ozone in CMIP6 Simulations. Atmos. Chem. Phys. Discuss. 2020. under review. [Google Scholar]
  49. Emili, E.; Barret, B.; Massart, S.; Le Flochmoen, E.; Piacentini, A.; El Amraoui, L.; Pannekoucke, O.; Cariolle, D. Combined assimilation of IASI and MLS observations to constrain tropospheric and stratospheric ozone in a global chemical transport model. Atmos. Chem. Phys. Discuss. 2014, 14, 177–198. [Google Scholar] [CrossRef] [Green Version]
  50. Durre, I.; Vose, R.S.; Yin, X.; Applequist, S.; Arnfield, J. Integrated Global Radiosonde Archive (IGRA) Version 2. NOAA Natl. Centers Environ. Inf. 2016, 10, V5X63X0Q. [Google Scholar] [CrossRef]
  51. Gelaro, R.; Mccarty, W.; Suárez, M.J.; Todling, R.; Molod, A.; Takacs, L.; Randles, C.A.; Darmenov, A.; Bosilovich, M.G.; Reichle, R.; et al. The Modern-Era Retrospective Analysis for Research and Applications, Version 2 (MERRA-2). J. Clim. 2017, 30, 5419–5454. [Google Scholar] [CrossRef] [PubMed]
  52. Putman, W.M.; Lin, S.-J. Finite-volume transport on various cubed-sphere grids. J. Comput. Phys. 2007, 227, 55–78. [Google Scholar] [CrossRef]
  53. Birner, T. Recent widening of the tropical belt from global tropopause statistics: Sensitivities. J. Geophys. Res. Space Phys. 2010, 115. [Google Scholar] [CrossRef] [Green Version]
  54. Evtushevsky, O.M.; Grytsai, A.V.; Klekociuk, A.R.; Milinevsky, G.P. Total ozone and tropopause zonal asymmetry during the Antarctic spring. J. Geophys. Res. Space Phys. 2008, 113. [Google Scholar] [CrossRef]
  55. Fujiwara, M.; Wright, J.S.; Manney, G.L.; Gray, L.J.; Anstey, J.; Birner, T.; Davis, S.; Gerber, E.P.; Harvey, V.L.; Hegglin, M.I.; et al. Introduction to the SPARC Reanalysis Intercomparison Project (S-RIP) and overview of the reanalysis systems. Atmos. Chem. Phys. Discuss. 2017, 17, 1417–1452. [Google Scholar] [CrossRef] [Green Version]
  56. Liu, G.; Liu, J.; Tarasick, D.W.; Fioletov, V.E.; Jin, J.J.; Moeini, O.; Liu, X.; Sioris, C.E.; Osman, M. A global tropospheric ozone climatology from trajectory-mapped ozone soundings. Atmos. Chem. Phys. Discuss. 2013, 13, 10659–10675. [Google Scholar] [CrossRef] [Green Version]
  57. Liu, J.; Tarasick, D.W.; Fioletov, V.E.; McLinden, C.; Zhao, T.; Gong, S.; Sioris, C.; Jin, J.J.; Liu, G.; Moeini, O. A global ozone climatology from ozone soundings via trajectory mapping: A stratospheric perspective. Atmos. Chem. Phys. Discuss. 2013, 13, 11441–11464. [Google Scholar] [CrossRef] [Green Version]
  58. Liu, Y.; Xu, T.; Liu, J. Characteristics of the seasonal variation of the global tropopause revealed by COSMIC/GPS data. Adv. Space Res. 2014, 54, 2274–2285. [Google Scholar] [CrossRef]
  59. Davis, S.M.; Hegglin, M.I.; Fujiwara, M.; Dragani, R.; Harada, Y.; Kobayashi, C.; Long, C.; Manney, G.L.; Nash, E.R.; Potter, G.L.; et al. Assessment of upper tropospheric and stratospheric water vapor and ozone in reanalyses as part of S-RIP. Atmos. Chem. Phys. Discuss. 2017, 17, 12743–12778. [Google Scholar] [CrossRef] [PubMed] [Green Version]
  60. Wargan, K.; Labow, G.; Frith, S.; Pawson, S.; Livesey, N.; Partyka, G. Evaluation of the Ozone Fields in NASA’s MERRA-2 Reanalysis. J. Clim. 2017, 30, 2961–2988. [Google Scholar] [CrossRef] [Green Version]
  61. Manney, G.L.; Hegglin, M.I.; Lawrence, Z.D.; Wargan, K.; Millán, L.F.; Schwartz, M.J.; Santee, M.L.; Lambert, A.; Pawson, S.; Knosp, B.W.; et al. Reanalysis comparisons of upper tropospheric-lower stratospheric jets and multiple tropopauses. Atmos. Chem. Phys. 2017, 17, 11541–11566. [Google Scholar] [CrossRef] [PubMed] [Green Version]
  62. Homeyer, C.R.; Bowman, K.P.; Pan, L.L. Extratropical tropopause transition layer characteristics from high-resolution sounding data. J. Geophys. Res. Space Phys. 2010, 115. [Google Scholar] [CrossRef] [Green Version]
Figure 1. (a) The red line shows the latitudinal variation in the climatological lapse-rate tropopause pressure (PLRT) averaged over 1980–2017. The colors show occurrence frequency of different PLRT intervals in each latitudinal bin at selected radiosonde stations. The pressure altitude ranges from 500–100 hPa. (b) The number of the selected stations varying with latitude.
Atmosphere 12 00417 g001
Figure 2. (a) Spatial variation in the PLRT difference (ΔPLRT, in hPa) between NCEP/NCAR and radiosonde data. Each value is the mean difference in PLRT over 1980–2017 at each grid cell containing one or more radiosonde sites. In the right panel, 10° zonal-mean differences are shown. The text indicates the global mean bias. (b) The same as (a), but for the PLRT difference between MERRA-2 and radiosonde data. 0.625° × 0.5° grid cells are properly magnified for visibility. The NCEP/NCAR and MERRA-2 data are used in their original resolutions of 2.5° × 2.5° and 0.625° × 0.5° in longitude and latitude.
Atmosphere 12 00417 g002
Figure 3. (a) Frequency distribution of the PLRT difference (ΔPLRT, in hPa) between NCEP/NCAR and radiosonde data in each 10° latitudinal zone. (b) The same as (a), but for the PLRT difference between MERRA-2 and radiosonde data. (c) The total frequency of positive biases (in blue) and negative biases (in red) in each 10° latitudinal band for NCEP/NCAR. (d) The same as (c), but for MERRA-2. The NCEP/NCAR and MERRA-2 data are used in their original resolutions of 2.5° × 2.5° and 0.625° × 0.5° in longitude and latitude.
Atmosphere 12 00417 g003
Figure 4. (a) Latitudinal variation in the PLRT difference (ΔPLRT, in hPa) between NCEP/NCAR and radiosonde data averaged over 1980–2017 in the four seasons. (b) The same as (a), but for the PLRT differences between MERRA-2 and radiosonde data. The NCEP/NCAR and MERRA-2 data are used in their original resolutions of 2.5° × 2.5° and 0.625° × 0.5° in longitude and latitude.
Atmosphere 12 00417 g004
Figure 5. (a) The zonal mean PLRT difference (ΔPLRT, in hPa) over 1980–2017 between NCEP/NCAR and radiosonde data at different horizontal resolutions. The text indicates the hemispheric mean, which is calculated as the cosine-weighted latitudinal average of monthly 10°-zonal mean differences. (b) The same as (a), but for the PLRT difference between MERRA-2 and radiosonde data.
Atmosphere 12 00417 g005aAtmosphere 12 00417 g005b
Figure 6. (a) Histogram of the PLRT biases in NCEP/NCAR (blue bar, left y-axis), based on all monthly samples at all available 5° × 5° regridded cells containing one or more radiosonde sites over 1980–2017. Ratio (right y-axis) of the number of samples with misidentified tropopause layer to the total number of samples in each of the bias intervals (x-axis) at 1-km (red solid line) and 0.5-km (red dashed line) vertical resolutions. The text indicates the ratio of misidentified tropopause layers in NCEP/NCAR based on all monthly samples. (b) The same as (a), but for the PLRT biases in MERRA-2. The NCEP/NCAR and MERRA-2 data are remapped to a horizontal resolution of 5° × 5° in longitude and latitude to be consistent with TOST data.
Atmosphere 12 00417 g006
Figure 7. (a) Means (gray bar) and standard deviations (black error bar) of tropospheric column ozone (TCO) biases caused by using NCEP/NCAR PLRT in each of the PLRT bias intervals (left y-axis), based on all monthly samples for which both radiosonde and ozonesonde are available. TCO bias is computed as the difference in TCO using NCEP/NCAR PLRT and using radiosonde PLRT. The occurrence frequency of the NCEP/NCAR PLRT biases in each of the PLRT bias intervals is also shown (blue dashed line, right y-axis). (b) The same as (a), but for PLRT biases in MERRA-2 and induced TCO biases. The NCEP/NCAR and MERRA-2 data are used in their original resolutions of 2.5° × 2.5° and 0.625° × 0.5° in longitude and latitude.
Atmosphere 12 00417 g007
Figure 8. (a) Spatial variation in the TCO biases (in DU) between using NCEP/NCAR PLRT and using radiosonde PLRT. Each value is the mean difference in TCO over 1980–2017 at each of the 5° × 5° grid cells. In the right panels, 10° zonal-mean differences are shown. The text indicates the global mean bias in absolute and relative terms. (b) The same as (a), but for the TCO biases using MERRA-2 PLRT. Vertical ozone profile data is based on TOST at 1-km resolution. Blank grids are missing data mainly due to unavailability of radiosonde data. Both NCEP/NCAR and MERRA-2 data are remapped to the horizontal resolution of TOST, 5° × 5° in longitude and latitude [57]. The text in each panel indicates the global mean biases if PLRT from the corresponding reanalysis is used.
Atmosphere 12 00417 g008
Table 1. Means and standard deviations (in brackets) of PLRT biases (in hPa, top panel) and HLRT biases (in m, bottom panel) over 1980–2017. MAM stands for March-April-May, JJA June-July-August, SON September-October-November, and DJF December-January-February.
DomainYearlyMAMJJASONDJF
PLRT Difference (NCEP—Radiosonde, hPa)
Globe−2.28 (5.84)−2.87 (6.09)−2.79 (6.48)−2.56 (6.9)−3.08 (6.06)
NH−0.57 (6.04)−1.04 (7.57)−1.91 (7.69)−0.32 (6.91)−0.59 (7.76)
SH−4.00 (5.64)−4.74 (4.58)−3.69 (5.25)−4.80 (6.9)−5.56 (4.35)
PLRT Difference (MERRA-2—Radiosonde, hPa)
Globe−0.92 (6.71)−2.53 (7.89)−0.07 (8.77)−0.16 (7.71)−3.61 (7.78)
NH−1.34 (9.83)−2.95 (12.02)−0.97 (12.09)−0.24 (10.88)−3.48 (11.78)
SH−0.49 (3.6)−2.10 (3.69)0.85 (5.4)−0.09 (4.55)−3.74 (3.78)
HLRT Difference (NCEP—Radiosonde, m)
Globe52 (232)116 (238)33 (251)45 (267)138 (243)
NH14 (249)76 (297)29 (300)−20 (272)48 (301)
SH91 (216)157 (178)37 (201)111 (262)228 (184)
HLRT Difference (MERRA-2—Radiosonde, m)
Globe16 (257)107 (291)−56 (319)−28 (287)159 (292)
NH46 (365)150 (429)−21 (424)−25 (392)178 (418)
SH−14 (149)63 (151)−92 (214)−30 (182)141 (167)
Publisher’s Note: MDPI stays neutral with regard to jurisdictional claims in published maps and institutional affiliations.

