Abstract
Sampling campaigns indoors have shown that occupants exposed to contaminated air generally exhibit diverse health outcomes. This study intends to assess the deposition rates of total settleable dust and bioburden in the indoor air of dwellings onto quartz fiber filters and electrostatic dust collectors (EDCs), respectively. EDC extracts were inoculated onto malt extract agar (MEA) and dichloran glycerol (DG18) agar-based media used for fungal contamination characterization, while tryptic soy agar (TSA) was applied for total bacteria assessment, and violet red bile agar (VRBA) for Gram-negative bacteria. Azole-resistance screening and molecular detection by qPCR was also performed. Dust loading rates ranged from 0.111 to 3.52, averaging 0.675 μg cm−2 day−1. Bacterial counts ranged from undetectable to 16.3 colony-forming units (CFU) m−2 day−1 and to 2.95 CFU m−2 day−1 in TSA and VRBA, respectively. Fungal contamination ranged from 1.97 to 35.4 CFU m−2 day−1 in MEA, and from undetectable to 48.8 CFU m−2 day−1 in DG18. Penicillium sp. presented the highest prevalence in MEA media (36.2%) and Cladosporium sp. in DG18 (39.2%). It was possible to observe: (a) settleable dust loadings and fungal contamination higher in dwellings with pets; (b) fungal species considered indicators of harmful fungal contamination; (c) Aspergillus section Candidi identified in supplemented media with voriconazole and posaconazole; (d) specific housing typologies and (e) specific housing characteristics influencing the microbial contamination.
1. Introduction
Bioburden (comprising bacterial and fungal genera) is very common in dwellings. The most prevalent fungal genera found in this indoor environment are Cladosporium, Penicillium, Alternaria and Aspergillus [1,2]. In fact, in Portuguese dwellings, located in the districts of Lisbon and Aveiro, Penicillium and Aspergillus have been also reported as the dominant fungi [3,4]. Lately, exposure to fungal contamination has gained increasing importance, since correlations with respiratory diseases and atopic dermatitis have been often observed [5,6,7]. Recent studies have also documented the emerging worldwide problem of azole drug resistance of A. fumigatus isolates [8,9,10,11,12]. The prevalence of azole resistant fungi in dwellings, especially in homes of immunocompromised individuals or patients with respiratory diseases, represents a significant health risk that supports the need for assessments of the prevalence of azole resistance in indoor environments of different regions [13,14].
Several studies have reported that dust is the most suitable matrix to characterize bioburden, so it has been used by several researchers in this type of evaluation [15,16]. Furthermore, settled dust has been considered a reservoir of bacterial contamination [17]. Thus, although some researchers argue that active sampling methods (air pumping) represent a better surrogate of exposure, numerous advantages can be pointed out to passive sampling methods. Indeed, active air sampling is limited by short sampling periods (minutes to hours), representing only a snapshot of bioburden exposure [18]. Electrostatic dust collectors (EDCs) constitute a simple and cost-effective passive sampling method able to characterize bioburden present in settleable dust [3,4,19,20,21,22,23]. Given their simplicity, low cost, independence from noisy pumps and power supply, possibility of allowing simultaneous sampling in multiple locations, and ability to provide indications of exposure over longer time frames, passive samplers are regarded as a good alternative in indoor air quality and exposure assessment studies [24,25].
Bioburden assessment with EDCs has been previously carried out in occupational environments, such as schools [3], health care centers [26] and swine farms [27], as well as in residential settings of Portuguese coastal cities [3,4]. However, outdoor fungi and bacteria are mainly affected by local climate conditions [28], while in indoor environments different factors, such as the thermal comfort, dwelling characteristics and occupant activities, may play a key role in bioburden [3,4,29,30]. Thus, results of a given region may not be generalizable to other target populations.
In this study, the deposition rates of total settleable dust and bioburden were assessed in the indoor air of dwellings in a small urban area within a touching distance from the highest mountain range in mainland Portugal. The investigation also included the molecular detection of toxigenic fungal species and the analysis of antifungal resistance profiles.
2. Materials and Methods
2.1. Location of the Studied Dwellings
This study was conducted in the living rooms of 30 dwellings located in the city of Guarda (Figure 1), from mid-June to early October 2018. The characteristics of each dwelling are listed in the supplementary material. Figure 2 shows the frequencies of the main features. With a population of about 50,000 inhabitants, Guarda is the city located at the highest altitude in continental Portugal (around 1000 m). It has a continental cool Mediterranean climate. The average temperature of the coldest month (January) is of 4 °C, that of the warmest month (August) is of 19.2 °C. Precipitation ranges from 10 mm in the driest month (August) to 140 mm in the wettest (December).
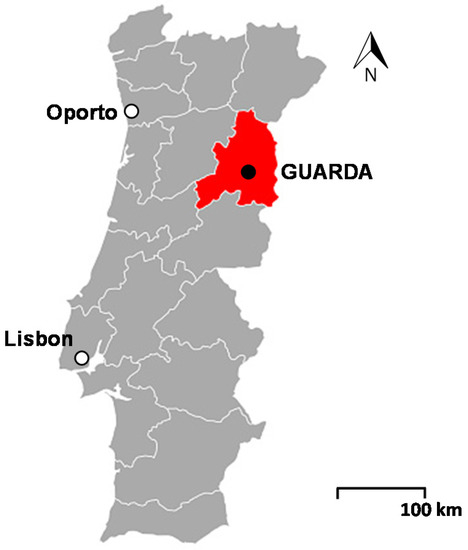
Figure 1.
Location of the studied dwellings in Guarda, Portugal.
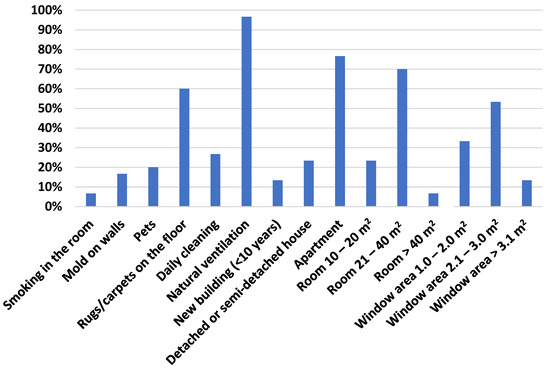
Figure 2.
Frequencies of the main features of the houses and rooms where samples were obtained.
2.2. Settleable Dust Sampling and Quantification
To collect particulate matter, 47 mm diameter quartz fiber filters (Pallflex® Putnam, CT, USA) were exposed in uncovered petri dishes (Analyslide® Pall, München, Germany) over periods from 105 to 160 days, between June and early October 2018, under typical summer conditions. Filters were weighted, before and after exposure, in a microbalance (RADWAG 5/2Y, Radom, Poland) after conditioning for 24 h in a room with controlled humidity (50%) and temperature (20 °C). Each filter was weighted at least 6 times. The final value resulted from the average of these 6 readings.
Electrostatic dust collectors (EDC), which comprise electrostatic polypropylene clothes, were exposed to particulate fallout over the same time as quartz filters. One EDC was placed in each sampling location. EDCs were placed in open petri dishes (surface area of 154 cm2) side by side with the quartz filters, on top of the furniture, at 1.3–1.5 m above the ground, which corresponds approximately to the breathing zone height. A member of the research team, together with the family nurse, explained to the members of each dwelling about the importance of not touching the samplers and that information was also passed on to the cleaning lady. After transport in refrigerated conditions (<4 °C), EDCs were then used to assess bioburden.
2.3. Electrostatic Dust Cloth Extraction and Bioburden Analyses
Settled dust collected by EDCs was analyzed by culture-based methods and using Real Time PCR (qPCR), targeting 4 indicators of harmful fungal contamination belonging to Aspergillus genera, namely sections Flavi, Fumigati, Circumdati and Nidulantes [4].
EDC extracts (0.15 mL) were obtained following the procedures already published [23] and inoculated onto 2% malt extract agar (MEA) with 0.05 g L−1 chloramphenicol media and dichloran glycerol (DG18) agar-based media were used for fungal contamination characterization, while tryptic soy agar (TSA) with 0.2% nystatin was applied for total bacteria assessment, and violet red bile agar (VRBA) for Gram-negative bacteria.
Samples were also seeded (0.15 mL) onto Sabouraud dextrose agar (SAB) media supplemented with 4 mg L−1 itraconazole (ITR), 1 mg L−1 voriconazole (VOR), or 0.5 mg L−1 posaconazole (POS) (protocol adapted from the EUCAST 2017 guidelines) [31] for the screening of antifungal resistance [32].
Incubation of MEA, DG18 and azole screening plates at 27 °C for 5 to 7 days and TSA and VRBA plates at 30 and 35 °C for 7 days, respectively, was ensured. Bioburden densities (colony-forming units, CFU m−2 day−1) were calculated following the same procedures already published [3,4].
Molecular detection of the different Aspergillus sections was accomplished by qPCR using the CFX-Connect PCR System (Bio-Rad). Reactions included 1× iQ Supermix (Bio-Rad), 0.5 μm of each primer (Table 1), and 0.375 μm of TaqMan probe in a total volume of 20 μL. Amplification followed a three-step PCR: 50 cycles with denaturation at 95 °C for 30 s, annealing at 52 °C for 30 s, and extension at 72 °C for 30 s. A non-template control was used in every PCR reaction. For each gene that was amplified, a non-template control and a positive control were used, consisting of DNA obtained from a reference that belonged to the culture collection of the Reference Unit for Parasitic and Fungal Infections, Department of Infectious Diseases of Dr. Ricardo Jorge National Institute of Health. These strains have been sequenced for ITS B-tubulin, and calmodulin.

Table 1.
Sequence of primers and TaqMan probes used for real time PCR.
Table 1.
Sequence of primers and TaqMan probes used for real time PCR.
| Aspergillus Sections Targeted | Sequences | Reference |
|---|---|---|
| Flavi (Toxigenic Strains) | ||
| Forward Primer | 5′-GTCCAAGCAACAGGCCAAGT-3′ | |
| Reverse Primer | 5′-TCGTGCATGTTGGTGATGGT-3′ | [33] |
| Probe | 5′-TGTCTTGATCGGCGCCCG-3′ | |
| Fumigati | ||
| Forward Primer | 5′-CGCGTCCGGTCCTCG-3′ | |
| Reverse Primer | 5′-TTAGAAAAATAAAGTTGGGTGTCGG-3′ | [34] |
| Probe | 5′-TGTCACCTGCTCTGTAGGCCCG-3′ | |
| Circumdati | ||
| Forward Primer | 5′-CGGGTCTAATGCAGCTCCAA-3′ | |
| Reverse Primer | 5′-CGGGCACCAATCCTTTCA-3′ | [35] |
| Probe | 5′-CGTCAATAAGCGCTTTT-3′ | |
| Nidulantes | ||
| Forward Primer | 5′–CGGCGGGGAGCCCT-3′ | |
| Reverse Primer | 5′–CCATTGTTGAAAGTTTTGACTGATcTTA-3′ | [36] |
| Probe | 5′–AGACTGCATCACTCTCAGGCATGAAGTTCAG-3′ |
2.4. Statistical Analysis
The data were analyzed using the statistical software SPSS, V26.0. The results were considered significant at the 5% significance level. To test the normality of the data, the Shapiro–Wilk test was used. For the characterization of the sample, frequency analysis (n, %) was used for qualitative data and the minimum, maximum, mean or median and standard deviation for quantitative data. Graphical representations were also used according to the nature of the data. The Spearman’s correlation coefficient was used to study the relationship between housing characteristics, bacterial and fungal counts and azoles screening, since the assumption of normality was not verified. For the comparison of bacterial counts, fungal counts and azoles screening between the heating systems (which was dichotomized, in central and others, due to the reduced number of responses), between wall materials (also dichotomized, brick/stone and brick + stone), between window frames, between rugs (yes/no), between smoke in the room (yes/no), between pets (yes/no), between cleaning frequency (daily/weekly) and between fungi (yes/no), the Mann–Whitney test was employed, since the assumption of normality was not verified. To compare the bacterial counts, fungal counts and screening azoles between the types of frames, the Kruskal–Wallis test was used, since the assumption of normality was not verified. Neural networks were used to assess which housing characteristics are most important for bacterial and fungal counts and azoles screening.
3. Results and Discussion
3.1. Dust Loading Rates
Dust loading rates ranged from 0.111 to 3.52, averaging 0.675 μg cm−2 day−1. These mass loadings of household dust are in line with the mean values (0.429 μg cm−2 day−1 in winter, 0.570 μg cm−2 day−1 in summer) reported for different dwellings located in the coastal district of Aveiro, also in Portugal [3,4]. Slightly lower deposition rates were documented for four New Jersey homes, where mean values of 0.37 ± 0.13 μg cm−2 day−1 during the summer and 0.22 ± 0.13 μg cm−2 day−1 during the winter were obtained [37]. Shraim et al. [38] collected dust samples from residential houses in the city of Almadinah Almunawarah, Saudi Arabia, reporting loading rates from 0.489 µg cm−2 day−1 to 1.53 µg cm−2 day−1. Much higher mean dust loading rates of 22.6 and 117 µg cm−2 day−1 were measured by Khoder et al. [39] inside and outside of domestic houses, respectively, in an urban area of Giza, Egypt. In the present study, on average, settleable dust loadings in dwellings with dogs (1.25 μg cm−2 day−1) were approximately double those in homes that did not have that pet (0.576 μg cm−2 day−1). No conclusions could be drawn regarding the influence of other characteristics.
3.2. Bacterial Contamination Assessment
Bacterial counts ranged from undetectable to 16.3 CFU m−2 day−1 and to 2.95 CFU m−2 day−1 in TSA and VRBA, respectively. Median values were 5.82 CFU m−2 day−1 in TSA and 0.00 CFU m−2 day−1 in VRBA. The lower counts of Gram-negative bacteria followed the same trend as in previous studies conducted in dwellings from two different Portuguese cities [4], which can in part be explained by less tolerance to the environmental factors of these species [40].
3.3. Fungal Contamination Assessment
Fungal contamination ranged from 1.97 to 35.4 CFU m−2 day−1 in MEA, and from undetectable to 48.8 CFU m−2 day−1 in DG18. These counts are lower than those obtained in previous studies conducted in Lisbon city [23], in French dwellings [22] and in Danish homes [41]. The differences can be due to dissimilar contamination sources, or even environmental variables that can impact the fungal profile indoors [42]. Additionally, the differences observed between the results of this study and those reported in the literature may also arise from aspects related to seasonality that may have an influence on microbial contamination [23,28,42].
Penicillium sp. presented the highest prevalence in MEA media (143 CFU m−2 day−1; 36.2%), followed by Aspergillus sp. (104 CFU m−2 day−1; 26.4%) and Cladosporium sp. (75.7 CFU m−2 day−1; 19.1%). In DG18 media, the highest prevalence belonged to Cladosporium sp. (202 CFU m−2 day−1; 39.2%), followed by Aspergillus sp. (149 CFU m−2 day−1; 28.8%) and Penicillium sp. (109 CFU m−2 day−1; 21.2%) (Table 2). The most prevalent fungi followed the same trend of other studies conducted in different Portuguese cities, where Aspergillus, Penicillium and Cladosporium genera also dominated [3,4]. As expected, depending of the culture media, the fungal characterization presented different results in counts and species. Indeed, the exclusive identification by MEA of Mucor sp., Paecilomyces sp. and Trichothecium roseum with clinical relevance and/or with toxigenic potential [43,44,45], should be highlighted.
Table 2.
Distribution of fungal species in both culture media applied.
Regarding Aspergillus sp., a total of eight sections were identified in these samples. In MEA media, Aspergillus section Nigri presented the highest prevalence (54.5%), followed by Aspergillus section Fumigati (21.7%) and Aspergillus section Nidulantes (20.1%). Concerning DG18, Aspergillus section Nidulantes showed the highest prevalence (42.4%), followed by Aspergillus section Circumdati (34.5%) and Aspergillus section Candidi (9.89%) (Figure 3). The identification of Aspergillus sections (Fumigati, Nidulantes and Circumdati) should be stressed since they are considered indicators of harmful fungal contamination [46]. Additionally, the exclusive identification by MEA of Aspergillus sections Fumigati and Flavi and Circumdati section in DG18 increases the importance of applying different culture media to acknowledge the Aspergillus contribution to fungal contamination [32]. In fact, the presence indoors of Aspergillus section Fumigati represents a major risk for the onset and development of respiratory diseases in immunocompromised individuals [47,48], while sections Flavi and Circumdati, major producers of aflatoxin B1 and ochratoxin, respectively, represent the potential exposure to these mycotoxins [3,44,49].
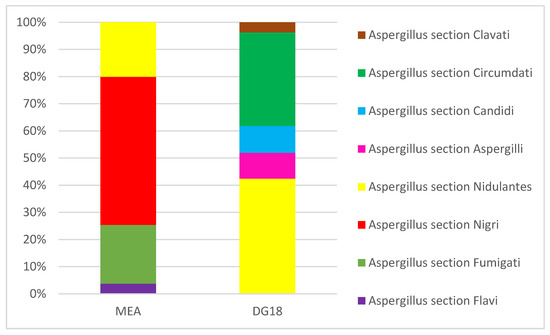
Figure 3.
Aspergillus sections identified in EDC samples.
3.4. Screening of Azole-Resistance
Fungal contamination in EDC samples ranged from 0.99 to 21.4 CFU m−2 day−1 in Sabouraud dextrose agar media (SAB), followed by maxima of 3.93, 5.54 and 1.98 CFU m−2 day−1 in ITR, VOR and POS, respectively. Penicillium spp. was also the most frequent in SAB media (82.2 CFU m−2 day−1; 40.7%), followed by Aspergillus spp. (44.6 CFU m−2 day−1; 22.1%) and Cladosporium spp. (27.8 CFU m−2 day−1; 13.8%), with a fungal distribution similar to that observed in MEA. In azole-supplemented media, a higher fungal diversity was observed in VOR (seven genus/species ranging from 0.98 to 27.8 CFU m−2 day−1), followed by POS (four genus/species ranging from 0.98 to 2.97 CFU m−2 day−1) and ITR (three genus/species ranging from 0.93 to 6.79 CFU m−2 day−1) (Table 3).
Table 3.
Distribution of fungal species through azole screening of electrostatic dust collectors (EDC) samples.
Five Aspergillus sections were identified in SAB in 17 (32.7%) of the EDC samples, with a sixth section (Candidi) identified in VOR and POS. Aspergillus section Nigri was also (as in MEA) the most frequent in SAB (28.9%), followed by Aspergillus sections Clavati (8.38%) and Fumigati (4.85%). No Aspergillus sections were identified in ITR (Figure 4).
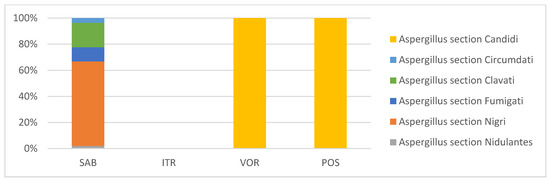
Figure 4.
Aspergillus sections identified through azole screening of EDC samples.
3.5. Molecular Assessment
None of the fungal species/strains (Aspergillus sections Fumigati, Flavi, Nidulantes and Circumdati) have been amplified by RT-PCR, while culture-based methods were able to provide positive results within Aspergillus genera. False negatives in the qPCR assays for fungal detection can occur. This can be due to inadequate removal of PCR inhibitors from the sample (such as particles present in the EDC), ineffective release of microbial DNA content from the cells, or poor DNA recovery after extraction and purification steps [50,51]. Although these observations, molecular tools are generally an appropriate solution to overcome the limitations of culture-based methods as they might also provide a more complete diversity profile (e.g., high throughput sequencing), unlike culture methods that might reveal less abundant taxa in an environment or with slower growth rates [52]. Nevertheless, molecular methods often only identify most of the organisms until taxonomic levels [52,53] and this identification level is not exhaustive enough to perform exposure assessment [32].
3.6. Correlation Analysis
Between housing characteristics and bacterial counts (TSA and VRBA), fungal counts (MEA and DG18) and azoles screening (SAB, ITR, VOR and POS), only the following correlations were detected: (i) area of the living rooms and fungal counts in MEA (rS = −0.500, p = 0.005) and in DG18 (rS = −0.512, p = 0.004); (ii) ceiling height and the fungal counts in MEA (rS = −0.464, p = 0.010); iii) number of floors and fungal counts in SAB (rS = 0.368, p = 0.045) and in POS (rS = 0.467, p = 0.009) (Table 4). These results reveal that larger dimensions of the rooms and higher ceiling heights are related to less fungal counts, whilst a higher number of floors of the building is associated with higher fungal counts in SAB and in POS.
Table 4.
Study of the relationship between housing characteristics, bacterial counts (tryptic soy agar (TSA) and violet red bile agar (VRBA)) and fungal counts (malt extract agar (MEA) and DG18) and azoles screening (in SAB, ITR, VOR and POS): Spearman correlation results.
Fungal proliferation indoors could be a result of water leakage or inadequate ventilation [54]. In fact, larger spaces can favor better ventilation and dilution of the microbial contamination [54]. On the other hand, house typologies with a higher number of floors, thus, more compartmentalized, might have poorer ventilation and promote the accumulation of dust, as all residential surfaces may act as passive collectors of airborne fungi of outdoor origin [55]. This phenomenon has already been described in previous studies [56]. Noteworthy, the observed correlation between higher fungal counts in POS and higher number of floors suggests that these housing typologies may favor the development indoors of fungal resistance. Dust and moisture are strongly associated with fungal concentration [57]. However, there are other important determinants, such as type of building material [58], air temperature and moisture levels [59] and also some type of carpet fiber that can affect fungal growth [57]. Additionally, occupants’ behavior can also influence the indoor microbiome through the different frequency of window opening, the use of exhaust fans [60] or of humidifiers [60,61]. Significant correlations were only found between bacterial counts in TSA and in VRBA (rS = 0.440, p = 0.015) and fungal counts in SAB (rS = 0.416, p = 0.022), revealing that higher bacterial counts in TSA are related to higher bacterial counts in VRBA and higher counts in SAB (Table 4). Whereas the origin of bacteria indoors is linked to a mixture of bacteria from outdoor air, house inhabitants, and bacterial growth on surfaces, fungal contamination originates mostly from outdoor air, with some fungal growth on surfaces with high levels of moisture [55].
The EDC sampler, as used in this study, collects airborne bacteria and fungi that are allowed to deposit on its surface during the exposure period (about 3 months, in the present case). The fact that a relation between bacteria and fungi was observed only in SAB (and not in MEA or DG18) might be related to the substrate nature of these fungal media. Sabouraud’s agar is a type of agar growth medium containing peptones that is selective to certain fungi due to its low pH (5.6) and high glucose concentration (3–4%). DG18 media has dichloran added to limit the spread of some fast-growing fungal colonies, limiting their diameter. As for MEA media, they have been extensively used for decades due to its low cost and high availability of malt extract. However, for the wide range of fungi growing in microenvironments such as damp cardboard or carpets in water damaged buildings, the use of maltose as substrate is not likely given its typical absence in those ecological niches [62].
3.7. Comparison between Sampling Locations
From the comparison of bacterial counts, fungal counts and azoles screening, among the type of housing, only statistically significant differences were detected in relation to the bacterial counts in VRBA (U = 45.5, p = 0.041). It was found that the bacterial counts in buildings were higher, probably because detached houses have more solar radiation than buildings [63], decreasing the counts of Gram-negative bacteria due to their less tolerance to environmental factors [40].
Among the types of heating system, wall materials, window frames, types of frames, presence or absence of rugs, smoke in the room and the presence/absence of fungi, no statistically significant differences were detected in terms of bacterial and fungal counts and azoles screening.
Statistically significant differences were detected between fungal counts in DG18 and the presence or absence of pets (U = 25,000, p = 0.015). Higher fungal contamination in DG18 was found when pets are present. Indeed, pets have been described as a contamination source of fungi indoors [64].
With regard to the frequency of cleaning, statistically significant differences were detected for fungal counts in VOR (U = 45.5, p = 0.042), showing higher values when cleaning was weekly, in opposition to daily. While this correlation may suggest that a reduced frequency in cleaning favors the development or persistence of fungal resistance indoors, it is noteworthy that many fungal species present intrinsic resistance to voriconazole, namely, of the Mucor genera [43], as found in this study (Table 4). It is also important to have information on the microbiome outdoors in order to determine the origin of azole resistance. Other fungal species observed in VOR media, such as Aspergillus sp., raise concern on the origin of fungal resistance and its implications for human health [8,9,10,12,13,14,58,65,66].
3.8. Importance of Housing Characteristics for Bacterial Counts, Fungal Counts and Azoles Screening
Figure 5, Figure 6 and Figure 7 show the importance (normalized) of the characteristics of the dwellings for the bacterial counts, fungal counts, and screening azoles. From their analysis, it can be seen that regarding the counts in TSA, the heating system is the one that contributes the most, while in VRBA it is the frequency of cleaning, followed by the heating system and pets. In the case of fungal counts in MEA, the factor that contributed most was the type of ventilation. In DG18, the heating system was the most influential, followed by the type of house, rugs and cleaning frequency. These results corroborate the role of all these factors as determinants of microbial contamination indoors [54,59,60,61,65,66,67].

Figure 5.
Normalized importance of housing characteristics for bacterial counts. (a) TSA, (b) VRBA.
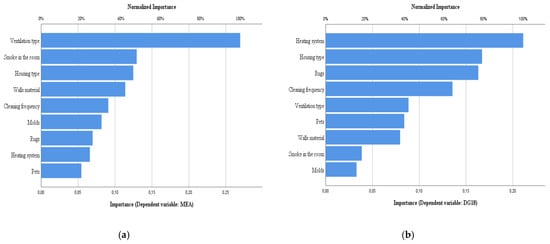
Figure 6.
Normalized importance of housing characteristics for fungal counts. (a) MEA, (b) DG18.
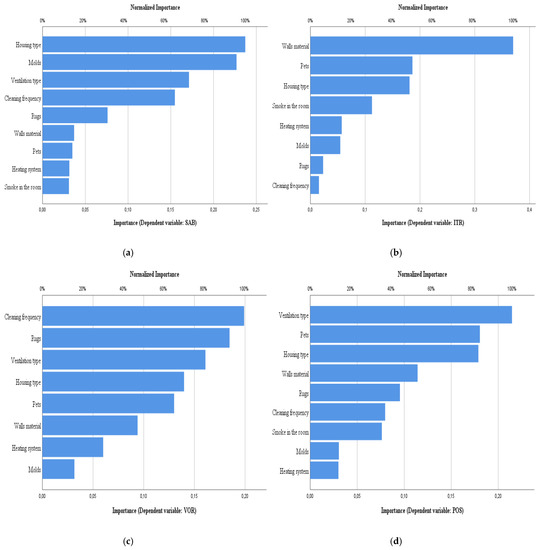
Figure 7.
Normalized importance of housing characteristics for azoles screening. (a) SAB, (b) ITR, (c) VOR, (d) POS.
Finally, for fungal counts in SAB, what contributed most was housing type, ventilation type and cleaning frequency. In ITR, the most influential factor was the material of the walls. This is in accordance with the fungal species detected in ITR (Alternaria sp., Fusarium oxysporum, and Penicillium sp., (Table 4), which are commonly found in ceramic tiles, concrete efflorescences, brick and stone [59,68,69]. In VOR, what contributed most was the cleaning frequency (as abovementioned), followed by the rugs, ventilation type, housing type and pets. The effects of carpet fiber materials and dust loading on fungal growth has been recently described [57]. Nastasi and colleagues concluded that elevated moisture, followed by the presence of house dust are the main contributors to fungal growth in carpets. In POS, the major determinant was the type of ventilation (natural, in 29 out of 30 cases), followed by pets and housing type [57]. Fungal species observed in POS (C. sitophila, Aspergillus sp., Fusarium oxysporum and Penicillium sp.) are commonly found outdoors. Natural ventilation, prevalent in the dwellings of this study, can be a source of microorganisms, especially in the countryside or near nature, and promote their way into buildings during ventilation periods, thus, contaminating the indoor environments [59]. The fact that they were able to grow in a fixed concentration of posaconazole is of concern for Aspergillus sp. and must be further explored in order to determine fungal susceptibility and consequent risk for the health of house inhabitants, especially if immunocompromised or with respiratory diseases [13,14].
It was possible to obtain information on the housing typologies and characteristics that most influence microbial contamination, including azole resistance. The influence of all these variables was previously studied [54,55,56,57,58,59,60,61,62,63,64,65,66,67,68,69,70]. In the present study, results correlated with several physical variables. However, the results of microbial counts can be underestimated due to the extended sampling duration that can decrease microbial viability and because of the aforementioned limitations of culture-based methods [52,70].
In future studies, the record on opening windows should be included, since the promotion of natural ventilation contributes to the decrease of microbial loads in the indoor air [71].
4. Conclusions
The use of electrostatic dust collectors allowed the assessment of settleable dust and bioburden, and to identify the variables that most influence them, in the assessed dwellings. Overall, it was possible to observe:
- Higher settleable dust loadings and fungal contamination levels in dwellings with pets;
- Fungal species considered indicators of harmful fungal contamination, namely Aspergillus sections (Fumigati, Nidulantes and Circumdati);
- The presence in dwellings of Aspergillus sp. (namely, Aspergillus section Candidi) with reduced susceptibility to azoles, thus, with potential risk for immunocompromised inhabitants or individuals with respiratory diseases, corroborating the need to assess the prevalence of azole resistance also in indoor environments;
- Specific housing typologies, such as larger dimensions of the rooms and higher ceiling heights, leading to less fungal counts;
- Specific housing characteristics favoring the development of microbial communities in the indoor air, namely heating system, cleaning frequency and pets, in the case of bacterial contamination, and ventilation type, heating system, house type, rugs and cleaning frequency with regard to fungal contamination.
Supplementary Materials
The following are available online at https://www.mdpi.com/2073-4433/12/3/378/s1, Table S1: Characteristics of dwellings where the samples were taken.
Author Contributions
Conceptualization, C.V., C.A. and C.C.; funding acquisition, C.A., C.C. and C.V.; project administration, C.A. and C.C.; supervision, C.V. and C.A.; methodology, E.V., M.D., B.A., L.A.C. and E.C.; formal analysis, C.V., L.A.C. and C.A.; writing—original draft, C.V., L.A.C. and C.A.; writing—review and editing all co-authors. All authors have read and agreed to the published version of the manuscript.
Funding
Estela Vicente acknowledges the grant SFRH/BD/117993/2016 from the Portuguese Foundation for Science and Technology (FCT). H&TRC authors gratefully acknowledge the FCT/MCTES national support through the UIDB/05608/2020 and UIDP/05608/2020 projects. We are also grateful for the support to CESAM (UIDB/50017/2020 + UIDP/50017/2020) and to GeoBioTec (UID/GEO/04035/2019 + UIDB/04035/2020) to FCT/MCTES through national funds and co-funding by FEDER within the PT2020 Partnership Agreement and Compete 2020.
Acknowledgments
The authors would like to thank the collaboration of the Guarda City Council and the homeowners for their participation. Special thanks go to the nurse José Grácio for his precious help in recruiting the families who agreed to participate in this study.
Conflicts of Interest
The authors declare no conflict of interest.
References
- Mentese, S.; Arisoy, M.; Rad, A.Y.; Güllü, G. Bacteria and Fungi Levels in Various Indoor and Outdoor Environments in Ankara, Turkey. CLEAN Soil Air Water 2009, 37, 487–493. [Google Scholar] [CrossRef]
- Ayanbimpe, G.M.; Wapwera, S.D.; Kuchin, D. Indoor air mycoflora of residential dwellings in Jos metropolis. Afr. Health Sci. 2010, 10, 172–176. [Google Scholar] [PubMed]
- Viegas, C.; Almeida, B.; Dias, M.; Caetano, L.; Carolino, E.; Gomes, A.; Faria, T.; Martins, V.; Marta Almeida, S. Assessment of Children’s Potential Exposure to Bioburden in Indoor Environments. Atmosphere 2020, 11, 993. [Google Scholar] [CrossRef]
- Viegas, C.; Dias, M.; Almeida, B.; Vicente, E.; Caetano, L.A.; Carolino, E.; Alves, C. Settleable Dust and Bioburden in Portuguese Dwellings. Microorganisms 2020, 8, 1799. [Google Scholar] [CrossRef] [PubMed]
- O’Connor, G.T.; Walter, M.; Mitchell, H.; Kattan, M.; Morgan, W.J.; Gruchalla, R.S.; Pongracic, J.A.; Smartt, E.; Stout, J.W.; Evans, R., III. Airborne fungi in the homes of children with asthma in low-income urban communities: The Inner-City Asthma Study. J. Allergy Clin. Immunol. 2004, 114, 599–606. [Google Scholar] [CrossRef] [PubMed]
- Tischer, C.; Chen, C.-M.; Heinrich, J. Association between domestic mould and mould components, and asthma and allergy in children: A systematic review. Eur. Respir. J. 2011, 38, 812–824. [Google Scholar] [CrossRef] [PubMed]
- Gaitanis, G.; Magiatis, P.; Hantschke, M.; Bassukas, I.D.; Velegraki, A. The Malassezia Genus in Skin and Systemic Diseases. Clin. Microbiol. Rev. 2012, 25, 106–141. [Google Scholar] [CrossRef]
- Verweij, P.E.; Snelders, E.; Kema, G.H.; Mellado, E.; Melchers, W.J. Azole resistance in Aspergillus fumigatus: A side-effect of environmental fungicide use? Lancet Infect. Dis. 2009, 9, 789–795. [Google Scholar] [CrossRef]
- Snelders, E.; Camps, S.M.T.; Karawajczyk, A.; Schaftenaar, G.; Kema, G.H.J.; van der Lee, H.A.; Klaassen, C.H.; Melchers, W.J.G.; Verweij, P.E. Triazole Fungicides Can Induce Cross-Resistance to Medical Triazoles in Aspergillus fumigatus. PLoS ONE 2012, 7, e31801. [Google Scholar] [CrossRef]
- Prigitano, A.; Venier, V.; Cogliati, M.; De Lorenzis, G.; Esposto, M.C.; Tortorano, A.M. Azole-resistant Aspergillus fumigatus in the environment of northern Italy, May 2011 to June 2012. Eurosurveillance 2014, 19. [Google Scholar] [CrossRef]
- Sabino, R.; Verissimo, C.; Parada, H.; Brandao, J.; Viegas, C.; Carolino, E.; Clemons, K.V.; Stevens, D.A. Molecular screening of 246 Portuguese Aspergillus isolates among different clinical and environmental sources. Med. Mycol. 2014, 52, 519–529. [Google Scholar] [CrossRef]
- Perlin, D.S.; Rautemaa-Richardson, R.; Alastruey-Izquierdo, A. The global problem of antifungal resistance: Prevalence, mechanisms, and management. Lancet Infect. Dis. 2017, 17, e383–e392. [Google Scholar] [CrossRef]
- Dauchy, C.; Bautin, N.; Nseir, S.; Reboux, G.; Wintjens, R.; Le Rouzic, O.; Sendid, B.; Viscogliosi, E.; Le Pape, P.; Arendrup, M.C.; et al. Emergence of Aspergillus fumigatus azole resistance in azole-naïve patients with chronic obstructive pulmonary disease and their homes. Indoor Air 2018, 28, 298–306. [Google Scholar] [CrossRef]
- Simões, D.; Aranha Caetano, L.; Veríssimo, C.; Viegas, C.; Sabino, R. Aspergillus collected in specific indoor settings: Their molecular identification and susceptibility pattern. Int. J. Environ. Health Res. 2019, 1–10. [Google Scholar] [CrossRef]
- Leppänen, H.K.; Täubel, M.; Jayaprakash, B.; Vepsäläinen, A.; Pasanen, P.; Hyvärinen, A. Quantitative assessment of microbes from samples of indoor air and dust. J. Expo. Sci. Environ. Epidemiol. 2018, 28, 231–241. [Google Scholar] [CrossRef]
- Park, J.-H.; Sulyok, M.; Lemons, A.R.; Green, B.J.; Cox-Ganser, J.M. Characterization of fungi in office dust: Comparing results of microbial secondary metabolites, fungal internal transcribed spacer region sequencing, viable culture and other microbial indices. Indoor Air 2018, 28, 708–720. [Google Scholar] [CrossRef]
- Bouillard, L.; Michel, O.; Dramaix, M.; Devleeschouwer, M. Bacterial contamination of indoor air, surfaces, and settled dust, and related dust endotoxin concentrations in healthy office buildings. Ann. Agric. Environ. Med. 2005, 12, 187–192. [Google Scholar] [PubMed]
- Stamatelopoulou, A.; Pyrri, I.; Asimakopoulos, D.N.; Maggos, T. Indoor air quality and dustborne biocontaminants in bedrooms of toddlers in Athens, Greece. Build. Environ. 2020, 173, 106756. [Google Scholar] [CrossRef]
- Basinas, I.; Schlünssen, V.; Heederik, D.; Sigsgaard, T.; Smit, L.A.M.; Samadi, S.; Omland, Ø.; Hjort, C.; Madsen, A.M.; Skov, S.; et al. Sensitisation to common allergens and respiratory symptoms in endotoxin exposed workers: A pooled analysis. Occup. Environ. Med. 2012, 69, 99–106. [Google Scholar] [CrossRef] [PubMed]
- Krop, E.J.M.; Jacobs, J.H.; Sander, I.; Raulf-Heimsoth, M.; Heederik, D.J.J. Allergens and β-Glucans in Dutch Homes and Schools: Characterizing Airborne Levels. PLoS ONE 2014, 9, e88871. [Google Scholar] [CrossRef]
- Rocchi, S.; Reboux, G.; Frossard, V.; Scherer, E.; Valot, B.; Laboissière, A.; Zaros, C.; Vacheyrou, M.; Gillet, F.; Roussel, S.; et al. Microbiological characterization of 3193 French dwellings of Elfe cohort children. Sci. Total Environ. 2015, 505, 1026–1035. [Google Scholar] [CrossRef]
- Spilak, M.P.; Madsen, A.M.; Knudsen, S.M.; Kolarik, B.; Hansen, E.W.; Frederiksen, M.; Gunnarsen, L. Impact of dwelling characteristics on concentrations of bacteria, fungi, endotoxin and total inflammatory potential in settled dust. Build. Environ. 2015, 93, 64–71. [Google Scholar] [CrossRef]
- Viegas, C.; Dias, M.; Monteiro, A.; Faria, T.; Lage, J.; Carolino, E.; Caetano, L.A.; Gomes, A.Q.; Almeida, S.M.; Verde, S.C.; et al. Bioburden in sleeping environments from Portuguese dwellings. Environ. Pollut. 2021, 273, 116417. [Google Scholar] [CrossRef] [PubMed]
- Yamamoto, N.; Schmechel, D.; Chen, B.T.; Lindsley, W.G.; Peccia, J. Comparison of quantitative airborne fungi measurements by active and passive sampling methods. J. Aerosol Sci. 2011, 42, 499–507. [Google Scholar] [CrossRef]
- Córdoba Gamboa, L.; Solano Diaz, K.; Ruepert, C.; van Wendel de Joode, B. Passive monitoring techniques to evaluate environmental pesticide exposure: Results from the Infant’s Environmental Health study (ISA). Environ. Res. 2020, 184, 109243. [Google Scholar] [CrossRef]
- Viegas, C.; Santos, P.; Almeida, B.; Monteiro, A.; Carolino, E.; Gomes, A.Q.; Viegas, S. Electrostatic dust collector: A passive screening method to assess occupational exposure to organic dust in primary health care centers. Air Qual. Atmos. Health 2019, 12, 573–583. [Google Scholar] [CrossRef]
- Viegas, C.; Faria, T.; Monteiro, A.; Caetano, L.; Carolino, E.; Quintal Gomes, A.; Viegas, S. A Novel Multi-Approach Protocol for the Characterization of Occupational Exposure to Organic Dust—Swine Production Case Study. Toxics 2017, 6, 5. [Google Scholar] [CrossRef]
- Chang, C.; Gershwin, M.E. Indoor Air Quality and Human Health: Truth vs Mass Hysteria. Clin. Rev. Allergy Immunol. 2004, 27, 219–240. [Google Scholar] [CrossRef]
- Aydogdu, H.; Asan, A.; Otkun, M.T. Indoor and outdoor airborne bacteria in child day-care centers in Edirne City (Turkey), seasonal distribution and influence of meteorological factors. Environ. Monit. Assess. 2010, 164, 53–66. [Google Scholar] [CrossRef]
- Le Cann, P.; Bonvallot, N.; Glorennec, P.; Deguen, S.; Goeury, C.; Le Bot, B. Indoor environment and children’s health: Recent developments in chemical, biological, physical and social aspects. Int. J. Hyg. Environ. Health 2011, 215, 1–18. [Google Scholar] [CrossRef]
- Arendrup, M.C.; Rodriguez-Tudela, J.-L.; Lass-Flörl, C.; Cuenca-Estrella, M.; Donnelly, J.P.; Hope, W. EUCAST technical note on anidulafungin. Clin. Microbiol. Infect. 2011, 17, E18–E20. [Google Scholar] [CrossRef] [PubMed]
- Viegas, C.; Dias, M.; Carolino, E.; Sabino, R. Culture Media and Sampling Collection Method for Aspergillus spp. Assessment: Tackling the Gap between Recommendations and the Scientific Evidence. Atmosphere 2020, 12, 23. [Google Scholar] [CrossRef]
- Mayer, Z.; Bagnara, A.; Färber, P.; Geisen, R. Quantification of the copy number of nor-1, a gene of the aflatoxin biosynthetic pathway by real-time PCR, and its correlation to the cfu of Aspergillus flavus in foods. Int. J. Food Microbiol. 2003, 82, 143–151. [Google Scholar] [CrossRef]
- Cruz-Perez, P.; Buttner, M.P.; Stetzenbach, L.D. Specific detection of Stachybotrys chartarum in pure culture using quantitative polymerase chain reaction. Mol. Cell. Probes 2001, 15, 129–138. [Google Scholar] [CrossRef]
- Viegas, C.; Faria, T.; de Oliveira, A.C.; Caetano, L.A.; Carolino, E.; Quintal-Gomes, A.; Twarużek, M.; Kosicki, R.; Soszczyńska, E.; Viegas, S. A new approach to assess occupational exposure to airborne fungal contamination and mycotoxins of forklift drivers in waste sorting facilities. Mycotoxin Res. 2017, 33, 285–295. [Google Scholar] [CrossRef]
- United States Environmental Protection Agency (EPA). Microbiological and Chemical Exposure Assessment, EPA Technology for Mold Identification and Enumeration. Available online: https://irp-cdn.multiscreensite.com/c4e267ab/files/uploaded/gCQnkBNWQuSD96fPIikY_EPA_TechnologyforMoldIdentificationandEnumeration.pdf (accessed on 21 February 2021).
- Edwards, R.D.; Yurkow, E.J.; Lioy, P.J. Seasonal deposition of housedusts onto household surfaces. Sci. Total Environ. 1998, 224, 69–80. [Google Scholar] [CrossRef]
- Shraim, A.M.; Alenazi, D.A.; Abdel-Salam, A.-S.G.; Kumar, P. Loading Rates of Dust and Metals in Residential Houses of Arid and Dry Climatic Regions. Aerosol Air Qual. Res. 2016, 16, 2462–2473. [Google Scholar] [CrossRef]
- Khoder, M.I.; Hassan, S.K.; El-Abssawy, A.A. An Evaluation of Loading Rate of Dust, Pb, Cd, and Ni and Metals Mass Concentration in the Settled Surface Dust in Domestic Houses and Factors Affecting Them. Indoor Built Environ. 2010, 19, 391–399. [Google Scholar] [CrossRef]
- Adhikari, A.; Kettleson, E.M.; Vesper, S.; Kumar, S.; Popham, D.L.; Schaffer, C.; Indugula, R.; Chatterjee, K.; Allam, K.K.; Grinshpun, S.A.; et al. Dustborne and airborne Gram-positive and Gram-negative bacteria in high versus low ERMI homes. Sci. Total Environ. 2014, 482–483, 92–99. [Google Scholar] [CrossRef] [PubMed]
- Madsen, A.M.; Matthiesen, C.B.; Frederiksen, M.W.; Frederiksen, M.; Frankel, M.; Spilak, M.; Gunnarsen, L.; Timm, M. Sampling, extraction and measurement of bacteria, endotoxin, fungi and inflammatory potential of settling indoor dust. J. Environ. Monit. 2012, 14, 3230. [Google Scholar] [CrossRef]
- Frankel, M.; Timm, M.; Hansen, E.W.; Madsen, A.M. Comparison of sampling methods for the assessment of indoor microbial exposure. Indoor Air 2012, 22, 405–414. [Google Scholar] [CrossRef]
- Caetano, L.A.; Faria, T.; Springer, J.; Loeffler, J.; Viegas, C. Antifungal-resistant Mucorales in different indoor environments. Mycology 2019, 10, 75–83. [Google Scholar] [CrossRef] [PubMed]
- Varga, J.; Baranyi, N.; Chandrasekaran, M.; Vágvölgyi, C.; Kocsubé, S. Mycotoxin producers in the Aspergillus genus: An update. Acta Biol. Szeged. 2015, 59, 151–167. [Google Scholar]
- Houbraken, J.; Verweij, P.E.; Rijs, A.J.M.M.; Borman, A.M.; Samson, R.A. Identification of Paecilomyces variotii in Clinical Samples and Settings. J. Clin. Microbiol. 2010, 48, 2754–2761. [Google Scholar] [CrossRef] [PubMed]
- Dillon, H.K.; Heinsohn, P.A.; Miller, J.D. Field Guide for the Determination of Biological Contaminants in Environmental Samples. Available online: https://online-ams.aiha.org/amsssa/ecssashop.show_product_detail?p_mode=detail&p_product_serno=859 (accessed on 12 March 2021).
- European Centre for Disease Prevention and Control (ECDC). Risk Assessment on the Impact of Environmental Usage of Triazoles on the Development and Spread of Resistance to Medical Triazoles in Aspergillus Species. Available online: https://www.ecdc.europa.eu/sites/portal/files/media/en/publications/Publications/risk-assessment-impact-environmental-usage-of-triazoles-on-Aspergillus-spp-resistance-to-medical-triazoles.pdf (accessed on 21 February 2021).
- Sabino, R.; Carolino, E.; Veríssimo, C.; Martinez, M.; Clemons, K.V.; Stevens, D.A. Antifungal susceptibility of 175 Aspergillus isolates from various clinical and environmental sources. Med. Mycol. 2016, 54, 740–756. [Google Scholar] [CrossRef]
- Jakšić, D.; Sertić, M.; Kocsubé, S.; Kovačević, I.; Kifer, D.; Mornar, A.; Nigović, B.; Šegvić Klarić, M. Post-Flood Impacts on Occurrence and Distribution of Mycotoxin-Producing Aspergilli from the Sections Circumdati, Flavi, and Nigri in Indoor Environment. J. Fungi 2020, 6, 282. [Google Scholar] [CrossRef] [PubMed]
- Yang, S.; Rothman, R.E. PCR-based diagnostics for infectious diseases: Uses, limitations, and future applications in acute-care settings. Lancet Infect. Dis. 2004, 4, 337–348. [Google Scholar] [CrossRef]
- McDevitt, J.J.; Lees, P.S.J.; Merz, W.G.; Schwab, K.J. Inhibition of quantitative PCR analysis of fungal conidia associated with indoor air particulate matter. Aerobiologia 2007, 23, 35–45. [Google Scholar] [CrossRef]
- Mbareche, H.; Veillette, M.; Bilodeau, G.J.; Duchaine, C. Fungal aerosols at dairy farms using molecular and culture techniques. Sci. Total Environ. 2019, 653, 253–263. [Google Scholar] [CrossRef]
- Madsen, A.M.; Frederiksen, M.W.; Jacobsen, M.H.; Tendal, K. Towards a risk evaluation of workers’ exposure to handborne and airborne microbial species as exemplified with waste collection workers. Environ. Res. 2020, 183, 109177. [Google Scholar] [CrossRef] [PubMed]
- Niculita-Hirzel, H.; Yang, S.; Hager Jörin, C.; Perret, V.; Licina, D.; Goyette Pernot, J. Fungal Contaminants in Energy Efficient Dwellings: Impact of Ventilation Type and Level of Urbanization. Int. J. Environ. Res. Public Health 2020, 17, 4936. [Google Scholar] [CrossRef]
- Adams, R.I.; Miletto, M.; Taylor, J.W.; Bruns, T.D. The Diversity and Distribution of Fungi on Residential Surfaces. PLoS ONE 2013, 8, e78866. [Google Scholar] [CrossRef]
- Nasir, Z.A.; Colbeck, I. Assessment of Bacterial and Fungal Aerosol in Different Residential Settings. Water Air Soil Pollut. 2010, 211, 367–377. [Google Scholar] [CrossRef]
- Nastasi, N.; Haines, S.R.; Xu, L.; da Silva, H.; Divjan, A.; Barnes, M.A.; Rappleye, C.A.; Perzanowski, M.S.; Green, B.J.; Dannemiller, K.C. Morphology and quantification of fungal growth in residential dust and carpets. Build. Environ. 2020, 174, 106774. [Google Scholar] [CrossRef]
- Andersen, B.; Frisvad, J.C.; Søndergaard, I.; Rasmussen, I.S.; Larsen, L.S. Associations between fungal species and water-damaged building materials. Appl. Environ. Microbiol. 2011, 77, 4180–4188. [Google Scholar] [CrossRef] [PubMed]
- Flannigan, B.; Samson, R.A.; Miller, J.D. Microorganisms in Home and Indoor Work Environments: Diversity, Health Impacts, Investigation and Control; CRC Press: Boca Raton, FL, USA, 2016. [Google Scholar]
- Zock, J.-P.; Jarvis, D.; Luczynska, C.; Sunyer, J.; Burney, P. Housing characteristics, reported mold exposure, and asthma in the European Community Respiratory Health Survey. J. Allergy Clin. Immunol. 2002, 110, 285–292. [Google Scholar] [CrossRef] [PubMed]
- Gent, J.F.; Ren, P.; Belanger, K.; Triche, E.; Bracken, M.B.; Holford, T.R.; Leaderer, B.P. Levels of household mold associated with respiratory symptoms in the first year of life in a cohort at risk for asthma. Environ. Health Perspect. 2002, 110. [Google Scholar] [CrossRef] [PubMed]
- Black, W.D. A comparison of several media types and basic techniques used to assess outdoor airborne fungi in Melbourne, Australia. PLoS ONE 2020, 15, e0238901. [Google Scholar] [CrossRef]
- Howden-Chapman, P.; Crane, J.; Matheson, A.; Viggers, H.; Cunningham, M.; Blakely, T.; O’Dea, D.; Cunningham, C.; Woodward, A.; Saville-Smith, K.; et al. Retrofitting houses with insulation to reduce health inequalities: Aims and methods of a clustered, randomised community-based trial. Soc. Sci. Med. 2005, 61, 2600–2610. [Google Scholar] [CrossRef] [PubMed]
- Jang, K.-S.; Yun, Y.-H.; Yoo, H.-D.; Kim, S.H. Molds Isolated from Pet Dogs. Mycobiology 2007, 35, 100. [Google Scholar] [CrossRef]
- Viegas, C.; Malta-Vacas, J.; Sabino, R.; Viegas, S.; Veríssimo, C. Accessing indoor fungal contamination using conventional and molecular methods in Portuguese poultries. Environ. Monit. Assess. 2014, 186, 1951–1959. [Google Scholar] [CrossRef]
- Pasanen, A.-L.; Kalliokoski, P.; Pasanen, P.; Jantunen, M.J.; Nevalainen, A. Laboratory studies on the relationship between fungal growth and atmospheric temperature and humidity. Environ. Int. 1991, 17, 225–228. [Google Scholar] [CrossRef]
- Thatcher, T.L.; Lai, A.C.K.; Moreno-Jackson, R.; Sextro, R.G.; Nazaroff, W.W. Effects of room furnishings and air speed on particle deposition rates indoors. Atmos. Environ. 2002, 36, 1811–1819. [Google Scholar] [CrossRef]
- An, K.-D.; Kiyuna, T.; Kigawa, R.; Sano, C.; Miura, S.; Sugiyama, J. The identity of Penicillium sp. 1, a major contaminant of the stone chambers in the Takamatsuzuka and Kitora Tumuli in Japan, is Penicillium paneum. Antonie Van Leeuwenhoek 2009, 96, 579–592. [Google Scholar] [CrossRef] [PubMed]
- la Rosa-Garcia, D.; del Carmen, S.; Ortega-Morales, O.; Gaylarde, C.C.; Beltrán-Garcia, M.; Quintana-Owen, P.; Reyes-Estebanez, M. Influence of fungi in the weathering of limestone of Mayan monuments. Rev. Mex. Micol. 2011, 33, 43–51. [Google Scholar]
- Franchitti, E.; Pascale, E.; Fea, E.; Anedda, E.; Traversi, D. Methods for Bioaerosol Characterization: Limits and Perspectives for Human Health Risk Assessment in Organic Waste Treatment. Atmosphere 2020, 11, 452. [Google Scholar] [CrossRef]
- Li, J.M.; Wan, M.P.; Schiavon, S.; Tham, K.W.; Zuraimi, S.; Xiong, J.; Fang, M.; Gall, E. Size-resolved dynamics of indoor and outdoor fluorescent biological aerosol particles in a bedroom: A one-month case study in Singapore. Indoor Air 2020, 30, 942–954. [Google Scholar] [CrossRef]
Publisher’s Note: MDPI stays neutral with regard to jurisdictional claims in published maps and institutional affiliations. |
© 2021 by the authors. Licensee MDPI, Basel, Switzerland. This article is an open access article distributed under the terms and conditions of the Creative Commons Attribution (CC BY) license (http://creativecommons.org/licenses/by/4.0/).