Article

Characteristics and Synoptic Patterns of Regional Extreme Rainfall over the Central and Eastern Tibetan Plateau in Boreal Summer

1
Institute of Plateau Meteorology, CMA, Chengdu 610072, China
2
Sichuan Branch of Meteorological Training Institute, CMA, Chengdu 610072, China
3
China Meteorological Administration Training Centre, Beijing 100081, China
4
Institute of Plateau Meteorology, China Meteorological Administration/Heavy Rain and Drought-Flood Disasters in Plateau and Basin Key Laboratory of Sichuan Province, Chengdu 610072, China
5
Sichuan Provincial Climate Centre, Chengdu 610072, China
6
Chongqing Meteorological Observatory, Chongqing 401147, China
*
Author to whom correspondence should be addressed.
Atmosphere 2021, 12(3), 379; https://doi.org/10.3390/atmos12030379
Submission received: 2 February 2021 / Revised: 6 March 2021 / Accepted: 8 March 2021 / Published: 13 March 2021
(This article belongs to the Section Atmospheric Techniques, Instruments, and Modeling)

Abstract

:
In this research, the observation datasets from 106 gauge stations over the central and eastern areas of the Tibetan Plateau (TP) and the ERA (ECMWF Re-Analysis)-Interim reanalysis datasets in the summers of 1981–2016 are used to study the characteristics and synoptic patterns of extreme precipitation events over the TP. By using a modern statistical method, the abnormal circulation characteristics at high, middle, and low latitudes in the Northern Hemisphere during extreme precipitation events over the central-eastern Tibetan Plateau are discussed, and the physical mechanisms related to the extreme precipitation events are investigated. The results show that the largest amount of extreme precipitation is found in the southern and eastern areas of the TP, where the frequency of daily extreme rainfall events (exceeding 25 mm) and the frequency of all extreme precipitation events both show obvious quasi-biweekly oscillation. When the daily extreme precipitation event threshold over the TP is met and more than 5 stations show daily extreme precipitation at the same time, with at least three of them being adjacent to each other, this is determined as a regional extreme precipitation event. As such, 33 regional daily extreme precipitation events occur during the summer periods of 1981–2016. According to the influence system, the 33 regional extreme precipitation events can be divided into three types, namely the plateau trough type, the plateau shear line type, and the plateau vortex type. For the plateau trough type, the South Asian high is anomalously strong at 100 hPa. For the other two types, the South Asian high is slightly weaker than usual. For the plateau shear line type, the development of the dynamic disturbance is the strongest, reaching 200 hPa. In the plateau trough type and plateau vortex type, the water vapor is transported by the westerly belt and the southwesterly flow from the Bay of Bengal.

1. Introduction

Under global warming, extreme rainfall events are generally increasing [1], and the impacts of extreme precipitation are becoming more serious [2], especially in the Tibetan Plateau (TP), which is known as “the roof of the world” and “the third pole”. Extreme rainfall events over the TP could lead to secondary disasters such as mudslides and landslides, and have a significant impact on the local social economy. Additionally, they also have significant impacts on the weather and climate in the surroundings and downstream areas [3]. Extreme rainfall events over the TP have attracted much attention in recent years [4,5,6,7].
Because there are many mountains and rivers on the TP and the topography is complex, the precipitation is asymmetrically distributed over the plateau [8,9,10,11,12,13,14]. Additionally, the observation sites in the northern and western TP are sparse. Therefore, previous studies mainly focus on the Lhasa area, Hengduan Mountains, and the central-eastern TP. Significant progress has been made in the study of extreme precipitation in the above areas of the TP. Cao and Pan [4] used meteorological observation datasets to study the distribution characteristics of extreme precipitation over the TP and pointed out that the extreme precipitation over the TP decreases from the southeast to northwest in summer, while the centerpoint of these high values is located in the east of Sichuan Province, followed by the southeast of the TP.
The threshold for extreme rainfall events over Tibet is between 15.7 and 36.0 mm. The areas of high extreme precipitation threshold values are located in Nyalam at the edge of the south Tibet, Rigaze along the middle of the river and Bomi, and Chayu in the southeast of the Tibet [15]. In recent years, the extreme precipitation over the plateau has shown an increasing trend. You et al. [6] pointed out that the extreme precipitation threshold in more than 65% of the stations in the north, southeast, and southwest of the TP increased during the 1960s–2000s. The extreme precipitation values and intensities are increasing in the south of Shannan and the southeast of Linzhi [16]. The variation characteristics for extreme precipitation in the whole basin show that from 1971 to 2010, the extreme precipitation in the Nujiang River Basin in Tibet increased. The most significant increase was in Chayu, with the rate of increase being 29.4 mm·(10a)−1. The intensity of annual extreme precipitation increased most prominently in Naqu and Chayu [17]. Li et al. [18] predicted that the heavy rainfall in the Three-River Headwaters area of the TP would increase from 2001 to 2050. Although the extreme precipitation over the plateau generally shows an increasing trend, in some places it still shows a decreasing trend. Severe precipitation and extremely severe precipitation in the Mount Everest region have decreased considerably, with decrease rates of −5.74 mm·(10a)−1 and −1.2 mm·(10a)−1, respectively, especially in Nyalam station on the south slope of the Himalayas [19]. The change of extreme precipitation in the Hengduan Mountains is not obvious, and the extreme precipitation there decreases from the south to north.
From the distribution and variation characteristics of extreme precipitation over the TP, we can see that the regional characteristics of extreme precipitation are very obvious and that the total amount, frequency, intensity, and variation trends of extreme precipitation are different in the different regions [20,21,22]. Therefore, improving the scientific understanding of regional extreme precipitation events, especially their formation mechanisms, is of high importance to atmospheric scientists.
Much progress has been made in studying the formation mechanisms of extreme precipitation [23]. Macye et al. [24] analyzed the causes and statistical characteristics of extreme precipitation in the eastern United States and studied the distribution characteristics of regional extreme precipitation under five typical weather patterns. They pointed out that hurricanes and humid tropical air flow are the most common systems causing extreme precipitation of more than 150 mm. Sun et al. [25] pointed out that the circulation background and dynamic–thermal characteristics of the two kinds of regional extreme precipitation events in South China in summer—which are affected by tropical cyclones and non-tropical cyclones, respectively—are obviously different. Li et al. [18] predicted that the water vapor in extreme precipitation in the Three-River Headwaters mainly comes from the Indian Ocean, which is transported by the southwest monsoons in summer and is related to the small-scale atmospheric circulation.
However, most studies have focused on the distribution and variation characteristics of extreme precipitation over the TP. There are few studies on regional extreme precipitation events and less discussions on their causes over the TP. To this end, this study focuses on the classification of weather systems that produce regional extreme precipitation events and discusses the causes of different regional extreme precipitation events from the perspective of influence systems. In order to deepen the understanding of extreme precipitation events over the TP and provide a scientific basis for enhancing the prediction ability, firstly the spatiotemporal distribution characteristics of extreme precipitation are analyzed, then the regional extreme precipitation events over the TP are counted. Next, the characteristics of the weather system affecting the regional extreme precipitation events are discussed. Finally, the physical mechanisms of extreme precipitation events in different regions are revealed.

2. Datasets and Methods

2.1. Datasets

The datasets used in this research were the precipitation datasets from surface stations in the Meteorological Daily Values of Basic Meteorological Elements of China National Surface Weather Station (V3.0) set, derived from the China Meteorological Administration (Available online: http://data.cma.cn/ (accessed on 20 June 2019)). Due to the scarcity of stations in the west of the TP, in order to ensure that there were enough stations in the study area with long time sequences and strong running stability, 106 stations were selected from 124 stations over the central and eastern TP. The period of the datasets was from June to August during 1981–2016. There are 20 stations in Qinghai, 38 stations in Tibet, 25 stations in Sichuan, 9 stations in Yunnan, and 17 stations in Gansu, as shown in Figure 1. The quality of the selected datasets was strictly controlled [26] via the correlation coefficient weighted average and first difference methods.
Moreover, all atmospheric data fields came from the European Centre for Medium-Range Weather Forecasts (ECMWF) interim reanalysis (ERA-Interim) dataset, with a horizontal resolution of 0.5° × 0.5° [27] and 14 layers in the vertical direction. The variables of the ERA-Interim data used herein include the horizontal wind direction, wind speed, geopotential height, temperature, and specific humidity.

2.2. Definition of the Thresholds of Extreme Rainfall Events

A precipitation threshold is used to define an extreme rainfall event, and is related to the precipitation amount and frequency of extreme rainfall events. By using the percentile relative index method proposed by Easterling et al. [28], the precipitation datasets (≥0.1 mm) of 106 meteorological stations over the central and eastern TP from June to August 1981–2016 were arranged in ascending order according to the precipitation of each station. We calculated the 99th percentile value of the whole precipitation series at each station, which is defined as the threshold value of extreme precipitation events for that station. The dates where precipitation exceeded the threshold were classes extreme precipitation events for that station.

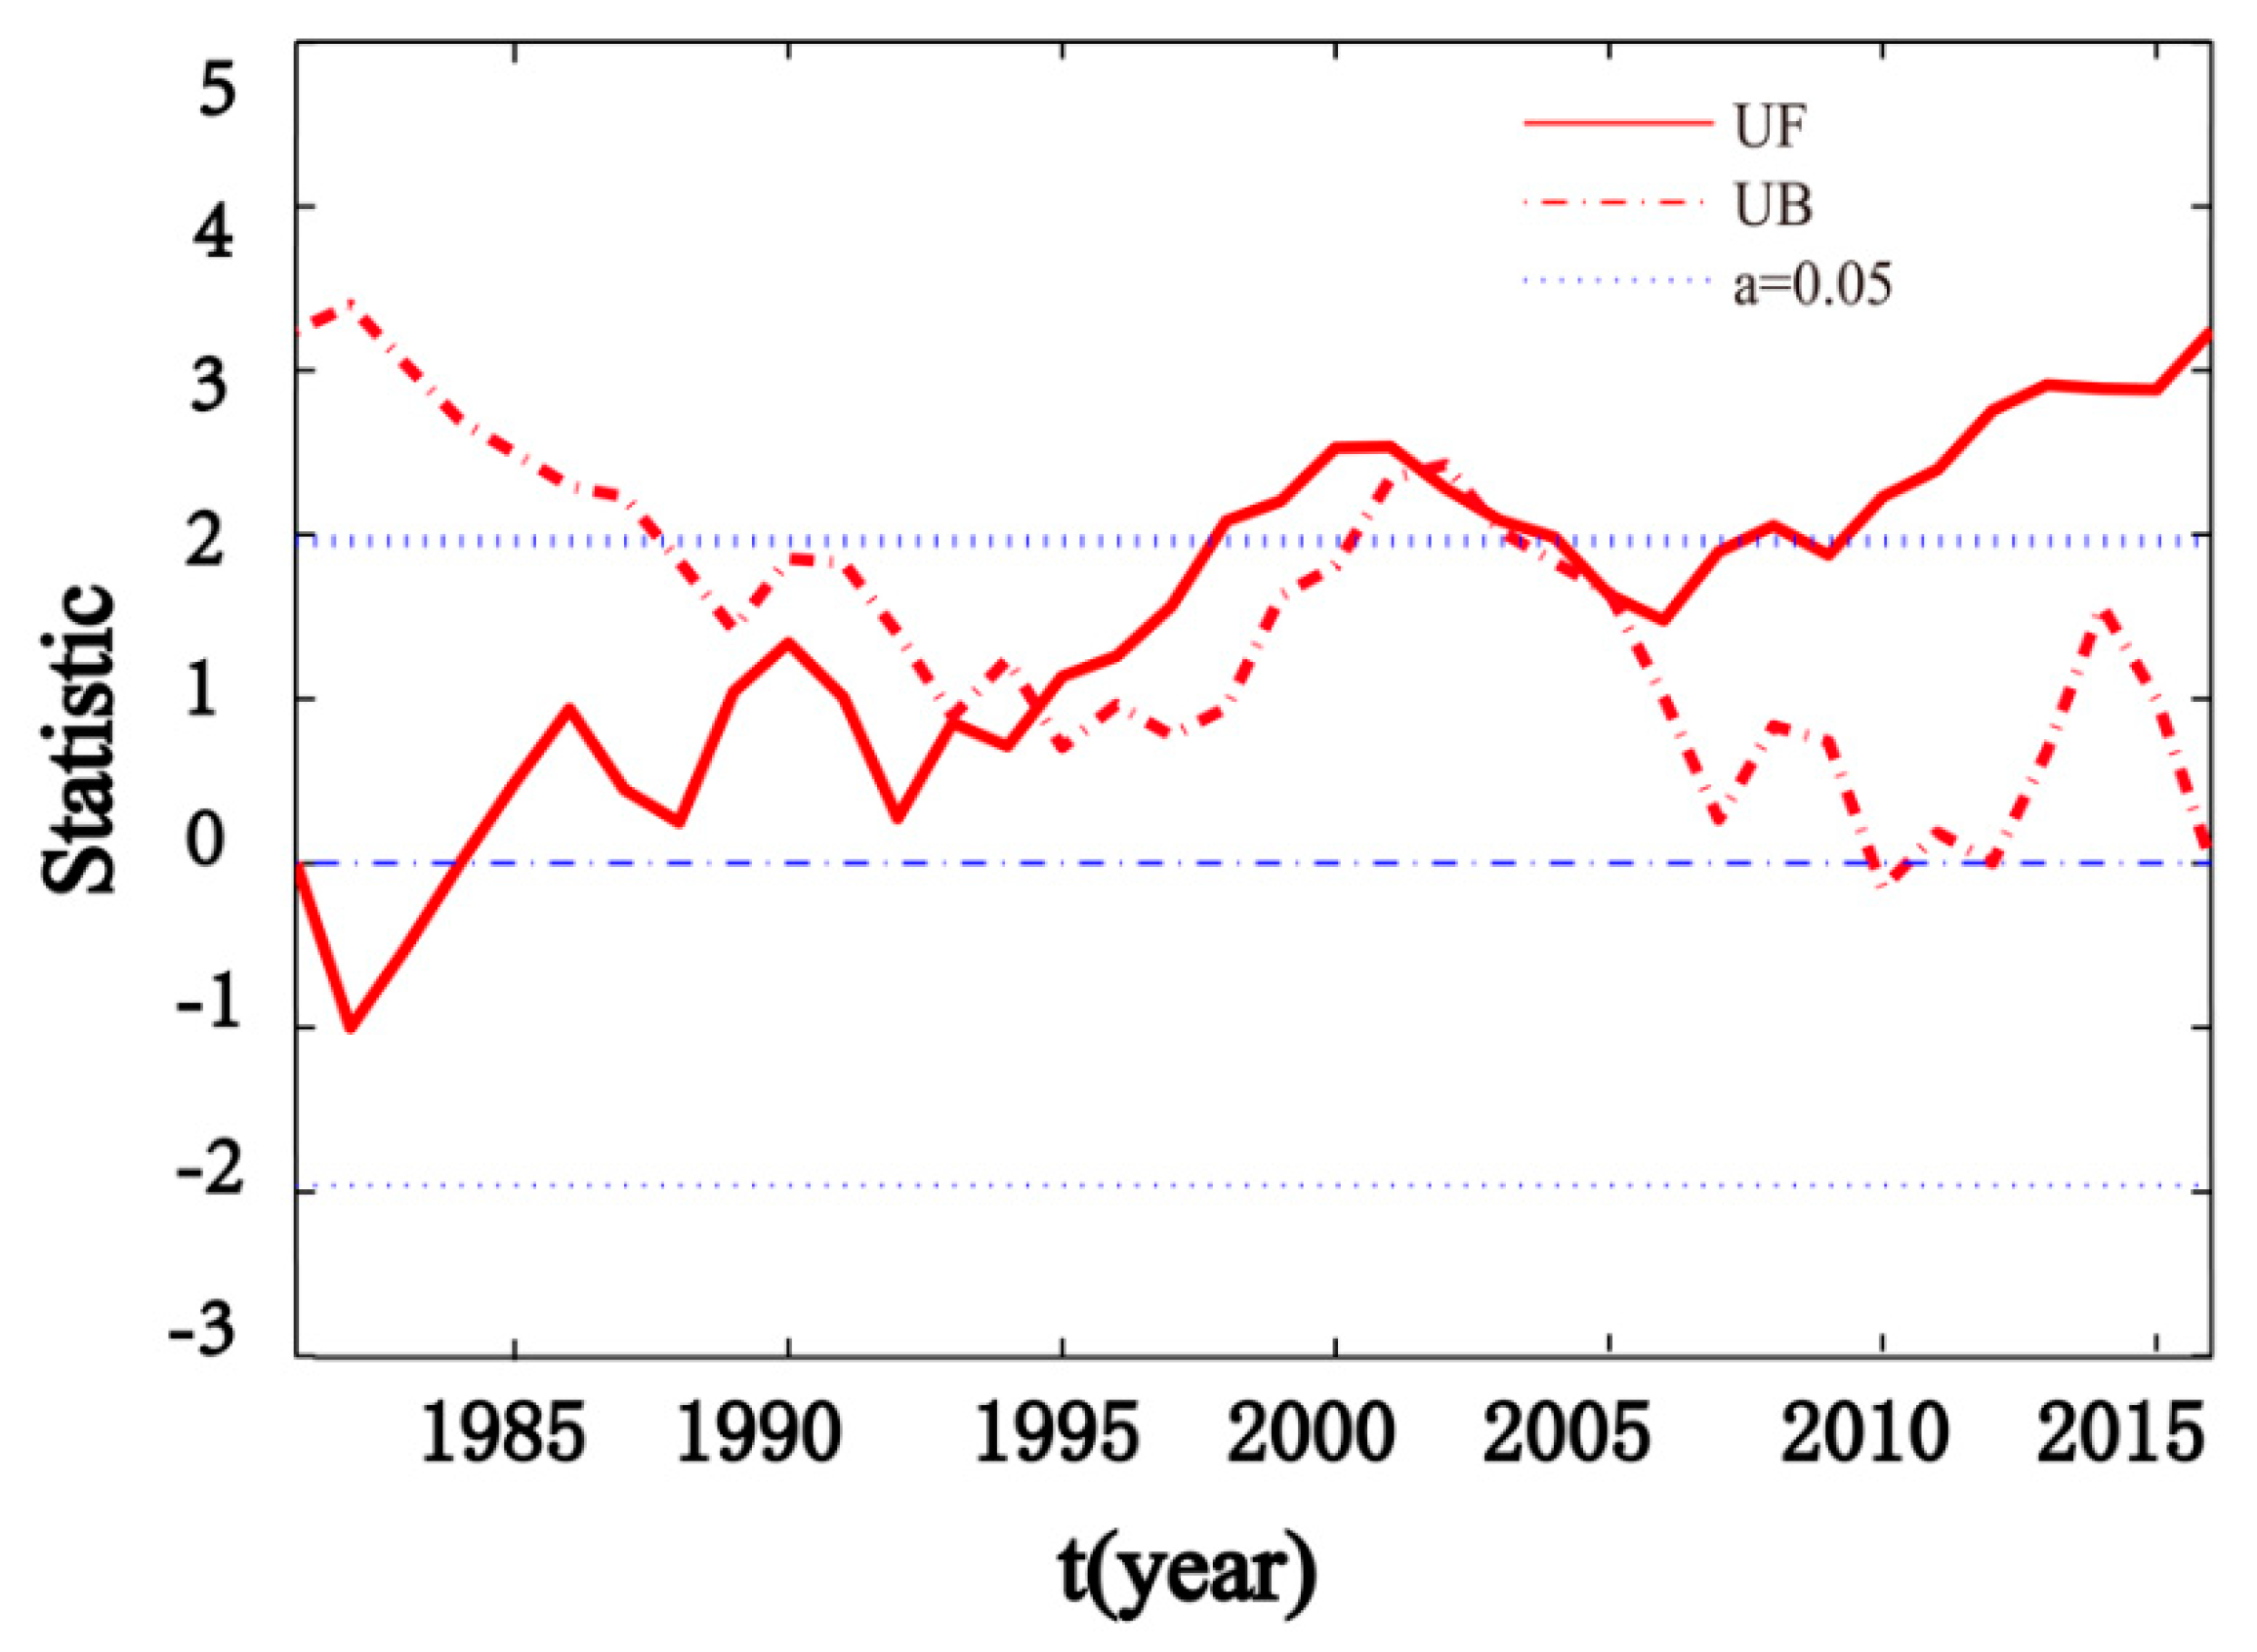
2.3. Mann–Kenda (M-K) Test

The non-parametric M-K test can be used to test the significance of the variation trend. The non-parametric test is also called the non-distribution test, the advantage of which is that the sample does not need to follow a certain distribution and it cannot be affected by outliers, which is convenient for calculation.

3. Results

3.1. Spatiotemporal Distribution Characteristics of Extreme Precipitation over the TP

Herein, as a basic study of the causes of extreme precipitation, firstly the spatiotemporal distribution characteristics of extreme precipitation are analyzed.

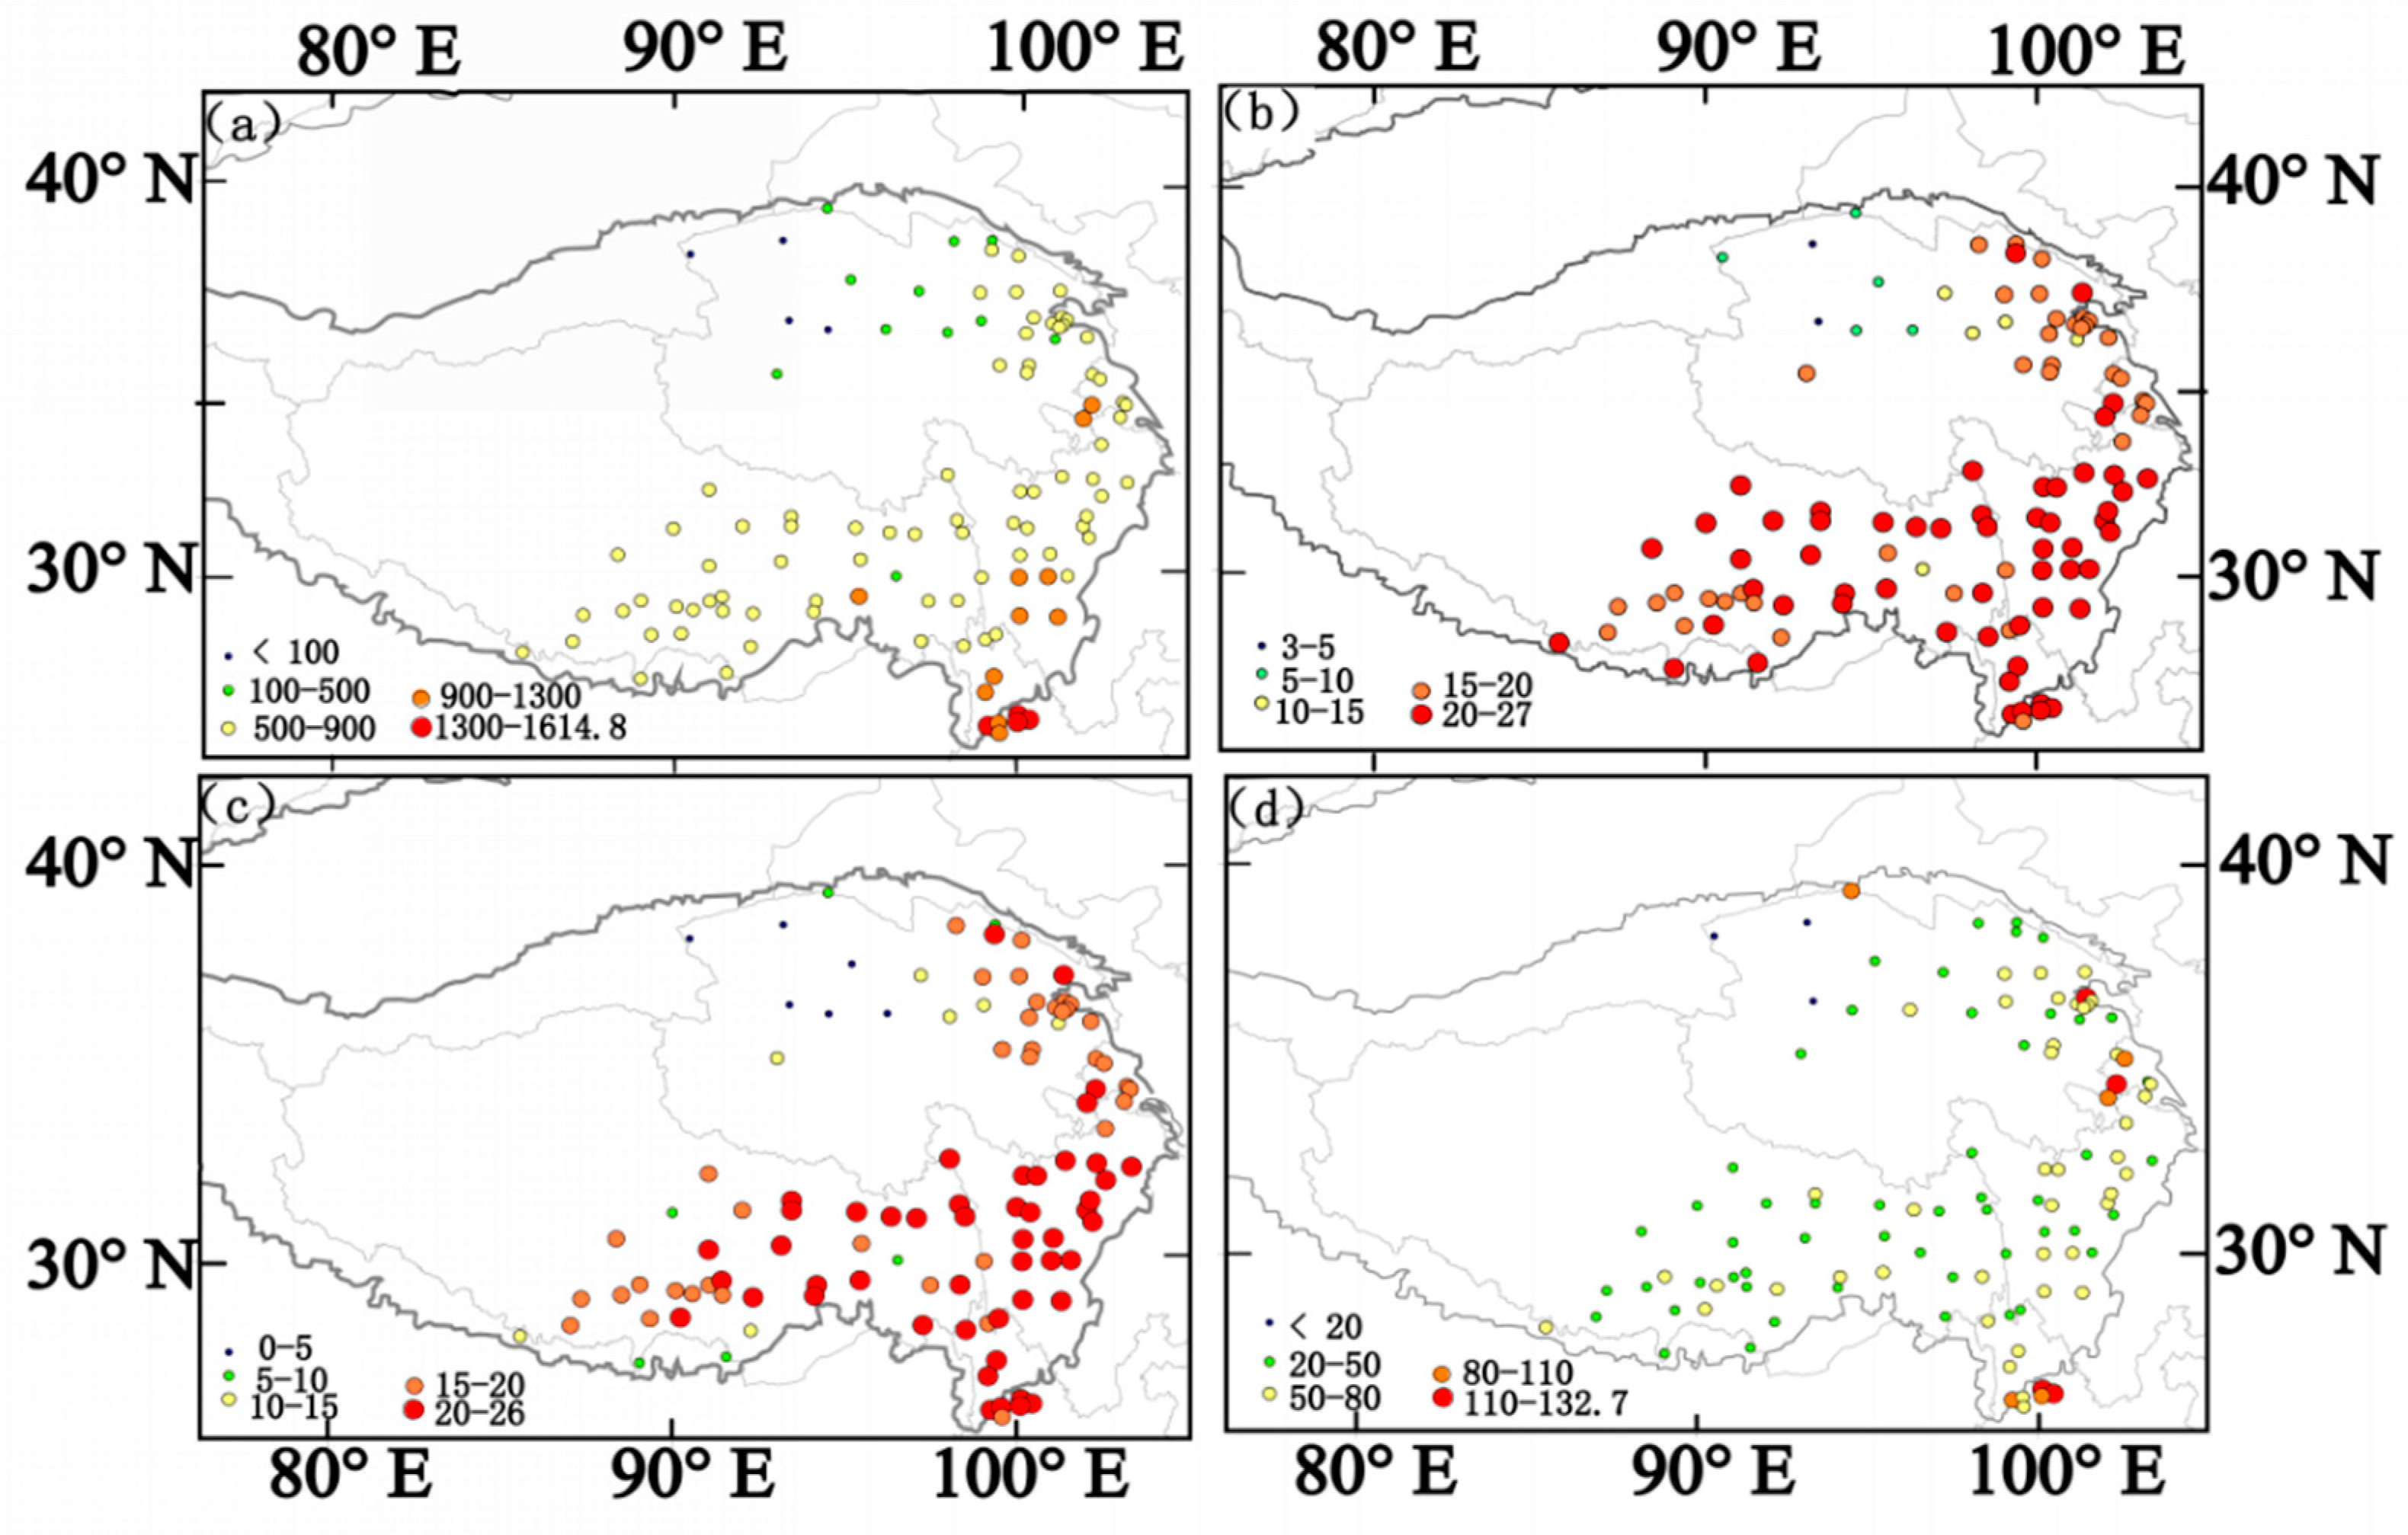
3.1.1. Spatial Distribution Characteristics of Extreme Precipitation

From 1981 to 2016, the distribution of the total extreme precipitation over the TP is uneven (Figure 2a). The extreme rainfall events are more frequent in the south and east, and less so in the north and west, which is consistent with the previous study on the distribution characteristics of summer precipitation over the TP [14]. Most of the total extreme precipitation over the TP is in the range of 500–900 mm, while the values in the northern part of the TP are the smallest, most of which are smaller than 500 mm. The Hengduan Mountains on the southeast side of the TP have the largest total extreme precipitation values at more than 1300 mm.
The frequency distribution of extreme rainfall events (Figure 2b) is similar to the distribution of extreme precipitation amounts, which are high in the south and east and low in the north and the west. The northern part of the TP has the lowest frequency, especially for the northern part of Qinghai, most of which is about 3–5 events. The eastern part of the TP and the east of Lake Qinghai have the highest frequencies at about 20–27 events. The frequency of extreme rainfall events in the south is more than 15 events. The areas of high values are located in the mountainous areas south of the Himalayas and near the Tanggula Mountains, reaching 20–27 events.
Figure 2c presents the frequency distribution of severe extreme rainfall events with extreme precipitation greater than 25 mm. Similar to Figure 2b, the severe extreme rainfall events are also more frequent in the south and east, less so in the north and west, and are the least frequent in the north. In the northern areas, taking Qinghai Lake as the boundary, the frequency is highest in the east and lowest in the west (5 events in the west and 15–20 events in the east, respectively). The eastern part of the TP has the highest frequency at about 20–26. The frequency over the southern part of the TP is unevenly distributed. The highest frequency appears near the Tanggula Mountains, reaching 20–26. The frequency in the southern slope of the Himalayas is significantly lower than that in the northern slope.
Figure 2d shows the distribution of daily maximum extreme precipitation. The minimum value (less than 20 mm) is in the north of the plateau and the maximum value (133 mm) is in the Hengduan Mountains. The daily maximum extreme precipitation in the other areas is concentrated in the range of 20–50 mm. There are two centers of high daily maximum extreme precipitation values over the TP—one is in the southeast of Qinghai and the other in the Hengduan Mountain Range.
From the distribution characteristics of extreme precipitation, we can see that the extreme precipitation over the TP contributes a lot to the total precipitation. Affected by the South Asian monsoon airflow, the rainy days in summer are more frequent in the south than in the north of the TP, and there are many rainy days and heavy rain fall events across the mountain range. Regardless of the frequency of extreme precipitation or of rainfall greater than 25 mm on the east side of Qinghai Lake, this is the area with the highest values in the plateau. The distribution of maximum daily precipitation over the TP is the most uneven, and there is no obvious trend of high precipitation in the south and low precipitation in the north.

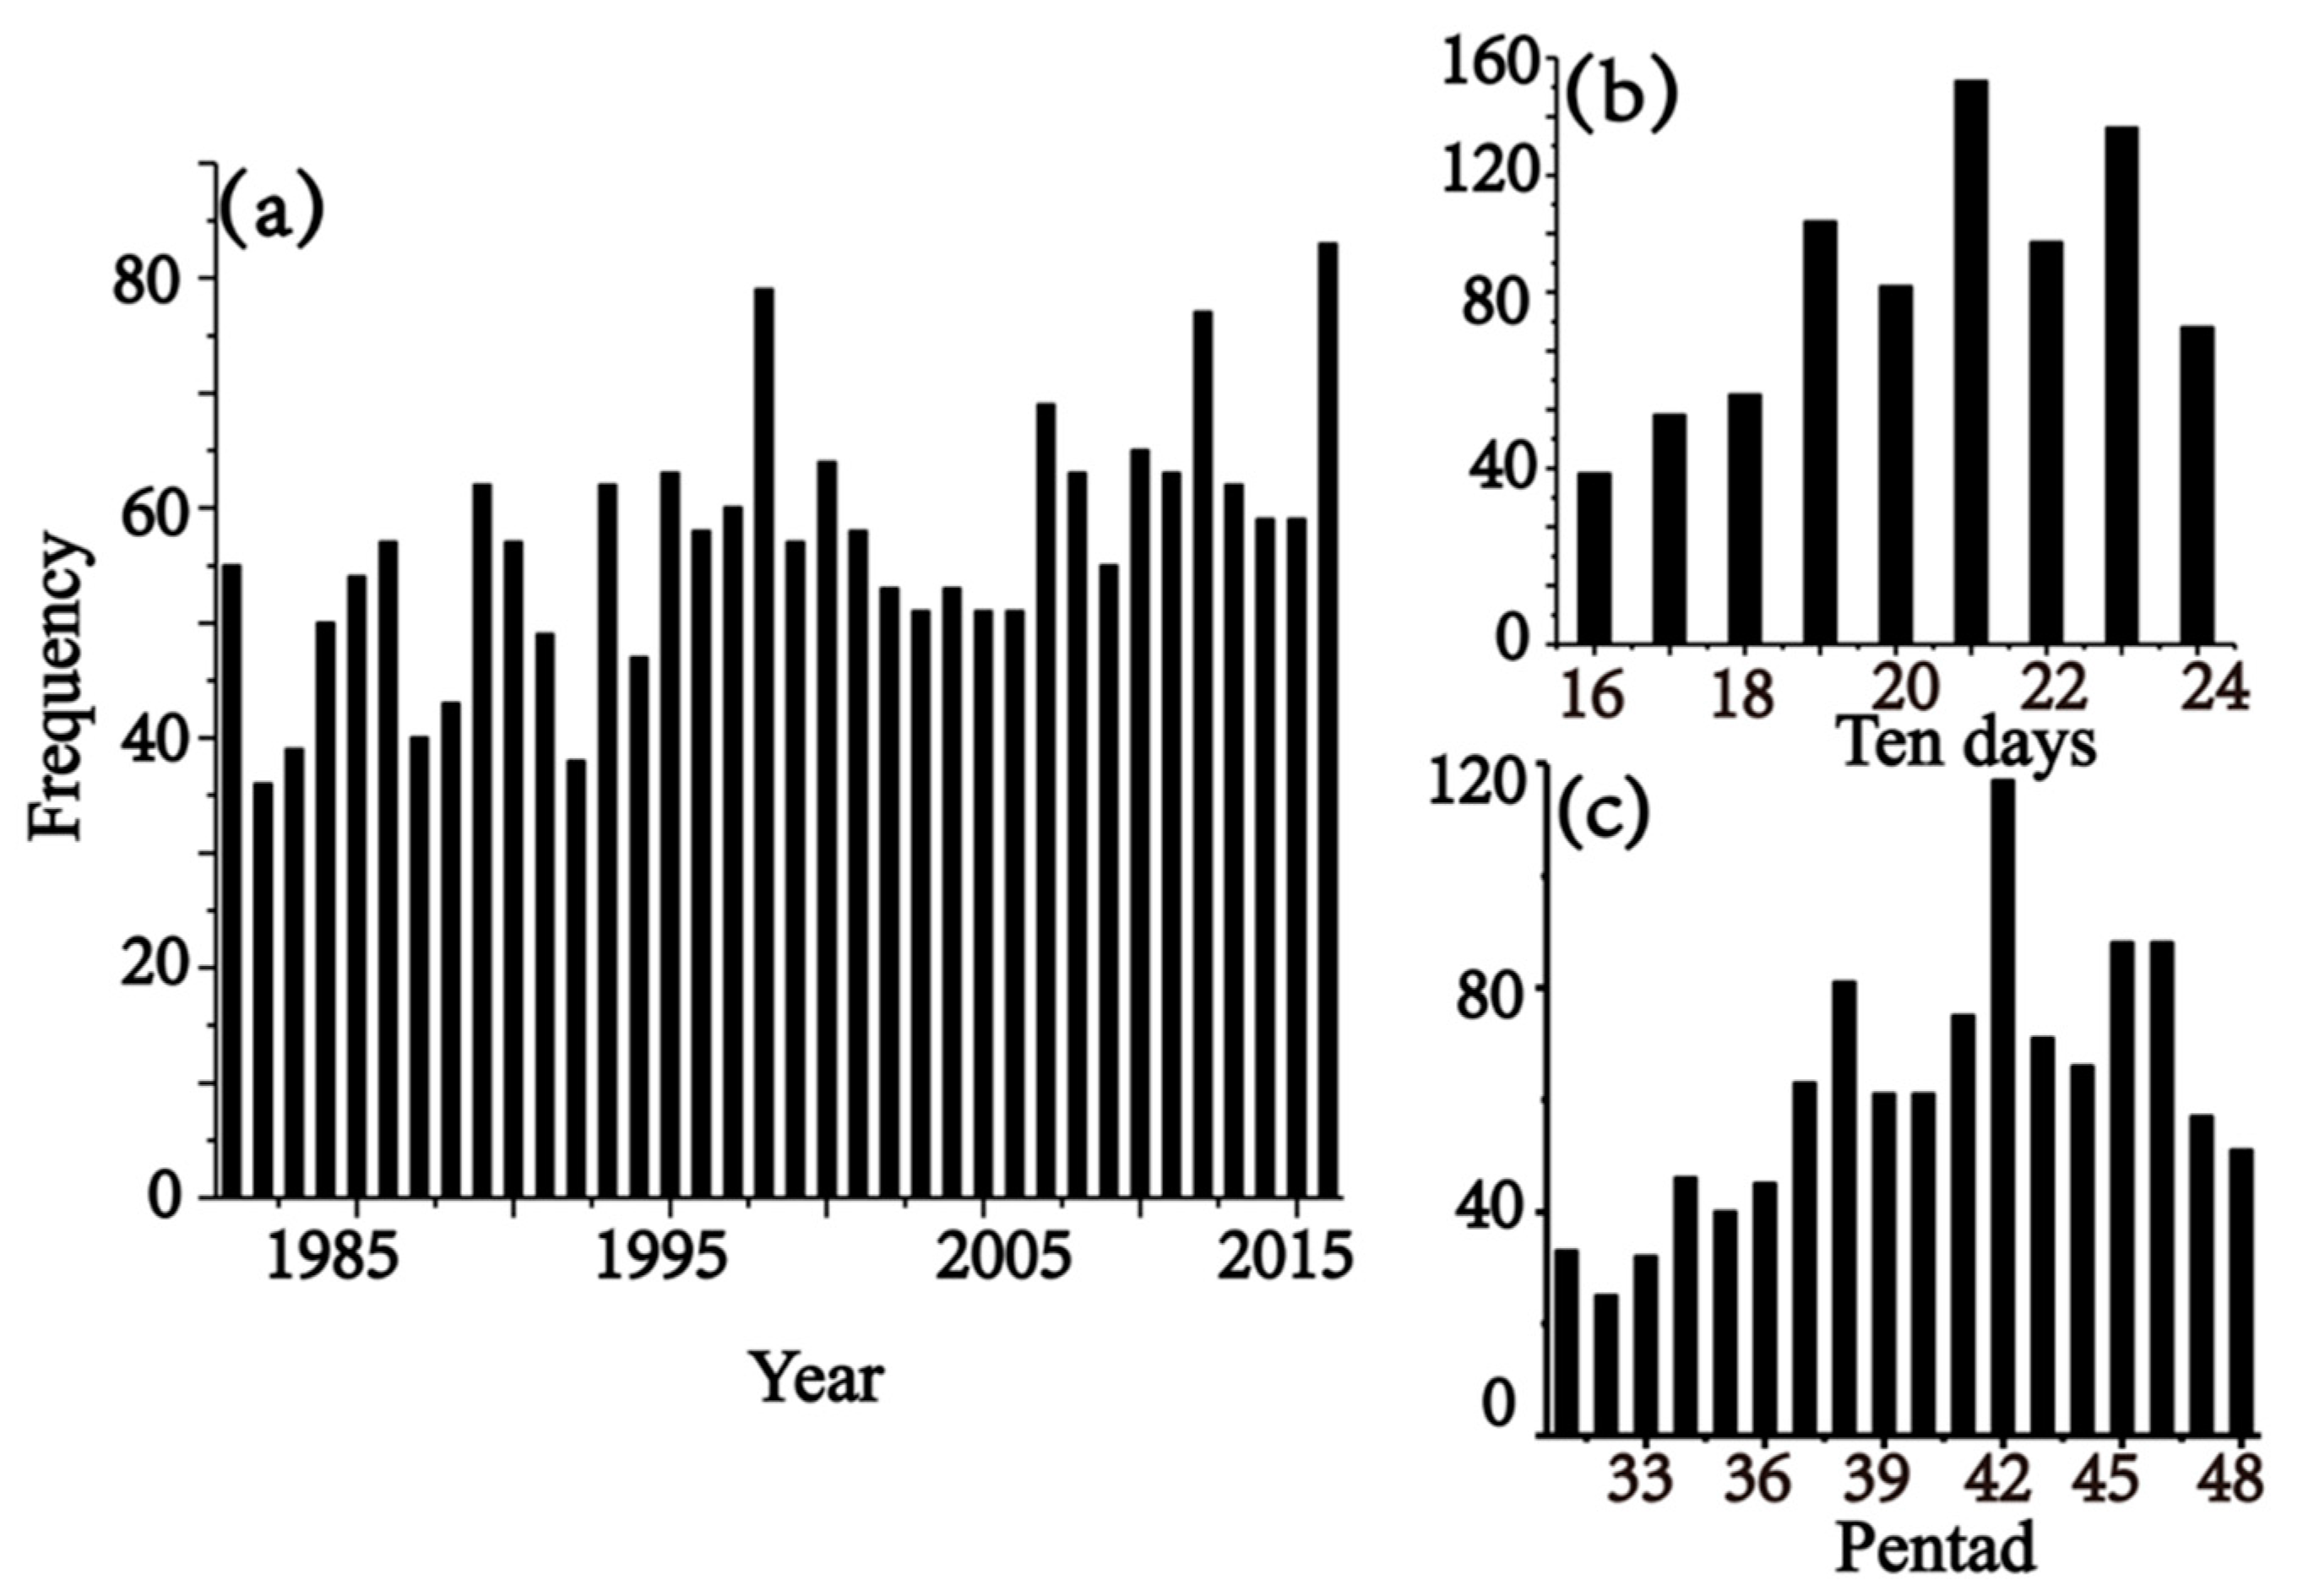
3.1.2. Temporal Distribution Characteristics of Extreme Precipitation

In order to reveal the temporal distribution characteristics of extreme precipitation over the TP, the annual, ten-day, and pentad distributions of the extreme precipitation frequency over the TP are analyzed herein. As seen from the annual distribution of extreme precipitation frequency in Figure 3a, the annual average of the extreme precipitation in the TP is 57, and there is an ascending trend on the whole, which passes the significance test at the level of 0.01. In 2016, the extreme precipitation is the greatest of all 36 years, reaching 89, while the lowest value is 38 in 1992.
The ten-day distribution of extreme precipitation frequency shown in Figure 3b shows that the extreme precipitation frequency increases from the 16th ten-day period, reaching the maximum value of 192 in the 21st ten-day period. The 19th ten-day period, 21st ten-day period, and 23rd ten-day period are the three peak periods, while the frequencies in the 20th ten-day period, 22nd ten-day period, and 24th ten-day period are relatively low, with a return period of 20 days. Figure 3c shows the pentad variation of the extreme precipitation frequency. The extreme precipitation frequency increases from the 31st pentad and the 42nd pentad is of the maximum frequency of 117. During the 31st–48th pentads, the plateau extreme precipitation frequency displays an obvious cycle of 20 days, reaching a large value every 2 pentads, which also includes a short period of 10 days. This is consistent with the quasi-biweekly oscillation of the South Asia High over the TP.
According to the anomaly distribution of the daily extreme precipitation over the TP in summer (figure not shown), the extreme precipitation can be roughly divided into two stages, namely stages of relatively more and less anomalies. Relatively less anomalies occurred before 1994, with only one positive anomaly in 1986. After 1994, a period of relatively more anomalies occurred. Especially after 2006, the frequency and values of positive anomalies increased significantly. The years with less extreme precipitation anomalies are 1982, 1987, and 1992, and those with more are 2012 and 2016.
Climate mutation is an important phenomenon in climate change. The results of the M-K mutation test show that (Figure 4) the annual extreme precipitation over the TP showed an obvious mutation in 1995. Although the extreme precipitation began to increase after 1985, it did pass the significance test of 0.05 until 1997.
In 1995, the frequency of the annual extreme precipitation over the TP also changed abruptly. The increasing trends for both the annual extreme precipitation frequency and the periods passing the significance test are in accordance with the change trend for the annual extreme precipitation.
The Morlet wavelet transform for the extreme precipitation frequency (Figure 5a) is combined with the transformed modular squared time frequency distribution to carry out the periodic analysis [29]. The real part of the wavelet transform coefficients shows a false oscillation trend in the periodic analysis. The modular squared time frequency distribution of the wavelet coefficients (Figure 5b) further verifies the stability of the periodic variation [30]. The module size represents the strength of the characteristic time scale signal, while the signal strength distribution is different at different time scales. It can be seen from Figure 5a that the frequency of extreme precipitation shows obvious peaks at 12a and 16–18a, and the signals for these two periods are relatively strong. This shows that the oscillation periods of about 12 years and 16–18 years have high reliability. The oscillation period of 3 years before 1995 is also obvious, which is consistent with the abrupt change of extreme precipitation, however the signal for the short period is weak and there is no obvious signal in the time frequency distribution of the modular square root.

3.2. Mechanism of Extreme Precipitation in Different Regions over the TP

3.2.1. Influence of Regional Extreme Precipitation Events

The Qinghai Lake in the north, the Himalayas and Tanggula Mountain in the south, and the Hengduan Mountains in the east all have important effects on the distribution of extreme precipitation over the TP (Section 2.1). Meanwhile, a trough often occurs in the north of the TP when the Xinjiang trough moves southeastward. The south branch of the circumfluence of the westerlies forms low vortices on the northern slope of the Himalayas, while multiple shear lines exist in the steep areas on the eastern side of the plateau [31,32,33]. In this study, we explore the different mechanisms that produce regional extreme precipitation events over the TP. A regional extreme precipitation event is defined as extreme precipitation simultaneously occurring at more than five stations over the TP, at least three of which are adjacent. From this, 33 regional extreme precipitation events were obtained for the period 1981–2016. According to the frequency distribution of regional extreme precipitation events at each station (Figure 6), the total frequency of extreme precipitation events in most stations is less than 3. The stations without regional extreme precipitation events are mainly distributed in the south of the Yarlung Zangbo River, near Naqu and northwest Qinghai, while the areas with the most regional extreme precipitation events are in the east of Qinghai. Statistics for the 500 hPa influence systems of regional extreme precipitation events (Table 1) show that the extreme precipitation events are mainly caused by the plateau trough, the plateau shear line, and the plateau vortex. The westerly trough across the TP is called the plateau trough. The plateau shear line generated in the plateau area refers to the discontinuous line of horizontal wind direction or wind speed of 500 hPa. It is a long and narrow air flow belt with cyclonic rotation due to the rapid change of wind direction or wind speed, and its length is more than 5 degrees of longitude and latitude. The plateau vortex is a kind of α-mesoscale, low-pressure vortex, which is generated in the main boundary layer of the TP, with a horizontal scale of 400–500 km, and which is mainly active at 500 hPa.
The plateau trough type of extreme precipitation event accounts for 48.5% of the total number, the plateau vortex type accounts for 18.2%, and the plateau shear line type accounts for 33.3%.
The main influence systems are counted in this paper and the conclusions drawn are in accordance with the previous study [34,35]. The regional extreme precipitation events caused by different systems influence the variability of the rainfall extent and amount. The extreme precipitation events caused by the plateau trough mainly occur in the northern part of the TP. The extreme precipitation events caused by the plateau shear line mainly occur in the eastern part of the TP. The extreme precipitation events caused by the plateau vortex mainly occur in the central-southern part of the TP. The extreme precipitation caused by the plateau shear line is generally the largest, followed by the plateau vortex and the plateau trough. In the following analysis, the regional extreme precipitation events are divided into three types according to the influence system at 500 hPa, namely the plateau trough-type (short for PT-type) extreme precipitation events, which are the extreme precipitation events mainly caused by the plateau trough; the plateau-vortex-type (short for PV-type) extreme precipitation events, which are the extreme precipitation events mainly caused by the plateau vortex; and the plateau shear line-type (short for PSL-type) extreme precipitation events, which are the extreme precipitation events mainly caused by the plateau shear line. In order to make the research results more universal, different types of regional extreme precipitation events are selected to conduct a composite analysis. Four extreme precipitation events are selected for each type. The influence of the selected cases basically occurs in the same position, and the specific selected cases and times are shown in Table 2 (the times are shown in UTC).
The extreme precipitation events are affected by many factors, such as global warming and changes in water resources. However, precipitation is more closely related to water vapor transport and dynamic and thermal conditions. The physical mechanisms of the three types extreme precipitation events will be discussed herein by analyzing the characteristics of atmospheric circulation and dynamics and thermal and water vapor conditions in the next sections.

3.2.2. Characteristics of Atmospheric Circulation

The composite situation fields at 500 hPa for the three types of the regional extreme precipitation events are shown in Figure 7. At 500 hPa, the PT-type extreme precipitation event (Figure 7a) is characterized by a northern vortex and a southern trough (the vortex is located near Lake Baikal and the trough is located in the south of Lake Baikal). The region from Qinghai to central Tibet is dominated by a low trough, with the extreme precipitation occurring in front of the trough. The contour lines of the 500 hPa geopotential height north of 40° N are distributed latitudinally, which is not conducive to the southward transportation of cold air. The PSL-type extreme precipitation event at 500 hPa shows a meridional distribution in the mid-high latitudes of Asia (Figure 7b), along the ridge to the west of Lake Baikal. The northwest airflow in the front of the ridge reaches around 30° N. The influence system from the south to the east of the TP is a shear line, near which the PSL-type extreme precipitation event occurs. The PV-type extreme precipitation event at 500 hPa shows a vortex in central Tibet (Figure 7c), while the PV-type extreme precipitation event occurs on the south side of it. The west of Lake Baikal is controlled by a weak ridge, while the northwest air flow in front of it strengthens the north wind on the north side of the vortex.
The composite anomalies of 100 hPa geopotential height are shown in Figure 7a–c. During the PT-type extreme precipitation event (Figure 8a), the whole East Asian continent at 100 hPa maintains positive anomalies of geopotential height, indicating that the South Asia High is strengthening, while the strengthening of the upper-level high pressure is conducive to the enhancement of pumping. During the PSL-type extreme precipitation event (Figure 8b), the East Asian continent exhibits positive anomalies in the west and negative anomalies in the east, while extreme precipitation occurs in the wide range of negative anomalies. During the PV-type extreme precipitation event (Figure 8c), the South Asia High is weaker than usual and the precipitation appears at the junction of the negative anomalies and positive anomalies.
The composite anomalies of 500 hPa geopotential height are shown in Figure 8d–f. During the PT-type extreme precipitation event (Figure 8d), the whole East Asian continent has two positive anomalies and one negative anomaly, with the negative anomaly in favor of the deepening and maintenance of the low-level trough. During the PSL-type extreme precipitation event (Figure 8e), the situations at 500 hPa and 100 hPa in the East Asia continent are similar, with positive anomalies in the west and negative anomalies in the east. This indicates that the negative anomaly should be maintained from 500 to 100 hPa when the extreme precipitation occurs in the east. The negative anomaly for the whole layer is favorable for the eastern plateau, being in the low-value system. During the PV-type extreme precipitation event (Figure 8f), the region is characterized by positive anomalies in the east and negative anomalies in the west, similar to that at 100 hPa. The extreme precipitation area shows a weakly negative anomaly, which is beneficial to the development of vortices.
The comparison of the three types shows that the PT-type extreme precipitation event needs the enhancement of the upper-level high pressure and that the pumping at the upper level can provide a strong upward motion. The PSL-type and the PV-type extreme precipitation events occur at the junction of positive and negative anomalies, which indicates that during the extreme precipitation period, a weaker South Asia High is needed. In the extreme precipitation area, there is a negative anomaly field at 500 hPa, which is beneficial to the development of the trough, vortices, and shear lines.

3.2.3. Characteristics of Dynamic Field

In order to better reveal the vertical structure of the dynamic conditions in the extreme precipitation area, the anomalies of vorticity and divergence are analyzed. In the PT-type extreme precipitation event (Figure 9a), there are obvious low-level convergence disturbances and upper-level divergence disturbances in the extreme precipitation area (35° N–40° N). The level of convergence disturbance lifts with the increase of latitude, however the disturbance value weakens. The convergence disturbance center at low levels near 35° N–40° N is accompanied by a strong positive vorticity disturbance, with the strongest disturbance appearing at 600–500 hPa. In the PSL-type extreme precipitation event (Figure 9b), there are obvious low-level convergence disturbances and upper-level divergence disturbances in the extreme precipitation area (25° N–30° N). The area of positive (negative) vorticity disturbance overlaps with that of convergence (divergence) disturbance. The cooperation between the vorticity field and divergence field increases the divergence up to almost 200 hPa. The PV-type extreme precipitation area (28° N–32° N) (Figure 9c) exhibits weak low-level convergence disturbance and upper-level divergence disturbance, corresponding to positive vorticity disturbance at low levels. Convergence and divergence disturbances only remain below 400 hPa.
Comparing the three types, we find that the regions of extreme precipitation are accompanied by the low-level convergence, positive vorticity disturbance, and upper-level divergence disturbance. However, the height and intensity of disturbance development in the PV-type extreme precipitation event are the weakest (corresponding to a slight enhancement of convergence and divergence in the original field). The center of high divergence disturbance at 500 hPa in the PT-type extreme precipitation event is obviously stronger than that in the PSL-type and PV-type extreme precipitation events. This shows that the extreme precipitation event caused by the low trough requires stronger dynamic disturbance than that caused by vortices and shear lines.

3.2.4. Characteristics of Thermal Field

Because the thermal field provides a trigger mechanism for precipitation, the thermal anomaly field of extreme precipitation events over the TP is analyzed.
During the period of extreme precipitation in the PV-type extreme precipitation event (Figure 10a), the potential temperature anomaly of the extreme precipitation area gradually increases with the height, with a center of high values near 300 hPa, while the positive anomaly inclines to high latitudes. There is a strong disturbance of ascending speed in the extreme precipitation area, which strengthens the release of condensational heat. This leads to a strong temperature increase over the extreme precipitation area. The PSL-type extreme precipitation event (Figure 10b) is accompanied by a weak temperature increase and a strong vertical ascending velocity disturbance. The area of high ascending velocity disturbance reaches around 200 hPa, which is highly consistent with the development of upper-level divergence disturbance in the PSL-type. There is an obvious cooling area at 30° N–40° N, with the strongest cooling occurring near 300 hPa. This shows that a strong cold air invades in the north side of the shear line, which is in accordance with the results for the 500 hPa composite field in the eastern plateau. For the PV-type extreme precipitation event (Figure 10c), no significant warming in the extreme precipitation area occurs because there is no disturbance of ascending velocity at 600–500 hPa. There is a small velocity disturbance from 500 hPa to 200 hPa and also an obvious cooling zone at 30° N–40° N, with the maximum cooling center at 300 hPa. This is consistent with the analysis results that there is strong cold air invasion in the north of the vortex in the 500 hPa composite field in the PV-type extreme precipitation event.
Comparing the three types, we find that the disturbance of the ascending speed (corresponding to the enhancement of the ascending motion in the original field) and the intensity of cold air play important roles in the adiabatic heating in the extreme precipitation region. The latitudinal air flow in the PT-type extreme precipitation event is not affected by the cold air, so the strong ascending disturbance could cause warming across the whole atmosphere layer. During the PSL-type extreme precipitation event, although there is a strong ascending disturbance, the invasion of cold air weakens the warming effect of the precipitation area. In the PV-type extreme precipitation event, there is no obvious increase of temperature due to the weak ascending disturbance and strong cold air. At the same time, it is also found that the centers of high temperature increase and temperature decrease values both appear at 300–200 hPa, while the centers of high values for three regions basically appear at the same height.

3.2.5. Characteristics of Water Vapor

According to the study by Xie et al. [36], there are two main water vapor channels for summer precipitation over the TP. In the first channel, the Indian summer monsoon transports the water vapor from the Arabian Sea and the Bay of Bengal to the southeast of the TP. In the second channel, the water vapor is transported by the mid-latitude westerlies. For the PT-type extreme precipitation event (Figure 11a), the water vapor from the westerly flow turns into a southwest wind due to the friction of the plateau and converges with the southerly flow of the Bay of Bengal. It is transported to the precipitation area through the middle of the plateau. There is an obvious convergence of water vapor flux in the precipitation area, with maximum specific humidity of up to 7 g kg−1. During the PSL-type extreme precipitation event period (Figure 11b), the water vapor mainly comes from the Bay of Bengal, and there is also an obvious convergence of water vapor flux in the center of the severe precipitation area, with a maximum specific humidity of 5 g kg−1. During the PV-type extreme precipitation event period (Figure 11c), the water vapor is transported to the south of the plateau by both the southerly flow from the Bay of Bengal and the westerlies. A strong convergence center of water vapor flux is found in the region of severe precipitation, accompanied by a large specific humidity center of 8 g kg−1.
Comparing the three types, we find that the water vapor from the Bay of Bengal is very important to the extreme precipitation over the TP. During the three extreme precipitation periods, all are influenced by the water vapor from the Bay of Bengal. The joint action of two water vapor channels is needed because the latitude of the PT-type extreme precipitation event is higher and the water vapor dissipates greatly in the event of northward transportation. Due to the relatively low latitude of the PSL-type extreme precipitation event, the water vapor in the Bay of Bengal dissipates less and can be directly transported to the precipitation area. Besides the water vapor in the Bay of Bengal, the strong convergence of the vortex also involves part of the water vapor from the westerly flow over the TP during the PV-type extreme precipitation event, which is produced by the plateau vortex system.

4. Discussion and Conclusions

4.1. Discussion

In recent years, the extreme precipitation over the plateau has shown an increasing trend. The distribution of precipitation is affected by the special topography of the plateau [6]. In this study, the summer extreme precipitation event in the central-eastern part over the TP shows a significant increasing trend. The centers of high maximum daily precipitation values are distributed along the edge of the plateau. There are two centers of daily maximum precipitation over the TP. One is in the southeast of Qinghai and the other is over the Hengduan Mountains. The largest amounts of extreme precipitation are found in the southern and eastern TP, where there are the highest frequencies of daily extreme rainfall (exceeding 25 mm). Multiple shear lines exist in the steep areas on the eastern side of the plateau [31,32,33]. In this study, the extreme precipitation events caused by the plateau shear line mainly occur in the eastern part of the TP, which is similar to past studies. In addition to the plateau shear line, in this paper we also study the plateau vortex and plateau trough, finding that the extreme precipitation events caused by the plateau trough mainly occur in the northern part of the TP and the extreme precipitation events caused by the plateau vortex mainly occur in the central-southern part of the TP.

4.2. Conclusions

Based on the daily gauge precipitation datasets of 106 national surface weather stations and the ERA-Interim reanalysis datasets in summer from 1981 to 2016 over the TP, according to the statistics for extreme precipitation events in the mid-eastern part of the Tibetan Plateau from 1981 to 2016, there were 33 regional extreme precipitation events in 36 years, which have three main influence systems at 500 hPa, namely the plateau trough, plateau vortex, and plateau shear line. Different systems influence the variability of the rainfall extent and amount, therefore according to the three influence systems, the regional extreme precipitation events can be divided into three categories, namely the plateau-trough-type extreme precipitation event, plateau-vortex-type extreme precipitation event, and plateau shear line-type extreme precipitation event. On this basis, the characteristics of the three types of regional extreme precipitation events were studied and the preliminary conclusions are as follows.
The frequency was high in early July (21st ten-day period, or 42nd pentad). Among them, the frequencies in the 19th, 21st, and 23rd ten-day periods were high, while those in the 20th, 22nd, and 24th ten-day periods were relatively low. Obviously, there was a significant quasi-biweekly oscillation. Before 1993, extreme precipitation over the TP was rare. After 2007, the total amount of extreme precipitation in the plateau increased significantly. The years with negative anomalies of extreme precipitation were 1982, 1987, and 1992, while the years with positive anomalies were 2012 and 2016. The M-K test showed that extreme precipitation amounts over the TP entered a significant mutation period after 1995, while the frequency of extreme precipitation showed obvious oscillation periods of 12a and 16–18a.
During the 33 regional extreme precipitation events over the TP, the plateau trough type accounted for 48.5% of the total number, the plateau vortex type accounted for 18.2%, and plateau shear line accounted for 33.3%.
During the plateau-trough-type extreme precipitation event period, there was a positive anomaly at 100 hPa, indicating that the South Asian High was anomalously strong. However, for the other two types, the South Asian High was slightly weaker than usual. There were negative height anomalies at 500 hPa for the three types, which is favorable for the development of low troughs, shear lines, and vortices. During the period of extreme precipitation events, the development height of the dynamic disturbance for the plateau shear line-type extreme precipitation event was the highest, reaching 200 hPa. The ascending disturbance at low levels and the strength of the cold air played important roles in the temperature increase in the extreme precipitation area.
The water vapor in the Bay of Bengal is very important for the extreme precipitation over the Tibetan Plateau. The water vapor in the plateau trough type and plateau vortex type extreme precipitation events were transported by the westerly belt and the southwesterly flow of the Bay of Bengal. There was larger specific humidity in the plateau vortex type than in the other types, reaching up to 8 g·kg−1.
Based on the ground rain gauge datasets, this research presented the characteristics of extreme precipitation over the TP in summer, along with the regional extreme precipitation events and their influence systems over the TP. The causes of extreme precipitation events were preliminarily analyzed from circulation, heat, power, and water vapor characteristics. The mechanism behind the extreme precipitation events remains to be further explored.

Author Contributions

Data curation, J.S. and G.D.; Formal analysis, J.S.; Software, Y.L.; Writing—review & editing, X.Y. and J.S. All authors have read and agreed to the published version of the manuscript.

Funding

This research was funded by the National Natural Science Foundation of China (91937301, 42030611) and the Second Tibetan Plateau Scientific Expedition and Research (STEP) program (2019QZKK0105).

Institutional Review Board Statement

Not applicable.

Informed Consent Statement

Not applicable.

Data Availability Statement

Data available in a publicly accessible repository that does not issue DOIs. Publicly available datasets were analyzed in this study. This data derived from the China Meteorological Administration (Available online: http://data.cma.cn/).

Acknowledgments

This study is supported by the National Natural Science Foundation of China (91937301, 42030611) and the Second Tibetan Plateau Scientific Expedition and Research (STEP) program (2019QZKK0105).

Conflicts of Interest

The authors declare no conflict of interest.

References

  1. Goswami, B.N.; Venugopal, V.; Sengupta, D.; Madhusoodanan, M.S.; Xavier, P.K. Increasing trend of extreme rain events over India in a warming environment. Science 2006, 314, 1442–1445. [Google Scholar] [CrossRef] [Green Version]
  2. Giannaros, C.; Kotroni, V.; Lagouvardos, K.; Oikonomou, C.; Haralambous, H.; Papagiannaki, K. Hydrometeorological and Socio-Economic Impact Assessment of Stream Flooding in Southeast Mediterranean: The Case of Rafina Catchment (Attica, Greece). Water 2020, 12, 2426. [Google Scholar] [CrossRef]
  3. Jiang, W.X.; Li, G.P.; Yang, S.; Yang, K.; Chen, J.W. Interannual variation of summer atmospheric heat source over the tibetan plateau and the role of convection around the western maritime continent. J. Clim. 2016, 29, 121–138. [Google Scholar] [CrossRef]
  4. Cao, L.; Pan, S. Changes in precipitation extremes over the “Three-River Headwaters”region, hinterland of the Tibetan Plateau, during 1960–2012. Quat. Int. 2014, 321, 105–115. [Google Scholar] [CrossRef]
  5. Ning, B.; Yang, X.; Chang, L. Changes of temperature and precipitation extremes in Hengduan Mountains, Qinghai-Tibet Plateau in 1961–2008. Chin. Geogr. Sci. 2012, 22, 422–436. [Google Scholar] [CrossRef]
  6. You, Q.; Kang, S.; Aguilar, E.; Yan, Y.P. Changes in daily climate extremes in the eastern and central Tibetan Plateau during 1961–2005. J. Geophys. Res. Atmos. 2008, 113, 1639–1647. [Google Scholar] [CrossRef] [Green Version]
  7. Singh, P.; Makamura, K. Diurnal variation in summer precipitation over the central Tibetan Plateau. J. Geophys. Res. Atmos. 2009, 114, D20. [Google Scholar] [CrossRef]
  8. Wu, X.G.; Duan, A.M.; Zhang, X.Q.; Liu, Y.M.; Ma, Y.M.; Yang, K. Extreme weather and climate changes and its environmental effects over the Tibetan Plateau. Chin. J. Nat. 2013, 35, 167–171. (In Chinese) [Google Scholar]
  9. Liu, D.X.; Yin, Z.Y. Spatial and temporal variation of summer precipitation over the eastern Tibetan Plateau and the North Atlantic oscillation. J. Clim. 2001, 14, 2896–2909. [Google Scholar] [CrossRef] [Green Version]
  10. Wu, P.; Kimura, F.; Sasaki, T.; Liu, J.; Yamanaka, M.D. Diurnal variation of GPS-derived precipitable water over the Tibetan Plateau during summer. J. Appl. Meteorol. 2003, 5, 02620. [Google Scholar]
  11. Wu, S.H.; Yin, Y.H.; Zheng, D.; Yang, Q.Y. Climatic trends over the Tibetan Plateau during 1971–2000. J. Geogr. Sci. 2007, 17, 141–151. [Google Scholar] [CrossRef]
  12. Bao, X.; Zhang, F.; Sun, J. Diurnal Variations of Warm-Season Precipitation East of the Tibetan Plateau over China. Mon. Weather Rev. 2011, 39, 2790–2810. [Google Scholar] [CrossRef]
  13. Wu, Y.; Huang, A.; Huang, D.; Chen, F.; Yang, B.; Zhou, Y.; Fang, D.; Zhang, L.J.; Wen, L.J. Diurnal variations of summer precipitation over the regions east to Tibetan Plateau. Clim. Dyn. 2017, 51, 4287–4307. [Google Scholar] [CrossRef]
  14. Ji, Q.; Yang, J.P.; Chen, H.J. Comprehensive analysis of the precipitation changes over the Tibetan Plateau during 1961–2015. J. Glaciol. Geocryol. 2018, 40, 1090–1099. (In Chinese) [Google Scholar]
  15. Yang, Z.G.; Jian, J.; Hong, J.C. Temporal and Spatial Distribution of Extreme recipitation Events in Tibet during 1961–2010. Plateau Meteorol. 2014, 33, 37–42. (In Chinese) [Google Scholar]
  16. Du, J.; Lu, H.Y.; Jian, J. Change in Extreme Precipitation Events over Tibet from 1961 to 2012. J. Nat. Resour. 2014, 29, 990–1001. (In Chinese) [Google Scholar]
  17. Yang, Y.; Du, J.; Luo, S.X.; Shi, L. On Extreme Precipitation Events in the Nujiang River Basin in Tibet in Recent 40 Years. Arid Zone Res. 2013, 30, 315–321. (In Chinese) [Google Scholar]
  18. Li, H.M.; Li, L.; Zhang, J.X.; Shi, X.H.; Shen, H.Y.; Wang, Z.N. Changes in extreme climatic events over the sources of the three rivers in the prometaphase 21 st century. J. Glaciol. Geocryol. 2012, 34, 1403–1408. (In Chinese) [Google Scholar]
  19. Lu, H.Y.; Du, L.; Yuan, J.; Liao, J. Variation characteristics of extreme precipitation events over Mt. Qomolangma region in China from 1971 to 2012. J. Glaciol. Geocryol. 2014, 36, 563–572. [Google Scholar]
  20. Agel, L.; Barlow, M.; Qian, J.-H.; Colby, F.; Douglas, E.; Eichler, T. Climatology of daily precipitation and extreme precipitation events in the northeast United States. J. Hydrometeorol. 2015, 16, 2537–2557. [Google Scholar] [CrossRef]
  21. Frei, A.; Kunkel, K.E.; Matonse, A. The seasonal nature of extreme hydrological events in the northeastern united states. J. Hydrometeorol. 2015, 16, 2065–2085. [Google Scholar]
  22. Huang, H.; Winter, J.M.; Osterberg, E.C.; Horton, R.M.; Beckage, B. Total and extreme precipitation changes over the northeastern United States. J. Hydrometeorol. 2017, 18, 1783–1798. [Google Scholar] [CrossRef] [PubMed]
  23. Greco, A.; De Luca, D.L.; Avolio, E. Heavy Precipitation Systems in Calabria Region (Southern Italy): High-Resolution Observed Rainfall and Large-Scale Atmospheric Pattern Analysis. Water 2020, 12, 1468. [Google Scholar] [CrossRef]
  24. Macy, E.H.; Thorncroft, C.D.; Bosar, L.F. Changes in Extreme Precipitation in the Northeast United States: 1979–2014. J. Hydrometeorol. 2019, 20, 673–688. [Google Scholar]
  25. Sun, J.C.; Guan, Z.Y.; Li, M.G.; Yu, Y.X. Anomalous circulation patterns in association with two types of regional daily precipitation extremes over South China from July to October. Acta Meteorol. Sin. 2019, 77, 43–57. (In Chinese) [Google Scholar]
  26. Yang, S.; Li, Q. Improvement in homogeneity analysis method and update of China precipitation data. Adv. Clim. Chang. Res. 2014, 10, 276–281. (In Chinese) [Google Scholar]
  27. Dee, D.P.; Uppala, S.M.; Simmons, A.J.; Berrisford, P.; Poli, P.; Kobayashi, S.; Andrae, U.; Balmaseda, G.; Bauer, P.; Bechtold, P.; et al. The ERA-Interim reanalysis: Configuration and performance of the data assimilation system. Q. J. R. Meteorol. Soc. 2011, 137, 553–597. [Google Scholar] [CrossRef]
  28. Easterling, D.R.; Meehl, G.A.; Changnon, C.P.A.; Karl, T.R.; Mearns, L.O. Climate extremes: Observations, modeling and impacts. Science 2000, 289, 2068–2074. [Google Scholar] [CrossRef] [Green Version]
  29. Torrence, C.; Compo, G.P. A practical guide to wavelet analysis. Bull. Am. Meteorol. Soc. 1998, 79, 61–78. [Google Scholar] [CrossRef] [Green Version]
  30. Wang, W.-S.; Ding, J.; Li, Y.-Q. Hydrology Wavelet Analysis; Chemical Industry Press: Beijing, China, 2005. (In Chinese) [Google Scholar]
  31. Gao, S.T. The Instability of the Vortex Sheet along the Shear Line. Adv. Atmos. Sci. 2000, 17, 526–537. [Google Scholar]
  32. He, G.B.; Gao, W.L.; Tu, N.N. The Observational Analysis of Shear Line and Low Vortex over the Tibetan Plateau in Summer from 2000 to 2007. Plateau Meteorol. 2009, 28, 37–42. (In Chinese) [Google Scholar]
  33. Fu, Y.F.; Liu, X.P.S.; Li, R.; Zhong, L. Characteristics of precipitation based on cloud brightness temperatures and storm tops in summer Tibetan Plateau. Chin. J. Atmos. Sci. 2016, 40, 102–120. (In Chinese) [Google Scholar]
  34. He, G.B.; Shi, R. Studies on dynamic and thermal characteristics of different shear lines over Tibetan Plateau in summer. Plateau Meteorol. 2011, 30, 568–575. (In Chinese) [Google Scholar]
  35. Li, G.P.; Li, S.S.; Huang, C.H. Research status and prospect of the interaction between Tibetan Plateau shear line and Tibetan Plateau vortex. J. Adv. Earth Sci. 2017, 32, 919–925. (In Chinese) [Google Scholar]
  36. Xie, X.R.; You, Q.L.; Bao, Y.T.; Meng, X.H. The connection between the precipitation and water vapor transport over Qing-hai-Tibetan Plateau in summer based on the multiple datasetssets. Plateau Meteorol. 2018, 37, 78–92. (In Chinese) [Google Scholar]
Figure 1. Distribution of stations over the Tibetan Plateau. The shade represents altitude (unit: m).
Atmosphere 12 00379 g001
Figure 2. Characteristics of precipitation and extreme precipitation over the Tibetan Plateau from 1981 to 2016: (a) extreme precipitation (unit: mm); (b) extreme precipitation frequency; (c) extreme precipitation frequency greater than 25 mm; (d) Daily maximum precipitation (unit: mm).
Atmosphere 12 00379 g002
Figure 3. Time distribution of extreme precipitation over the Tibetan Plateau from 1981 to 2016: (a) annual frequency of extreme precipitation over the Tibetan Plateau; (b) ten-day frequency of extreme precipitation over the Tibetan Plateau; (c) pentad frequency of extreme precipitation over the Tibetan Plateau.
Atmosphere 12 00379 g003
Figure 4. The Mann–Kenda (M-K) test for summer extreme precipitation over the Tibetan Plateau.
Atmosphere 12 00379 g004
Figure 5. (a) The Morlet wavelet transform of extreme precipitation frequency. (b) The modular squared time frequency of the Morlet wavelet transformation of the extreme precipitation frequency.
Atmosphere 12 00379 g005
Figure 6. The frequency distribution of regional extreme precipitation events at each station.
Atmosphere 12 00379 g006
Figure 7. The composite of the 500 hPa circulation for (a) PT-type, (b) PSL-type, and (c) PV-type precipitation events. The blue contour lines represent the potential height (unit: gpm), the red box represents the extreme precipitation area, and the thick red lines indicate the shear line or trough line.
Atmosphere 12 00379 g007
Figure 8. The composite of the height anomaly at 100 hPa for (a) PT-type, (b) PSL-type, and (c) PV-type precipitation events. The composite of the height anomaly at 500 hPa for (d) PT-type, (e) PSL-type, and (f) PV-type precipitation events. The red box represents the extreme precipitation area.
Atmosphere 12 00379 g008
Figure 9. The vertical section of divergence anomalies (shade, unit: 10−5s−1) and vorticity anomalies (black solid line, unit: 10−5s−1) over the Tibetan Plateau for (a) the PT-type precipitation event at 100° E, (b) the PSL-type precipitation event at 99° E, and (c) the PV-type precipitation event at 90° E. The black rectangle on the horizontal axis represents the extreme precipitation area.
Atmosphere 12 00379 g009
Figure 10. The vertical section of vertical velocity anomalies (shade, units: 10−2 Pa/s) and potential temperature anomalies (unit: k) over the Tibetan Plateau for (a) the PT-type extreme precipitation event at 100° E, (b) the PSL-type extreme precipitation event at 99° E, and (c) the PV-type extreme precipitation event at 90° E. The black rectangle on the horizontal axis represents the extreme precipitation area.
Atmosphere 12 00379 g010
Figure 11. The 500 hPa water vapor flux divergence (shade, unit: 10−7g·cm−2 hPa−1 s−1) and water vapor flux (vector, unit: 10−3g·cm−1 hPa−1 s−1) over the Tibetan Plateau for (a) PT-type, (b) PSL-type, and (c) the PV-type extreme precipitation events. The red box represents the extreme precipitation area, while the yellow boundary lines represent the Tibetan Plateau.
Atmosphere 12 00379 g011
Table 1. The 500 hPa influence system of regional extreme precipitation events.
Serial NumberPrecipitation Area (Adjacent Stations)Influence SystemCase TimeMaximum Precipitation (mm)
1E (4)Plateau low trough1983081839.8
2E (6)Plateau low trough2016071441.6
3N (6)Plateau low trough1990072537.5
4N (7)Plateau low trough1997070248.3
5N (4)Plateau low trough1997080542.0
6N (4)Plateau low trough1998071065.0
7N (5)Plateau low trough1995081044.5
8N (6)Plateau low trough1996080949.0
9N (5)Plateau low trough2008073038.9
10N (5)Plateau low trough2009081845.9
11N (7)Plateau low trough2012073048.0
12N (5)Plateau low trough2001070940.8
13N (5)Plateau low trough2013082752.6
14N (6)Plateau low trough2014070846.8
15N (5)Plateau low trough2016071046.6
16N (5)Plateau low trough2016071139.8
17E (5)Plateau shear line19890727115.8
18E (5)Plateau shear line1993082966.0
19E (5)Plateau shear line1995070339.9
20E (9)Plateau shear line1997070867.8
21E (4)Plateau shear line2007072144.5
22E (5)Plateau shear line2010071855.9
23S-C (5)Plateau shear line1995070434.2
24N (5)Plateau shear line1993072042.7
25N (5)Plateau shear line2007083060.5
26N (6)Plateau shear line2010060752.0
27N (5)Plateau shear line2012060593.7
28S-C (4)Plateau vortex1990073135.4
29S-C (5)Plateau vortex1986071635.9
30S-C (3)Plateau vortex2013080744.5
31S-C (6)Plateau vortex2015081975.9
32E (5)Plateau vortex2000082842.1
33N (4)Plateau vortex1998070935.4
Table 2. Synthetic case information table.
YearPrecipitation PeriodSynthesis TimePrecipitation TypeInfluence System
199024 July–25 July24 July 18:00PT-typePlateau low trough
199509 Aug–10 Aug09 Aug 18:00PT-typePlateau low trough
201326 Aug–27 Aug26 Aug 18:00PT-typePlateau low trough
201407 July–08 July07 July 18:00PT-typePlateau low trough
198926 July–27 July26 July 18:00PSL-typePlateau shear line
199328 Aug–29 Aug28 Aug 18:00PSL-typePlateau shear line
199707 July–08 July07 July 18:00PSL-typePlateau shear line
200720 July–21 July20 July 18:00PSL-typePlateau shear line
198615 July–16 July15 July 18:00PV-typePlateau vortex
199030 July7–31 July30 July 18:00PV-typePlateau vortex
201306 Aug–07 Aug06 Aug18:00PV-typePlateau vortex
201518 Aug–19 Aug18 Aug 18:00PV-typePlateau vortex
Publisher’s Note: MDPI stays neutral with regard to jurisdictional claims in published maps and institutional affiliations.

