Article

Volatile Organic Compounds Monitored Online at Three Photochemical Assessment Monitoring Stations in the Pearl River Delta (PRD) Region during Summer 2016: Sources and Emission Areas

1
State Key Laboratory of Organic Geochemistry, Guangzhou Institute of Geochemistry, Chinese Academy of Sciences, Guangzhou 510640, China
2
University of Chinese Academy of Sciences, Beijing 100049, China
3
State Environmental Protection Key Laboratory of Regional Air Quality Monitoring, Ecological and Environmental Monitoring Center of Guangdong Province, Guangzhou 510308, China
4
Guangzhou Ecological and Environmental Monitoring Center of Guangdong Province, Guangzhou 510060, China
5
Guangdong Provincial Observation and Research Station for Climatic Environment and Air Quality Change in the Pearl River Estuary, Guangzhou 510275, China
*
Author to whom correspondence should be addressed.
Atmosphere 2021, 12(3), 327; https://doi.org/10.3390/atmos12030327
Submission received: 7 February 2021 / Revised: 24 February 2021 / Accepted: 28 February 2021 / Published: 4 March 2021
(This article belongs to the Special Issue Air Quality Management)

Abstract

:
Volatile organic compounds (VOCs) were monitored online at three photochemical assessment monitoring stations (MDS, WQS and HGS) in the Pearl River Delta region during the summer of 2016. Measured levels of VOCs at the MDS, WQS and HGS sites were 34.78, 8.54 and 8.47 ppbv, respectively, with aromatics and alkenes as major ozone precursors and aromatics as major precursors to secondary organic aerosol (SOA). The positive matrix factorization (PMF) model revealed that VOCs at the sites mainly came from vehicle exhaust, petrochemical industry, and solvent use. Vehicle exhaust and industrial processes losses contributed most to ozone formation potentials (OFP) of VOCs, while industrial processes losses contributed most to SOA formation potentials of VOCs. Potential source contribution function (PSCF) analysis revealed a north-south distribution for source regions of aromatics occurring at MDS with emission sources in Guangzhou mainly centered in the Guangzhou central districts, and source regions of aromatics at WQS showed an east-west distribution across Huizhou, Dongguan and east of Guangzhou, while that at HGS showed a south-north distribution across Guangzhou, Foshan, Zhaoqing and Yangjiang. This study demonstrates that multi-point high time resolution data can help resolve emission sources and locate emission areas of important ozone and SOA precursors.

Graphical Abstract

1. Introduction

Volatile organic compounds (VOCs) are important precursors to secondary pollutants such as ozone (O3) and secondary organic aerosol (SOA) in the troposphere through complex photochemical cycles [1]. In recent years, the gradual deterioration of O3 pollution in China’s major cities has attracted great concerns [2]. Particularly in summer, excessive O3 concentration is the main cause of poor air quality index. Previous studies demonstrated that in these megacities O3 formation is largely VOC-limited and the increase in anthropogenic emissions of VOCs is an important reason for the deteriorating O3 pollution. The ozone formation potentials (OFP) of different VOCs vary largely with their OH radical reaction rates [3,4,5]. Many VOCs, like aromatic hydrocarbons and biogenic VOCs, are also precursors of SOA [6,7], which shares 20–70% mass concentrations of PM2.5 in ambient air [8,9]. Therefore, for the coordinated prevention and control of O3 and PM2.5 prevention, it is critical to determine which are the most important precursors to O3 and SOA among the hundreds of VOC species occurring in the ambient [6,7,10], and, moreover, what are the major sources and emission areas of these precursors.
The Pearl River Delta (PRD) region is the world’s largest megacity and one of the most urbanized and industrialized regions in China. In the past decades, the rapid urbanization and industrialization in the region have given rise to the emission of a large number of air pollutants, leading to air quality problems with PM2.5 and O3 pollution. In recent years, while PM2.5 pollution has been alleviated with intensified pollution control, O3 pollution however are becoming more and more prominent. As O3 formation in this area is largely more sensitive to VOCs than to nitrogen oxides (NOx) in the PRD region [11,12,13,14,15], a large number of studies have been carried out in the region to investigate anthropogenic sources of VOCs [10,14,16,17,18,19,20,21,22,23]. However, most of the studies on VOCs sources in the PRD region are focused on urban areas through offline analysis with samples collected in canisters, and studies on VOCs sources in rural areas and on regional scale are quite limited [14,24]. Moreover, online VOC monitoring with much higher time resolution and a larger data pool would facilitate better understanding of the emission sources and diagnosing emission areas [25,26,27] and would therefore yield results that benefit formulating emission control measures.
In this study, approximate one-month online VOC measurement was carried out concurrently at an urban, a suburban and a background site in the PRD region during the photochemically active summertime to determine ambient levels of VOCs and identify important precursors to O3 and SOA. PMF model was used for the source apportioning, and PSCF was further used to explore the potential source areas of the aromatics, which are important precursors to both O3 and SOA.

2. Methods

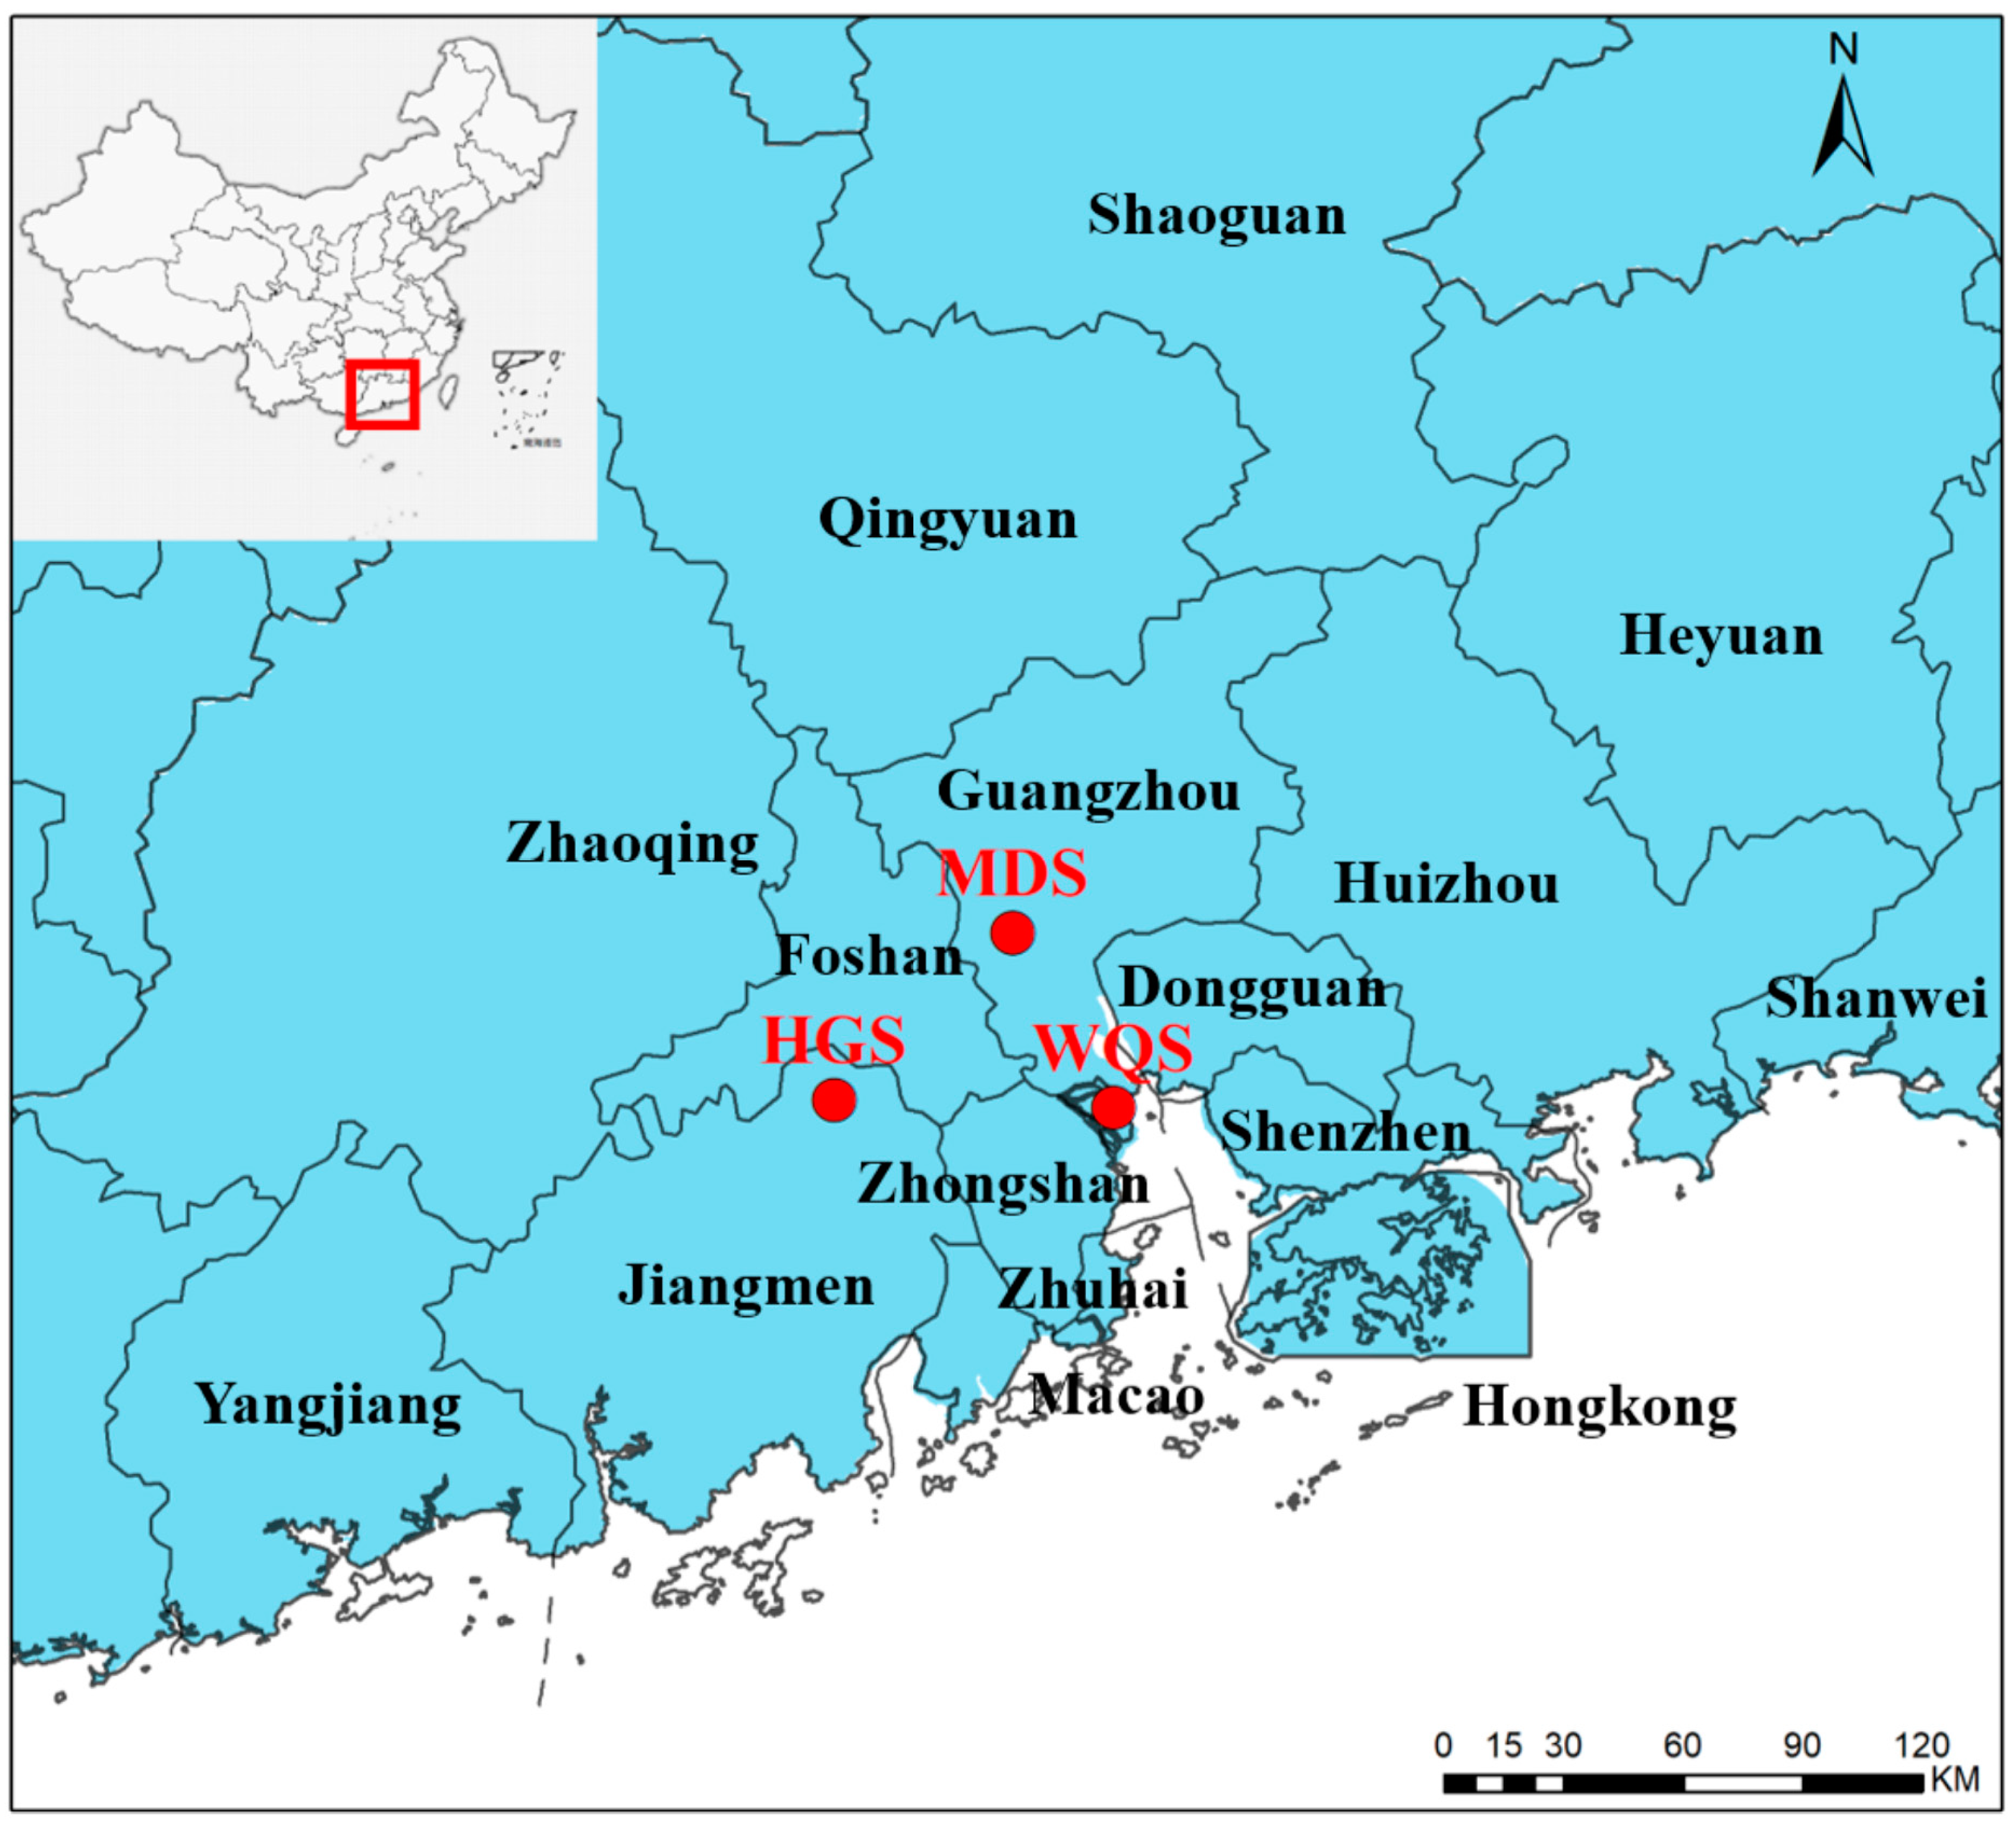
2.1. Desciption of Monitoring Sites

Three sites (MDS, WQS and HGS; Figure 1) among Photochemical Assessment Monitoring Stations (PAMS) in the PRD region are selected in this study. They are located in the cities of Guangzhou and Jiangmen.
The MDS site (113.33° E, 23.11° N) is 50 m above the ground on the roof of Guangdong Provincial Environmental Monitoring Center in the Haizhu District of Guangzhou. The station is located in a downtown area surrounded by a number of traffic arteries, and there are petrochemical, shipping, automobile manufacturing and other industrial parks clustered in the east and south of the site.
The WQS site (113.55° E, 22.71° N) is 30 m above the ground on the roof of the Science and Technology Building of Fok Yingdong Research Institute, Hong Kong University of Science and Technology in the Nansha District of Guangzhou. The station is located in the southernmost part of Guangzhou and in the center of the “Golden Triangle” of Guangzhou, Hong Kong and Macao. It is 50, 75 and 65 km away from core urban areas of Guangzhou, Hong Kong and Macao, respectively. There are enterprises in thermal power generation, chemical industry, electronics, shipping and other industries around the point.
The HGS site (112.93° E, 22.73° N) is 20 m above the ground on a hill top of the Huaguo Mountain in the Taoyuan Town of Jiangmen. The station is 80 km away from Guangzhou, 50 km away from Foshan and 30 km away from Jiangmen. It is located within the core areas of the PRD region with relatively intensive pollution emissions in its surrounding cities and pollutions there are obviously affected by atmospheric transport.
According to the dominant southerly wind direction during the observation period (July–August 2016), the upwind WQS is taken as the background site, while the MDS site is an urban point and HGS is a suburban site influenced by regional transport.

2.2. Online Measurement of VOCs

Fifty-seven VOC species, including 29 alkanes, 10 alkenes, 17 aromatic hydrocarbons and acetylene were monitored hourly at the three sites with three online VOCs analyzers, two of which (TH-300B, Tianhong Inc., Wuhan, China) were installed at the HGS and MDS sites, and one of which (Clarus-500 & TurboMatrix, PerkinElmer Inc., Waltham, MA, USA) was installed at the WQS site. For the two TH300-B analyzers, air samples are firstly collected at a flow rate of 60 mL/min for 5 min and then analyzed by the gas chromatography-flame ionization detector/mass selective detector (GC-FID/MSD), with a sampling and analysis cycle of 1 h. The moisture in the air samples was cryogenically removed and the VOCs in air samples were captured by a collecting column. The FID was used to detect C2–C5 hydrocarbons through a 20 m × 0.32 mm × 3.0 μm PLOT column, and MSD was used to detect C5–C12 hydrocarbons through a 60 m × 0.25 mm × 1.4 μm DB-624 column. In order to improve the accuracy to identify sources of VOCs, some typical source tracers, including chloromethane, trichloroethylene, tetrachloroethylene and methyl tert-butyl ether, in each sample were also monitored. The Perkin Elmer analyzer consists of an automatic concentrator, a thermal desorber, and a GC with dual FID detectors with a 50 m × 0.32 mm sodium sulfate deactivated alumina column for the C2–C6 components, and a 50 m × 0.22 mm × 1 μm methyl silane column for the C6–C12 components, respectively.
Stringent quality assurance/quality control criteria were followed during the online monitoring. The analyzers have built-in auto-linearization and auto-calibration programs developed for the quality control. The certified calibration standard mixture (1 ppm, Spectra Gases Inc., Bransburg, NJ, USA) was dynamically diluted to 10 ppb and injected every day to check the performance of the calibration curves, which had concentration-response correlation coefficients above 0.995 in this study. The method detection limits (MDLs) for the 57 VOC species ranged from 0.001 to 0.326 (ppbv).

2.3. Data Collection

In this study, for VOCs monitoring at the three stations the time spans in 2016 were as follows: from 9 July to 1 August at the MDS site; from 4 July to 3 August at the WQS site; and from 1 July to 1 August at the HGS site. Except for missing data caused by instrument failure or maintenance, 387, 707 and 690 groups of valid VOCs data were obtained at the MDS, WQS and HGS sites, respectively. Hourly data for NOx (chemiluminescence method), O3 (UV spectrophotometry method), SO2 (UV fluorescence method), CO (infrared spectroscopy method) and the meteorological data (including temperature, relative humidity (RH), wind speed and wind direction measured with Vaisala WXT535 Multi-Parameter Weather Sensor) were collected from the stations administered by the Ecological and Environmental Monitoring Center of Guangdong Province.

2.4. Data Analysis

2.4.1. PMF Receptor Model

Positive matrix factorization (PMF) receptor model is a method widely used to quantify source contributions to target pollutants observed at a given receptor site. It is a multi-factor analysis tool that can decompose the matrix of field observation data into two matrices: a source contribution matrix and a source profile matrix [28,29]. In this work, the USEPA PMF model version 5.0 was used [30], with input principles as follows: (1) certainty and uncertainty values for VOC species were estimated according to the methods in the PMF 5.0 user guide; (2) VOC sources were explored using a data matrix based on the Equation (1) below; (3) the PMF solution minimizes the objective function Q based on the uncertainties (μ) with a convergence based on Equation (2) below:
X ij = k = 1 p g ik f kj + e ij
Q = i = 1 n j = 1 m [ x ij k = 1 p g ik f kj u ij ] 2
where matrix X is the VOC species concentration data, which can be decomposed into a factorial solution of two matrices including g (source contribution) and f (source profile); e is the residual value; i is the number of VOCs samples, j is the number of VOC species, and k is the number of VOC sources, and p is the number of independent sources.
The PMF model requires two input files: sample species concentration values and sample species uncertainty values. In the model, data values below the MDLs were substituted with MDL/2; missing data values were substituted with median concentrations [31]. If the concentration is less than or equal to the MDL provided, the uncertainty is calculated using the following equation, Unc = 5/6 × MDL; if the concentration is greater than the MDL provided, the calculation is Unc = ((Error Fraction × mixing ratios)2 + (MDL/2)2)1/2 [32,33]. In this study, most species had all concentration levels above the MDLs. In the PMF analysis, 20% extra modelling uncertainty was used to account for temporal changes in source profiles and other sources of variability. The species also need to be further filtered according to the signal-to-noise ratio (S/N). If S/N > 2, species will be classified as “strong”. If 0.2 < S/N < 2, species will be classified as “weak”. Otherwise, species will be classified as “bad” and ruled out from the PMF model. To determine the optimum number of VOC sources, we tested combinations of 3–8 sources, to determine the best fit in the PMF model. The number of sources is optimal when the Q(true)/Q(expected) ratio is close to 1. In this study, 5 sources were selected for the WQS site and 6 sources were selected for the MDS and HGS sites, with the Q(true)/Q(expected) ratios ranging from 0.9 to 1.0.

2.4.2. Potential Source Contribution Function (PSCF)

In order to track possible emission area of pollution sources for ambient VOCs observed at each site, the PSCF analysis was conducted using the software TrajStat developed based mainly on conditional probability function [34], which is defined as the conditional probability that the corresponding value of a certain element exceeds the set threshold when the air mass passing through a certain region reaches the observation site. A certain study area is divided into grids with a specific resolution, and a threshold is set for VOC concentrations. When the concentration of VOCs corresponding to the trajectory is higher than the threshold, the trajectory can be considered as a pollution trajectory.
The backward trajectories were calculated for time points during a day (UTC 0:00, 3:00, 6:00, 9:00, 12:00, 15:00, 18:00 and 21:00). The meteorological parameters were collected from the National Oceanic and Atmospheric Administration (NOAA) Global Data Assimilation System (GDAS). The study field was divided into cells of 0.1° × 0.1°. The PSCF is defined by Equation (3) below:
PSCF ij = m ij n ij × W ij
where i and j represent the latitude and the longitude, respectively; nij represents the total endpoint number of trajectories falling in the ijth grid cell. mij represents the endpoint number of VOC concentration trajectories in the same grid cell. VOC concentration trajectories represent any VOC concentration above the reference values [25], which were the average VOC concentrations. To avoid uncertainties resulting from the influence of lower nij values, an arbitrary weight function Wij was applied to the PSCF values [27]. Wij is defined by Equation (4) below:
W ij = { 1.00 20 < n ij 0.75 10 < n ij 20 0.50 5 < n ij 10 0 0 < n ij 5

2.4.3. Ozone Formation Potential (OFP)

OFP was calculated as the Equation (5) below based on the maximum incremental reactivity (MIR) values of each VOC species [35]:
OFP i = [ VOC ] i × MIR i
where OFPi represents the O3 formation potential of species i; [VOC]i is the concentration of species i; and MIRi (in g O3/g VOC) is the MIR of species i.

2.4.4. Secondary Organic Aerosol Formation Potential (SOAFP)

SOAFP is a parameter used to estimate the contribution of individual VOCs to SOA formation [36,37]. In the present study, SOAFP was calculated by multiplying the concentration of a species by its fractional aerosol coefficient (FAC), as shown by equations below:
SOAFP i = [ VOCs ] i , initial × FAC i
[ VOCs ] i , st = [ VOCs ] i , initial × ( 1 F [ VOC ] i )
where SOAFPi represents the amount of aerosol formed from species i; FACi refers to fractional aerosol coefficient of species i; [VOC]i,initial refers to the initial concentration of the species i; [VOC]i,st refers to the concentration of the species i after oxidation; and F[VOC]i refers to the fraction of reacted for the species i.

3. Results and Discussion

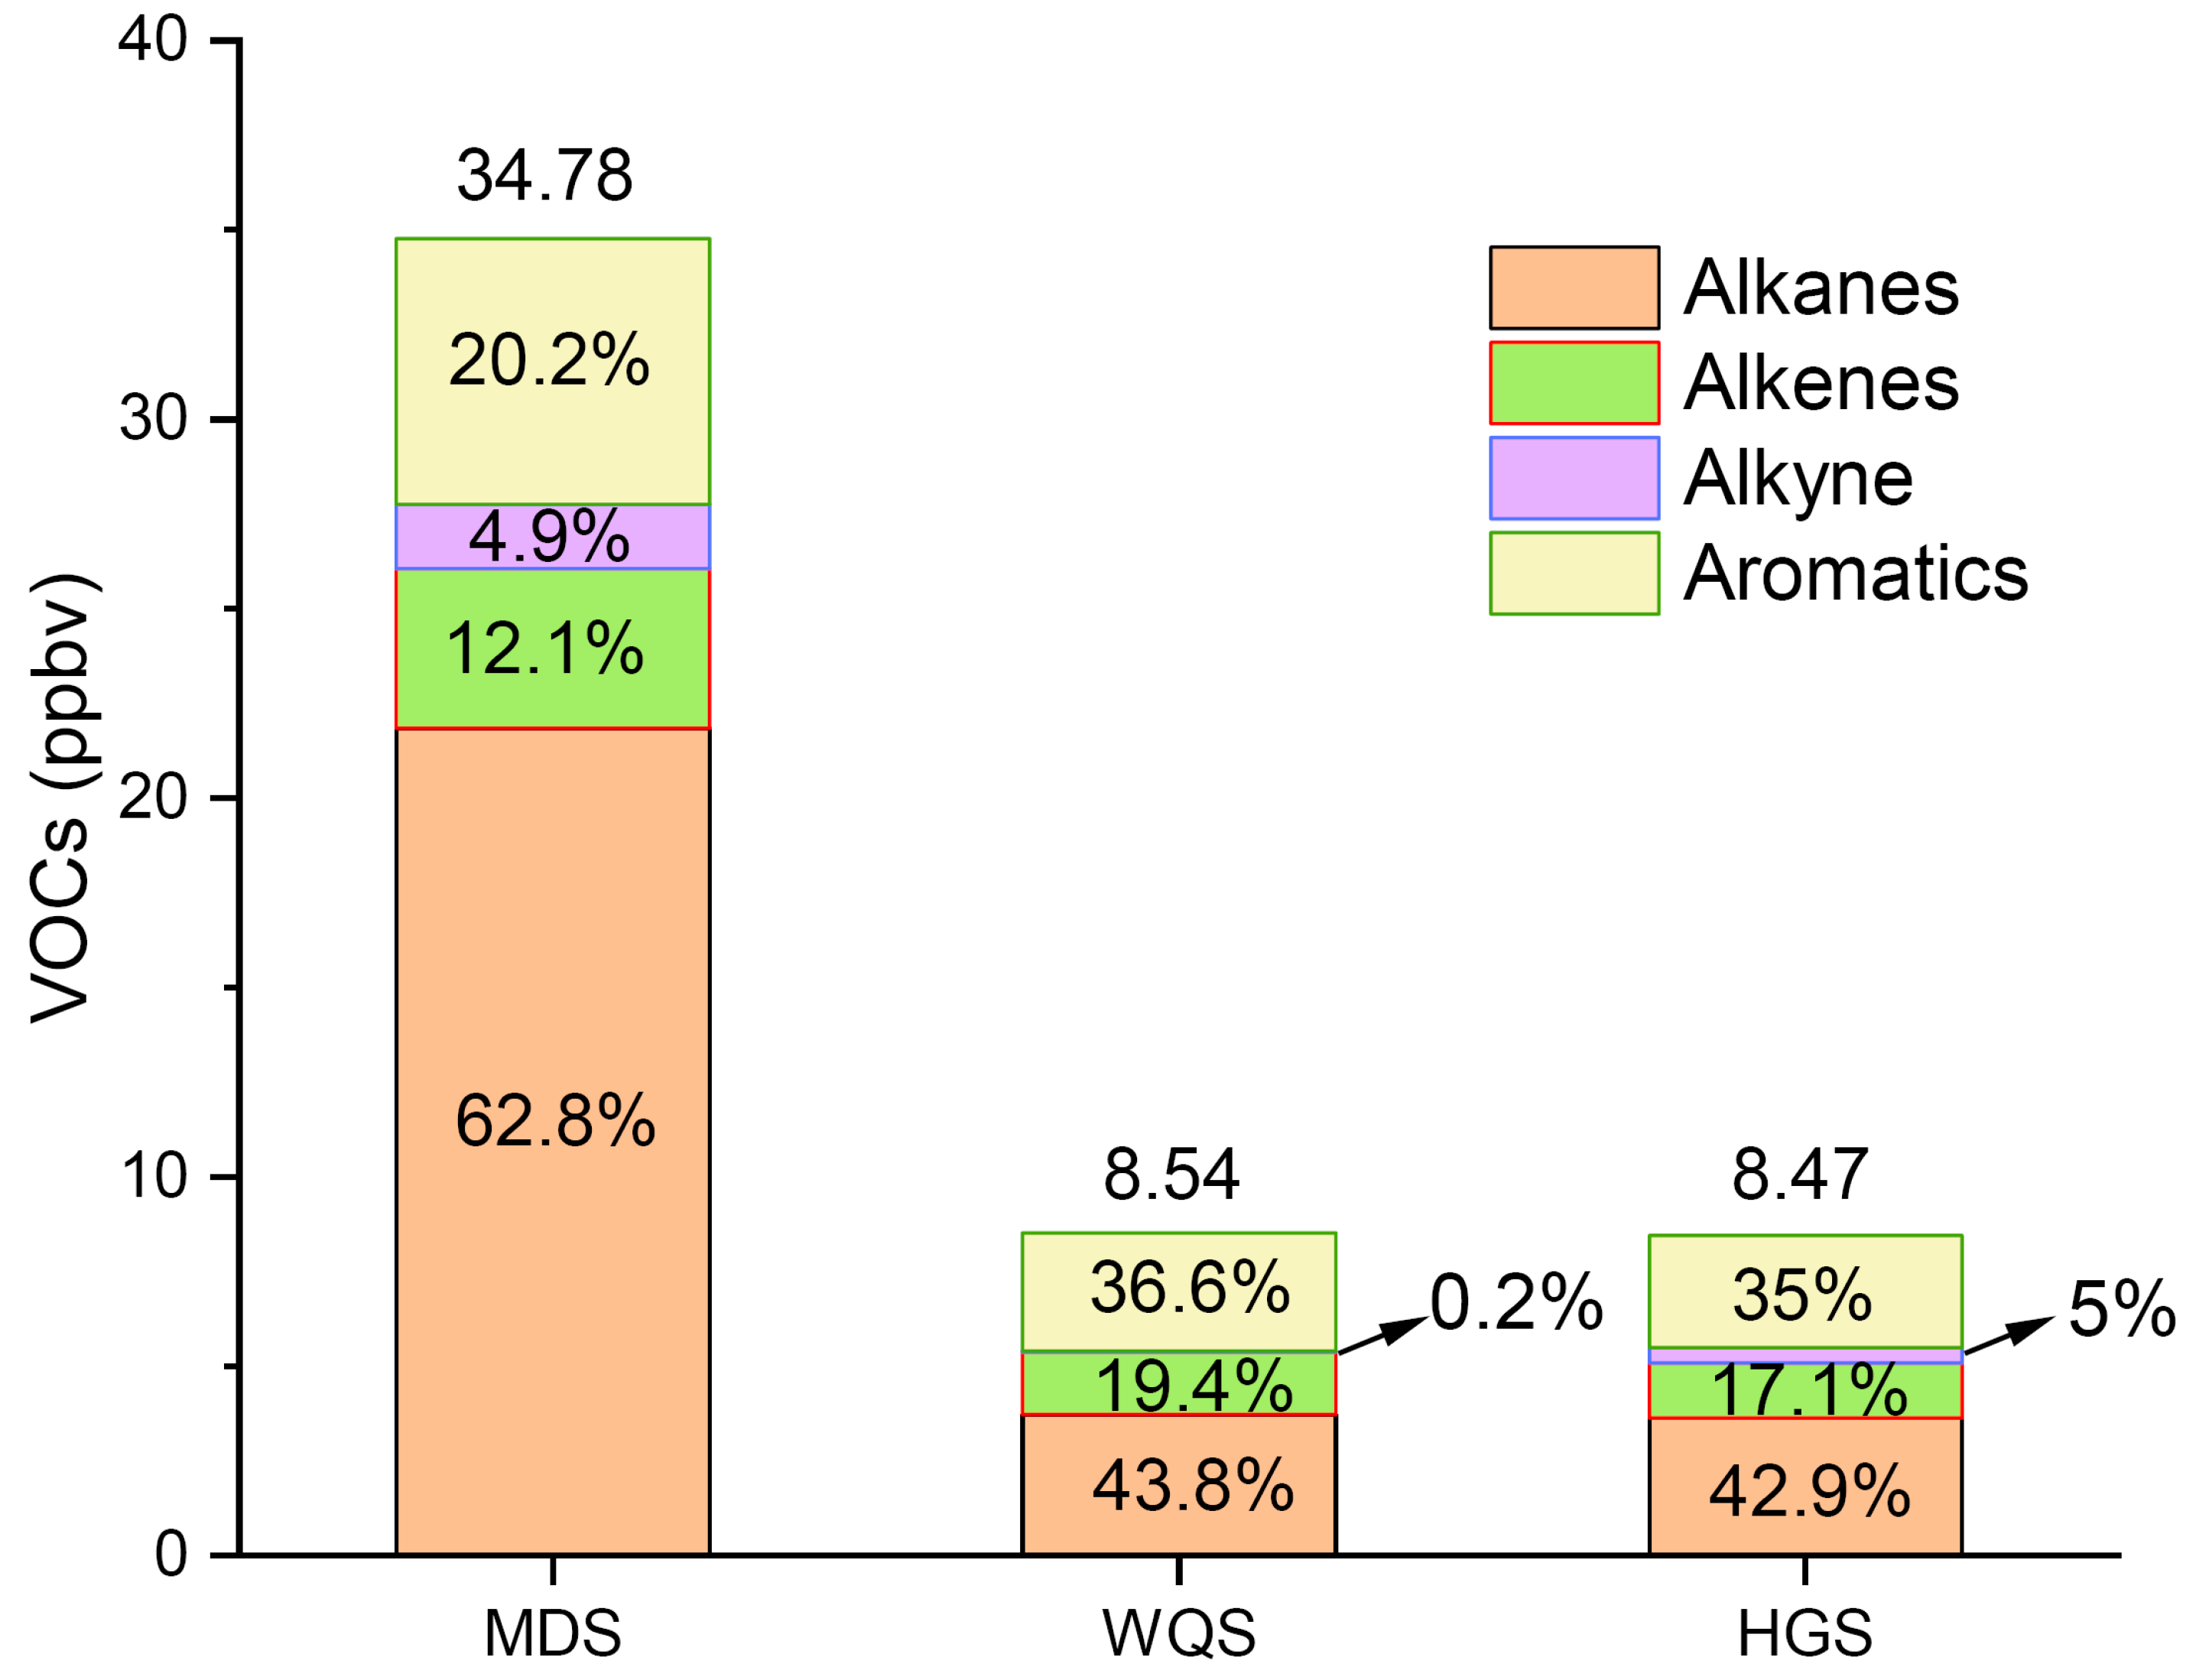
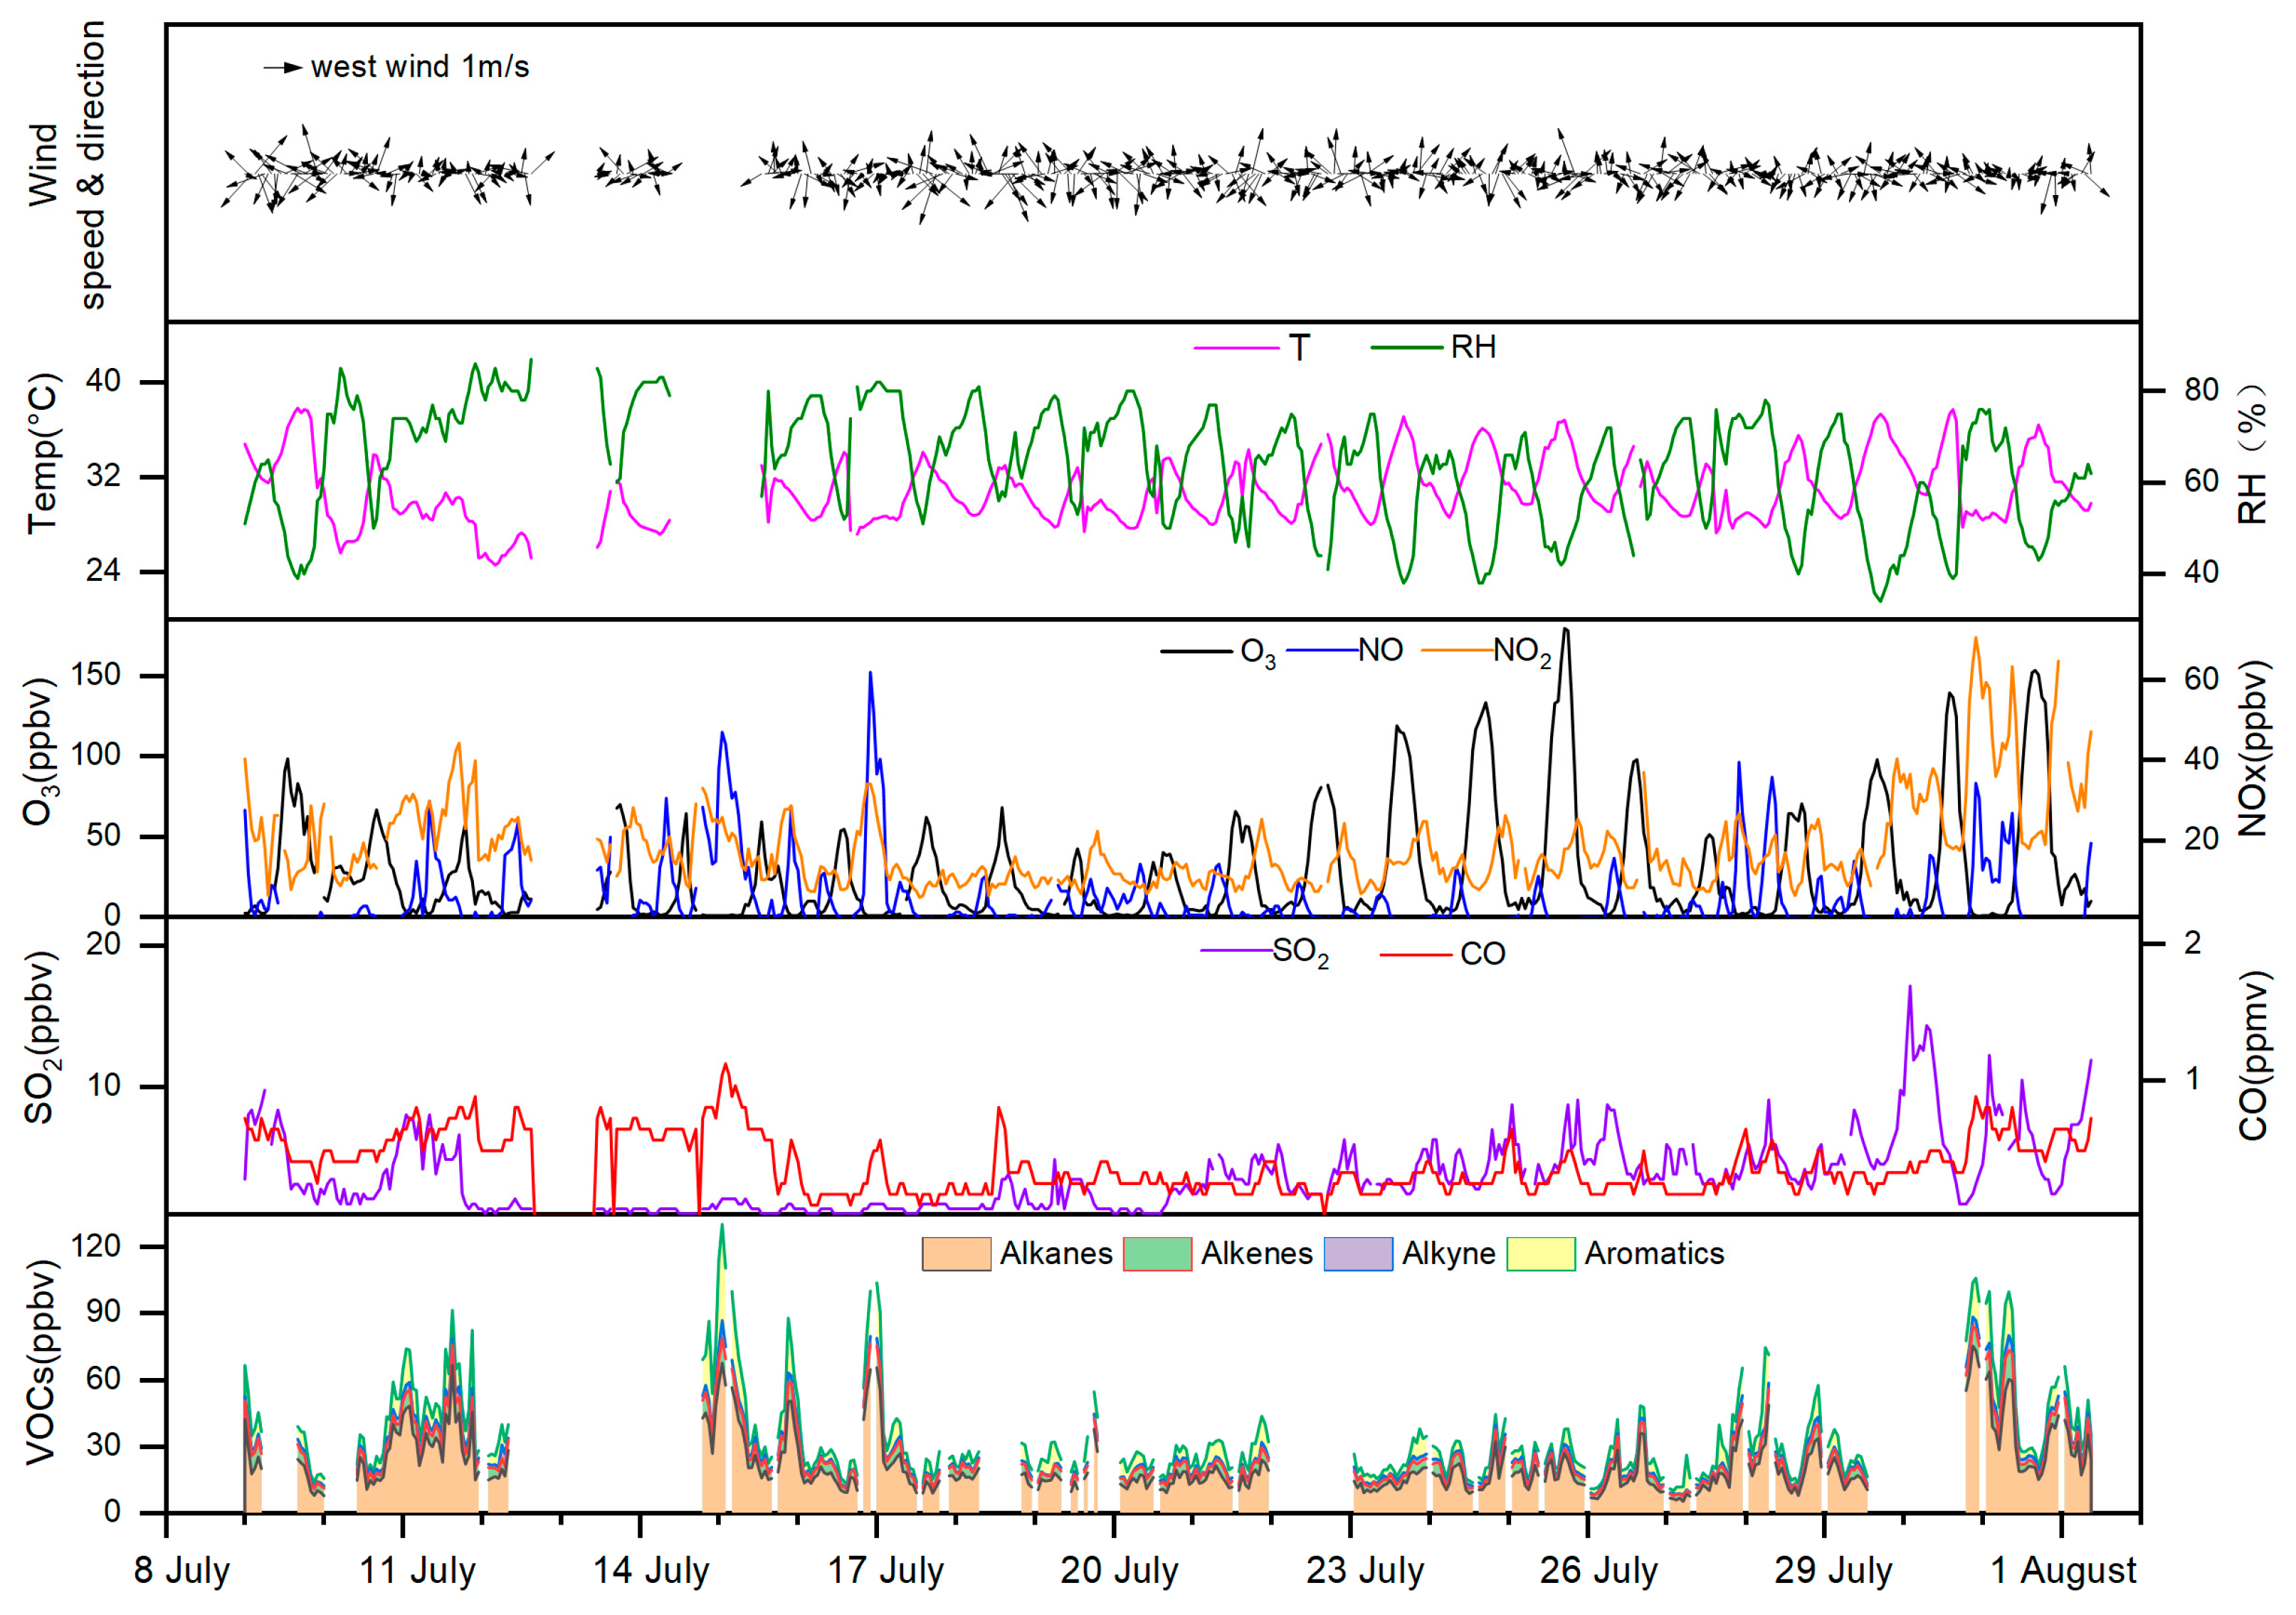
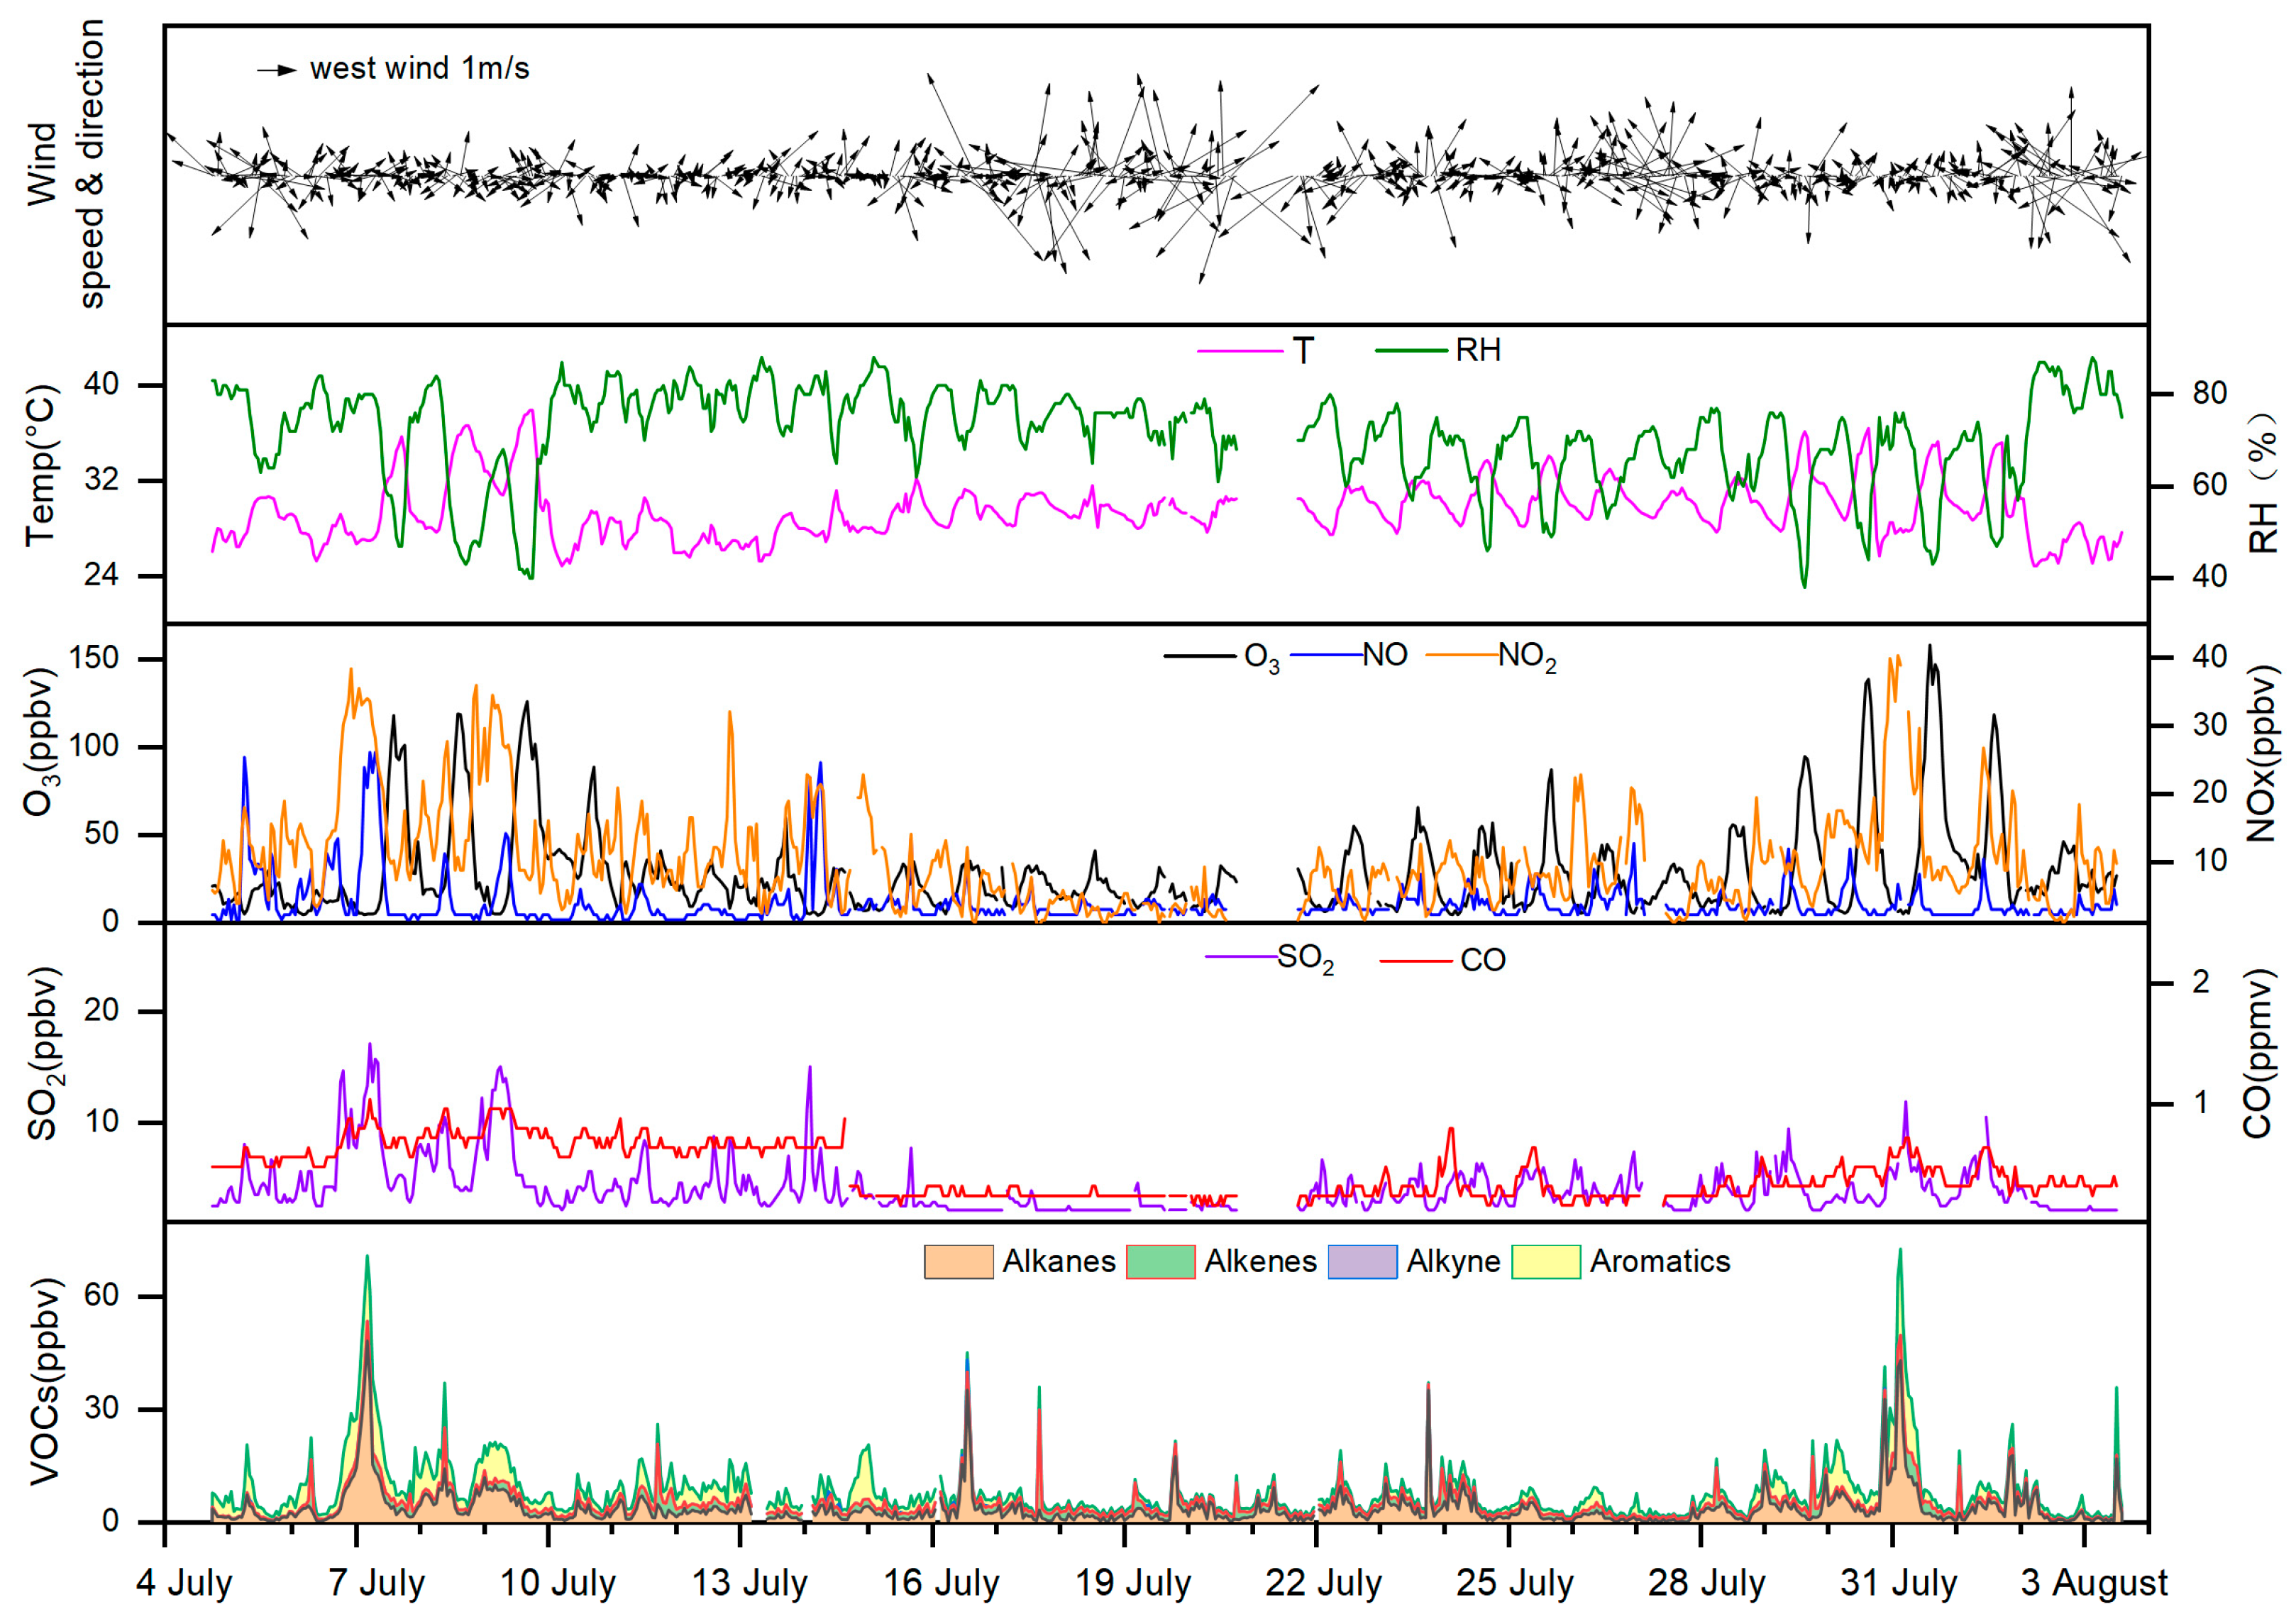
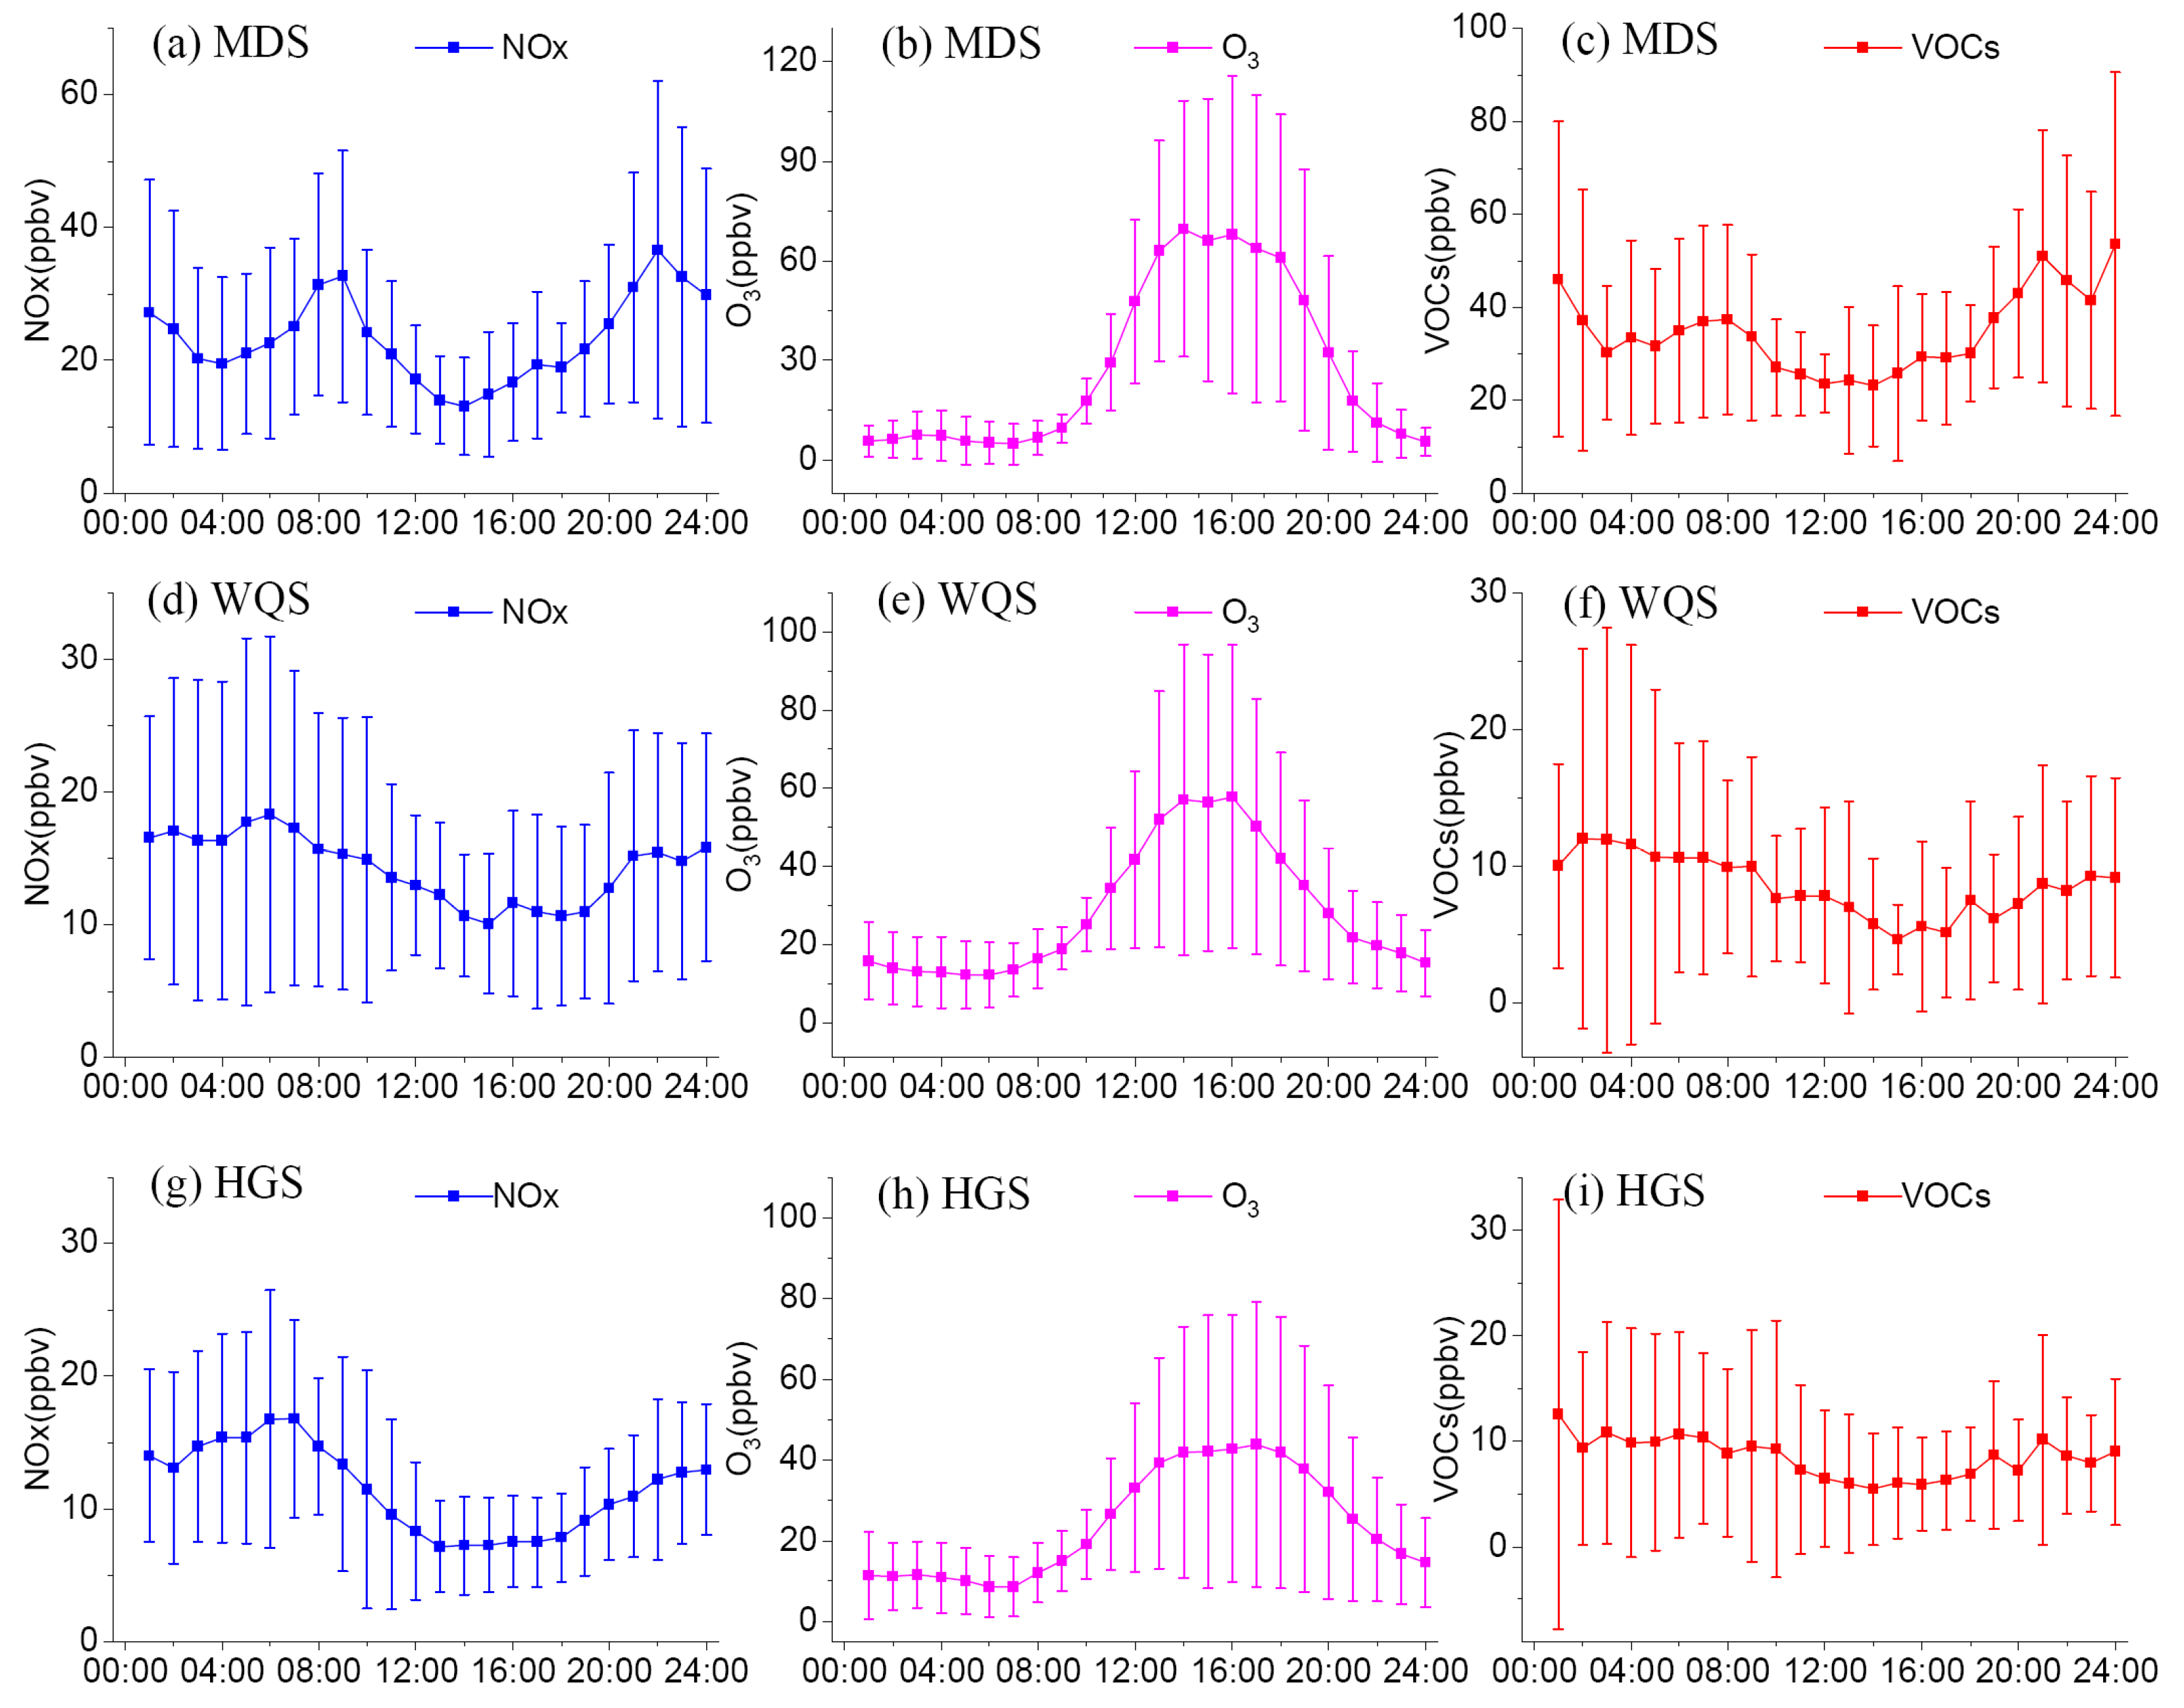
3.1. Variations in Mixing Ratios of VOCs

The concentrations of VOCs were 34.78, 8.54 and 8.47 ppbv on average at the MDS, WQS and HGS sites, respectively, during our field campaign in the summer (Figure 2). Mixing ratios of VOCs at the MDS site in the core urban area were substantially higher than that at the background (WQS) or suburban (HGS) sites. Apart from much stronger vehicle emissions and more decoration-related painting activity in the densely populated urban areas, the prevailing southerly winds during the field campaign might also bring pollutants from the upwind industrial areas to the MDS site. The concentrations of VOCs at WQS and HGS site on average were quite near each other. The mean mixing ratio of total VOCs observed at the HGS site in this study was quite near those observed previously in background areas in the North China Plain, in the Yangtze River Delta region or the PRD region [19,38,39], but was much lower than that measured at the same site during autumn (22 October 22 to 20 November 20) in 2014 [40], possibly due to changes in emission strength from 2014 to 2016 through enhanced emission control or due to lower boundary layer heights in autumn than in summer. However, the mean concentration of VOCs at the WQS site was similar to that observed previously during November–December 2009 [23] at the same area. The inconsistent trends of mixing ratios of VOCs in ambient air at different sites in the rapidly developing PRD region also implied that it is necessary to establish a network with online measurements to track the changing VOCs in ambient air.
Figure 3, Figure 4 and Figure 5 display the temporal variations of VOCs along with that of wind speed and direction, temperature and RH, O3, NO, NO2, SO2 and CO at the MDS, WQS and HGS sites.
At the MDS site, higher concentrations of O3 appeared from 24 July to 26 July and from 29 July to 1 August, but there are differences between the two periods: concentrations of VOCs and NOx showed no obvious rise from 24 July to 26 July, while they had a substantial rise during 29 July−1 August. A sudden increase in SO2 was observed on 29 July, implying enhanced emission from coal combustion.
At the WQS site, higher concentrations of O3 appeared from 7 July to 9 July and also from 29 July to 1 August when wind speed was low and the concentrations of VOCs and NOx were both at higher levels.
At the HGS site, higher O3 concentrations occurred on 8 July, 25 July and 31 July. However, concentrations of VOCs and NOx were also higher on 8 July and 31 July, while concentrations of VOCs and NOx were at a low level on 25 July when northerly winds dominated, higher O3 levels on that day were possibly due to the regional transport.
Figure 6 shows the diurnal variations of VOCs, NOx, and O3 concentrations at the three sites. It can be found that O3 peaked in the afternoon, while NOx and VOCs concentrations seemed to be opposite to that of O3, with the lowest concentrations in the afternoon. Concentration of VOCs rose at night mainly because there was no photochemical consumption at night and that the boundary layer height was also reduced. On noon time when photochemical reaction was the strongest in a day while temperature and the boundary layer height reached the highest, a large amount of VOCs were consumed during the photochemical formation of O3 and the higher boundary layer also resulted in decreased VOCs concentrations.

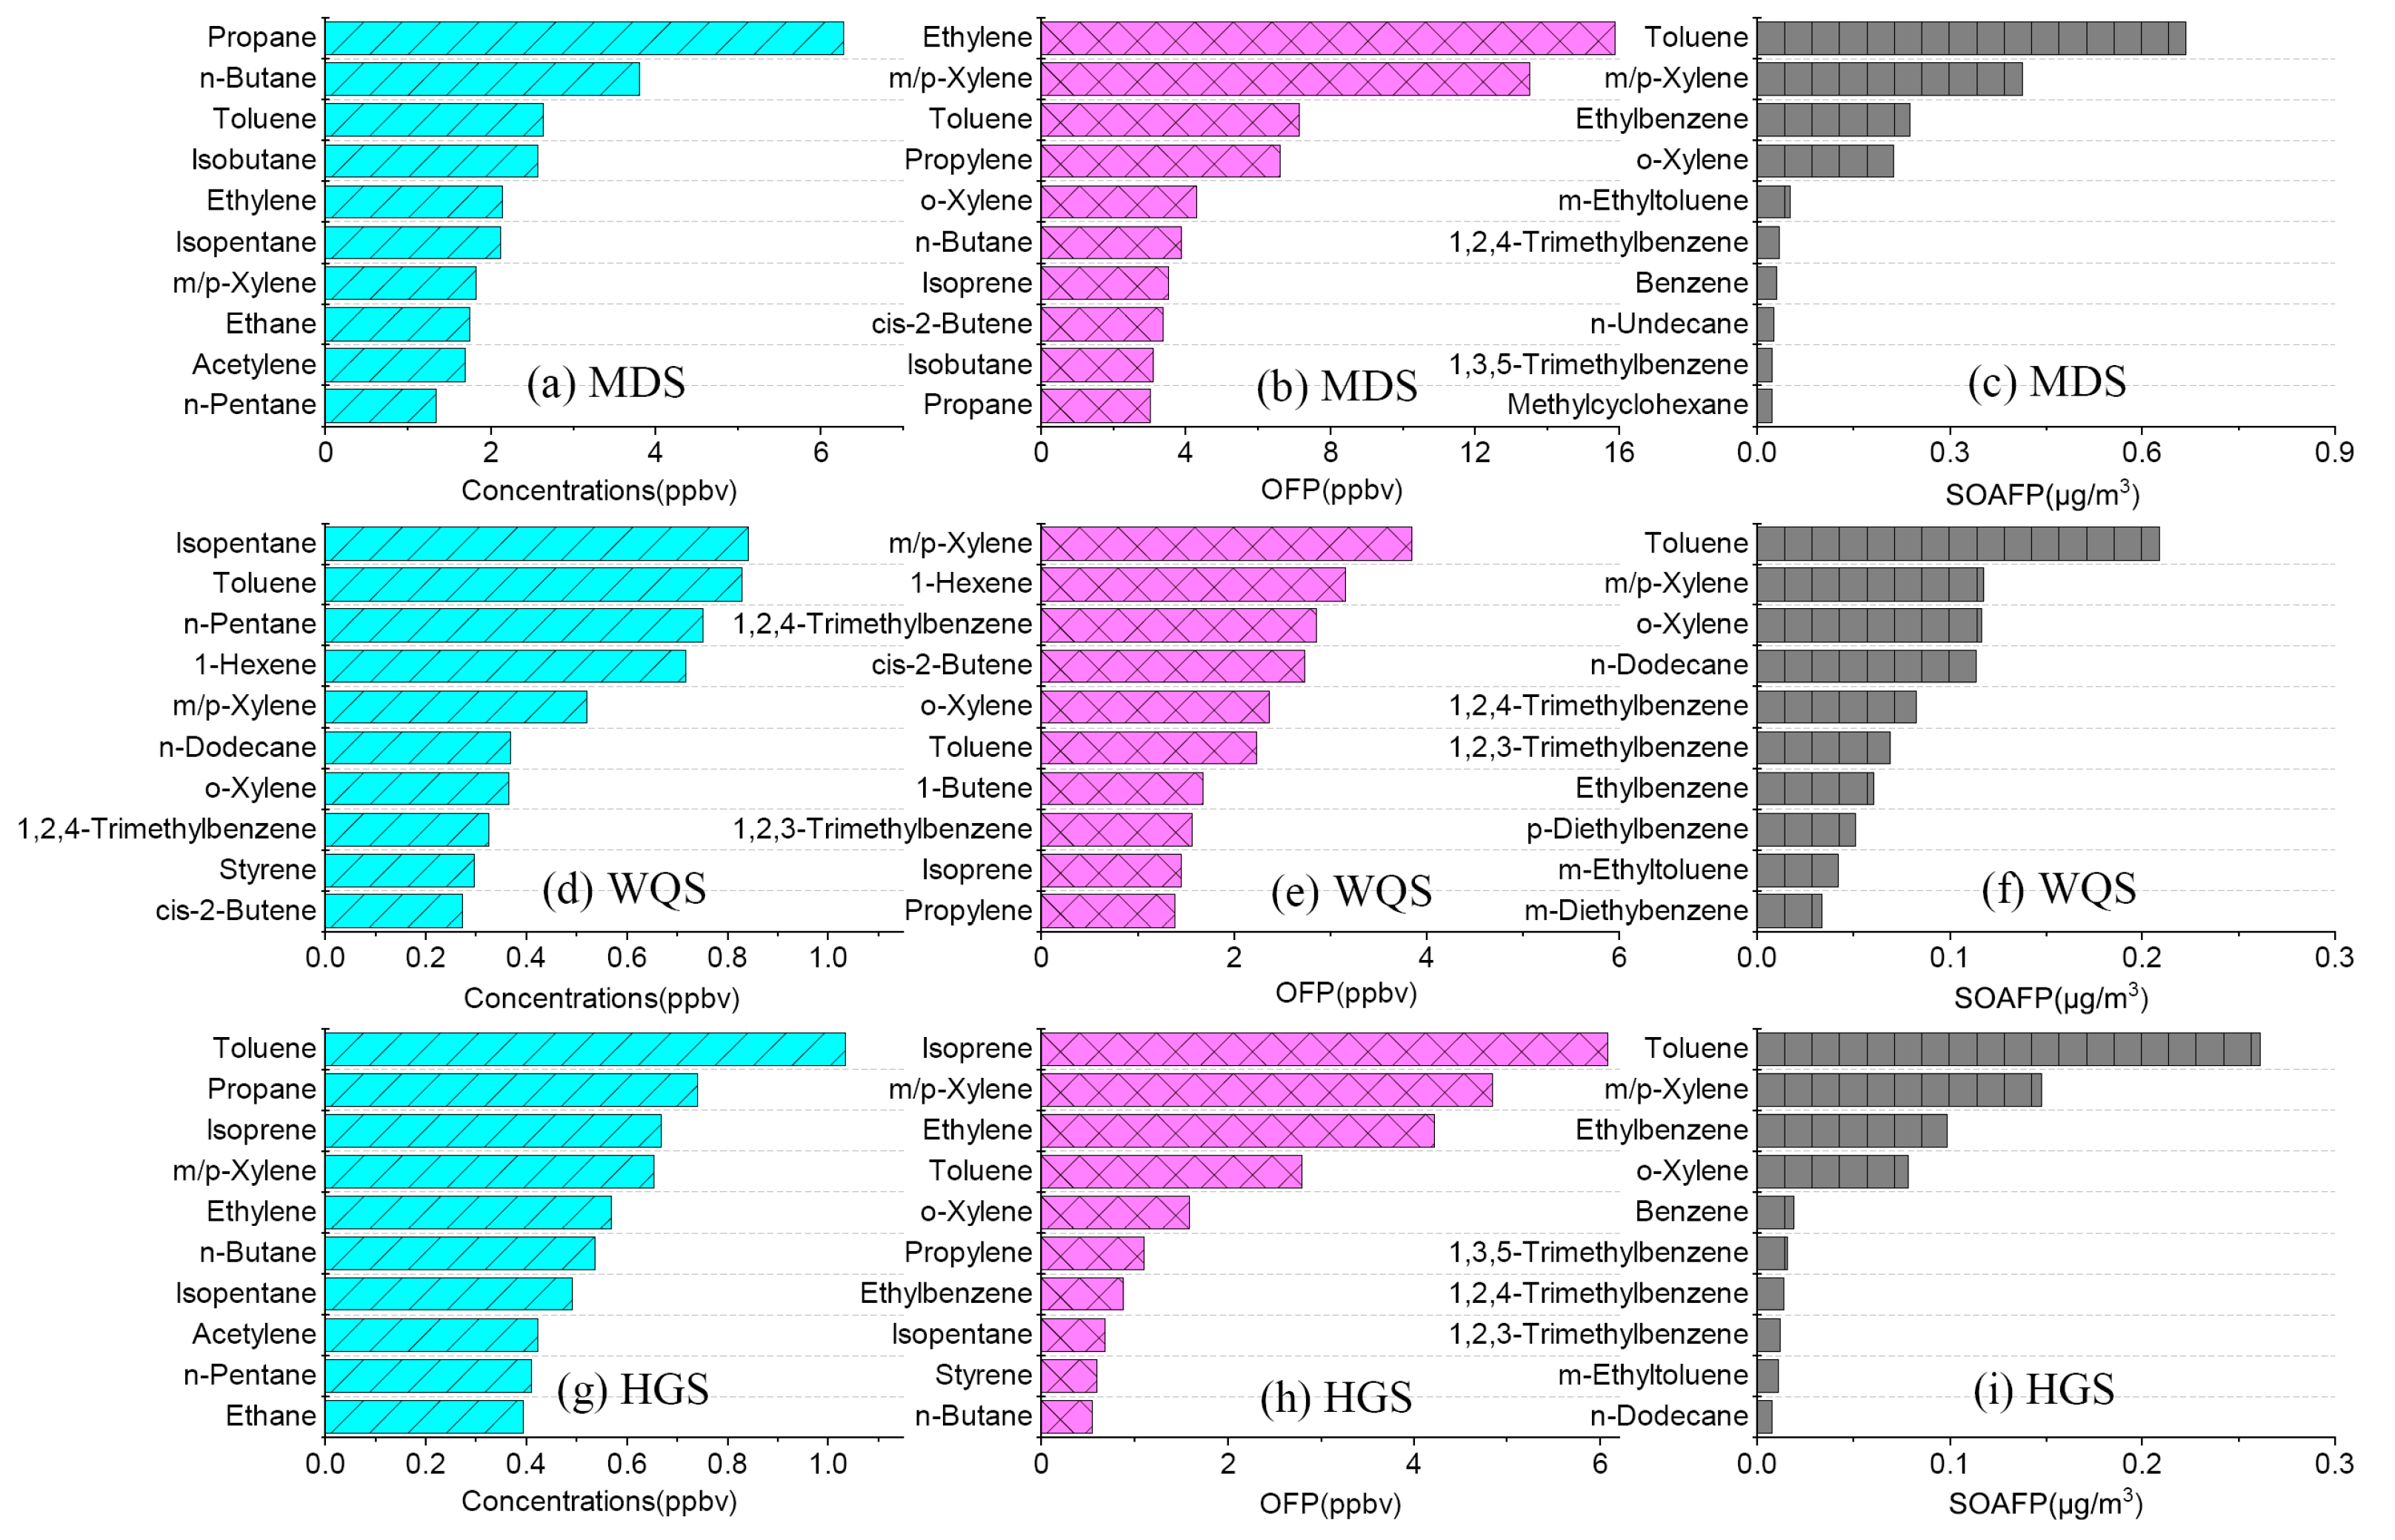
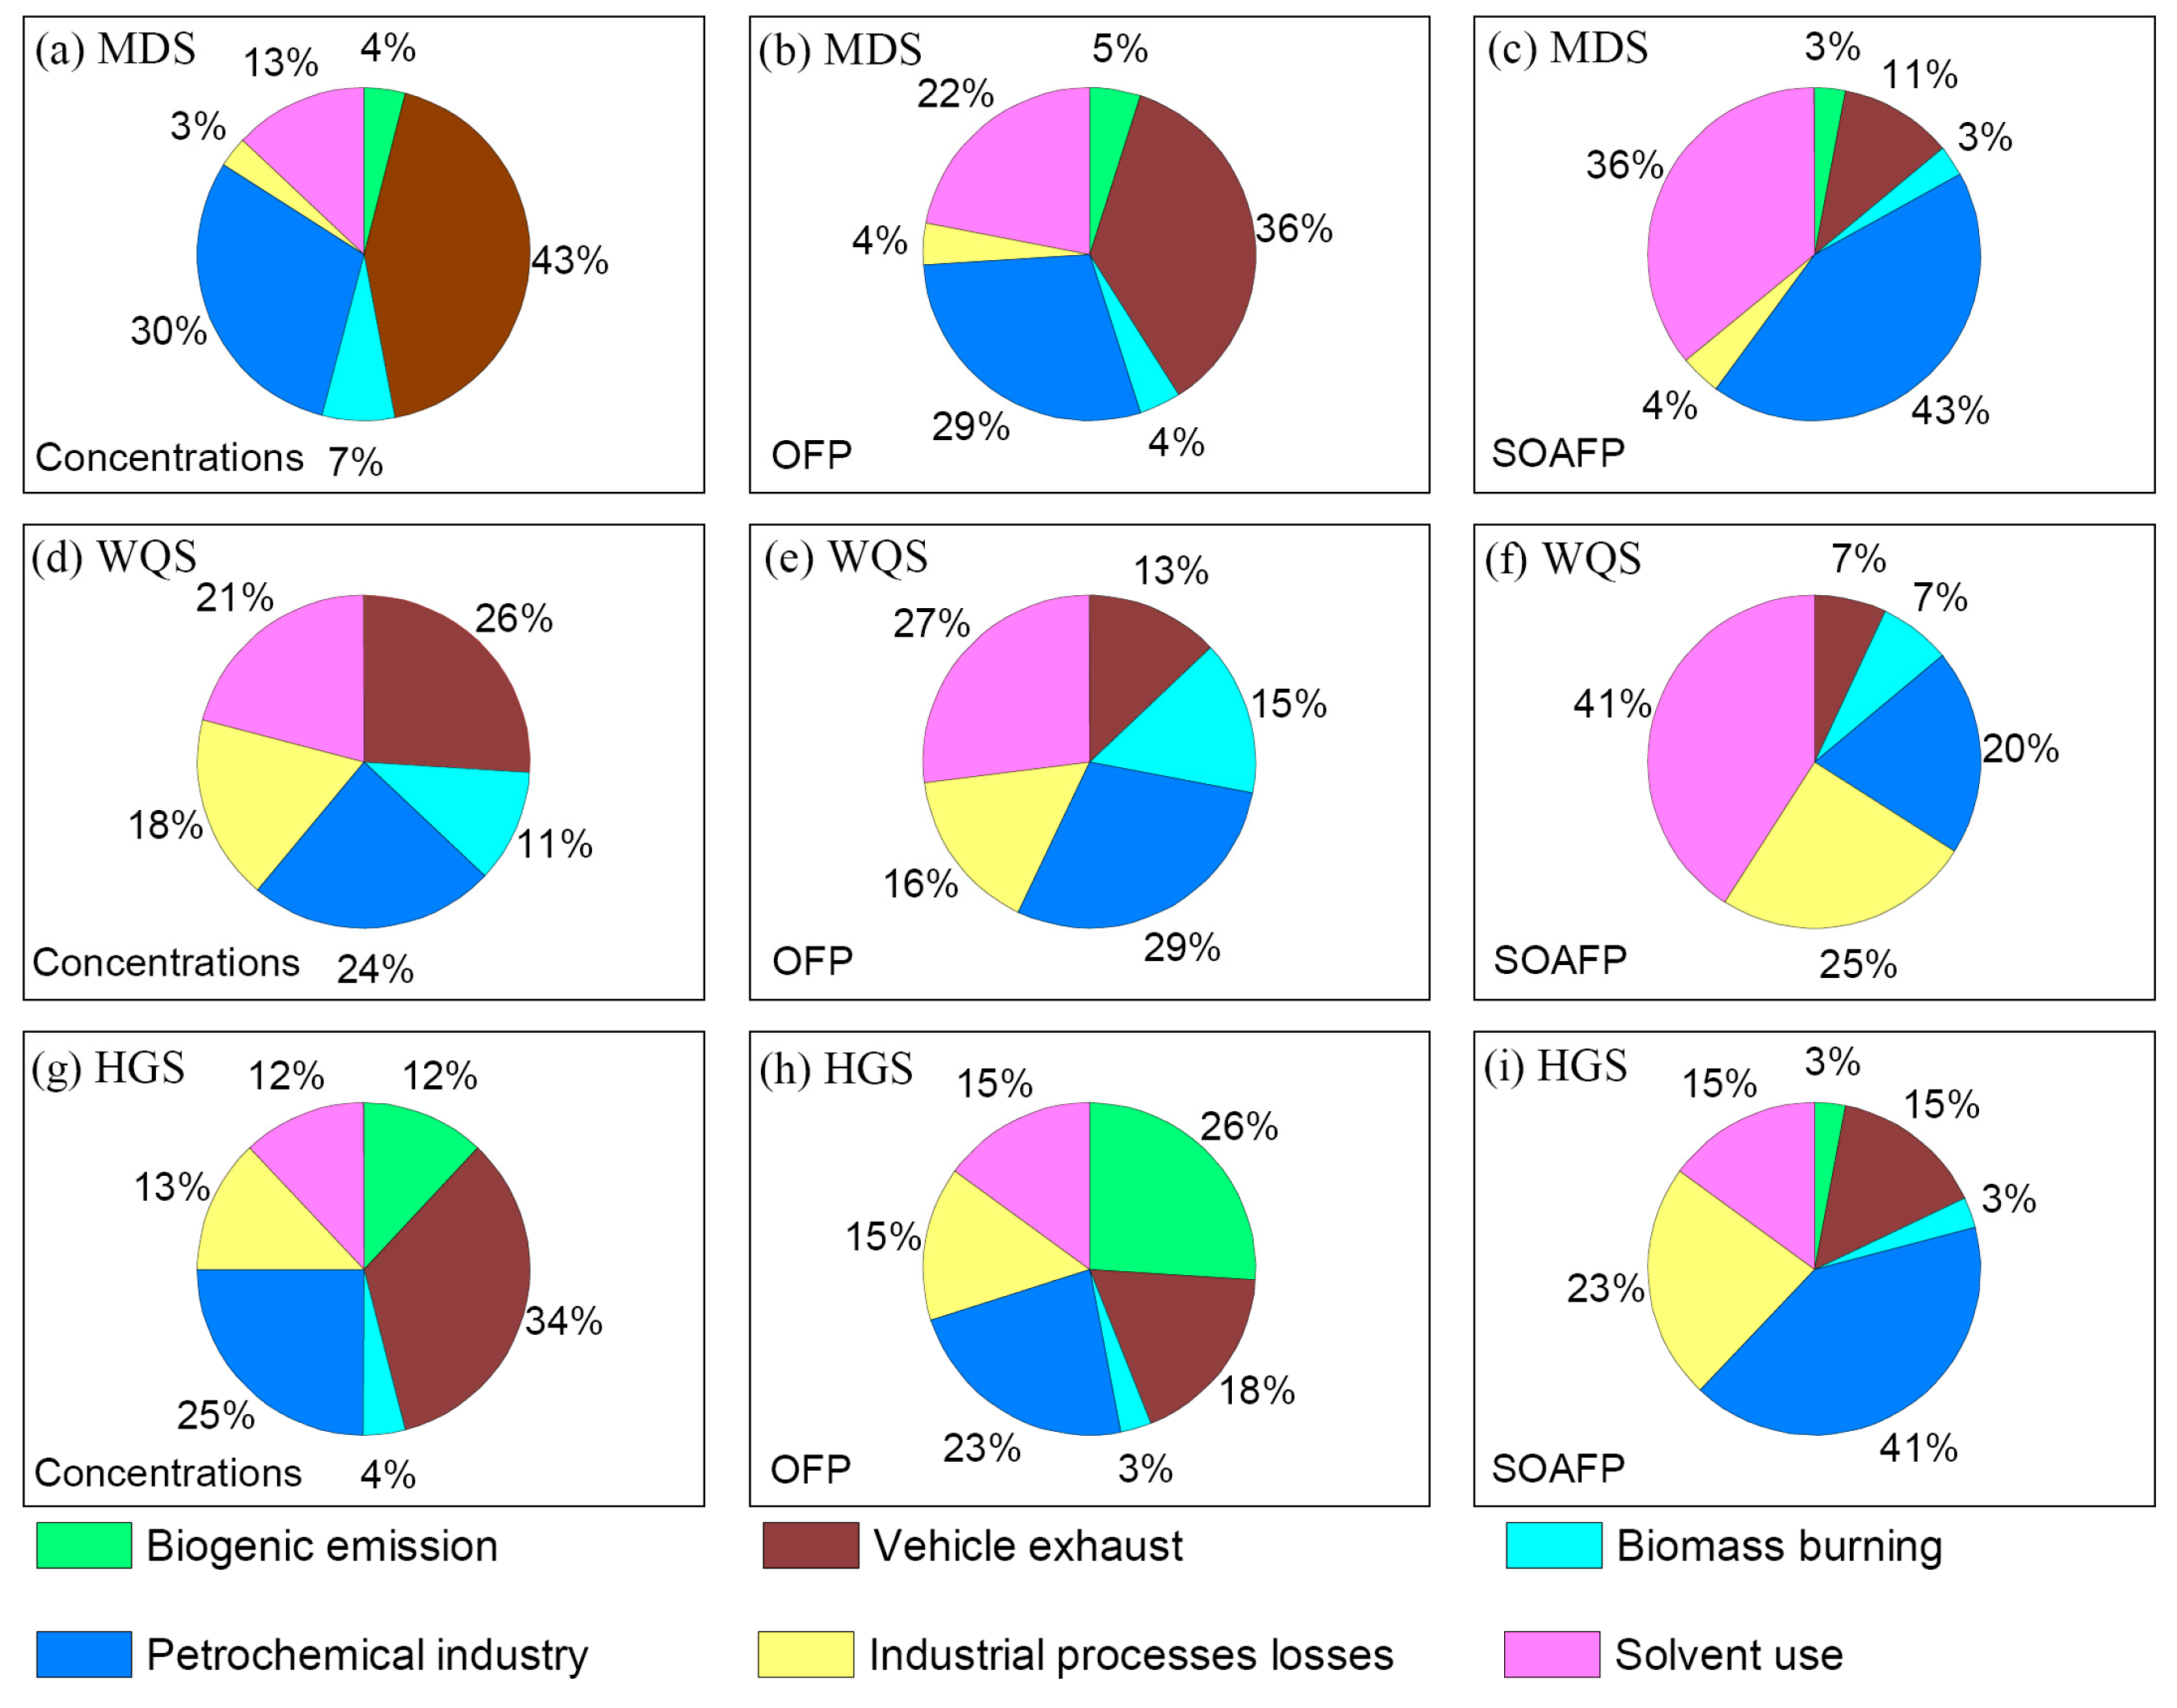
3.2. Compositions and Contributions to OFP and SOAFP

Figure 2 also shows the group compositions (alkanes, alkenes, alkyne and aromatics) of VOCs observed at the three sites. Alkanes were the most abundant with the proportions of 62.8%, 43.8% and 42.9%, followed by aromatics with shares of 20.2%, 36.6% and 35%, alkenes with shares of 12.1%, 19.4% and 17.1%, and alkynes with shares of 4.9%, 0.2% and 5%, respectively, at the MDS, WQS and HGS sites. The higher proportion of alkanes at the MDS site might reflect more contributions from liquefied petroleum gas (LPG)-related sources and vehicle emissions in the urban area [41], while the higher proportion of aromatics in the WQS and HGS sites might be related to stronger emissions in the surrounding areas from industrial point sources, most of which had been moved from urban areas to industrial parks in rural or suburban areas.
Figure 7 shows top 10 VOCs species in average mixing ratios at the three sites. At the MDS site, the LPG-related propane and n-butane were the most abundant VOC species, followed by toluene, isobutane, ethylene, isopentane, m/p-xylenes, ethane, acetylene and n-pentane. At the WQS site, isopentane, which is tracer of oil evaporation [21], was the most abundant VOC species, followed by toluene, n-pentane, 1-hexene, m/p-xylenes, n-dodecane, o-xylene. At the HGS site, toluene, which is a widely used solvent in industry [42], became the most abundant VOC species, followed by propane, isoprene, m/p-xylenes, ethylene, n-butane, isopentane, acetylene, n-pentane, ethane. It worth noting that isoprene at the HGS site ranked the third, indicating reasonably more biogenic emissions at this site on a vegetated mountain.
As for OFP contributed by VOC species at the three sites, consistent with previous studies [43,44,45,46,47,48], aromatics and alkenes were major contributors, and xylenes and toluene were among the most important aromatics, while ethylene, propylene, butene and isoprene were the most important alkenes (Figure 7). Ethylene contributed the most to OFP at the MDS site, followed by m/p-xylenes, toluene, propylene, o-xylene, n-butane, isoprene, cis-2-butene, isobutane and propane. At the HGS site isoprene contributed the most to OFP, followed by m/p-xylenes, ethylene, toluene, o-xylene, propylene, ethylbenzene, isopentane, styrene and n-butane. At the WQS site, m/p-xylenes contributed the most to OFP, followed by 1-hexene, 1,2,4-trimethylbenzene, cis-2-butene, o-xylene, toluene and 1-butene.
As aromatics are most important anthropogenic precursors to SOA [49,50,51], toluene and xylenes were reasonably found to contribute the most to SOAFP at the three sites. At the MDS and HGS sites, toluene, ethylbenzene and xylenes contributed more than 80% of the total SOAFP, while at the WQS site, toluene, m/p-xylenes, o-xylene, n-dodecane, 1,2,4-trimethylbenzene, 1,2,3-trimethylbenzene, ethylbenzene, p-diethylbenzene, m-ethyltoluene and m-diethylbenzene are the top 10 species in their contributions to SOAFP.

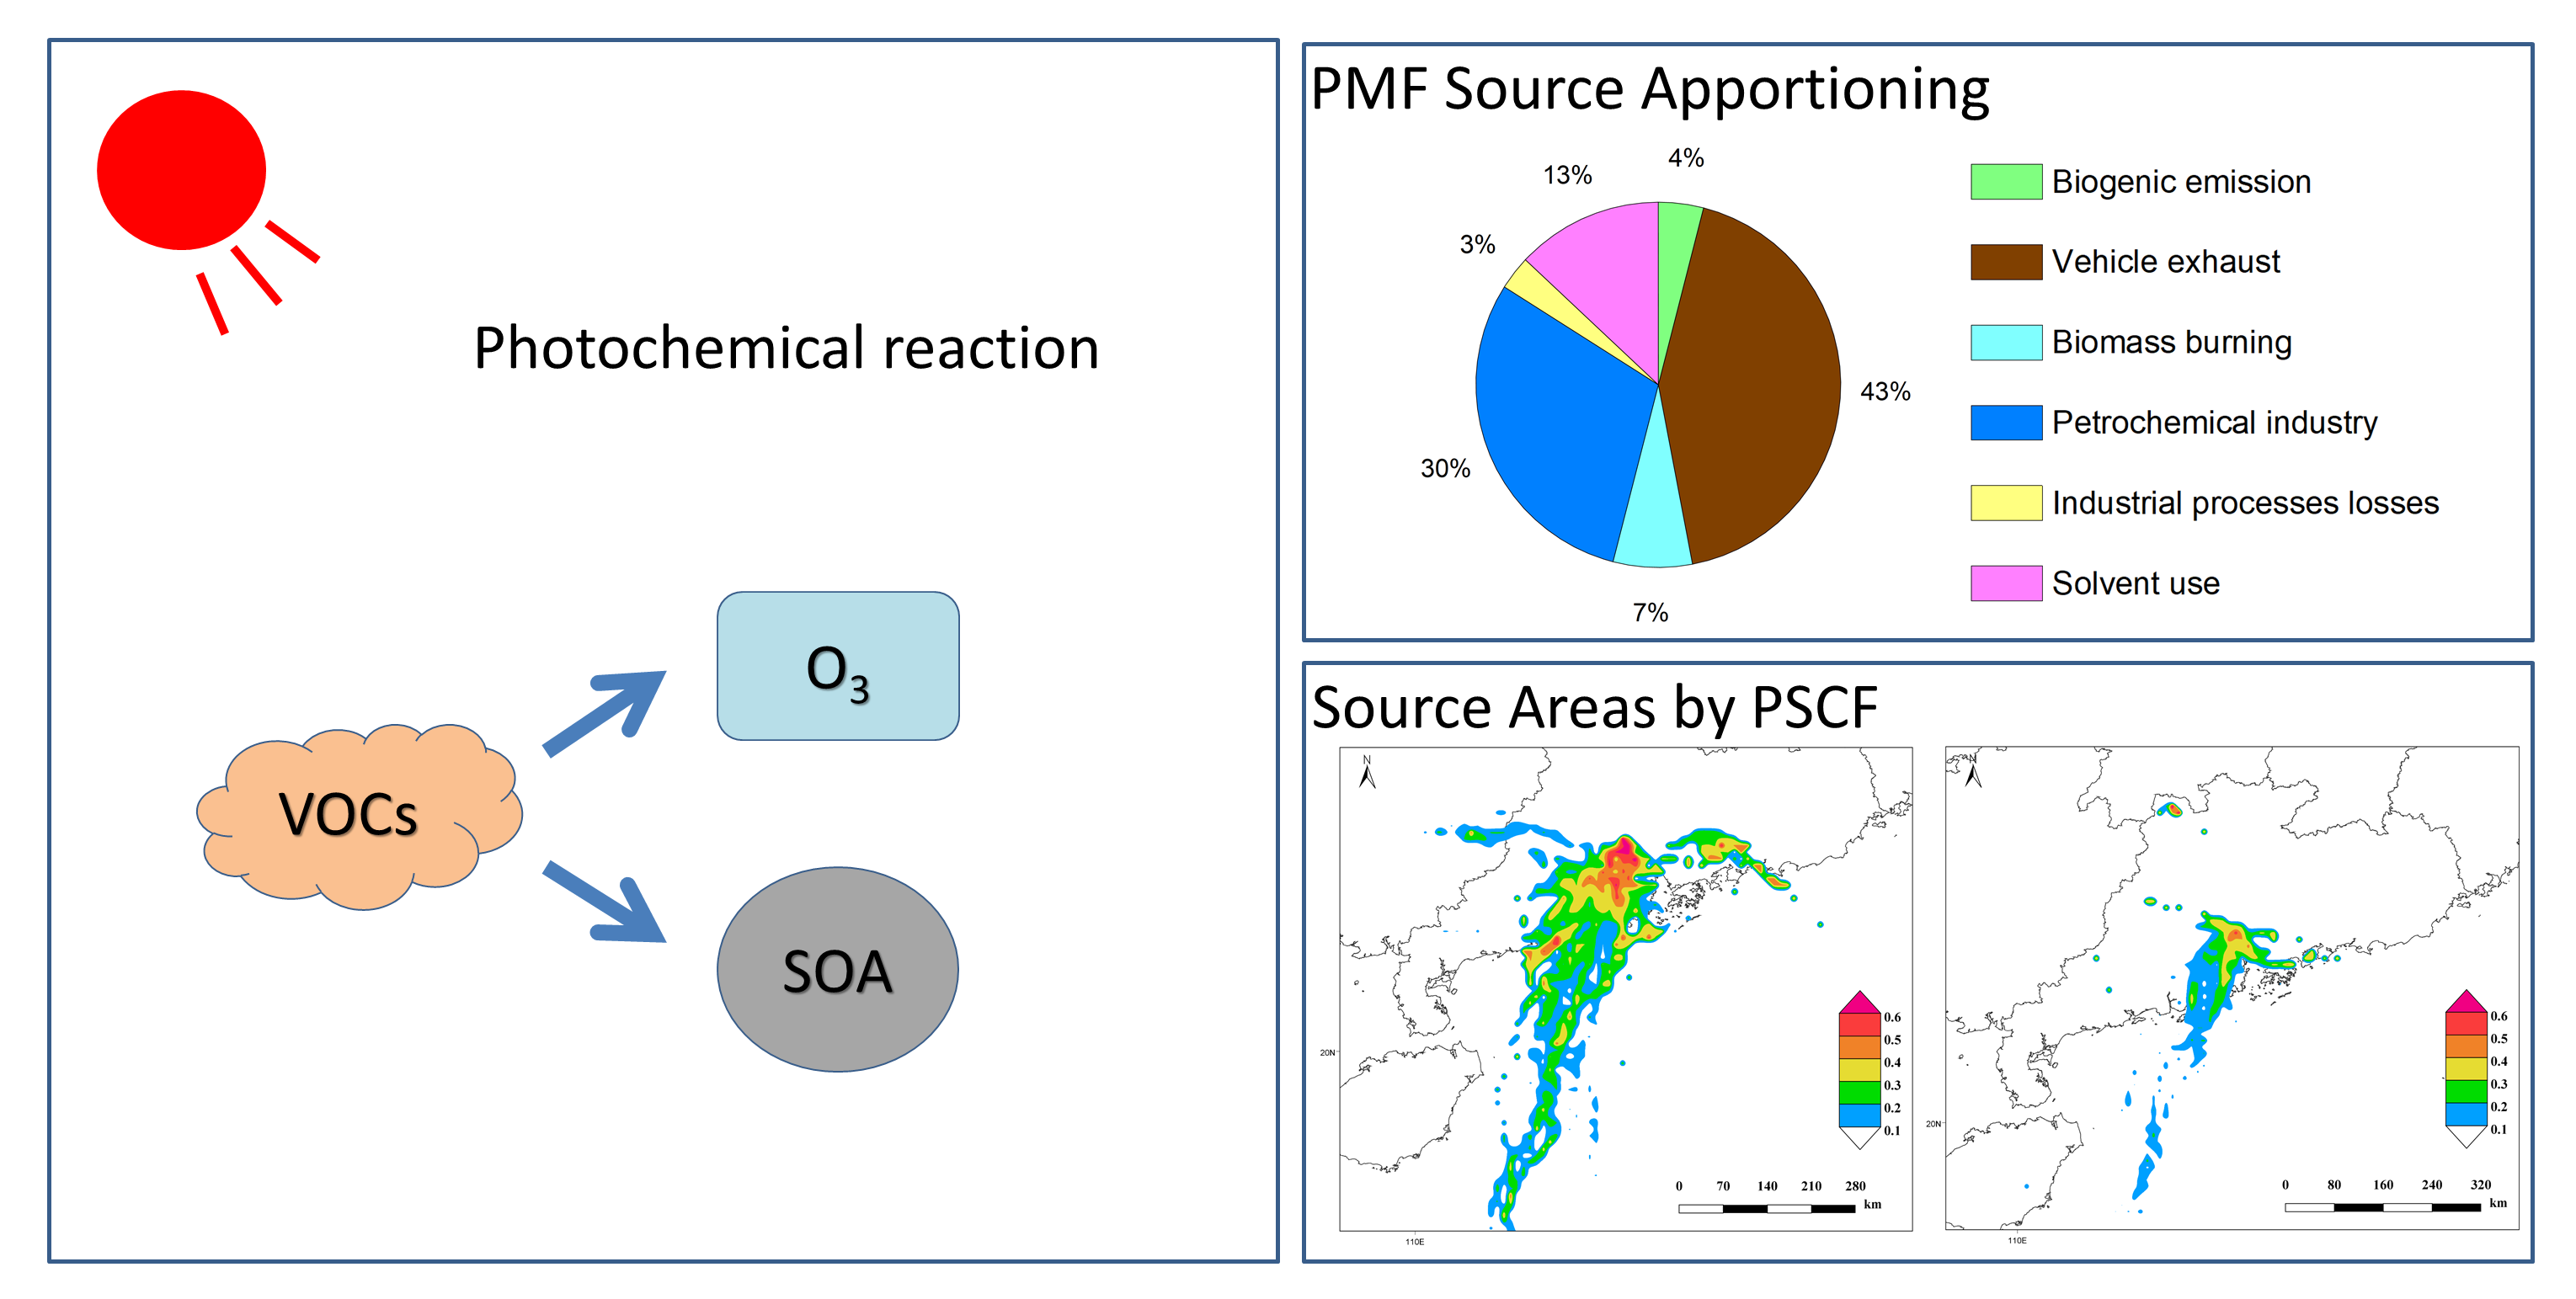
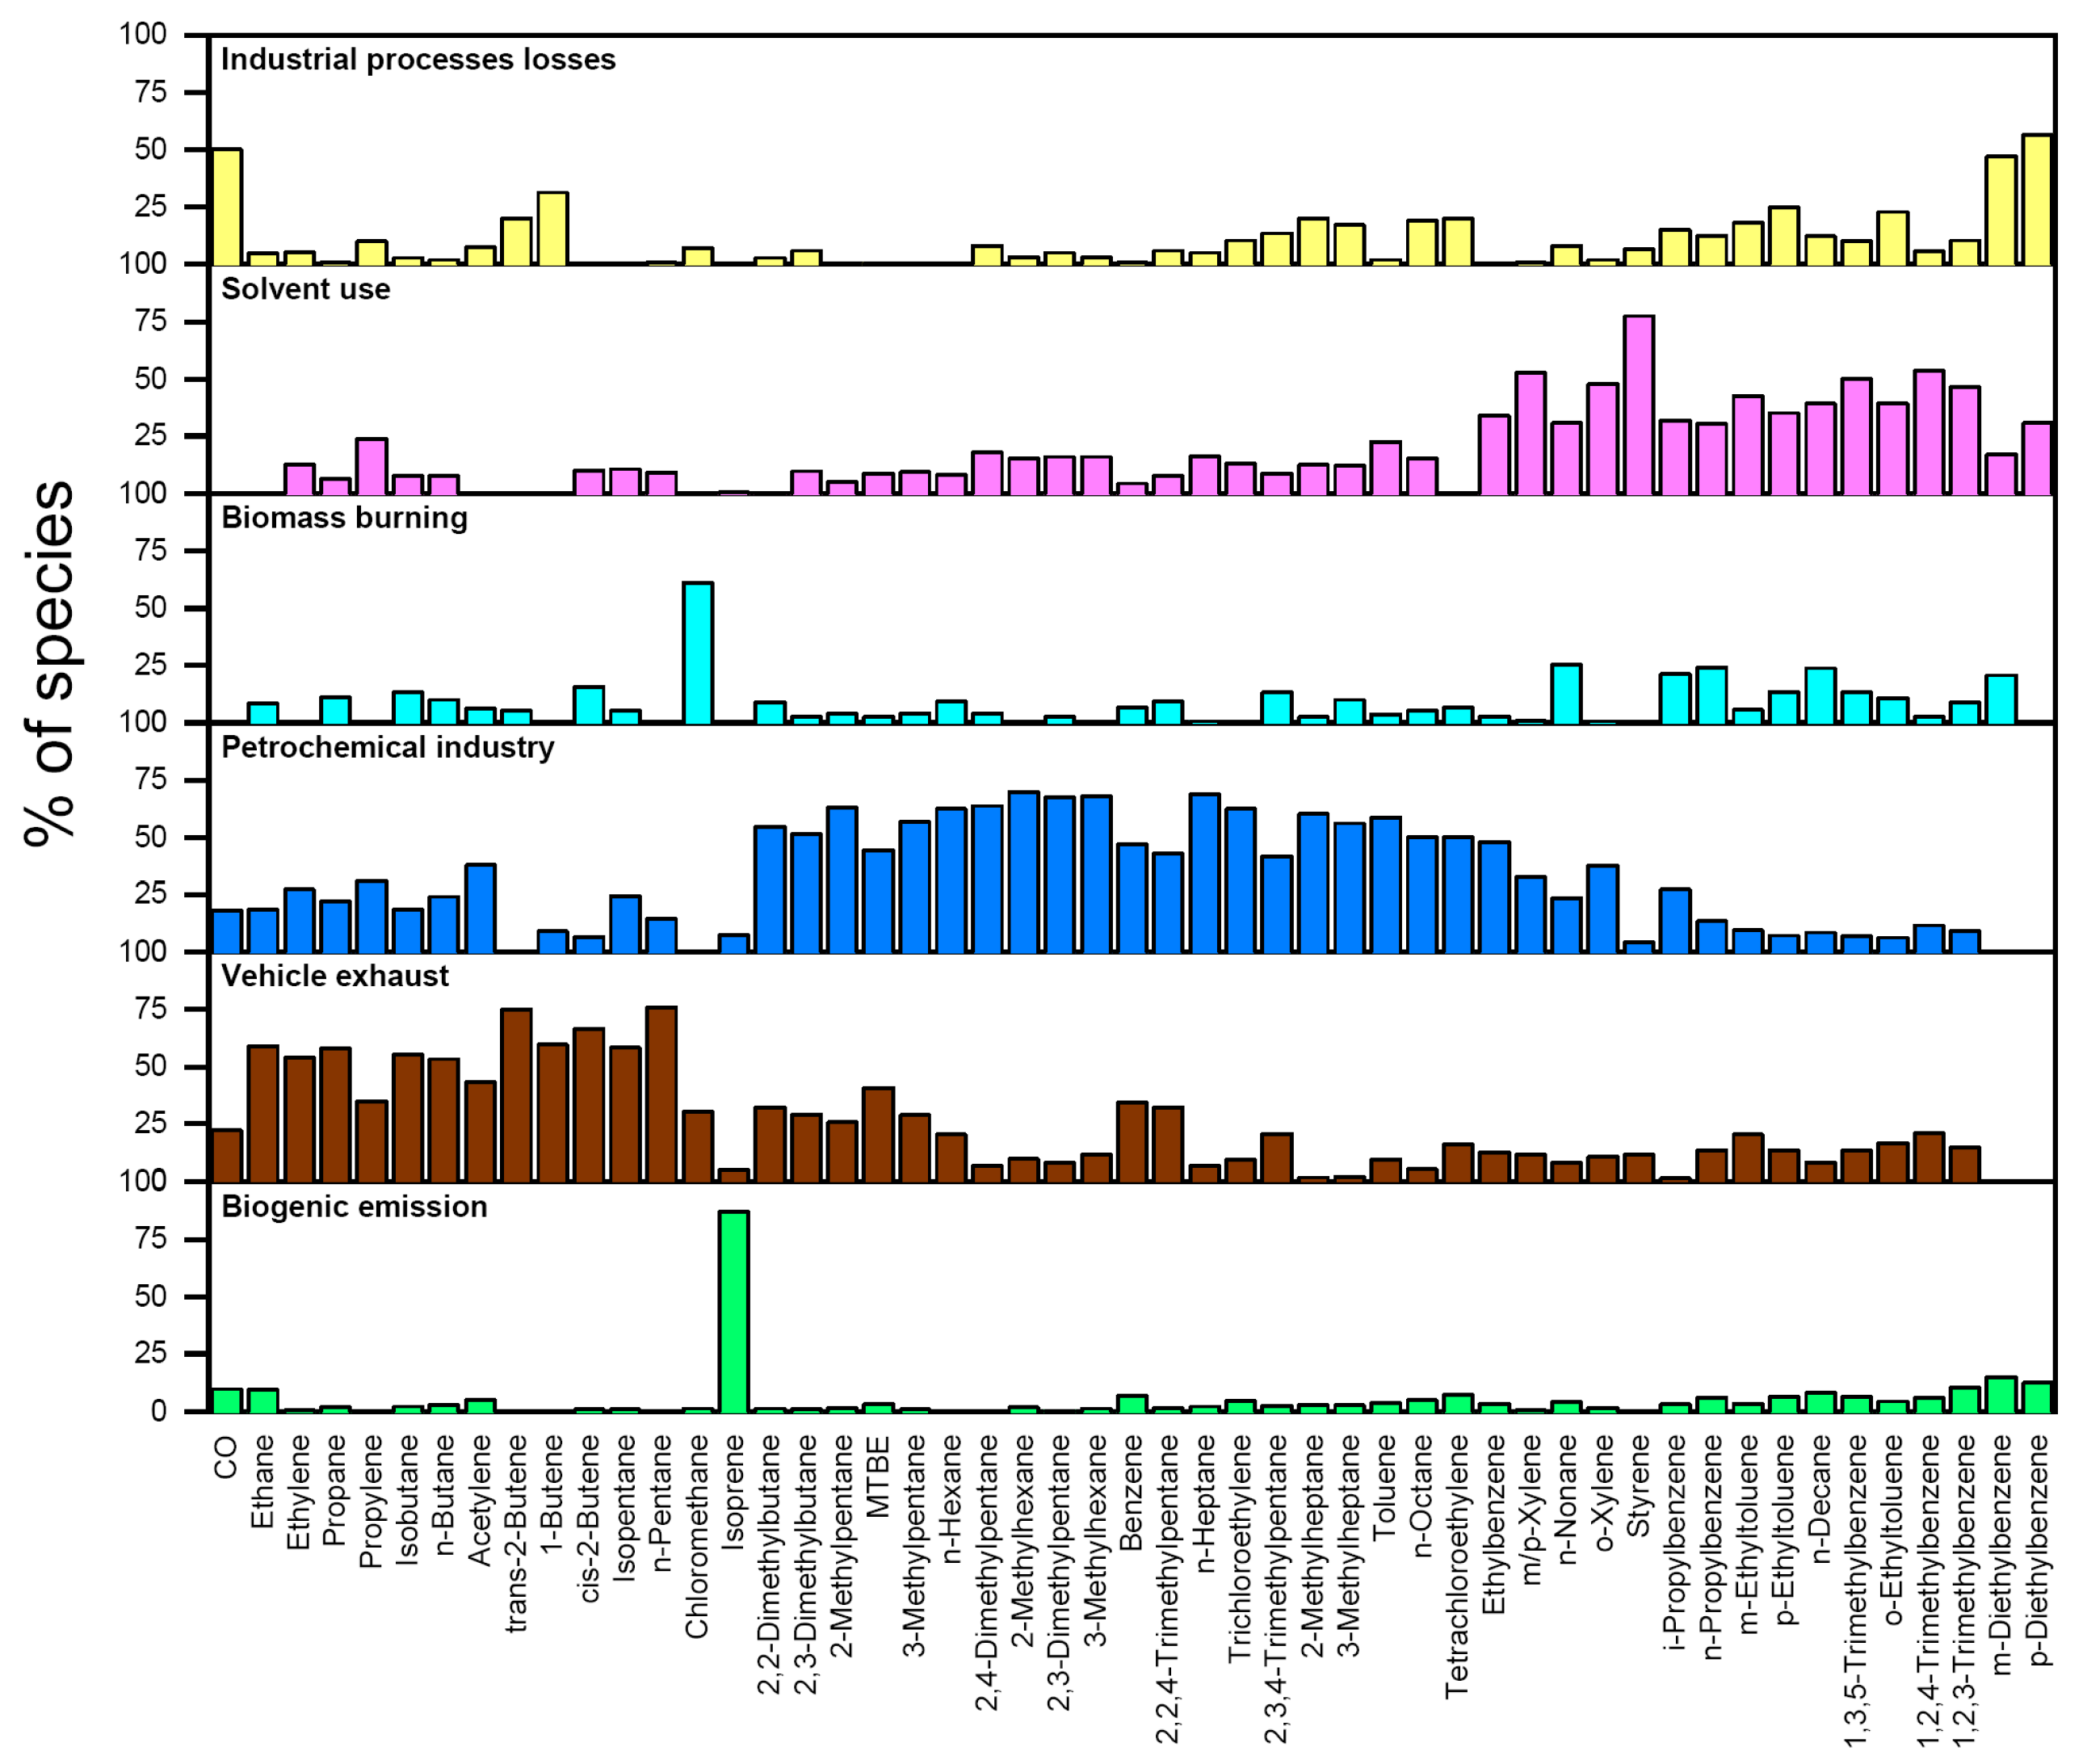
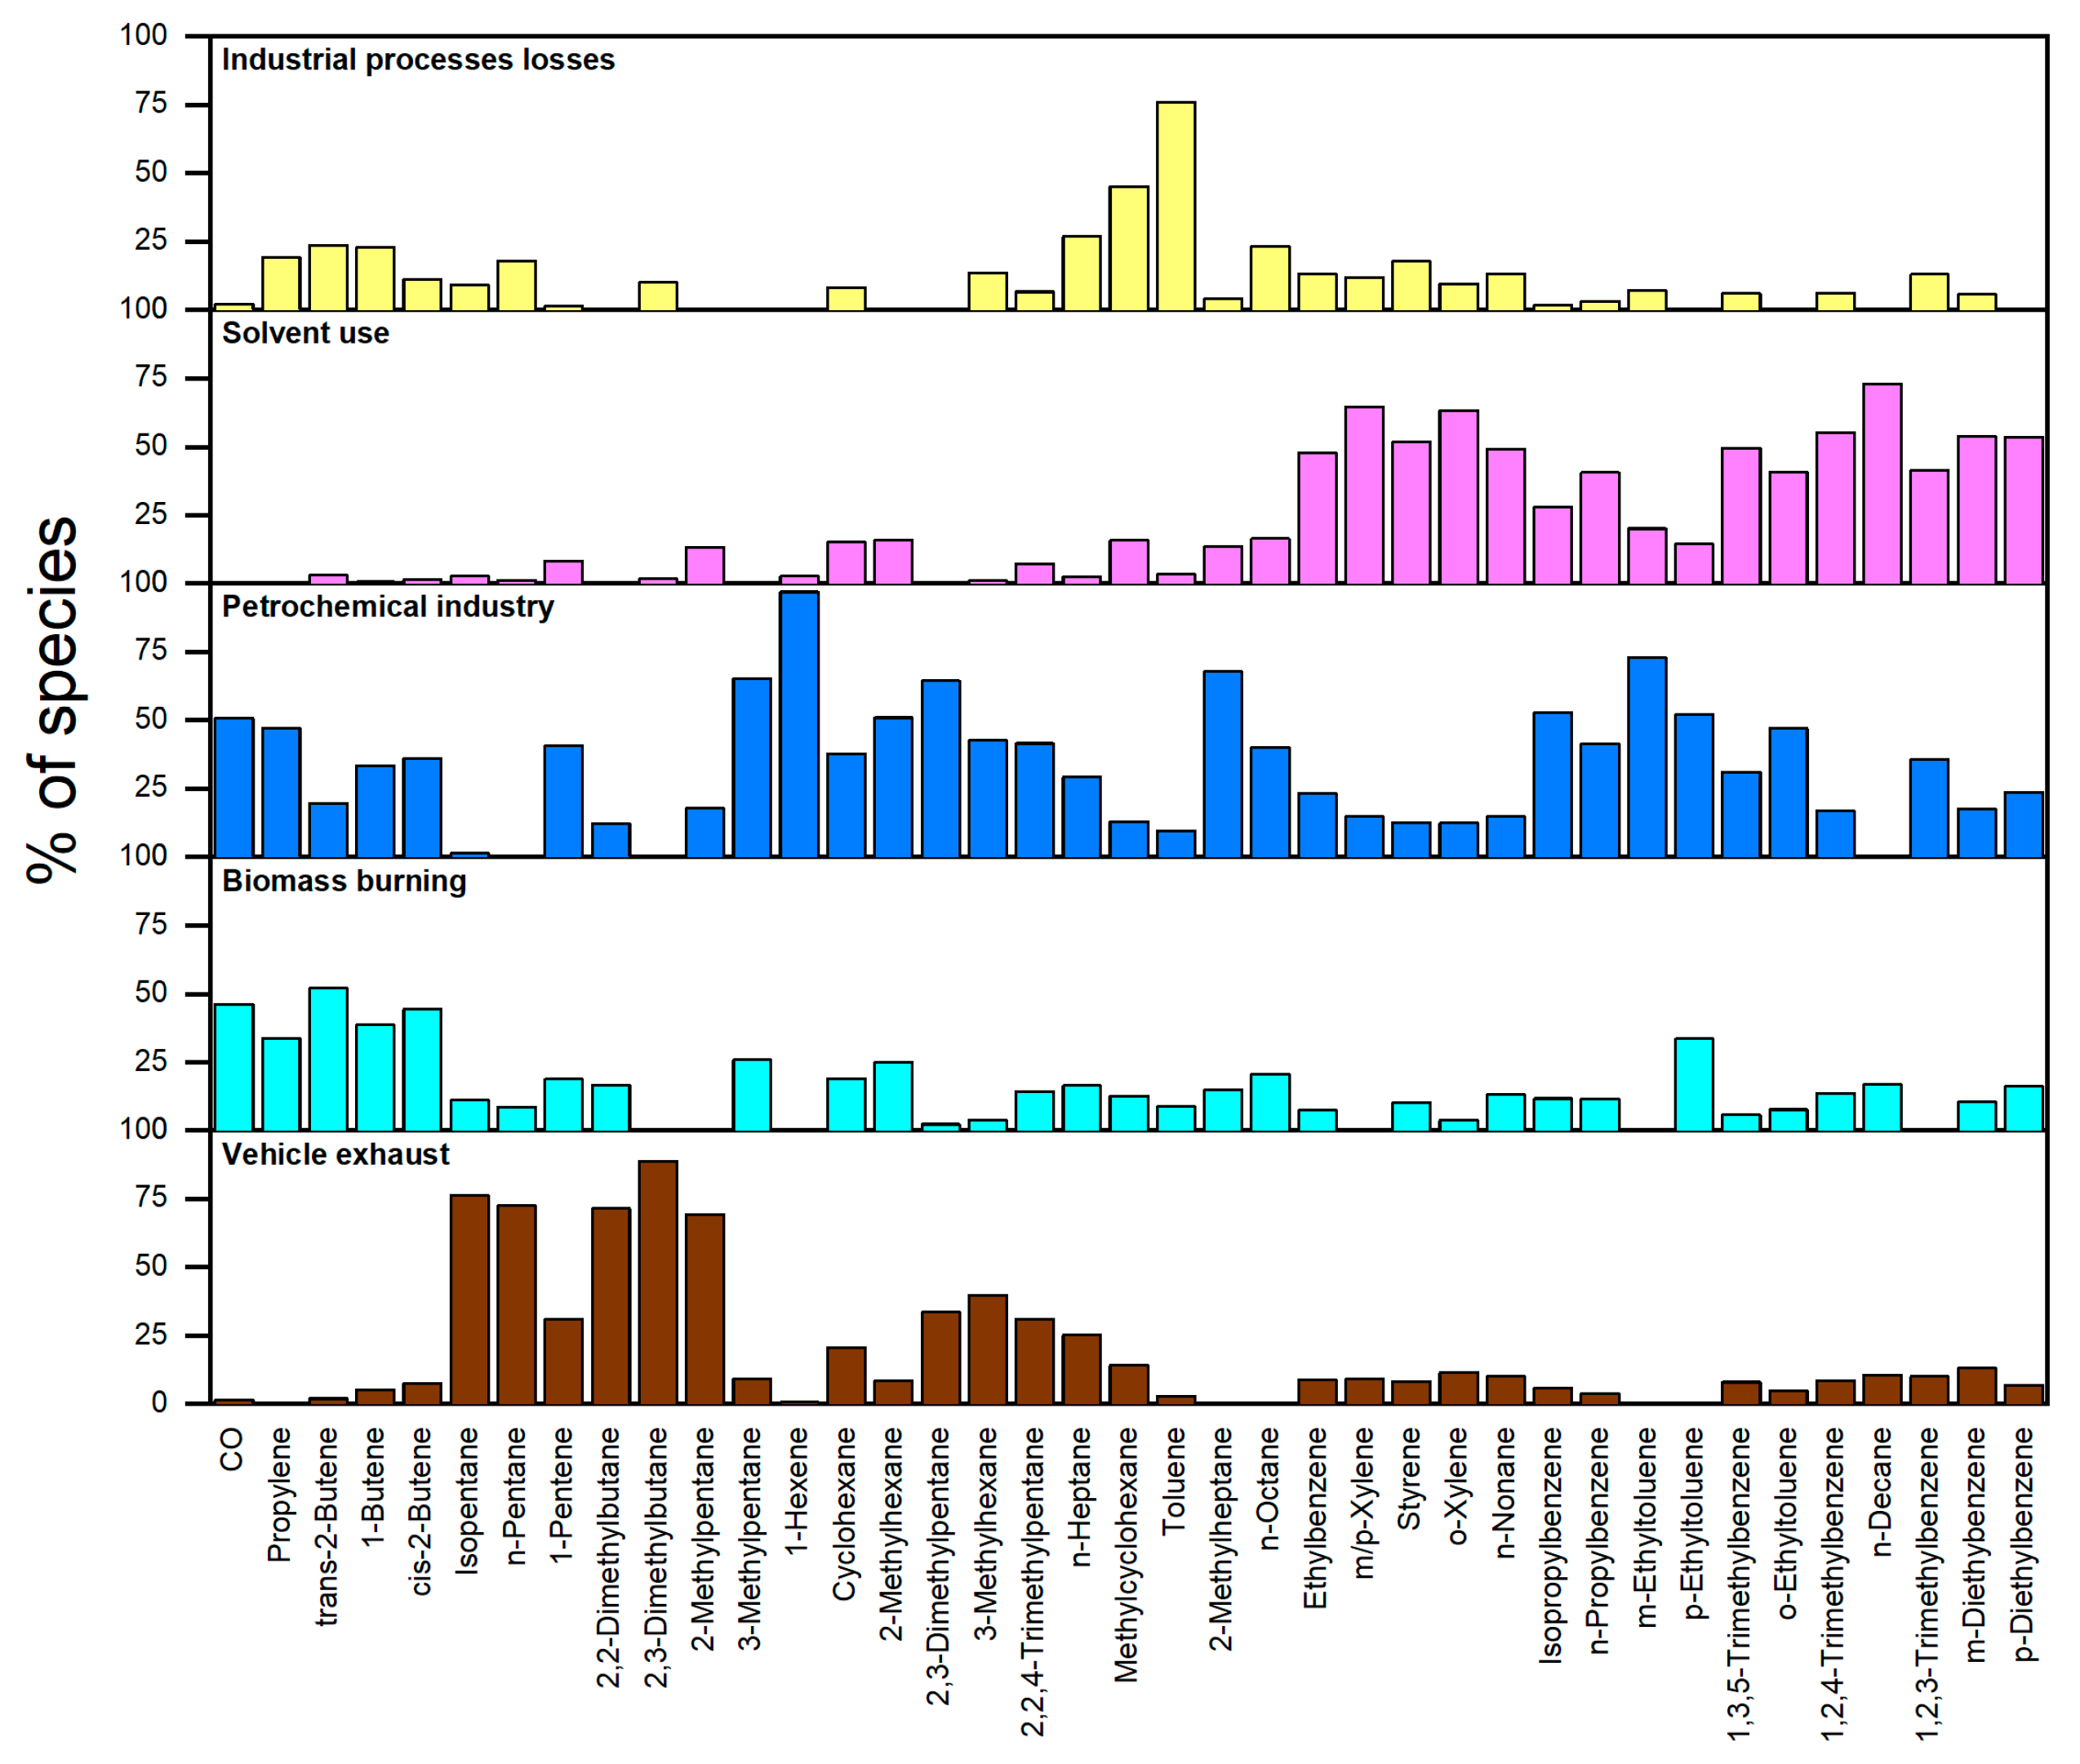
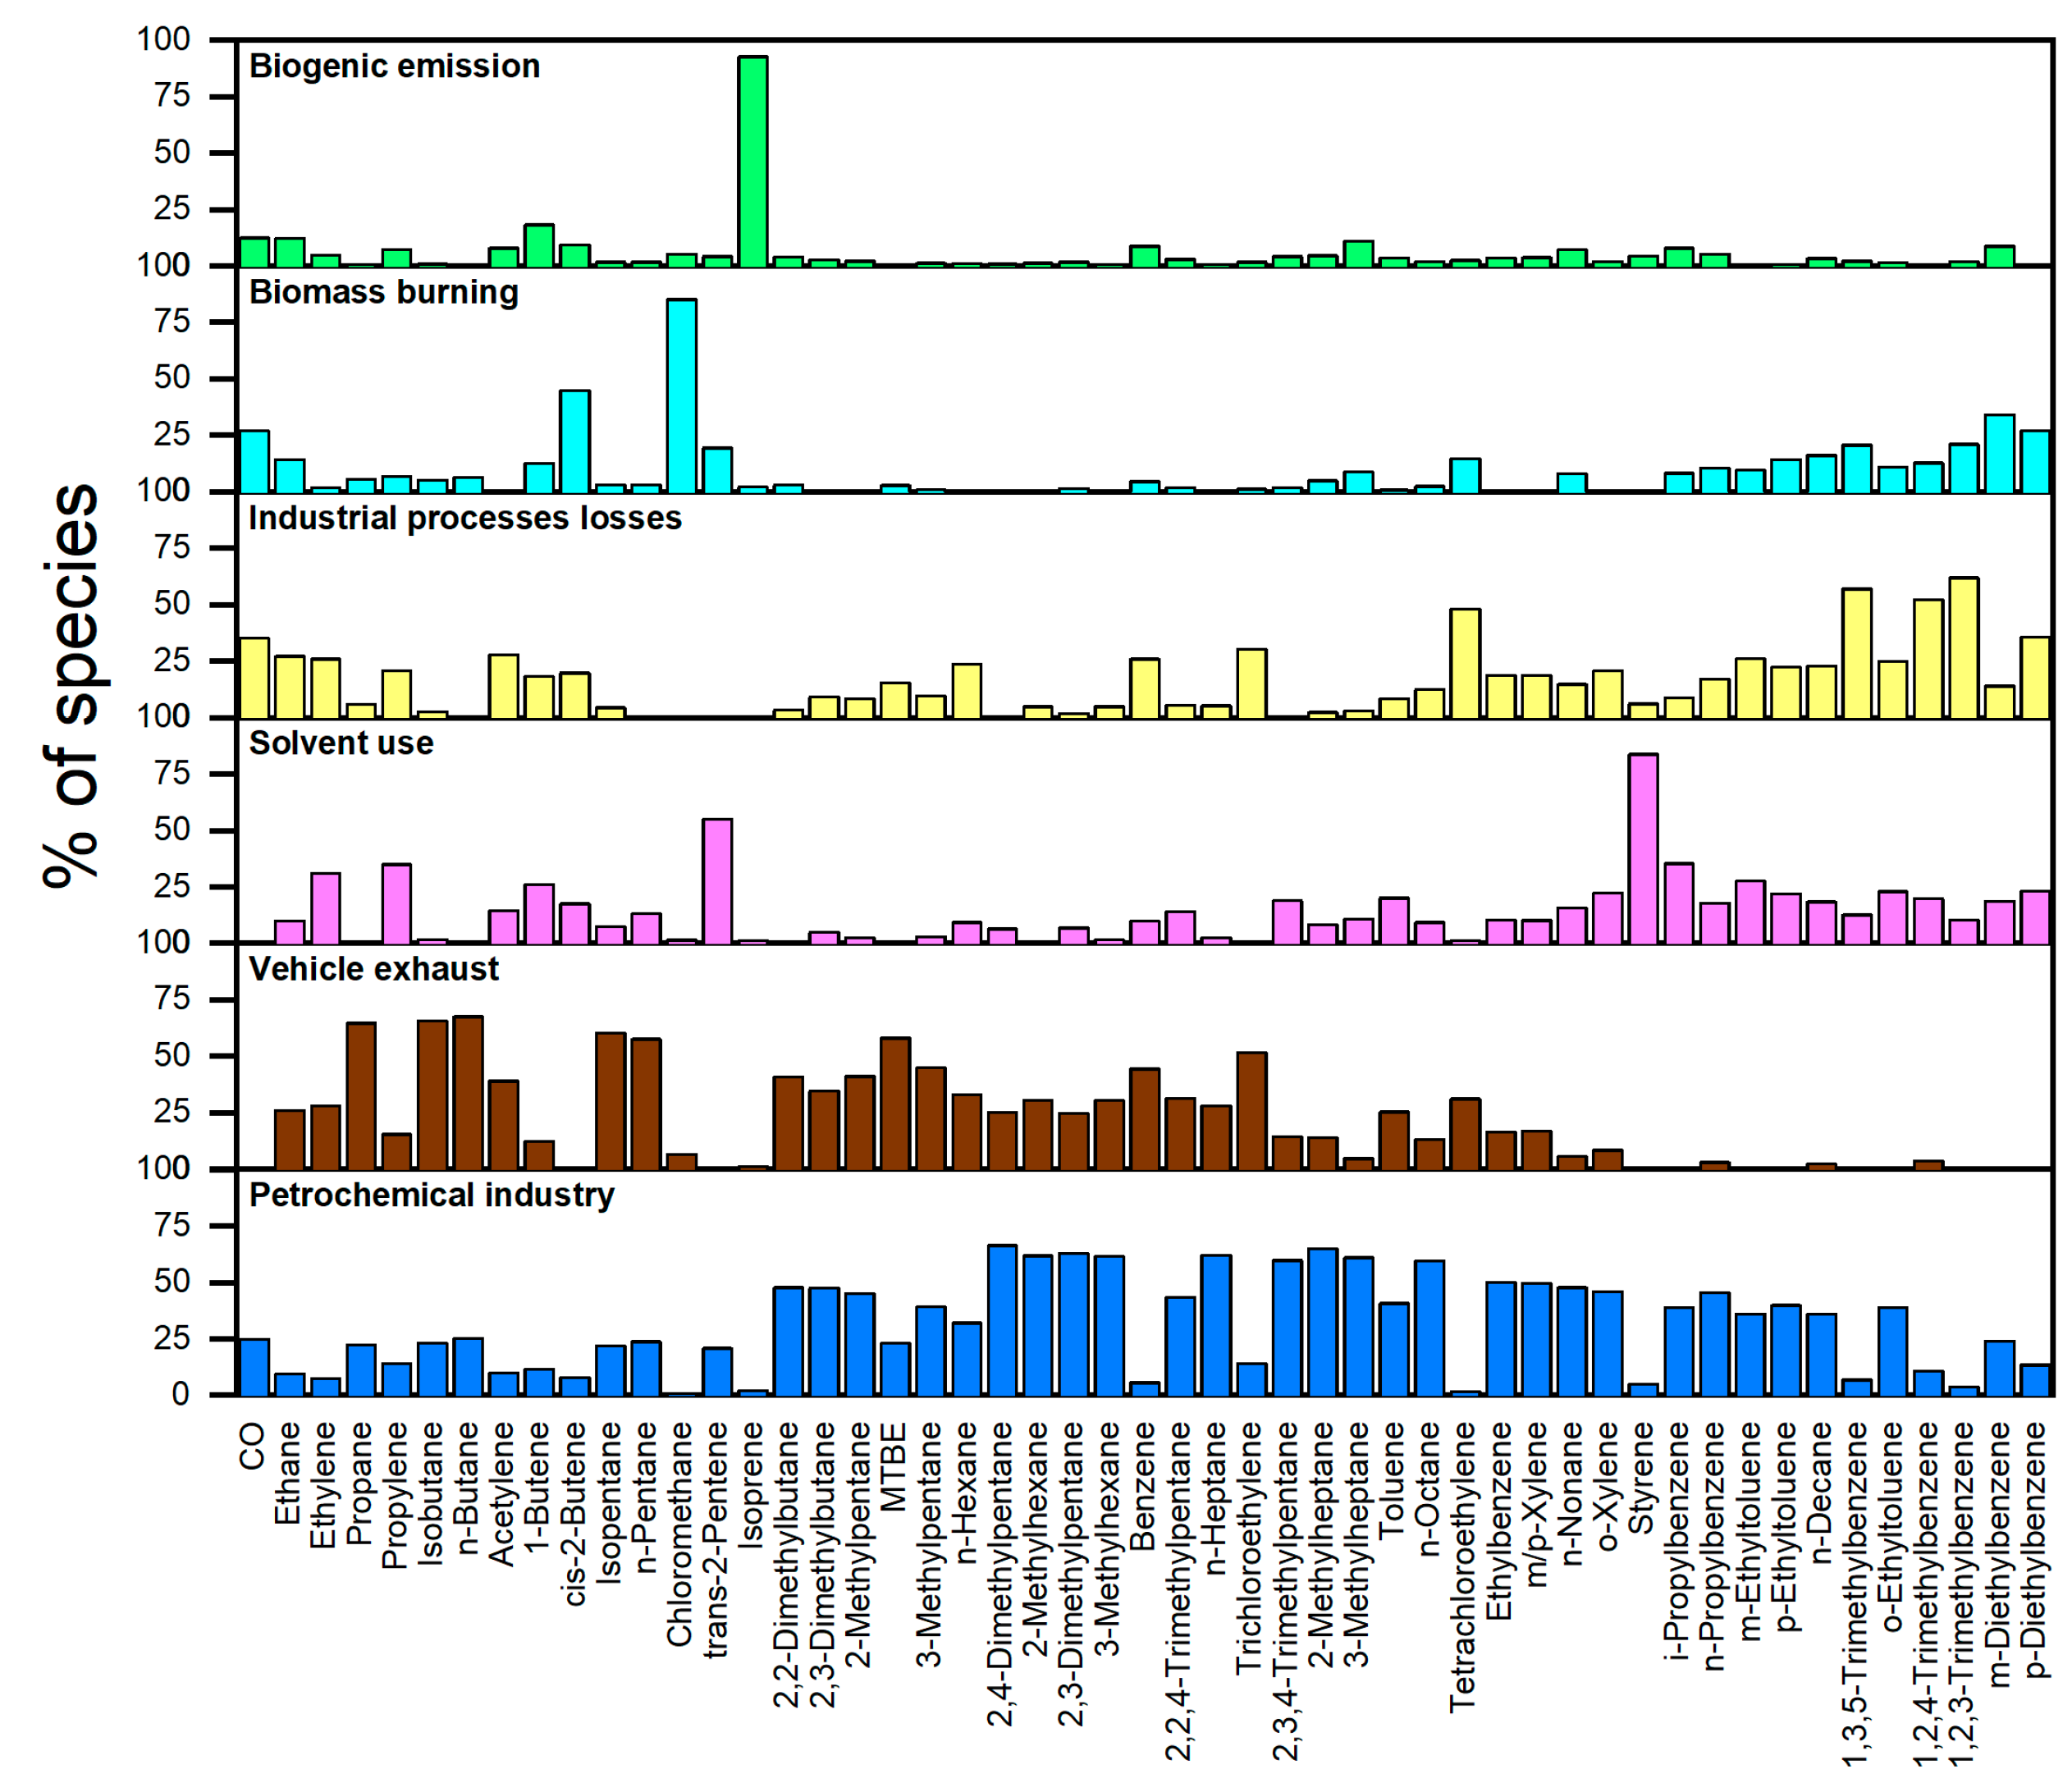
3.3. Source Attributions by PMF

Figure 8 shows the source profiles resolved by PMF at the MDS site. Factor 1 shows a higher contribution by C8- and C9-aromatics and substantial contributions by trichloroethylene and tetrachloroethylene, therefore it may be related to industrial process losses [31]. Factor 2 is characteristic of higher proportions of aromatics such as toluene, styrene and ethylbenzene that are generally used as solvents [52,53], and it can be termed solvent use. Chloromethane, which is a marker of biomass burning [53,54,55], contributes the most in the Factor 3, and some alkenes and aromatic hydrocarbons also occurs in the Factor 3 [56]. Therefore, Factor 3 is considered as biomass burning. Ethylene, acetylene, ethane and 1-butene, as well as 2-methylhexane, n-heptane and methyl cyclohexane, which might be related to oil cracking process [57,58], are present in the Factor 4. Therefore, Factor 4 is regarded as petrochemical industry emissions. Factor 5 shows highest contributions by propane, isobutane and n-butane, which are markers of LPG-related emissions [59] and also among most abundant species from on-road vehicle fleets with a considerable portion of LPG-fueled buses and taxies [41], meanwhile MTBE, a tracer of gasoline-related emissions [43], and vehicle exhaust related C5 and C6 alkanes [43,60], are also present in the Factor 5. So Factor 5 represents vehicular emissions. Isoprene from plant emissions [55] contributes the most in the Factor 6, which is thus biogenic emission. Figure 9 and Figure 10 show source profiles resolved by PMF at the WQS and the HGS sites, respectively. Similarly emission sources are identified based on the factor profiles.
Figure 11 shows contributions by major emission sources at the three sites. At the MDS site, vehicle exhaust contributed the most with a percentage of 43%, followed by petrochemical emissions (30%) and solvent use (13%). At the WQS site, vehicle exhaust also contributed the most but with a percentage of 26%, while petrochemical industry, solvent use, industrial processes losses and biomass burning accounted for 24%, 21%, 18%, and 11%, respectively. At the HGS site, vehicle exhaust was again the largest contributor (34%), followed by petrochemical emissions (25%), industrial processes losses (13%), solvent use (12%) and biogenic emissions (12%). Higher contribution of biogenic emission at the HGS site is reasonable as the site is mostly surrounded by forests.
With contributions to VOCs by different sources, the contribution of different emission sources to OFP can be further calculated. Solvent use instead contributed most to OFP at the MDS site due to a large number of more photochemically reactive VOCs species in this source. At the WQS site, the contribution of petrochemical emissions, solvent use and industrial process losses contributed more to OFP than vehicle exhaust, and accounted for 29%, 27% and 16% of total OFP, respectively, indicating that industry-related emissions played a major role in OFP at the WQS site. At the HGS site, the biogenic emission however ranked first in the contributions to OFP, reaching an average percentage of 26%.
Accordingly the contribution of different emission sources to SOAFP can also be calculated. At MDS site, SOAFP was largely attributed to petrochemical emission (43%) and solvent use (36%), while vehicle exhaust only contributed 11%. At the WQS site, the contribution percentages of solvent use, industrial process losses and petrochemical emission are 41%, 25% and 20%, respectively. At the HGS site, petrochemical emission and industrial processes losses also contributed the most to SOAFP, with shares of 41% and 23%, respectively. In general, SOAFP was largely contributed by VOCs from industry related emissions.

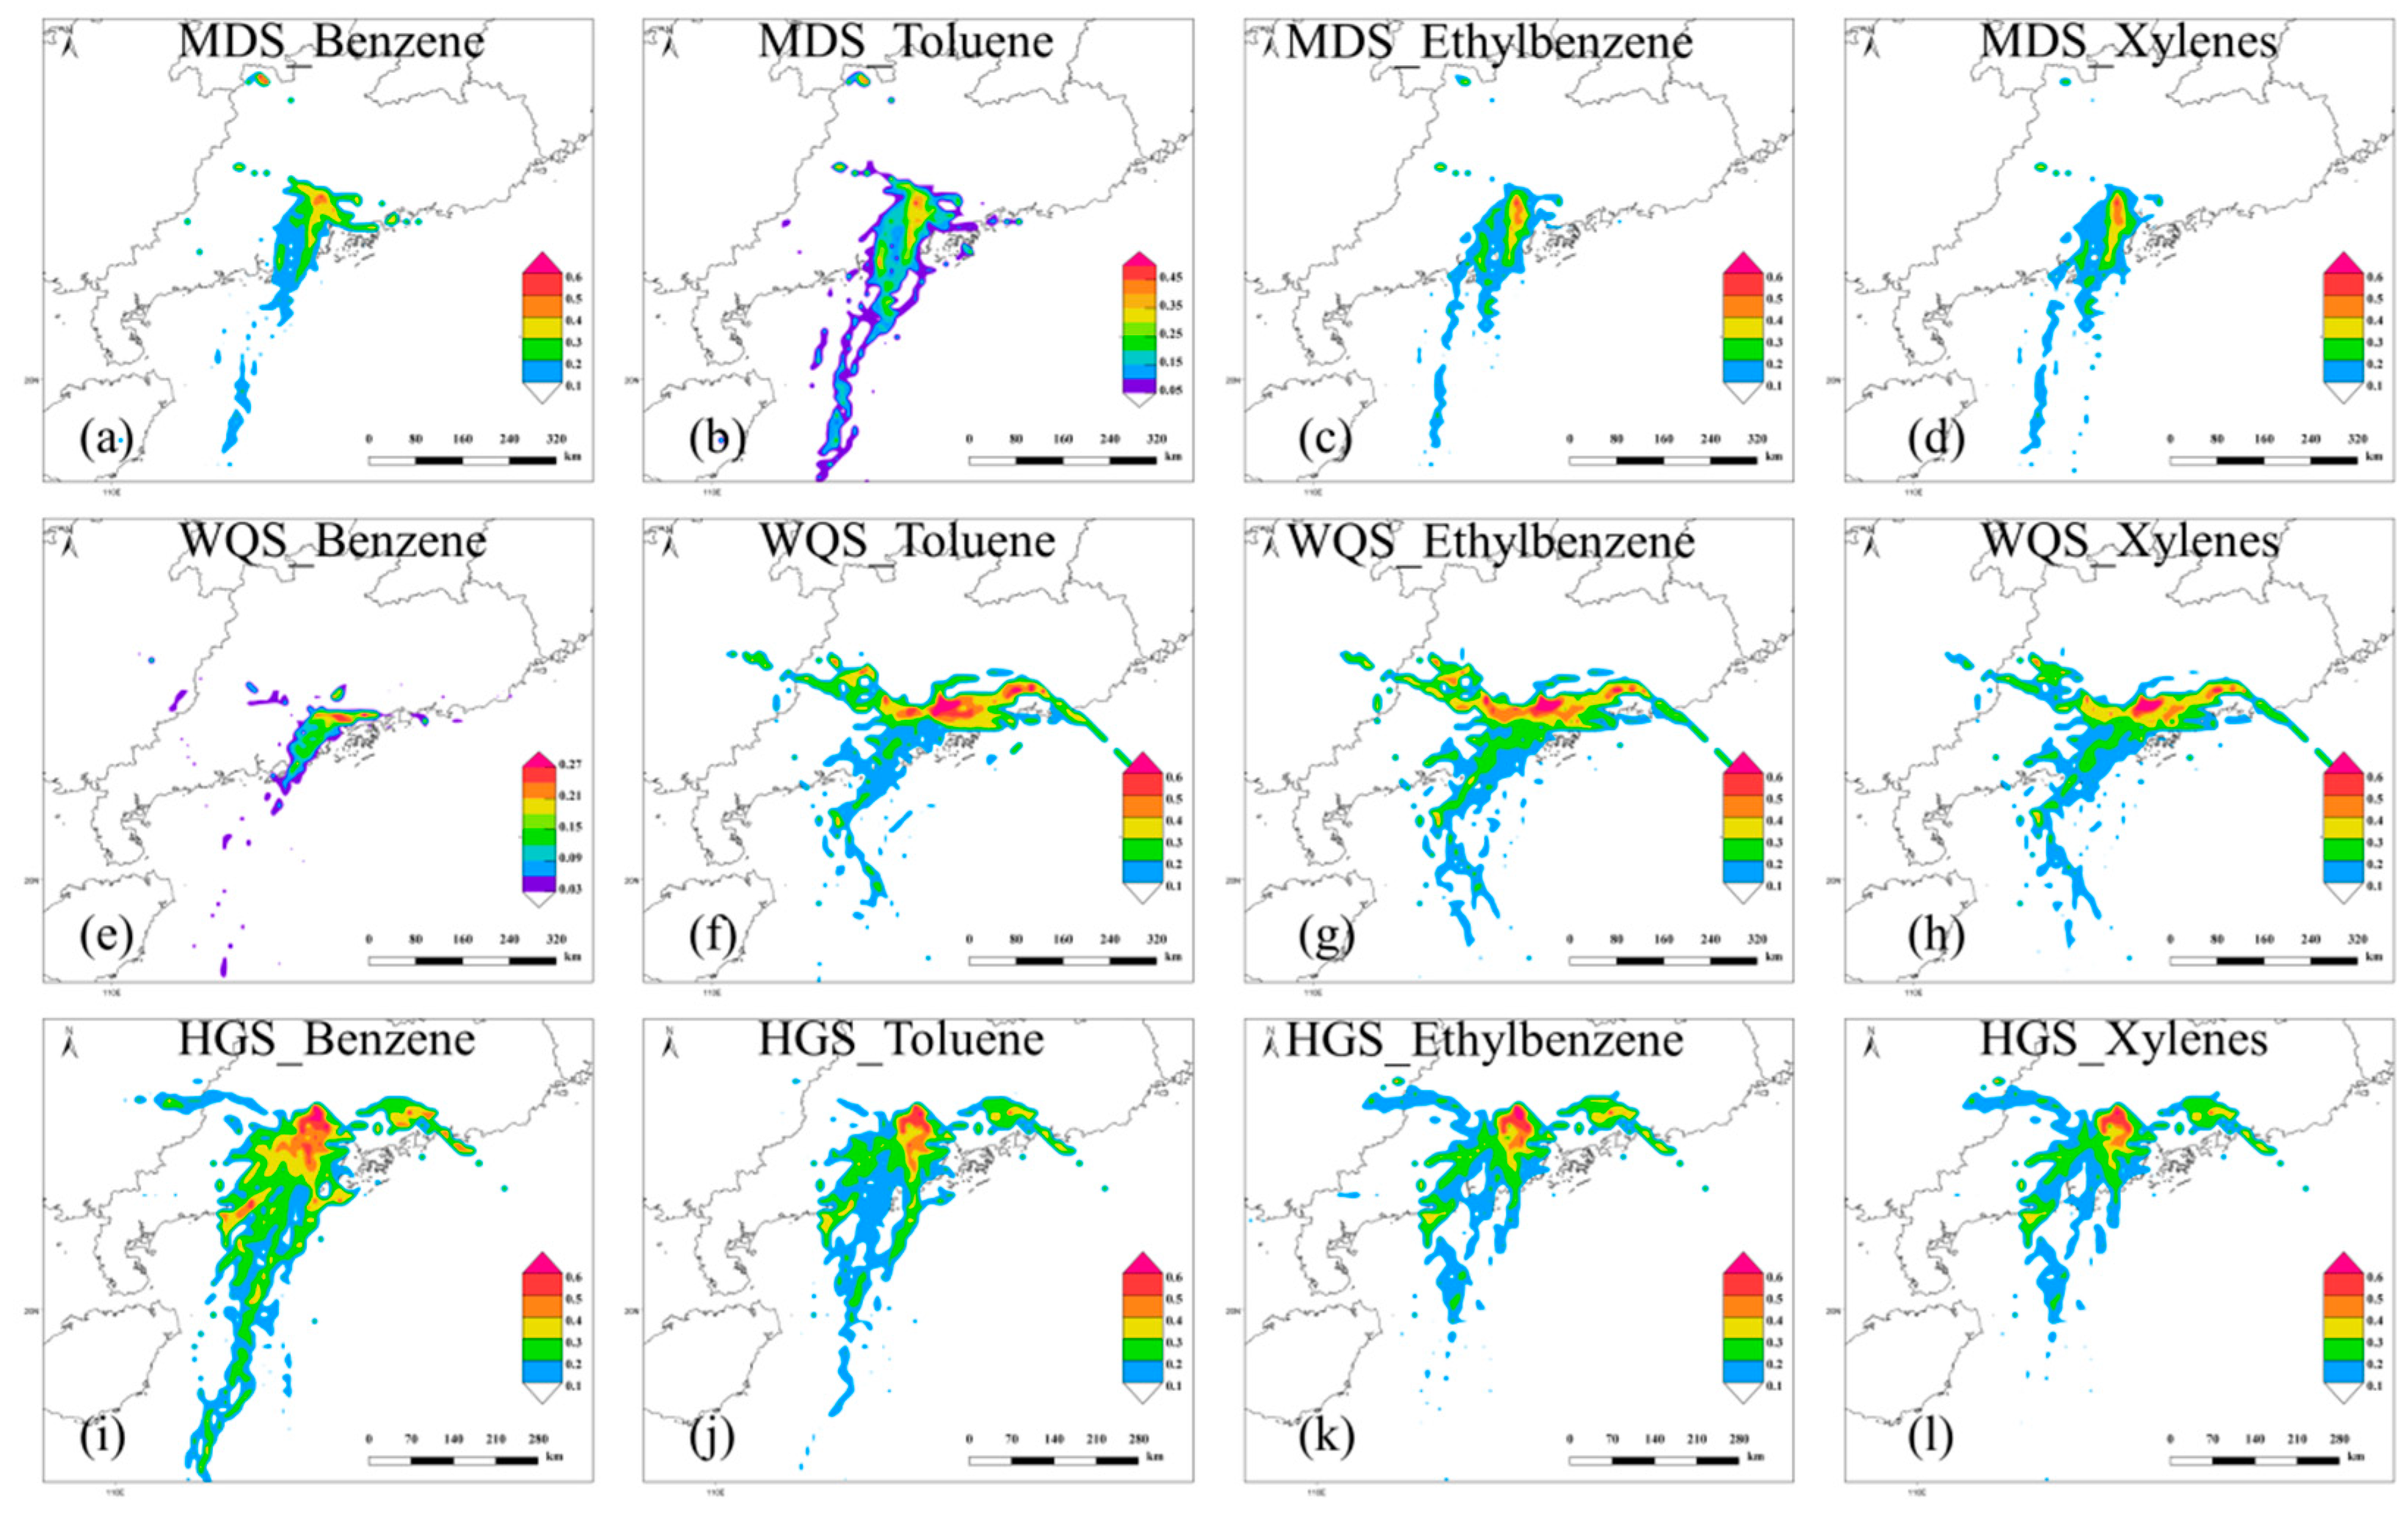
3.4. Source Areas by PSCF Analysis

As aromatics are found to be among most important ozone and SOA precursors as discussed above and aromatics are more stable in ambient air than alkenes [49], in this study we further conducted PSCF analysis to explore the location of probable emission sources for aromatics including benzene, toluene, ethylbenzene and xylenes observed in July–August when ozone pollution is more serious. This kind of analysis would help clarify the source emission areas and regional transport channels as well.
As showed in Figure 12, the warmer the color in an area, the greater the value of PSCF and thereby the greater the emission intensity in the grid. The potential source areas of the aromatics observed at the MDS site show a north–south distribution, and the emission sources in Guangzhou were mainly centered in the Guangzhou central districts. The potential source areas of the aromatics at the WQS site were distributed from east to west across Huizhou, Dongguan and east of Guangzhou, where a great many industrial enterprises were located. Also there were emission sources in the northeast Guangzhou, in Qingyuan in the northwest to Guangzhou, and in Foshan in the southwest to Guangzhou that contributed aromatics observed at the site. The potential source areas of the aromatics at the HGS site had south-north distribution across Guangzhou, Foshan, Zhaoqing and Yangjiang, and there were the source areas, though less important, in Huizhou and Dongguan. The PSCF identified aromatics emission areas is highly consistent with the actual industrial layout in the cities, indicating that the PSCF results can better reflect the potential source areas. From south to north, there is a belt with high WPSCF values, which is mainly related to furniture processing enterprises, which give emissions of aromatics [42], in Panyu in the south of Guangzhou.

4. Conclusions

In this study, VOCs were monitored online during the summer of 2016 at three representative sites, namely MDS (urban), WQS (background) and HGS (suburban), in the PRD region. The mixing ratios, chemical compositions, O3 and SOA formation potentials, sources and potential source areas of VOCs in the PRD region were investigated based on the hourly data. The results revealed average VOCs mixing ratios of 34.78 ppbv, 8.54 ppbv and 8.47 ppbv at the MDS, WQS and HGS sites, respectively. In terms of mixing ratios, alkanes were the most abundant VOC groups at the three sites, followed by aromatics and alkenes; propane and n-butane were the most abundant VOC species at the MDS site in mixing ratios, isopentane and toluene were the most abundant at the WQS site, and toluene and propane were the top two at the HGS site.
Aromatics (xylenes and toluene) and alkenes (ethylene, propylene, butene and isoprene) among the VOC species contributed most to OFP at the three sites, and toluene and xylenes contributed the most to SOAFP at the three sites. Source apportionment by the PMF model revealed that vehicle exhaust was the largest contributor at the three sites, accounted for 43%, 26% and 34% of observed VOCs at the MDS, WQS and HGS site, respectively. Meanwhile, petrochemical emissions (30% at MDS, 24% at WQS, and 25% at HGS), solvent use (13% at MDS, 21% at WQS and 12% at HGS) and industrial processes losses (3% at MDS; 18% at WQS and 13% at HGS) also contributed substantially, with reasonably much lower contribution by industrial processes losses at the urban MSD site (3%) and much biogenic emission contribution (12%) at the HGS site surrounded by forests. However, at all the three sites OFP and SOAFP were mostly contributed by VOCs from industry-related emission sources, indicating the importance to control reactive organic gases from industry sources for the coordinated prevention of PM2.5 and O3 pollution in the region.
Based on the PSCF analysis with the high time resolution data, potential source areas of the aromatics, which are important precursor to both O3 and SOA could be targeted. This is a good example that online data can be used to locate potential source areas for pollutants of concern. It worth noting that this study is only based on observations at three sites during a summer month. It is quite certain that online observation data at more sites and in more seasons would give a more clear and reliable picture for potential source areas of important O3 and SOA precursors in the region, which is highly beneficial to reduce emissions in an accurate and effective way.

Author Contributions

Methodology, T.Z. and S.X.; validation, Y.Z.; investigation, T.Z and S.X.; data curation, T.Z., C.P., D.C., M.J. and T.L.; writing—original draft preparation, T.Z. and S.X.; writing—review and editing, Y.Z. and X.W.; supervision, X.W. All authors have read and agreed to the published version of the manuscript.

Funding

This study was funded by Natural Science Foundation of China (41530641), the National Key Research and Development Program (2017YFC0212802), the Chinese Academy of Sciences (QYZDJ-SSW-DQC032), and Department of Science and Technology of Guangdong Province (2019B121201002/2020B1111360003/2019B121205006).

Institutional Review Board Statement

Not applicable.

Informed Consent Statement

Not applicable.

Data Availability Statement

Data are available upon request on the official website of Department of Ecology and Environment of Guangdong Province.

Acknowledgments

The authors acknowledge the support of Peking University, Beijing, China.

Conflicts of Interest

The authors declare that they have no conflict of interest.

References

  1. Sillman, S. The relation between ozone, NOx and hydrocarbons in urban and polluted rural environments. Atmos. Environ. 1999, 33, 1821–1845. [Google Scholar] [CrossRef]
  2. Wang, B.; Shao, M.; Lu, S.H.; Yuan, B.; Zhao, Y.; Wang, M.; Zhang, S.Q.; Wu, D. Variation of ambient non-methane hydrocarbons in Beijing city in summer 2008. Atmos. Chem. Phys. 2010, 10, 5911–5923. [Google Scholar] [CrossRef] [Green Version]
  3. Cheng, H.R.; Saunders, S.M.; Guo, H.; Louie, P.K.K.; Jiang, F. Photochemical trajectory modeling of ozone concentrations in Hong Kong. Environ. Pollut. 2013, 180, 101–110. [Google Scholar] [CrossRef] [PubMed]
  4. Liu, X.H.; Zhang, Y.; Xing, J.; Zhang, Q.; Wang, K.; Streets, D.G.; Jang, C.; Wang, W.-X.; Hao, J.M. Understanding of Regional Air Pollution over China Using Cmaq, Part Ii. Process Analysis and Sensitivity of Ozone and Particulate Matter to Precursor Emissions. Atmos. Environ. 2010, 44, 3719–3727. [Google Scholar] [CrossRef]
  5. Wei, W.; Cheng, S.; Li, G.; Wang, G.; Wang, H. Characteristics of Volatile Organic Compounds (VOCs) Emitted from a Petroleum Refinery in Beijing, China. Atmos. Environ. 2014, 89, 358–366. [Google Scholar] [CrossRef]
  6. Jang, M.S.; Czoschke, N.M.; Lee, S.; Kamens, R.M. Heterogeneous Atmospheric Aerosol Production by Acid-Catalyzed Particle-Phase Reactions. Science 2002, 298, 814–817. [Google Scholar] [CrossRef]
  7. Claeys, M.; Graham, B.; Vas, G.; Wang, W.; Vermeylen, R.; Pashynska, V.; Cafmeyer, J.; Guyon, P.; Andreae, M.O.; Artaxo, P.; et al. Formation of Secondary Organic Aerosols through Photooxidation of Isoprene. Science 2004, 303, 1173–1176. [Google Scholar] [CrossRef] [PubMed] [Green Version]
  8. Cabada, J.C.; Pandis, S.N.; Subramanian, R.; Robinson, A.L.; Polidori, A.; Turpin, B. Estimating the Secondary Organic Aerosol Contribution to PM2.5 using the EC Tracer Method Special Issue Of aerosol Science and Technologyon Findings from the Fine Particulate Matter Supersites Program. Aerosol Sci. Technol. 2004, 38, 140–155. [Google Scholar] [CrossRef] [Green Version]
  9. Lonati, G.; Giugliano, M.; Butelli, P.; Romele, L.; Tardivo, R. Major Chemical Components of PM2.5 in Milan (Italy). Atmos. Environ. 2005, 39, 1925–1934. [Google Scholar] [CrossRef]
  10. Zou, Y.; Deng, X.J.; Zhu, D.; Gong, D.C.; Wang, H.; Li, F.; Tan, H.B.; Deng, T.; Mai, B.R.; Liu, X.T.; et al. Characteristics of 1 Year of Observational Data of VOCs, NOx and O3 at a Suburban Site in Guangzhou, China. Atmos. Chem. Phys. 2015, 15, 6625–6636. [Google Scholar] [CrossRef] [Green Version]
  11. Shao, M.; Zhang, Y.; Zeng, L.; Tang, X.; Zhang, J.; Zhong, L.; Wang, B. Ground-Level Ozone in the Pearl River Delta and the Roles of VOC and NO(X) in Its Production. J. Environ. Manag. 2009, 90, 512–518. [Google Scholar] [CrossRef] [PubMed]
  12. Xue, L.; Wang, T.; Louie, P.K.K.; Luk, C.W.Y.; Blake, D.R.; Xu, Z. Increasing External Effects Negate Local Efforts to Control Ozone Air Pollution: A Case Study of Hong Kong and Implications for Other Chinese Cities. Environ. Sci. Technol. 2014, 48, 10769–10775. [Google Scholar] [CrossRef] [PubMed] [Green Version]
  13. Xue, L.K.; Wang, T.; Gao, J.; Ding, A.J.; Zhou, X.H.; Blake, D.R.; Wang, X.F.; Saunders, S.M.; Fan, S.J.; Zuo, H.C.; et al. Ground-Level Ozone in Four Chinese Cities: Precursors, Regional Transport and Heterogeneous Processes. Atmos. Chem. Phys. 2014, 14, 13175–13188. [Google Scholar] [CrossRef] [Green Version]
  14. Ling, Z.H.; Guo, H.; Cheng, H.R.; Yu, Y.F. Sources of Ambient Volatile Organic Compounds and Their Contributions to Photochemical Ozone Formation at a Site in the Pearl River Delta, Southern China. Environ. Pollut. 2011, 159, 2310–2319. [Google Scholar] [CrossRef]
  15. Guo, H.; Ling, Z.; Cheung, K.; Jiang, F.; Wang, D.; Simpson, I.; Barletta, B.; Meinardi, S.; Wang, T.; Wang, X. Characterization of Photochemical Pollution at Different Elevations in Mountainous Areas in Hong Kong. Atmos. Chem. Phys. 2013, 13, 3881–3898. [Google Scholar] [CrossRef] [Green Version]
  16. Bo, Y.; Cai, H.; Xie, S.D. Spatial and Temporal Variation of Historical Anthropogenic NMVOCs Emission Inventories in China. Atmos. Chem. Phys. 2008, 8, 7297–7316. [Google Scholar] [CrossRef] [Green Version]
  17. Zheng, J.; Zhang, L.; Che, W.; Zheng, Z.; Yin, S. A Highly Resolved Temporal and Spatial Air Pollutant Emission Inventory for the Pearl River Delta Region, China and Its Uncertainty Assessment. Atmos. Environ. 2009, 43, 5112–5122. [Google Scholar] [CrossRef]
  18. Guo, H.; Cheng, H.R.; Ling, Z.H.; Louie, P.K.; Ayoko, G.A. Which Emission Sources Are Responsible for the Volatile Organic Compounds in the Atmosphere of Pearl River Delta? J. Hazard Mater. 2011, 188, 116–124. [Google Scholar] [CrossRef]
  19. Yuan, B.; Chen, W.; Shao, M.; Wang, M.; Lu, S.; Wang, B.; Liu, Y.; Chang, C.-C.; Wang, B. Measurements of Ambient Hydrocarbons and Carbonyls in the Pearl River Delta (PRD), China. Atmospheric Res. 2012, 116, 93–104. [Google Scholar] [CrossRef]
  20. Zhang, Y.; Wang, X.; Barletta, B.; Simpson, I.J.; Blake, D.R.; Fu, X.; Zhang, Z.; He, Q.; Liu, T.; Zhao, X.; et al. Source Attributions of Hazardous Aromatic Hydrocarbons in Urban, Suburban and Rural Areas in the Pearl River Delta (PRD) Region. J. Hazard. Mater. 2013, 250–251, 403–411. [Google Scholar] [CrossRef] [Green Version]
  21. Zhang, Y.; Wang, X.; Zhang, Z.; Lü, S.; Shao, M.; Lee, F.S.C.; Yu, J. Species Profiles and Normalized Reactivity of Volatile Organic Compounds from Gasoline Evaporation in China. Atmos. Environ. 2013, 79, 110–118. [Google Scholar] [CrossRef]
  22. Ou, J.; Guo, H.; Zheng, J.; Cheung, K.; Louie, P.K.K.; Ling, Z.; Wang, D. Concentrations and Sources of Non-Methane Hydrocarbons (NMHCs) from 2005 to 2013 in Hong Kong: A Multi-Year Real-Time Data Analysis. Atmos. Environ. 2015, 103, 196–206. [Google Scholar] [CrossRef]
  23. Zhang, Y.; Wang, X.; Zhang, Z.; Lu, S.; Huang, Z.; Li, L. Sources of C2-C4 Alkenes, the Most Important Ozone Nonmethane Hydrocarbon Precursors in the Pearl River Delta Region. Sci. Total Environ. 2015, 502, 236–245. [Google Scholar] [CrossRef]
  24. Guo, H.; Wang, T.; Blake, D.R.; Simpson, I.J.; Kwok, Y.H.; Li, Y.S. Regional and Local Contributions to Ambient Non-Methane Volatile Organic Compounds at a Polluted Rural/Coastal Site in Pearl River Delta, China. Atmos. Environ. 2006, 40, 2345–2359. [Google Scholar] [CrossRef] [Green Version]
  25. Ashbaugh, L.L.; Malm, W.C.; Sadeh, W.Z. A Residence Time Probability Analysis of Sulfur Concentrations at Grand Canyon National Park. Atmos. Environ. 1985, 19, 1263–1270. [Google Scholar] [CrossRef]
  26. Draxler, R.R.; Hess, G.D. An Overview of the Hysplit_4 Modelling System for Trajectories, Dispersion and Deposition. Aust. Meteorol. Mag. 1998, 47, 295–308. [Google Scholar]
  27. Polissar, A.V.; Hopke, P.K.; Paatero, P.; Kaufmann, Y.J.; Hall, D.K.; Bodhaine, B.A.; Dutton, E.G.; Harris, J.M. The Aerosol at Barrow, Alaska: Long-Term Trends and Source Locations. Atmos. Environ. 1999, 33, 2441–2458. [Google Scholar] [CrossRef]
  28. Paatero, P.; Tapper, U. Positive Matrix Factorization—A Nonnegative Factor Model with Optimal Utilization of Error-Estimates of Data Values. Environmetrics 1994, 5, 111–126. [Google Scholar] [CrossRef]
  29. Paatero, P. Least Squares Formulation of Robust Non-Negative Factor Analysis. Chemom. Intell. Lab. Syst. 1997, 37, 23–35. [Google Scholar] [CrossRef]
  30. Norris, G.; Duvall, R.; Brown, S.; Bai, S. EPA Positive Matrix Factorization (PMF) 5.0 Fundamentals and User Guide; U.S. Environmental Protection Agency, Office of Research and Development: Washington, DC, USA, 2014. [Google Scholar]
  31. Brown, S.G.; Frankel, A.; Hafner, H.R. Source Apportionment of VOCs in the Los Angeles Area Using Positive Matrix Factorization. Atmos. Environ. 2007, 41, 227–237. [Google Scholar] [CrossRef]
  32. Polissar, A.V.; Hopke, P.K.; Paatero, P. Atmospheric Aerosol over Alaska—2. Elemental Composition and Sources. J. Geophys. Res. Atmos. 1998, 103, 19045–19057. [Google Scholar] [CrossRef]
  33. Reff, A.; Eberly, S.I.; Bhave, P.V. Receptor Modeling of Ambient Particulate Matter Data Using Positive Matrix Factorization: Review of Existing Methods. J. Air Waste Manag. Assoc. 2007, 57, 146–154. [Google Scholar] [CrossRef] [Green Version]
  34. Wang, Y.Q.; Zhang, X.Y.; Draxler, R.R. Trajstat: Gis-Based Software That Uses Various Trajectory Statistical Analysis Methods to Identify Potential Sources from Long-Term Air Pollution Measurement Data. Environ. Model. Softw. 2009, 24, 938–939. [Google Scholar] [CrossRef]
  35. Carter, W.P. Updated Maximum Incremental Reactivity Scale and Hydrocarbon Bin Reactivities for Regulatory Applications. Calif. Air Resour. Board Contract 2009, 339. Available online: http://citeseerx.ist.psu.edu/viewdoc/download?doi=10.1.1.480.5788&rep=rep1&type=pdf (accessed on 7 February 2021).
  36. Grosjean, D.; Seinfeld, J.H. Parameterization of the Formation Potential of Secondary Organic Aerosols. Atmos. Environ. 1989, 23, 1733–1747. [Google Scholar] [CrossRef]
  37. Grosjean, D. In Situ Organic Aerosol Formation During a Smog Episode: Estimated Production and Chemical Functionality. Atmos. Environ. Part A Gen. Top. 1992, 26, 953–963. [Google Scholar] [CrossRef]
  38. Tang, J.H.; Chan, L.Y.; Chang, C.C.; Liu, S.; Li, Y.S. Characteristics and Sources of Non-Methane Hydrocarbons in Background Atmospheres of Eastern, Southwestern, and Southern China. J. Geophys. Res. 2009, 114. [Google Scholar] [CrossRef] [Green Version]
  39. Zhu, Y.; Yang, L.; Chen, J.; Wang, X.; Xue, L.; Sui, X.; Wen, L.; Xu, C.; Yao, L.; Zhang, J.; et al. Characteristics of Ambient Volatile Organic Compounds and the Influence of Biomass Burning at a Rural Site in Northern China During Summer 2013. Atmos. Environ. 2016, 124, 156–165. [Google Scholar] [CrossRef]
  40. He, Z.; Wang, X.; Ling, Z.; Zhao, J.; Guo, H.; Shao, M.; Wang, Z. Contributions of Different Anthropogenic Volatile Organic Compound Sources to Ozone Formation at a Receptor Site in the Pearl River Delta Region and Its Policy Implications. Atmos. Chem. Phys. 2019, 19, 8801–8816. [Google Scholar] [CrossRef] [Green Version]
  41. Zhang, Y.; Yang, W.; Simpson, I.; Huang, X.; Yu, J.; Huang, Z.; Wang, Z.; Zhang, Z.; Liu, D.; Huang, Z.; et al. Decadal Changes in Emissions of Volatile Organic Compounds (VOCs) from on-Road Vehicles with Intensified Automobile Pollution Control: Case Study in a Busy Urban Tunnel in South China. Environ. Pollut. 2018, 233, 806–819. [Google Scholar] [CrossRef] [Green Version]
  42. Zheng, J.; Yu, Y.; Mo, Z.; Zhang, Z.; Wang, X.; Yin, S.; Peng, K.; Yang, Y.; Feng, X.; Cai, H. Industrial Sector-Based Volatile Organic Compound (VOC) Source Profiles Measured in Manufacturing Facilities in the Pearl River Delta, China. Sci. Total Environ. 2013, 456–457, 127–136. [Google Scholar] [CrossRef] [PubMed]
  43. Cai, C.; Geng, F.; Tie, X.; Yu, Q.; An, J. Characteristics and Source Apportionment of VOCs Measured in Shanghai, China. Atmos. Environ. 2010, 44, 5005–5014. [Google Scholar] [CrossRef]
  44. An, J.; Wang, J.; Zhang, Y.; Zhu, B. Source Apportionment of Volatile Organic Compounds in an Urban Environment at the Yangtze River Delta, China. Arch. Environ. Contam. Toxicol. 2017, 72, 335–348. [Google Scholar] [CrossRef] [PubMed]
  45. Huang, X.F.; Wang, C.; Zhu, B.; Lin, L.L.; He, L.Y. Exploration of Sources of Ovocs in Various Atmospheres in Southern China. Environ. Pollut. 2019, 249, 831–842. [Google Scholar] [CrossRef] [PubMed]
  46. Ma, Z.; Liu, C.; Zhang, C.; Liu, P.; Ye, C.; Xue, C.; Zhao, D.; Sun, J.; Du, Y.; Chai, F.; et al. The Levels, Sources and Reactivity of Volatile Organic Compounds in a Typical Urban Area of Northeast China. J. Environ. Sci. 2019, 79, 121–134. [Google Scholar] [CrossRef] [PubMed]
  47. Song, C.; Liu, B.; Dai, Q.; Li, H.; Mao, H. Temperature Dependence and Source Apportionment of Volatile Organic Compounds (VOCs) at an Urban Site on the North China Plain. Atmos. Environ. 2019, 207, 167–181. [Google Scholar] [CrossRef]
  48. Li, Y.; Yin, S.; Yu, S.; Yuan, M.; Dong, Z.; Zhang, D.; Yang, L.; Zhang, R. Characteristics, Source Apportionment and Health Risks of Ambient VOCs During High Ozone Period at an Urban Site in Central Plain, China. Chemosphere 2020, 250, 126283. [Google Scholar] [CrossRef]
  49. Huang, C.; Wang, H.L.; Li, L.; Wang, Q.; Lu, Q.; De Gouw, J.A.; Zhou, M.; Jing, S.A.; Lu, J.; Chen, C.H. VOC Species and Emission Inventory from Vehicles and Their SOA Formation Potentials Estimation in Shanghai, China. Atmos. Chem. Phys. 2015, 15, 11081–11096. [Google Scholar] [CrossRef] [Green Version]
  50. Li, Q.; Su, G.; Li, C.; Liu, P.; Zhao, X.; Zhang, C.; Sun, X.; Mu, Y.; Wu, M.; Wang, Q.; et al. An Investigation into the Role of VOCs in SOA and Ozone Production in Beijing, China. Sci. Total Environ. 2020, 720, 137536. [Google Scholar] [CrossRef]
  51. Tan, Q.; Liu, H.; Xie, S.; Zhou, L.; Song, T.; Shi, G.; Jiang, W.; Yang, F.; Wei, F. Temporal and Spatial Distribution Characteristics and Source Origins of Volatile Organic Compounds in a Megacity of Sichuan Basin, China. Environ. Res. 2020, 185, 109478. [Google Scholar] [CrossRef] [PubMed]
  52. Borbon, A.; Locoge, N.; Veillerot, M.; Galloo, J.; Guillermo, R. Characterisation of NMHCs in a French Urban Atmosphere: Overview of the Main Sources. Sci. Total Environ. 2002, 292, 177–191. [Google Scholar] [CrossRef]
  53. Yuan, B.; Shao, M.; Lu, S.; Wang, B. Source Profiles of Volatile Organic Compounds Associated with Solvent Use in Beijing, China. Atmos. Environ. 2010, 44, 1919–1926. [Google Scholar] [CrossRef]
  54. Liu, Y.; Shao, M.; Lu, S.; Chang, C.C.; Wang, J.L.; Fu, L. Source Apportionment of Ambient Volatile Organic Compounds in the Pearl River Delta, China: Part Ii. Atmos. Environ. 2008, 42, 6261–6274. [Google Scholar] [CrossRef]
  55. Wu, F.; Yu, Y.; Sun, J.; Zhang, J.; Wang, J.; Tang, G.; Wang, Y. Characteristics, Source Apportionment and Reactivity of Ambient Volatile Organic Compounds at Dinghu Mountain in Guangdong Province, China. Sci. Total Environ. 2016, 548–549, 347–359. [Google Scholar] [CrossRef] [PubMed]
  56. Fang, Z.; Deng, W.; Zhang, Y.; Ding, X.; Tang, M.; Liu, T.; Hu, Q.; Zhu, M.; Wang, Z.; Yang, W.; et al. Open Burning of Rice, Corn and Wheat Straws: Primary Emissions, Photochemical Aging, and Secondary Organic Aerosol Formation. Atmos. Chem. Phys. 2017, 17, 14821–14839. [Google Scholar] [CrossRef] [Green Version]
  57. Simpson, I.J.; Blake, N.J.; Barletta, B.; Diskin, G.S.; Fuelberg, H.E.; Gorham, K.; Huey, L.G.; Meinardi, S.; Rowland, F.S.; Vay, S.A.; et al. Characterization of Trace Gases Measured over Alberta Oil Sands Mining Operations: 76 Speciated C2–C10 Volatile Organic Compounds (VOCs), CO2, CH4, CO, NO, NO2, NOY, O3 and SO2. Atmos. Chem. Phys. 2010, 10, 11931–11954. [Google Scholar] [CrossRef] [Green Version]
  58. Li, J.; Zhai, C.; Yu, J.; Liu, R.; Li, Y.; Zeng, L.; Xie, S. Spatiotemporal Variations of Ambient Volatile Organic Compounds and Their Sources in Chongqing, a Mountainous Megacity in China. Sci. Total Environ. 2018, 627, 1442–1452. [Google Scholar] [CrossRef]
  59. Feng, J.; Zhang, Y.; Song, W.; Deng, W.; Zhu, M.; Fang, Z.; Ye, Y.; Fang, H.; Wu, Z.; Lowther, S. Emissions of Nitrogen Oxides and Volatile Organic Compounds from Liquefied Petroleum Gas-Fueled Taxis under Idle and Cruising Modes. Environ. Pollut. 2020, 267, 115623. [Google Scholar] [CrossRef]
  60. Wang, Q.; Chen, C.; Wang, H.; Zhou, M.; Lou, S.; Qiao, L.; Huang, C.; Li, L.; Su, L.; Mu, Y. Forming Potential of Secondary Organic Aerosols and Sources Apportionment of VOCs in Autumn of Shanghai, China. Huanjing Kexue 2013, 34, 424–433. [Google Scholar] [PubMed]
Figure 1. Location of the three monitoring sites in the Pearl River Delta.
Atmosphere 12 00327 g001
Figure 2. The group compositions (alkanes, alkenes, alkyne and aromatics) of volatile organic compounds (VOCs) at the three sites.
Atmosphere 12 00327 g002
Figure 3. Time series of wind speed and direction, temperature (Temp) and relative humidity (RH), O3, NO, NO2, SO2, CO and VOCs concentrations at the MDS site.
Atmosphere 12 00327 g003
Figure 4. Time series of wind speed and direction, temperature (Temp) and relative humidity (RH), O3, NO, NO2, SO2, CO and VOCs concentrations at the WQS site.
Atmosphere 12 00327 g004
Figure 5. Time series of wind speed and direction, temperature (Temp) and relative humidity (RH), O3, NO, NO2, SO2, CO and VOCs concentrations at the HGS site.
Atmosphere 12 00327 g005
Figure 6. Diurnal variations of (a) nitrogen oxides (NOX) at MDS, (b) O3 at MDS, (c) VOCs at MDS, (d) NOx at WQS, (e) O3 at WQS, (f) VOCs at WQS, (g) NOx at HGS, (h) O3 at HGS, and (i) VOCs at HGS. Points represent the means. Error bars represent the standard deviations.
Atmosphere 12 00327 g006
Figure 7. The top 10 VOC species by (a) concentrations at MDS, (b) ozone formation potentials (OFP) at MDS, (c) secondary organic aerosol formation potential (SOAFP) at MDS, (d) concentrations at WQS, (e) OFP at WQS, (f) SOAFP at WQS, (g) concentrations at HGS, (h) OFP at HGS, and (i) SOAFP at HGS.
Atmosphere 12 00327 g007
Figure 8. Source profiles derived from the positive matrix factorization (PMF) model at the MDS site.
Atmosphere 12 00327 g008
Figure 9. Source profiles derived from the PMF model at the WQS site.
Atmosphere 12 00327 g009
Figure 10. Source profiles derived from the PMF model at the HGS site.
Atmosphere 12 00327 g010
Figure 11. The source contributions to VOCs (a) concentrations at MDS, (b) OFP at MDS, (c) SOAFP at MDS, (d) concentrations at WQS, (e) OFP at WQS, (f) SOAFP at WQS, (g) concentrations at HGS, (h) OFP at HGS, and (i) SOAFP at HGS.
Atmosphere 12 00327 g011
Figure 12. The PSCF analysis for potential source areas of (a) benzene at MDS, (b) toluene at MDS, (c) ethylbenzene at MDS, (d) xylenes at MDS, (e) benzene at WQS, (f) toluene at WQS, (g) ethylbenzene at WQS, (h) xylenes at WQS, (i) benzene at HGS, (j) toluene at HGS, (k) ethylbenzene at HGS, and (l) xylenes at HGS.
Atmosphere 12 00327 g012
Publisher’s Note: MDPI stays neutral with regard to jurisdictional claims in published maps and institutional affiliations.

