Article

Generating Projections for the Caribbean at 1.5, 2.0 and 2.5 °C from a High-Resolution Ensemble

by
Jayaka D. Campbell
1,*,
Michael A. Taylor
1,
Arnoldo Bezanilla-Morlot
2,
Tannecia S. Stephenson
1,
Abel Centella-Artola
2,
Leonardo A. Clarke
1 and
Kimberly A. Stephenson
3
1
Climate Studies Group Mona (CSGM), Department of Physics, University of the West Indies, Kingston 07, Jamaica
2
Instituto de Meteorología, Loma de Casa Blanca, Regla, La Habana 11700, Cuba
3
Department of Life Sciences, University of the West Indies, Kingston 07, Jamaica
*
Author to whom correspondence should be addressed.
Atmosphere 2021, 12(3), 328; https://doi.org/10.3390/atmos12030328
Submission received: 13 January 2021 / Revised: 19 February 2021 / Accepted: 24 February 2021 / Published: 4 March 2021
(This article belongs to the Special Issue Central America and Caribbean Hydrometeorology and Hydroclimate)

Abstract

:
Six members of the Hadley Centre’s Perturbed Physics Ensemble for the Quantifying Uncertainty in Model Predictions (QUMP) project are downscaled using the PRECIS (Providing Regional Climates for Impact Studies) RCM (Regional Climate Model). Climate scenarios at long-term temperature goals (LTTGs) of 1.5, 2.0, and 2.5 °C above pre-industrial warming levels are generated for the Caribbean and six sub-regions for annual and seasonal timescales. Under a high emissions scenario, the LTTGs are attained in the mid-2020s, end of the 2030s, and the early 2050s, respectively. At 1.5 °C, the region is slightly cooler than the globe, land areas warmer than ocean, and for the later months, the north is warmer than the south. The far western and southern Caribbean including the eastern Caribbean island chain dry at 1.5 °C (up to 50%). At 2.0 °C, the warming and drying intensify and there is a reversal of a wet tendency in parts of the north Caribbean. Drying in the rainfall season accounts for much of the annual change. There is limited further intensification of the region-wide drying at 2.5 °C. Changes in wind strength in the Caribbean low-level jet region may contribute to the patterns seen. There are implications for urgent and targeted adaptation planning in the Caribbean.

1. Introduction

The Caribbean has consistently advocated for global recognition of the threat of climate change for small island developing states (SIDS) [1]. In recent years, that advocacy has centered around the slogan “1.5 to Stay Alive”. The suggestion is that sectors essential for Caribbean existence including water, agriculture, and energy are extremely vulnerable to climatic variations. Their future viability and in turn Caribbean life are threatened should global warming exceed 1.5 °C above pre-industrial levels by the end of the century [1,2,3,4,5,6]. Caribbean advocacy in part led to 1.5 °C being captured as an aspirational long-term temperature goal (LTTG) in the 2015 Paris Agreement—the prevailing global climate change agreement within the United Nations Framework Convention on Climate Change (UNFCCC) [7]. The Intergovernmental Panel on Climate Change (IPCC) in its current reporting cycle subsequently produced a special report examining, among other things, the feasibility, impacts of and global effort required to achieve the 1.5 °C target [8].
The arguments made by the Caribbean for global action are strongly premised on change already seen in the region due to the approximately one degree of mean global temperature rise to date. Some of these changes are summarized in Table 1. The Caribbean region is already experiencing: (i) warming at about the same rate as the rest of the world, (ii) increases in the number of very warm days and nights in a year, (iii) significant interannual variability in mean annual rainfall amounts, (iv) more frequent floods and droughts, (v) more intense hurricanes and tropical storms, and (vi) rising sea levels. The arguments are also premised on projected changes in climate which by century’s end under a high emission scenario include: (i) 3–4 °C of warming [9,10,11], (ii) up to 40% drying [9,10,11], (iii) more climate extremes including warm spells, droughts, and intense hurricanes [12,13,14], and (iv) up to approximately 1 m sea level rise [15,16].
Even with an increase in the number of modeling studies providing future projections for the Caribbean, there are still very few studies determining the region’s climate at 1.5 °C in support of the region’s advocacy. Reference [2] utilizes an ensemble of 10 general circulation models (GCMs) run under Representative Concentration Pathway (RCP) 4.5 (a medium greenhouse gas emissions scenario) to produce projections of temperature, rainfall, and selected warm and wet indices for LTTGs of 1.5, 2.0, and 2.5 °C above pre-industrial levels. They determine that at 1.5 °C, compared to a present-day baseline (1971–2000), the Caribbean is (i) 0.5 to 1.5 °C warmer, (ii) 5–10% wetter, except in the northeast and southeast which are drier, and (iii) has significant warm spells. At 2.0 °C, the magnitude of warming and the number of warm spell days increase, the entire region is 5–15% drier than the present-day baseline, and there are more droughts. At 2.5 °C, the patterns at 2.0 °C intensify. They highlight the shift from slightly wet to predominantly drier for the half a degree change from 1.5 to 2.0 °C and note it as significant due to the implications for regional adaptation decisions. Reference [30] produced similar results, using a single GCM running the same RCP. Their study was, however, more so devoted to studying the implications for the Caribbean if solar geo-engineering is utilized as an option for achieving 1.5 °C. Both studies utilize GCM-derived projections, notwithstanding that much of the region consists of small islands, which are not resolvable by many of the models.
In this study, climate projections are again produced for the Caribbean domain for LTTGs of 1.5, 2.0, and 2.5 °C above pre-industrial (1860–1900) levels but from an ensemble of simulations derived from a regional climate model (RCM). There are still only a few projection studies for the Caribbean from an ensemble of regional models [31], and to the best of our knowledge, no downscaled projections for the region for the LTTGs. A perturbed physics approach is employed to generate the ensemble. Under this approach, each RCM simulation is derived from a driving model which has had one of its physics parameters perturbed. Perturbed physics experiments (hereafter PPEs) translate model uncertainties into transient climate responses [32]. Parameter uncertainty is an important and substantial uncertainty given that present climate biases and future climate changes in a single model may be sensitive to changes in parameter values in the model’s physical schemes [33]. The PPE approach has been used to produce ensemble future projections for various regions worldwide including for Canada [34], the Middle East [35], the Himalayas [36], Africa [37], Vietnam [38,39], the Amazon [40], and India [41,42,43].
At least two PPE-premised studies exist for the Caribbean [6,44]. They are impact studies which make use of the downscaled data presented in this study. Those studies (and this one) are part of a regional initiative to increase the use of downscaled projection data for the Caribbean [45]. Part of the importance of this study is to provide the scientific basis and context for the data and results already presented in References [6,44]. This, of necessity, constrains the models and scenario used in this study to be the same as in References [6,44]. A detailed description of the RCM, the driving GCM, the scenario employed, and the perturbed physics approach are provided in Section 2.
This study is, however, also important for corroborating some of the LTTG conclusions of References [2,30], including the change in rainfall tendency at higher global warming targets. It goes further by exploring seasonal changes as well and providing downscaled projections for the Caribbean divided into six sub-regions (see also Section 2). A further benefit of the study is the addition of an ensemble of six downscaled simulations which can be used for additional future studies of the region. The need for downscaled high-resolution projections, particularly in regions like the Caribbean, has been recognized as important for regional planning purposes and to support regional negotiators [45].
The aim of this study is to generate high-resolution future projections of Caribbean climate at the three LTTGs of 1.5, 2.0, and 2.5 °C using a dynamical downscaling ensemble approach. Section 2 details the data and methodology employed. Section 3 provides results for ensemble selection, attainment dates for the LTTGs, and future climates of the Caribbean including the six sub-regions at the temperature thresholds. Section 4 discusses the major results.

2. Data and Methodology

2.1. Models, Data, and Domain

Version 1.7.1 of the PRECIS (Providing Regional Climate Impact Scenarios) RCM—a freely available dynamical downscaling model from the Hadley Centre, UK [46]—is used. PRECIS has been previously validated for the Caribbean [9,11,47,48] and used for regional impact studies [6]. We therefore do not repeat the validation in this study. PRECIS is a hydrostatic primitive equations grid point model which offers a full range of meteorological variables (upward of 100 surface and atmospheric variables) on varying timescales (e.g., monthly, daily, sub-daily) at up to 19 levels of the atmosphere as well as surface variables [46,49]. Temperature and rainfall output at a grid resolution of 0.22° × 0.22° (~25 km) are analyzed. PRECIS has schemes to account for both atmospheric and land surface components of the climate system, including for dynamical flow, the atmospheric sulfur cycle, clouds and precipitation, radiative processes, and the interactions between land surface and deep soil. For a full description of PRECIS’ physics, see Reference [46].
PRECIS was run over the domain shown in Figure 1. The domain is centered on the main Caribbean basin but also includes Caribbean territories in northern South America (Guyana and Suriname) and Central America (Belize). The domain is large enough to capture many of the Caribbean region’s key circulation features, e.g., the northeast trade wind regime, the Caribbean low-level jet, as well as vertical shear and divergence within the basin, while not being too large to make it computationally expensive to run. Reference [48] showed that a similarly defined domain (Domain D2 in their study) represented an “optimal choice” for regional downscaling experiments when computational and other resource constraints are considered.
The higher resolution of the RCM (as compared to GCMs) is exploited to provide high-resolution projections for six Caribbean sub-domains, also shown in Figure 1. The sub-regions approximate the Caribbean’s six rainfall zones detailed in Reference [50] which are in turn premised on similar sub-regional rainfall zones defined in References [51,52,53]. The Caribbean countries falling in each of the six defined zones are listed in Table 2. Each sub-region has a slightly different rainfall climatology and timing of rainfall peaks (e.g., zones 2 and 3 are distinctly bimodal while zone 5 tends to be unimodal) and receives differing rainfall amounts (e.g., zone 1 and zone 6 are very wet in comparison to the other zones). For an even more detailed description of the rainfall zones and their climatological characteristics, see Reference [54]. Boundary conditions for the PRECIS model were from a subset of the QUMP (Quantifying Uncertainties in Model Projection) perturbed physics experiments (PPEs) from the Hadley Centre, UK [55,56]. The full QUMP ensemble consists of 17 members generated by running the fully coupled atmosphere-ocean model HadCM3 GCM HadCM3 over the period 1850–2100 under the Special Report on Emissions Scenario (SRES) A1B scenario [57]. QUMP experiments are run varying uncertain parameters in the GCM’s representation of key physical and dynamical processes. That is, each simulation, has a perturbation to either an atmospheric process, land surface, or sea ice parametrization of HadCM3, with the resulting simulated climate of each realization being unique. QUMP surface air temperature and precipitation data were extracted on a 2.5° × 3.75° grid. For more detail on the QUMP experiments, see Reference [55].
The SRES A1B scenario [57] used in the QUMP experiments is one of a range of possible future emissions scenarios which formed the basis of the Intergovernmental Panel on Climate Change (IPCC) Fourth Assessment report [58]. It is a high emissions scenario which results in global mean temperature of approximately 3 °C by the end of the century. In comparison to the more recent Representative Concentration Pathways (RCPs) [59], it is most comparable to RCP 6.0 in terms of carbon dioxide concentrations and mean global temperatures, though with higher values throughout the mid- to end-of-century.

2.2. Methodology

The study is divided into two tasks: (i) Generating an ensemble of downscaled scenarios for use in the Caribbean, and (ii) generating future Caribbean climate projections at the LTTGs.

2.2.1. Generating an Ensemble of Downscaled Caribbean Scenarios

The 17 members of the QUMP ensemble are numbered Q0–16, where Q0 is the unperturbed member while Q1 through Q16 refer to perturbed members. The ensemble members are numbered according to the value of their global climate sensitivity, i.e., Q1 has the lowest global mean temperature response to a given increase in atmospheric CO2 while Q16 has the highest. Computational capacity precludes the downscaling of the entire 17-member ensemble using PRECIS, so recommendations outlined by Reference [56] are followed for selecting an ensemble subset. The guidelines suggest choosing Q0 (the unperturbed simulation using original parameter settings as applied in the atmospheric component of HadCM3) and thereafter choosing a subset based on (i) how well each QUMP member simulates the present-day large-scale climate of the region, ensuring that they provide a realistic representation, and (ii) achieving, if possible, a spread of model outcomes which reasonably sample the range of possible outcomes in the full 17-member ensemble. An ensemble size of six (including Q0) was used based on the available computational resources.
In keeping with the guidelines, comparisons were made between the HadCM3 QUMP output and rainfall and temperature data extracted from NOAA’s 20th Century Reanalysis V2c dataset [60] over the period 1960–1990. The reasons for using these gridded products as reference (as opposed to station data) include (i) the comparability of their resolution with that of the HadCM3 model, (ii) significant limitations with availability, consistency, and quality of station data across, especially the Caribbean islands [61], (iii) the focus of this part of the study on capturing large-scale climate features across the basin, and (iv) their prior use in a similar manner in other regional studies [11,30,62]. Comparisons were done for climatologies and annual and seasonal maps. For the seasonal maps, results are presented for four three-month seasons roughly coinciding with Caribbean wet and dry seasons [63]: May–July (MJJ) and August–October (ASO), roughly corresponding with the Caribbean wet season, and November–January (NDJ) and February–April (FMA), roughly corresponding to the Caribbean dry season. Expert judgement was used to select five QUMP members (in addition to Q0) for downscaling with PRECIS. Statistical analysis was done to show that the selected six-member ensemble reasonably sampled to the full 17-member QUMP ensemble.
The six QUMP members were used to drive the PRECIS model. In each case, the model was run continuously from 1959 to 2100, with the initial “spin up” year of each experiment discarded. The period 1960–1990 is taken as the model baseline and representative of present-day conditions. During this period, the driving HadCM3 GCM uses the observed evolution of greenhouse gas concentrations. Data representing the downscaled future projections of Caribbean climate from PRECIS are extracted for the period 2020 through 2100 and are presented as deviations from this baseline period.

2.2.2. Generating Future Caribbean Climate Projections at the LTTGs

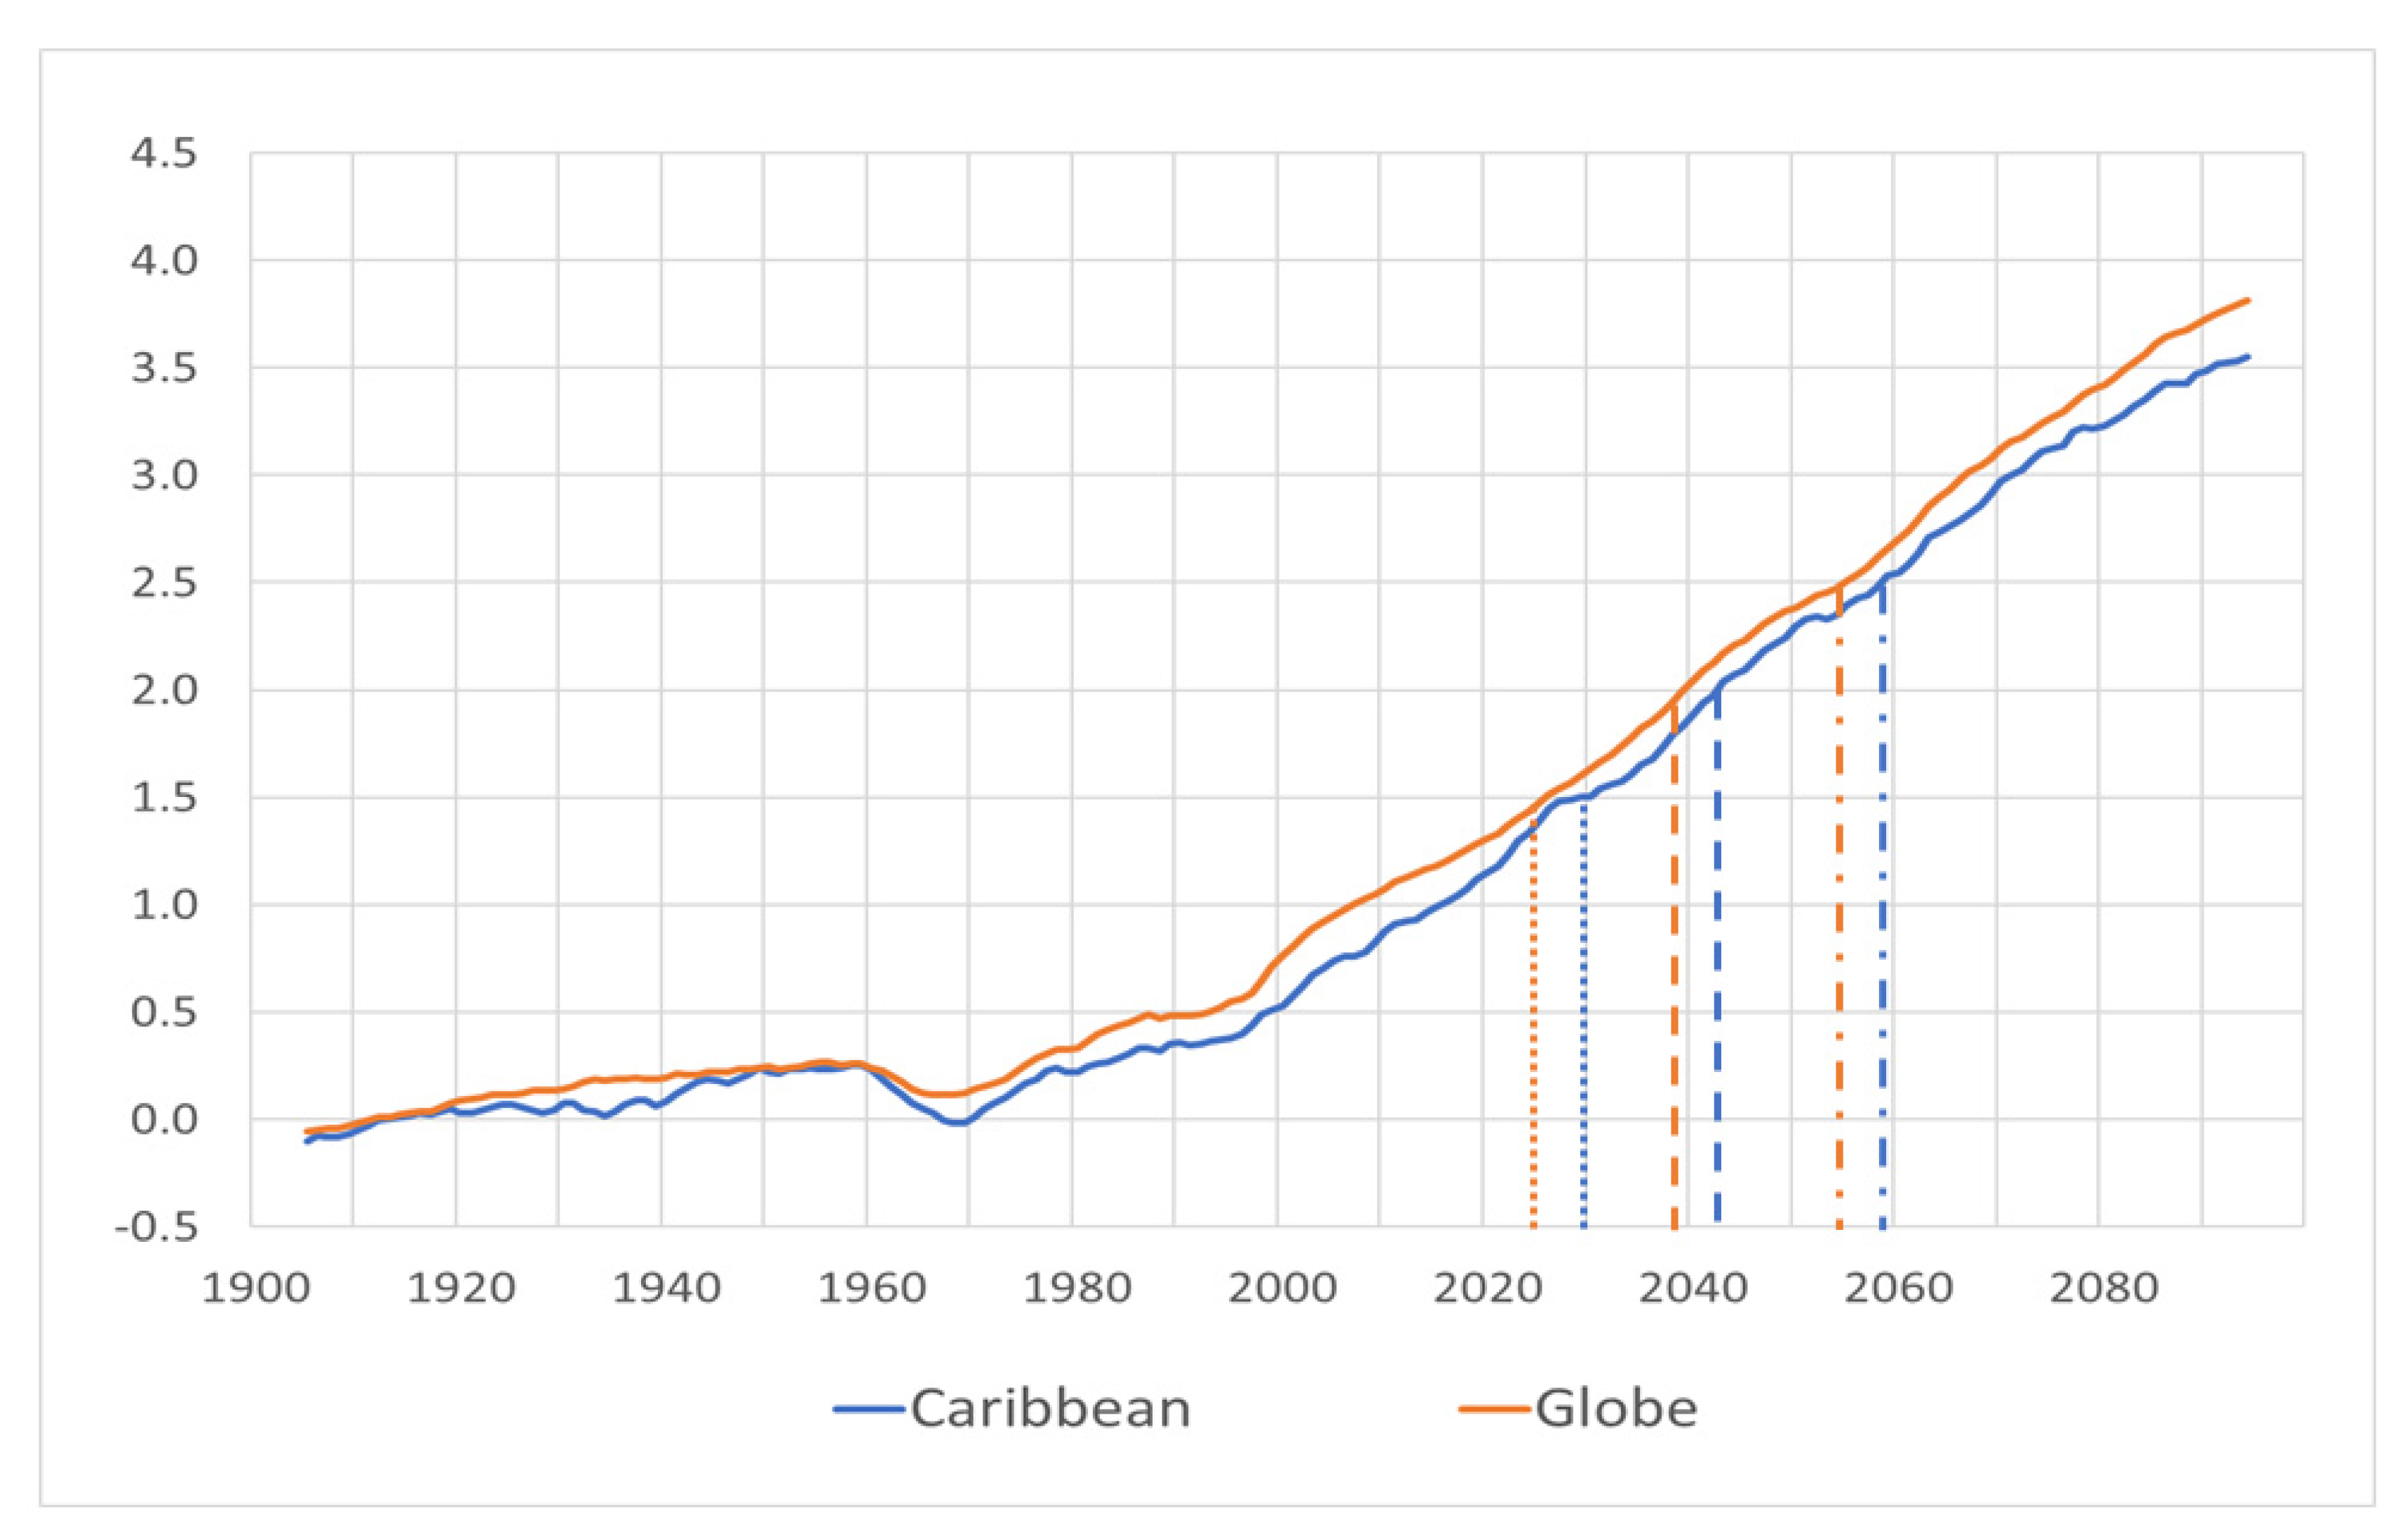
The methodology for determining the future climate for the Caribbean at the three LTTGs is patterned after the other similar studies previously noted for the region [2,30]. Firstly, the years when mean global surface temperature reaches respectively 1.5, 2.0, and 2.5 °C above the pre-industrial period are determined. To do so, annual surface air temperature anomalies time series are calculated for the globe for the Caribbean from the ensemble mean of the six selected QUMP simulations (prior to downscaling with PRECIS) over the period 1860–2100. Anomalies are with respect to a pre-industrial period which is taken as 1860–1900 [64]. The time series is subject to a 10-year running mean to minimize the impact of internal climate variability and the first year when the running mean exceeds 1.5, 2.0, or 2.5 °C, with all subsequent years being higher taken as the respective LTTG attainment date.
Thereafter, a “time sampling” approach is utilized to generate Caribbean climate pictures at the LTTGs utilizing the downscaled data. Temperature and rainfall anomaly maps for the Caribbean were created for the PRECIS ensemble mean, averaged over an 11-year period centered on the year when the prior analysis suggested attainment of each global warming target. As before, future climate scenarios are presented with respect to the baseline period 1960–1990 using absolute and percentage differences for temperature and rainfall, respectively. The Student’s t-test is used to determine where the differences are statistically significant. The pros and cons of the time sampling methodology are discussed in Reference [65]. Apart from References [2,30], the methodology has been used in a number of studies globally, see for instance References [66,67,68]. Results are presented for the domain as a whole and averaged over the six Caribbean sub-regions shown in Figure 1.

3. Results

3.1. Choosing a QUMP Subset for Downscaling

3.1.1. Temperature

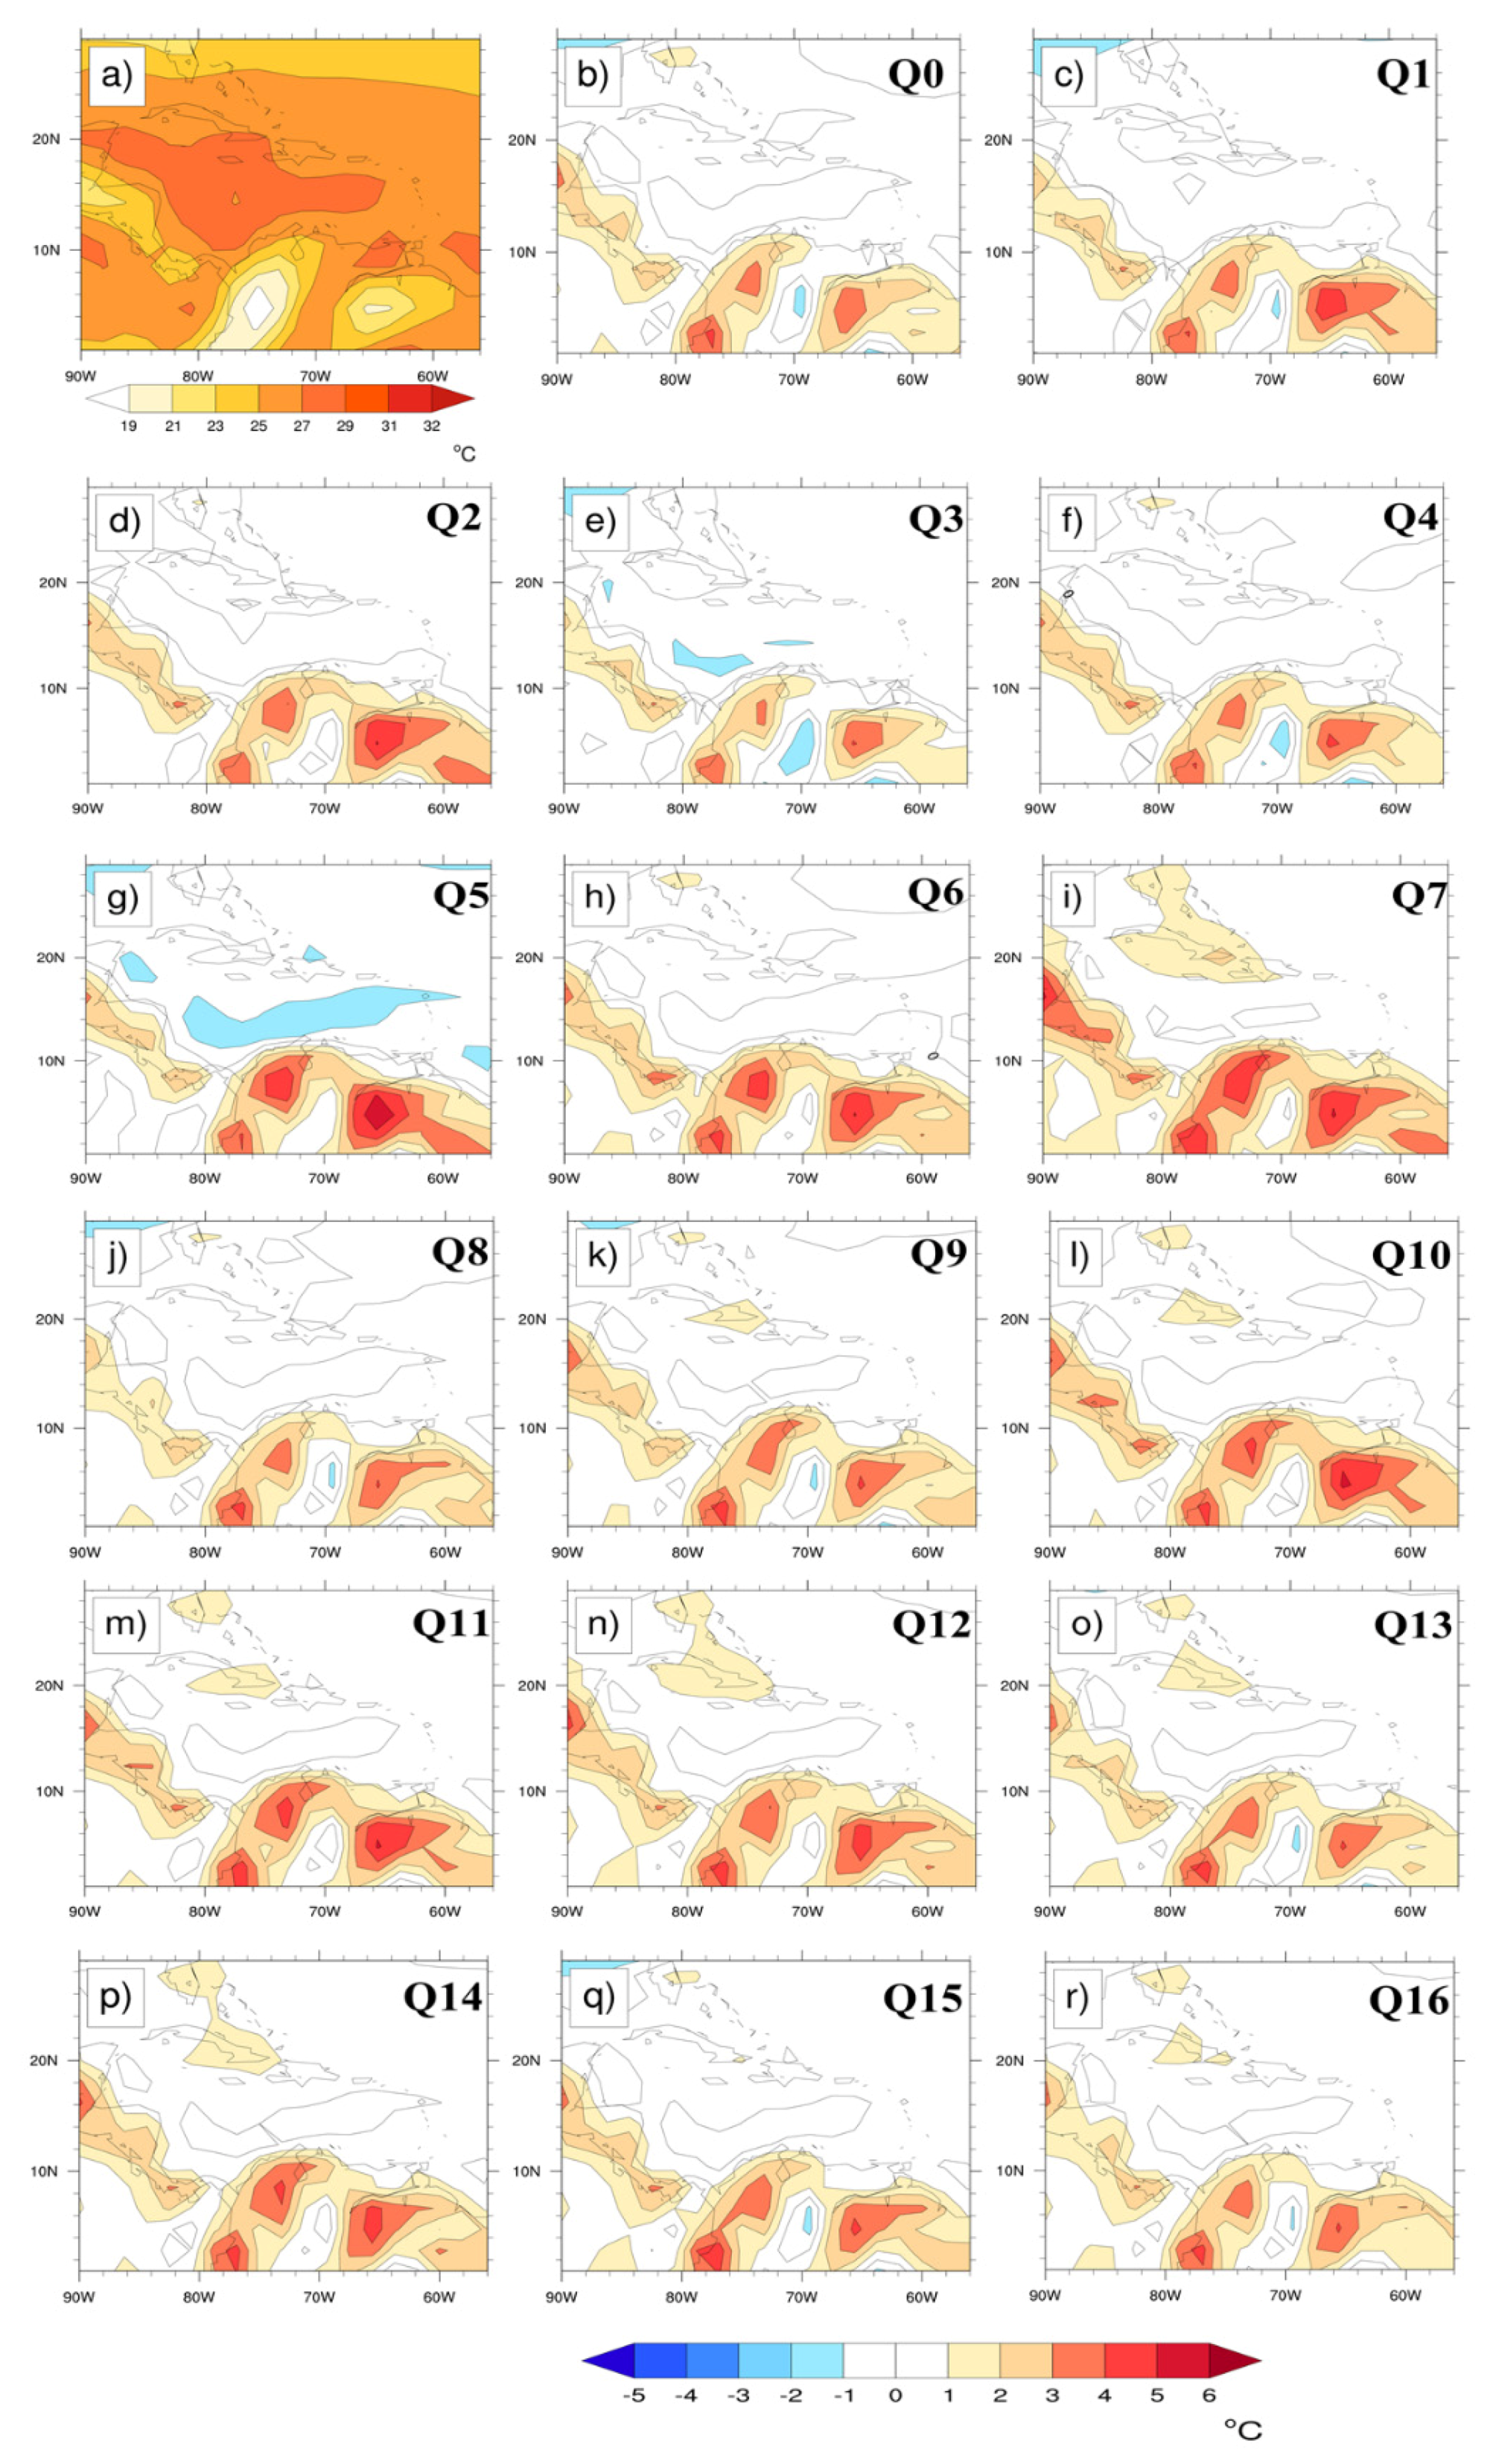
Figure 2 shows plots of mean annual near-surface temperature from the reanalysis dataset (Figure 2a) and the difference between QUMP simulations Q0 to Q16 and Figure 2a (Figure 2b–r). Plots are for the baseline period 1960–1990 and are restricted to the Caribbean basin, which is the focus of the study. Equivalent seasonal maps representing the wet and dry seasons were created but are not shown. The reanalysis plot (Figure 2a) shows the characteristic large-scale temperature pattern for the region, i.e., a relatively cooler far-north Caribbean and generally warmer south Caribbean, including the main Caribbean basin [69]. There is a warm tongue across the central Caribbean basin which emerges from the western Caribbean Sea and extends to just east of the Lesser Antilles, i.e., straddling the Atlantic Warm Pool region [70]. It is generally confined between 10° N and 20° N. The coolest locations within the domain roughly coincide with the mountainous regions of the continental-scale land masses resolvable by the Hadley Centre Coupled Model version 3 (HadCM3), i.e., over the Central American isthmus and the north western coast of the South American continent. As a reminder, it is only the larger landmasses in the domain that are resolvable by the HadCM3 GCM used to create the QUMP ensemble.
The difference between the unperturbed simulation Q0 and reanalysis shows the general biases of the HadCM driving model over the domain (Figure 2b). Over the main Caribbean basin, the differences are small, however warm biases exist over the continental land masses (Central America and South America) where positive differences of up to four degrees occur. There are three warm anomaly maxima over northern South America, roughly positioned over the highest elevation regions. Figure 2c–r suggest that the general large-scale bias pattern noted above (i.e., small differences in the north and central Caribbean and warm anomaly maxima across the continental land masses) is a characteristic of the driving GCM. All the simulations display an overestimation of the temperatures along the Central American isthmus, and over western areas of Columbia and Venezuela and stretching to across the northern extremities of Guyana and Suriname. Notwithstanding, small variations exist between individual members Q1 and Q16 due to the perturbations in the model physics for each simulation. Q3 and Q5 display a cold bias in the central Caribbean basin in the area covered by the warm tongue, which extends to the eastern Caribbean in Q5 but is limited to the southwestern Caribbean Sea for Q3. All other ensemble members show small and/or negligible differences from observation over the warm tongue region. It is also noted that Q7 through Q14 and Q16 exhibit an area of overestimation over areas of the Greater Antilles, centered over Cuba. The overestimation covers the greatest extent and is the highest in Q7.
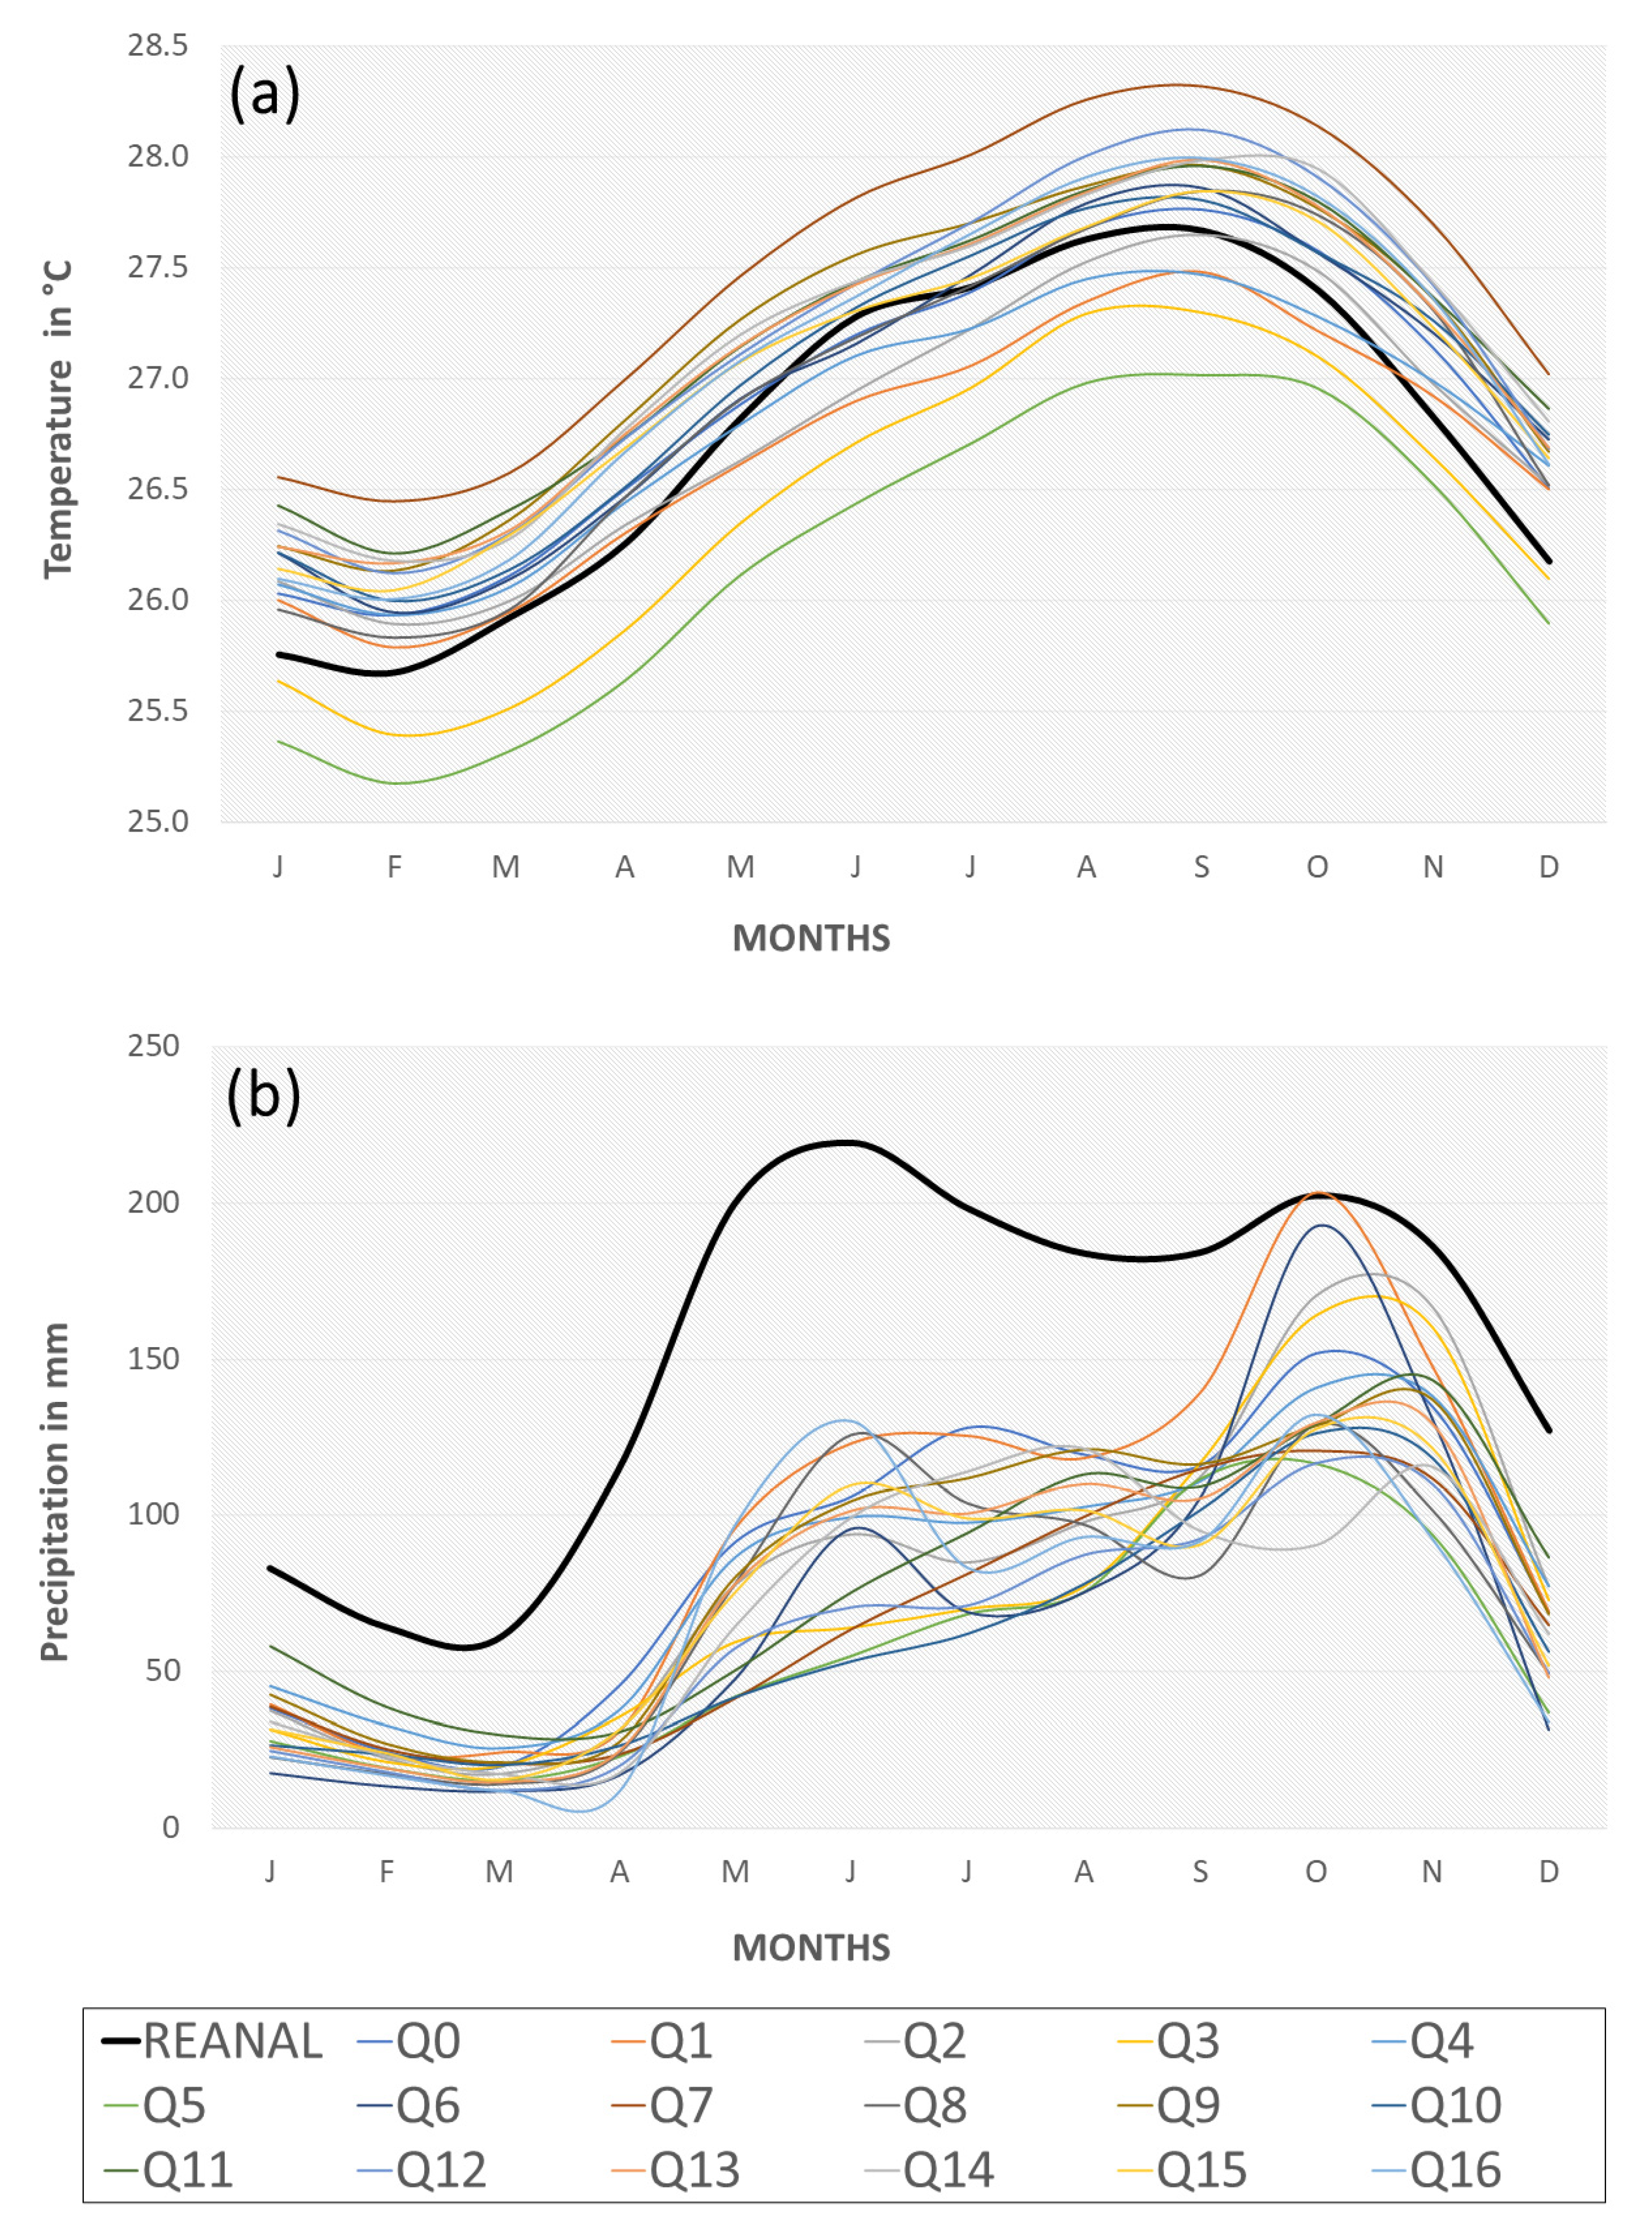
Figure 3a shows climatologies of mean monthly temperatures averaged across the entire domain shown in Figure 2. All perturbations capture the unimodal nature of temperatures in the region with a peak in September and cooler temperatures in boreal winter. The 17 ensemble members cluster around the reanalysis climatology. Q7 (Q5) is the warmest (coolest) overall ensemble and displays the largest positive (negative) monthly difference of +0.87 in November (−0.84 in June) with reanalysis. Between November and April, only two perturbations, Q3 and Q5, had simulated values lower than reanalysis.

3.1.2. Rainfall

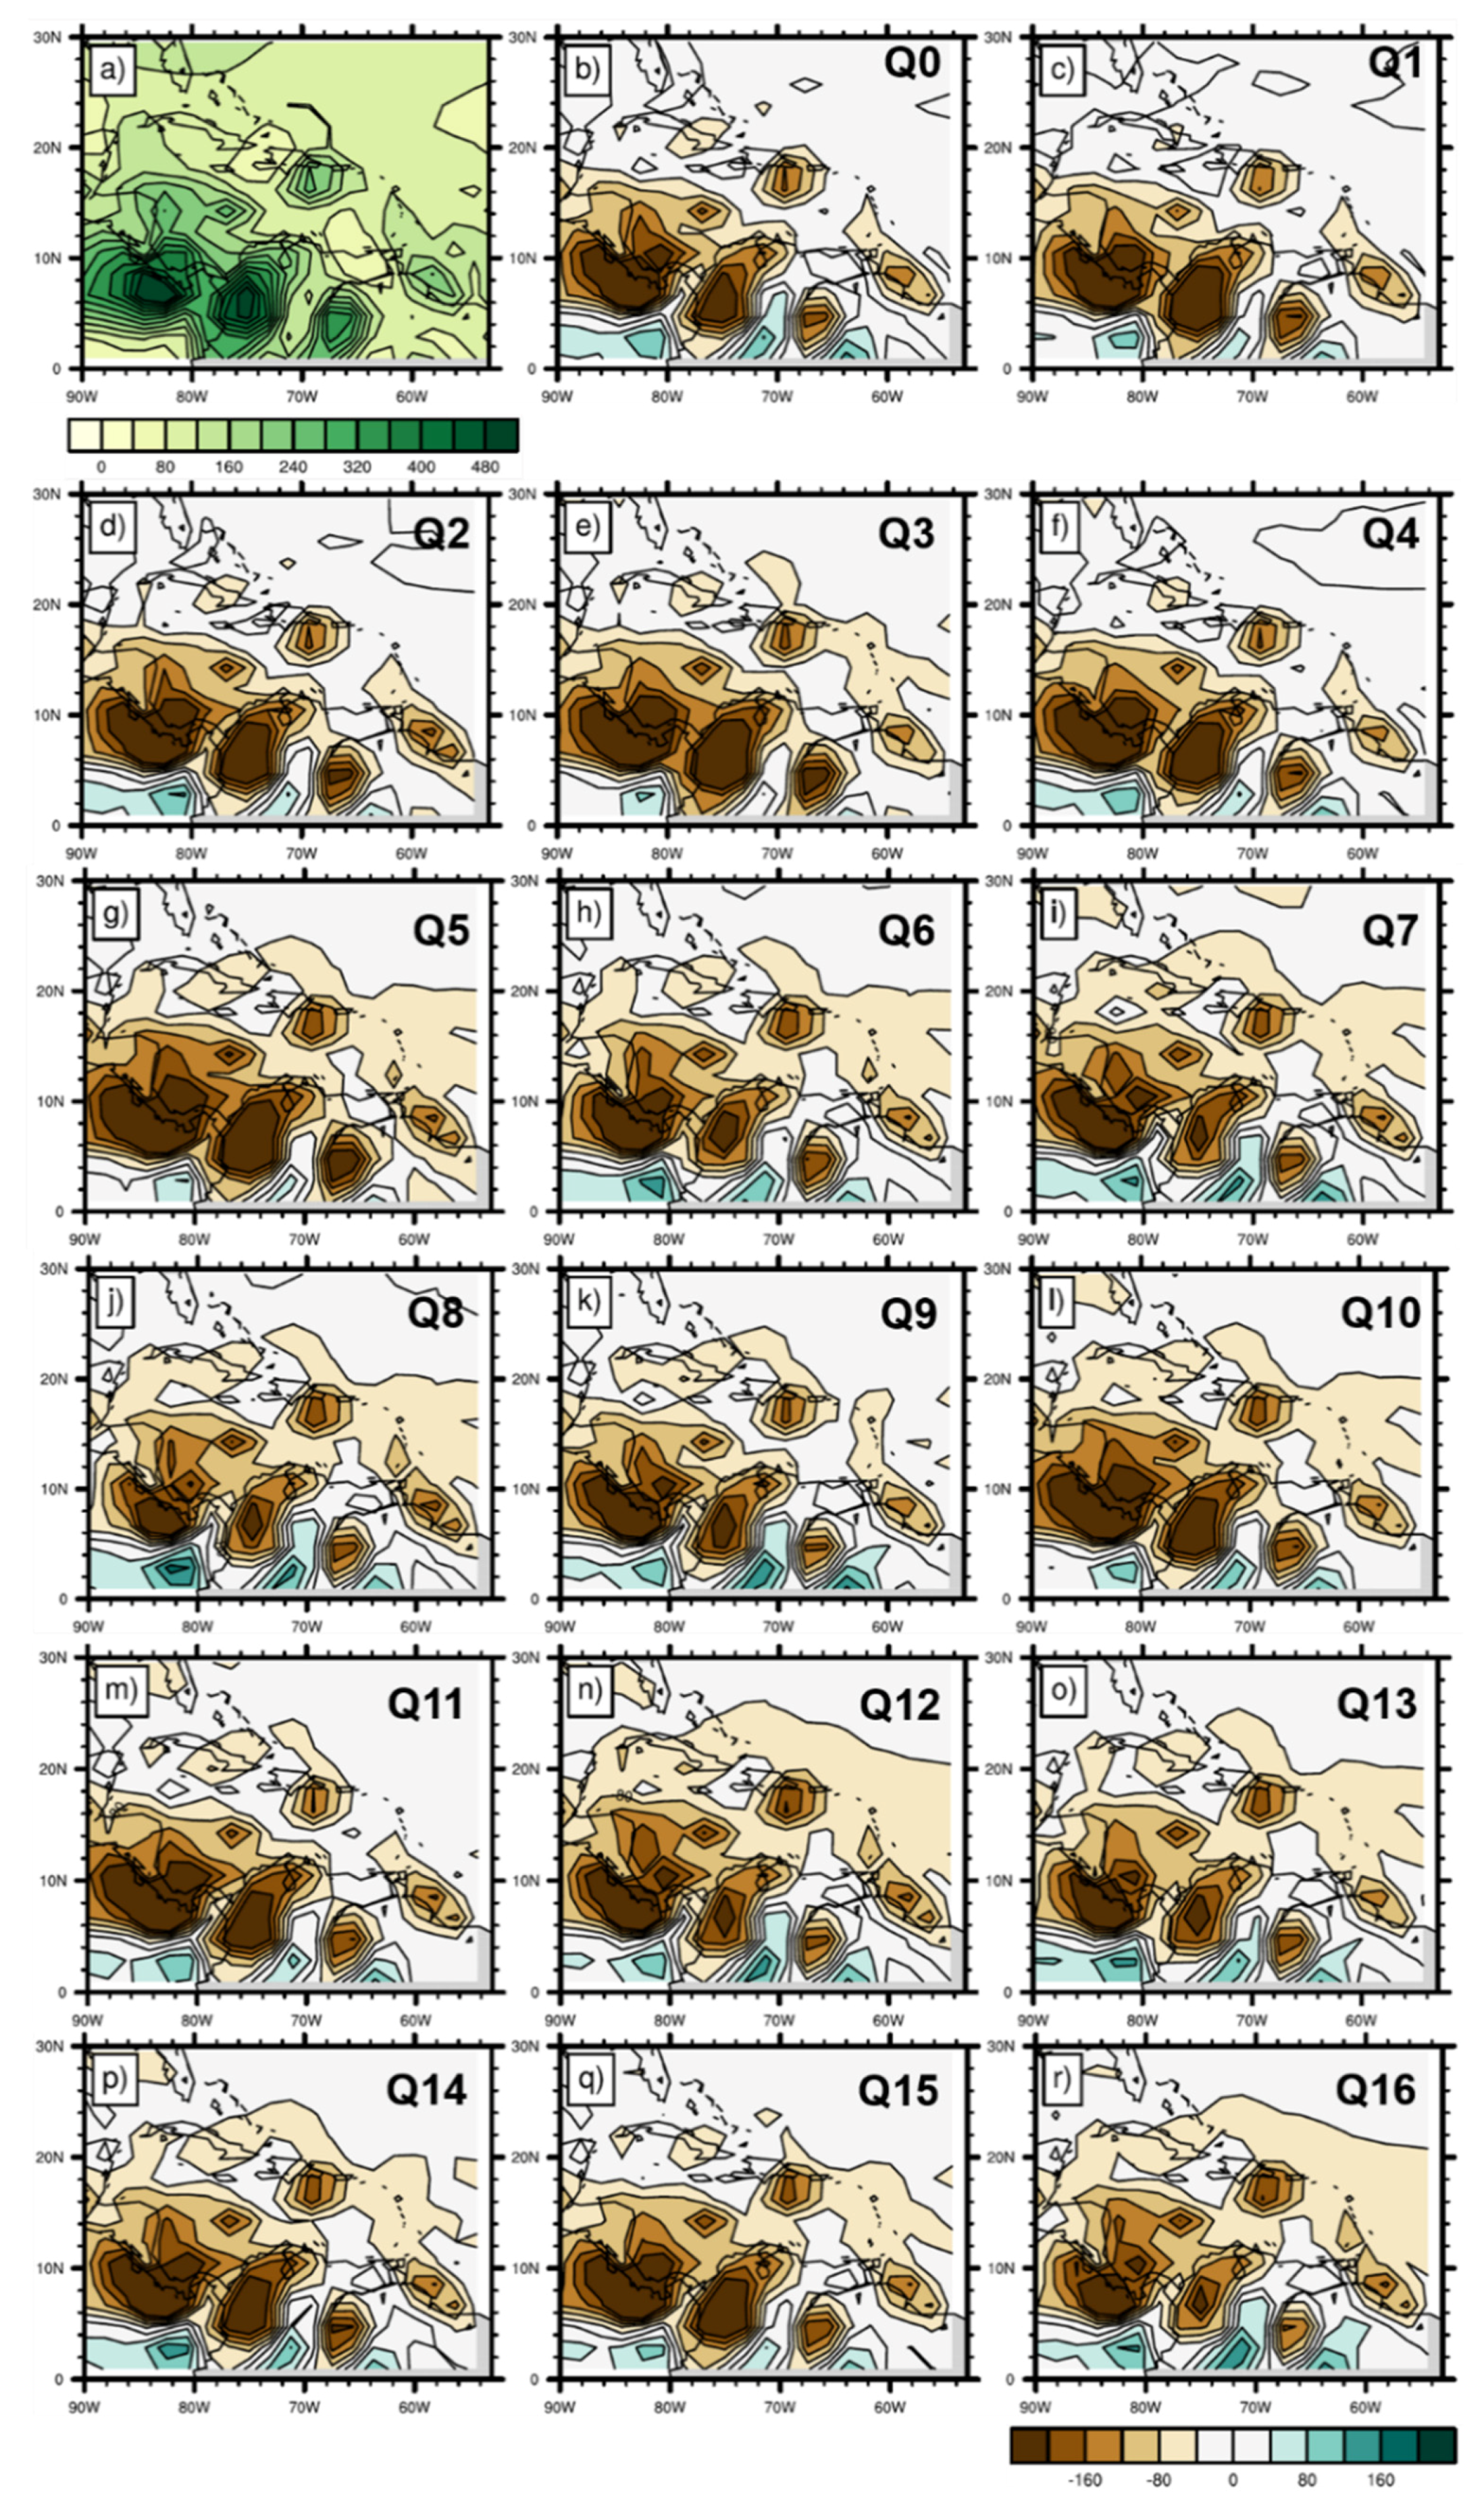
Figure 3b and Figure 4 are similar in structure to Figure 2 and Figure 3a but for rainfall. Figure 4a shows that generally, across the domain, rainfall tends to be highest in the southwest, i.e., across the Central American isthmus, Columbia, and Venezuela and extending into the southwest Caribbean Sea [69]. The Caribbean in comparison receives lower rainfall amounts with rainfall maxima over the far northwest (northern Bahamas and the Florida Panhandle), eastern Hispaniola and the surrounding ocean, and over the far south-eastern part of the domain (far eastern Venezuela and Guyana). Caribbean rainfall minima occur over the Windward Passage (the area between Jamaica, Cuba, and Hispaniola) and just off the north coast of Venezuela in the vicinity of Aruba, Bonaire and Curacao.
Q0 shows the dry bias of HadCM3 with respect to reanalysis (Figure 4b), particularly over the regions of maximum rainfall in the southwestern parts of the domain, but also in the main Caribbean basin, though to a lesser extent. The previously noted regions of Caribbean rainfall maxima are underestimated except in the far north over Florida. Overestimation is evident over the small portion of the equatorial Pacific in the domain. These patterns generally reoccur across all the PPEs (Figure 4c–r), suggesting that the dry bias, especially in the Caribbean, is a characteristic of the driving GCM. With respect to the Caribbean, the primary differences between PPEs (Figure 3c–r) are in the extent of underestimation produced over the basin between 10° N and 20° N. Whereas Q1, Q2, and Q4 generally restrict underestimation to the regions of rainfall maximum, Q3, Q8, Q9, Q11, Q14, and Q15 show a dry anomaly also encompassing the islands of the Greater and Lesser Antilles, while Q5, Q6, Q7, Q10, Q12, Q13, and Q16 expand the dry tendency to include most of the Caribbean Sea and even north of 20° N. In Q5, Q12, and Q16, the entire Caribbean region is underestimated as well as the portion of the domain east of the Lesser Antilles and northward up to 25° N.
Figure 3b shows the climatology for rainfall (it is to be noted that the reanalysis dataset averaged over the domain produces a higher early than late rainfall peak. If the averaging were restricted to the main Caribbean basin, this would be reversed [63]). The perturbed ensemble members all underestimate precipitation amounts throughout the entire year, with the underestimation greatest in the early rainfall season. This was particularly noticeable in the seasonal analyses performed and particularly over the southwest of the domain (not shown). A number of other studies have noted a similar dry tendency in versions of the HadGCMs run over the Intra-Americas [30,71,72]. The late season peak is better simulated than the early season in terms of amount of rainfall across all simulations. The first few months of the year through April and including the dry season are the least underestimated by most experiments.
Most experiments capture the characteristic bimodality of the region even with the challenge of simulating the early rainfall peak. Many show some decrease, even if small and in some cases delayed, in midsummer rainfall in comparison to the May–June amounts, suggesting that the midsummer drought phenomenon [73,74] is being captured to some extent. A few perturbations (e.g., Q3 and Q10) tend to a unimodal distribution with only a late season peak. This is typical of the northern Lesser Antilles. Q1, Q3, Q6, and Q10 do reasonably well during the late season. Q0 is among the best-performing experiments with respect to extent of underestimation across the year.

3.1.3. Six Ensemble Members

Bearing in mind the guidelines of Reference [56] and using expert judgement premised on the annual and seasonal maps, six ensemble members were chosen to be downscaled. They are Q0, Q3, Q4, Q10, Q11, and Q14. In choosing these members, some of the following were taken into account:
  • The experiments chosen were premised on model performance in the main Caribbean basin.
  • The unperturbed simulation Q0 was chosen, as recommended.
  • Q5 and Q7 were eliminated as they consistently featured amongst simulations with extreme patterns over the Caribbean. For example, Q5 was amongst the coolest simulations relative to the reference dataset (Figure 2) and also amongst the driest (Figure 5). Q7 had a significant warm bias in the northwest Caribbean in the annual pattern (Figure 2) and during MJJ (not shown) and was among the set of experiments that produced a dry bias across much of the Caribbean and into the tropical Atlantic east of the Antilles in ASO (not shown).
  • An attempt was made to still account for the tendencies captured by Q5 and Q7 so that the final sampling would be representative of the spread of the full ensemble. In that regard, Q3, which has a similar cool-dry characteristic to Q5 (Figure 2 and Figure 4), was selected, as was Q14, which captured some of the warmer and drier late rainfall season tendencies of Q7 (not shown).
  • The best attempt was made to sample across all remaining experiments such that a balance was achieved across the various annual and seasonal temperature and rainfall biases. Q10 was chosen as it was amongst the drier ensembles in the early rainfall season but did reasonably well in the late season. It was also representative of the subset of simulations that displayed a unimodal rainfall climatology which is characteristic of parts of the eastern Caribbean. Q11 and Q4 displayed varying tendencies cross the variables and seasons, but generally did not feature in any of the discussion on extreme conditions with respect to the Caribbean. They were therefore chosen as “middle of the road” experiments.
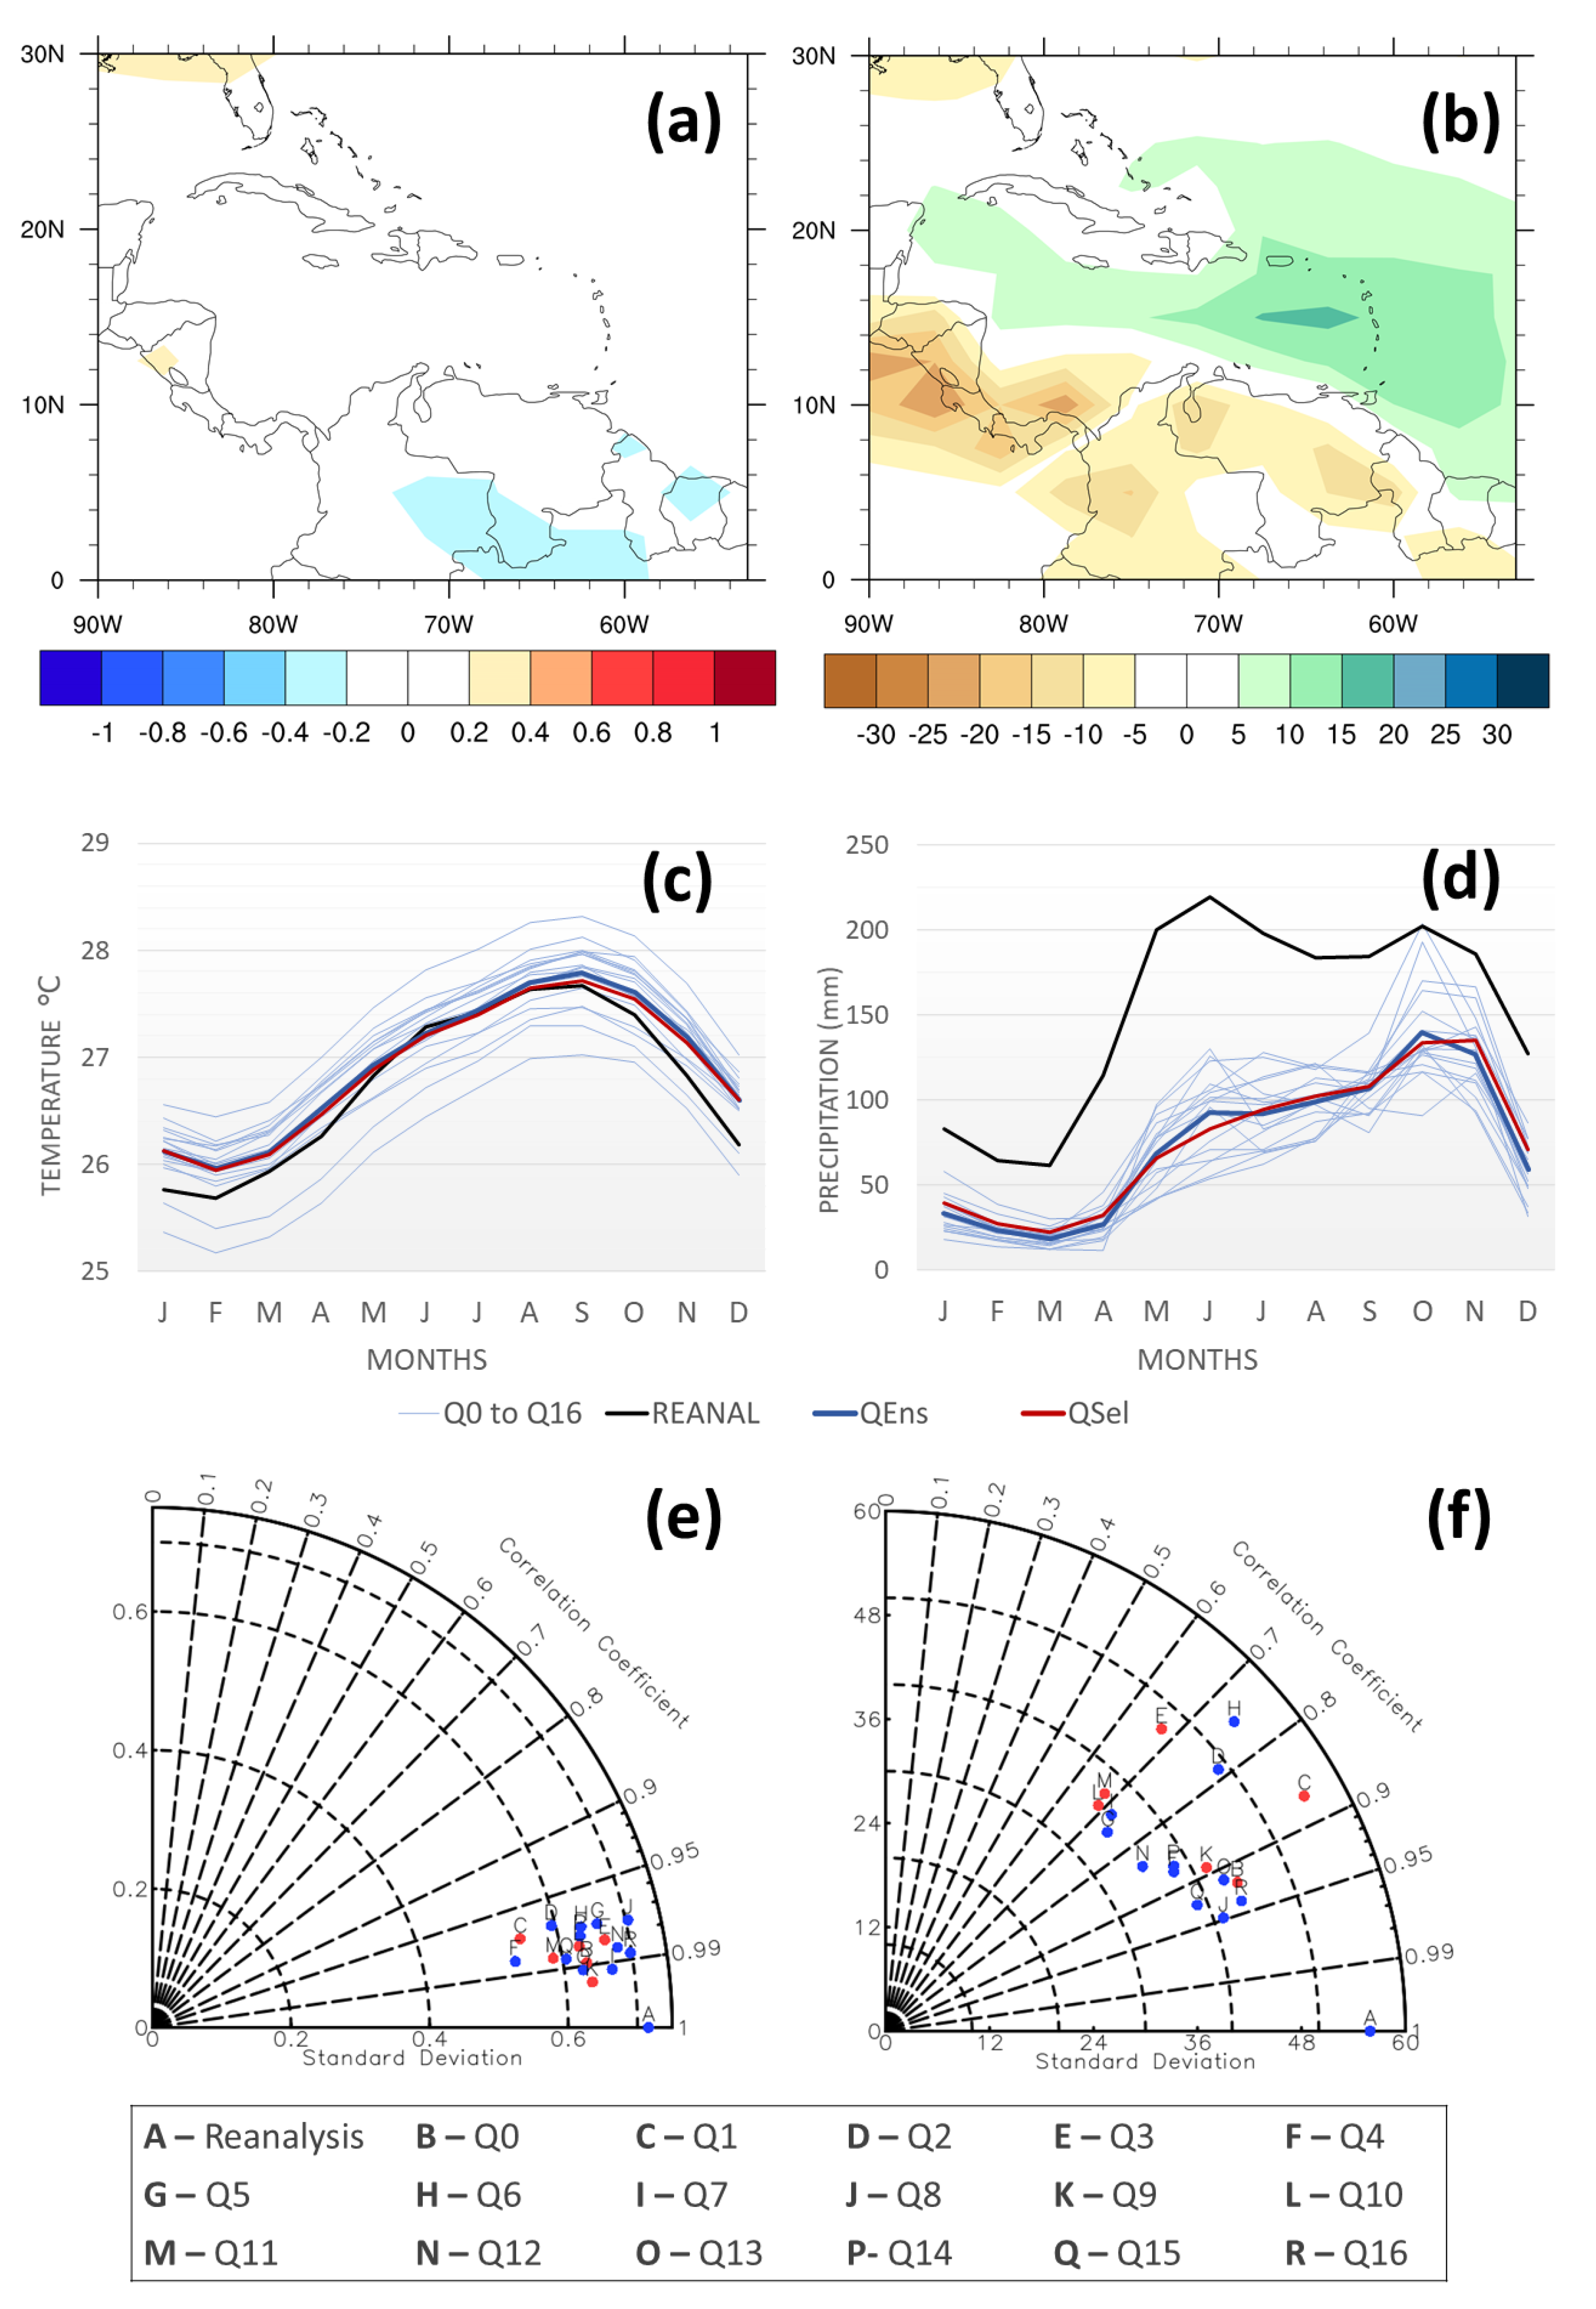
Figure 5 shows that the six-member selected ensemble satisfies both the “representative” and “spread” criteria by mirroring the mean characteristics of the full ensemble, while at the same time reasonably capturing the range of its results. Differences in temperature between selected and full ensembles over the Caribbean are very small or negligible, ranging between ±0.2 degrees (Figure 5a). Seasonal analysis (not shown) suggests that the exception is in ASO (FMA), where the mean of the selected is colder (warmer) than the full ensemble by 0.4 degrees over Cuba (Cuba and the north-eastern sections of the Bahamas). Outside of the Caribbean, differences greater than 0.2 °C exist over the continental areas, representing an underestimation of the full ensemble by the six-member selection, specifically over central South America and Central America. Nonetheless, the ensemble mean temperature climatological plots for both the selected and full ensembles closely overlap (Figure 5c).
With respect to rainfall, there is small overestimation in the annual mean by the selected ensemble over the Caribbean region (Figure 5b), reaching up to 10–15% in the south and eastern Caribbean. Underestimations occur over Central America and northern South America. Seasonal analysis (not shown) suggests that the Caribbean overestimation is largest for FMA (up to 30%) across the central Caribbean Sea, may reach up to 20% in the southwest Caribbean Sea for NDJ, and is smallest in ASO. Over Central and South America, the differences are greatest in MJJ and smallest in NDJ. The climatological patterns of the selected and ensemble means are closely aligned (Figure 5d). It should be noted that if the climatology were recalculated from QSel for just the subregions of interest shown in Figure 1, the early season bias with respect to reanalysis is reduced and the climatology falls within the 66% likely range for a similar calculation of climatologies from 20 Coupled Model Intercomparison Project Phase 5 (CMIP5) GCMs (not shown).
Finally, the Taylor diagram (Figure 5f) suggests that for rainfall, the six ensemble members reasonably covers the range of both the standard deviation and correlation of the full ensemble, with no overall bias to an extreme in either metric. The same is true for the temperature Taylor diagram (Figure 5e). With respect to reanalysis, the temperature values for all ensemble members are more closely clustered and nearer to the reference value, suggesting it as generally better captured by the GCM than precipitation. It is, however, again noted that all ensemble members underestimate rainfall, as indicated by the distance of the twelve ensemble members from the reanalysis point.

3.2. LTTG Attainment Dates

The ensemble average of the six selected QUMP members is used to determine the approximate dates for achieving the LTTGs. Figure 6 shows the 10-year running averaged annual surface temperature anomalies for the globe and for the Caribbean using the Caribbean index (10°–20° N and 65°–83° W) definition of Reference [63]. There is a steady rise in global mean surface temperatures since the 1900s, with a mean warming rate of approximately 0.2 °C per decade between 1970 and 2000. This is similar to that reported in Reference [8]. The model also simulates steady warming in the Caribbean, with the rate of Caribbean temperature rise closely mirroring the simulated global rate. The annual mean Caribbean surface temperature is, however, always slightly cooler than that of the globe. For example, at the LTTGs of 1.5, 2.0, and 2.5 °C, the Caribbean is respectively 1.4, 1.8, and 2.4 °C. Reference [2] reports a similar finding.
The ensemble mean suggests that under the A1B scenario, 1.5 °C is achieved as early as 2025, 2.0 °C is achieved in 2039, while 2.5 °C is achieved shortly after mid-century in 2054 (Table 3). If the full 17-member ensemble means were used, the years are almost identical with mean attainment dates of 2024, 2038, and 2052, respectively. This again suggests that the selected members are a reasonable representation of the entire ensemble. For comparison, Reference [2] suggests attainment dates of 2028, 2046, and 2070 for RCP4.5. The earlier attainment dates in this study relative to Reference [2] reflect the steeper rise in carbon dioxide emissions of the A1B scenario and higher end-of-century mean global temperature change. Reference [68] suggests almost identical attainment dates to this study of 2024, 2038, and 2050 using 17 CMIP5 models running the business-as-usual RCP8.5.
The corresponding years when the Caribbean domain achieved 1.5, 2.0, and 2.5 °C above pre-industrial times are also shown in Table 3. The Caribbean lags the globe by 5 to 7 years. This is not surprising since Caribbean temperatures are simulated to be slightly cooler than the globe, though rising at about the same rate.

3.3. Downscaled Caribbean Projections at 1.5, 2.0, and 2.5 °C

3.3.1. Temperature

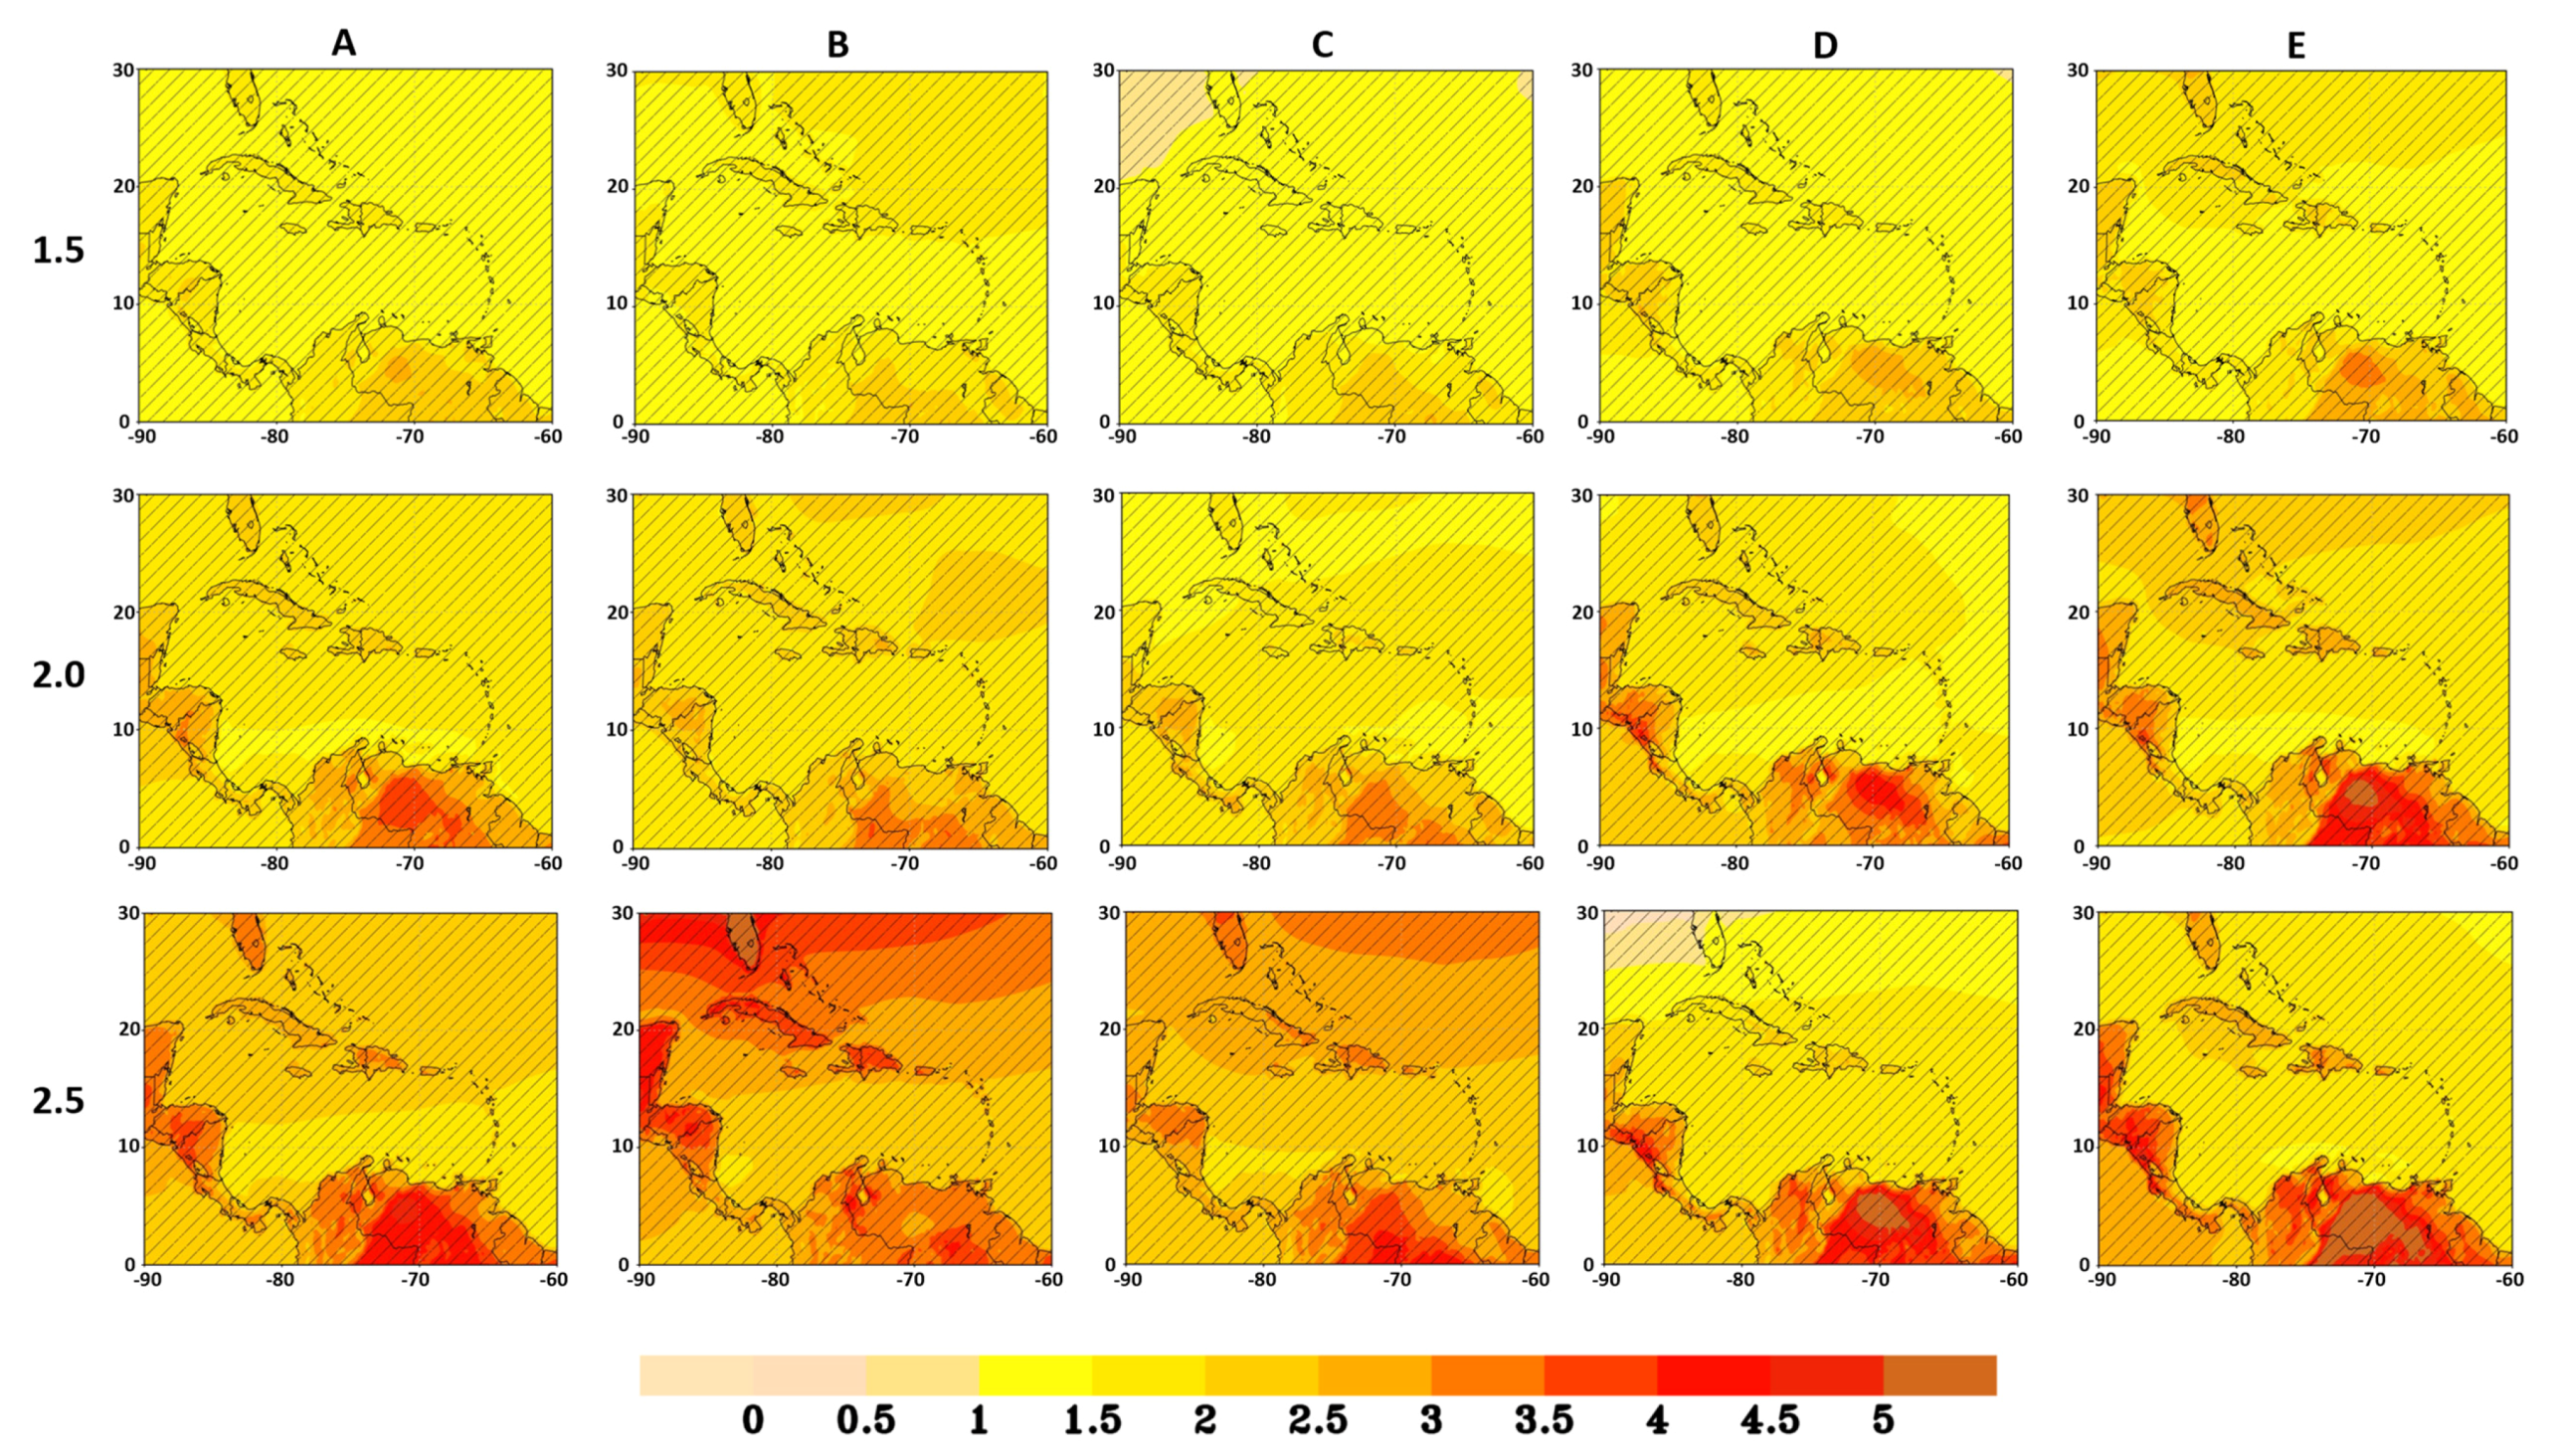
Figure 7 shows annual and seasonal temperature anomaly maps. The annual maps (Figure 7, column A) show that at 1.5 °C, ocean areas are approximately 1.0° warmer than the present-day baseline period (1960–1990), while warming across land areas ranges from 1.5 to 2.5 °C. Highest land warming occurs over the parts of northern South America shown in the domain, specifically over southern Guyana and Suriname. The domain progressively warms for each of the higher LTTGs. At 2.0 °C, much of the Caribbean Sea is covered by a warm anomaly of 1.5 °C, except for the far-south Caribbean Sea just off the coast of South America which is slightly cooler (~1.0 °C). The Caribbean island masses are slightly warmer (~2.0 °C), while across much of northern South America, the warming is between 2.5 and 3.0 °C. At 2.5 °C, the north Caribbean Sea above 15° N is about 2.0 °C, while the south Caribbean Sea is slightly cooler (~1.5 °C). The larger north Caribbean islands exhibit a 2.5 °C anomaly, while across northern South America, the warming is up to 3.5 °C across southern Guyana and southern Suriname. Corresponding maps in Reference [2] showed little to no distinction even between the larger Caribbean land masses and the surrounding Caribbean Sea. This suggests a benefit of downscaling.
Projections by season are also shown. Irrespective of global warming target, the largest anomalies over the main Caribbean basin occur in NDJ (column B) and ASO (column E), whilst MJJ (column D) consistently shows smallest anomalies for the same region (i.e., in comparison to the other seasons for a given global threshold). It is the cooler months that warm most, suggesting a future Caribbean that is generally warm year-round. Other observations are:
  • NDJ is dominated by north–south stratification in warming (column B). At 1.5 °C, whereas the south Caribbean Sea has a warm anomaly of 1 °C, above 18° N, it is 1.5 °C, including the panhandle of Florida. Further stratification, particularly at 2.5 °C, means that at higher global warming targets, the coolest parts of the domain in the far north will warm more than the normally warmer parts of the South Caribbean Sea in NDJ.
  • The pattern seen in NDJ is generally mimicked in ASO (column E), with largest warming in the northwest at 1.5 °C. Warming extends southward at the higher LTTGs, with a warm anomaly of 1.5 °C engulfing the entire region at LTTG 2.5 °C. Land masses are always warmer than the surrounding ocean.
  • In FMA, the warm anomaly across the Caribbean Sea is 1.0 °C at LTTG 1.5 °C, increasing to 1.5 °C from eastern Cuba to the lesser Antilles and southward to South America at 2.0 °C. Interestingly, the far northwest of the domain is cooler than the south Caribbean Sea for 2.0 °C, which is a reversal of what is seen in ASO. At 2.5 °C, there is again stratification with the north warmer than the south, as is seen in NDJ.
  • In MJJ, the Caribbean Sea has a warm anomaly of 1.0 °C at LTTG 1.5 °C. This increases to 2.0 °C over the northwest of the domain and over the island chain at LTTG of 2.0 °C. The region generally maintains this magnitude warming at the highest global warming target. The exception is in the western Caribbean (Belize), which warms slightly more at 2.5 °C.
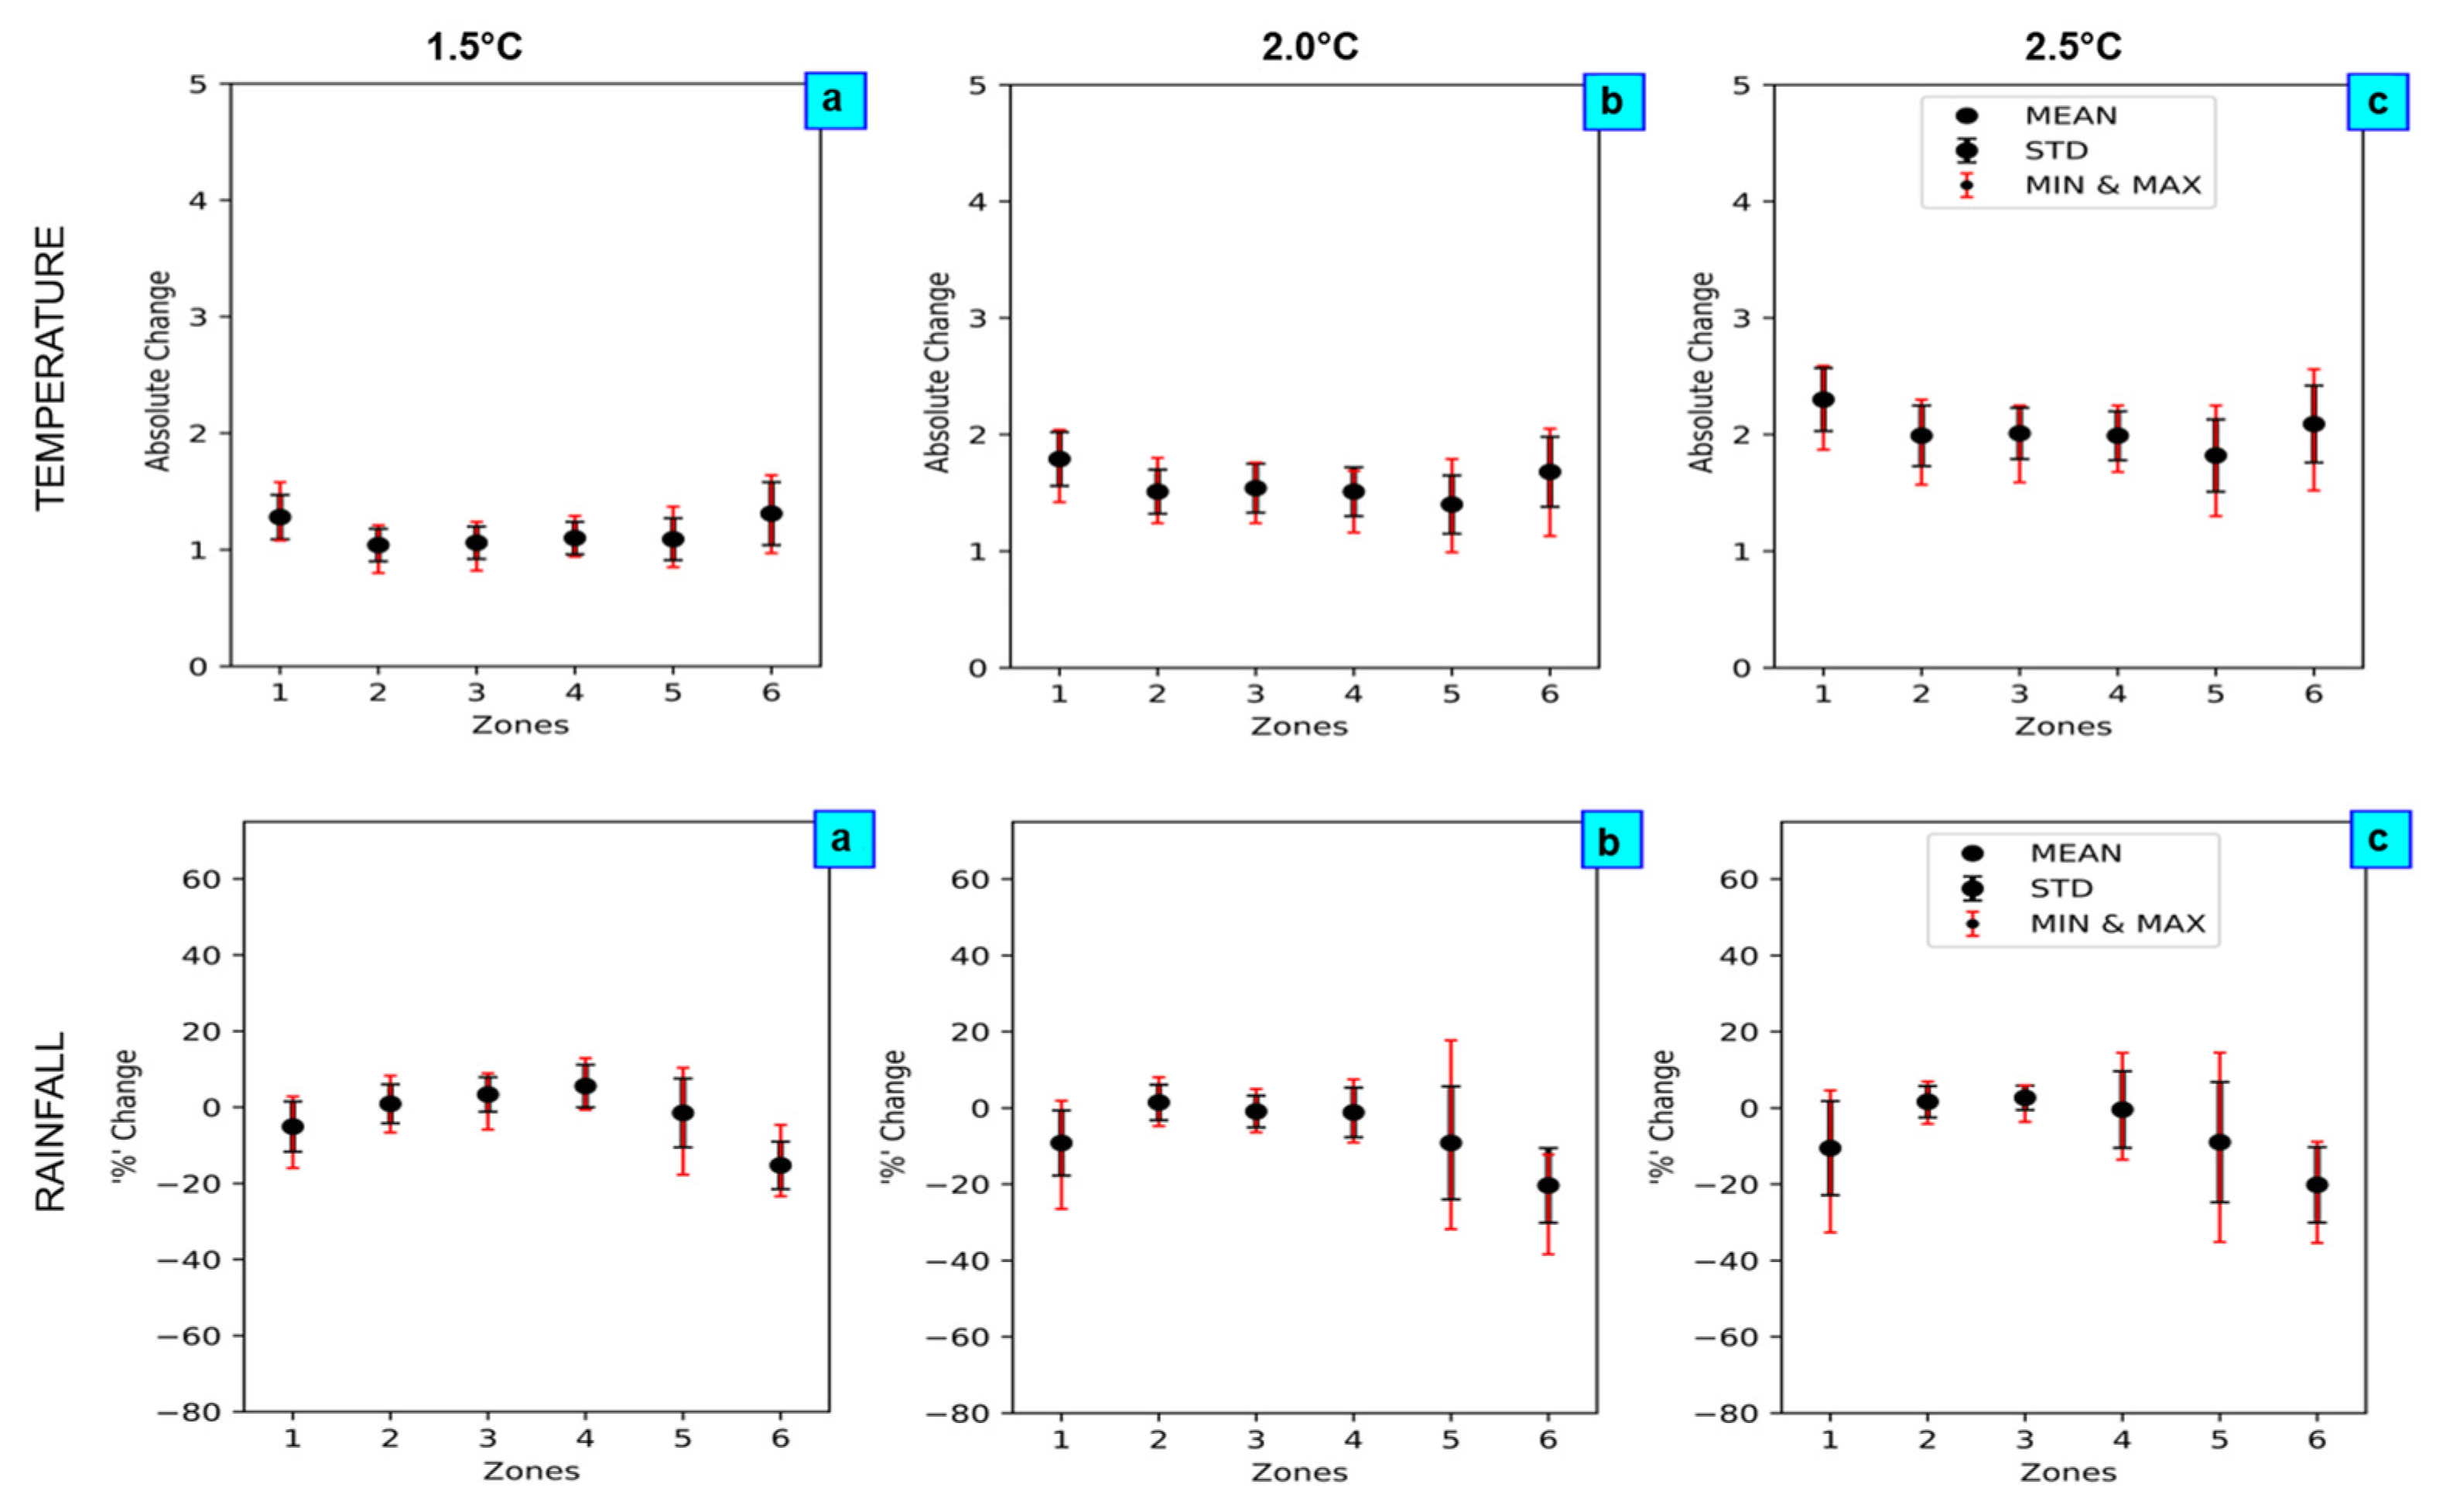
Table 4 and Figure 8 (top panels) show the ensemble maximum, minimum, and mean annual warming at each LTTG for each of the six Caribbean sub-regions previously defined. For all sub-regions, there is consistency in the sign across ensemble minimum through maximum irrespective of LTTG, with greater warming for successively higher global warming targets. In fact, when prior warming is considered, the ensemble mean values suggest that the sub-regions are in general only slightly cooler (zones 2 through 5) or almost equal to (zones 1 and 6) the mean global warming. The zones capturing the continental Caribbean territories (zones 1 and 6) show largest warm anomalies. This is also true for all seasons (not shown).
The mean annual warming across the island zones (zones 2, 3, 4, and 5) is of similar magnitude at 1.5 °C, with a difference of 0.06 °C between coolest and warmest zones. This increases to 0.14 °C at 2.0 °C and 0.19 °C at 2.5 °C, suggesting greater regional differentiation in warming for successively higher LTTGs. This is primarily due to smaller changes in zone 5 (compared to zones 2, 3, and 4) for each 0.5 °C LTTG change, which is consistent with a southward spreading of warming for the higher LTTGs. The more northern subregions (zones 2, 3, and 4) generally have larger warm anomalies than the south. This suggests a convergence of temperatures across the main Caribbean basin at the highest global warming targets since climatologically, the south is warmer that the north (see again Figure 2a).
Zone 1 (Belize) shows the largest change in mean annual warming (0.51 °C) for the half a degree transition from 1.5 to 2.0 °C. In comparison, changes for zones 2, 3, and 4 are 0.47, 0.48, and 0.41 °C respectively, while zone 5 (the eastern Caribbean) and zone 6 (south-eastern Caribbean) show smaller changes (0.31 and 0.37 °C, respectively). This pattern of change is replicated for the half a degree change from LTTG 2.0 to 2.5 °C. That is, zone 1 again shows maximum change in the mean annual warming (0.51 °C), followed by zones 2, 3, and 4 (between 0.46 and 0.48 °C). Though zones 5 and 6 again show smallest change (0.42 and 0.41 °C, respectively), it is noteworthy that the difference in the mean change is larger for the transition between LTTGs 2.0 and 2.5 °C than for 1.5 to 2.0 °C. This is again consistent with the southward spread of warming in the region for higher global warming targets.

3.3.2. Rainfall

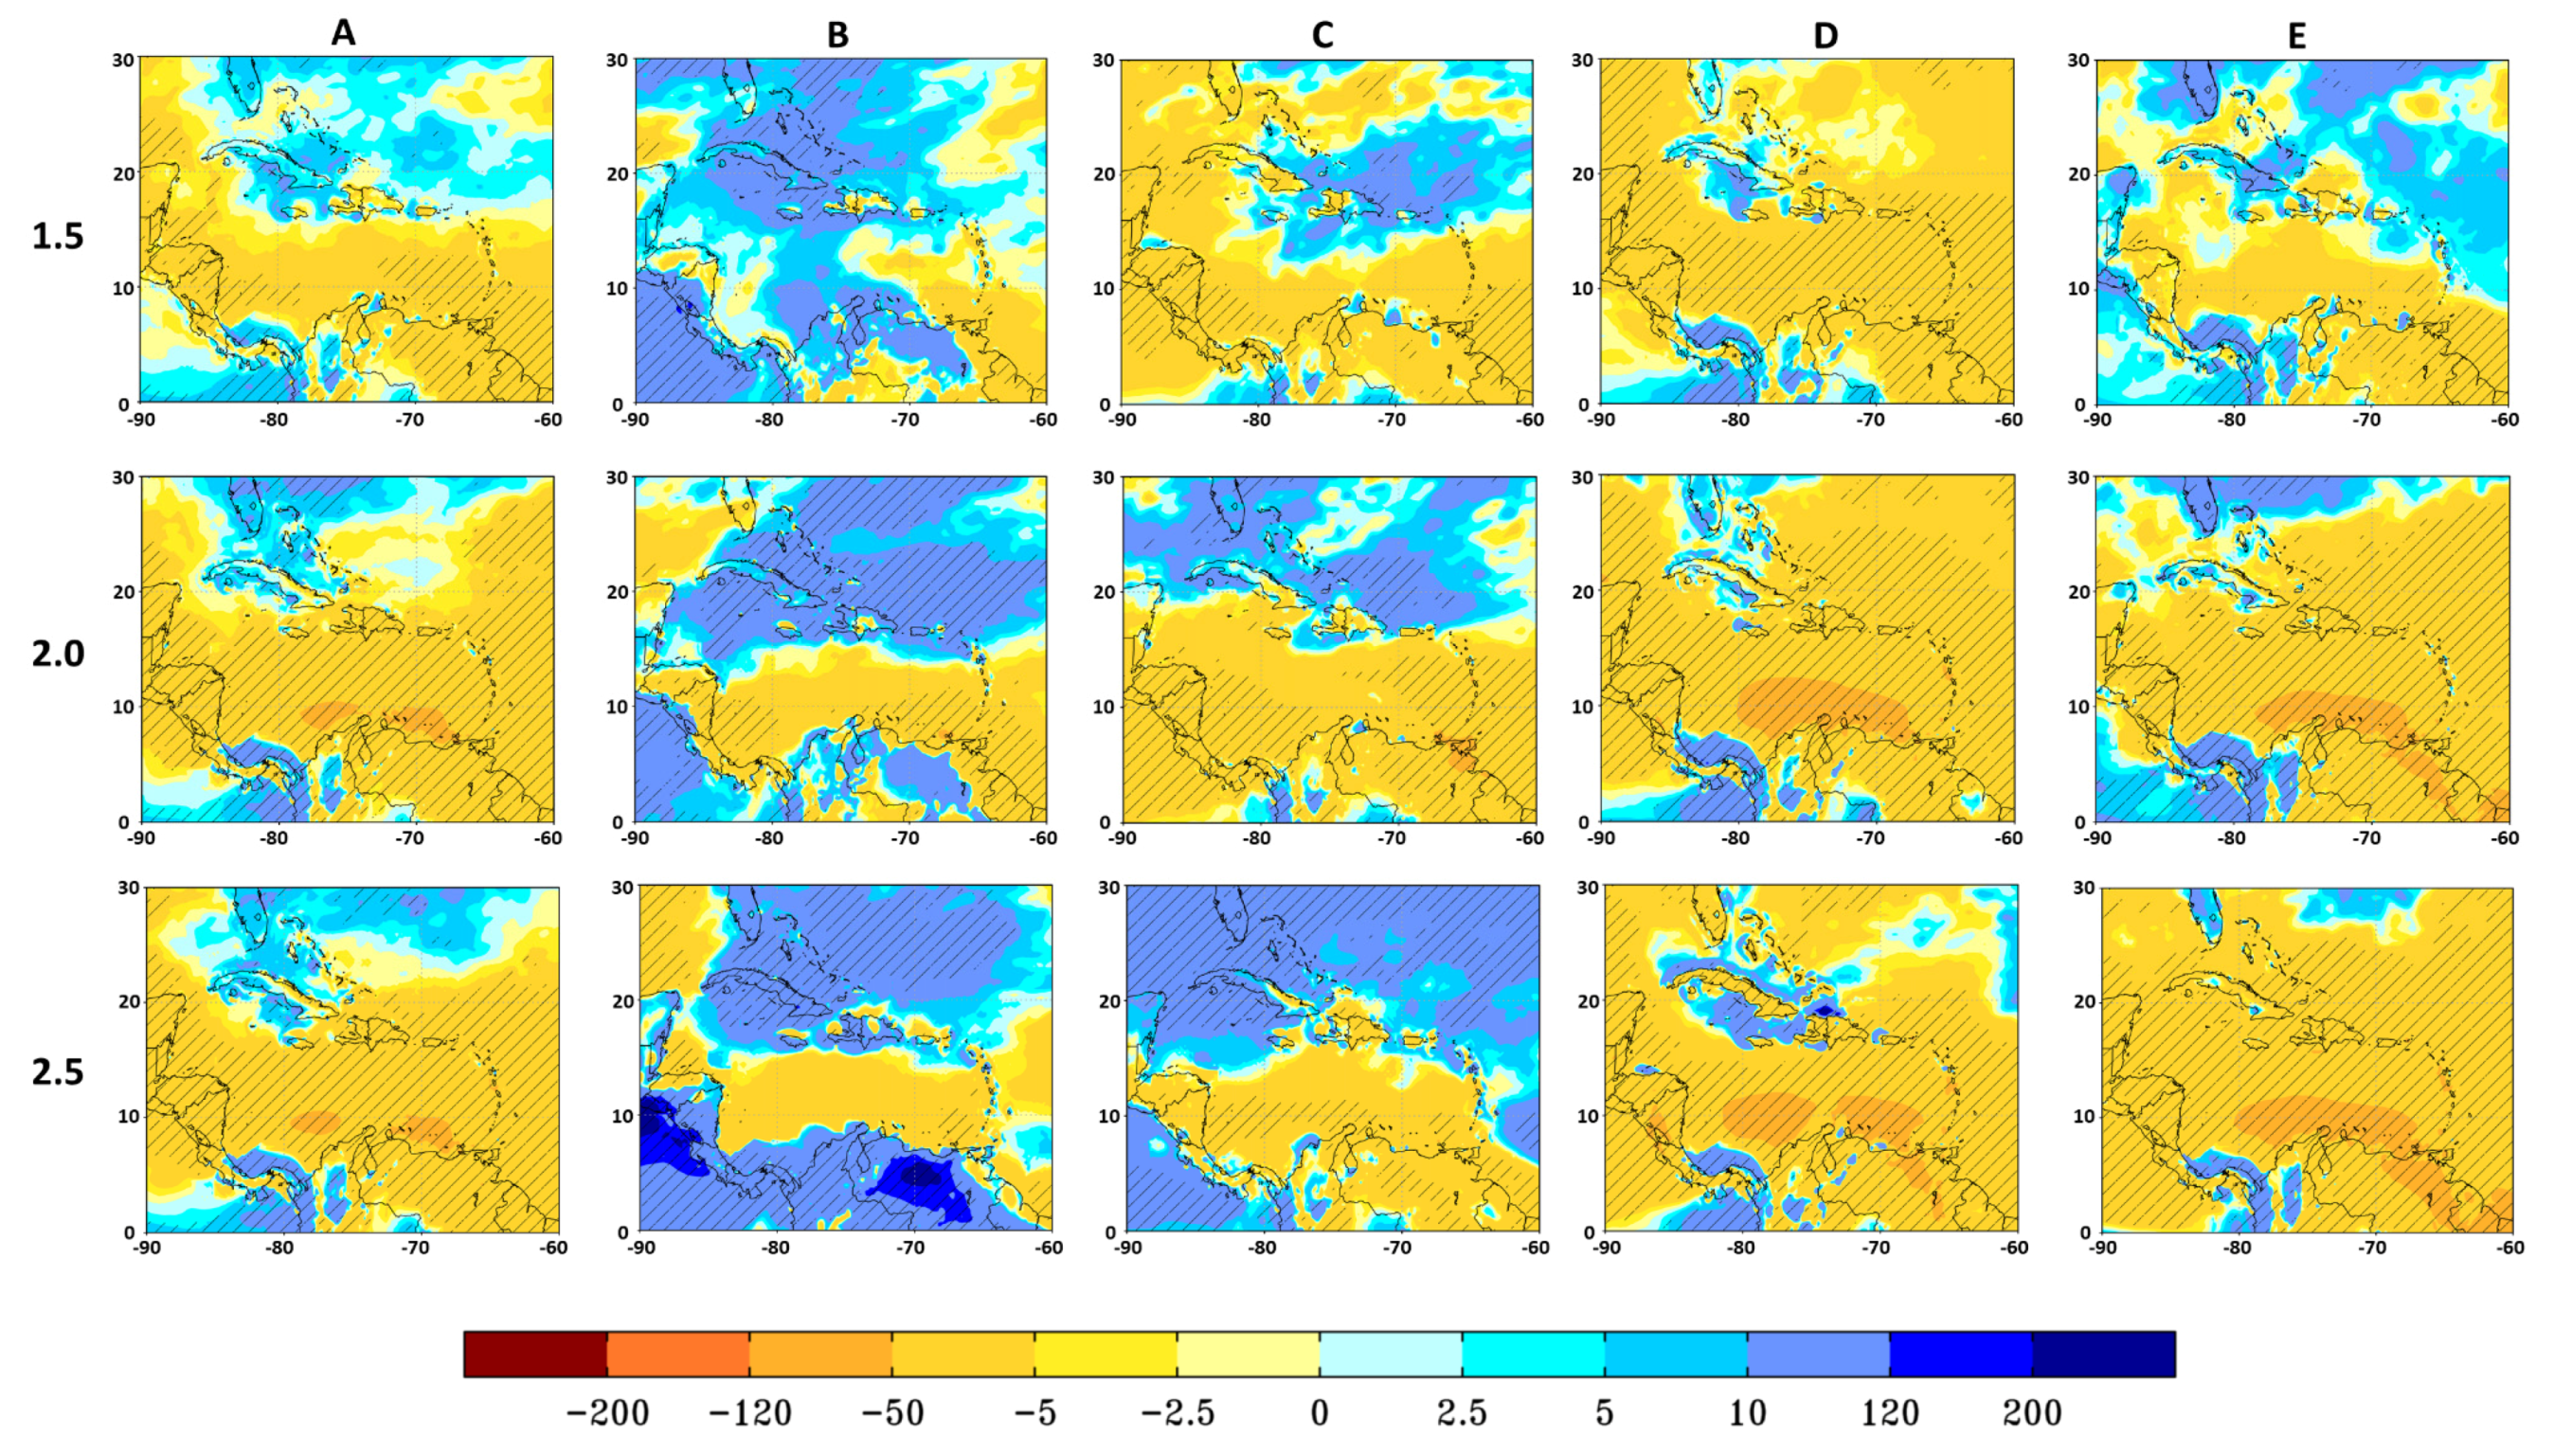
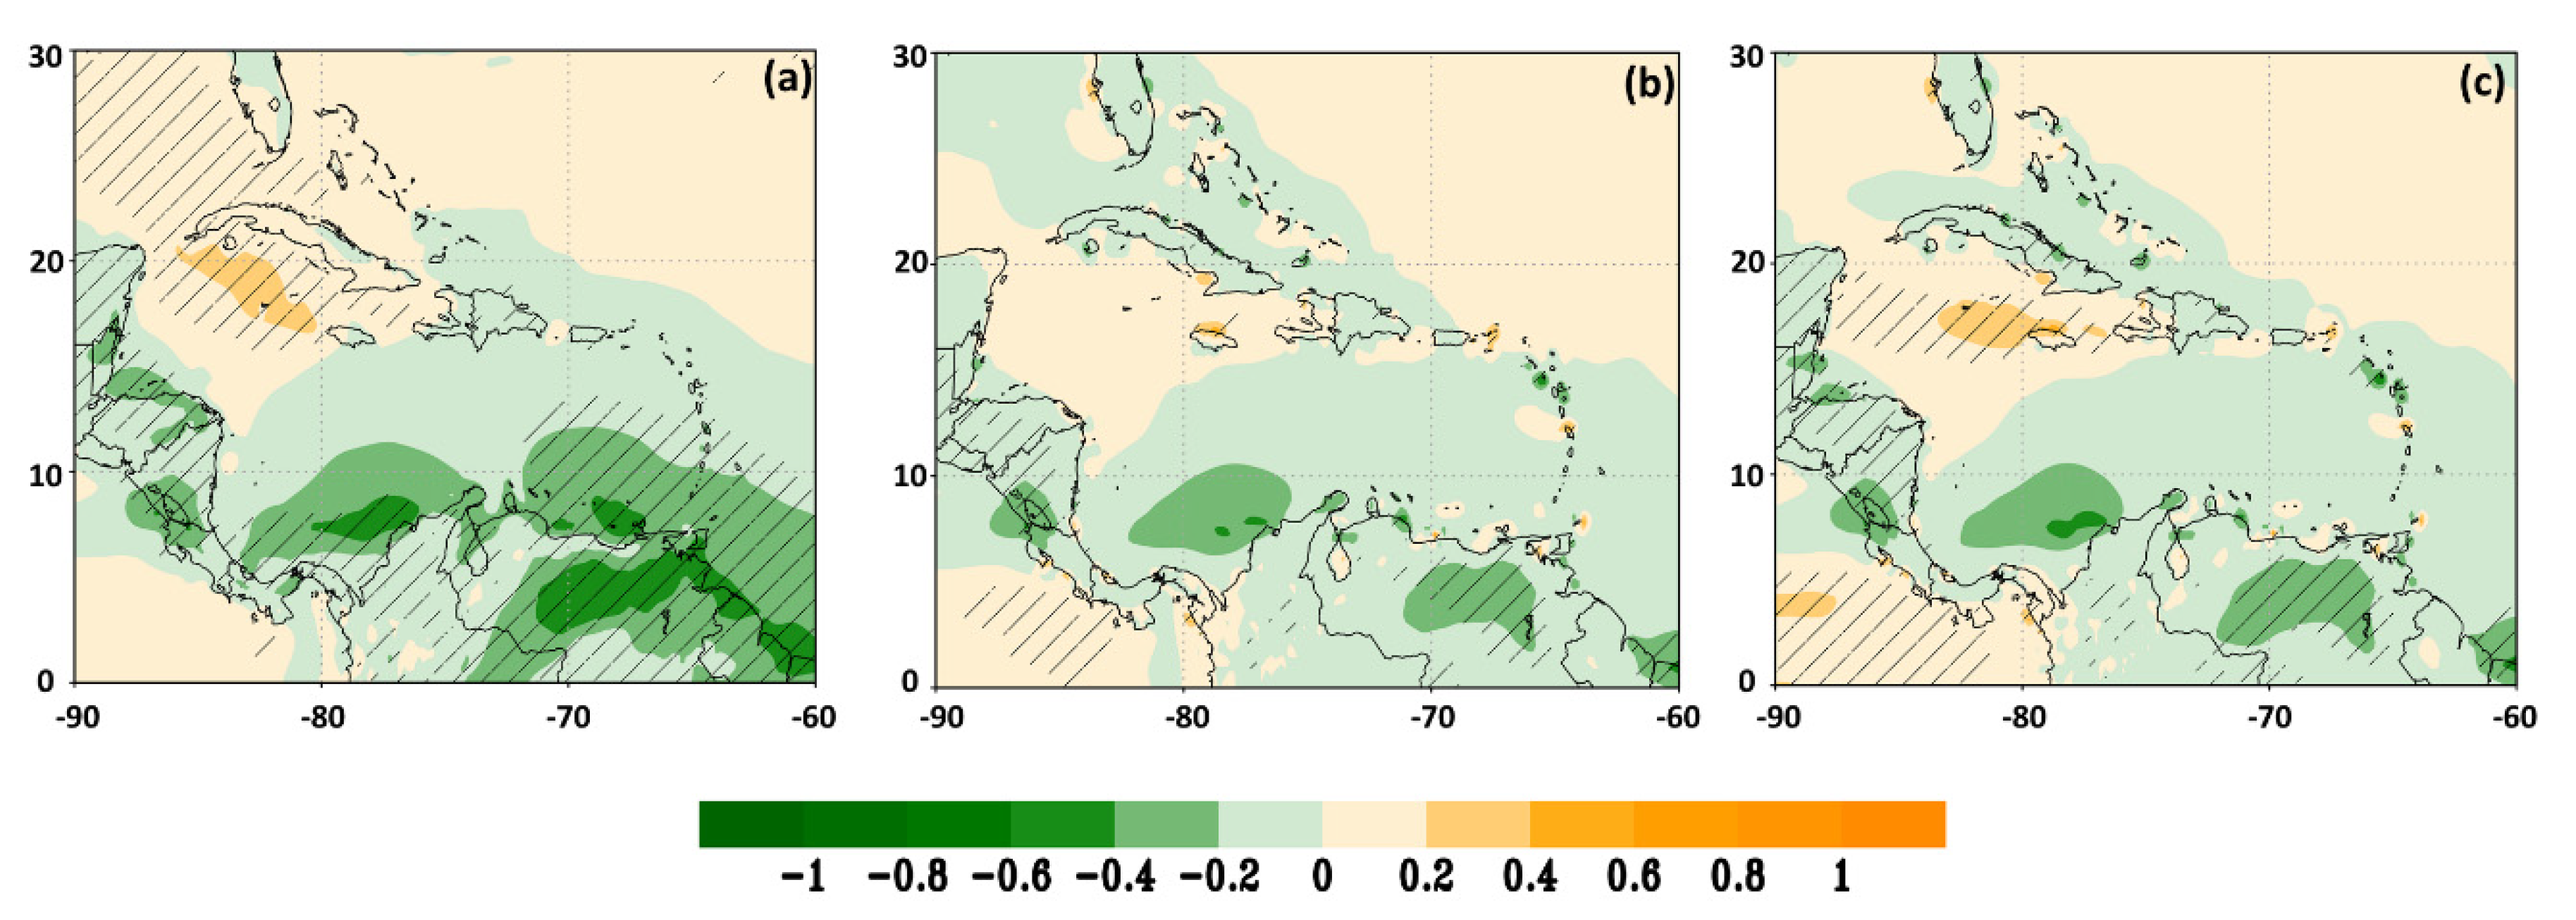
The Caribbean basin is projected to be significantly drier compared to the baseline period at all three global warming targets (Figure 9). At 1.5 °C, largest drying is over the south Caribbean Sea and over the southeast portion of the domain, including the northern parts of South America (Column A). Drying in the latter region is statistically significant. While the north and northwest Caribbean (including the Bahamas, Cuba, Hispaniola, and Jamaica) and those islands of the Lesser Antilles above ~18° N latitude show small increases (5–10%) or negligible drying, the Caribbean below this latitude shows drying of up to 50%. There are two regions in the domain where the drying exceeds 50%. The first is over the ocean north of Guyana and Suriname, spreading westward across the southern Lesser Antilles (Trinidad and Tobago, Grenada Barbados) and into the eastern Caribbean Sea. The second region occupies the southwestern Caribbean Sea in the vicinity of the Caribbean Low-Level Jet (CLLJ) region. Interestingly, the intense drying in the latter region coupled with the up to 10% wet anomalies over eastern Panama and western Colombia may be indicative of a strengthened CLLJ.
At the two higher warming thresholds, the statistically significant drying in the southeast and southwest of the basin now engulfs the entire Caribbean in the annual maps. As a result, at LTTGs 2.0 and 2.5 °C, most of the Caribbean islands (except for the far-north Bahamas and western Cuba) are 10% to 50% or more drier than for the baseline period. The dry anomalies are statistically significant. For these two higher global warming targets, wet anomalies seen in the far north of the domain (east of Florida) still exist. However, only at 2.0 °C are these latter changes statistically significant. The wet anomalies over Panama and western Colombia persist at the two higher global warming targets and are statistically significant.
Some things to note about the seasonal projections (Columns B through E) are:
  • In NDJ (column B), at 1.5 °C, most of the islands of the Caribbean are projected to be 5–50% wetter, except in the vicinity of Trinidad and Tobago and the northern parts of Guyana and Suriname, which are projected to be 5–10% drier. Only changes in the northwest are statistically significant. At 2.0 and 2.5 °C, the dry anomalies in the southeastern Caribbean extend westward to cover the south Caribbean Sea. Notwithstanding that the north Caribbean region has wet anomalies even at the higher warming targets, the magnitude of the change seen may not be sufficient to offset the drying associated with the two wet seasons.
  • In FMA (column C), irrespective of global warming threshold, all the land masses in the domain (except western Cuba and the Bahamas at the higher two LTTGs) generally show a drying tendency (between 5% and 50%), with largest percentage drying in the southern Lesser Antilles and over the continental land masses. The drying is generally of the same magnitude, with little evidence of intensification for higher warming targets. In contrast, the ocean in the northeast of the domain is projected to be wetter at 1.5 °C, with the region of wet anomalies intensifying and covering much of the northwest Caribbean at 2.0 and 2.5 °C. Panama and the surrounding Caribbean Sea show a drying tendency for all three warming targets.
  • The MJJ patterns (column D) largely mirror the annual maps. The Caribbean region south of 18° N is projected to be drier than baseline, with a westward spreading of drying from the south-eastern Caribbean into the eastern Caribbean Sea as well as from the southwest Caribbean Sea northward for progressively higher global warming targets. Panama in contrast is wetter than baseline for all three temperature targets. There is a reversal in signal over Cuba, i.e., from a weak wet tendency at 1.5 °C (not statistically significant) to statistically significant drying at 2.0 and 2.5 °C.
  • Changes in ASO (column E) show for successively higher global warming targets a northward spreading of the region of maximum drying from the southeast Caribbean Sea to cover the entire Caribbean, including Bahamas in the north at LTTG 2.5 °C. The drying is statistically significant over much of the domain for the two higher LTTGs.
Table 5 and Figure 9 (lower panels) are identical to Table 4 and Figure 7 but for percentage change in annual rainfall for each of the six Caribbean sub-regions. The extent of wetting or drying is not uniform across the region at each threshold level and as the global warming target increases.
We note the following:
  • For zones 1 and 6, irrespective of the LTTG, the ensemble mean indicates drying. This is also true for all seasons except in FMA for zone 1 at 1.5 °C (not shown). The annual mean is 16% (5%) drier than the current-day baseline for zone 6 (zone 1) at 1.5 °C, and 20% (9%) at 2.0 °C. The extent of drying then remains fairly constant at 20% (10%) for the further half a degree of global warming to 2.5 °C. That is, there is a larger reduction in rainfall for Belize, Guyana, and Suriname for the half a degree transition to 2.0 °C than for the further half a degree change from 2.0 to 2.5 °C. Zone 6 consistently shows largest drying and there is a consensus in sign across ensemble maximum and minimum. The southeastern Caribbean seems most impacted for higher degrees of global warming.
  • Projected changes in zone 5 are not dissimilar to those for zone 6, again suggesting that the eastern and south-eastern Caribbean display a sensitivity and tendency to dry first (compared to the north and north-western Caribbean) in the face of global warming. The ensemble mean suggests that zone 5 is 1.6% drier than the current-day baseline at 1.5 °C, increasing to 9% at 2.0 and at 2.5 °C. It is again noted that 1.5 °C seems to represent a threshold in the east and south-eastern Caribbean, above which there is significant further drying for the next half a degree of global warming. Thereafter, however, the extent of drying in comparison to the baseline remains fairly constant for further comparable global warming.
  • Seasonal analysis (not shown) for zones 3 and 4 both show a reversal of tendency from slightly wet in ASO at 1.5 °C to considerably drier (6% and 11%, respectively) at 2.0 °C and even further drying (7% and 19%, respectively) at 2.5 °C (in fact, we note that for the peak rainy season, ASO, generally all zones increasingly dry between LTTGs 1.5 and 2.5 °C). For zones 3 and 4, all other seasons have a wet tendency for all LTTGs, which is however not sufficient to offset the significant drying in the wet seasons at 2.0 °C. Consequently, the mean annual rainfall shows slight reductions at 2.0 °C. Again, 1.5 °C seems to indicate a threshold for change, in this case a reversal of tendency for zones 3 and 4. At 2.5 °C, however, whereas the annual mean indicates slight drying for zone 3, it indicates slight wetting for zone 4.
  • Zone 2 (western Cuba) is projected to always be negligibly wetter in the annual for all three global warming targets. There is no intensification of the wet tendency, however, for successively higher global warming targets. Except for zone 2, then, all other zones become drier in the annual for the half a degree global warming from 1.5 to 2.0 °C.

4. Discussion

The picture of the Caribbean that emerges is one where everywhere in the domain warms for successively higher LTTGs. This is true for both the annual and seasonal time scales. Seasonally, the coolest months are projected to warm the most, especially for the highest LTTG. In all instances, warming over continental areas and large land masses exceed that of oceanic areas. The sub-regional analysis shows that as opposed to mirroring the mean Caribbean, which is always a few tenths of a degree cooler than the global average, some zones approximate or exceed the LTTG, e.g., zone 1 (Belize) and zone 6 (south-eastern Caribbean), in some seasons (e.g., ASO). The relatively cooler northern zones generally experience the greater warming moving from 1.5 to 2.0 °C, with zone 1 (Belize) showing the largest change. The eastern Caribbean (zone 5) and the south-eastern Caribbean (zone 6) tend to have lowest magnitude warming for each half a degree change in global mean temperature.
With respect to precipitation, the Caribbean is projected to receive significantly less rainfall at consecutively higher warming thresholds. Statistically significant drying is restricted to the southern extents of the Caribbean basin at 1.5 °C but stretches to encompass the entire basin for 2.0 and 2.5 °C in the annual mean. The sub-regional analysis supports the idea that the Caribbean is not homogeneous in its rainfall response to successively higher global warming targets. For example, it is Belize in the far west and Suriname and Guyana in the far south and to a lesser extent, the eastern Caribbean island chain, that immediately dry at 1.5 °C. For these areas, 1.5 °C represents a significant threshold. The region-wide drying that emerges at 2.0 °C is thereafter largely maintained in location and intensity at 2.5 °C. It is noteworthy that the half of a degree change between LTTGs 1.5 and 2.0 °C represents an intensification of the drying trend for the far west, east, and south-eastern Caribbean, but a reversal of the wet tendency over the north and north-central Caribbean. Notwithstanding the general tendency for drying across the domain, especially at 2.0 and 2.5 °C, there are regions that experience increases in rainfall totals (even at these highest global warming targets). These include the eastern sections of the Florida panhandle and the Bahamas, as well as Panama and western Colombia. Increases in these areas are, however, only significant at the higher LTTGs. Figure 10 suggests that stronger trades and an intensification in the CLLJ at higher LTTGs may in part account for the entrenchment of the drying trend in the main Caribbean basin and the progressively wetter signal over Panama. The southern Caribbean is projected to have increases in the strength of the easterlies of between 0.2 and 0.4 m/s at 1.5 °C, which further increase (up to 0.6 m/s) at 2.0 and 2.5 °C. Maximum anomaly increase occurs in the CLLJ region of the southwest Caribbean and north of Panama. There is, in contrast, evidence of decreasing wind speeds in the northwest of the domain, which is consistently with slightly wetter conditions in the far north Caribbean.
Irrespective of LTTGs examined, the mean annual pattern is driven either by significant drying in the wet seasons of MJJ and ASO and/or increases in rainfall totals in the dry seasons spanning NDJ to FMA (except the south-eastern Caribbean, which always dries irrespective of seasons). For example, at 1.5 °C in the far-north Caribbean, the increase in rainfall during the dry season is seemingly enough to compensate for wet season decreases and annual changes are therefore small. Elsewhere, at the same global temperature target, it is the wet seasons’ tendency (especially ASO) that drives the overall tendency for the annual mean. For higher warming targets, the annual tendency is dominated by the drying during the wet season, i.e., even if there are increases noted during the traditional dry season, it is insufficient to offset the reductions seen during the wet season.
It is noted that this study largely focused on mean temperature and rainfall which, though important to several climate-sensitive sectors, do not capture changes in extreme climate (e.g., warm spells, intense rainfall, and droughts). There is also a need to fully explore the regional dynamics which account for the changes seen. Further analysis should evaluate how (for example) the model reproduces the CLLJ, upper-level winds, vertical shear, and moisture convergence, and what changes are projected for them in the future. These are also valuable for exploring the deficiencies of RCMs or GCMs, especially in the early rainfall season and over the southwest of the domain studied. Future research will examine seasonal and annual projections for individual nation states which are resolvable at the higher resolutions. The research will quantify not just the change in climate regime for the countries as a whole but for as many of its sub-divisions as possible.

5. Conclusion

The results of the study contribute to ongoing discussions about the challenge of climate change for the Caribbean. We conclude the following:
  • The Caribbean is right to advocate limiting global warming to 1.5 °C.
Prior to Reference [2], projection studies for the Caribbean all employed the time-sliced approach, i.e., provided insights into the future climate at specific periods in the future. In many cases, the time-periods analyzed are the mid-century and/or end-of-century, when there is greater certainty about the emergence of a clear climate signal on which a call to action can be premised. The time slice approach is also particularly useful since it provides information at periods that sync with long-term development planning horizons. The approach, however, sometimes (inadvertently) contributes to a lack of urgency with respect to action needed in response to the climate change threat, since it ties climate change to future periods which seem distant, and for which it is assumed there will still be time to prepare. This study makes a case for urgent global action with respect to global warming by firstly corroborating that the attainment of the 1.5 °C global warming threshold may be within the next 10 years under a high emissions scenario. For the same pathway, the attainment of even the highest LTTG examined (2.5 °C) would be just after mid-century. Given the resource constraints in the Caribbean and the cost of adaptation, it is imperative that warming thresholds be limited.
This study supports the notion that 1.5 °C does represent some kind of threshold for the Caribbean with respect to changes in Caribbean climate. For example, as shown, there is a reversal of a wet tendency in parts of the northern Caribbean, moving from 1.5 to 2.0 °C. This suggests that adaptation planning in the north Caribbean must of necessity allocate resources to account for both states of change. At the same time, Belize and the south-eastern Caribbean must likewise respond, but to an intensifying dry trend, which is already evident at 1.5 °C. It is correspondingly important to note that the simulated changes from 2.0 to 2.5 °C indicate a further drying and warming of the entire Caribbean, though to differing extents depending on sub-region, i.e., there is not a reversal of conditions to a 1.5 °C state. This further supports the idea that 1.5 °C represents a threshold for the region. The Caribbean must therefore continue to advocate for greater global efforts at mitigation to slow the attainment of 1.5 °C as well as greater resources to adapt to the changes in climate it will face even at that LTTG, and certainly beyond.
  • The Caribbean must develop an ensemble of high-resolution simulations for use in climate change studies for the region.
There has been much development in the region over the last two decades with respect to the generation of future projections from dynamical models [75]. As climate change manifestations become clearer at the island and sub-island scale, there is a need for more high-resolution model projections to support the growing number of impact studies (see for example studies on agriculture in Jamaica [6], water availability in Barbados [76], hydropower in Suriname [5], or country vulnerability rankings [77]). The need for these kinds of studies for the region will only continue to grow. Similar, then, to the initial GCM-driven efforts to produce climate projections, there is a need for a comparable effort to produce a large ensemble pool of high-resolution simulations which express the range of possible futures. It could even be argued that the absence of a large ensemble of such high-resolution simulations may have been a limiting factor to more locally focused impact studies being currently available.
This study adds an ensemble of six high-resolution simulations to the pool of available simulations for use in producing future island and sub-island scale climate profiles. The use of an ensemble helps instill confidence (through consensus) in the changes simulated. The use of the perturbed physics approach was also well-suited for the Caribbean as it employed an already validated RCM for the region (PRECIS), as opposed to, for example, running multiple RCMs, thus limiting the complexity and resources required to generate a range of future high-resolution scenarios. The study also corroborates that the driving model demonstrates reasonable skill in reproducing the present-day global-scale climatological patterns of select atmospheric variables across the Caribbean basin, which adds confidence that the model-produced future projections are also plausible.
The study also makes a case for even greater specificity of future climate information. Though a regional view of changes in the Caribbean due to global warming is instructive, it masks changes seen at the sub-regional or country level, where planning really takes place. This is particularly evident in the sub-regional focus of this study, which established that there are differences in how climate change manifests itself across even a small region like the Caribbean. These changes are driven in part by factors such as location (e.g., north versus south) and size (e.g., island versus continental), and are in most instances more pronounced or reflect reversals of the changes seen at the regional level. By employing regional climate models at resolutions of 25 km or better, one is also able to better resolve the topographic and coastal features of even the small islands within the Caribbean. Consequently, there is an opportunity to simulate key features such as orographically driven variations in precipitation [78]. This is seen to some extent in the rainfall maxima noted over some of the larger Caribbean islands and South American high mountain regions. This study shows what is possible, while helping to make an urgent case for more dynamically downscaled studies to provide projections for the sub-island scale.
Climate change is an existential threat to the Caribbean [1,2,3,4,5,6]. The value of this study lies in its attempt to address a deficiency in the number of high-resolution projection studies available for the Caribbean, especially for the LTTGs. It represents a further contribution to building regional resilience both by the results it presents but also by the future opportunities it will facilitate, e.g., through further use of the high-resolution ensemble dataset.

Author Contributions

Conceptualization, J.D.C. and M.A.T.; methodology, J.D.C. and M.A.T.; software, J.D.C.; validation, J.D.C.; formal analysis, J.D.C., M.A.T. and A.B.-M.; data curation, J.D.C. and A.B.-M.; writing—original draft preparation, J.D.C., M.A.T. and L.A.C.; writing—review and editing, J.D.C., M.A.T., A.C.-A., A.B.-M., T.S.S., L.A.C. and K.A.S.; visualization, J.D.C., A.B.-M. and L.A.C. All authors have read and agreed to the published version of the manuscript.

Funding

This paper has been produced with support from the Inter-American Development Bank (IDB) under the Caribbean Regional Track of the Pilot Program for Climate Resilience (PPCR) of the Climate Investment Funds (CIFs). The program is executed by The University of the West Indies, Mona (The UWI) through its Mona Office for Research and Innovation (MORI) in partnership with the Climate Studies Group Mona (CSGM).

Institutional Review Board Statement

Not applicable.

Informed Consent Statement

Not applicable.

Data Availability Statement

Publicly available datasets were analyzed in this study. This data can be found here: http://clearinghouse.caribbeanclimate.bz/ (accessed on 3 March 2021) and http://climexp.knmi.nl/ (accessed on 3 March 2021).

Acknowledgments

This study is a part of the Caribbean Modelling Initiatives 1.5 project that attempts to investigate the implications of global warming of 1.5, 2.0, and 2.5 °C above pre-industrial levels. Some of the model datasets were generated by the CSGM supported by funding under the PPCR, with additional model datasets provided by the Instituto de Meteorología, and the Caribbean Community Climate Change Centre. This research was also supported by the SUPERCLIMA project executed under the Cuban National Research Program “Climate Change in Cuba: Impacts, Mitigation and Adaptation”.

Conflicts of Interest

The authors declare no conflict of interest.

References

  1. Sealey-Huggins, L. ‘1.5 °C to stay alive’: Climate change, imperialism and justice for the Caribbean. Third World Q. 2017, 38, 2444–2463. [Google Scholar] [CrossRef] [Green Version]
  2. Taylor, M.A.; Clarke, L.A.; Centella, A.; Bezanilla, A.; Stephenson, T.S.; Jones, J.J.; Campbell, J.D.; Vichot, A.; Charlery, J. Future Caribbean climates in a world of rising temperatures: The 1.5 vs 2.0 dilemma. J. Clim. 2018, 31, 2907–2926. [Google Scholar] [CrossRef]
  3. Mycoo, M.A. Beyond 1.5 °C: Vulnerabilities and adaptation strategies for Caribbean Small Island Developing States. Reg. Environ. Chang. 2018, 18, 2341–2353. [Google Scholar] [CrossRef] [Green Version]
  4. Benjamin, L.; Thomas, A. 1.5 to stay alive? AOSIS and the long term temperature goal in the Paris Agreement. SSRN Electron. J. 2016. [Google Scholar] [CrossRef]
  5. Donk, P.; Van Uytven, E.; Willems, P.; Taylor, M.A. Assessment of the potential implications of a 1.5 °C versus higher global temperature rise for the Afobaka hydropower scheme in Suriname. Reg. Environ. Chang. 2018, 18, 2283–2295. [Google Scholar] [CrossRef]
  6. Lallo, C.H.O.; Cohen, J.; Rankine, D.; Taylor, M.A.; Campbell, J.; Stephenson, T. Characterizing heat stress on livestock using the temperature humidity index (THI)—Prospects for a warmer Caribbean. Reg. Environ. Chang. 2018, 18, 2329–2340. [Google Scholar] [CrossRef] [Green Version]
  7. UNFCCC Report. In Proceedings of the Parties on Its Twenty-First Session, Paris, France, 30 November–13 December 2015.
  8. Intergovernmental Panel on Climate Change (IPCC). Global Warming of 1.5 °C.An IPCC Special Report on the Impacts of Global Warming of 1.5 °C above Pre-Industrial Levels and Related Global Greenhouse Gas Emission Pathways, in the Context of Strengthening the Global Response to the Threat of Climate Change; Masson-Delmotte, V., Zhai, P., Pörtner, H.-O., Roberts, D., Skea, J., Shukla, P.R., Pirani, A., Moufouma-Okia, W., Péan, C., Pidcock, R., et al., Eds.; World Meteorological Organization: Geneva, Switzerland, 2018. [Google Scholar]
  9. Karmalkar, A.V.; Taylor, M.A.; Campbell, J.; Stephenson, T.; New, M.; Centella, A.; Benzanilla, A.; Charlery, J.A. Review of observed and projected changes in climate for the islands in the Caribbean. Atmosfera 2013, 26, 283–309. [Google Scholar] [CrossRef] [Green Version]
  10. Hall, T.C.; Sealy, A.M.; Stephenson, T.S.; Kusunoki, S.; Taylor, M.A.; Chen, A.A.; Kitoh, A. Future climate of the Caribbean from a super-high-resolution atmospheric general circulation model. Theor. Appl. Climatol. 2013, 113, 271–287. [Google Scholar] [CrossRef]
  11. Campbell, J.D.; Taylor, M.A.; Stephenson, T.S.; Watson, R.A.; Whyte, F.S. Future climate of the Caribbean from a regional climate model. Int. J. Climatol. 2011, 31, 1866–1878. [Google Scholar] [CrossRef]
  12. Emanuel, K.A. Climate and tropical cyclone activity: A new model downscaling approach. J. Clim. 2006, 19, 4797–4802. [Google Scholar] [CrossRef]
  13. Bender, M.A.; Knutson, T.R.; Tuleya, R.E.; Sirutis, J.J.; Vecchi, G.a.; Garner, S.T.; Held, I.M. Modeled impact of anthropogenic warming on the frequency of intense Atlantic hurricanes. Science 2010, 327, 454–458. [Google Scholar] [CrossRef] [PubMed] [Green Version]
  14. Knutson, T.R.; McBride, J.L.; Chan, J.; Emanuel, K.; Holland, G.; Landsea, C.; Held, I.; Kossin, J.P.; Srivastava, K.; Sugi, M. Tropical cyclones and climate change. Nat. Geosci. 2010, 3, 157–163. [Google Scholar] [CrossRef] [Green Version]
  15. Perrette, M.; Landerer, F.; Riva, R.; Frieler, K.; Meinshausen, M. A Scaling approach to project regional sea level rise and its uncertainties. Earth Syst. Dyn. 2013, 4, 11–29. [Google Scholar] [CrossRef] [Green Version]
  16. Horton, R.M.; Herweijer, C.; Rosenzweig, C.; Liu, J.; Gornitz, V.; Ruane, A.C. Sea level rise projections for current generation CGCMs based on the semi-empirical method. Geophys. Res. Lett. 2008, 35, 1–5. [Google Scholar] [CrossRef]
  17. Jones, P.D.; Harpham, C.; Burton, A.; Goodess, C.M. Downscaling regional climate model outputs for the Caribbean using a weather generator. Int. J. Climatol. 2016, 36, 4141–4163. [Google Scholar] [CrossRef] [Green Version]
  18. Antuña-Marrero, J.C.; Otterå, O.H.; Robock, A.; Mesquita, M.D.S. Modelled and observed sea surface temperature trends for the Caribbean and Antilles. Int. J. Climatol. 2016, 36, 1873–1886. [Google Scholar] [CrossRef]
  19. Glenn, E.; Comarazamy, D.; González, J.E.; Smith, T. Detection of recent regional sea surface temperature warming in the Caribbean and surrounding region. Geophys. Res. Lett. 2015, 42, 6785–6792. [Google Scholar] [CrossRef]
  20. Stephenson, T.S.; Vincent, L.A.; Allen, T.; Van Meerbeeck, C.J.; Mclean, N.; Peterson, T.C.; Taylor, M.A.; Aaron-Morrison, A.P.; Auguste, T.; Bernard, D.; et al. Changes in extreme temperature and precipitation in the Caribbean region, 1961–2010. Int. J. Climatol. 2014, 34, 2957–2971. [Google Scholar] [CrossRef]
  21. Alexander, L.V.; Zhang, X.; Peterson, T.C.; Caesar, J.; Gleason, B.; Klein Tank, A.M.G.; Haylock, M.; Collins, D.; Trewin, B.; Rahimzadeh, F.; et al. Global observed changes in daily climate extremes of temperature and precipitation. J. Geophys. Res. 2006, 111, D05109. [Google Scholar] [CrossRef] [Green Version]
  22. McSweeney, C.; New, M.; Lizcano, G.; Lu, X. The UNDP climate change country profiles. Bull. Am. Meteorol. Soc. 2010, 91, 157–166. [Google Scholar] [CrossRef] [Green Version]
  23. Intergovernmental Panel on Climate Change (IPCC). Managing the Risks of Extreme Events and Disasters to Advance Climate Change Adaptation. a Special Report of Working Groups I and II of the Intergovernmental Panel on Climate Change; Field, C.B., Barros, V., Stocker, T.F., Qin, D., Dokken, D.J., Ebi, K.L., Mastrandrea, M.D., Mach, K.J., Plattner, G.-K., Allen, S.K., et al., Eds.; Cambridge University Press: Cambridge, UK; New York, NY, USA, 2012; ISBN 978-1-107-60780-4. [Google Scholar]
  24. Burgess, C.P.; Taylor, M.A.; Spencer, N.; Jones, J.; Stephenson, T.S. Estimating damages from climate-related natural disasters for the Caribbean at 1.5 °C and 2 °C global warming above preindustrial levels. Reg. Environ. Chang. 2018, 18, 2297–2312. [Google Scholar] [CrossRef]
  25. Pulwarty, R.S.; Nurse, L.A.; Trotz, U.O. Caribbean islands in a changing climate. Environ. Sci. Policy Sustain. Dev. 2010, 52, 16–27. [Google Scholar] [CrossRef]
  26. Herrera, D.A.; Ault, T. Insights from a new high-resolution drought atlas for the Caribbean spanning 1950–2016. J. Clim. 2017, 30, 7801–7825. [Google Scholar] [CrossRef]
  27. Herrera, D.A.; Ault, T.R.; Fasullo, J.T.; Coats, S.J.; Carrillo, C.M.; Cook, B.I.; Williams, A.P. Exacerbation of the 2013–2016 Pan-Caribbean drought by anthropogenic warming. Geophys. Res. Lett. 2018, 45, 10–619. [Google Scholar] [CrossRef] [PubMed] [Green Version]
  28. Palanisamy, H.; Becker, M.; Meyssignac, B.; Henry, O.; Cazenave, A. Regional sea level change and variability in the Caribbean sea since 1950. J. Geod. Sci. 2012, 2, 125–133. [Google Scholar] [CrossRef]
  29. Torres, R.R.; Tsimplis, M.N. Sea-level trends and interannual variability in the Caribbean Sea. J. Geophys. Res. Ocean. 2013, 118, 2934–2947. [Google Scholar] [CrossRef]
  30. Clarke, L.A.; Taylor, M.A.; Centella-Artola, A.; Williams, M.S.M.; Campbell, J.D.; Bezanilla-Morlot, A. Stephenson, T.S. The Caribbean and 1.5 °C: Is SRM an option? Atmosphere. in press.
  31. Vichot-Llano, A.; Martinez-Castro, D.; Bezanilla-Morlot, A.; Centella-Artola, A.; Giorgi, F. Projected changes in precipitation and temperature regimes and extremes over the Caribbean and central America using a multiparameter ensemble of RegCM4. Int. J. Climatol. 2021, 41, 1328–1350. [Google Scholar] [CrossRef]
  32. Huntingford, C.; Fisher, R.A.; Mercado, L.; Booth, B.B.; Sitch, S.; Harris, P.P.; Cox, P.M.; Jones, C.D.; Betts, R.A.; Malhi, Y.; et al. Towards quantifying uncertainty in predictions of Amazon “dieback.”. Philos. Trans. R. Soc. B Biol. Sci. 2008, 363, 1857–1864. [Google Scholar] [CrossRef] [PubMed] [Green Version]
  33. Shiogama, H.; Watanabe, M.; Yoshimori, M.; Yokohata, T.; Ogura, T.; Annan, J.D.; Hargreaves, J.C.; Abe, M.; Kamae, Y.; O’ishi, R.; et al. Perturbed physics ensemble using the MIROC5 coupled atmosphere–ocean GCM without flux corrections: Experimental design and results. Clim. Dyn. 2012, 39, 3041–3056. [Google Scholar] [CrossRef] [Green Version]
  34. Wang, X.; Huang, G.; Baetz, B.W. Dynamically-downscaled probabilistic projections of precipitation changes: A Canadian case study. Environ. Res. 2016, 148, 86–101. [Google Scholar] [CrossRef]
  35. Hemming, D.; Buontempo, C.; Burke, E.; Collins, M.; Kaye, N. How uncertain are climate model projections of water availability indicators across the Middle East? Philos. Trans. R. Soc. A Math. Phys. Eng. Sci. 2010, 368, 5117–5135. [Google Scholar] [CrossRef] [PubMed]
  36. Kulkarni, A.; Patwardhan, S.; Kumar, K.K.; Ashok, K.; Krishnan, R. Projected climate change in the hindu kush-himalayan region by using the high-resolution regional climate MODEL PRECIS. Mt. Res. Dev. 2013, 33, 142–151. [Google Scholar] [CrossRef]
  37. Buontempo, C.; Mathison, C.; Jones, R.; Williams, K.; Wang, C.; McSweeney, C. An ensemble climate projection for Africa. Clim. Dyn. 2015, 44, 2097–2118. [Google Scholar] [CrossRef] [Green Version]
  38. Raghavan, S.V.; Vu, M.T.; Liong, S.Y. Ensemble climate projections of mean and extreme rainfall over Vietnam. Glob. Planet. Chang. 2017, 148, 96–104. [Google Scholar] [CrossRef]
  39. Redmond, G.; Hodges, K.I.; Mcsweeney, C.; Jones, R.; Hein, D. Projected changes in tropical cyclones over Vietnam and the South China Sea using a 25 km regional climate model perturbed physics ensemble. Clim. Dyn. 2015, 45, 1983–2000. [Google Scholar] [CrossRef]
  40. Alves, L.M.; Marengo, J.A.; Fu, R.; Bombardi, R.J. Sensitivity of Amazon regional climate to deforestation. Am. J. Clim. Chang. 2017, 06, 75–98. [Google Scholar] [CrossRef] [Green Version]
  41. Krishna Kumar, K.; Patwardhan, S.K.; Kulkarni, A.; Kamala, K.; Koteswara Rao, K.; Jones, R. Simulated projections for summer monsoon climate over India by a high-resolution regional climate model (PRECIS). Curr. Sci. 2011, 101, 312–326. [Google Scholar]
  42. Rao, K.K.; Patwardhan, S.K.; Kulkarni, A.; Kamala, K.; Sabade, S.S.; Kumar, K.K. Projected changes in mean and extreme precipitation indices over India using PRECIS. Glob. Planet. Chang. 2014, 113, 77–90. [Google Scholar] [CrossRef]
  43. Patwardhan, S.; Kulkarni, A.; Rao, K.K. Projected changes in rainfall and temperature over homogeneous regions of India. Theor. Appl. Climatol. 2018, 131, 581–592. [Google Scholar] [CrossRef]
  44. Climate Studies Group Mona (CSGM). The State of the Jamaican Climate 2015: Information for Resilience Building (Full Report); CSGM: Kingston, Jamaica, 2017; ISBN 978-976-8103-69-7. [Google Scholar]
  45. Stephenson, K.; Taylor, M.A.; Stephenson, T.S.; Centella, A.; Bezanilla, A.; Charlery, J. The regional climate science initiative: Value added and lessons learnt. Caribb. Q. 2018, 64, 11–25. [Google Scholar] [CrossRef]
  46. Jones, R.G.; Noguer, M.; Hassell, D.; Hudson, D.; Wilson, S.; Jenkins, G.; Mitchell, J. Generating High Resolution Climate Change Scenarios Using PRECIS; Met Office Hadley Centre: Exeter, UK, 2004. Available online: https://www.uncclearn.org/wp-content/uploads/library/undp17.pdf (accessed on 3 March 2021).
  47. Taylor, M.A.; Centella-Artola, A.; Charlery, J.; Forrajero, I.; Bezanilla, A.; Campbell, J.; Rivero, R.; Stephenson, T.; Whyte, F.; Watson, R. Glimpses of the Future: A Briefing from the PRECIS Caribbean Climate Change Project; Caribbean Community Secretariat: Georgetown, Guyana, 2007; ISBN 978 976-41-0212-2. [Google Scholar]
  48. Centella-Artola, A.; Taylor, M.A.; Bezanilla-Morlot, A.; Martinez-Castro, D.; Campbell, J.D.; Stephenson, T.S.; Vichot, A. Assessing the effect of domain size over the Caribbean region using the PRECIS regional climate model. Clim. Dyn. 2015, 44, 1901–1918. [Google Scholar] [CrossRef]
  49. Jones, R.G.; Noguer, M.; Hassell, D.; Hudson, D.; Wilson, S.; Jenkins, G.; Mitchell, J. Generating High Resolution Climate Change Scenarios Using PRECIS; UNDP: New York, NY, USA, 2003; Available online: https://unfccc.int/files/national_reports/non-annex_i_natcom/cge/application/pdf/precis_flyers_cop9_rcm.pdf (accessed on 3 March 2021).
  50. Stennett-Brown, R.K.; Jones, J.J.P.; Stephenson, T.S.; Taylor, M.A. Future Caribbean temperature and rainfall extremes from statistical downscaling. Int. J. Climatol. 2017, 37, 4828–4845. [Google Scholar] [CrossRef]
  51. Jury, M.R.; Malmgren, B.A.; Winter, A. Subregional precipitation climate of the Caribbean and relationships with ENSO and NAO. J. Geophys. Res. Atmos. 2007, 112, 1–10. [Google Scholar] [CrossRef]
  52. Jury, M.R. An interdecadal American rainfall mode. J. Geophys. Res. Atmos. 2009, 114, 1–11. [Google Scholar] [CrossRef] [Green Version]
  53. McLean, N.M.; Stephenson, T.S.; Taylor, M.A.; Campbell, J.D. Characterization of future Caribbean rainfall and temperature extremes across rainfall zones. Adv. Meteorol. 2015, 2015, 1–18. [Google Scholar] [CrossRef]
  54. Climate Studies Group Mona (CSGM); Caribbean Institute of Meteorology and Hydrology (CIMH). State of the Caribbean Climate: Information for Resilience Building; Produced for the Caribbean Development Bank (under the ACP-EU NDRM Programme): Kingston, Jamaica, 2020. [Google Scholar]
  55. Collins, M.; Booth, B.B.B.; Harris, G.R.; Murphy, J.M.; Sexton, D.M.H.; Webb, M.J. Towards quantifying uncertainty in transient climate change. Clim. Dyn. 2006, 27, 127–147. [Google Scholar] [CrossRef]
  56. McSweeney, C.F.; Jones, R.G.; Booth, B.B.B.B. Selecting ensemble members to provide regional climate change information. J. Clim. 2012, 25, 7100–7121. [Google Scholar] [CrossRef]
  57. Nakicenovic, N.; Alcamo, J.; Davis, G.; de Vries, B.; Fenhann, J.; Gaffin, S.; Gregory, K.; Grubler, A.; Jung, T.Y.; Kram, T.; et al. Special Report on Emissions Scenarios: A Special Report of Working Group III of the Intergovernmental Panel on Climate Change; Nakicenovic, N., Swart, R., Eds.; Cambridge University Press: Cambridge, UK, 2000. [Google Scholar]
  58. Contribution of Working Group I to the Fourth Assessment Report of the Intergovernmental Panel on Climate Change; Solomon, S.; Qin, D.; Manning, M.; Chen, Z.; Marquis, M.; Averyt, K.B.; Tignor, M.; Miller, H.L. (Eds.) Cambridge University Press: Cambridge, MA, USA, 2007. [Google Scholar]
  59. Moss, R.H.; Edmonds, J.A.; Hibbard, K.A.; Manning, M.R.; Rose, S.K.; Van Vuuren, D.P.; Carter, T.R.; Emori, S.; Kainuma, M.; Kram, T.; et al. The next generation of scenarios for climate change research and assessment. Nature 2010, 463, 747–756. [Google Scholar] [CrossRef]
  60. Mata, T.M.; Martins, A.A.; Caetano, N.S. Microalgae for biodiesel production and other applications: A review. Renew. Sustain. Energy Rev. 2010, 14, 217–232. [Google Scholar] [CrossRef] [Green Version]
  61. Centella-Artola, A.; Bezanilla-Morlot, A.; Taylor, M.A.; Herrera, D.A.; Martinez-Castro, D.; Gouirand, I.; Sierra-Lorenzo, M.; Vichot-Llano, A.; Stephenson, T.; Fonseca, C.; et al. Evaluation of sixteen gridded precipitation datasets over the Caribbean region using gauge observations. Atmosphere 2020, 11, 1334. [Google Scholar] [CrossRef]
  62. Oglesby, R.; Rowe, C.; Grunwaldt, A.; Ferreira, I.; Ruiz, F.; Campbell, J.; Alvarado, L.; Argenal, F.; Olmedo, B.; del Castillo, A.; et al. A high-resolution modeling strategy to assess impacts of climate change for mesoamerica and the Caribbean. Am. J. Clim. Chang. 2016, 5, 202–228. [Google Scholar] [CrossRef] [Green Version]
  63. Taylor, M.A.; Enfield, D.B.; Chen, A.A. Influence of the tropical Atlantic versus the tropical Pacific on Caribbean rainfall. J. Geophys. Res. 2002, 107, 3127. [Google Scholar] [CrossRef] [Green Version]
  64. Intergovernmental Panel on Climate Change (IPCC). Climate Change 2014: Synthesis Report. Contribution of Working Groups I, II and III to the Fifth Assessment Report of the Intergovernmental Panel on Climate Change [Core Writing Team, R.K. Pachauri and L.A. Meyer (eds.)]; IPCC: Geneva, Switzerland, 2014; ISBN 9789291691432. [Google Scholar]
  65. James, R.; Washington, R.; Schleussner, C.F.; Rogelj, J.; Conway, D. Characterizing half-a-degree difference: A review of methods for identifying regional climate responses to global warming targets. Wiley Interdiscip. Rev. Clim. Chang. 2017, 8. [Google Scholar] [CrossRef] [Green Version]
  66. Karmalkar, A.V.; Bradley, R.S. Consequences of global warming of 1.5 °C and 2 °C for regional temperature and precipitation changes in the contiguous United States. PLoS ONE 2017, 12, 1–17. [Google Scholar] [CrossRef] [PubMed] [Green Version]
  67. Schleussner, C.F.; Lissner, T.K.; Fischer, E.M.; Wohland, J.; Perrette, M.; Golly, A.; Rogelj, J.; Childers, K.; Schewe, J.; Frieler, K.; et al. Differential climate impacts for policy-relevant limits to global warming: The case of 1.5 °C and 2 °C. Earth Syst. Dyn. 2016, 7, 327–351. [Google Scholar] [CrossRef] [Green Version]
  68. Guo, X.; Huang, J.; Luo, Y.; Zhao, Z.; Xu, Y. Projection of precipitation extremes for eight global warming targets by 17 CMIP5 models. Nat. Hazards 2016, 84, 2299–2319. [Google Scholar] [CrossRef] [Green Version]
  69. Taylor, M.A.; Alfaro, E.J. Climate of Central America and the Caribbean. In Encyclopedia of World Climatology; Oliver, J.E., Ed.; Springer International Publishing: Dordrecht, The Netherlands, 2005; pp. 183–189. ISBN 978-1-4020-4870-8. [Google Scholar]
  70. Wang, C.; Lee, S.K. Atlantic warm pool, Caribbean low-level jet, and their potential impact on Atlantic hurricanes. Geophys. Res. Lett. 2007, 34, 1–5. [Google Scholar] [CrossRef] [Green Version]
  71. Ryu, J.-H.; Hayhoe, K. Understanding the sources of Caribbean precipitation biases in CMIP3 and CMIP5 simulations. Clim. Dyn. 2014, 42, 3233–3252. [Google Scholar] [CrossRef]
  72. Herrera, D.A.; Mendez-Tejeda, R.; Centella-Artola, A.; Martínez-Castro, D.; Ault, T.; Delanoy, R. Projected hydroclimate changes on Hispaniola Island through the 21st century in CMIP6 Models. Atmosphere 2020, 12, 6. [Google Scholar] [CrossRef]
  73. Chen, A.A.; Taylor, M.A. Investigating the link between early season Caribbean rainfall and the El Niño+1 year. Int. J. Climatol. 2002, 22, 87–106. [Google Scholar] [CrossRef]
  74. Magaña, V.; Amador, J.A.; Medina, S. The midsummer drought over Mexico and Central America. J. Clim. 1999, 12, 1577–1588. [Google Scholar] [CrossRef]
  75. Taylor, M.A.; Centella, A.; Charlery, J.; Bezanilla, A.; Campbell, J.D.; Borrajero, I.; Stephenson, T.S.; Nurmohamed, R. The precis Caribbean story lessons and legacies. Bull. Am. Meteorol. Soc. 2013, 94, 1065–1073. [Google Scholar] [CrossRef]
  76. Cashman, A. ‘Our water supply is being managed like a rumshop’: Water governance in Barbados. Soc. Environ. Account. J. 2011, 31, 155–165. [Google Scholar] [CrossRef]
  77. Stennett-Brown, R.K.; Stephenson, T.S.; Taylor, M.A. Caribbean climate change vulnerability: Lessons from an aggregate index approach. PLoS ONE 2019, 14, e0219250. [Google Scholar] [CrossRef] [PubMed] [Green Version]
  78. Jury, M.R.; Bernard, D. Climate trends in the East Antilles Islands. Int. J. Climatol. 2020, 40, 36–51. [Google Scholar] [CrossRef]
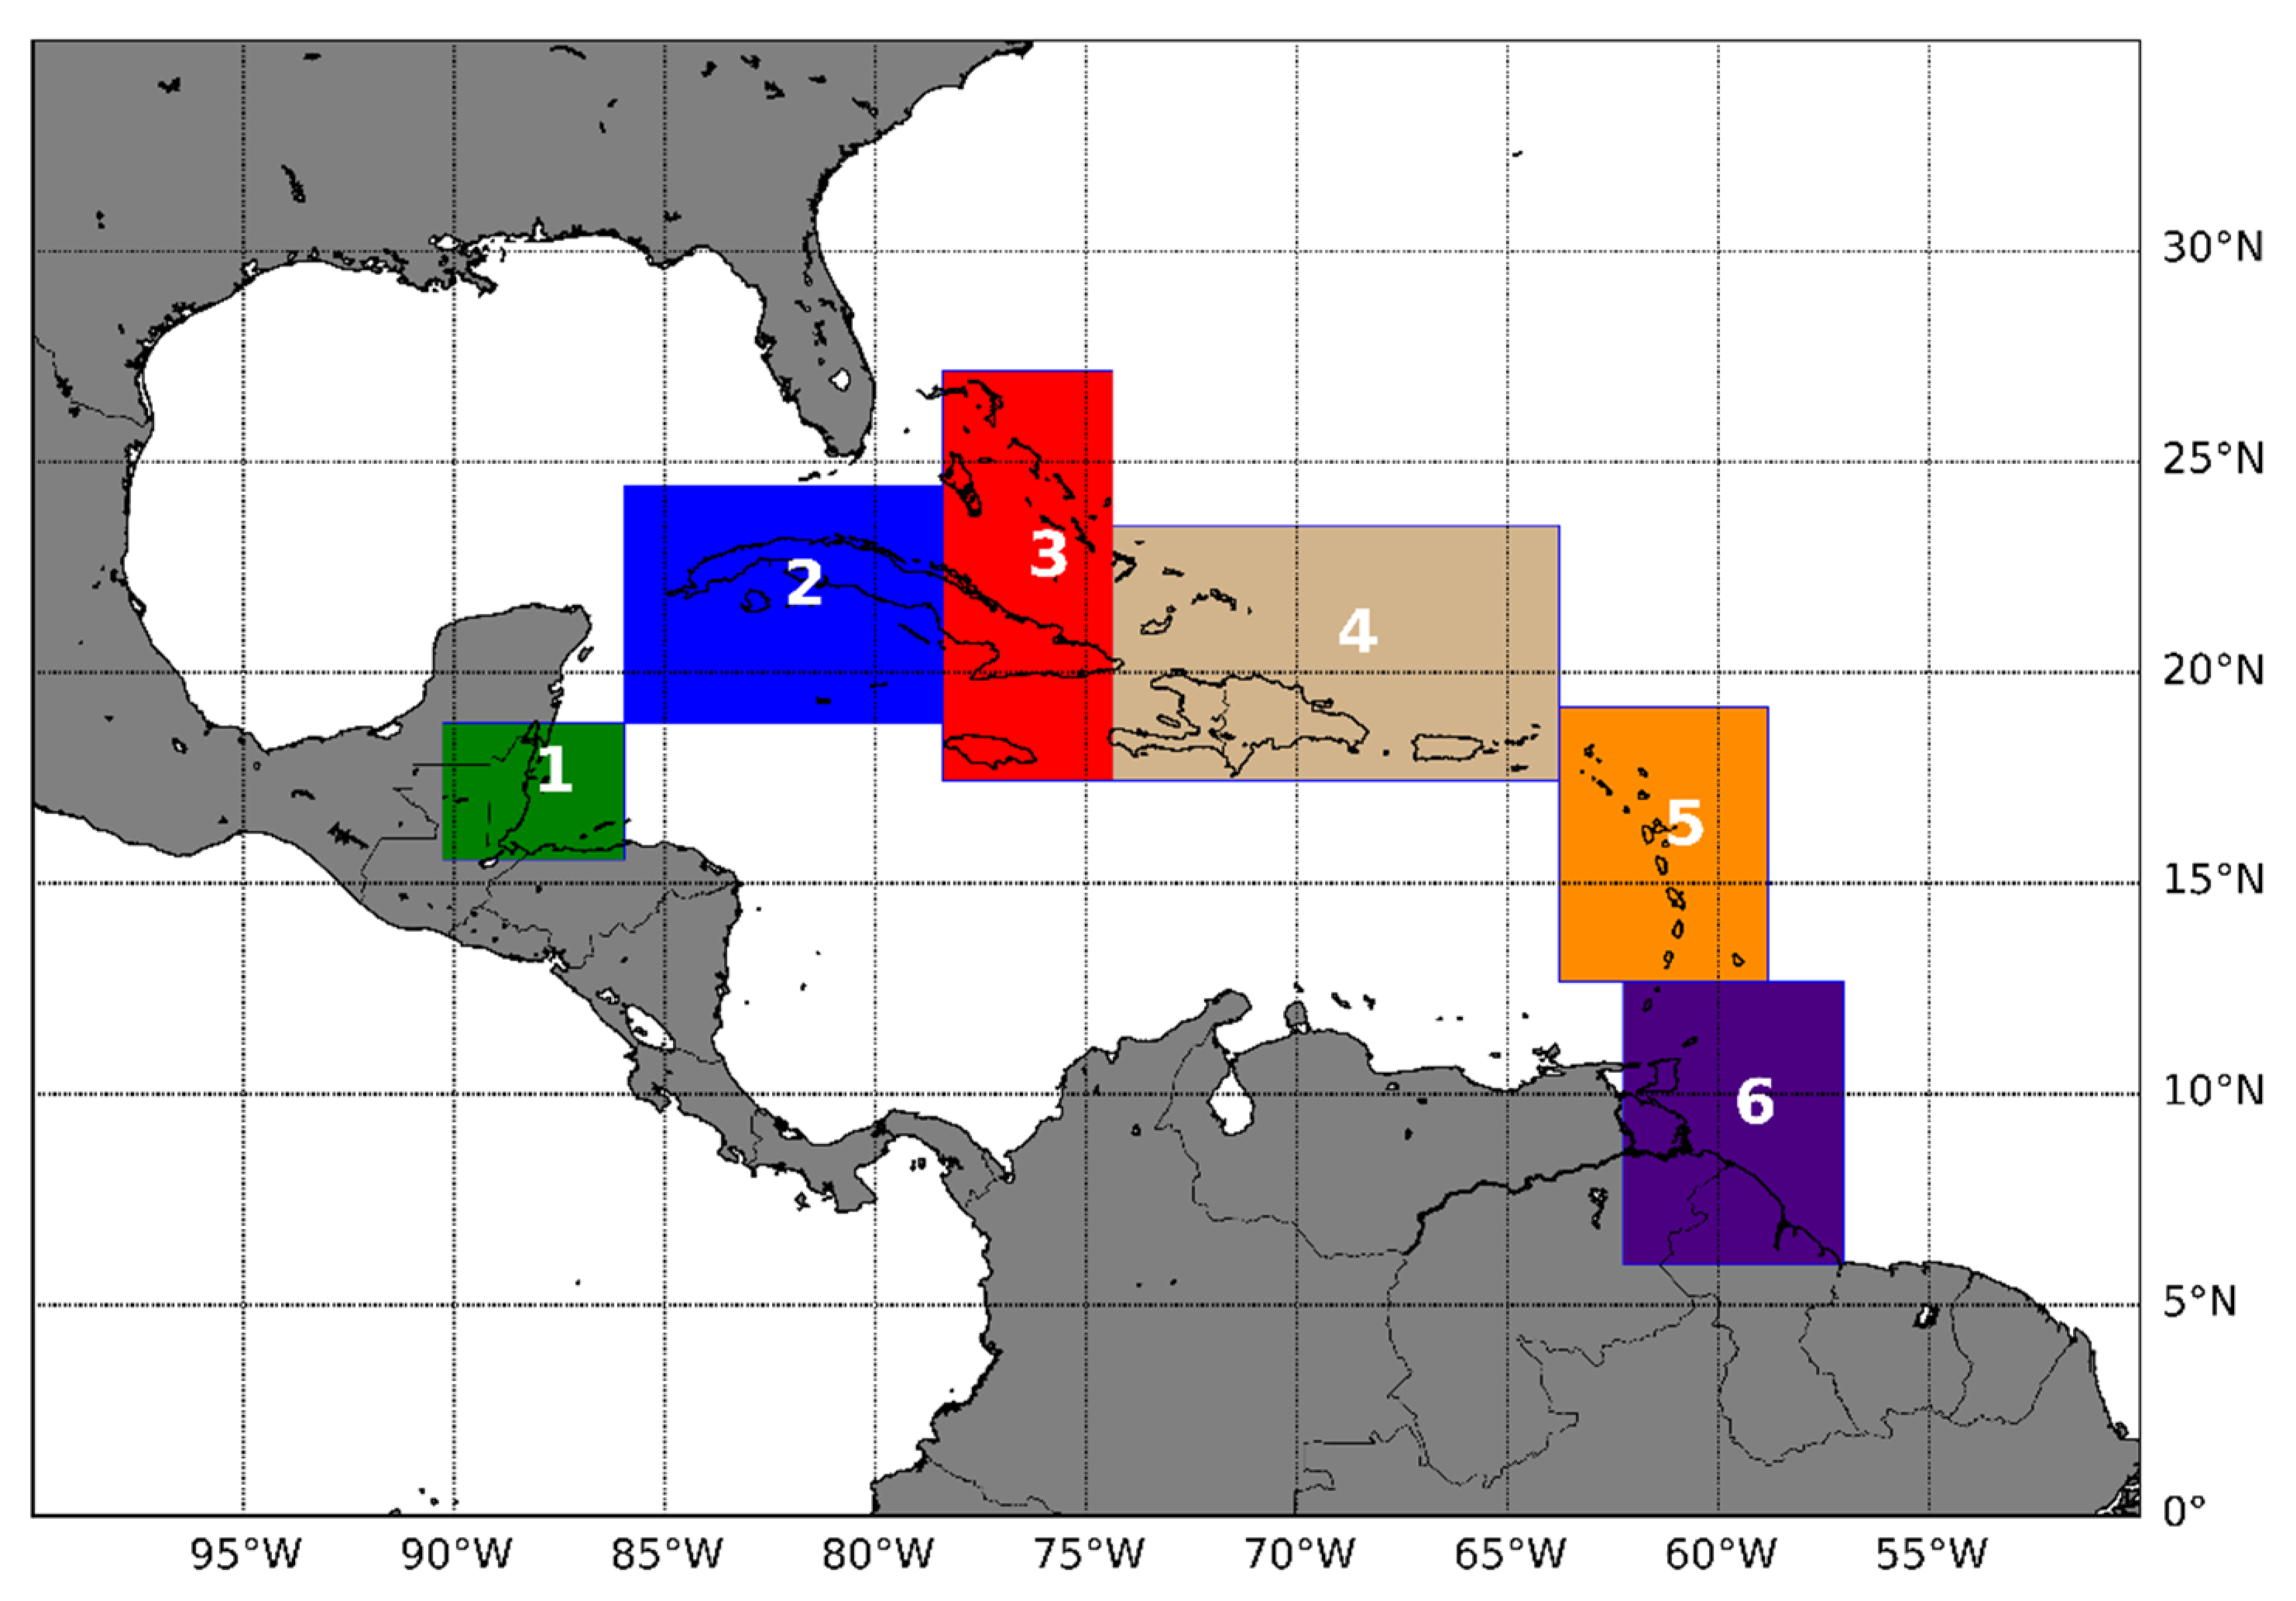
Figure 1. Providing Regional Climate Impact Scenarios (PRECIS) domain and six rainfall zones over the Caribbean. Zone coordinates and countries are shown in Table 2.
Atmosphere 12 00328 g001
Figure 2. (a) Mean annual surface temperature from reanalysis. (br) The difference in mean annual surface temperature for each PPE (Q0 to Q16) from the pattern depicted in plot (a). All plots are averaged over the period 1960–1990. Units are in °C.
Atmosphere 12 00328 g002
Figure 3. (a) Temperature and (b) rainfall climatologies for each ensemble member and reanalysis. Averaging is over the domain shown in Figure 2 and the period 1960–1990.
Atmosphere 12 00328 g003
Figure 4. Annual plots of precipitation averaged over the period 1960–1990 (a) in mm per month. Observed (br) percentage difference between observation and respective PPE.
Atmosphere 12 00328 g004
Figure 5. Top: Difference of mean of six selected ensemble members minus the mean of the full ensemble for (a) annual near-surface temperature (°C) and (b) precipitation (%). Middle: Graph showing monthly climatological means of (c) temperature and (d) precipitation. Bottom: Taylor diagrams of (e) temperature and (f) precipitation. For the middle and bottom rows, plots are for each of the 17-member QUMP simulations, ensemble means for the six-selected members (QSel), and the full ensemble (QEns) and reanalysis.
Atmosphere 12 00328 g005
Figure 6. Graph showing 10-year running averages of temperature anomalies from 1900 through to 2100 for the Caribbean domain (blue) and the globe (orange), with respect to the pre-industrial period of 1860–1899. Values are for the ensemble mean of the six-member QUMP dataset. Vertical lines show the approximate years when the Caribbean (blue) and globe (orange) attain 1.5, 2.0, and 2.5 °C above pre-industrial values.
Atmosphere 12 00328 g006
Figure 7. Diagram showing the projected absolute change in temperature (°C) for (column A) Annual (column B) NDJ, (column C) FMA, (column D) MJJ, and (column E) ASO for the 1.5 °C (row 1), 2.0 °C (row 2), and 2.5 °C (row 3) global warming thresholds. Results are from the ensemble mean of six perturbed physics simulations of the PRECIS RCM. Hashing indicates changes that are at the 95% significance level. All changes are with respect to a baseline period of 1960–1990.
Atmosphere 12 00328 g007
Figure 8. Graphs showing the absolute change in temperature (top row) and percentage change in rainfall (bottom row) with respect to a 1960–1990 baseline for each rainfall zone for (a) 1.5, (b) 2.0, and (c) 2.5 °C. Black dots represent the ensemble mean for the period, red whisker lines represent the ensemble minimum and maximum, and the black whisker represents the one standard deviation. Graphs are for the annual average.
Atmosphere 12 00328 g008
Figure 9. Diagram showing the projected percentage change in precipitation for (column A) Annual (column B) NDJ, (column C) FMA, (column D) MJJ, and (column E) ASO for the 1.5 °C (row 1), 2.0 °C (row 2), and 2.5 °C (row 3) global warming thresholds. Results are from the ensemble mean of six perturbed physics simulations of the PRECIS RCM. Hashing indicates changes that are at the 95% significance level. All changes are with respect to a baseline period of 1960–1990.
Atmosphere 12 00328 g009
Figure 10. Diagram showing the differences between the warming target thresholds for 10 m wind speed. (a) The difference between baseline and wind speeds at 1.5 °C. (b) The difference between 1.5 and 2.0 °C and (c) between 1.5 and 2.5 °C.
Atmosphere 12 00328 g010
Table 1. Historical and future changes in Caribbean climate.
VariableHistoricalFuture
Temperatures
  • Statistically significant increase in mean temperature over last century [17].
  • Greater than 0.5 °C increase in ocean temperatures since 1950’s [18,19].
  • Average day (night) time temperature increases of approximately 0.19 °C/decade (0.28 °C) since 1960 [20].
  • Decrease in the diurnal temperature range [21].
  • Increase (decrease) in the number of extremely warm days (very cool nights) by 3.31%/decade (2.55%/decade) since 1960 [21].
  • Warming of between 1.0 and 3.5 °C warmer by the end of the century [9,10,11].
  • Up to 95% of all days and nights in a year exceeding the 90th percentile of current temperatures [22].
Rainfall
  • Small but statistically significant increases in annual rainfall totals, daily intensity, maximum number of consecutive dry days, and heavy rainfall events during the period 1986–2010 [20].
  • Total annual rainfall decreasing by up to 30%.
  • Significant drying during the Caribbean wet season of May and October [9,11].
Extremes
  • Increased frequency of extreme events including droughts and more intense hurricanes [23].
  • Increased occurrence of Caribbean meteorological disasters (cyclones, storms, floods, droughts) between 1960 and 2013, from an annual average of 1.7 events prior to 1980 to 10.8 events after 1980 [24].
  • Increase in the average number of named tropical storms and hurricanes, from 11.6 and 6.1 per year between 1980 and 1994 to 14.5 and 7.6 per year between 1995 and 2009 [25].
  • Four region-wide severe multi-year droughts since the 1970s in 1974–1977, 1997/1998, 2009/2010, and 2013–2016. Two in the last decade [26,27].
  • Hurricane rainfall rates near the center of the storm increasing by 20%–30%, and by 10% for distances form the center of 200 km or larger [12,13,14]. The same studies suggest that the maximum wind speeds associated with the hurricanes are projected to increase by 2–11%.
Sea levels
  • Rate of sea level rise of 1.7–1.9 mm/year between 1950 and 2009 [28,29]
  • Mean sea levels across the region projected to rise by up to 1.4 m for the current century [15,16].
Table 2. Definition of six Caribbean rainfall zones used for regional climate model (RCM) experiments.
ZonesCoordinates of Bounding BoxCountries
Zone 1 Longitude
Latitude
−90.28 and −85.97
15.56 and 18.81
Belize
Zone 2Longitude
Latitude
−85.97 and −78.14
18.81 and 24.42
Western Cuba, Cayman
Zone 3Longitude
Latitude
−78.41 and −74.37
17.43 and 27.16
Bahamas, Eastern Cuba, Jamaica
Zone 4Longitude
Latitude
−74.37 and −63.78
17.43 and 23.49
Turks and Caicos, Hispaniola, Puerto Rico, British Virgin Islands
Zone 5Longitude
Latitude
−63.78 and −58.83
12.67 and 19.17
Anguilla, Sint Maarten, Saint Kitts and Nevis, Antigua and Barbuda, Montserrat, Guadeloupe, Dominica, Martinique, Saint Lucia, St. Vincent and the Grenadines, Barbados
Zone 6Longitude
Latitude
−62.26 and −57.03
5.95 and 12.67
Grenada, Trinidad and Tobago, Northern Guyana
Table 3. Table showing approximate years when global warming thresholds are attained for the six-member selected subset (QSel) and the 17 QUMP (QEns) runs. The years when the Caribbean attains the same temperatures are also shown for QSel.
Target, ΔT1.52.02.5
Globe (QSel)202520392054
Globe (QEns)202420382052
Caribbean203020432059
Table 4. Ensemble maximum, minimum, and mean change in annual temperature (°C) over the six sub-regions of the Caribbean for the three global warming thresholds. Changes are with respect to a 1960–1990 baseline.
ZonesLong-Term Temperature Goal, ΔT
1.5 °C2.0 °C2.5 °C
MaxMeanMinMaxMeanMinMaxMeanMin
Zone 11.581.281.082.041.791.422.592.301.87
Zone 21.211.040.801.801.511.242.301.991.57
Zone 31.241.060.821.761.541.242.252.011.59
Zone 41.291.100.941.691.511.162.251.991.68
Zone 51.371.090.851.791.400.992.251.821.30
Zone 61.641.310.972.051.681.132.562.091.52
Table 5. Ensemble maximum, minimum, and mean percentage change in annual precipitation (%) over the six sub-regions of the Caribbean for the three global warming thresholds. Changes are with respect to a 1960–1990 baseline.
ZonesLong Term Temperature Goal, ΔT
1.5 °C2.0 °C2.5 °C
MaxMeanMinMaxMeanMinMaxMeanMin
Zone 12.81−5.1−15.941.91−9.18−26.494.63−10.53−32.65
Zone 28.310.89−6.648.061.46−4.726.921.64−4.16
Zone 38.933.35−5.865.01−0.91−6.355.942.68−3.62
Zone 412.925.56−0.697.51−1.16−9.0514.43−0.42−13.55
Zone 510.38−1.5−17.7117.71−9.16−31.7814.46−8.97−35.13
Zone 6−4.64−15.26−23.38−12.22−20.32−38.35−8.86−20.16−35.38
Publisher’s Note: MDPI stays neutral with regard to jurisdictional claims in published maps and institutional affiliations.