Abstract
Atmospheric emissions related to harbor-related activities can significantly contribute to air pollution of coastal urban areas and so, could have implications to the citizens’ health that live in those areas. Of great concern is the local impact of the emissions that are generated while ships are at berth, since not all types of ships switch off the main engines. This paper intends to investigate the influence of the stack configuration for generic cargo ships on the exhaust smoke dispersion, using the Port of Leixões as a case study and a series of wind tunnel experiments with support of Particle Image Velocimetry (PIV) technique. For that, different configurations of the stack of a cargo ship (in terms of height, geometry and diameter) were simulated under the typical wind conditions of the study area. The PIV results indicate negligible differences between the medium and long stack height, with the short stack height presenting a strong impact on the flow field around the stack. For the short stack height, the flow field is not only disturbed by the stack, but also by the cargo ship bridge, with both obstacles promoting disturbances on the flow field and creating a large wake turbulence effect, which is important for the downwash phenomena. Regarding the effects linked with two distinct geometries (straight or curved), the results show that the straight chimney led to higher perturbation of wind field when compared with the curved geometry. The curved stack presents an increase of vorticity, indicating the generation of more turbulent structures. The PIV results also confirmed that higher wind velocity at the inlet conducts to higher vorticity levels, as well as a higher number of Kelvin–Helmholtz structures. For distinct wind conditions the PIV measurements point out different patterns, indicating the northern wind direction as the most favorable condition for the exposure of dock workers to pollutants. Overall, the results showed that a ship stack with a curved end, medium length and smaller diameter has the capability to promote the behaviors in the flow that are coherent with increased pollutant dispersion.
1. Introduction
The increase of international trade and tourism boosted the growth of maritime transport though the last decade [1], which makes harbors key contributors to social and economic development worldwide [2]. In coastal areas, there is a rising concern about the impact of maritime transport and its related activities (maneuvering ships to the activity at the dock and at berthing ship) on local air quality, with a set of studies pointed out that emissions from ships may have a strong impact on human health in coastal communities [3].
Due to the increasing demand for larger, faster and more sophisticated ships, it was required to impose stricter design standards for the exhaust stack of ships and these were introduced in 2005 by the Marine Pollution Convention (MARPOL) Annex VI by the International Maritime Organization (IMO) to control both air pollution and heat damage problems [4]. The contamination from smoke discharged from the funnels of ships has been found to manifest itself in the form of objectionable quantities of smoke coming down on topside operational areas. This is a problem for almost all vessels from the earliest days of steam ship travel, regardless of type—be it the passenger liners, merchant ships or the naval ships. The evolution of the topside of the ship over the years has influenced the design of the funnel on all type of ships [5]. The harmful exhaust-gas from the funnel should be regulated strictly as governments and companies worldwide have started to pay close attention to Health, Safety and Environmental (HSE) issues [4].
Engine settings and type of engine (diesel or gas turbine), speed and engine power have an influence on the size of the exhaust plume and on the concentration of species present in it. Nevertheless, pollution and heat damage from the exhaust gas could be mitigated by increasing the funnel height or decreasing the funnel diameter, which could accelerate the exit velocity. However, air draft is decided by the operational route of the ship, and the crane height of the terminal restricts the funnel height. Decreasing the funnel diameter can also generate noise and back flow in the exhaust pipe. Therefore, an understanding of the exhaust smoke behavior is quite an important aspect of the design of the ship.
Several studies have been carried out on contamination and damage related to exhaust gas of shipping chimneys [6], using field measurements, wind tunnel experimental and numerical modelling approaches to investigate the exhaust gas behavior and pollution. Overall, the results revealed, for various load conditions and wind directions, a great deal of contamination due to the exhaust gas with the ballast load condition, highlighting that the height of the loaded container in front of the deckhouse is an important variable for the exhaust pipe design. Abdul-Wahab et al. (2008) suggested that port authorities should be in cooperation with local environmental agencies and with the crew of ships for them to take actions to reduce and control emissions [7]. In addition, the authors also recommended that project management should be implemented. Dobrucali (2012) summarized the key research activities for ship exhaust gas dispersion [8]. The authors have concluded that the dispersion of exhaust smoke is affected by many parameters such as efflux velocity and temperature of smoke, level of turbulence, wind velocity and direction, geometry of the structures of the deck of the ship, etc. Kulkarni et al. (2005) provides an overview of the changes in funnel design during the last hundred years [5]. The main developments were that the height of the funnel has decreased, and the size and number of funnels were reduced. These developments and an increasing competition for space and height on top of the superstructure have led to several investigations into smoke nuisance problems on ships. Camelli and Löhner (2004) simulated the smoke release from the funnel to study the temperature fields and levels of concentration of different species around a ship using the large eddy simulation [9]. Kim et al. (2008) compared wind tunnel test data and CFD results for smoke dispersion around a container carrier to establish optimum design of the funnel of ship [10]. Park et al. (2011) studied the exhaust gas flow from the ship’s funnel through a numerical approach, aiming to improve the antenna location configurations of the typical ship [4]. For the exhaust gas flow analysis, different engine loads, wind speeds and directions were considered to determine valuable information for suitable locations of the antenna.
The literature review showed that there is a set of studies that explores the exhaust gas from the funnels of ships. However, most of the previous studies were focused on heat and fluid flows around the topside of the ship [7,11,12,13] and structural modifications to the above problems [4,14]. To our best knowledge, no studies have yet been conducted to evaluate the influence of exhaust gas from a ship stack when they are at berth, in a perspective of air quality impact over coastal urban areas and its related population and workers exposure. According to the European Sea Ports Organization [15], the top environmental priority for seaports is the local air quality, focusing on the health of the workers and nearby residents. With the projected increase of shipping activities [16], a comprehensive study to increase knowledge and awareness of the contamination from exhaust gas of ships and to explore measures that can be applied to promote greater pollutant dispersion still needs research. Therefore, there are two questions that have not been explored yet: what are the effects of stack configuration on the exhaust smoke dispersion? and what should the optimal stack design be to promote greater pollutant dispersion?
In this study, the influence of the wind flow conditions and stack configuration (height, geometry and diameter) for a generic cargo ship on the exhaust smoke dispersion is investigated through a series of wind tunnel experiments, using the Particle Image Velocimetry (PIV) technique. For that, the worst-case scenario in terms of air pollution was analyzed, using the Port of Leixões as a case study. The Port of Leixões is an interesting case study due to two main features: (i) proximity (around 9 km) to high density urban areas, with thousands of people potentially exposed to air pollution; and (ii) records exceedances to the daily limit value of PM10 concentrations in the last years. The main innovative aspects of this study include the assessment of the interaction of stack configuration and the surrounding areas on the wind flow, with a focus on the implications of the flow disruption on air quality, and using the optimum technique for measuring velocity fields in the wind tunnel.
2. Methodology
A specific methodology was applied to investigate the influence of the stack configuration on the exhaust smoke dispersion. A detailed description of the case study (Section 2.1) and the experimental setup applied (Section 2.2) are presented in the following sub-sections.
2.1. Case Study Description
The Port of Leixões (41°11′ N, 8°40′ W) is located in the Northern part of Portugal, in the Northwest corner of the Iberian Peninsula, in proximity to the city of Porto and surrounded by other small towns like Leça da Palmeira to the North and Matosinhos to the South. Matosinhos is the largest town, with approximately 175,000 inhabitants, while Leça da Palmeira is a smaller community with 18,000 inhabitants [17]. Some residential areas of these towns are in very close proximity to the ports docking stations, only separated by a road with scarce meters of width, which promotes population exposure to hazardous air pollutants with its origins on the pier and the cargo ships [18]. The location of the port and its surroundings is shown in Figure 1.
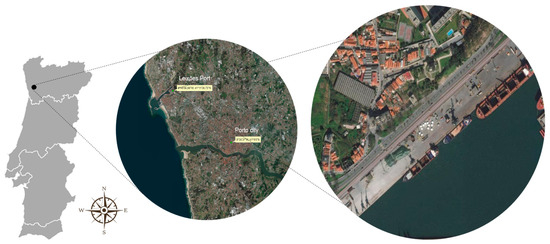
Figure 1.
Geographical location of Porto area, Port of Leixões: North region of Portugal. The Port of Leixões is located in the north region of mainland Portugal at 41°11′ N, 8°40′ W.
Its main terminals are used for loading and unloading operations of container loads, rolling loads and bulk cargo (liquid and solid). In 2018 this port handled 2527 cargo ship movements scattered around its 32 docking stations, totaling 19,156 thousand tons of moved cargo. The cargo ships stay in the terminal, with the engine on, between 10.33 h. ship−1 and 102.7 h. ship−1. Around 25% of the Portuguese foreign trade by sea goes through this port, which covers a wet area of 120 ha, with 5 km of quay.
Regarding the air quality status, according to [19], the onsite air quality station (located inside the Port), revealed exceedances to the daily limit value of PM10 concentrations (the daily limit of 50 µg. m−3 must not exceed more than 35 days per year), not fulfilling the requirements of the EU Directive 2008/50/EC (European Parliament and Council, 2008).
Typical meteorological conditions of the study area were characterized through an analysis of meteorological wind data, using hourly records gathered over a three-year period (2014–2016) by a local meteorological station (from the national meteorological monitoring network), located in the region. Wind rises for the onsite station and the selected period are shown in Figure 2.
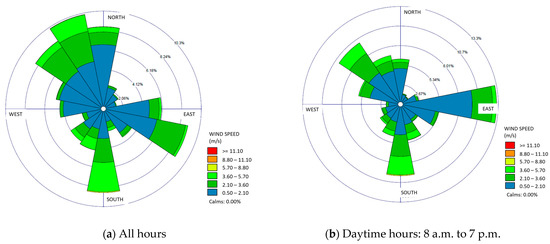
Figure 2.
Three-year period (2014–2016) data wind rises obtained from the meteorological measured data at the station located near the study area for (a) all hours and (b) daytime hours.
The wind pattern for daytime hours is very similar to the all hours pattern, with predominant winds blowing from Northwest (NW) and East (E); wind velocities are, in majority, below 2 m. s−1, with more than 80% of the data falling into this condition. Since it is usual for ship maneuvering, loading and unloading operations to be performed during the daytime, and in order to achieve the main goal of this study, the wind conditions selected for the experimental tests were based on two criteria: (i) the representativeness of typical meteorological conditions of the study area (North-Easterly and North-Westerly quadrants); and (ii) the influence of the surrounding areas to ship stacks and its possible drawbacks in air quality around the ship or the residential area in close proximity to the docking stations. Based on these two criteria, North (N) and North-East (NE) wind directions were selected. These wind directions are the ones that maximize the influence of the surrounding areas (the urban canopy North of the ship and the bridge of the ship located downstream of the North-East wind) in the wind flow field, but are still in agreement with the meteorological analysis. The selected wind velocities for the experiments were 1 and 2 m. s−1, which are the most frequent wind velocities in the study area.
2.2. Physical Modelling
2.2.1. Experimental Setup
The experiments were conducted using the wind tunnel facilities of the Atmospheric Aerodynamics Laboratory (AAL) at the Department of Environment and Planning of the University of Aveiro. The wind tunnel is an open-circuit type with a test section of 6.5 m × 1.5 m × 1.0 m (L × W × H) (with a total length of 12 m) and is typically used for the physical modelling of urban flows and air pollutants dispersion. The air flow enters the wind tunnel at the intake passing through a flow-straightening section directly to a contraction cone. The honeycomb screen reduces the free stream turbulence level, and the contraction cone increases the airflow velocity towards the test section. Downstream the test section, a coarse-wire mesh and a conical diffuser are linked to the engine constituted by a fan. The diffuser smoothly reduces the air flow velocity without creating turbulence within the test section. When applicable, the guidelines proposed by the German Engineering Association for atmospheric boundary layer simulation in wind tunnels were followed for neutral stability conditions [19].
A 1:180 scaled mock-up of a container ship pier of the Port of Leixões was built, considering obstacles near the shoreline such as buildings or trees, and an obstacle free area representing the sea beyond the pier. Following the same scale, a cargo ship was positioned next to the pier in order to represent one of the exhaust pollutants emission sources in the area. The mock-up, depicted in Figure 3a, has a diameter of 1.49 m and the highest obstacle measures 0.4 m. The blockage varies between 5% and 10% according to the wind direction in analysis. The area selected to be represented by the mock-up consists of a pier in the Port of Leixões used for loading and unloading operations of solid bulk cargo and a residential area next to the pier, separated from each other by a road. The geographical area represented in the mock-up is shown in Figure 3b, circumscribed by a white circle.
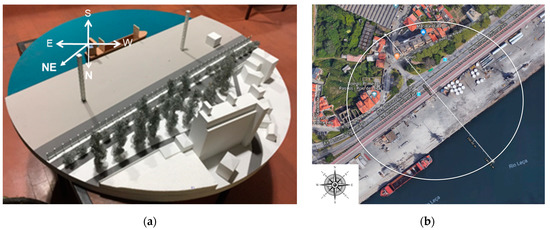
Figure 3.
(a) Mock-up used in the wind tunnel experiments. The figure also shows a schematic representation of the orientation of mock-up with reference to the wind directions under analysis: North (N) and North-East (NE). (b) Geographical area represented in the mock-up.
Vertical wind velocity profile of the representative atmospheric boundary layer was measured using a pitot tube. The profile was obtained at a free flow velocity of 4 m. s−1 measured downstream of the contraction section, and upstream of the spires and roughness elements (see Figure 4a). This procedure was performed in order to assess the correct characterization of the boundary layer generated on the wind tunnel test section, considering that the free flow must start at a height greater than 0.4 m, corresponding to the height of the tallest building on the mock-up. To achieve this, roughness elements and spires were used in order to increase the local air turbulence near the bottom of the tunnel (see Figure 4b,c). The spires generate clockwise swirls (using as reference a perpendicular flow direction) while the roughness elements generate counter-clockwise swirls. Due to induced turbulence, the boundary layer thickness of the main flow was about 0.5 m. Furthermore, a turbulent regime is achieved for the wind tunnel quadrangular section at the wind free flow velocity required for the experiments, with a Reynolds number greater than 4000. The obtained wind velocity profile follows a logarithmic wind profile, as discussed by [20,21].
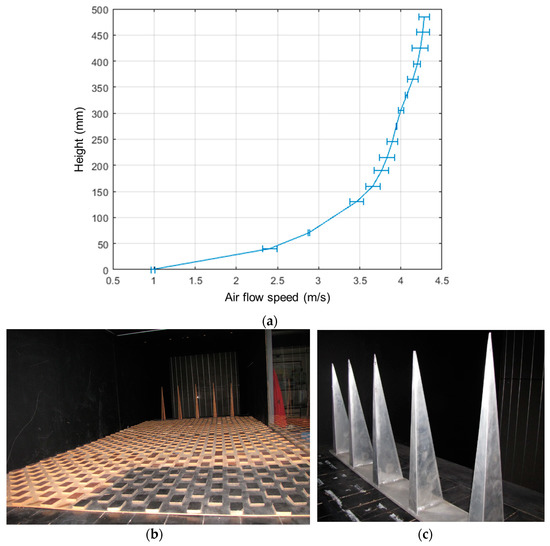
Figure 4.
(a) Vertical wind profile of the wind tunnel, at the test section. (b) Roughness elements and (c) spires used to generate the atmospheric boundary layer.
In order to consider the wind tunnel scale analysis viable and equivalent to the real scale events, model and full scale must comply with geometric, kinematic and dynamic similarity. The geometric similarity was achieved since the mock-up has the same linear-scale ratio on all three coordinates of the study area [22]. With the geometric similarity guaranteed, dynamic similarity exists simultaneous with kinematic similarity when, for an incompressible flow with no free surface, the Reynolds number of the mock-up and full scale environment are correspondingly equal [22]; however, common scales used in wind tunnel models will not allow the compliance of the Reynolds similarity [19]. According to the German Engineering Association, for cuboid-shaped buildings, it is sufficient to satisfy the condition of Equation (1) where is the velocity at building height in (which varied between 1 and 2 m. s−1); the characteristic length of the flow field in (with a value of 0.4 m); and the kinematic viscosity in (with a value of 14.88 × 10⁻⁶ m2. s−1). Since the mock-up used in this work has simplified, cuboid-shaped geometries and the condition of Equation (1) is verified, it can be concluded that the model used for the wind tunnel simulation complies with geometric, kinematic and dynamic similarities, meaning that length, time and force dependent variables can be correctly replicated [22].
Measurements were carried out using the Particle Image Velocimetry (PIV) technique. PIV is an optical non-intrusive measurement technique that is capable of acquiring a quantitative velocity field at several points of a defined plane, by processing images with tracer particles moving along with the flow [23]. The PIV measurements provide a velocity vector field with the vertical and horizontal components at each identified tracer particle. In addition, if post-processing is made, it is possible to obtain not only the mean velocity magnitude but also some characteristic parameters, such as vorticity, at several discretized areas of the plane. The setup field of PIV measurements consists in a 532 nm wavelength Nd:YAG laser (Litron Lasers: NANO S 65-15PIV), a synchronizer, a Charge-Coupled Device (CCD) camera (PowerView Plus 2MP) and magnification lenses. The laser is Q-switched to produce maximum output with 400 mJ pulse pairs. The laser beam generates a laser sheet through optical lenses. The CCD camera, with a pixel resolution of 1600 × 1200 pixel (and each pixel with a resolution of 7.4 µm × 7.4 µm), was mounted to capture pairs of particle seeded images at a frame rate of 32 frames per second (fps). For a macro analysis, the camera was equipped with a 28 mm MF Nikkor zoom lens. For a micro analysis, a 50 mm MF Nikkor zoom lens was equipped on the camera, in order to obtain a smaller sized frame. The synchronizer was used to control the timing between the laser pulses and the camera shutter opening time through a desktop computer. The seeding particles used were generated by a standard beamZ S1200 MKII fog generator and released through the ship stack. “Insight3G” Windows-based software was used for data acquisition and processing. The software allows for the pulse synchronization and the definition of the time step between two images. This time step was of 100 µs. The data processing with the Insight3G implied that the figures coordinates were fixed according to the PIV frame, with the zero being set in the upper left corner. The wind tunnel free flow velocity was defined using a pitot tube located downstream of the flow-straightening section.
The measurements were conducted for a single vertical plane (2D) (Figure 5). The xy plane was centered in the stack of the ship, using as reference the height of the test section to set the yy axis and the direction of the wind flow to set the xx axis. The schematic representation of the mock-up orientation with reference to the wind directions under analysis—North (N) and North-East (NE)—can be seen in Figure 3a.
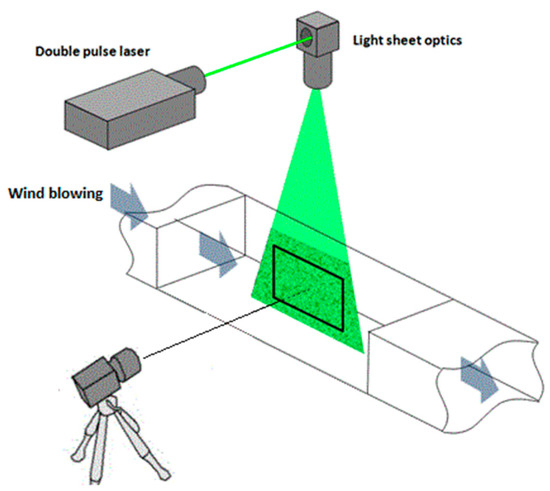
Figure 5.
Vertical measurement plane (2D) applied in all the experiments conducted with the Particle Image Velocimetry (PIV) technique.
To guarantee the worst-case scenario in terms of air pollution, conditions favorable to the occurrence of downwash effect (Vs/V < 1.5), the exhaust velocity (Vs) of the ship was defined to be less than the free wind flow (V). This effect often leads to elevated concentrations downwind of affected stacks, and so, it is critical to the citizens living in the Port surroundings, but especially dangerous to the workers of these facilities. The exhaust velocity (below 1 m. s−1) was kept constant in all the experiments.
2.2.2. Definition of Stack Configurations
Cargo ships may have different configurations of their stacks, varying in diameter, curvature and height, which have influence on exhaust smoke dispersion. For this reason, several combinations were experimentally tested:
- three different heights (80, 130 and 170 mm) measured from sea level up to the top of the stack; to improve readability and comprehension, throughout the paper, the stack measuring 80 mm is referred to as short and the following stacks as medium and long, respectively. For the different height stacks, the geometry (straight) and internal diameter (17 mm) were kept constant;
- two geometries (straight and curved), considering a medium stack height (130 mm) and an internal dimeter of 9 mm; and
- two different internal diameters (9 and 17 mm), considering a straight geometry and a medium stack height (130 mm).
All the configurations were tested for the predominant wind conditions: two wind velocities—1 and 2 m. s−1 and two wind directions—North and North-East. To allow a full understanding of the influence of each configuration, each parameter (height, geometry, diameter and wind condition) was individually assessed by keeping the remaining parameters constant.
In order to promote a clear understanding of the used configurations, these are presented on a summarized geometrical scheme in Figure 6.
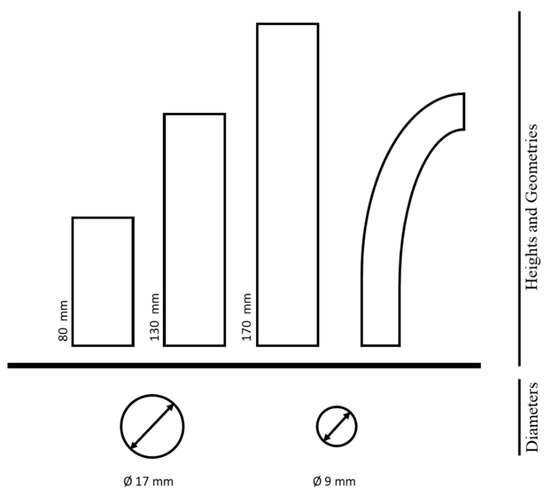
Figure 6.
Geometrical scheme summarizing the different configurations used.
3. Results and Discussion
Given the described methodology (Section 2), the influence of the stack configuration—height (Section 3.1), geometry (Section 3.2) and internal diameter (Section 3.3)—on exhaust smoke dispersion was assessed. The role of wind conditions, velocity and direction on exhaust smoke dispersion is also discussed (Section 3.3). The results are shown in terms of wind flow field and vorticity. The characteristics of the stack are presented and discussed for an initial wind velocity of 1 m. s−1 and a North-Easterly wind direction.
3.1. Influence of the Height of Ship Stack
Figure 7 shows the wind flow field for different stack heights for an initial wind velocity of 1 m. s−1 and a North-Easterly wind direction. The contour (represented by the black color) is referred to the whole ship. It was found that the ship geometry has similar influence for stacks size between medium and long. On long and medium stacks, the stack geometry itself created an area with zero velocity (represented in dark blue) located downstream of the obstacle, which indicates an area of lower pressure and a clear wake turbulence effect. This behavior was also found and discussed in the work of [23]. As the analysis gets further downstream of the obstacle, the previously mentioned effect is no longer visible and the flow field returns to its previous state (turbulent flow without being perturbed by the stack geometry), with a velocity magnitude similar to the initial condition (around 1.2 m. s−1). However, when using short stacks, the geometry of the ship has greater influence on the wind flow field around the stack. In this case, the obstacle to the wind flow is not only the ship stack itself but also the cargo ship bridge, which has greater dimensions, thus creating a larger wake turbulence effect. This increased turbulence is an important factor for the downwash effect. Despite being a complex effect that involves many other variables not accounted for in this work, such as plume rise, it is safe to state that this effect is more likely to occur on smaller stacks than on higher ones, due to the greater wake turbulence observed on the first. Overall, all the stacks show a similar pattern: lower velocity (in dark blue) just behind the stack and higher velocity at the tail of the plume.
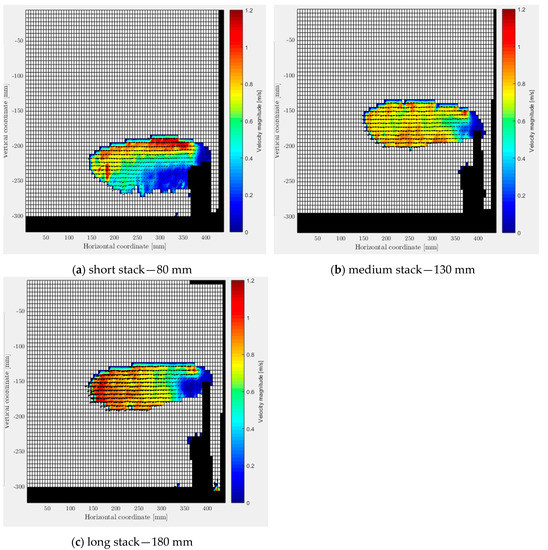
Figure 7.
Wind velocity field results to assess the height of stack effects on the exhaust smoke dispersion for an inflow condition of 1 m. s−1 and a North-Easterly wind direction, using (a) short, (b) medium and (c) long stacks.
Similar behavior was found for an initial wind velocity of 2 m. s−1 (results not shown), with differences on the velocity magnitude (maximum velocities of 2.5 m. s−1 were obtained).
3.2. Influence of the Geometry of the Ship Stack
To assess the influence of the ship stack geometry on the exhaust smoke dispersion, two kind of analysis were conducted: (i) a macro analysis, focused on the whole ship, to provide an analysis of the average behavior of the exhaust plume; and (ii) a micro analysis, focused on the stack exit, to allow a better understanding of the complex phenomena that occur around this area. For the macro analysis the contour (represented by the black color) is referred to the whole ship, while for the micro analysis the contour is referred to the stack exit.
The macro analysis (Figure 8) of the two stack shapes shows that the straight stack promoted a higher influence on the wind field (composed by the exhaust field and the initial wind flow), with direct implication on its magnitude. The wind field reaches to values of 1.4 m. s−1 and around 0.9 m. s−1 for the straight and curved stack, respectively. The flow coming out of the stack also reaches a greater height, about 40 mm higher than the curved stack. Similar behavior was found for an initial wind velocity of 2 m. s−1 (results not shown), with differences on the velocity magnitude. The micro analysis (Figure 8a,b) of both configurations shows a slight increase on the vorticity parameter for the curved stack, indicating a greater turbulent flow, when compared to the straight stack, especially right at the exit of the stack. Also, on the frontier between the stack and free flow, a typical turbulent pattern called Kelvin–Helmholtz instabilities was observed. This phenomenon occurs when a shear action happens between two flows with different velocities (free wind flow and exhaust flow), resulting in the formation of several swirls. The dimension and the rotational direction of these swirls are dependent on the relation between the velocities of both flows. These conclusions are supported by the findings of [23].
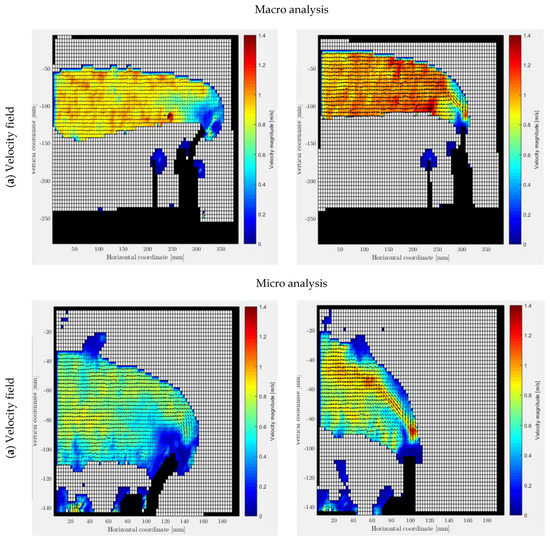
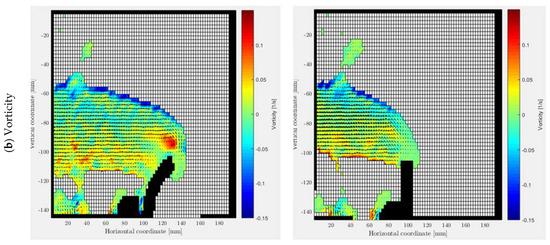
Figure 8.
Macro and micro analysis of the influence of the geometry of the stack on the exhaust smoke dispersion. The macro analysis is performed in terms of the velocity fields for an inflow condition of 1 m. s−1 and a North-Easterly wind direction, while the micro analysis was performed for both velocity field (for an inflow condition of 1 m. s−1 and a North-Easterly wind direction) (a) and vorticity (for an inflow condition of 2 m. s−1 and a North-Easterly wind direction) (b).
For both ship stack geometries, the swirls are formed in a clockwise direction with equal vorticity magnitude (pseudo vector field that defines the magnitude of a swirl); a higher number of these structures was found for the case where a curved stack was used (see Figure 8b). It should be noted that the Kelvin–Helmholtz instabilities were obtained for both inflow conditions (1 and 2 m. s−1), with those structures being more evident and with higher number and intensity for an inflow condition of 2 m. s−1. For this reason the vorticity results presented in Figure 7b were displayed for an inflow condition of 2 m. s−1 so the Kelvin–Helmholtz instabilities could be easily analyzed.
The vorticity field shows a sequence of equidistant vortices at the plume/ambient flow interface rotating along a trigonometric direction (red stands for positive—counter-clockwise rotation and higher vorticity, while blue stands for negative—clockwise rotation and higher vorticity). It also appears that in the lower section of the plume, similar vorticity patterns have formed, but their rotation very logically takes place in the opposite direction, as this constitutes a resting flow zone. In the wake zone, the results highlight the disorderly formation of vorticity patterns. These findings are in accordance with the work of [23], for a velocity ratio Vs/V less than 1.
3.3. Influence of the Internal Diameters of the Ship Stack
Figure 9 shows the obtained results for different stack diameters considering an inflow condition of 1 m. s−1 and a North-Easterly wind direction. The contour (represented by the black color) is referred to the whole ship. The outcomes confirm the theoretically expected results. As the seeding particles flow rate is kept constant for each case, the stacks diameter reduction is responsible for an acceleration of the flow, resulting in the increase of the outflow velocity of the chimney, even though the wind free flow velocity is maintained at 1 m. s−1. The increased velocity that follows the diameter reduction is also accounted for the higher vertical level that the seeding particles reach, compared to the case where a larger diameter is used. This effect is visible on the post-processed PIV data images of Figure 9. For an inflow condition of 1 m. s−1, the exhaust flow rate was of around 0.6 m. s−1 for a diameter stack of 17 mm and higher than 1.4 m. s−1 for a dimeter stack of 9 mm. Similar behavior was found for an inflow condition of 2 m. s−1, with the magnitude of the exhaust flow rate varying between 1 m. s−1 and 2.5 m. s−1, for a diameter stack of 17 mm and 9 mm, respectively.
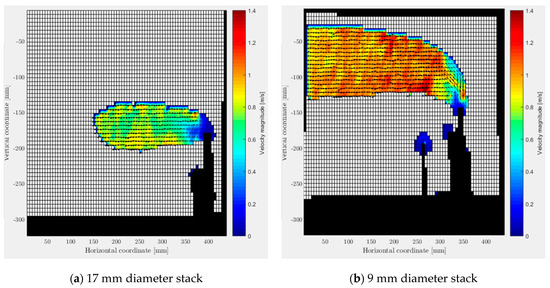
Figure 9.
Wind velocity field results for a stack diameter of (a) 17 mm and (b) 9 mm to evaluate the effects on the exhaust smoke dispersion (for an inflow condition of 1 m.s−1 and a North-Easterly wind direction).
3.4. Influence of the Wind Flow Conditions
This section is devoted to exploring the influence of wind conditions, wind velocity and wind direction on the exhaust smoke dispersion. To assess the impact of wind conditions, a medium and curved stack with a diameter of 9 mm was used.
As previously mentioned, different wind flow velocity conditions produce an effect on the generated Kelvin–Helmholtz instabilities. For that reason, the vorticity of the stacks outflow was the chosen parameter to study the referred instabilities, shown in Figure 10. The contour is referred to the stack exit (represented by the black color). Although the rotational direction is kept for different wind flow velocity, the vorticity intensity and the number of Kelvin–Helmholtz instabilities is superior for higher free flow velocity, considering that the stacks outflow is kept at a constant velocity. As a whole, the seeding particles are also subjected to the effects of the increasing velocity as the initial wind velocity is higher, with the vorticity level being higher for an initial wind velocity of 2 m. s−1.
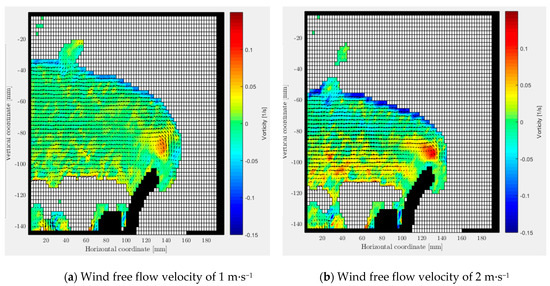
Figure 10.
Vorticity field results showing the effects of an inflow condition of (a) 1 m. s−1 and (b) 2 m. s−1 on the exhaust smoke dispersion, for the North-East wind direction.
Regarding the wind flow field, the results allowed the conclusion that the ambient flow greatly affects the plume’s flow, with the main factor determining the plume’s shape being the exhaust velocity/wind velocity ratio.
Since the cargo ship is integrated in the Port of Leixões, the experimental results show that the geometrical elements around the ship have an impact on the stacks outflow behavior. Wind from a Northerly direction is subjected to several relevant obstacles of the urban canopy such as buildings and trees, including the highest building of the mock-up. On the other hand, wind from North-Easterly direction is free of obstacles close to the ship.
Figure 11a illustrates the stacks outflow velocity for a North-Easterly wind direction, while Figure 11b demonstrates the same parameter for a Northerly direction. The contour (represented by the black color) is referred to the whole ship. The analysis was performed for a short and straight stack with a diameter of 17 mm, and for an initial inflow condition of 1 m. s−1. The presence of obstacles on a Northerly wind direction reduces the overall flow velocity around the stack, related to the increased turbulence induced by buildings and trees, while their absence contributes to the expectable behavior of the flow (turbulent flow, without being perturbed by built-up environment). The same behavior was found for an initial flow condition of 2 m. s−1 (results not shown), with differences on the velocity magnitude.
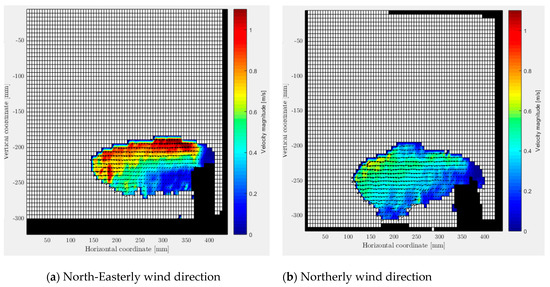
Figure 11.
Wind velocity field results for (a) North-Easterly and (b) Northerly wind directions demonstrating its effects on the exhaust smoke dispersion (for an inflow condition of 1 m. s−1).
Based on this analysis, the optimal stack design to promote greater pollutant dispersion has to include a careful consideration of several properties. From the analysis performed, one of the properties with special relevance is the stacks’ height: short stacks will be more vulnerable to the turbulence created by geometries around it, promoting a downwash behavior that can bring pollutants close to the ground, harming the ship or dock personnel. Although long stacks might be helpful in resolving pollutant dispersion issues in land, keeping them high above the population and at more favorable atmospheric conditions, increasing the size of ship stacks might not be possible due to the perfect balance that must be kept in a moving object at sea. However, using smaller diameters and higher exhaust velocities will mitigate possible downwash behaviors, allowing a reduction of the length of stacks. Another aspect that should help the pollutant dispersion on a ship stack is their curvature: instead of using straight stacks, a curved geometry will promote an increased vorticity and therefore increase the dispersion of exhaust pollutants from ships. With these results in mind, a ship stack with a curved end, medium length and smaller diameter has the capability to promote the behaviors in the flow that are coherent with increased pollutant dispersion.
When extracting conclusions from this work, it is important to be aware of its limitations, since it was not technically viable to assess all variables in such a complex subject. Carefully analyzing detailed aspects such as the interaction between wind and the exhaust fluid, and possible thermal effects that may occur, were not considered in this work but are recognized by the authors as valid and important variables. However, what is concluded from the results in this section is viable and serves the purpose of opening a field of discussion and indicating the way for new and more detailed analysis.
4. Summary and Conclusions
This paper presents an analysis of the influence of the stack configuration for a generic cargo ship on the exhaust smoke dispersion, through a series of wind tunnel experiments, using the PIV technique. The wind tunnel experiments were conducted for the selected typical wind conditions over the Port of Leixões study area, i.e., wind blowing from North and Northeast, with typical velocities of 1–2 m. s−1. These wind conditions were selected not only based on the representativeness of the meteorological conditions of the study area, but also considering the influence of the surrounding areas on the wind flow field patterns.
Different configurations of the stack of cargo ships will have distinct impact on the gas exhaust patterns, as well as on the flow field patterns around the stack. Therefore, different configuration parameters of the stack were studied in this work, such as the diameter, the geometry and the stack height.
The PIV results indicate negligible differences between the medium and long stack height, while the differences between those and the short stack height are clear, with the last presenting a strong impact on the flow field around the stack. In addition, in case of the short stack height the flow field is not only disturbed by the stack, but also by the cargo ship bridge. Both obstacles promote disturbances on the flow field and create a large wake turbulence effect, which is important for the downwash phenomena.
Regarding the effects linked with two distinct geometries (straight or curved), the results show that the straight stack led to a higher perturbation of the wind field, when compared with the curved geometry, which has implications on the wind field magnitude. In addition, the flow reaches a higher height for the straight geometry. Furthermore, the curved stack presents an increase of vorticity, indicating the generation of more turbulent structures and the use of a low stack diameter led to the acceleration of the gas exhaust velocity. The PIV results also indicate that higher wind velocity at the inlet promotes higher vorticity levels, as well as a higher number of Kelvin–Helmholtz structures.
The results point out an overall velocity reduction of the wind flow around the stack promoted by the geometrical elements in the surroundings of the cargo ship. Furthermore, for distinct wind conditions the PIV measurements indicate different patterns. On one hand, for a wind blowing from North, the presence of the urban canopy upstream of the stack reduces the overall flow velocity around the cargo stack. One the other hand, for a wind blowing from northeast, the obstacle with the greatest impact on the flow patterns is the geometry of the ship, which creates a low-pressure area, and may promote the downwash effect. In this case, the turbulence is also increased, theoretically with benefits for the dispersion process, although this may also contribute to dragging the gas exhaust to the ground (even if there are some additional parameters that should be accounted for in this analysis). The results indicate that, although being pushed to the sea, pollutants influenced by a northern wind direction may increase the exposure of dock workers to air pollutants released from ship stacks.
In summary, this work presents a contribution to understanding the exhaust smoke patterns and to improving the design of the stacks for cargo ships based on the Port of Leixões case study, which can be reproduced and followed for other port areas.
Author Contributions
Conceptualization, S.R.; Formal analysis, L.P.C. and S.S.; Methodology, L.P.C.; Supervision, A.M.; Visualization, S.S.; Writing—original draft, L.P.C., S.R. and V.R.; Writing—review & editing, C.B. and A.M. All authors have read and agreed to the published version of the manuscript.
Funding
This research received no external funding.
Data Availability Statement
The data presented in this study are available on request from the corresponding author.
Acknowledgments
The authors wish to thank the financial support of FEDER through the COMPETE Program and the national funds from FCT–Science and Technology Portuguese Foundation for financing the AIRSHIP project (PTDC/AAG-MAA/1581/2014), CESAM (UIDP/50017/2020+UIDB/50017/2020), and also for the PhD grant of S. Sorte (SFRH/BD/117164/2016). The authors would like to thank also the Port of Leixões (APDL S.A.) for providing access to all the information about the domain.
Conflicts of Interest
The authors declare no conflict of interest.
References
- Zhao, M.; Zhang, Y.; Ma, W.; Fu, Q.; Yang, X.; Li, C.; Zhou, B.; Yu, Q.; Chen, L. Characteristics and ship traffic source identification of air pollutants in China’s largest port. Atmos. Environ. 2013, 64, 277–286. [Google Scholar] [CrossRef]
- Eyring, V.; Isaksen, I.S.A.; Berntsen, T.; Collins, W.J.; Corbett, J.J.; Endresen, O.; Grainger, R.G.; Moldanova, J.; Schlager, H.; Stevenson, D.S. Transport impacts on atmosphere and climate: Shipping. Atmos. Environ. 2010, 44, 4735–4771. [Google Scholar] [CrossRef]
- Sorte, S.; Rodrigues, V.; Borrego, C.; Monteiro, A. Impact of harbour activities on local air quality: A review. Environ. Pollut. 2020, 257. [Google Scholar] [CrossRef] [PubMed]
- Park, S.; Heo, J.; Yu, B.S.; Rhee, S.H. Computational analysis of ship’s exhaust-gas flow and its application for antenna location. Appl. Therm. Eng. 2011, 31, 1689–1702. [Google Scholar] [CrossRef]
- Kulkarni, P.R.; Singh, S.N.; Seshadri, V. The Smoke Nuisance Problem on Ships—A Review. Int. J. Marit. Eng. 2005, 147, 15. [Google Scholar] [CrossRef]
- Park, S.; Yang, J.; Rhee, S.H. Parametric study on ship’s exhaust-gas behavior using computational fluid dynamics. Eng. Appl. Comput. Fluid Mech. 2017, 11, 159–171. [Google Scholar] [CrossRef]
- Abdul-Wahab, S.A.; Elkamel, A.; Al Balushi, A.S.; Al-Damkhi, A.M.; Siddiqui, R.A. Modeling of nitrogen oxides (NOx) concentrations resulting from ships at berth. J. Environ. Sci. Health Part A 2008, 43, 1706–1716. [Google Scholar] [CrossRef]
- Dobrucali, E. A Brief Review on Examination of Exhaust Gas Dispersion on Marine Ships. J. Mar. Sci. Eng. 2012, 8, 46–56. [Google Scholar]
- Camelli, F.; Löhner, R.; Sandberg, W.C.; Ramamurti, R. VLES Study of Ship Stack Gas Dynamics. AIAA 2004, 72. [Google Scholar] [CrossRef]
- Kim, J.H.; Park, S.; Cha, H.; Seol, S.S. Numerical Research on Establishing Optimum Design Criterion of Ship’s Funnel. In Proceedings of the ASME International Mechanical Engineering Congress and Exposition; ASME: New York, NY, USA, 2008. [Google Scholar] [CrossRef]
- Ergin, S.; Dobrucalı, E. Numerical modeling of exhaust smoke dispersion for a generic frigate and comparisons with experiments. J. Mar. Sci. Appl. 2014, 13, 206–211. [Google Scholar] [CrossRef]
- Huang, J.; Carrica, P.M.; Stern, F. A method to compute ship exhaust plumes with waves and wind. Int. J. Numer. Methods Fluids 2012, 68, 160–180. [Google Scholar] [CrossRef]
- Vijayakumar, R.; Singh, S.N.; Seshadri, V.; Kulkarni, P.R. Flow Visualization Studies of Exhaust Smoke Interaction with Superstructure and Intakes of Generic Naval Ships in a Wind Tunnel. Nav. Eng. J. 2012, 124, 129–142. [Google Scholar]
- Seshadri, V.; Singh, S.N.; Kulkarni, P.R. Study of Problem of Exhaust Smoke Ingress into GT Intakes of a Naval Ship. J. Ship Technol. 2006, 2, 22–35. [Google Scholar]
- ESPO. Top Environmental Priorities of European Ports for an Analysis Taking Port Size and Geography into Consideration; ESPO: Brussels, Belgium, 2013. [Google Scholar]
- Statistics Portugal [WWW Document]. 2017. Available online: https://www.ine.pt/xportal/xmain?xpid=INE&xpgid=ine_indicadores&contecto=pi&indOcorrCod=0008273&selTab=tab0 (accessed on 16 May 2019).
- Sorte, S.; Arunachalam, S.; Naess, B.; Seppanen, C.; Rodrigues, V.; Valencia, A.; Borrego, C.; Monteiro, A. Assessment of source contribution to air quality in an urban area close to a harbor: Case-study in Porto, Portugal. Sci. Total Environ. 2019, 662, 347–360. [Google Scholar] [CrossRef] [PubMed]
- Borrego, C.; Costa, A.M.; Amorim, J.H.; Santos, P.; Sardo, J.; Lopes, M.; Miranda, A.I. Air quality impact due to scrap-metal handling on a sea port: A wind tunnel experiment. Atmos. Environ. 2007, 41, 6396–6405. [Google Scholar] [CrossRef]
- German Engineering Association. Physical Modelling of Flow and Dispersion Processes in the Atmospheric Boundary Layer—Application of Wind Tunnels VDI 3783; DIN: Berlin, Germany, 2000. [Google Scholar]
- Sorte, S.; Rodrigues, V.; Ascenso, A.; Freitas, S.; Valente, J.; Monteiro, A.; Borrego, C. Numerical and physical assessment of control measures to mitigate fugitive dust emissions from harbor activities. Air Qual. Atmos. Health 2018, 11, 493–504. [Google Scholar] [CrossRef]
- Rodrigues, V.; Vicente, B.; Sorte, S.; Rafael, S.; Oliveira, K.; Silva, S.; Miranda, A.I.; Borrego, C. Improving the design of an open auditorium: On the relationship between flow dynamics and building arrangement. Sustain. Cities Soc. 2021, 64, 102513. [Google Scholar] [CrossRef]
- White, F.M. Fluid Mechanics, 2nd ed.; McGraw-Hill: New York, NY, USA, 1986. [Google Scholar]
- Mahjoub Saïd, N.; Mhiri, H.; Le Palec, G.; Bournot, P. Experimental and numerical analysis of pollutant dispersion from a chimney. Atmos. Environ. 2005, 39, 1727–1738. [Google Scholar] [CrossRef]
Publisher’s Note: MDPI stays neutral with regard to jurisdictional claims in published maps and institutional affiliations. |
© 2021 by the authors. Licensee MDPI, Basel, Switzerland. This article is an open access article distributed under the terms and conditions of the Creative Commons Attribution (CC BY) license (http://creativecommons.org/licenses/by/4.0/).